Embed Size (px)
Citation preview
<Enter Project Name Here>
Test Evaluation
Department of Veterans Affairs
<Month><Year>
Version <#.#>
This template contains a paragraph style called Instructional Text. Text using this paragraph style is designed to assist the reader in completing the document. Text in paragraphs added after this help text is automatically set to the appropriate body text level. For best results and to maintain formatting consistency, use the provided paragraph styles. Delete all instructional text before publishing or distributing the document Revision History.
This template conforms to the latest Section 508 guidelines. The user of the template is responsible to maintain Section 508 conformance for any artifact created from this template.
Revision HistoryNote: The revision history cycle begins once changes or enhancements are requested after the Communications Plan has been baselined.
Date Version Description Author
Place latest revisions at top of table.
The Revision History pertains only to changes in the content of the document or any updates made after distribution. It does not apply to the formatting of the template.
Remove blank rows.
Artifact RationaleThe test evaluation document is the primary output of the test and evaluation process, an integral part of the systems engineering process, which identifies levels of performance and assists the developer in correcting deficiencies.
The PMAS Directive cites the Service Delivery and Engineering (SDE) organization as having primary responsibilities for system testing and certification.
<Proect Name> Test Evaluation <Month> <Year>
Instructions
This template contains a style named Instructional Text. Text using this style is only to provide guidance in completing the document – the final document should not contain Instructional Text. Text in paragraphs added after Instructional Text is automatically set to the appropriate body text style. For best results and to maintain formatting consistency:
Use the provided paragraph styles Delete all Instructional Text before finalizing the document, including these instructions
The following project types are required to complete this artifact. Exceptions are outlined where needed throughout the document.
Activity New Capability [1] Feature Enhancement [2]
Field Deployment [A] Yes Yes
Cloud/Web Deployment [B] Yes Yes
Mobile Application [C] Yes Yes
Section 508 compliance. The contents of this document shall be 508 compliant and accessible to persons with disabilities. Particular attention should be given to tables and images. Training on how to make the document accessible can be found here: http://www.hhs.gov/web/508/accessiblefiles/index.html.
<Proect Name> Test Evaluation <Month> <Year>
Table of Contents1. Test Evaluation Introduction..............................................................1
1.1. Test Evaluation Scope.....................................................................................11.2. Test Architecture..............................................................................................11.3. Test Environment/ Configuration....................................................................11.4. Installation Process..........................................................................................3
2. Test Data..............................................................................................33. Issues...................................................................................................34. Test Execution Log.............................................................................45. Test Defect Log....................................................................................46. Test Results Summary........................................................................4
6.1. Defect Severity and Priority Levels.................................................................46.2. Total Defects by Severity Level.......................................................................56.3. Defects by Severity Level and Increment.......................................................56.4. Breakdown of Test Results..............................................................................66.5. Performance Testing........................................................................................6
6.5.1. Test Event.................................................................................................66.5.2. Requirements Coverage Status..............................................................76.5.3. Test Design...............................................................................................86.5.4. Test Execution..........................................................................................86.5.5. Analysis / What the Results Mean...........................................................86.5.6. Performance Test Results.......................................................................86.5.7. Transaction Response Times..................................................................86.5.8. Server Resources.....................................................................................9
7. Test Coverage....................................................................................107.1. Requirements Covered..................................................................................107.2. Section 508 Compliance Coverage...............................................................10
8. Suggested Actions............................................................................109. Defect Severity and Priority Definitions..........................................10
9.1. Defect Severity Level......................................................................................119.1.1. Severity Level 1 – Critical......................................................................119.1.2. Severity Level 2 - High...........................................................................119.1.3. Severity Level 3 - Medium......................................................................129.1.4. Severity Level 4 - Low............................................................................12
9.2. Priority Classifications...................................................................................129.2.1. Priority 1 - Resolve Immediately...........................................................12
<Proect Name> Test Evaluation <Month> <Year>
9.2.2. Priority 2 - Give High Attention.............................................................129.2.3. Priority 3 - Normal Queue......................................................................129.2.4. Priority 4 - Low Priority..........................................................................12
10. Optional Tables, Charts, and Graphs..............................................1311. Document Approval Signatures.......................................................14Appendix A - Test Execution Log...........................................................15Appendix B – Defect Log.........................................................................16
<Proect Name> Test Evaluation <Month> <Year>
1. Test Evaluation IntroductionProvide an overview of the Test Evaluation specifying the purpose, scope, definitions, acronyms, abbreviations, and references. The Test Evaluation should be filled out for each increment of the project and summaries should be provided for the individual increment and for the project to date. Although there are not specific sections for these items, please add sections and relevant information as required for: IOC Approval, Test Site Concurrence, Compliance Dates and SQA Checklist.
1.1. Test Evaluation ScopeDescribe the scope of the testing as it relates to the original Master Test Plan. For example is this report produced as a result of Performance testing, Functional Regression testing, User Acceptance testing or other forms of testing? In the following subsections, identify portions of the Master test plan that were followed and what, if any, deviation was taken.
1.2. Test ArchitectureBriefly describe the architecture of the test environment. If the test architecture was described in the Master Test Plan, state this and describe the deviations (if any) from the actual test environment architecture and the description in the Master Test Plan. If the architecture was not described in the Master Test Plan, then describe it here and include a diagram.
Figure x: Environment Architecture
1.3. Test Environment/ ConfigurationBriefly describe the test environment. Describe any deviations (if any) test environment as defined in the Master Test Plan. For example, identify any changes the software being tested and include name of the software, build ID, Patch or Rev #, etc.
If the test environment was not described in the Master Test Plan, then describe it here.
For performance testing, use the table below to show the similarities or differences between the test environment and the production environment. (The Test Environment Components shown are examples.)
The <Project Name> architects and other component subject matter experts (SMEs) configured the <application name> applications and components for the designated hardware and software systems.
<Proect Name> Test Evaluation <Month> <Year>
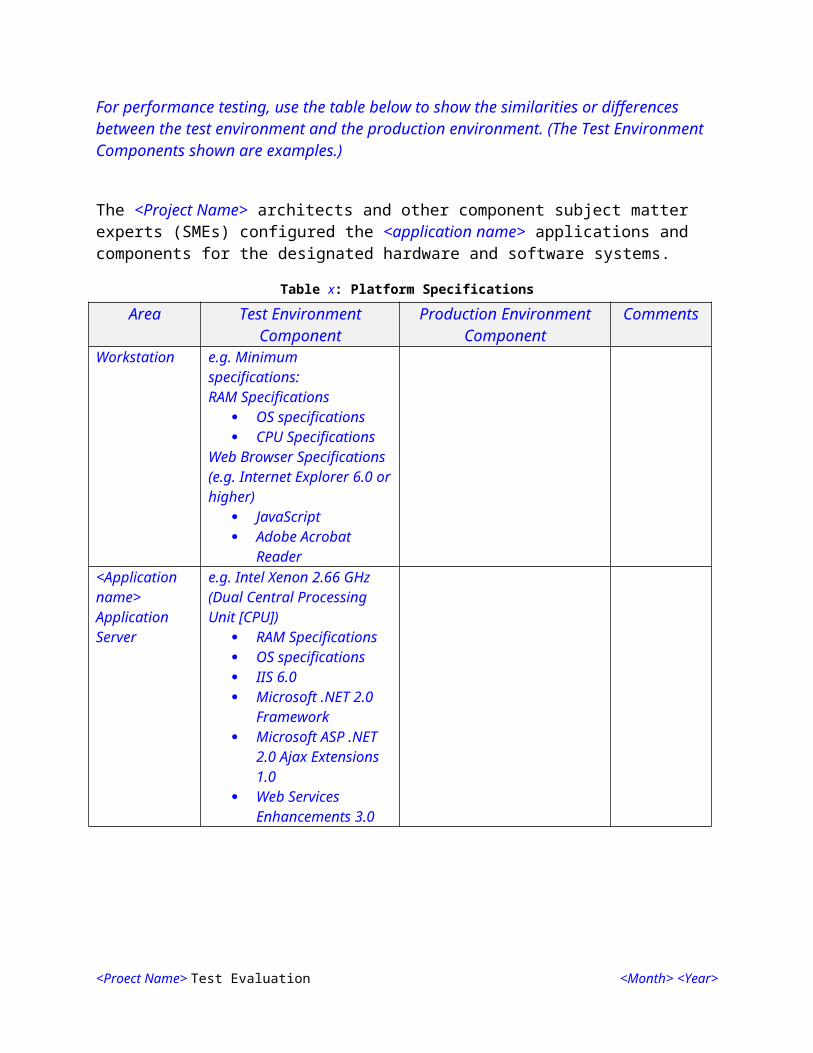
Table x: Platform SpecificationsArea Test Environment
ComponentProduction Environment
ComponentComments
Workstation e.g. Minimum specifications:RAM Specifications
OS specifications CPU Specifications
Web Browser Specifications (e.g. Internet Explorer 6.0 or higher)
JavaScript Adobe Acrobat Reader
<Application name> Application Server
e.g. Intel Xenon 2.66 GHz (Dual Central Processing Unit [CPU])
RAM Specifications OS specifications IIS 6.0 Microsoft .NET 2.0
Framework Microsoft ASP .NET
2.0 Ajax Extensions 1.0
Web Services Enhancements 3.0
<Application name> Web Server
e.g. Intel Xenon 2.66 GHz (Dual CPU)
RAM Specifications OS specifications IIS 6.0 Microsoft .NET 2.0
Framework Microsoft ASP .NET
2.0 Ajax Extensions 1.0
Web Services Enhancements 3.0.
<Application name> Database Server
e.g. Intel Xenon 2.66 GHz (Dual CPU)
RAM Specifications OS specifications Microsoft SQL Server
2010
<Proect Name> Test Evaluation <Month> <Year>
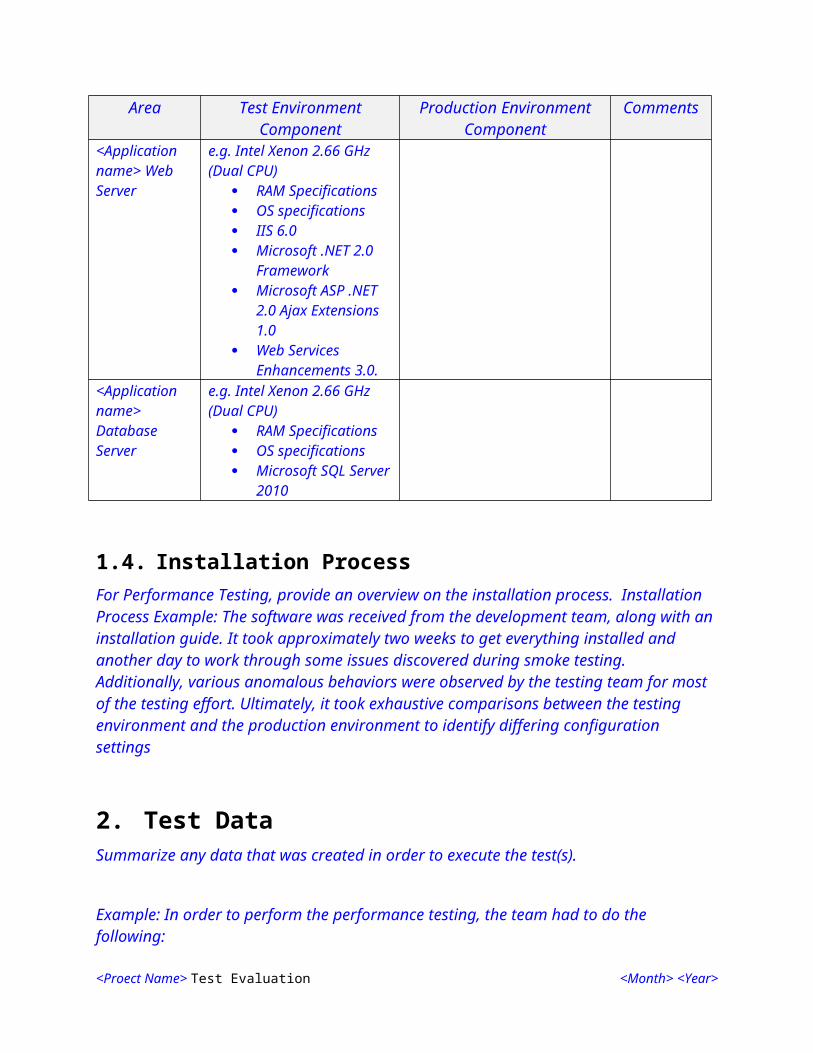
1.4. Installation ProcessFor Performance Testing, provide an overview on the installation process. Installation Process Example: The software was received from the development team, along with an installation guide. It took approximately two weeks to get everything installed and another day to work through some issues discovered during smoke testing. Additionally, various anomalous behaviors were observed by the testing team for most of the testing effort. Ultimately, it took exhaustive comparisons between the testing environment and the production environment to identify differing configuration settings
2. Test DataSummarize any data that was created in order to execute the test(s).
Example: In order to perform the performance testing, the team had to do the following:
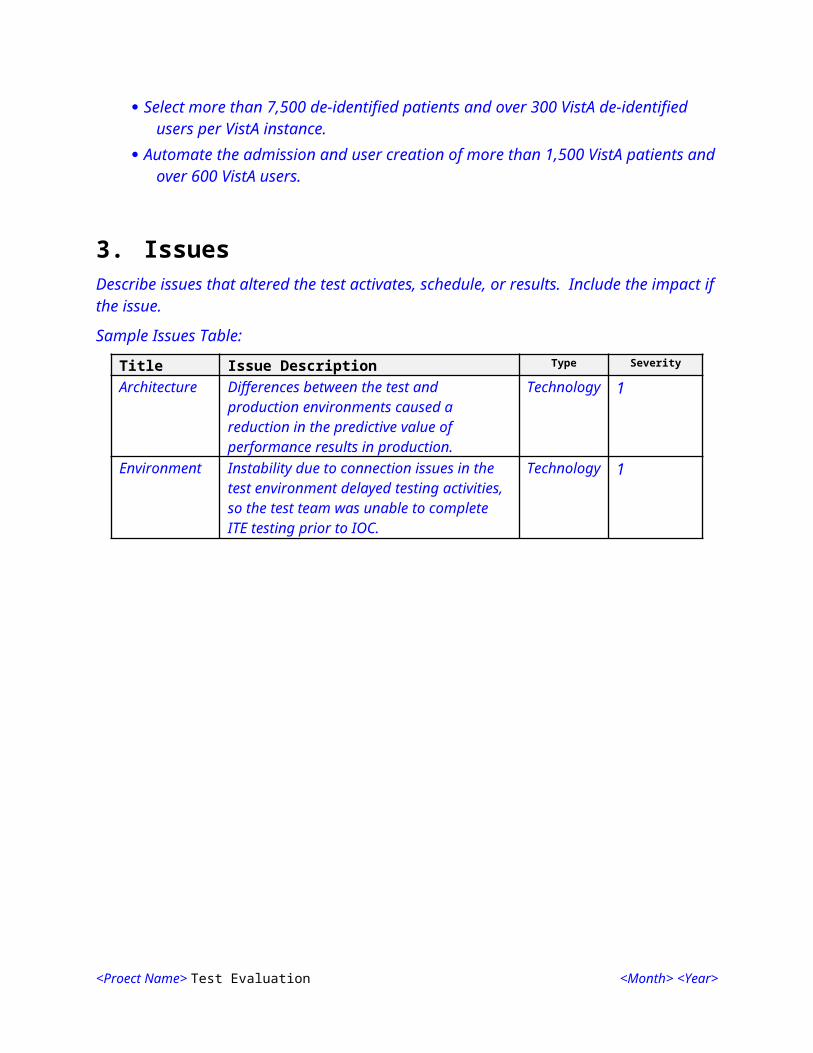
Select more than 7,500 de-identified patients and over 300 VistA de-identified users per VistA instance.
Automate the admission and user creation of more than 1,500 VistA patients and over 600 VistA users.
3. IssuesDescribe issues that altered the test activates, schedule, or results. Include the impact if the issue.
Sample Issues Table:
Title Issue Description Type Severity
Architecture Differences between the test and production environments caused a reduction in the predictive value of performance results in production.
Technology 1
Environment Instability due to connection issues in the test environment delayed testing activities, so the test team was unable to complete ITE testing prior to IOC.
Technology 1
<Proect Name> Test Evaluation <Month> <Year>
4. Test Execution LogThe Test Execution Log is records the execution of test scripts and documents the test results for each test script. The test analyst is responsible for completing the Test Execution Log. Each version of the Test Execution Log is listed in Appendix A, and has at least one corresponding Defect Log Listed in Appendix B.
The Test Execution Log shall be produced, following the instructions found in Appendix A. When possible, the Test Execution Log shall be produced via an automated tool (IBM Rational tools under the Ration Jazz Platform) report, otherwise it shall be manually produced.
5. Test Defect LogThe Test Defect Log, listed in Appendix B, is a tool for recording, analyzing, tracking, and documenting the closure of defects. It specifies the screen, field, behavior or result that occurred, and the IEEE defined Severity Level. It may include a screen capture and enough information for the developer to find and re-create the defect, Use the IEEE definitions for Severity Levels.
The Test Defect Log shall be produced, following the instructions found in Appendix B. When possible, the Test Defect Log shall be produced via an automated tool (IBM Rational tools under the Ration Jazz Platform) report, otherwise it shall be manually produced.
6. Test Results SummaryBriefly summarize the results of the test. This section shall include a high-level summary of total defects entered for the project, the source of the defects if more than one team has entered defects, and the resolution of each defect – fixed, deferred, works as designed, etc. The graphs and tables in the following sections may be used as a minimum set of results. However, you may add and delete graphs and tables according to the needs of the testing effort.
6.1. Defect Severity and Priority LevelsA defect is defined as a flaw in a component or system that can cause the component or system to fail to perform its required function, e.g., an incorrect statement or data definition. A defect, if encountered during execution, may cause a failure of the component or system.
Defects are categorized according to severity and priority levels. The test analyst assigns the severity, while the development manager assigns the priority for repair. For more information, see Defect Severity and Priority Definition in this Test Evaluation.
<Proect Name> Test Evaluation <Month> <Year>
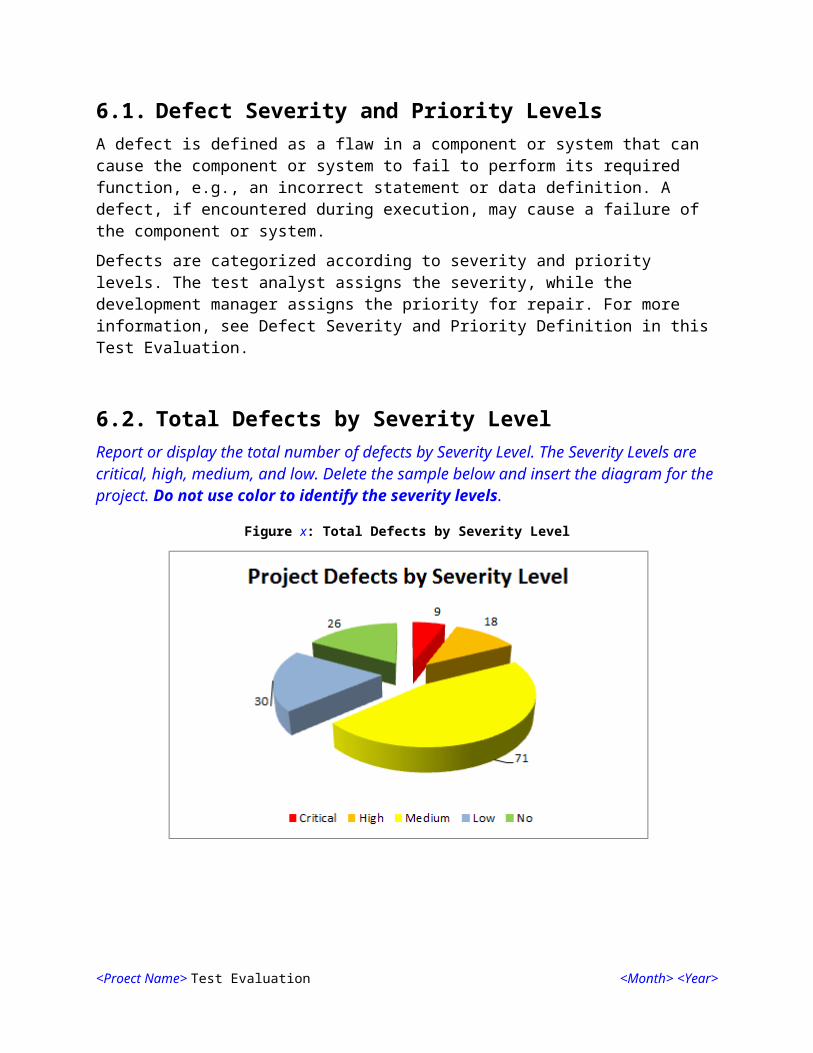
6.2. Total Defects by Severity LevelReport or display the total number of defects by Severity Level. The Severity Levels are critical, high, medium, and low. Delete the sample below and insert the diagram for the project. Do not use color to identify the severity levels.
Figure x: Total Defects by Severity Level
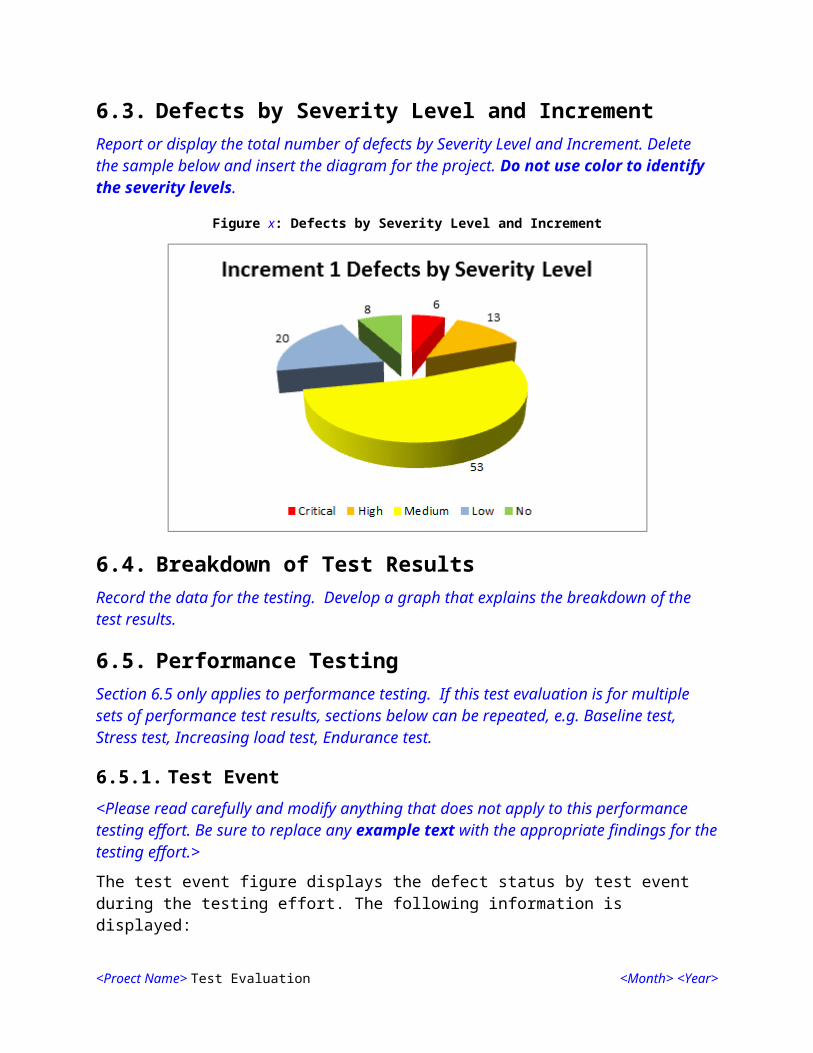
6.3. Defects by Severity Level and IncrementReport or display the total number of defects by Severity Level and Increment. Delete the sample below and insert the diagram for the project. Do not use color to identify the severity levels.
Figure x: Defects by Severity Level and Increment
<Proect Name> Test Evaluation <Month> <Year>
6.4. Breakdown of Test ResultsRecord the data for the testing. Develop a graph that explains the breakdown of the test results.
6.5. Performance TestingSection 6.5 only applies to performance testing. If this test evaluation is for multiple sets of performance test results, sections below can be repeated, e.g. Baseline test, Stress test, Increasing load test, Endurance test.
6.5.1. Test Event<Please read carefully and modify anything that does not apply to this performance testing effort. Be sure to replace any example text with the appropriate findings for the testing effort.>
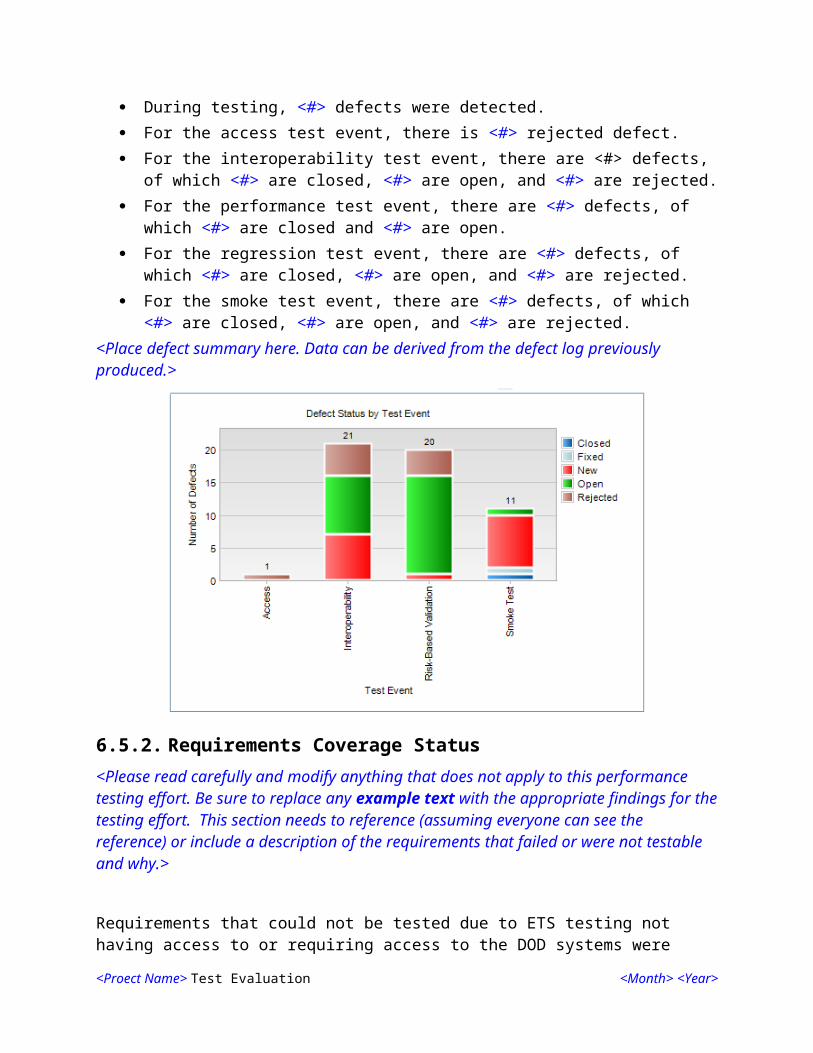
The test event figure displays the defect status by test event during the testing effort. The following information is displayed:
During testing, <#> defects were detected. For the access test event, there is <#> rejected defect. For the interoperability test event, there are <#> defects, of which <#> are closed, <#>
are open, and <#> are rejected. For the performance test event, there are <#> defects, of which <#> are closed and <#>
are open. For the regression test event, there are <#> defects, of which <#> are closed, <#> are
open, and <#> are rejected. For the smoke test event, there are <#> defects, of which <#> are closed, <#> are open,
and <#> are rejected.<Place defect summary here. Data can be derived from the defect log previously produced.>
<Proect Name> Test Evaluation <Month> <Year>
6.5.2. Requirements Coverage Status<Please read carefully and modify anything that does not apply to this performance testing effort. Be sure to replace any example text with the appropriate findings for the testing effort. This section needs to reference (assuming everyone can see the reference) or include a description of the requirements that failed or were not testable and why.>
Requirements that could not be tested due to ETS testing not having access to or requiring access to the DOD systems were labelled Not Testable. In addition, requirements that were so high level that an entire system test would be required to validate the passing of the requirement were also labelled Not Testable.
Figure <#> displays the number of requirements that were tested during testing the code set for each build. The following information is displayed:
For the <type> direct cover status, there is/are <#> requirement(s) For the failed direct cover status, there are <#> requirements For the no run direct cover status, there are <#> requirements For the not completed direct cover status, there are <#> requirements For the not testable direct cover status, there are <#> requirement. For the passed direct cover status, there are <#> requirements
Figure x: Requirements Coverage
<Proect Name> Test Evaluation <Month> <Year>
6.5.3. Test DesignThe following figure compares the users and the amount of work they completed to what is expected in production. This shows that not only the number of virtual users was met, but also the derivative of the amount of work they accomplish while logged into the system.
If necessary, briefly describe any reasons the tests could not reach expected user or workloads in production for the table below.
Business Process Name
Number of users
expected in production
Number of users ran
during testing
Business Processes expected hourly in
production
Business Processes ran hourly during
performance test
Total completed processes
during performance test
Login Example 300 300 372 369 1106
Patient Lookup Example
250 250 140 90 269
Logout Example 300 300 270 191 572
6.5.4. Test ExecutionDescribe the type of test run. This can include purpose of this particular test i.e. baseline, spike, load, or endurance tests. If multiple tests are being documented, use this section to document differences between the tests. This can include the number of users ran, pacing, and user think time.
6.5.5. Analysis / What the Results MeanDescribe whether or not the test results show that the system should/should not be considered stable for the average expected workload.
6.5.6. Performance Test ResultsDescribe the overall behavior of the test run. Give a high level description of the stability of the test run and the length of its duration. Describe the overall condition of the environment during load testing (e.g. resource trending vs stability). Denote application or server errors. Document if response time requirements or SLAs were met.
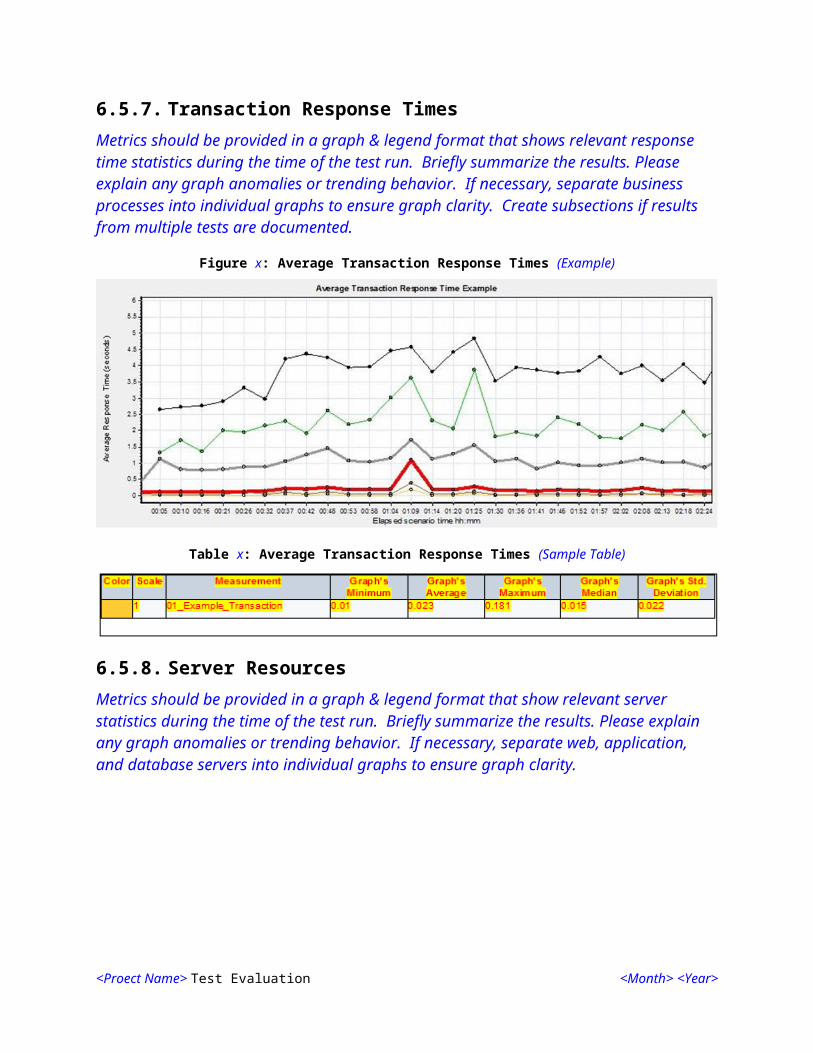
6.5.7. Transaction Response TimesMetrics should be provided in a graph & legend format that shows relevant response time statistics during the time of the test run. Briefly summarize the results. Please explain any graph anomalies or trending behavior. If necessary, separate business processes into individual graphs to ensure graph clarity. Create subsections if results from multiple tests are documented.
<Proect Name> Test Evaluation <Month> <Year>
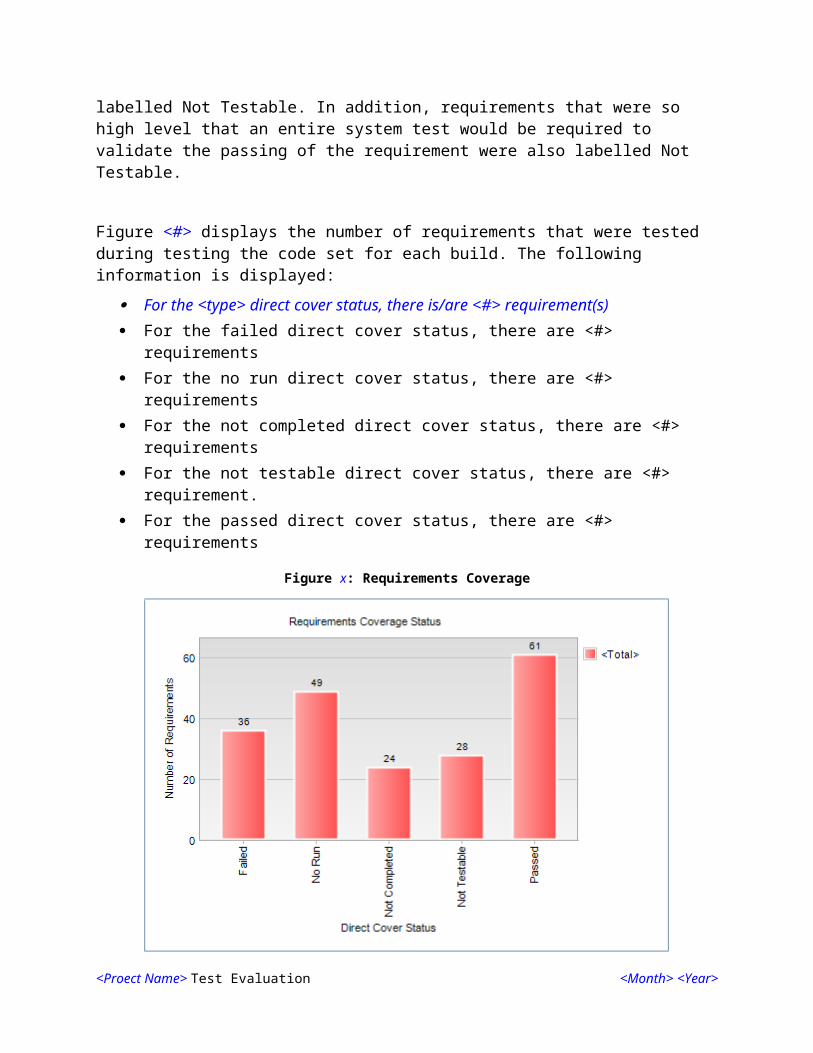
Figure x: Average Transaction Response Times (Example)
Table x: Average Transaction Response Times (Sample Table)
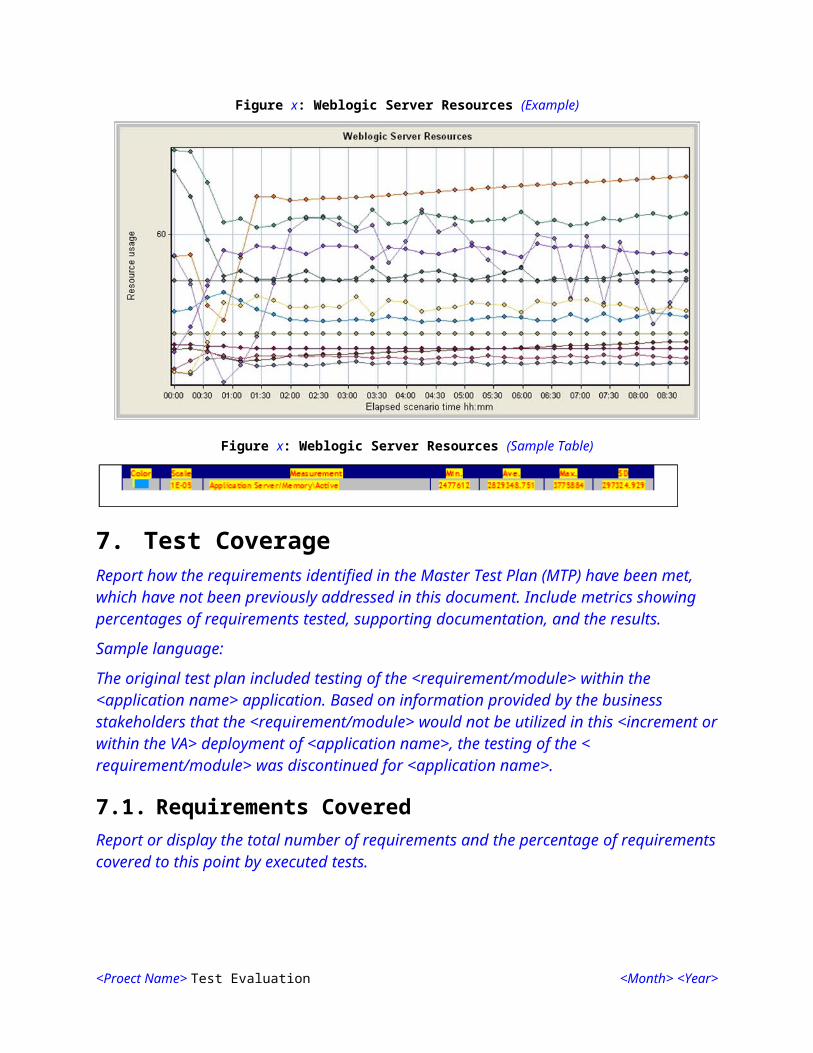
6.5.8. Server ResourcesMetrics should be provided in a graph & legend format that show relevant server statistics during the time of the test run. Briefly summarize the results. Please explain any graph anomalies or trending behavior. If necessary, separate web, application, and database servers into individual graphs to ensure graph clarity.
Figure x: Weblogic Server Resources (Example)
<Proect Name> Test Evaluation <Month> <Year>
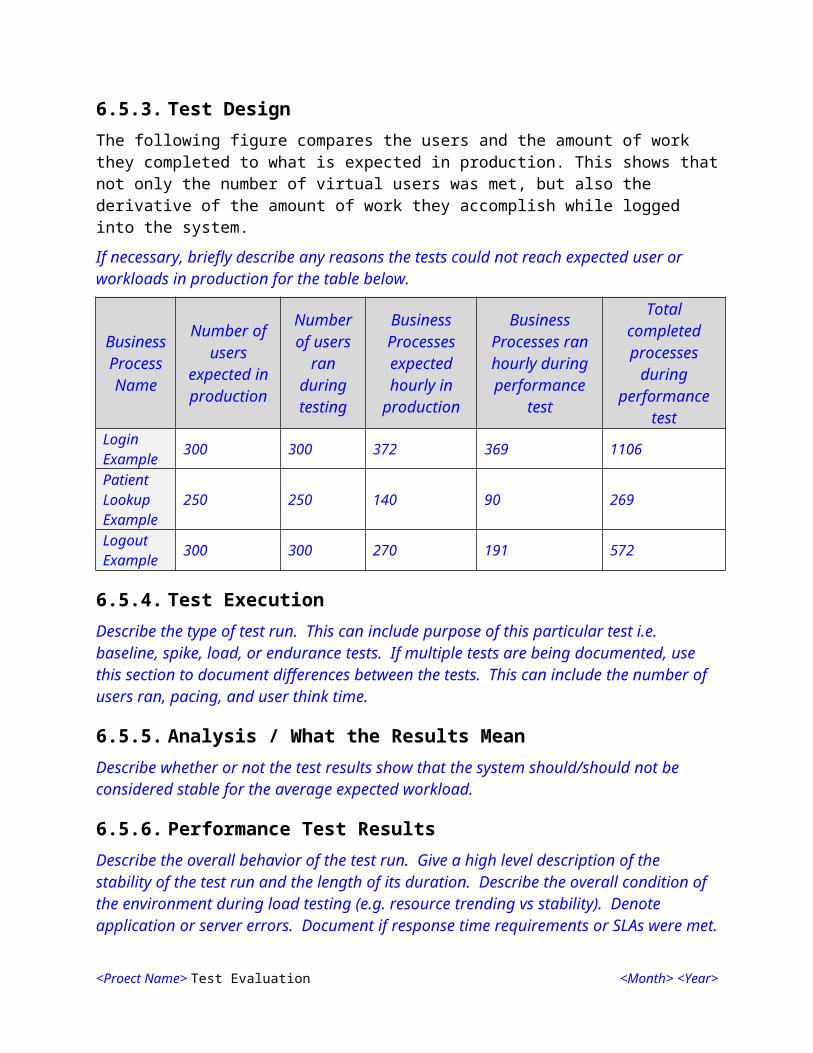
Figure x: Weblogic Server Resources (Sample Table)
7. Test CoverageReport how the requirements identified in the Master Test Plan (MTP) have been met, which have not been previously addressed in this document. Include metrics showing percentages of requirements tested, supporting documentation, and the results.
Sample language:
The original test plan included testing of the <requirement/module> within the <application name> application. Based on information provided by the business stakeholders that the <requirement/module> would not be utilized in this <increment or within the VA> deployment of <application name>, the testing of the < requirement/module> was discontinued for <application name>.
7.1. Requirements CoveredReport or display the total number of requirements and the percentage of requirements covered to this point by executed tests.
7.2. Section 508 Compliance CoverageReport or display the total number of Section 508 Compliance requirements and the percentage of Section 508 Compliance requirements covered to this point by executed tests. Report Section 508 defects found during User Functionality Test to the Section 508 Program Office. For more information, contact [email protected]. Identify whether the project had an internal 508 test team or an external 508 test team.
8. Suggested ActionsState any suggested actions based upon an evaluation of the test results and key measures of test. Document problems found during the <lifecycle, phase, or increment> for a project that negatively impacted testing coverage, along with recommendations for improvement.
9. Defect Severity and Priority DefinitionsThe classification of defects within a system examines both the severity and priority of the defect.
Severity is a measure of how great the impact is on the user’s ability to complete the documented actions within the system.
Priority determines the speed with which a given defect must be repaired.
<Proect Name> Test Evaluation <Month> <Year>
Defect classification may be determined either because testing is delayed by a failure in the system or because a cumbersome workaround prevents a user from completing the assigned tasks. Both severity and priority measures must be recorded when scheduling defect resolution tasks.
9.1. Defect Severity LevelThe following subsections identify the defect severity levels.
9.1.1. Severity Level 1 – CriticalInstitute of Electrical and Electronics Engineers (IEEE) definition: The defect results in the failure of the complete software system, of a subsystem, or of a software unit (program or module) within the system.
Any defect that compromises patient safety or system security. Examples of system security defects include breach of confidentiality requirements of the Privacy Act, the Health Insurance Portability and Accountability Act (HIPAA), or Federal Tax Information guidelines.
Loss of system functionality critical to user operations with no suitable workaround, i.e., there is no way to achieve the expected results using the application.
System crash or hang that prevents further testing or operation of the complete application or a section of the application.
Any defect that causes corruption of data from a result of the system (as opposed to user error).
Any defect in which inappropriate transmissions are consistently generated or appropriate transmissions of HL7 messages fail to be generated.
Loss of functionality resulting in erroneous eligibility/enrollment determinations or communications not being sent.
9.1.2. Severity Level 2 - High IEEE definition: The defect results in the failure of the complete software system, of a subsystem, or of a software unit (program or module) within the system. There is no way to make the failed component(s) function. However, there are acceptable processing alternatives which will yield the desired result.
A major defect in the functionality that does not result in corruption of data. A major defect in the functionality resulting in a failure of all or part of the application,
where: The expected results can temporarily be achieved by alternate means. The customer
indicates the work around is acceptable for the short term. Any defect that does not conform to Section 508 standards. Any defect that results in inaccurate or missing requirements. Any defect that results in invalid authentication or authentication of an invalid end user.
<Proect Name> Test Evaluation <Month> <Year>
9.1.3. Severity Level 3 - Medium IEEE definition: The defect does not result in a failure, but causes the system to produce incorrect, incomplete, or inconsistent results, or the defect impairs the systems usability.
Minor functionality is not working as intended and a workaround exists but is not suitable for long term use
The inability of a valid user to access the system consistent with granted privileges Typographical or grammatical errors in the application, including installation guides, user
guides, training manuals, and design documents Any defect producing cryptic, incorrect, or inappropriate error messages Any defect that results from the use of non-standard data terminology in the application
or documentation, as defined by the Department of Veterans Affairs Cosmetic issues that are important to the integrity of the product, but do not result in data
entry and or data quality problems.
9.1.4. Severity Level 4 - Low IEEE definition: The defect does not cause a failure, does not impair usability, and the desired processing results are easily obtained by working around the defect.
Minor loss of, or defect in the functionality where a long term use exists Low-level cosmetic issues.
9.2. Priority ClassificationsThe following subsections identify the appropriate actions for defects at each priority level, per definitions of IEEE.
9.2.1. Priority 1 - Resolve ImmediatelyFurther development and/or testing cannot occur until the defect has been repaired. The system cannot be used until the repair has been affected.
9.2.2. Priority 2 - Give High AttentionThe defect must be resolved as soon as possible because it is impairing development and/or testing activities. System use will be severely affected until the defect is fixed.
9.2.3. Priority 3 - Normal QueueThe defect should be resolved in the normal course of development activities. It can wait until a new build or version is created.
9.2.4. Priority 4 - Low PriorityThe defect is an irritant that should be repaired, but can be repaired after more serious defects have been fixed.
<Proect Name> Test Evaluation <Month> <Year>
10. Optional Tables, Charts, and GraphsAfter performing an analysis of the defect data, provide relevant graphs that would be relevant to Senior Leadership to understand the results of the testing.
<Proect Name> Test Evaluation <Month> <Year>
11. Document Approval Signatures
Signed: _______________________________________________________________________
Program/Project Manager Date
Signed: _______________________________________________________________________
Business Sponsor Representative Date
Signed: _______________________________________________________________________
Lead Tester Date
<Proect Name> Test Evaluation <Month> <Year>
Appendix A - Test Execution LogA Test Execution Log will be developed and maintained for each increment of the project. Each iteration of the Test Execution Log (i.e., each time the log is modified prior to retesting) will be listed in Appendix A, and shall have at least one corresponding defect log listed in Appendix B.
When possible, the Test Execution Log shall be produced via an automated tool (IBM Rational tools under the Ration Jazz Platform) report, otherwise it shall be manually produced.
The Test Execution Log shall include:
Item DefinitionTest Case The numerical identifier for the Test Case associated with this Test ScriptTest Script ID The identification number assigned to this test scriptDate Tested The date the test was executedBuild ID/ Patch # The name of the build file installed prior to test execution or patch number and
test version numberActual Result:Pass/Fail
The test outcome; P=Pass, F=Fail
Defect ID The identification number assigned to the test failure
An example of the Test Execution Log includes:
Test Case Test Script ID Date Tested Build ID/Patch # Pass/Fail Defect ID4.1 1 11-11-11 PSO_6_0.KID;1 P None4.1 2 11-11-11 PSO_6_0.KID;1 F 14.1 3 11-12-11 PSO_6_0.KID;1 P None4.1 4 11-12-11 PSO_6_0.KID;1 P None
<Proect Name> Test Evaluation <Month> <Year>
Appendix B – Defect Log
A Test defect Log will be developed and maintained for each increment of the project. Each iteration of the Test Defect Log (i.e., each time the log is modified prior to retesting) will be listed in Appendix.
When possible, the Test Defect Log shall be produced via an automated tool (IBM Rational tools under the Ration Jazz Platform) report, otherwise it shall be manually produced.
Specify the screen, field, behavior and actual result that occurred. Include a screen capture, when possible. Use the IEEE definitions for Severity Levels. Supply the appropriate level of detail when recording a defect. Supply enough information for the developer to find, re-create and repair the defect.
An example of the manual Test Defect Log includes:
Project Name
Project ID System Name System Version #
Patch # Recorder
ID
Test
Cyc
le
Test
Cas
e ID
Des
crip
tion
Rep
orte
dB
y
Dat
eR
epor
ted
Seve
rity
Def
ect
Cod
eSt
atus
Res
olut
ion
Dat
eR
esol
ved
For example, to complete defect information:
1. Defect ID: <unique, sequential number used to identify the defect> 2. Test Cycle: <end-to-end execution of tests, per phase> 3. Multiple tests may be executed during each phase. Tests may be repeated in subsequent
cycles 4. Test Case ID: <reference number of the specific test case or test script> 5. Description: <brief description of the problem> 6. Reported by: <name of the person who discovered the defect> 7. Date Reported: <date the defect was reported> 8. Severity: <classification of defects within a system examines both the severity and
priority of the defect>
<Proect Name> Test Evaluation <Month> <Year>
Template Revision HistoryDate Versio
nDescription Author
June 2015 1.6 Migrated to latest Artifact Template, edited to conform with latest Section 508 guidelines, and remediated with Common Look Office tool
Process Management
May 2015 1.5 Reviewed and modified during the PMAS Process Improvement Lockdown
Process Management
October 2014 1.4 Edited to conform with current Section 508 guidelines and remediated with Common Look Office tool
Process Management
June 2014 1.3 Removed signature requirements for ESE Representative
Process Management
March 2013 1.2 Formatted to current ProPath documentation standards and edited to conform with latest Alternative Text (Section 508) guidelines
Process Management
March 2013 1.1 Updates from ETS ETS
January 2013 1.0 Initial Version PMAS Business Office
Place latest revisions at top of table.
The Template Revision History pertains only to the format of the template. It does not apply to the content of the document or any changes or updates to the content of the document after distribution.
The Template Revision History can be removed at the discretion of the author of the document.
Remove blank rows.
<Proect Name> Test Evaluation <Month> <Year>