Embed Size (px)
Citation preview
Test-Driven Design of Modulation Approaches forGrid-Tied Inverters
Tiarles Guterres, Henrique Magnago, Fernanda Carnielutti, Rodrigo Vieira, Jorge Massing, Humberto PinheiroGrupo de Eletronica de Potencia e Controle – Universidade Federal de Santa Maria
Santa Maria, Rio Grande do Sul 97105–900Emails: [email protected], [email protected], [email protected],
[email protected], [email protected], [email protected]
Abstract—The paper presents an approach to evaluate mo-dulation techniques in a Grid-Tied two-level Inverter using Test-Driven Design (TDD). It presents a set of tests that collectand calculate performance, harmonic, and power metrics of theinverter, based on IEEE Standards. The results are obtainedby a Hardware-In-the-Loop (HIL) simulation and the TDD isapplied with the pytest framework and Python language. Theresults of TDD procedure offer a structure to analyze differentcharacteristics of the modulation approaches considering theHalf-Bridge converter and the Space Vector, Sinusoidal andCarrier-Based algorithms.
Keywords – Modulation, Grid-Tied Inverters, Test-Driven Design
I. INTRODUCTION
The quick insertion of distributed generated systems inmarket create a demand for the power electronics industry.User generating and consuming from these resources broughtnew challenges for the engineering and engineers to build morereliable, safe, high-fidelity, and durable products in a shorterperiod of time, forcing guidelines and grid codes in order tomanufacture and sell inverters.
In that scenario, it became necessary to establish expe-riments for certification and validation of power converters,with reduced lead times. FPGA-based Hardware-In-the-Loop(HIL) are one of the most advanced simulation tools for powerelectronic devices, helping engineering companies to developtheir products in a shorter time, compared with solutionsrunning only in processors of general purposes, such as thepersonal computers (Processor-In-the-Loop) [1], [2].
Increase continuous integration, delivery and time-to-marketare possible with these new technologies to apply automationof tests as a feature for the development process [3]–[5]. Withtest automation, you can choose a list of one or more teststo evaluate and certify controllers, PV systems, converters,passive and active filters in several operation scenarios. Someof these tests are very difficult to perform using SupervisoryControl and Data Acquisition (SCADA) systems or in benchexperiments.
The Test-Driven Design (TDD) presented in [5]–[7] is amethodology based on Test-Driven Development used in testautomation for verification and validation into the softwareprocess. Beck is one of the first to discuss and document
the methodology [8] also explored by several authors [9]–[11] and popularized by the software Extreme Programming(XP) community. As a package, Test-Driven Developmentphilosophy is presented as a framework in Java, C#, andPython working accordingly to the structures displayed in thebook xUnit Test Patterns [12].
The design analysis using TDD is a new approach for powerelectronics. To deploy Grid-Tied Inverter can apply to the con-trollers a wide range of adversities, like disturbances, faults,and changes to the grid impedance. Tests were developed tocompute the system metrics, measuring and calculating theseconditions during the TDD procedure.
The computation of these metrics are done offline, aftersimulation, using the array package provided on Python, calledNumpy. Numpy assures results with fast and high-resolutionprecision provided by the HIL simulation [13].
The tests for Grid-Tied Inverters introduced to evaluatemodulation algorithms will be presented in Sections II andIII, the figures of merit considering grid codes and IEEEStandard approaches will be presented in Section IV, and thesummarization of TDD results and discussion of the approachwill be presented in Section V and VI.
II. TEST-DRIVEN DESIGN
The first testing approach known by the development com-munity is the Waterfall method presented by Royce [14]. Inthis model, the test is placed to develop and evaluated at theend of the workflow, as a highlight in Fig. 1.
The method is a difficult way to proceed, where the productspecification cannot be verified until the end of the developingprocess. After Waterfall method, the literature shows testingmodels closer to design, as the V-model introduced as anindustrial development method [15].
V-model is similar to Waterfall in the steps definitionbut at the same time built more connection between eachstep, attaching each other with layers with different levels ofabstraction.
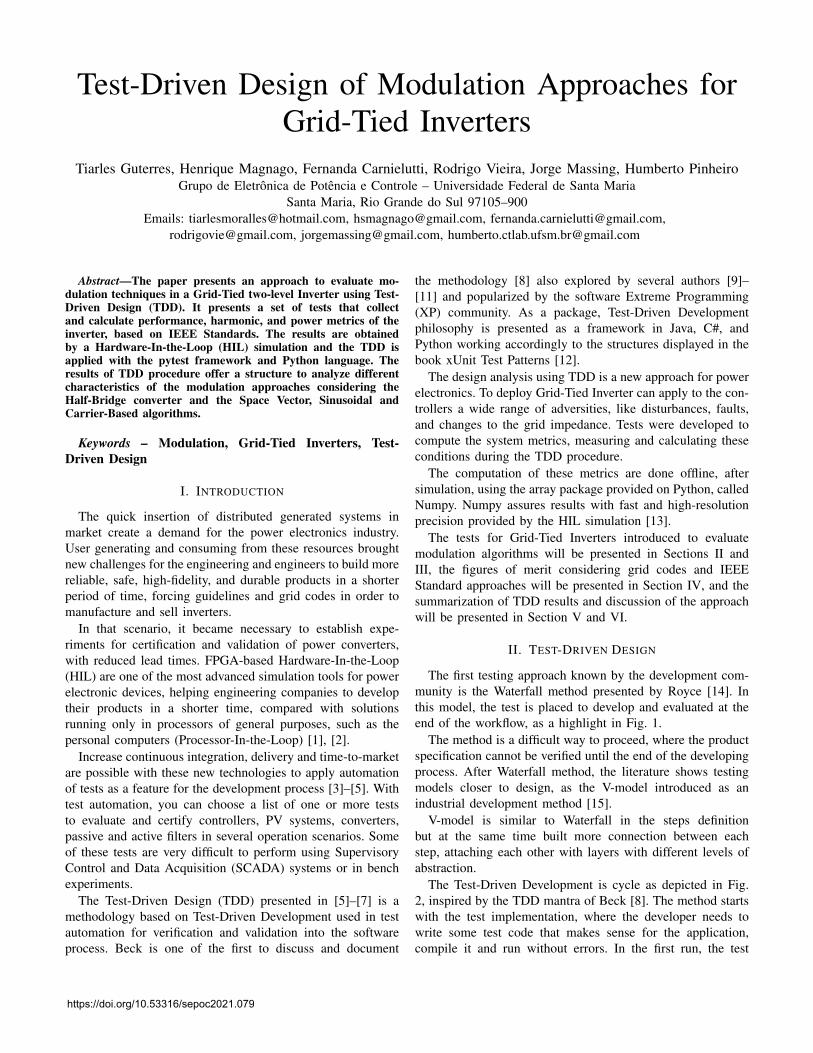
The Test-Driven Development is cycle as depicted in Fig.2, inspired by the TDD mantra of Beck [8]. The method startswith the test implementation, where the developer needs towrite some test code that makes sense for the application,compile it and run without errors. In the first run, the test
https://doi.org/10.53316/sepoc2021.079
Start System Requirements
Software Requirements
Analysis
Program Design
Coding
Testing
Operations End
Fig. 1. Flowchart of Waterfall method [14].
result will probably fail, which is not a problem consideringthe approach has a refactoring stage.
In refactoring step, the design is improved until the resultsare satisfactory, attending the test requirements. If, after refac-toring, the tests pass the user can return to the evaluationstep and write more code to make sure that all applicationrequirements are satisfied. If the new tests fail, the productcan be refactored to implement necessary changes to make itpass.
The test structure described by Hackenberg and Mund [6] isvery close to Test-Driven Development, presenting a structuremore flexible to industrial and Engineering applications. TheTest-Driven Design (TDD) introduces not only the notion ofincrements during the developing process but also an extraphase in the Test-Driven Development.
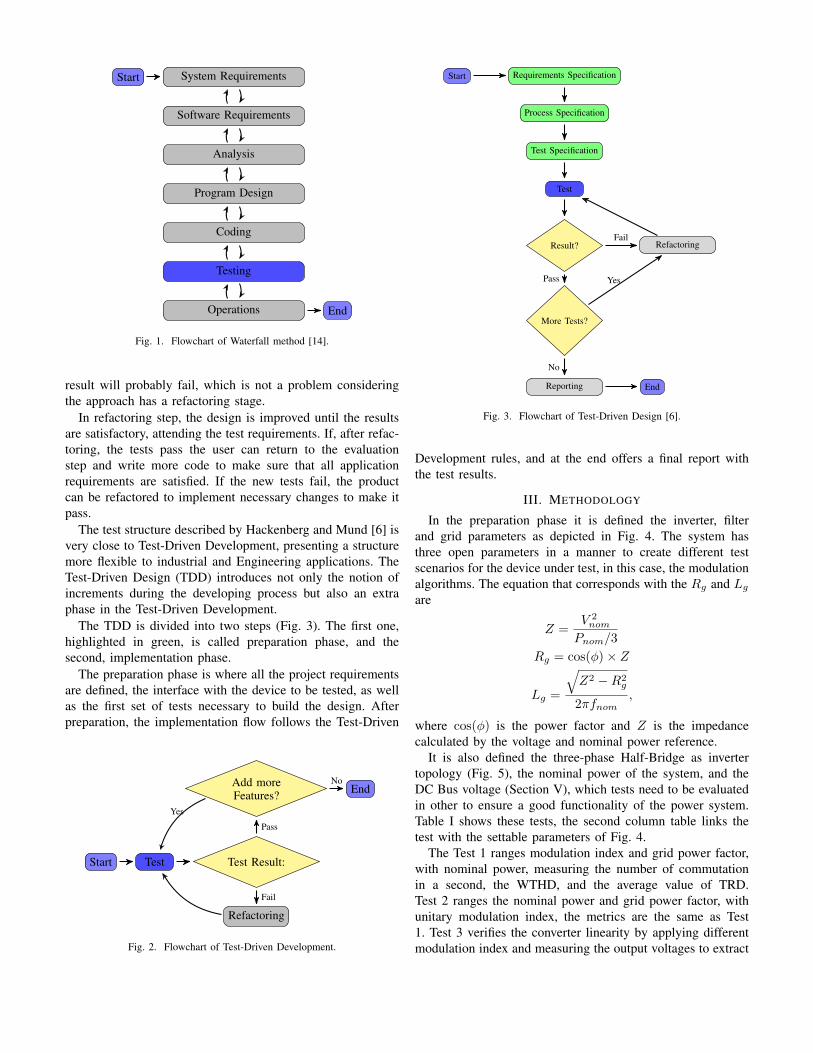
The TDD is divided into two steps (Fig. 3). The first one,highlighted in green, is called preparation phase, and thesecond, implementation phase.
The preparation phase is where all the project requirementsare defined, the interface with the device to be tested, as wellas the first set of tests necessary to build the design. Afterpreparation, the implementation flow follows the Test-Driven
Start Test Test Result:
Refactoring
Add moreFeatures? End
Fail
Pass
No
Yes
Fig. 2. Flowchart of Test-Driven Development.
Start Requirements Specification
Process Specification
Test Specification
Test
Result? Refactoring
More Tests?
Reporting End
Fail
Pass Yes
No
Fig. 3. Flowchart of Test-Driven Design [6].
Development rules, and at the end offers a final report withthe test results.
III. METHODOLOGY
In the preparation phase it is defined the inverter, filterand grid parameters as depicted in Fig. 4. The system hasthree open parameters in a manner to create different testscenarios for the device under test, in this case, the modulationalgorithms. The equation that corresponds with the Rg and Lg
are
Z =V 2nom
Pnom/3
Rg = cos(φ)× Z
Lg =
√Z2 −R2
g
2πfnom,
where cos(φ) is the power factor and Z is the impedancecalculated by the voltage and nominal power reference.
It is also defined the three-phase Half-Bridge as invertertopology (Fig. 5), the nominal power of the system, and theDC Bus voltage (Section V), which tests need to be evaluatedin other to ensure a good functionality of the power system.Table I shows these tests, the second column table links thetest with the settable parameters of Fig. 4.
The Test 1 ranges modulation index and grid power factor,with nominal power, measuring the number of commutationin a second, the WTHD, and the average value of TRD.Test 2 ranges the nominal power and grid power factor, withunitary modulation index, the metrics are the same as Test1. Test 3 verifies the converter linearity by applying differentmodulation index and measuring the output voltages to extract
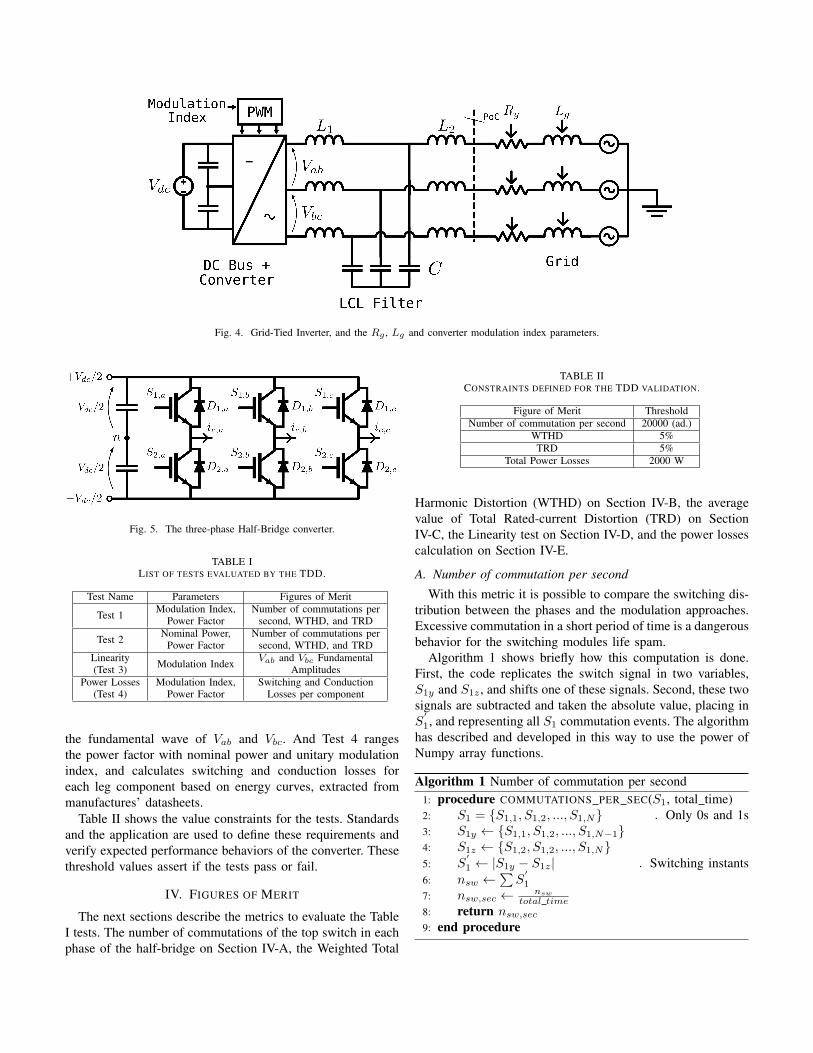
Fig. 4. Grid-Tied Inverter, and the Rg , Lg and converter modulation index parameters.
Fig. 5. The three-phase Half-Bridge converter.
TABLE ILIST OF TESTS EVALUATED BY THE TDD.
Test Name Parameters Figures of Merit
Test 1 Modulation Index,Power Factor
Number of commutations persecond, WTHD, and TRD
Test 2 Nominal Power,Power Factor
Number of commutations persecond, WTHD, and TRD
Linearity(Test 3) Modulation Index Vab and Vbc Fundamental
AmplitudesPower Losses
(Test 4)Modulation Index,
Power FactorSwitching and Conduction
Losses per component
the fundamental wave of Vab and Vbc. And Test 4 rangesthe power factor with nominal power and unitary modulationindex, and calculates switching and conduction losses foreach leg component based on energy curves, extracted frommanufactures’ datasheets.
Table II shows the value constraints for the tests. Standardsand the application are used to define these requirements andverify expected performance behaviors of the converter. Thesethreshold values assert if the tests pass or fail.
IV. FIGURES OF MERIT
The next sections describe the metrics to evaluate the TableI tests. The number of commutations of the top switch in eachphase of the half-bridge on Section IV-A, the Weighted Total
TABLE IICONSTRAINTS DEFINED FOR THE TDD VALIDATION.
Figure of Merit ThresholdNumber of commutation per second 20000 (ad.)
WTHD 5%TRD 5%
Total Power Losses 2000 W
Harmonic Distortion (WTHD) on Section IV-B, the averagevalue of Total Rated-current Distortion (TRD) on SectionIV-C, the Linearity test on Section IV-D, and the power lossescalculation on Section IV-E.
A. Number of commutation per second
With this metric it is possible to compare the switching dis-tribution between the phases and the modulation approaches.Excessive commutation in a short period of time is a dangerousbehavior for the switching modules life spam.
Algorithm 1 shows briefly how this computation is done.First, the code replicates the switch signal in two variables,S1y and S1z , and shifts one of these signals. Second, these twosignals are subtracted and taken the absolute value, placing inS
′
1, and representing all S1 commutation events. The algorithmhas described and developed in this way to use the power ofNumpy array functions.
Algorithm 1 Number of commutation per second1: procedure COMMUTATIONS PER SEC(S1, total time)2: S1 = {S1,1, S1,2, ..., S1,N} . Only 0s and 1s3: S1y ← {S1,1, S1,2, ..., S1,N−1}4: S1z ← {S1,2, S1,2, ..., S1,N}5: S
′
1 ← |S1y − S1z| . Switching instants6: nsw ←
∑S
′
1
7: nsw,sec ← nsw
total time8: return nsw,sec
9: end procedure
B. Weighted Total Harmonic Distortion
In order to calculate the WTHD, TRD, and linearity testhas introduced in TDD the methodology of ”very short timeharmonic measurements” from IEEE 519-2014 [16]. Thestandard establishes a measurement on an interval of three(3) seconds with a sliding-window of 15 samples, each onewith 12 cycles, for 60 Hz, or 10 cycles, for 50 Hz, equals200 ms. In TDD these parameters are totally configurable toshorten the refactoring cycle.
Equation (1) computes the WTHD [17] of one window (j)
WTHDj =
√∑∞h=2
(Vh,j
h
)2V1,j
. (1)
And the final WTHD is an average value of all windows
WTHD (%) =1
N
N∑j=1
WTHDj × 100,
where N is the number of windows.The signal used to calculate the WTHD is a relation between
the output inverter voltages. The value of 2Vab +Vbc describethe behavior of the current through LCL filter connected tothe converter [18].
C. Average Total Rated-current Distortion
The Total Rated-current Distortion (TRD, equation (2))presented on IEEE 1547-2018 [19] considers all harmoniccontent, including sub-harmonics and inter-harmonics, of thecurrent measured, except the fundamental.
TRDabc =
√I2rms,abc − I21,abc
Irated(2)
where Irms,abc is each phase RMS value, I1,abc is the RMSvalue of the fundamental components, and Irated is the nomi-nal current of the converter. For three-phase converters, Iratedis calculated as
Irated =Pnom
3 Vnom. (3)
Considering that TRD is calculated for each phase current,it is possible to compute the average as
TRDav(%) =TRDa + TRDb + TRDc
3× 100. (4)
As presented in the previous section, the TRD procedure asthe same of WTHD considering the ”very short time harmonicmeasurements” of IEEE 519-2014.
D. Linearity
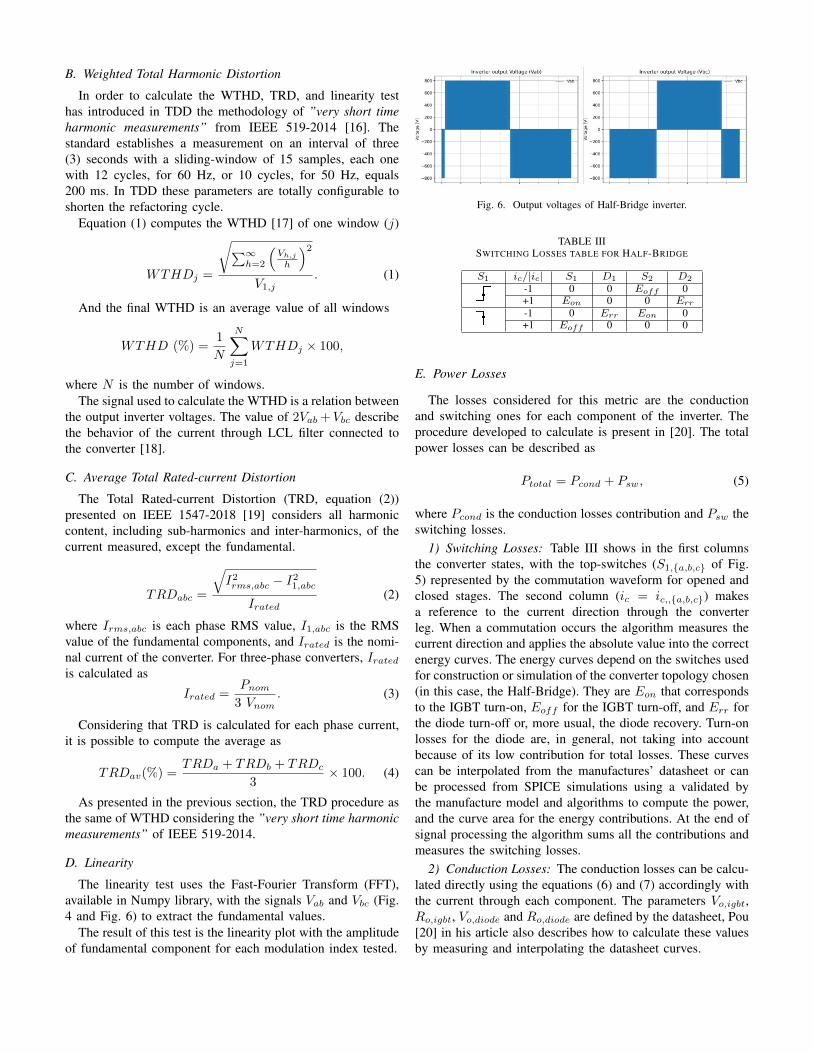
The linearity test uses the Fast-Fourier Transform (FFT),available in Numpy library, with the signals Vab and Vbc (Fig.4 and Fig. 6) to extract the fundamental values.
The result of this test is the linearity plot with the amplitudeof fundamental component for each modulation index tested.
Fig. 6. Output voltages of Half-Bridge inverter.
TABLE IIISWITCHING LOSSES TABLE FOR HALF-BRIDGE
S1 ic/|ic| S1 D1 S2 D2
-1 0 0 Eoff 0+1 Eon 0 0 Err
-1 0 Err Eon 0+1 Eoff 0 0 0
E. Power Losses
The losses considered for this metric are the conductionand switching ones for each component of the inverter. Theprocedure developed to calculate is present in [20]. The totalpower losses can be described as
Ptotal = Pcond + Psw, (5)
where Pcond is the conduction losses contribution and Psw theswitching losses.
1) Switching Losses: Table III shows in the first columnsthe converter states, with the top-switches (S1,{a,b,c} of Fig.5) represented by the commutation waveform for opened andclosed stages. The second column (ic = ic,,{a,b,c}) makesa reference to the current direction through the converterleg. When a commutation occurs the algorithm measures thecurrent direction and applies the absolute value into the correctenergy curves. The energy curves depend on the switches usedfor construction or simulation of the converter topology chosen(in this case, the Half-Bridge). They are Eon that correspondsto the IGBT turn-on, Eoff for the IGBT turn-off, and Err forthe diode turn-off or, more usual, the diode recovery. Turn-onlosses for the diode are, in general, not taking into accountbecause of its low contribution for total losses. These curvescan be interpolated from the manufactures’ datasheet or canbe processed from SPICE simulations using a validated bythe manufacture model and algorithms to compute the power,and the curve area for the energy contributions. At the end ofsignal processing the algorithm sums all the contributions andmeasures the switching losses.
2) Conduction Losses: The conduction losses can be calcu-lated directly using the equations (6) and (7) accordingly withthe current through each component. The parameters Vo,igbt,Ro,igbt, Vo,diode and Ro,diode are defined by the datasheet, Pou[20] in his article also describes how to calculate these valuesby measuring and interpolating the datasheet curves.
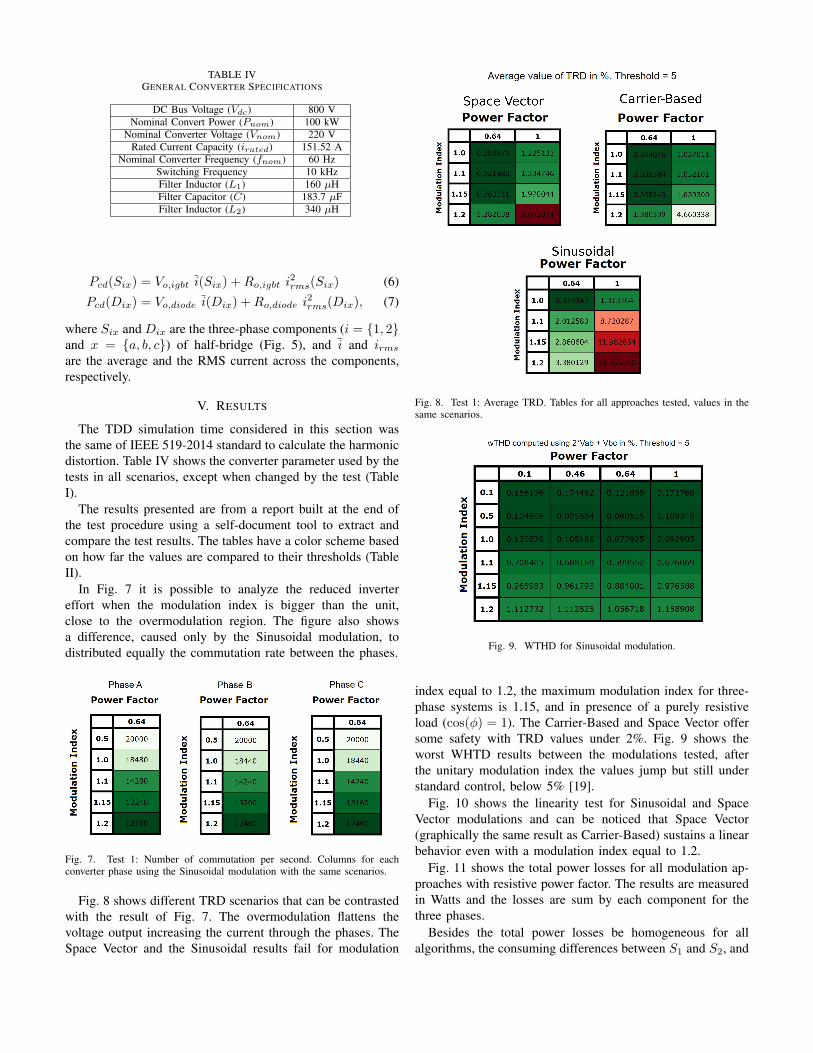
TABLE IVGENERAL CONVERTER SPECIFICATIONS
DC Bus Voltage (Vdc) 800 VNominal Convert Power (Pnom) 100 kW
Nominal Converter Voltage (Vnom) 220 VRated Current Capacity (irated) 151.52 A
Nominal Converter Frequency (fnom) 60 HzSwitching Frequency 10 kHzFilter Inductor (L1) 160 µHFilter Capacitor (C) 183.7 µFFilter Inductor (L2) 340 µH
Pcd(Six) = Vo,igbt i(Six) +Ro,igbt i2rms(Six) (6)
Pcd(Dix) = Vo,diode i(Dix) +Ro,diode i2rms(Dix), (7)
where Six and Dix are the three-phase components (i = {1, 2}and x = {a, b, c}) of half-bridge (Fig. 5), and i and irms
are the average and the RMS current across the components,respectively.
V. RESULTS
The TDD simulation time considered in this section wasthe same of IEEE 519-2014 standard to calculate the harmonicdistortion. Table IV shows the converter parameter used by thetests in all scenarios, except when changed by the test (TableI).
The results presented are from a report built at the end ofthe test procedure using a self-document tool to extract andcompare the test results. The tables have a color scheme basedon how far the values are compared to their thresholds (TableII).
In Fig. 7 it is possible to analyze the reduced invertereffort when the modulation index is bigger than the unit,close to the overmodulation region. The figure also showsa difference, caused only by the Sinusoidal modulation, todistributed equally the commutation rate between the phases.
Fig. 7. Test 1: Number of commutation per second. Columns for eachconverter phase using the Sinusoidal modulation with the same scenarios.
Fig. 8 shows different TRD scenarios that can be contrastedwith the result of Fig. 7. The overmodulation flattens thevoltage output increasing the current through the phases. TheSpace Vector and the Sinusoidal results fail for modulation
Fig. 8. Test 1: Average TRD. Tables for all approaches tested, values in thesame scenarios.
Fig. 9. WTHD for Sinusoidal modulation.
index equal to 1.2, the maximum modulation index for three-phase systems is 1.15, and in presence of a purely resistiveload (cos(φ) = 1). The Carrier-Based and Space Vector offersome safety with TRD values under 2%. Fig. 9 shows theworst WHTD results between the modulations tested, afterthe unitary modulation index the values jump but still understandard control, below 5% [19].
Fig. 10 shows the linearity test for Sinusoidal and SpaceVector modulations and can be noticed that Space Vector(graphically the same result as Carrier-Based) sustains a linearbehavior even with a modulation index equal to 1.2.
Fig. 11 shows the total power losses for all modulation ap-proaches with resistive power factor. The results are measuredin Watts and the losses are sum by each component for thethree phases.
Besides the total power losses be homogeneous for allalgorithms, the consuming differences between S1 and S2, and
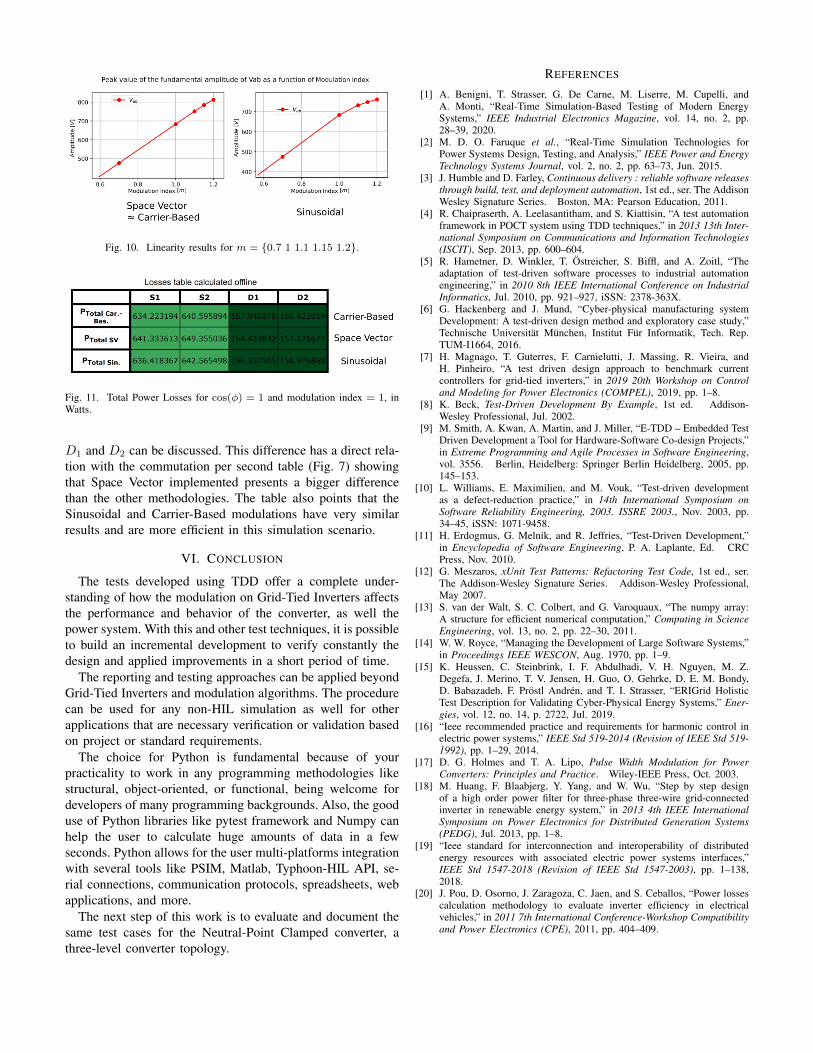
Fig. 10. Linearity results for m = {0.7 1 1.1 1.15 1.2}.
Fig. 11. Total Power Losses for cos(φ) = 1 and modulation index = 1, inWatts.
D1 and D2 can be discussed. This difference has a direct rela-tion with the commutation per second table (Fig. 7) showingthat Space Vector implemented presents a bigger differencethan the other methodologies. The table also points that theSinusoidal and Carrier-Based modulations have very similarresults and are more efficient in this simulation scenario.
VI. CONCLUSION
The tests developed using TDD offer a complete under-standing of how the modulation on Grid-Tied Inverters affectsthe performance and behavior of the converter, as well thepower system. With this and other test techniques, it is possibleto build an incremental development to verify constantly thedesign and applied improvements in a short period of time.
The reporting and testing approaches can be applied beyondGrid-Tied Inverters and modulation algorithms. The procedurecan be used for any non-HIL simulation as well for otherapplications that are necessary verification or validation basedon project or standard requirements.
The choice for Python is fundamental because of yourpracticality to work in any programming methodologies likestructural, object-oriented, or functional, being welcome fordevelopers of many programming backgrounds. Also, the gooduse of Python libraries like pytest framework and Numpy canhelp the user to calculate huge amounts of data in a fewseconds. Python allows for the user multi-platforms integrationwith several tools like PSIM, Matlab, Typhoon-HIL API, se-rial connections, communication protocols, spreadsheets, webapplications, and more.
The next step of this work is to evaluate and document thesame test cases for the Neutral-Point Clamped converter, athree-level converter topology.
REFERENCES
[1] A. Benigni, T. Strasser, G. De Carne, M. Liserre, M. Cupelli, andA. Monti, “Real-Time Simulation-Based Testing of Modern EnergySystems,” IEEE Industrial Electronics Magazine, vol. 14, no. 2, pp.28–39, 2020.
[2] M. D. O. Faruque et al., “Real-Time Simulation Technologies forPower Systems Design, Testing, and Analysis,” IEEE Power and EnergyTechnology Systems Journal, vol. 2, no. 2, pp. 63–73, Jun. 2015.
[3] J. Humble and D. Farley, Continuous delivery : reliable software releasesthrough build, test, and deployment automation, 1st ed., ser. The AddisonWesley Signature Series. Boston, MA: Pearson Education, 2011.
[4] R. Chaipraserth, A. Leelasantitham, and S. Kiattisin, “A test automationframework in POCT system using TDD techniques,” in 2013 13th Inter-national Symposium on Communications and Information Technologies(ISCIT), Sep. 2013, pp. 600–604.
[5] R. Hametner, D. Winkler, T. Ostreicher, S. Biffl, and A. Zoitl, “Theadaptation of test-driven software processes to industrial automationengineering,” in 2010 8th IEEE International Conference on IndustrialInformatics, Jul. 2010, pp. 921–927, iSSN: 2378-363X.
[6] G. Hackenberg and J. Mund, “Cyber-physical manufacturing systemDevelopment: A test-driven design method and exploratory case study,”Technische Universitat Munchen, Institut Fur Informatik, Tech. Rep.TUM-I1664, 2016.
[7] H. Magnago, T. Guterres, F. Carnielutti, J. Massing, R. Vieira, andH. Pinheiro, “A test driven design approach to benchmark currentcontrollers for grid-tied inverters,” in 2019 20th Workshop on Controland Modeling for Power Electronics (COMPEL), 2019, pp. 1–8.
[8] K. Beck, Test-Driven Development By Example, 1st ed. Addison-Wesley Professional, Jul. 2002.
[9] M. Smith, A. Kwan, A. Martin, and J. Miller, “E-TDD – Embedded TestDriven Development a Tool for Hardware-Software Co-design Projects,”in Extreme Programming and Agile Processes in Software Engineering,vol. 3556. Berlin, Heidelberg: Springer Berlin Heidelberg, 2005, pp.145–153.
[10] L. Williams, E. Maximilien, and M. Vouk, “Test-driven developmentas a defect-reduction practice,” in 14th International Symposium onSoftware Reliability Engineering, 2003. ISSRE 2003., Nov. 2003, pp.34–45, iSSN: 1071-9458.
[11] H. Erdogmus, G. Melnik, and R. Jeffries, “Test-Driven Development,”in Encyclopedia of Software Engineering, P. A. Laplante, Ed. CRCPress, Nov. 2010.
[12] G. Meszaros, xUnit Test Patterns: Refactoring Test Code, 1st ed., ser.The Addison-Wesley Signature Series. Addison-Wesley Professional,May 2007.
[13] S. van der Walt, S. C. Colbert, and G. Varoquaux, “The numpy array:A structure for efficient numerical computation,” Computing in ScienceEngineering, vol. 13, no. 2, pp. 22–30, 2011.
[14] W. W. Royce, “Managing the Development of Large Software Systems,”in Proceedings IEEE WESCON, Aug. 1970, pp. 1–9.
[15] K. Heussen, C. Steinbrink, I. F. Abdulhadi, V. H. Nguyen, M. Z.Degefa, J. Merino, T. V. Jensen, H. Guo, O. Gehrke, D. E. M. Bondy,D. Babazadeh, F. Prostl Andren, and T. I. Strasser, “ERIGrid HolisticTest Description for Validating Cyber-Physical Energy Systems,” Ener-gies, vol. 12, no. 14, p. 2722, Jul. 2019.
[16] “Ieee recommended practice and requirements for harmonic control inelectric power systems,” IEEE Std 519-2014 (Revision of IEEE Std 519-1992), pp. 1–29, 2014.
[17] D. G. Holmes and T. A. Lipo, Pulse Width Modulation for PowerConverters: Principles and Practice. Wiley-IEEE Press, Oct. 2003.
[18] M. Huang, F. Blaabjerg, Y. Yang, and W. Wu, “Step by step designof a high order power filter for three-phase three-wire grid-connectedinverter in renewable energy system,” in 2013 4th IEEE InternationalSymposium on Power Electronics for Distributed Generation Systems(PEDG), Jul. 2013, pp. 1–8.
[19] “Ieee standard for interconnection and interoperability of distributedenergy resources with associated electric power systems interfaces,”IEEE Std 1547-2018 (Revision of IEEE Std 1547-2003), pp. 1–138,2018.
[20] J. Pou, D. Osorno, J. Zaragoza, C. Jaen, and S. Ceballos, “Power lossescalculation methodology to evaluate inverter efficiency in electricalvehicles,” in 2011 7th International Conference-Workshop Compatibilityand Power Electronics (CPE), 2011, pp. 404–409.