Embed Size (px)
Citation preview

Steven J. BereshEngineering Sciences CenterSandia National Laboratories
Albuquerque, NM
Sandia is a multiprogram laboratory operated by Sandia Corporation, a Lockheed Martin Company,for the United States Department of Energy’s National Nuclear Security Administration
under contract DE-AC04-94AL85000.
Test Before Flight:Wind Tunnel Technology for Aerodynamic Testing

Aerosciences at Sandia
Sandia’s missions support national security• Primary mission is stewardship of the
nuclear stockpile• Other missions are derived from our
nuclear mission, including non-proliferation, surveillance, etc.
• We collaborate with DoD, NASA, and industry on other programs in the national interest
Many of these missions are centered upon flight hardware• Flight vehicles for nuclear weapons• Precision weapons• Missile defense• Future prompt response systems
o Rocketso Re-entry vehicles

The Role of the Wind Tunnels
Ground Test
Flight Test
Modeling &Simulation
We support Sandia’s aero needs by:• Aerodynamic characterization of vehicles• Testing of flight components• Investigating fundamental aerospace physics• Providing data to develop and validate
computational models

Experimental Aerosciences Facility
Trisonic Wind Tunnel (TWT)• Mach 0.5 – 3• Gravity bombs, missiles,
commercial aerospaceHypersonic Wind Tunnel (HWT)• Mach 5, 8, 14• Re-entry vehicles, rockets
High-Altitude Chamber (HAC)• Satellite components
Trisonic Wind Tunnel Hypersonic Wind Tunnel
High-Altitude Chamber

Trisonic Wind Tunnel (TWT)
Blowdown Wind Tunnel• Runs for 30-50 seconds at a time
• Turnaround of about 20-30 minutes
• Supplied by high-pressure air
• Exhausts to atmosphere
• 12" square test section
Flow Control• A series of valves control the
pressure and the flow rate
• Downstream of the valves are screens and honeycomb to “smooth” the flow
• The test section is where we do business
screenshoneycomb
screens flow

Trisonic Wind Tunnel (TWT)
Supersonic experiments are conducted in contoured nozzles • Nozzle contour determines Mach
o Switch out walls to change Mach• Mach 1.5, 2.0, 2.5, and 3.0
Transonic experiments are conducted in a porous-wall test section• Any Mach number from 0.5 to 1.3• Porous walls are needed to:
o Prevent the reflection of shock waves back onto the model
o Alleviate choking effects near Mach 1
• The typical wind tunnel test hangs a scale model of a flight vehicle off a sting
• Can pitch through a range of angles of attack during one run

The TWT is surrounded by additional systems needed for various experiments• Secondary gas supply for
simulating rocket motors• Lasers and optics for
advanced diagnostics• The control console
Trisonic Wind Tunnel (TWT)
The test section is enclosedin a pressurized plenum• Contains the flow through
the porous walls• Makes optical access for
measurements more difficult
Hypersonic Wind Tunnel (HWT)
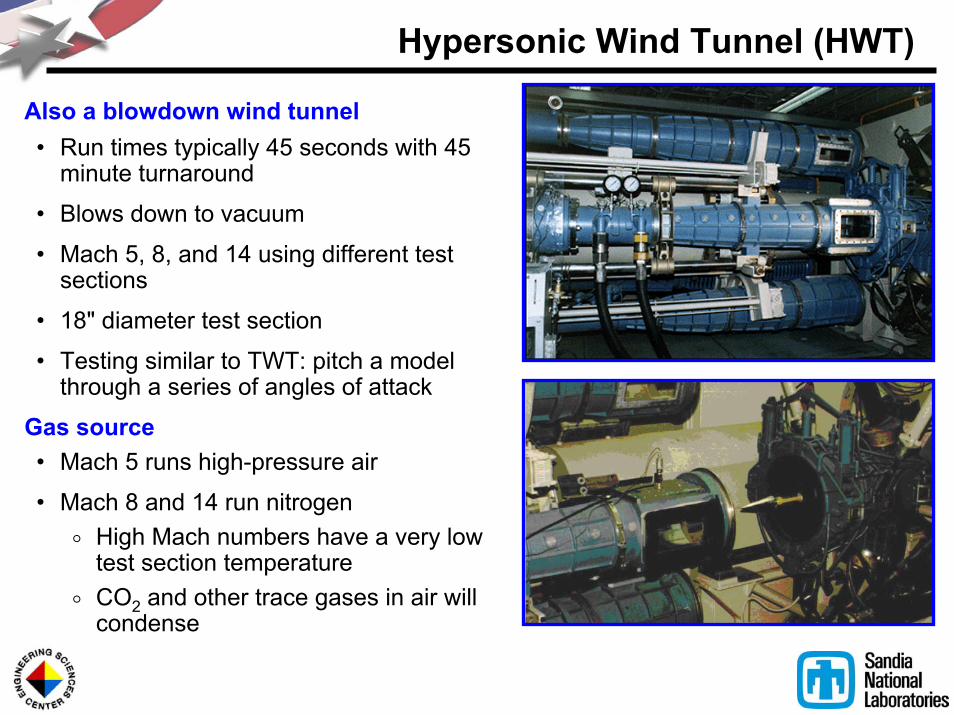
Also a blowdown wind tunnel• Run times typically 45 seconds with 45
minute turnaround
• Blows down to vacuum
• Mach 5, 8, and 14 using different test sections
• 18" diameter test section
• Testing similar to TWT: pitch a model through a series of angles of attack
Gas source• Mach 5 runs high-pressure air
• Mach 8 and 14 run nitrogeno High Mach numbers have a very low
test section temperatureo CO2 and other trace gases in air will
condense

Hypersonic Wind Tunnel (HWT)
Hypersonics presents many morechallenges than lower speeds
The wind tunnel gas must be heated• Prevent condensation of nitrogen• Use electric resistance heaters
unique to each Mach numbero Maximum of 3 megawatt
• Wind tunnel throat is jacketed by a high-pressure water line for cooling
High Mach numbers require a much larger pressure ratio to operate• Nitrogen pressures to 8600 psi• Blowdown to vacuum
Despite high pressure and temperature,the HWT cannot simulate the real gas effects associated with re-entry
Mach 14 heater
Mach 5 heater

Wind Tunnel Models
Take an actualflight vehicle…
…which has features such as:• Instrumentation• Geometry changes• Spin testing
Some other models tested at Sandia:
By necessity, a small model does notexactly replicate the full-scale version
Part of a wind tunnel engineer’s jobis to understand such scaling issues
…and build ascale model of it…

Aerodynamic Measurements
α (deg)
CN
-5 0 5 10 15-0.2
0
0.2
0.4
0.6
α (deg)
Cm
-5 0 5 10 15-2.5
-2
-1.5
-1
-0.5
0
0.5
1
• Determine the aerodynamic forces and moments using an internal strain-gage balance placed inside the model
• Balance elements flex as they are loaded, producing a measurable signal
• Vary parameters such as tunnel Mach number, model angle-of-attack, model geometry, etc
Flow Visualization
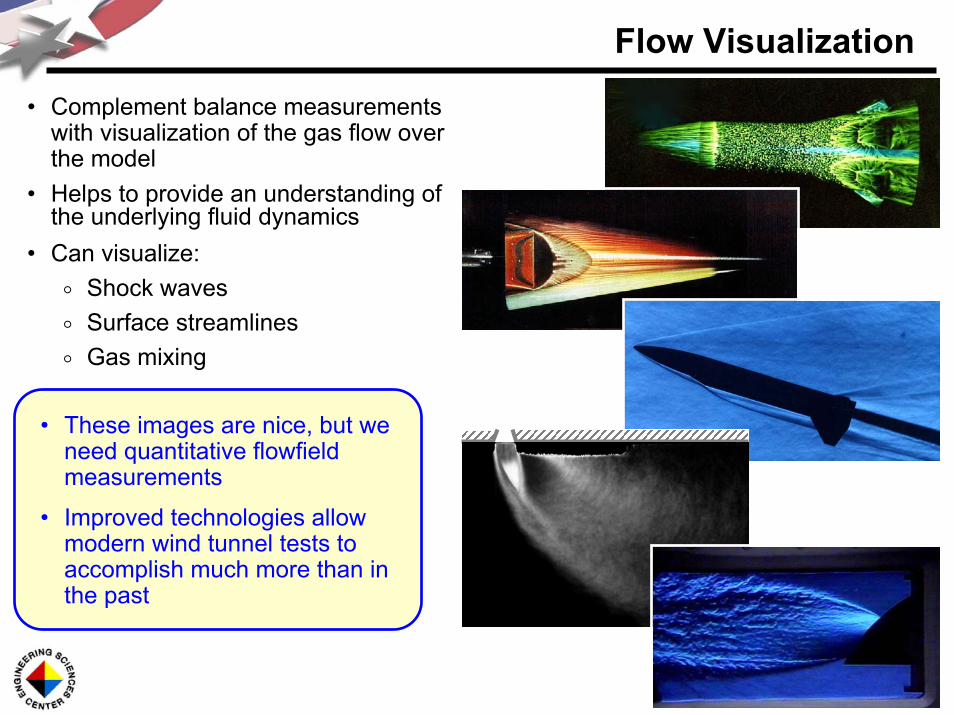
• These images are nice, but weneed quantitative flowfieldmeasurements
• Improved technologies allow modern wind tunnel tests to accomplish much more than in the past
• Complement balance measurementswith visualization of the gas flow over the model
• Helps to provide an understanding of the underlying fluid dynamics
• Can visualize:o Shock waveso Surface streamlineso Gas mixing

Advanced Measurements
Why do we need laser diagnostics?• Some wind tunnel tests need only
provide aerodynamic forces…• …but others must yield a better
understanding of the underlying flowfield
• Development and validation of CFD requires high-fidelity measurements
• We can’t let CFD have a monopoly on pretty vugrafs
Sandia’s wind tunnels are ideal for advanced measurements and research programs.• Relatively inexpensive to operate• Smaller scale is conducive to
optical requirements
z/dj
y/d j
-5 0 50
5
10
15
u/U∞1
0.96
0.92
0.88
0.84
0.8
0.1U∞

Advanced Measurements
Why do we need laser diagnostics?• Some wind tunnel tests need only
provide aerodynamic forces…• …but others must yield a better
understanding of the underlying flowfield
• Development and validation of CFD requires high-fidelity measurements
• We can’t let CFD have a monopoly on pretty vugrafs
Sandia’s wind tunnels are ideal for advanced measurements and research programs.• Relatively inexpensive to operate• Smaller scale is conducive to
optical requirements
Particle Image Velocimetry (PIV)• A plane of 3-D velocity vectors• Most effective at M∞<3
Doppler Global Velocimetry (DGV)• A plane of velocity measurements• Well-suited to hypersonics
Pressure and Temperature Sensitive Paint (PSP and TSP)• Measure model surface pressures
or temperatures• Can cover the entire model body,
including thin control surfaces
Oil-Film Interferometry (OFI)• Measures wall shear stress over a
model surface• Transition detection
z/dj
y/d j
-5 0 50
5
10
15
u/U∞1
0.96
0.92
0.88
0.84
0.8
0.1U∞

Jet-in-Crossflow StudiesFlight vehicles with both fins and thruster rockets experience aninteraction between them.Our objectives are to:• Directly detect the vortices
responsible for the interaction• Acquire data for developing and
validating computational models
Examine a case study in which advanced diagnostics were used to resolve a flight vehicle concern• In this case, Particle Image
Velocimetry (PIV)
9.53 mm
15°
30°
M=3.73

What is Particle Image Velocimetry (PIV)?
• Seed a large quantity of small particles into the wind tunnel
GridPoint
t=t0 t=t0+Δt
cross-correlation
v=Δx/Δt
• Grid the images into smaller windows• In each grid window, track a pattern of
particles as they move from the first exposure to the second
• Illuminate with a double-pulsed laser sheet and image with a specialized digital camera
• Compute a field of velocity vectors

Stereoscopic PIV
• Two cameras are used for a stereoscopic view, then the images are digitally reassembled for a three-dimensional perspective
- Much like human vision• It’s a lot harder than 2D, but much
more flexible
This is what we needto see the vortices andmeasure their properties

Laser Sheet Configuration• View the interaction at a single downstream
location where a fin would be located.
• Laser sheet aligned to the crossplane of the interaction to directly measure the induced vortices.

z/dj
y/d j
-5 0 50
5
10
15
0.84 0.88 0.92 0.96 1u/U∞
0.3U∞
Crossplane Mean Velocity Fields
• In-plane velocities shown by vectors
• Out-of-plane velocities (streamwise component) shown by contour plot
• The counter-rotating vortex pair and the surface horseshoe vortex that are induced by the interaction are clearly visible
o These vortices are responsible for jet/fin interaction
ui/U∞
y/d j
-0.05 0 0.05 0.1 0.150
5
10
15U∞-uvw
U∞-uvw
Data Analysis
z/dj
y/d j
-5 0 50
5
10
15
u/U∞10.980.960.940.920.90.880.860.84
0.2U∞
z/dj
y/d j
-5 0 50
5
10
15
u/U∞10.980.960.940.920.90.880.860.84
0.1U∞
z/dj
y/d j
-5 0 50
5
10
15
u/U∞10.980.960.940.920.90.880.860.84
0.2U∞
z/dj
y/d j
-5 0 50
5
10
15
u/U∞10.980.960.940.920.90.880.860.84
0.3U∞
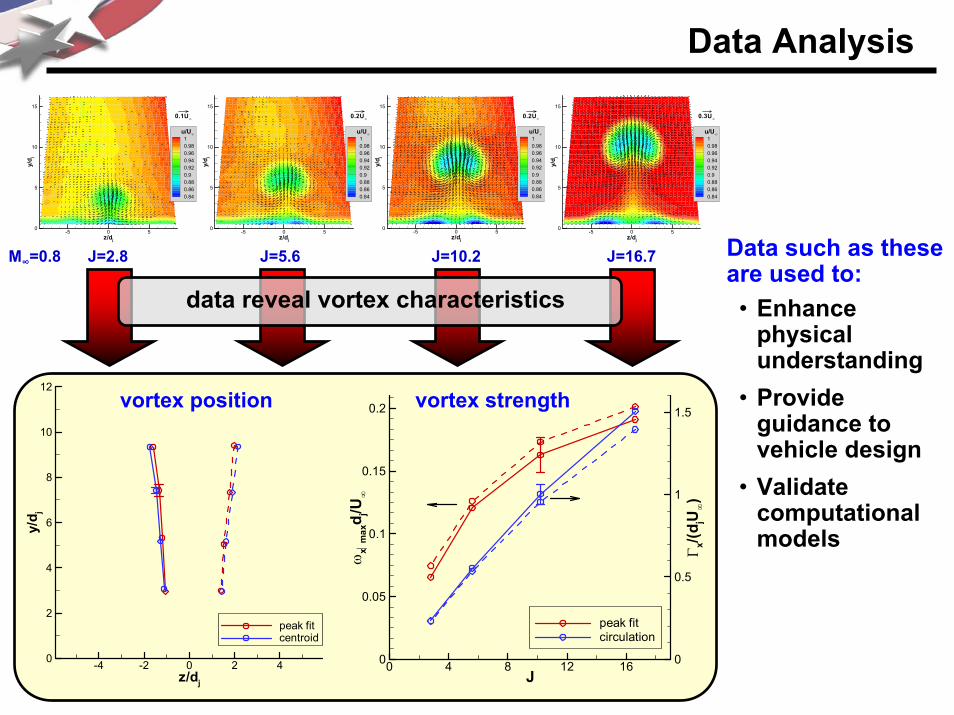
J=16.7J=5.6J=2.8 J=10.2
data reveal vortex characteristics
J
ωx⏐
max
d j/U∞
Γ x/(d
jU∞)
0 4 8 12 160
0.05
0.1
0.15
0.2
0
0.5
1
1.5
peak fitcirculation
z/dj
y/d j
-4 -2 0 2 40
2
4
6
8
10
12
peak fitcentroid
vortex strengthvortex position
Data such as these are used to:• Enhance
physical understanding
• Provide guidance to vehicle design
• Validate computational models
M∞=0.8

Full-Scale Wind Tunnel Test
stretch x-axisfor clarity
• Test conducted in the NASA Ames 11-Foot Transonic Wind Tunnel
• Transfer PIV to a large-scale facility• The resulting data set is limited in
comparison to the TWT, but important to connecting the study to the flight vehicle
streamwise velocitycomponent is shown

Fin Wake Interactions
• Vehicles with two sets of fins experience an interaction that dramatically alters aerodynamic control.
• We have neither the knowledge base nor the modeling capability to accurately predict these effects.
We can apply similar technologies to solving other problems….
A fin balance is behindone test section wall…
The balancemeasures theaerodynamicsof the interaction...
…and a second fin ismounted upstream.
α2 (deg)
CN
F,2
-5 0 5 10-0.6
-0.4
-0.2
0
0.2
0.4
0.6
0.8single finα1=-5°α1=0°α1=5°α1=10°
…and PIV measures the fin tip vortex responsible forthe altered aerodynamics.

Hypersonics Research
Sandia has numerous hypersonic responsibilities:• Ballistic re-entry vehicle dynamics• Component performance due to
aerothermodynamic environment• Thermal protection systems
Current experimental hypersonic studies:• Aerodynamic force and moment testing• Unsteady pressure loading on RV’s• Control surfaces and maneuvering RV’s• Assessment of techniques for low-
temperature ablation studies in the HWT
We also apply these technologies to hypersonics programs supporting Sandia re-entry vehicles.

Advanced Measurements for RV PhysicsWe are developing advanced laser diagnostics for hypersonic testing and code validation.• At an earlier state of development for
the HWT as compared to the TWT.• Requires techniques applicable to the
harsh environment of hypersonic flow.Laser Rayleigh Scattering• Flow visualization of shock waves,
boundary layers, and wakesDoppler Global Velocimetry (DGV)• Particle-based methods (PIV, LDV)
are unsuitable for hypersonicsPressure and Temperature Sensitive Paints (PSP & TSP)• Measure loading and heating over
re-entry bodies, including control surfaces.
400 m/s
0 m/s
X
Y
Z1500140013001200110010009008007006005004003002001000
qconv (W/cm2) We aim to provide an experimental analogue to computations such as this.
Transitioning DGV from a benchtop jet to the HWT.
Imaging of shock unsteadinessdue to an interaction with aboundary layer.

Summary
Sandia’s wind tunnels:• Cover the flight regime pertinent to DOE’s
defense responsibilities• Provide aerodynamic characterization of
flight vehicles
• Apply advanced diagnostics for measuring the underlying fluid dynamics
• Interact with facilities at NASA, DoD, and internationally to advance technologies
Hypersonic Wind TunnelTrisonic Wind Tunnel
z/dj
y/d j
-5 0 50
5
10
15
u/U∞1
0.96
0.92
0.88
0.84
0.8
0.1U∞