Embed Size (px)
Citation preview

................................NASA Techmcal Memoranaum 4251
2
...................................:Test and Evaluati9n_,,,,_ .......
...................................o f-the--Gen-er a__dG a te
_...........................Logic System Simu_!..a.tor ............. _
_L_:J _: _ -_ .... __: " _ _ L- - ================================== ........ _ i'T : : ::::::::::::::::::::::::::::::::::::::::: :Z::_: : I:::=::T ....
L.......................... : .__L.._:_::................................... ---LZ .............. Ji : _ :1............................................... t_ ..................... _
| ....... .::: :__.=:_=!:-= _',_L,,=._ ..... _£:,::_,::_--.: _:=:-4-, --- ............ _' "_--:.:_.,- -::5::i_=,!_-_:;£:_
i
4
Unc1_s
HI 031 I_
i

°
-- ---M ._
_-L '_"7__............ _

NASA Technical Memorandum 4251
Test and Evaluation
of the Generalized Gate
Logic System Simulator
Paul S. Miner
Langley Research Center
Hampton, Virginia
National Aeronautics andSpace Administration
Office of Management
Scientific and TechnicalInformation Division
1991


Contents
Symbols .................................... v
Introducticn .................................. 1
Focus of This Study ............................. 1Historical Background ............................ 1Description of Simulator ........................... 1Description of Microprocessor Design ...................... 2
Comparison Between Simulation and Hardware .................. 2
Unfaulted Te_,ting cf Simulator ......................... 2Self-Test Fault Simulation ........................... 3
Description of self-test ........................... 3Results and analysis ............................ 3
Comparison With Pre_'ous Experiments ..................... 4
Compariscn Monitoring Coverage ....................... 4
Description ................................ 4Results .................................. 5Discussion ................................. 6
Coincident ErIcr Measmement ......................... 6
DL,cussicn of 10rior results .......................... 6Results and analysis ............................ 7
CcncIuding Remarks .............................. 8
Appendix--Application Programs ........................ 9
Code for the LINCON Program . . . ..................... 9Code for the MATMUL Program ............ -. .......... 12
Referenc(s .................................. 14
k_ L lul[nll0NAttt
11"1"°
PRECEDING PAGE BLANK NOT FILMED


Symbols
D1
Dl-.8
Do
D_
Do/D_
Do/F
no/ Fc_
D_/F
nr./
F
MATMULURunl
MATMULU(U_41 Runj)
MATMULNRunl
MATMULN(N}41Runj)
N1
N1/Do
N,/F
N1/F
NE/Dz
gr./F
/
faults detected after the first program iteration of LINCON
(including those in local memory)
faults detected in any of the first eight program iterations of
LINCON (local random access memory (RAM) only)
faults visible at an output after the first program iteration of
LINCON
faults detectable anywhere in RAM
proportion of detectable faults visible at an output after the
first program iteration
proportion of faults detectable at an output port after the
first program iteration
proportion of distinguishable faults detectable at an output
port after the first program iteration
simulated faults detectable anywhere in RAM
distinguishable faults detectable anywhere in
proportion of
proportion ofRAM
total number of simulated faults (same for each run), 1741
number of simulated faults corrected for known indistinguish-
able faults, 1558
faults detected by MATMUL or by LINCON run 1
faults detected by MATMUL or by any of the 14 LINCON
runs
faults detected by MATMUL and by LINCON run number 1
faults detected by MATMUL and by all 14 LINCON runs
number of faults that failed to produce an answer in the first
program iteration of LINCON
proportion of faults detected in the first iteration that failed
to produce an answer
proportion of faults that failed to produce an answer in the
first program iteration
proportion of distinguishable faults that failed to produce an
answer in the first program iteration
number of faults that failed to produce an answer for all
program iterations
proportion to detectable faults that failed to produce ananswer for all program iterations
proportion of faults that failed to produce an answer for all
program iterations
proportion of distinguishable faults that failed to produce ananswer for all program iterations
V
PRECEDING PAGE BLANK NOT FILMED

14[J_=l Runj
14('lj=l Runj
coincident error as defined in Swern et al. (ref. 6); given thattwo faults (one latent) exist in distinct redundant channels ofa fault-tolerant digital system, $ is the probability that theyproduce identical errors
faults detected in any of the 14 LINCON runs
faults detected in all 14 LINCON runs
v|

Introduction
Focus of This Study
This paper discusses the results of the initial test-
ing of the Generalized Gate Logic System Simulator
(GGLOSS). The simulator is a special-purpose fault
simulator designed to assist in the analysis of the ef-fects of random hardware failures on fault-tolerant
digital computer systems. The testing of the simu-
lator covers two main areas. First, the simulationresults are compared with data obtained by moni-
toring the behavior of hardware. The circuit used
for these comparisons is an incomplete microproces-
sor design based upon the MIL-STD-1750A Instruc-
tion Set Architecture. In the second area of testing,
current simulation results are compared with experi-
mental data obtained using precursors of the current
tool. In each case, a portion of the earlier experi-ment is confirmed. The new results are then viewed
from a different perspective in order to evaluate the
usefulness of this simulation strategy.
The structure of the report is as follows. The
remainder of this introductory section gives a brief
historical perspective of the simulator, a descriptionof the salient features of the GGLOSS simulation
strategy, and a description of the microprocessordesign. The following section describes the results of
comparing the simulation results with data obtained
from the laboratory prototype. The final section
consists of a comparison of current data with the
results from two earlier fault simulation experiments.
The first of these is an attempt to estimate the fault
coverage of a comparison monitoring fault-tolerant
system. The second study attempted to estimate
the percentage of coexisting faults that can defeat
a comparison monitoring system. In each case, aportion of the earlier study is recreated, and then a
different interpretation of the results is given.
Historical Background
There have been a series of studies sponsored by
Langley Research Center that have explored the dy-namics of gate-level fault behavior in fault-tolerant
digital computer systems. In a 1978 study address-
ing the use of a compaxator/voter as a means for de-tecting faults, Nagel (ref. 1) reported that, for the
six sample programs, only _50 percent of the in-
jected faults produced observable errors after eight
program iterations. If the comparator/voter were
the only means of fault detection, this would allow
multiple faults to accumulate in redundant channels,
creating the potential for defeating redundancy man-
agement logic. McGough and Swern (refs. 2 and 3)
then performed a series of gate-level simulations of
a Bendix BDX-930 "avionic mini processor" in or-
der to corroborate Nagel's results by using a realistic
digital avionic system. That study measured similar
detection probabilities for the six algorithms used by
Nagel. In addition, a three-axis flight control com-
putation was simulated. Once again, a significantnumber of the simulated faults failed to produce anobservable error. The BDX-930 simulation was also
used to demonstrate a methodology for designing and
validating built-in self-test routines. In 1982, Mc-
Gough performed a feasibility study to identify thesalient features of the BDX-930 Gate Logic Software
Simulator (BGLOSS) and to determine if a gener-alized simulator could be developed (ref. 4). The
feasibility study concluded that a generalized ver-
sion could be written, and a prototype generalized
simulator was developed. This simulator was called
the Interim Generalized GLOSS (IGGLOSS) (ref. 5).
Due to limitations in the original IGGLOSS, Lang-
ley opted to develop a production grade version of
the simulator (GGLOSS). Concurrently, Swern et al.
(ref. 6) used an extended version of IGGLOSS (called
S-GGLOSS) to simulate a simple 300-gate processor
in order to estimate the probability of coincident er-
ror in a redundant computing system. The ultimateintent of these studies was to provide some means to
estimate fault coverage for the reliability analysis of
fault-tolerant digital computer systems.
Description of Simulator
GGLOSS was designed specifically to be a high-
speed fault simulator. As such, it lacks features
such as circuit timing analysis and multivalued logic,
which are common in commercially available design
verification simulators. It depends upon the assump-tion that the simulated circuit is a verified design.
Fhrthermore, since it was designed to be able to
simulate processing elements executing application
programs, a key development issue was simulation
speed. To achieve this, GGLOSS is limited to 2-
value logic, which allows the parallel simulation of32 copies of the circuit on a VAX host. GGLOSS
maintains 1 unfaulted copy of the circuit for easy
comparison, while allowing the user to inject faultsin any of the other 31 copies. The user has the op-
tion of injecting single or multiple faults in each of
the 31 faultable copies of the circuit. Injected faults
may be permanent or intermittent. GGLOSS uses
bit masking to inject stuck-at-l, stuck-at-0, and in-
vert faults at any input or output node of any gate
in the circuit. A user can monitor the propagation of
a fault at any point in the circuit because any loca-tion within the simulated circuit can be designated
as a test point. GGLOSS compiles the circuit froma netiist description into an internal representation
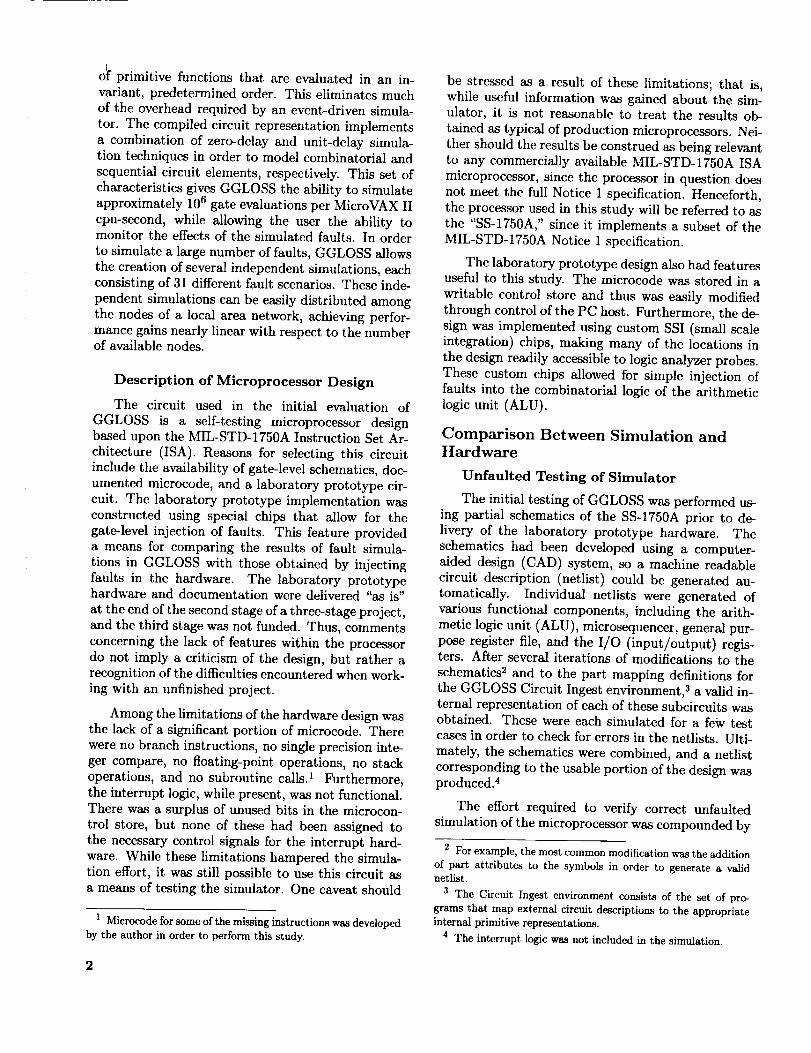
o_primitivefunctionsthat areevaluatedin an in-variant,predeterminedorder.Thiseliminatesmuchof the overhead required by an event-driven simula-
tor. The compiled circuit representation implements
a combination of zero-delay and unit-delay simula-
tion techniques in order to model combinatorial and
sequential circuit elements, respectively. This set of
characteristics gives GGLOSS the ability to simulate
approximately 106 gate evaluations per MicroVAX II
cpu-second, while allowing the user the ability tomonitor the effects of the simulated faults. In order
to simulate a large number of faults, GGLOSS allows
the creation of several independent simulations, eachconsisting of 31 different fault scenarios. These inde-
pendent simulations can be easily distributed among
the nodes of a local area network, achieving perfor-mance gains nearly linear with respect to the numberof available nodes.
Description of Microprocessor Design
The circuit used in the initial evaluation of
GGLOSS is a self-testing microprocessor design
based upon the MIL-STD-1750A Instruction Set Ar-
chitecture (ISA). Reasons for selecting this circuitinclude the availability of gate-level schematics, doc-
umented microcode, and a laboratory prototype cir-
cuit. The laboratory prototype implementation was
constructed using special chips that allow for the
gate-level injection of faults. This feature provided
a means for comparing the results of fault simula-
tions in GGLOSS with those obtained by injecting
faults in the hardware. The laboratory prototypehardware and documentation were delivered "as is"
at the end of the second stage of a three-stage project,
and the third stage was not funded. Thus, comments
concerning the lack of features within the processor
do not imply a criticism of the design, but rather a
recognition of the difficulties encountered when work-
ing with an unfinished project.
Among the limitations of the hardware design wasthe lack of a significant portion of microcode. There
were no branch instructions, no single precision inte-
ger compare, no floating-point operations, no stack
operations, and no subroutine calls3 Furthermore,
the interrupt logic, while present, was not functional.
There was a surplus of unused bits in the microcon-
trol store, but none of these had been assigned to
the necessary control signals for the interrupt hard-
ware. While these limitations hampered the simula-tion effort, it was still possible to use this circuit as
a means of testing the simulator. One caveat should
1 Microcode for some of the missing instructions was developed
by the author in order to perform this study.
be stressed as a result of these limitations; that is,while useful information was gained about the sim-ulator, it is not reasonable to treat the results ob-
tained as typical of production microprocessors. Nei-
ther should the results be construed as being relevantto any commercially available MIL-STD-1750A ISA
microprocessor, since the processor in question does
not meet the full Notice 1 specification. Henceforth,the processor used in this study will be referred to as
the "SS-1750A," since it implements a subset of the
MIL-STD-1750A Notice 1 specification.
The laboratory prototype design also had features
useful to this study. The microcode was stored in a
writable control store and thus was easily modified
through control of the PC host. Furthermore, the de-
sign was implemented using custom SSI (small scaleintegration) chips, making many of the locations in
the design readily accessible to logic analyzer probes.
These custom chips allowed for simple injection of
faults into the combinatorial logic of the arithmetic
logic unit (ALU).
Comparison Between Simulation and
Hardware
Unfaulted Testing of Simulator
The initial testing of GGLOSS was performed us-
ing partial schematics of the SS-1750A prior to de-
livery of the laboratory prototype hardware. The
schematics had been developed using a computer-
aided design (CAD) system, so a machine readable
circuit description (netlist) could be generated au-
tomatically. Individual netlists were generated of
various functional components, including the arith-metic logic unit (ALU), microsequencer, general pur-
pose register file, and the I/O (input/output) regis-ters. After several iterations of modifications to the
schematics _ and to the part mapping definitions for
the GGLOSS Circuit Ingest environment, 3 a valid in-ternal representation of each of these subcircuits wasobtained. These were each simulated for a few test
cases in order to check for errors in the netlists. Ulti-
mately, the schematics were combined, and a netlist
corresponding to the usable portion of the design wasproduced .4
The effort required to verify correct unfaulted
simulation of the microprocessor was compounded by
2 For example, the most common modification was the additionof part attributes to the symbols in order to generate a validnetlist.
3 The Circuit Ingest environment consists of the set of pro-grams that map external circuit descriptions to the appropriateinternal primitive representations.
4 The interrupt logic was not included in the simulation.
2

thefactthat thedocumentationof theprocessorwasincomplete,therewereerrorsin the schematic,andthe simulatorwasstill beingdeveloped.Thus,anydiscrepancybetweenexecutionof the simulatorandthe prototypehardwarecouldbecausedby aner-ror in anyof theseareas.Severaldifferenceswerefoundbetweenthebehaviorof the initial simulationattemptandthebehaviorofthehardware.A fewdis-crepanciesweretracedto flawsin theimplementationof thesimulator.Theseflawswereimmediatelycor-rectedby theGGLOSSdevelopmentteam.Manyofthediscrepancieswerecausedbymisinterpretationoftheprocessordocumentation,whilesomewereduetoincorrector incompletedocumentation.Eventuallya workingsimulationof the processor was obtained.
Self-Test Fault Simulation
Description of self-test. In the initial phase of
the GGLOSS evaluation, the self-test mechanism of
the SS-1750A processor was exercised. The self-test
hardware for the data path of the processor consists
of a linear feedback shift register (LFSR) for generat-
ing pseudorandom test patterns, and a multiple input
signature register (MISR) for compressing the resul-tant signature. 5 The data path test is controlled by
the microcode. Two different algorithms are used for
testing registers, with the results of each test shifted
into the MISR. The data path test also checks the
ALU logic by using the LFSR to generate input pat-
terns. For each test pattern, several ALU functions
are exercised, and all intermediate results are shiftedinto the MISR.
On the SS-1750A there are two modes for exe-cution of the self-test microcode. The first mode is
used to generate a "good-machine" signature, which
is required to evaluate the results of subsequent tests.
In this mode, the microcode loop that generates thepseudorandom test patterns and exercises the ALU
logic is repeated for exactly 1024 patterns. After the
loop terminates, the contents of the MISR are stored
into the good-machine signature register. This is the
only situation in which it is possible to write into
this register, at any other time it can only be read.
Thus the first mode consists of generating the good-machine signature necessary for comparison during
subsequent self-test execution.
The second mode consists of testing for the pres-
ence-of faults. In this mode, the test loop is repeated
until the contents of the MISR are equal to the pre-
viously generated good-machine signature. In otherwords, the loop is now nonterminating if the circuit
5 See P. K. Lala's text for discussion of how to implement aLFSR/MISR combination (ref. 7, p. 229-30).
fails the test. However, it is possible for a fault to
alter the execution of the test such that a valid signa-
ture is generated in a different number of iterations
than required to produce a "good" signature. In this
case, the fault is actively causing erroneous behav-
ior, but is undetected by the test. The fact that a
failed test is nonterminating is unfortunate because
the only way to recognize that a component has failed
is if it does not claim to be good within a fixed timeinterval.
Results and analysis. Once a few discrepan-
cies caused by errors in the processor documentation
were resolved, the good-machine signature generated
by the GGLOSS simulation was identical to the sig-
nature generated by the SS-1750A hardware. It was
then possible to make comparisons of the faulted be-
havior. The laboratory prototype processor allows
for the injection of 1312 distinct stuck-at faults inthe gates of the arithmetic logic unit. The faults can
be inserted only in the combinatorial logic. Table I
shows the class of faults injected for each combina-
torial gate type. All these faults were injected in the
hardware prototype. For each fault, the self-test was
executed for a fixed number of clock cycles, and theresults contained in the MISR at the end of that in-
terval were saved. Additionally, the contents of the
MISR were compared with the previously generated
good-machine signature in order to measure coverageof the test.
Table I. Fault Set--Self-Test
Gate Input pins Output pins
And Stuck-at- 1 Stuck-at-0
Or Stuck-at-0 Stuck-at- 1
Nand Stuck-at-1 Stuck-at-1Nor Stuck-at-0 Stuck-at-0
In the GGLOSS simulation, it was not necessary
to initialize the good-machine signature register, as
the unfaulted scenario s would always generate the
appropriate signature value in time for the intended
comparison. By not initializing the good-machinesignature, the termination condition for the self-test
loop in the GGLOSS simulation was different from
that on the hardware, but only in the case wherethe fault caused a good-machine signature at an
inappropriate time. Remember that the structure
of the self-test is such that it is possible for a fault to
6 Remember that in GGLOSS there is always one fault-freecopy of the circuit maintained.
3

gelnerate a valid signature, which causes early exit
from the test. Setting up the simulation in this
manner not only allowed for reduced simulation time,but raised the possibility of identifying faults that
defeat the self-test algorithm.
Of the 1312 stuck-at faults, 1300 were detected by
this test, both in the hardware prototype and in the
GGLOSS simulation. However, when the signatures
generated on the prototype hardware were comparedwith those generated by the GGLOSS simulation,
9 of the 1300 detected faults had signatures thatdisagreed. Either there was an error in the simulation
or these nine faults actually defeated the test. On
the hardware, the presence of these faults had been
observed by the PC host that was monitoring the
test, but they had not actually been detected by the
self-test. Subsequent executions on the laboratoryprototype demonstrated that these 9 faults exited
the self-test with a good-machine status prior to the
1024th pass through the test loop. Even thoughthe SS-1750A documentation recorded these nine
faults as being detected by the self-test, the results
of this study indicate that they were undetected
by the test and returned control to the processor. T
Thus, the GGLOSS simulation revealed a previously
undocumented error in the design of the self-test.
Comparison With Previous Experiments
Comparison Monitoring Coverage
Description. A suitable reference point for de-
termining the applicability of GGLOSS is an inves-
tigation of the results of the BGLOSS simulation of
the BDX-930 (refs. 2 and 3). It will be shown that re-sults generated from the simulation of the SS-1750A
correspond closely to those produced in the BDX-930study. However, the results will also be viewed from
a different perspective. Both the Nagel study and
the BDX-930 studies demonstrate that comparisonmonitoring systems s fail to detect all possible faults
(refs. 1, 2, and 3). Similar results can be shown usingthe SS-1750A.
There may exist faults that will remain unde-
tected by a comparison monitor and then subse-
quently exhibit malicious behavior. 9 Experiments
7 With the addition of a counter these faults could also be
detected, asone could ignore anygood'machine signals until afterexecution for a fixed number of clock cycles.
8 A comparison monitoring system is one that uses tests forequivalence between redundant systems in order to detect a faultychannel.
9 For example, consider a fault that can only exhibit erroneousbehavior when the system attempts to reconfignre. The effects of
to date have not provided a better understandingof these potentially malicious latent faults. All that
has been determined is that the majority of stuck-at faults do not exhibit malicious behavior. In other
words, these studies have provided a better under-standing of the behavior of nonlatent or short-term
latent faults. None of the studies were able to deter-
mine if any of the undetected faults (possibly long-term latents) could exhibit malicious behavior.
There were two simple 1750A programs used in
this part of the study. The code is given in the ap-
pendix. The first implements the LINCON 1° (refs. 2and 3) algorithm from the BGLOSS simulations of
the BDX-930. The second is a matrix multiplication(MATMUL) routine that squares a 2 × 2 matrix of
floating-point data. Eight program iterations of LIN-
CON require approximately 20000 clock cycles tocomplete on the SS-1750A processor. MATMUL re-
quires approximately 10 000 clock cycles to complete
(worst-case estimate). Assuming a 10 MHz clock rate
for the processor, these programs require 2 ms and
1 ms of real time, respectively, to complete. There
were 14 sets of input data generated randomly forthe LINCON program. Each input set was selectedin accordance with the criteria used in the BDX-930
study. Only one set of data was required for the com-
parison monitoring experiment. The multiple sets ofdata were required for the section on coincident error.
The MATMUL program was executed using a singleset of floating-point data consisting of all nonzero en-
tries. Both positive and negative values were used in
order to fully exercise the floating-point operations.
Using these two programs, many of the capabilitiesof GGLOSS were exercised.
The set of faults (F) for the SS-1750A simula-
tion were selected from the microsequencer and the
ALU. Faults were injected in the combinatorial logic
only and were selected according to the criteria pre-
sented in table I. A total of 1741 faults was se!ected,including the 1312 used in the evaluation of the self-test. These faults were simulated for each of the 14
LINCON executions, as well as for the execution ofMATMUL.
such a fault cannot appear until a system is attempting to recoverfrom a second fault. Such a fault could prevent the system fromreconflgnring, even if sufficient hardware was available.
10 A simple program performing arithmetic operations on inte-
ger data which is similar in structure to control programs. Thisprogram was chosen because, of all the programs simple enoughto implement on the SS-1750A, the observed fault behavior forthis program was closest to that of the flight control computationsimulated in the BDX-930 study.

Results. Table II presents initial detection re-sults from the SS-1750A simulation for each of the 14
distinct LINCON runs. For this table, Di representsthe number of faults detected in the ith iteration that
were not detected in any previous iteration. The de-
tectability criteria for this table include only those
errors observable at the single output of the program
or at the memory location for internal feedback data.Errors observable elsewhere were not counted. Col-
umn D1--.8 represents those faults detected in any of
the eight program iterations. As was shown in theprevious studies, the majority of faults detected were
detected in the first iteration. Also, while a majorityof faults were detected, a significant percentage re-
mained undetected after eight iterations of the pro-
gram. These results are similar to those presented for
the BDX-930 simulation of the LINCON algorithm.
In that study (refs. 2 and 3), the LINCON program
was executed for eight iterations using a single set
of randomly generated input data. Of 807 injected
gate-level 11 faults, 547 were detected for a coverageestimate of 0.678. Of the 547 detected faults, 529
caused an error in the first iteration of the program
with the remaining faults detected in the 2nd through8th iterations.
Table II. Detection by Iteration--LINCON
LINCON DI-s D1 D2 /])3 D4 /95 /96 Dz Ds
Run1 1331 1227 54 16 15 9 8 2 0
Run2 1302 1130 76 37 17 10 16 16 0
Run 3 1319 1072 134 30 21 39 3 8 12
Run4 1321 1178 71 21 18 23 8 1 i
Run5 1311 1211 53 28 9 4 0 6 0
Run 6 1284 1176 47 28 15 10 8 0 0
Run7 1292 1151 83 20 17 17 1 3 0
Run s 1320 1090 143 28 20 25 12 2 0Run9 1306 1184 49 35 6 12 10 6 4
Runl0 1328 1198 57 41 15 12 3 2 0
Runll 1310 1074 138 52 9 8 15 8 6
Run12 1325 1168 71 12 22 15 17 19 1
Runl3 1289 1191 36 30 11 3 16 2 0
Run14 1328 1250 36 24 17 0 0 0 1
Departing from the earlier results, table III gives
various coverage factors for the 14 executions of the
LINCON program. The criteria used for detection in
this table are slightly different from those used in ta-
ble II; Dr_ represents the set of faults that corrupted
11 Although the BDX-930 study included PROM bit faults, they
are excluded from this summary, since this study did not consider
memory faults.
any location of memory (e.g., the entire contents of
RAM were compared) and Do represents only thoseerrors that would be visible at an output port after
the first iteration of the program. Except for runs 6and 7, the set of faults detectable anywhere were de-
tectable in the memory local to the process. Only in
LINCON runs 6 and 7 did a fault corrupt memory
outside the local memory space of the program. Thefinal two rows in table III give results that explore de-
tection across multiple runs. Of the 1342 faults that
were detected by at least one run (LJl41 Runj), 1306had at least one externally visible detection in the
first iteration. Similarly 1267 faults were detectable
in every run (N_41Runj).
Table III. Coverage Factors--LINCON
LINCON I DE Do DE/F D_/Fo Do/F Do/Fa Do/D E
Run 1 1331 1227 0.765 0.854 0.705 0.788 0.922
Run 2 1302 1074 .748 .836 .617 .689 .823
Run 3 1319 1029 .758 .847 .591 .660 .780
Run 4 '1321 1103 .759 .848 .634 .708 .835
Run 5 1311 1182 .753 .841 .679 .759 .902
Run 6 1290 1097 .741 .828 .630 .704 .850
Run 7 1298 1110 .746 .833 .638 .712 .855
Run s 1320 1056 .758 .847 .607 .678 .800
Run 9 1306 1184 .750 .838 .680 .760 .907
RUnl0 1328 1183 .763 .852 .679 .759 .891
RUnll 1310 1062 .752 .841 .610 .682 .811
Runl2 1325 1155 .761 .850 .663 .741 .872
Runl3 1289 1160 .743 .830 .666 .745 .900
Run14 1328 1249 .763 .852 .717 .802 .941
U 4=IRu. 134213o60.771 0.861 0.750 0.838 0.973
''.7=O141Runj 1267 914 .728 .813 .525 .587 .721
As in the BDX-930 study, an attempt was made
to remove the set of indistinguishable 12 faults from
consideration in the coverage factors; Fa consists ofthe 1558 faults that were not identified as indistin-
guishable. Of the 1741 simulated faults F, 204 never
produced observable erroneous behavior (determinedby combining results from the self-test and the LIN-
CON and MATMUL simulations). Thus, 1537 of the
faults in F are clearly detectable and therefore in Fa.
The remaining 204 faults were analyzed to determine
why they were not detected. Faults were identified
as undetectable based upon analysis of the circuit
12 "A fault that has no affect [sic] on the computational process
is indistinguishable .... a distinguishable fault has the property
that there exists a software program the output of which differs
from that of the same program executed by an identical but non-
faulted processor." (ref. 2, p. 16).
5

an'_lmicrocode.Sincethe circuit beingsimulatedwasstill in thedesignphase,therewasa significantproportionof unusedlogicpresentfor anticipatedchangesin thedesign.Furthermore,giventhenatureof themicrocode,therewerea numberof faultsthatcouldneverbedetectedwith the currentmicrocodebut wouldpossiblybe detectableusinga differentimplementation.Additionally,somefaultswereiden-tifiedasbeingin redundantlogic,andhencenotde-tectable.Of the204undetectedfaults,183wereclas-siftedas indistinguishable.The21 remainingfaultswerenotprovento bedetectable,but therewasinsuf-ficientevidenceto classifythemasneverdetectable,thereforetheywerealsoincludedin Fa.
Table IV gives the coverage factors for the MAT-
MUL program and also combines the results with
those of LINCON in order to get a better feel for
coverage during a typical voting frame. Individu-
ally, each program detected _75 percent of the in-
jected faults; however, the two programs combineddetected over 80 percent of the injected faults. Fur-
thermore, 1193 of 1741 faults produced errors in ev-
ery execution.
Table IV. Coverage Factors--MATMUL
Dn DE/ F D_I FaMATMUL 1336 0.767 0.858
14
MATMULU(Uj= 1Runj) 1439 .827 ,924MATMULURunl 1429 .821 .917
14
MATMULN(Nj= 1Run j) 1193 .685 .766MATMULNRunl 1238 .711 .795
Discussion. Recognizing that these two pro-
grams do not fully exercise the hardware, and that
their execution time in real terms is approximately
2 ins, if the experiment were expanded to incorporate
a complete voting frame including operating system
overhead, it is likely that the detection probabilitieswould increase further. However, the amount of com-
putation time required for this small sample was pro-
hibitive. Each of the 14 runs of the LINCON program
required _100 hours of MicroVAX II cpu time. The
MATMUL simulation (for fault set F) required _25cpu hours on a MicroVAX 3200. Fortunately, it was
possible to distribute the computation requirements
across a 16-node network in a batch environment,
thus allowing for near linear speedup of the computa-
tion time required. Submitting the simulation tasks
in low-priority batch mode also allowed potential for
completing much of the simulation during periods oflow resource utilization.
6
Another limiting factor is that the simulated pro-
cessor is small by today's standards. The SS-1750A
used in this study consisted of approximately 3500
gates. Current generation microprocessors consist of
hundreds of thousands of gates. Thus it is impracti-
cal to use this simulation strategy to estimate com-
parison monitoring coverage parameters.
Coincident Error Measurement
The results of the LINCON simulation were an-
alyzed again, this time in an attempt to corrobo-rate results from the S-GGLOSS experiment measur-
ing coincident error. The LINCON program is more
complicated than the simple program used in the S-
GGLOSS study, but it does have a similar structure.
The program used for the S-GGLOSS study was a
simple loop consisting of 10 instructions. There were
no branch instructions within the body of the loop,
thus every instruction in the program was executed
in each iteration. The LINCON program, while still
a simple example, exhibits more characteristics ofa typical program. Within its main loop are con-
ditional branches and internal loops. The section
of code executed in any given iteration is more de-
pendent upon the data than was the case in the S-
GGLOSS study. However, as can be seen by referringback to table III, typically 85 percent of the faults
detected by this program were detected in the first
iteration (Do/DE). Thus, irrespective of the data,the majority of faults detectable by a given program
will produce erroneous behavior in the first iteration.
Discussion of prior results. S-GGLOSS was
used to simulate a 300-gate "mini-microcomputer"configured in a simple triplex fault-tolerant architec-
ture (ref. 6). The simulated system was configured as
a simple flight controller. The inputs are assumed tobe uncorrelated variations in flight path due to mild
turbulence. Each identical channel outputs its com-
puted values to an assumed perfect voter/monitorthat in turn drives a control surface actuator. The
voter/monitor has the capability of detecting and
isolating all single-channel errors while masking thefailure with the voter. The monitor can also detect
three different channel values and transfer control to
a backup unit. Thus the only way the monitor canbe defeated is when it receives two identical incorrect
channel values. Given that two faults (one latent) ex-ist in distinct redundant channels of a fault-tolerant
digital system, _ is the probability that they produceidentical errors. The S-GGLOSS method for deter-
mining coincident error _ is described in Swern et al.
(ref. 6).
This factor _ was combined with an average
latency measure to determine the contribution of

coincidentlatentfaultsto systemunreliability.Thisaveragelatencymeasurewasestimatedto be4.2it-erations,whereaniterationcorrespondedto asinglepassthroughthe simulatedprogram.An iterationof a typical flight controlprogramwasassumedtolast100ms,foranaveragelatencyof420ms.Usingthesevalues,the estimatedcontributionto proba-bility of systemfailurewas_10-11 for a 1-hrflight(ref. 6, p. 1004).However,consideringthat a sin-gleiterationconsistedof 10 instructions,with eachinstructionrequiring5 clockcyclesto complete,aniterationin theS-GGLOSSstudyrepresents50clockcycles.If weassumea clockrateof 1MHz,thetimerequiredfor a singleiterationis 50ps. Thus, while
the average latency time was measured to be 4.2 it-
erations in the S-GGLOSS study, the extrapolationto an iteration duration of 100 ms is unrealistic, as
this assumes that a 50 #s task is the only application
in a 100 ms voting frame. In more realistic settings,
several applications run consecutively in each votingframe. Therefore, the average latency time for a fault
will be much reduced. The only valid conclusion con-
cerning latency would be that for multiple consecu-
tive executions of this 50 #s task, the average latency
time would be 4.2 x 50 ps = 210 _s. Thus, these
results tell us nothing about the behavior of longerterm latent faults. One common thread among all of
these studies is that for a sufficiently complex pro-
gram, a significant majority of the faults observed to
be excitable by that program are detectable followingthe first execution of the program.
Results and analysis. The S-GGLOSS studyestimated that coincident error _ occurred in 7 per-
cent of the cases. The data generated by the simula-
tions of the LINCON program were analyzed in orderto make a similar measurement. In order to be as
consistent as possible with the previous study, onlythe results of the first iteration were considered in
measuring _. The sets of detected faults correspond
to Do from table III. Of the 1306 faults ever detected
in the first iteration of the program (column Do, row
(.j141 Runj), 392 were sometimes latent. Computingin the same fashion as done in the S-GGLOSS study,
was measured to be 11 percent. This result is con-
sistent with the 7 percent reported in the S-GGLOSS
study.
However, upon analysis of the errors produced, it
was observed that one error pattern was significantly
more frequent than any other. Analysis of the SS-1750A architecture revealed that the dominant error
pattern corresponds to the inability of the processor
to produce an answer (i.e., the fault causes the
processor to lose control).
The interesting point is that a nonanswer does
not require a comparison monitor for detection. It
can be detected simply by determining if the output
register has been written. For example, when the
comparison monitoring system gets data, it clears a
bit in an output-status register. When a processing
element produces new data to place in the output
register, it resets this bit. In the next voting frame,
if the comparison monitor executive sees that this bithas not been reset, it knows the data in the registerare invalid.
Although it was not practical to alter the sim-ulation of the SS-1750A in this fashion, the effect
on _ can be measured by excluding the nonanswers
from the analysis. Table V shows the proportion of
nonanswers N1 produced during the first iteration
of the LINCON program. In each of the 14 runs, at
least one of the latent faults produced a nonanswer inthe first iteration of a different run. Thus, included
in the computation for _ were several instances of
faults that produced errors coincident with _70 per-cent of the faults detected in the first iteration. If
these faults are excluded from consideration, the es-
timate for _ becomes 1.1 percent.
Table V. Proportion of Nonanswers--LINCON(First Iteration)
LINCON Do N1
Run1 1227 811
Run2 1074 783
Run3 1029 785
Run4 1103 807
Run5 1182 790
Run6 1097 794
Run7 1110 781Runs 1056 772
Run9 1184 787
Run10 1183 786
Run11 1062 794
RUnl2 1155 813
Run13 1160 791
Run14 1249 797
N1/Do N1/F
0.661 O.466
.729 .450
.763 .451
.732 .464
.668 .454
.724 .456
.704 .449
.731 .443
.665 .452
.664 .451
.748 .456
.704 .467
.682 .454
.638 .458
Yl/Fo0.521
.503
.504
.518
.507
.510
.501
.496
.505
.504
.510
.522
.508
.512
Another potential source for error in the estimateof _ is that the measurement only considers a single
word of voted data. In a typical control system,several different functions are computed within a
voting frame, thus more than a single word of datais voted in each frame. If we treat the eight passes
through the LINCON program as a single function
that produces 16 words of data (the primary output
for each pass through the program and an additional
7

8 words of scratch pad space), the vote can be treatedas a block vote of 16 words. The proportion of
nonanswers in this scenario is given in table VI.
None of the faults that produced a nonanswer were
considered latent by the above definition, so no steps
were required to account for them in the estimate of$. In this scenario the estimate for _ was measured
to be 0.36 percent. This implies that coincidenterror becomes less of a concern if the vote function
encompasses a large enough set of data and is also
capable of detecting a nonanswer.
Table VI. Proportion of Nonanswers--LINCON
LINCON
Run 1
Run2
Run3
Run4
Run5
Run6Runt
Runs
Run9
Run10
Runll
Run12
Run13
Runl4
D_ NE N_/DE N_/F
1331 779 0.585 0.447
1302 755 .580 .434
1319 767 .582 .441
1321 787 .596 .452
1311 744 .568 .427
1290 762 .593 .438
1298 743 .575 .4271320 756 .573 .434
1306 741 .567 .426
1328 751 .566 .431
1310 766 .585 .440
1325 786 .593 .451
1289 756 .587 .434
1328 773 .582 .444
N_/F.0.500
.485
.492
.505
.478
.489
.477
.485
.476
.482
.492
.504
.485
.496
Concluding Remarks
The initial test of GGLOSS proceeded in two
distinct phases. The first phase compares resultsobtained from GGLOSS simulations with those ob-
served in hardware. In the first few comparisons offault-free behavior there were several observed dis-
crepancies. However, most were caused by misin-
terpretation of the processor documentation. Therewere also some difficulties encountered by inadver-
tently violating some of GGLOSS's underlying as-
sumptions. Similarly, the incomplete microprocessor
design caused additional problems. These were all
resolved and a good fault-free simulation was even-
tuaily obtained.
This made it possible to compare self-test results
while injecting stuck-at faults in the combinatoriallogic of the microprocessor's ALU. It was possible
to exploit GGLOSS's simulation strategy to reveal
a previously undocumented error in the design of
the microcoded self-test routine. Furthermore, com-
parison to results from the hardware fault insertion
demonstrated that GGLOSS correctly models stuck-
at faults in combinatorial Iogic.
While the code implementing the GCLOSS toolwas well written, it is not clear that GGLOSS is capa-
ble of performing one of its desired functions, namely,
that of capturing the behavior of latent faults and
their effects on fault-tolerant computing systems. It
was possible to recreate results of earlier studies that
attempted to capture characteristics of fault behav-
ior in comparison monitoring systems. However, the
limited amount of real time simulated in these exper-
iments restricts the conclusions concerning the be-havior of latent faults. None of the studies to date
have simulated more than a few milliseconds of real
time, thus any observed fault behavior correspondsto either nonlatent faults or faults with very short av-
erage latency periods. Because of the computational
burden required for fault simulation, it is perhaps
questionable that one would want to try to capture
the behavior of latent faults by simulation.
While the results concerning the behavior of la-
tent faults are less than promising, there are other
ways to approach the problem. The most interest-ing result of the BGLOSS BDX-930 study was the
demonstration of a reasonably fast (_1 ms) high-
coverage (97.4 percent) self-test program: 3 This sug-
gests that for analysis of fault-tolerant systems, one
need not depend upon coverage factors based uponan estimate of the effectiveness of comparison mon-
itoring, but rather incorporate an effective periodic
background self-test as part of the system overhead.
This is not to say that comparison monitoring should
not be used. In fact, these studies all indicate that
a majority of faults propagate quickly, and thus we
depend upon the comparison monitoring system to
mask any error. Therein lies the key: Compari-
son monitoring is not a fault detection strategy, but
rather an error detection strategy. It is best used to
prevent propagation of errors. In order to ensurean appropriate level of fault detection, diagnostic
routines are a necessity. Furthermore, microproces-
sor faults may not be the dominant source of latent
faults. It is much more likely that latent faults will be
found in memory systems or possibly in redundancymanagement logic) 4 Therefore, it is probably wiser
to focus efforts on developing efficient on-line diag-nostics to detect faults in critical circuit locations.
NASA Langley Research CenterHampton, VA 23665-5225February 12, 1991
13 Again excluding bit faults in the PROM.
14 A possible scenario is given in footnote 9.

AppendixApplication Programs
Code for the LINCON Program
•NAME LINCON
;VARIABLE DECLARATION
XARRAY: .EQU X'AO
YARRAY: .EQU X'A9
MARRAY: .EQU X'B2
RESULT: .EQU RIO
TEMPX: .EQU RII
TEMPM: .EQU K12
K: .EQU R13
TEMPK: .EQU R14
;END VARIABLE DECLARATION
;INITIALIZE VARIABLES
LIM K,O
LIM TEMPX,O
L TEMPM,MARRAY
;END INITIALIZATION OF VARIABLES
J
;BEGIN MAIN PROGRAM LINCON
MAIN:
LOOP1:
CIM K,8
BEZ END
LR TEMPK,K
AIM TEMPK,1
L TEMPX,XAKKAY,TEMPK
S TEHPX,XARKAY,K
LR RESULT, TEMPX
MSR RESULT, TEMPM
A RESULT, YARRAY, K
;BEGIN IF THEN ELSE STATEMENT
CIM RESULT,O
BGE DO_RIGHT_HALF
BB DO_LEFT_HALF
;FOR K=O TO 7 DO
;ELSE DONE AND GOTO END LABEL
;LOAD RI4 TEMPK WITH LOOP COUNT
;SO THAT K+I CAN BE ADDRESSED
;LOAD X(K+I) INTO TEMPX (K13)
;TEMPX := X(K+I) - X(K)
;EVALUATION OF
;EQUATION
;TEHPX * TEMPM + Y(K) = RESULT
;IF RESULT _ O THEN
;GOTO DO_RIGHT_HALF
;ELSE GOTO DO_LEFT_HALF

RETURN:
;END OF IF THEN ELSE STATEMENT
L TEMPM,MARRAY,TEMPK
MSIM TEMPM, -i
AIM K,I
BR LOOP1
;RETURN POINT FROM SUBROUTINES
END:
BR END ;INFINITE LOOP TO STOP EXECUTION
J
.COMMENT %THIS SUBROUTINE IMPLEMENTS THE RIGHT HALF OF THE LINCON
FLOWCHART AS GIVEN IN THE BENDIX REPORT %
DO_RIGHT_HALF:
LOOP_RIGHT:
LR RO,TEMPM
SIM RO,1
ClM RO, -9
BEZ R_EXlT_I
;LOAD TEMPM INTO REG.O
;RO _ TEMPM -I
;IF TEMPM -I = -9 THEN
;GOTO LABEL R_EXlT_I
;ELSE BEGIN
SR RESULT, TEMPX ;RESULT = RESULT - TEMPX
CIM RESULT,O
BGE RI_ELSE
L RO,YARRAY,K
ClM RO,O
BGE R EXlT_2
BR R_EXlT_I
;IF RESULT < 0 THEN BEGIN
;ELSE GOTO LABEL RI_ELSE
;BEGIN IF
;GET YARRAY(K) MOVE INT0 RO
;IF YARRAY(K) > 0THEN
;GOT0 LABEL R_EXIT_2
;ELSE GOT0 LABEL R_EXIT_I
RI_ELSE:
SIM
BR
R_EXlT_I:
AR
R_EXIT_IA:
ST
ST
BR
R_EXIT_2:
ST
SIM
ST
BR
TEMPM,1
LOOP_RIGHT
RESULT, TEMPX
RESULT, YARRAY, TEMPK
TEMPM, MARRAY, TEMP K
RETURN
RESULT, YARRAY, TEMPK
TEMPM, I
TEMPM,MARRAY,TEMPK
RETURN
lO

D0_LEFT_HALF:
LOOPLEFT:
LR
AIM
ClM
BEZ
AR
CIM
BLT
L
ClM
BLT
BR
LI_ELSE:
AIM
BR
L_EXIT_I:
SR
L_EXlT_IA:
ST
ST
BR
L_EXIT_2:
ST
AIM
ST
BR
R0,TEMPM
RO,I
RO,9
L_EKIT_IA
RESULT, TEMPX
RESULT, 0
LI_ELSE
R0,YARP_Y,K
RO,O
L_EXlT_2
L_EXlT_I
TEMPM, 1
LOOP_LEFT
RESULT,TEMPX
RESULT,YARRAY,TEMPK
TEMPM,MARRAY,TEMPK
RETURN
RESULT,YARRAY,TEMPK
TEMPM,I
TEMPM,MARRAY,TEMPK
RETURN
;IF TEMPM +i = 9 THEN
;GOTO L_EXIT_I
;ELSE BEGIN
;IF RESULT < 0 THEN
;GOT0 LI_ELSE
;ELSE BEGIN
J
•END
ll

Code for the MATNIUL Program
•COMMENT %
1750-A NIL
MATRIX SQUARED (WAS MULTIPLY). ASSUMES THE ARRAY BEING
PROCESSED IS 2 X 2
NOTE MATMUL USES
KO
R1
K2
R3
H4
K5
K6,7 -
R8,9
RIO
Rll
RI2
R13
THE FOLLOWING REGISTERS
POINTER TO ARRAY A
ROW INCREMENT FOR A
COUNTER FOR OUTER LOOP(M)
COLUMN INDEX FOR ARRAY B
COUNTER FOR INNER LOOP(P)
OFFSET INTO ARRAY A
REGISTERS CONTAINING SUM DURING INNER
PRODUCT CALCULATION
RESULT OF MULTIPLICATION DURING
INNER PRODUCT CALCULATION
INCRF_T FOR ARRAY B OFFSET
OFFSET INTO ARRAY B
OFFSET INT0 ARRAY C
COUNTER FOR SUROUTINE L00P(N)
AUTHOR:
CREATED :
MODIFIED BY:
DATE:
WILLIAM F. INGOGLY
7 SEPTEMBER 1985
KAREN T. LOONEY
27 AUGUST 1987
THEN SUBSEQUENTLY MANGLED FOR THIS STUDY
BY PAUL MINER --- LAST CHANGE: 24 JULY 1989%
•NAME MATRIX_SQUARED
MATMUL:
LIM R15,X' OOAO'
LIM RO, 0
LIM R1,2
MIM RI, 2
LR R1 ,R2
LIM R2,0
LIM R10,2
MIM RIO, 2
LR RIO,RII
LIM RI2,0
;LOAD POINTER TO ARRAY
;INCREMENT FOR ROW
12

LOOPI:
LOOP2:
INPROD:
LOOP:
•end
LIM
LIM
SJS
AIM
AIM
CIM
BNZ
AR
AIM
CIM
BNZ
BR
PSHM
LR
LIM
LIM
LIM
LR
DL
FM
FAR
AIM
AR
AIM
CIM
BNZ
DST
AIM
POPM
URS
R3,0
R4,0
RI5, INPROD
R3,2
R4,1
R4,2
LOOP2
RO,RI
R2, I
R2,2
LOOPI
HERE ;END MATMUL
R2,R2
R5,RO
R13,0
R6,0
RT,O
R11,R3
R8,X'OO43',IL5
R8,X'OO4B',RII
R6,R8
R5,2
RII,RIO
R13,1
R13,2
LOOP
R6,X'OO53',R12
R12,2
R2,R2
RI5
13

References
2.
3.
Nagel, Phyllis M.: Modeling of a Latent Fault Detector in
a Digital System. NASA CR-145371, 1978.
McGough, John G.; and Swern, Fred L.: Measurement of
Fault Latency in a Digital Avionic Mini Processor. NASA
CR-3462, 1981.
McGough, John G.; and Swern, Fred L.: Measurement of
Fault Latency in a Digital Avionic Mini Processor Part
II. NASA CR-3651, 1983.
4. McGough, John G.: Feasibility Study for a Generalized
Gate Logic Software Simulator. NASA CR-172159, 1983.
5. McGough, J. G.; and Nemeroff , S.: The Development of
an Interim Generalized Gate Logic Software Simulator.
NASA CR-177939, 1985.
6. Swern, Frederc L.; Bavuso, Salvatore J.; Martensen, Anna
L.; and Miner, Paul S.: The Effects of Latent Faults
on Highly Reliable Computer Systems. IEEE Trans.
Comput., vol. C-36, no. 8, Aug. 1987, pp. 1000-1005.
7. Lala, Parag K.: Fault Tolerant and Fault Testable Hard-
ware Design. Prentice-Hall, Inc., c.1985.
14


Nalional Aeronaulics and
Space Administration
]. Report No.
NASA TM-4251
4. Title and Subtitle
Report Documentation Page
2. Government Accession No.
3. Recipient's Catalog No.
5. Report Date
Test and Evaluation of the Generalized Gate Logic SystemSimulator
7. Author(s)
Paul S. Miner
9. Performing Organization Name and Address 10.
NASA Langley Research Center
Hampton, VA 23665-5225 11.
12. Sponsoring Agency Name and Address 13.
National Aeronautics and Space Administration
Washington, DC 20546-0001 ]4.
i5. Supplementary Notes
April 1991
6. Performing Organization Code
8. Performing Organization Report No.
L-16822
Work Unit No.
505-66-21-02
Contract or Grant No.
Type of Report and Period Covered
Technical Memorandum
Sponsoring Agency Code
16. Abstract
This paper discusses the results of the initial testing of the Generalized Gate Logic SystemSimulator (GGLOSS). The simulator is a special-purpose fault simulator designed to assist in the
analysis of the effects of random hardware failures on fault-tolerant digital computer systems. The
testing of the simulator covers two main areas. First, the simulation results are compared with data
obtained by monitoring the behavior of hardware. The circuit used for these comparisons is anincomplete microprocessor design based upon the MIL-STD-1750A Instruction Set Architecture.
In the second area of testing, current simulation results are compared with experimental data
obtained using precursors of the current tool. In each case, a portion of the earlier experiment isconfirmed. The new results are then viewed from a different perspective in order to evaluate the
usefulness of this simulation strategy.
17. Key Words (Suggested by Author(s))Fault simulation
Fault tolerance
Self-test
Comparison monitor
Coverage
18. Distribution Statement
Unclassified--Unlimited
Subject Category 66
19. Security Classif. (of this report)Unclassified ] 20. Security Classif. (of this page)Unclassified 121 N°' °f Pages t22" Price19 A03
NASA FORM 1626 OCT 86 NASA-T_ngley, 1991
For sale by the National Technical Information Service, Springfield, Virginia 22161-2171