Embed Size (px)
Citation preview
The Dissertation Committee for Jody Lynn Ernst certifies
that this is the approved version of the following dissertation:
Genetic and Environmental Influences of Maternal Psychosocial and Antisocial
Tendencies on the Development, Stability, and Continuity of Problem Behaviors in
Adoptees from the Texas Adoption Project: A Life Course Investigation of Risk,
Resilience, and Vulnerability
Committee: _____________________________ Joseph M. Horn, Supervisor _____________________________ Jennifer L. Matjasko, Co-Supervisor _____________________________ John C. Loehlin _____________________________ Caryn L. Carlson _____________________________ George W. Holden


Genetic and Environmental Influences of Maternal Psychosocial and Antisocial
Tendencies on the Development, Stability, and Continuity of Problem Behaviors in
Adoptees from the Texas Adoption Project: A Life Course Investigation of Risk,
Resilience, and Vulnerability
by
Jody Lynn Ernst, B. A.
Dissertation
Presented to the Faculty of the Graduate School of
The University of Texas at Austin
in Partial Fulfillment of the Requirements
for the Degree of
Doctor of Philosophy
The University of Texas at Austin
December, 2000

UMI Number: 3285896
32858962007
UMI MicroformCopyright
All rights reserved. This microform edition is protected against unauthorized copying under Title 17, United States Code.
ProQuest Information and Learning Company 300 North Zeeb Road
P.O. Box 1346 Ann Arbor, MI 48106-1346
by ProQuest Information and Learning Company.

iii
Acknowledgements
I would like to thank the following: Joseph M. Horn, for believing I could; John Loehlin,
for his statistical expertise and assistance throughout this project and for coming to my
aid at the drop of a dime; Jen Matjasko, for all her knowledge, skills, and collaboration. I
have learned so much from each of you. I would also like to thank Elliot Davis and
Jessica Cundiff for their tireless effort and commitment to getting the job done, and
getting it done well. This project would not have been possible without you two. Finally,
I would like to thank my husband, Will, and my two sons for putting up with my “bad
behavior” throughout the dissertation process.

iv
Genetic and Environmental Influences of Maternal Psychosocial and Antisocial
Tendencies on the Development, Stability, and Continuity of Problem Behaviors in
Adoptees from the Texas Adoption Project: A Life Course Investigation of Risk,
Resilience, and Vulnerability
Publication No. _________
Jody Lynn Ernst, Ph.D.
The University of Texas at Austin, 2006
Supervisor: Joseph M. Horn
Co-Supervisor: Jennifer L. Matjasko
Utilizing a 30 year longitudinal investigation of 300 adoptive families, the influence of
both general and specific maternal psychological functioning on the development,
stability, and continuity of problem behaviors was investigated. In the first part of the
investigation, biological and adoptive mothers’ scores on eight subscales from the
Minnesota Multiphasic Personality Inventory were investigated to discover whether
general psychosocial functioning, defined as the number of elevated subscales scores, or
specific subscales were related to problem behavior development during childhood,
adolescence, and adulthood. Based on earlier findings from the Texas Adoption Project
(Loehlin, Willerman, & Horn, 1982, 1987), it was predicted that birth mothers’ general
psychosocial functioning would predict problem behavior development in their adopted
away offspring during adolescence and adulthood, but that the adoptive mothers’ general
functioning would predict behavior problems during childhood. I also predicted that the
birth mothers’ specific subscales, namely the psychopathic deviate scale, would be the
strongest predictor of adoptee behavior problems across the entire life span. These

v
hypotheses were generally supported. In the second part of the investigation, the stability
and continuity of problem behaviors were assessed to explore whether mean and intra-
individual trends in behavior, from childhood through middle-adulthood, differ as a
function of gender, adoptive status, and relative risk status. Genetic and shared
environmental influences on problem behavior development and continuity were also
investigated using correlations between biologically related and non-related sibling pairs.
Trends in both mean behavioral stability and intra-individual continuity were found to
differ between groups and genetic effects were found for the development of, but not
continuity in, problem behaviors. Finally, individual and family environmental
characteristics were investigated as potential risk or protective factors for two groups of
adoptees that varied in the amount of genetic risk they faced for problem behavior
development. Findings from the investigation highlight the necessity for using genetically
informative, longitudinal samples to investigate the influence of maternal psychological
functioning on the development of problem behavior. The importance of conducting
analyses of the influences of genetics and environmental factors separately for males and
females, as well as for Higher-Risk individuals, is also addressed.

vi
Table of Contents
Index of Tables and Figures vii Chapter One: General Introduction 1 Chapter Two: Assessing the Environmental and Genetic Influence of Maternal Psychosocial Functioning on Problem Behavior Development from Childhood to Middle Adulthood 14 Methods 19 Results 31 Discussion 35 Tables and Figures 44 Appendices 59 Chapter Three: Stability and Change in Patterns of Problem Behavior Development as a Function of Gender, Adoptive Status, and Risk Status 70 Methods 75 Results 78 Discussion 84 Tables and Figures 94 Chapter Four: An Exploration of Individual and Family Characteristics as Potential Risk/Protective Factors for Problem Behavior Development among Higher-Risk and Lower-Risk Samples of Adoptees 102 Methods 106 Results 115 Discussion 120 Tables and Figures 130 Appendices 141 Chapter Five: General Discussion 148 References 157 Vita 175

vii
Index of Tables and Figures Table 2.1. T-tests for mean differences between adoptees from the Texas 44 Adoption Project with and without available IQ Scores from their Biological Mothers. Table 2.2. Descriptive statistics for the childhood IPB items and total scores. 45 Table 2.3. Items that make up the childhood and adolescent personality scales, as 46 rated by the adoptive mothers during Time 1 and Time 2. Table 2.4. Correlations between Time 3 childhood IPB items, and Time 1 47 mother rated personality scales. Table 2.5. Descriptive statistics for the adolescent IPB items and total scores. 48 Table 2.6. Correlations between Time 3 adolescent IPB items and Time 2 49 mother rated personality scales. Table 2.7. Descriptive statistics for the adulthood IPB items and total score. 50 Table 2.8. Average MMPI sub-scale T-scores for the biological and adoptive 51 mothers from the TAP. Table 2.9. Predicting childhood percent scores on the IPB from biological 52 and adoptive mothers’ psychosocial profile scores and the interaction between them. Table 2.10. Model predicting adolescent percent score on the IPB from biological 53 and adoptive mothers’ psychosocial profile scores and the interaction between them. Table 2.11. Model predicting adulthood percent score on the IPB from biological 54 and adoptive mothers’ psychosocial profile scores and the interaction between them. Table 2.12. Model predicting problem behaviors across the life span from 55 biological mothers’ MMPI sub-scale T-scores. Table 2.13. Model predicting problem behaviors across the life span from 56 adoptive mothers’ MMPI sub-scale T-scores. Table 2.14. Pearson product moment correlations between adoptees problem behavior 57 development and indicators of psychopathic deviance in their mothers. Table 2.15. Correlations between male adoptees’ problem behaviors and their 57 biological and adoptive mothers’ Pd T-scores. Table 2.16. Correlations between female adoptees’ problem behavior their 57 biological and adoptive mothers’ Pd T-scores.

viii
Table 2.17. T-tests for mean differences between TAP participants whose adoptive 58 parents did and did not participate in the Time 3 interview. Table 3.1. Mean differences in the Time 3 participating families with 94 and without biological children. Figure 3.1. Mean IPB percent scores for males and females from Childhood, 95 through Adulthood. Figure 3.2. Mean IPB percent scores as a function of gender and adoptive 96 status from childhood through adulthood. Figure 3.3. Mean IPB percent scores as a function of risk status for the 97 adopted sample, from childhood through adulthood. Figure 3.4. Mean IPB percent scores as a function of gender and risk status 98 among the adopted sample, from childhood through adulthood. Table 3.2. Continuity of problem behaviors over time for the whole sample 99 and the adopted and biological sub-samples of the TAP. Table 3.3. Continuity of problem behaviors over time for the whole sample 99 and male and female sub-samples of the TAP. Table 3.4. Continuity of problem behaviors over time, differences between 100 sub-groups classified by gender and adoption status. Table 3.5. Continuity of problem behaviors over time for the adopted sample 100 and the Higher-Risk and Lower-Risk sub-samples from the TAP. Table 3.6. Continuity of problem behaviors over time, differences between sub-groups 101 classified by sex and risk status. Table 3.7. Intraclass correlations estimating the similarity on problem behavior 101 scores between genetically related and unrelated siblings. Table 3.8. Intraclass correlations estimating the similarity on the stability of problem 101 behaviors throughout the life course between genetically related and unrelated siblings.
Figure 4.1. Illustration of groups being compared in Chapter Four analyses. 130 Table 4.1. Frequency distribution of individuals in the four groups, classified according 130 to risk status and behavioral category during childhood, adolescence, and adulthood. Table 4.2. Mean differences in biological mother characteristics, family environment, 131 and individual characteristics by risk status and behavioral category, during childhood.

ix
Table 4.3. Mean differences in biological mother characteristics, family environment, 132 and individual characteristics by risk status and behavioral category, during adolescence. Table 4.4. Mean differences in biological mother characteristics, family environment, 133 and individual characteristics by risk status and behavioral category, during adulthood. Table 4.5. Childhood binary logistic regression model predicting Higher or Lower 134 IPB scores among individuals who were at Higher-Risk. Table 4.6. Childhood binary logistic regression model prediction Higher or Lower 135 IPB scores among individuals who were at Lower-Risk. Table 4.7. Odds ratios for significant effects from models 4.5, 4.6 and 136 4.8-4.11 (Block 4 full models only). Table 4.8. Adolescent binary logistic regression model predicting Higher or Lower 137 IPB scores among individuals who were at Higher-Risk. Table 4.9. Adolescent binary logistic regression model predicting Higher or Lower 138 IPB scores among individuals who were at Lower-Risk. Table 4.10. Adulthood binary logistic regression model prediction Higher or Lower 139 IPB scores among individuals who were at Higher-Risk. Table 4.11. Adulthood binary logistic regression model prediction Higher or Lower 140 IPB scores among individuals who were at Lower-Risk.

1
Chapter 1: General Introduction
Researchers from a number of areas within psychology have attempted to identify
the antecedents of, and factors influencing the development of, problem behaviors during
childhood, adolescence, and (to a limited extent) adulthood. Researchers from within the
fields of Developmental Psychology, Behavior Genetics, and Developmental
Psychopathology have investigated how the behaviors of proximal individuals, such as
parents and siblings, influence behavioral outcomes throughout the different stages of
life. While the goal of the researchers from within each of these areas is the same—to
uncover what factors contribute to or hinder the development of problem behaviors—the
interpretation of the results from different theoretical standpoints may lead to very
different practical implications, each lending to potentially different policy or treatment
recommendations. Accordingly, the first chapter of this dissertation is dedicated to
outlining the differences between the research methods, findings, and interpretations of
results for problem behavior development in these three areas of psychology. This
chapter, therefore, provides both a brief history of the research on problem behavior
development and a rationale for the methods used in the current investigation, followed
by an outline of the remaining chapters.
Socialization Hypothesis
The association between family and other social factors that predict the likelihood
of developing and maintaining problem behaviors is a popular research topic within the
area of Developmental Psychology. Parental mental illness is widely thought to influence
problem behavior development in children and adolescents. This relationship is,
therefore, a very popular one to study. The family climate, or care giving environment,
created by having a mentally ill parent (particularly a mentally ill mother) has been found
to be associated with problem behavior development in toddlers (Carter, Garrity-Rokous,
Chazan-Cohen, Little & Briggs-Gowen, 2001; Field, 1995; Gross, Conrad, Fogg, &

2
Wothke, 1994), children (Henderson, Sayger, & Horne, 2003; Miller, Warner,
Wickramaratne, & Weissman, 1999; Sheppard, 1994), and adolescents (Frye & Garber,
2005; Leve, Kim & Pears, 2005) alike. Maternal depression for example has been
associated with increased tantrums and acting out in toddlers (Field, 1995), increased
aggression in children (Park, Essex, Zahn-Waxler, Armstrong, Klein & Goldsmith,
2005), and increased rates of delinquency in adolescents (Sanders & Ralph, 2005).
Similarly, parental antisocial behaviors, such as hitting, bullying, neglecting, or otherwise
abusing their children have also been linked to like behaviors in their offspring, during
the childhood years (Rhule, McMahon, & Spieker, 2004).
Additional social factors that have been identified as antecedents to childhood and
adolescent behavior problems include indicators of family stress (Compas, Howell,
Phares, Williams, & Giunta, 1989; Matjasko, Grunden, & Ernst, 2006), socioeconomic
disadvantage (Adams, Hillman, & Gaydos, 1994; Achenbach, Stevenson, Richman, &
Graham, 1985; Verhulst, Edelbrock, Baron, & Akkerhuis, 1987), negative peer
affiliations (Patton, 1995; Sussman, Dent, McAdams, Stacy, Burton, & Flay, 1994) and
harsh parental practices (Baumrind, 1993; Maccoby & Martin, 1983). All of these factors
have been found to predict whether adolescents are likely to engage in delinquent and
risky behaviors, such as truancy, unprotected sexual intercourse, smoking, drug and
alcohol use/abuse, and criminal activity. What this line of research cannot tell us,
however, is the directionality of the relationships, what factors mediate them, or whether
the relationships are causal at all.
What most developmental psychologists traditionally had not taken into account
was the possibility that something other than the environment created by having a
mentally ill parent, growing up in a poor family, or hanging around with a bad group was
acting on children and adolescents to create externalizing, antisocial behaviors and
attitudes. Some developmental psychologists balked at the possibility that individuals
might be acting on their environments (Plomin & Bergeman, 1991; Scarr & McCartney,
1983), choosing those “bad” friends, or eliciting harsh punitive responses from their
parents. A few, however, did begin thinking about this possibility earlier. Bell (1968), for

3
example, set forth the notion that children’s behaviors were not only influenced by the
behaviors of their parents, but the children’s actions influenced the behaviors of their
parents toward them as well. These so called child-effects models have become
increasingly popular, finding evidence for the existence of these person-environment
correlations both within the laboratory (e.g., Anderson, Lytton, & Romney, 1986) and
within the home (e.g., Patterson, 1982).
Behavior Genetics
In 1983 Scarr and McCartney pushed the notion of person-environments even
further, purporting that the characteristics of the environment acting upon the children
may be influenced by individuals’ genetically determined propensities. Using methods
from behavior genetics, O’Connor, Deater-Deckard, Fulker, Rutter, and Plomin (1998)
investigated a traditionally developmental phenomenon, the development of antisocial
behavior, using genotype-environment correlations, or correlations between biological
parents and their adopted away children. Genotype-environment correlations, they stated,
allow researchers to investigate how variations in genetic risk and social risk factors
influence the development of antisocial behaviors.
The basic premise behind the theory of behavior genetics is that behaviors, just
like physical characteristics, develop in part as a result of individuals’ genetic make-up.
Contrary to what many believe, behavior geneticists do not attempt to prove that
behaviors are 100 percent genetic. Rather, researchers using the theory and methods of
behavior genetics attempt to uncover what percent of the development of a given
behavior can be accounted for by genetic factors. Some behaviors have been found to be
highly genetic in nature, for example extraversion—the tendency to be highly social and
a bit impulsive—has been found to be about 70% genetic (Canter, 1969; Price 1969;
Shields 1962), but others, such as agreeableness (Loehlin, 1992), have been found to
have much smaller heritabilities. Whatever is not accounted for by genes (or errors of
measurement) must, therefore, be due to environmental factors. What behavior

4
geneticists then try to determine is how much of the differences in the trait between
individuals is due to shared environmental factors (things in the environment shared
between individuals) and how much is a result of non-shared environmental factors
(aspects of the environment not shared between individuals).
Because behavior genetic researchers have attempted to parse the amount of a
trait that developed as a result of genetic factors, shared environmental factors, and non-
shared environmental factors a few special populations of individuals have been
frequently utilized. These populations include monozygotic twins (twins who originated
from a single egg and sperm but randomly split shortly after fertilization and developed
as two distinct, but 100% genetically alike, individuals) who were reared in different
families, monozygotic twins reared in the same home, dizygotic twins (twins that
originated from the fertilization of two eggs and two sperm and who are no more alike,
genetically, than siblings born at different times), and adopted children. Each of these
populations can be very informative to study because of the differences in the degree to
which each of the groups overlap in both their genes and environmental factors.
Ignoring, for the moment, such complications as correlations and interactions
between genes and environments, the variance of a trait can be broken down as follows:
Monozygotic twins reared apart (MZA) share 100 percent of their genetic composition
but zero percent of their environment, when adopted away shortly after birth and when
they are not adopted to similar families—two suppositions that will be discussed shortly.
Genetic effects on the development of behaviors among these populations are assessed
using correlation coefficients. The extent to which MZA twins correlate represents the
estimate of the genetic effect for a given behavior. Given that the expected range of the
correlation coefficients is from 0.0 – 1.0, subtracting the correlation coefficient from one
yields the estimate of the effect for a given behavior that is due the non-shared
environmental factors and errors of measurement.
As noted earlier, for the estimates of the genetic and non-shared environmental
effects to be reliable when MZA are used requires that a couple of assumptions are true.
The first assumption that must hold is that the MZA were adopted away shortly after

5
birth (and that the prenatal environment had no influence on the outcome of interest). If
this assumption was not met, and the twins did share the same rearing environment
during infancy and/or childhood, than the correlation cannot be assumed to be purely due
to the fact that they share 100% of their genes in common—resulting in an
overestimation of genetic effects. The second assumption that must be true is that the
MZA twins were not adopted by biological family members. If MZA twins were adopted
into the homes of genetically related family members than the correlations would also
result in an overestimation of genetic effects—because genetically related individuals
would likely have similar rearing strategies and, therefore, would likely provide some
environmental factors that could be argued to be shared. Similarly, if the twins were
adopted by families with similar characteristics to one another, genetic effects might also
be overestimated. Given that adoptive families are generally a more homogeneous sample
of the population than non-adoptive families, which is discussed more fully later, this
may be a weakness of the use of twins reared apart to estimate genetic effects.
Falconer (1960) put forth another way to estimate genetic and environmental
influences on behavioral characteristics using both monozygotic (MZ) and dizygotic
(DZ) twins. As stated earlier, monozygotic twins share 100 percent of their genes, while
DZ twins are no more alike than non-twin siblings who share an average of 50 percent of
their genes in common. Therefore, Falconer applied the correlations for a particular trait
for both MZ and DZ twins into the equation 2(MZ-DZ), which yielded an estimate of the
amount of the variance in that behavior that was due to the variation of the genes within a
particular population, or heritability. Subtracting the heritability estimate from the MZ
twin correlation yields an estimate of the amount of the variance of a particular trait is
due to shared environmental factors and subtracting the MZ correlation from 1.0 (as with
the MZA comparisons) provides an estimate of the non-shared environmental effects.
Some assumptions must also be met for the estimates of the Falconer’s method to
reliably estimate both genetic and non-shared environmental effects. One is the equal
environments assumption. In order for the estimate of genetic effects to be reliable, the
environments of monozygotic twins should be no more similar than the environments of

6
the dizygotic twins. For example, if it was found that parents treat MZ twins more alike
than DZ twins a priori (i.e. not just as a result of their differences in behavior), this
assumption would be put into question and genetic effects may be overestimated.
Research into the question of whether MZ twins’ environments are more similar has been
undertaken and generally found not to account for the similarity in personality and IQ
between twins (e.g., Loehlin & Nichols, 1976; Scarr & Carter-Saltzman, 1979). Another
assumption is that twin samples generally representative of the general population. Due
to their high rates of premature birth and the environmental effects of sharing a womb,
twins tend to be lower in verbal abilities (Rutter & Redshaw, 1991) although this
difference usually disappears by middle childhood (Wilson, 1983). In general, twins have
not been found to differ from singletons, as far as prevalence rates are concerned, in
either personality or rates of psychopathology (Christensen, Vaupel, Holm, & Yashlin,
1995).
Another genetically informative design is the adoption method. In these samples
children were reared by parents, and share environments with siblings, with whom they
share no naturally varying genes. Again, correlation coefficients have been estimated to
detect the amount of similarity there was between sibling behaviors—correlations here
have served as an estimate of the effect of common environmental factors—while parent-
child correlations served as a measure of the influence of parenting practices and
behaviors on behavioral development in adopted children. The generalizability of studies
from these adopted samples too is limited, because both adopted children and the parents
who adopt them are not randomly sampled from the general population. For example,
adopted children have biological parents who display a greater percentage of defiant
tendencies (Horn, Loehlin, & Willerman, 1982) than the general population, and adoptive
parents tend to be older, more educated, and higher in socioeconomic status than then
general population (Loehlin, Willerman, & Horn, 1981). However, the heritability
estimates found using adoptive samples have often been similar in strength and direction

7
to those found using twin samples1 and the adoption method allows investigators to parse
out the influence of genetic and shared environmental effects in some ways that twin
methods cannot.
Despite the limitations to the research conducted using genetically informative
samples, results from all the three major methods described have yielded similar results,
namely that both problem behaviors and psychological disorders characterized by high
amounts of problem behaviors, such as antisocial personality disorder, conduct disorder,
and attention deficit hyperactive disorder, show at least moderate heritability (American
Psychiatric Association, 1994).
While informative about the nature of problem behavior development, providing
estimates of the amount of variance accounted for by genetic, shared environmental, and
non-shared environmental factors, these results do not tell us at which stage in the life
cycle specific environmental factors become important in predicting the development of
behavior or whether the influence of specific environmental agents can deflect a
particular developmental pattern. For answers to these sorts of questions we turn to the
area of developmental psychopathology.
Developmental Psychopathology
The focus of developmental psychopathology is to gather an understanding of not
only the factors that lead to maladaptive behavior but normative behavior as well
(Overton, 2004). Using methods employed within the area of developmental
psychopathology, researchers search for risk factors, factors that increase the likelihood
of maladaptation; promotive factors, factors that increase the likelihood of positive
adaptation; and protective factors, factors that help decrease the likelihood of
maladaptation in the face of high risk. Developmental psychopathology unites the major
premises of both socialization and behavior genetic theories of behavior in that most
1 Although twin heritabilities can sometimes be substantially higher, suggesting non-additive genetic effects are important for the traits involved.

8
models consider factors from many aspects of the social environment, individual
characteristics, and biological factors as well—either by accounting for genetic effects
(e.g., Reiss & Neiderhiser, 2000) or by investigating the role that biological factors, such
as the onset of puberty (e.g., Eccles, Lord, & Roeser, 1996), play in the development of
certain behaviors.
Another important distinction between the research done within the scope of
developmental psychopathology and the research utilizing theories of behavior genetics
or socialization is that, as a developmental theory, developmental trends (or trajectories)
of behavior are often the subject of interest. While developmental psychopathologists,
like behavior geneticists and social learning theorists, often study the antecedents to the
development of problem behaviors, they also attempt to uncover how certain factors can
influences changes in development over time, often for distinctly different groups of
individuals.
For example, Lenzenweger and Castro (2005) used the “neurobehavioral model
within an individual growth curve framework” to investigate the stability and continuity
of borderline personality disorder (BPD) among persons with the disorder who were
treated versus persons with the disorder who were not treated. In this way, Lenzenweger
and Castro were able to assess both the rates of change and important predictors of
change in clinical features of BPD among two distinct subgroups of people. Using
samples of both treated and untreated individuals with borderline personality disorder
(rather than treated individuals alone, which had been done in the majority of studies
before them) Lenzenweger and Castro uncovered a more nuanced pattern of the
development of symptoms of BPD, which depended both on whether an individual
received treatment and the amount of incentive motivation and negative emotion each
individual maintained.
The methodological approach used by the developmental psychopathologist
allows researchers to uncover both main effects and interactions from various
environmental sources (e.g., families, schools, neighborhoods), as well as important
individual characteristics and biological factors, leading to a more holistic understanding

9
of the antecedents to and development of behavioral functioning. The current
investigation utilizes this approach to uncover the effects of individual characteristics, the
genes, and the family environment on the development and continuity of externalizing
problem behaviors across the lifespan of individuals who were adopted at birth, in hopes
of uncovering potential risk and protective factors that may promote resilience (the
development of positive functioning despite being at risk for negative outcomes).
The Current Investigation
The data used for this dissertation came from a genetically informative sample of
subjects, in order to investigate questions regarding risk and protective factors for the
development and stability of problem behaviors across three major life stages; childhood,
adolescence, and adulthood. Thus, the current investigation utilized the conceptual
framework of developmental psychopathology and behavior genetic methodology to test
both socialization and behavior genetic hypotheses regarding the development of problem
behaviors from early childhood through middle adulthood.
Subjects came from the Texas Adoption Project (TAP), a 30-year investigation of
300 Texas families. Each of the families had at least one child adopted from a particular
adoption agency which served as a home for unwed mothers. Each biological mother
filled out personality questionnaires, took IQ tests, and received psychological interviews
while residing in the home. Each of the adoptive parents later filled out the same
personality questionnaires and took the same (or similar) tests of intelligence. The
adopted children were first assessed on personality and measures of IQ during childhood
(average age of approximately 8 years old) and were followed at two time points, one
approximately 10 years after the first, the other about 12 years following the second. At
the first follow-up, measures of personality and intellectual ability were assessed. During
the third data collection phase, the principal investigator, Joseph M. Horn, and I were
able to conduct detailed, semi-formal interviews with a little over half of the original
parents from the 300 Texas families. Information acquired during these interviews served

10
as the primary source of data upon which behaviors throughout the life span of the
participants were assessed for this project.
The TAP has a number of advantages from a scientific standpoint. Not only were
the children adopted away within days of birth (in the majority of cases) but all of the
adoptions were closed record adoptions. This limits the amount of time spent with the
biological mother and allows us to draw conclusions about genetic effects because we are
relatively certain that the children had no contact with their biological mother during
childhood2. In addition, the adoptive parents were often told little about the biological
parents—beyond disclosing the birth mother’s age and educational attainment. Riggins-
Caspers (1997) found that adoptive parents who were told that the birth parents had
antisocial problems were more likely to seek professional counseling for their children
than adoptive parents who were not told anything about the psychological histories of the
birth parents, among a group of adoptees with no distinguishable problems. Therefore,
having adoptive parents with little or no knowledge of the birth mothers’ (or fathers’)
psychological functioning enables us to draw firmer conclusions about genetic effects,
should evidence of them be found. The adoption agency did attempt to place infants into
homes where the physical characteristics (e.g., hair and eye color) of the adoptive parents
resembled those of the biological mother—which could potentially result in a slight
overestimation of genetic effects. A main advantage of the TAP, from a research
perspective, is that 46% of the families also had at least one biological child of their
own—a group which serves as an important comparison group.
Research Questions
The TAP data provided a unique opportunity to assess questions regarding the
development of problem behaviors over time. Due to the consistency of measurement
2 Although a number of adoptees have since located their biological mothers, this was not done (to our knowledge) prior to the age of 16.

11
between the biological mothers and the adoptive mothers of the adoptees the following
three questions could be investigated:
1. Do biological mothers with identifiable psychological maladjustment leave their
adopted away offspring at heightened risk for developing problem behaviors in
childhood, adolescence, and/or adulthood?
2. How do problem behaviors develop over time for different groups of individuals, such
as adopted children, children reared by their biological parents, or adoptees that vary in
the amount of genetic risk they face for problem behavior development?
3. Once genetic factors are controlled for, what individual and family characteristics
serve as protective factors for individuals at risk for developing problem behaviors, and
which serve as risk factors for individuals who are not at increased genetic risk?
Few studies have been able to use a genetically informed, longitudinal sample to
investigate the link between genes, environment, and the development and progression of
problem behaviors from childhood into mid-adulthood. Of those that do exist (e.g., the
Colorado Adoption Project, Plomin & DeFries, 1983), few have had access to high
quality, reliable measurements of maternal psychological functioning (especially the
same measures for both biological and adoptive mothers) and been able to link these
measures to their offsprings’ behavioral outcomes—a gap this thesis will attempt to fill.
Outline of the Dissertation
Chapter Two of this dissertation addresses the question of whether biological
and/or adoptive mothers who showed clear indications of psychological and/or behavioral
difficulties left adoptees vulnerable toward developing problem behaviors during
childhood, adolescence, and adulthood. To this end, both an index of psychosocial

12
functioning and individual indicators of various psychological dysfunctions were used to
investigate whether general maternal psychosocial malfunctioning or specific
psychological difficulties predict problem behaviors in the adoptees. Following this, an
initial assessment of genetic and environmental effects on problem behavior development
was made, using parent-child correlations.
Chapter Three addresses how problem behaviors developed among the biological
and adopted individuals from the Texas Adoption Project. In addition, differential
patterns of behavior between Higher-Risk and Lower-Risk adoptees, as defined by the
findings from Chapter Two, were investigated. Most work on problem behavior
development has found a general increase in defiant, externalizing types of behaviors
between childhood and adolescence, followed by a decline of problem behaviors as
individuals mature into adulthood. This investigation explored whether adoptees, in
general, follow this same pattern of development and, breaking the sample down further,
whether individuals whose biological mothers were defiant or psychologically troubled
showed different developmental trajectories than adoptees whose biological mothers
were not. Sex differences within each of these groups were also explored and the degree
to which genes and the shared family environment influenced the development and
stability of problem behaviors were also investigated.
Chapter Four explores a set of individual and stable family characteristics that
may serve as protective factors promoting resilience toward problem behavior
development, for individuals who were classified as Higher-Risk. These same individual
and family characteristics were also investigated as potential risk factors for individuals
displaying vulnerability (i.e., displaying negative outcomes despite the lack of risk
factors). In this largely exploratory chapter, an adoptive sample is used to test
socialization hypotheses regarding the influence of maternal care giving and other family
factors that have been found to predict problem behavior development. I also explore the
hypothesis that individuals’ characteristics such as childhood IQ and early temperament
protect Higher-Risk adoptees from developing antisocial behaviors, despite their genetic
risk.

13
The final chapter provides a brief review of the findings from Chapters Two
through Four. In this summary chapter I also discuss possibilities for future research on
problem behavior development and outline the implications of my findings for treatment
and for individuals involved in the adoption process.

14
Chapter Two: Assessing the Environmental and Genetic Influence of Maternal
Psychosocial Functioning on Problem Behavior Development from Childhood to
Middle Adulthood
Maternal psychosocial functioning, broadly defined as maladaptation in one or
more areas of psychological or behavioral adjustment, has been found to be a moderately
strong predictor of problem behaviors among offspring during childhood and
adolescence. Maternal depression, for example, has been associated with offspring
externalizing behaviors and conduct disorder during childhood and delinquency during
adolescence (Frye et al., 2005; Gelfand & Teti, 1990; Hammen, 1999; Luoma,
Tamminen, Kaukonen, Laippala, Puura, Salmelin, & Almqvist, 2001). Similarly,
maternal antisocial behaviors have been linked with childhood conduct problems and
adolescent delinquency (Ehrensaft, Wasserman, Verdelli, Greenwald, Miller, & Davis,
2003; Rhule, et al., 2004).
Far less research has been conducted on the association between maternal mental
health and offspring outcomes beyond the adolescent years. Much of the existent
literature on the topic of intergenerational patterns of externalizing goes only into young
adulthood and often only compares fathers and sons. Of the studies that do investigate the
association between maternal externalizing and offspring antisocial behaviors, it has been
found that childhood and adolescent histories, as well as abusive parental behaviors, do
predict externalizing behaviors in their young adult offspring, but only significantly for
their daughters (Verona & Sachs-Ericsson, 2005). Scaramella and Conger (2003) have
also found that hostile parenting practices were passed down from mothers to their adult
daughters. These harsh parenting practices included behaviors such as hitting, slapping,
or pinching, being behaviorally controlling, and/or using statements of personalized
disapproval. Defined as such, these types of harsh parental practices are conceptually
similar to typical measures of externalizing, antisocial behaviors, such as bullying and
physical aggression, and support the notion that antisocial behaviors can be passed down
from one generation to the next.

15
Findings such as these have led researchers in many directions in search for the
pathways of transmission between maternal psychopathology3 and offspring problem
behaviors. For example, some have found that the genes a depressed or antisocial mother
passes on to her offspring may leave them at increased risk for problem behavior
development (Lemery & Goldsmith, 1999) especially when the pathology is profound
(i.e., symptoms developed early on and were pervasive throughout her lifespan) (Viding,
Blair, Moffitt, & Plomin, 2005). Others have found that such mothers tend to be overly
critical (Goodman, Adamson, Riniti, & Cole, 1994; Webster-Stratton, & Hammond,
1988), generally negative (Garber, Braafladt, & Zeman, 1991; Jaffee, Belsky, Harrington,
Caspi, & Moffitt, 2006; Lovejoy, Graczyk, O’Hare, & Newman, 2000), and unresponsive
toward their children’s needs (Cox, Puckering, Pound, & Mills, 1987). These
environments are thought to elicit the conduct problems observed among depressive and
antisocial mothers’ offspring (Jaffee, et al., 2006; Moffitt, 2005). Still other researchers
(e.g., Plomin & Ashbury, 2005; Scarr, et al., 1983) argued that it is difficult to
disentangle the effects of the maternal caregiving environment and the effects of the
maternal genetic disposition, because they likely act together to create offspring
outcomes.
Indeed, most genetically informed investigations have shown that both genetic
and environmental factors contribute to the development of problem behaviors across the
life span (Caspi, Moffitt, Morgan, Rutter, Taylor, Kim-Cohen & Polo-Tomas, 2004;
Kim-Cohen, Moffitt, Taylor, Pawlby, & Caspi, 2005). For example, Kim-Cohen et al.,
(2005) found that both the genes passed on by depressed mothers (and their mates) and
the caregiving environments created by these depressed mothers influenced problem
behavior development in children between the ages of 5- and 7-years-old. Caspi et al.,
(2004), also found both genetic and environmental effects when identifying factors that
3 The link between paternal psychosocial functioning and offspring outcomes has also been studied extensively (e.g., Mednick, Gabrielli, and Hutcheson, 1983). Because we do not have data on biological fathers, however, I could only investigate the relationship between mothers’ adjustment and offspring behavioral outcomes.

16
influence antisocial problem behavior development. However, many of these studies,
including Kim-Cohen et al. and Caspi et al., compared concordance rates (a measure of
similarity between a pair of individuals) among twins, both identical and fraternal. In
twin studies the shared environmental component is parsed out, and shared environmental
effects are estimated by the remainder of what is not accounted for by genetic and non-
shared environmental effects (and error). Since what we are interested in, when
investigating the relationship between maternal psychosocial well-being and offspring
outcomes are both the genetic and the shared environmental effects, it may be more
informative to use samples of individuals where the non-shared, rather than the shared,
environmental effects are parsed out.
Adoptive samples provide the ability to do such an investigation. Using parent-
child correlations, the influence of birth mother psychopathology and adoptive mother
psychological functioning can be assessed independently, allowing us to determine which
influences the development of problem behaviors throughout the life span. The adoption
method, therefore, may help detect the separate influence of maternal environmental
effects and maternal genetic effects on problem behavior development better than the
twin method, especially when the subjects were adopted away shortly after their birth and
the same measures are available for both the biological and the adoptive mothers.
One study of this nature has been conducted investigating the relationship
between parent and offspring criminal behavior. Mednick, Gabrielle and Hutchings
(1983) conducted a study using an adoptive sample from Denmark—where both adoptive
and criminal records are public record. Using this archival data, Mednick and his
colleagues investigated the correlation between biological and adoptive parents’
criminality (number of felony convictions) and criminality in their adopted away
offspring.
Mednick’s findings were striking. First, it was found that adoptees, in general, had
elevated rates of criminal convictions (13.5% vs. 10% national average). Second, when a
biological parent had a criminal record, but the adoptive parents did not, the adopted
away offspring were much more likely to have also been convicted of a felony crime

17
(20%). However, when an adoptive parent had a criminal conviction but neither
biological parent did, the adopted offspring were no more likely to have been convicted
than the adopted children with neither biological or adoptive parents having a conviction
(14%). Lastly, when both a biological and an adoptive parent had criminal convictions,
these adopted away offspring were most likely, of the four groups, to have been
convicted (24.5%). These findings suggest that adoptees were at increased risk for
criminality (an extreme problem behavior), genetics plays a moderate to large role in
predicting criminal behavior, and that the genes interact with environmental factors
making adoptees with both genetic and environmental risk factors most vulnerable
toward developing problem behaviors during adolescence and adulthood.
The current investigation used data from a 30-year longitudinal adoption project,
the Texas Adoption Project, which (similar to the Mednick et al. study) included the same
measures for both the birth parent and the adoptive parent, to estimate the influence of
maternal psychosocial characteristics on adoptee problem behavior development across
the life span. Using T-scores from the Minnesota Multiphasic Personality Inventory
(MMPI) (Dahlstrom, Welsh, & Dahlstrom, 1960), both general levels of psychosocial
functioning (the summation of 8 MMPI subscale T-scores) and specific subscales were
tested as predictors of problem behavior development during childhood, adolescence, and
adulthood. In this way, I was able to investigate whether the birth mothers’ genetic
propensity and/or the adoptive mothers’ psychological functioning influenced problem
behavior development well into the adopted individuals’ adult years (upper 30s and 40s).
This question was addressed in the following manner. Using linear regressions,
the current analyses assessed whether birth mothers’ index scores of general psychosocial
functioning (described above), adoptive mothers’ index scores, or the interaction between
the two influenced the development of problem behaviors in the adopted away offspring
during childhood, adolescence, and/or adulthood. Earlier findings from the Texas
Adoption Project (Loehlin, Willerman, & Horn, 1982, 1987) suggested that adoptees
were mildly similar to their adoptive parents in personality and IQ during childhood, but
did not resemble their adoptive parents at all during adolescence; instead they moderately

18
resembled the mothers who gave them up at birth. Similar to these previous findings, I
expected adoptive mothers’ levels of psychosocial functioning to predict the development
of childhood behavior problems in the adopted sample, but that the birth mothers’ general
levels of psychosocial functioning would predict problem behavior development during
adolescence and adulthood.
Generality vs. Specificity of Transmission
Another question addressed in this chapter has to do with the specificity with
which problem behaviors are transmitted from one generation to the next. For example,
does maternal psychosocial adjustment, broadly defined as the summation of elevated
subscales, predict behavioral adjustment in the offspring or do specific subscales predict
problem behavior development? In other words does having a mother with comorbid
symptomology influence problem behavior development? Secondly, do specific
psychological deficits in the mother leave her offspring at greater risk for developing
externalizing, antisocial behaviors throughout the life span? Prior research suggests that
both maternal depression and maternal antisocial disorders are associated with offspring
displays of externalizing behaviors during childhood and adolescence. These two
disorders, however, have been found to be highly comorbid with one another, especially
among female adolescents (Keenan, Loeber, & Green, 1999; Zoccolillo, 1992).
Therefore, the current investigation sought to uncover whether maternal antisocial
tendencies alone, or the number of psychological maladjustments combined, indicate who
is at greater risk of developing problem behaviors.
Another set of regressions was run, this time using scale scores for indicators of
eight specific indicators of maternal psychological maladjustment; including depression,
psychopathic deviance, hypochondriasis, schizophrenia, hypomania, and paranoia,
hysteria, and psychasthenia. This set of regressions was done to assess the specificity
with which problem behaviors may be transmitted. For example, did adoptees that were
raised by mothers with high scores on the depression subscale display similar levels of

19
problem behaviors to adoptees reared by mothers who had high scores on the paranoia
subscale? Did having a birth mother with obvious signs of depression predict problem
behavior development as well as having a birth mother with signs of antisocial
tendencies? Based on the results from Mednick et al. (1983), it was hypothesized that the
genetic transmission of problem behaviors would be specific, such that having a
biological mother with deviant or antisocial tendencies would predict problem behavior
development across the life span. No specific predictions were made with respect to the
influence of the adoptive mothers’ subscale scores, except that none were expected, for
the same reason listed above, to occur beyond the childhood years.
METHOD
Subjects
Data for this investigation came from the Texas Adoption Project, a longitudinal
study of 300 Texas families with at least one adopted child. There were three primary
data collection phases from TAP. During Time 1 (1979) 691 children, both adopted and
biological, from the 300 families were interviewed and administered IQ tests, while their
parents (most often the mothers) filled out a questionnaire assessing each child’s
personality. The average age all of the subjects during Time 1 was approximately 8 years
old. Almost all of the adoptees where Caucasian, as were the adoptive parents. In
addition to extensive data on the children IQ, personality, and psychological profiles were
assessed for the biological mothers (by the participating agency prior to the beginning of
the TAP) and both adoptive parents (by the TAP in 1979).
The second data collection phase occurred approximately 10 years later. During
Time 2 the, now adolescent (average age of 17 years), subjects were re-assessed. They
completed age appropriate measures of personality and IQ, and their mothers rating them
again (using the same measure as at Time 1) on personality. During Time 3, which began
in the summer of 2000, letters were sent to the last known address for each of the 300
families. When letters were returned via the post office an internet search using Lycos
was conducted—entering the adoptive father’s name and last known city of residence. In

20
total 186 of the original 300 families were located and agreed to participate in the third
data collection phase of TAP. Of them, 167 were actually interviewed; the remaining 19
had scheduling conflicts and were not interviewed. Thirty-two families explicitly
declined participation, 6 sets of parents were reported to be deceased (often by one of
children who received the letter), 39 families could not be located (either we had no
current address for them or the post office returned the letter with no forwarding address),
and 37 families did not respond.
For the 167 families that were interviewed, one of two interviewers (Joseph M.
Horn or I) traveled to their homes and conducted detailed semi-formal4 interviews with
the parents. Information on the life course of each of their children was acquired,
including infant, childhood, adolescent, and current physical health (major illnesses),
scholastic achievements, general disposition, accomplishments, accidents, problems with
drugs, alcohol, and the law, psychological diagnoses, and marital and reproductive
histories (see Appendix 2A for a list of probes used during the interviews) . Though data
are available for both the biological and adopted offspring, the research presented in this
chapter deals only with the adopted subjects. The biological offspring will, however, be
utilized in Chapter Three.
IQ scores for the adoptees’ birth mothers were not included in the adoption
records in many instances, limiting the number of subjects in the current analyses to 181.
T-tests were computed to test for systematic differences between adoptees with and
without data on birth mothers’ IQ scores. Those individuals with relatively complete data
differed by their age, adoptive mother rated extraversion during childhood, and by their
adoptive mothers’ age (see Table 2.1). These adoptees were younger, more extraverted
during childhood, and had younger adoptive mothers than the adoptees without IQ scores
for their biological mothers.
The tendency for adoptees with birth mother IQ data to be younger most likely
reflects the change in practice at the adoption agency regarding IQ testing, which began
4 The interviews followed no specific detailed clinical protocol, but a uniform set of probes was used to guide the parents through the life histories of each of their children, from infancy up to the present.

21
in 1973. The differences in the level of extraversion is likely associated with the age
difference—as the extraversion scale is negatively correlated with age (i.e., younger
adoptees also tended to be more extraverted in this sample). The differences between
these two groups—those with and without birth mother IQ data—are not likely to have
created a big problem for the analyses presented in the project as age is controlled for,
when appropriate.
Measures
Problem behaviors. During the interviews described above extensive notes were
taken on each member of the family. To estimate the amount of problem behaviors of
each participant, two independent raters and I read through the interview notebooks and
filled out an index of problem behaviors (IPB), created for the purpose of this
investigation (see Appendices 2B and 2C). The items included on this index were based
on research regarding the symptomology of antisocial personality disorder, conduct
disorder, and existing measures of problem behaviors (such as Achenbach’s [1991]
Behavior Problem Checklist). Accordingly a majority of the items for the childhood,
adolescent, and adulthood life stages represent antisocial, externalizing types of
behaviors. The items included in the infant portion of the index were based on Thomas &
Chess’s (1977) conception of the easy vs. difficult infant temperament and were not
included as a dependent variable in any of the analyses in this chapter, or the next.
However, infant items and total scores were utilized as predictors of problem behavior in
Chapter Four.
Each independent rater was trained on the interpretation and use of the behavioral
index. A pilot sample of five families was randomly selected. Each rater read the
interviews and rated each of the children according to the checklist. Each rater then
compared his rating with that of the author. Discrepancies were discussed and an
additional three families were rated to verify that each rater conceptually paralleled each
other as to what constituted specific problem behaviors throughout the life span.
Following the training exercise, each of the three raters then rated all of the children,

22
adopted and biological, in each of the 167 families. Each rater was blind to the adoption
status of the individuals being rated and only the first names of the subjects were visible
to the raters for identification purposes—although it was sometimes evident toward the
end of the interview when parents often wanted to tell the interviewer about their opinion
of adoption, a story of their child locating their biological mother, or something along
those lines. Though hints of the adoptive status of some of the subjects were apparent in
the interview notes, it should not have greatly affected the ratings of behavior because the
independent raters were unaware of the specific hypotheses of this investigation. They
were told simply that I was interested in the development of problem behaviors across the
lifespan.
Initial interrater reliabilities were calculated for the sample as a whole using
Cronbach’s alpha, item by item. Cronbach’s alpha is thought to be a good measure of
interrater consistency when there are more than two raters, so long as each rater has rated
all of the participants, because it allows systematic differences between judges to be
detected (Stemler, 2004). The individual item alphas were then averaged within each of
the life stages to summarize the reliability of ratings for each life stage. The individual
item alphas ranged from 0.58-0.95 during childhood, with a mean alpha of 0.75, alphas
could not be computed for three of the items (out of 14) because too few participants
were rated as displaying the behavior. For the adolescent period, the item alphas ranged
from 0.11-0.94, with a mean alpha of 0.82, and for adulthood the items ranged from 0.40-
0.98 with a mean of 0.82 (alphas could not be computed for four of the adulthood items).
While the average initial interrater reliabilities were reasonable, further measures were
taken to assure that the coding received by each subject was as complete and correct as
possible.
Following the initial reliability calculations, to assess the reason for any
discrepant ratings and attempt to reach consensus ratings, the three raters met to discuss
items on which they differed from one another on their respective ratings. Ratings were
considered discrepant when 1) two of the three raters differed from one another by more
than 1 point on Likert-type items, 2) all three raters differed on any item, 3) at least two

23
of the raters differed on dichotomous items (e.g., inappropriate sexual behavior during
childhood), or 4) two of the raters differed by more than 2 counts on the open number
items (e.g., number of arrests during adolescence). In instances where two raters agreed,
and the third was off by 1 point, for the Likert-type and open ended items, the item was
coded according to the two agreeing parties. If, however, the third rater was off by more
than one point the three raters discussed the case and attempted to resolve the
discrepancy. For example, if raters one and two rated an individual as having “little or no
problems with tantrums” in childhood, while the third rater rated him as have “some
problems with tantrums” in childhood, the final rating was “little or no problems with
tantrums”. However, if the third rater rated the individual as having “a lot of problems
with tantrums” in childhood, the three raters reviewed the individual’s notes, re-read the
relevant information, assessed whether any of the raters missed something, and discussed
what the appropriate rating should be. The final rating was than based on this discussion.
Though absolute consensus was not always reached, in all cases the three raters were able
to come within at most one point of each other. Again, final coding went to the “two out
of three rule.” Reliability analyses were then calculated again, using the average of the
individual Cronbach alphas for each item within a developmental period. The resulting
interrater reliability estimates were .84 for childhood, .92 for adolescence, and .94 for
adulthood.
Once the ratings for each item were finalized, positive items were reverse scored
and the items were summed for each of the three life stages: childhood (ages 4-12),
adolescence (ages 13-19), and adulthood (ages 20 and over)5. Higher scores indicated
more problem behaviors. The following paragraphs describe the scale composition for the
measure of problem behavior at each life stage: childhood, adolescence, and adulthood.
Appendix 2B provides a list of all of the items as well as a rubric for how each item was
5 As previously noted, although measures of infant behaviors were also assessed on the Index of Problem Behavior they were not used in this investigation as a measure of problem behavior. The infant items will, however, be used in Chapter Four as predictors of problem behavior development during subsequent life stages.

24
scored for analysis. Appendix 2C provides the item response frequencies for each of the
IPB items.
Problem behaviors during childhood (ages 4-12): included acting out in school or
at home (tantrums, disregard for rules, frequent defiance), physical and verbal aggression,
truancy, cruelty to animals, inappropriate sexual behavior, theft, and frequent lying. For
the Likert-type items (items 1-9 on the IPB) responses were coded 1=rarely,
2=sometimes, 3=a lot of the time, except for item number one, “type of student,” 0=good
(A/B student), 1= average (C student), 2=poor (D/F student). For the dichotomous items,
“cruelty to other children,” “cruelty to animals,” “inappropriate sexual behavior,” and
“diagnosed with a disorder,” items were coded as 2=Yes (the mean of the possible
number of points on the Likert-type items), 0=No. In this way the dichotomous items,
because they tend to be more serious problem behaviors, are weighted more heavily in
the overall score. This is the case at each of the three life stages measured in this
dissertation project. On all items, if the behavior was not specifically indicated in the
interview the rater checked the not indicated option and the items were coded as zero.
Table 2.2 presents the descriptive statistics for all of the childhood items as well as the
total scale score for the 381 subjects for whom we had interview data. All items were
then summed for a theoretical range of 0-37. The sample range was 0-18, with a mean of
2.29 (SD= 2.48, Skewness= 2.154). The SPSS program for calculating scale reliability
(Cronbach’s alpha) for the childhood section of the Index of Problem Behavior was used
(alpha= 0.56).
In order to provide a measure of the congruent validity of the IPB measure,
correlations were calculated between items on the childhood Index of Problem Behavior
and scales constructed from parent ratings during childhood at Time 1. These scales were
based on a factor analysis of the mother's ratings on the bipolar rating scales in the
original study (see Appendix A in Loehlin, et al, 1981). Table 2.3 lists the items that
made up each of the scales; Extraversion, Well-Socialized, and Emotional Stability.
Results from the correlations are presented in Table 2.4. The Extraversion scale was not
correlated with any of the IBP items. The Well-Socialized scale was significantly,

25
negatively correlated with 5 of the 14 items: rule abiding, physical aggression, threw
tantrums, manipulative, and bullied others. All the other items on the IPB also had a
negative relationship with the Well-Socialized scale, though not significantly so. Finally,
mother rated Emotional Stability was significantly, negatively correlated with throwing
tantrums and having been diagnosed with a disorder during childhood. As with the Well-
Socialized scale, all other estimates were in the negative direction, but were not
significant. These results support the use of the Index of Behavior Problems as a valid
indicator of behaviors during childhood, despite the fact that the index was rated on
retrospective accounts, because previous, concurrent ratings given by the mother showed
significant correlations to the retrospective accounts given during the interview in many
instances. In addition, all relations between concurrent measures and retrospective
measures of childhood behavior were in the right direction (i.e., being rated as well-
socialized by their mothers during childhood was negatively associated with the problem
behaviors they reported them having in childhood during the interview, twenty years
later), even if statistical significance was not reached for each of the individual items.
Problem behaviors during adolescence (ages 13-19) included: truancy, drug use,
alcohol use, theft, sneaking out or staying out past curfew, disregard for rules, getting into
fights, frequent speeding tickets, frequent at fault car accidents, multiple sexual partners,
destruction of property, and number of arrests and convictions. Items were scored in the
same manner as the childhood items and summed for a total score indicating the amount
of problem behaviors during adolescence. Scores ranged from 0-32, with a mean of 5.24
(SD= 5.44, Skewness= 2.04) and an alpha of 0.76. Table 2.5 presents the descriptive
statistics for the adolescent IPB items.
To assess the congruent validity of the IPB for measuring adolescent problem
behaviors, correlations were run between each of the adolescent IPB items and the
mother rated scales of extraversion, socialization, and emotional stability from Time 2
(when the participants were an average age of 17 years). In Table 2.6, similar to the
childhood correlations, many relationships between the contemporaneous measures of
personality and the IPB ratings were significant and in the direction one would expect.

26
For example, adolescents who were not rated by their adoptive mothers as being well-
socialized during adolescence were also rated by the three independent raters as having
displayed problems with academic performance, truancy, lying, stealing, running away
from home, and they were more likely to have been diagnosed with a disorder during
their adolescent years. Lower scores on adoptive mother ratings of emotional stability
were also related to many of these same problem behaviors, as rated by the three
independent raters. Therefore, the adolescent index of problem behaviors also appears to
be a valid measure of problem behaviors, at least as judged by consistency across time
and method.
Problem behaviors during adulthood (ages 20 and up) included physical and
verbal aggression, alcohol and drug use, destruction of property, gambling, credit card or
check fraud, sexual assault, child abandonment or abuse, as well as the number of
convictions, arrests, warrants, divorces, and illegitimate pregnancies. Items were coded
and summed, as with the childhood and adolescent measures, for a resulting scale range
of 0-27, mean= 2.10 (SD= 4.13, Skewness= 3.04), and a Cronbach’s alpha of 0.77.
Individual item descriptive statistics are presented in Table 2.7.
The adult portion of the IPB was validated by correlations between the IPB and
two items on the self-questionnaire that was sent out to each of the participants following
the parental interviews. The two items from the self-report questionnaire asked the
subjects to circle a number between 1 and 9 that best represented their current level of
problems with drugs and alcohol (1= no problems at all, 9= many problems) and the law
(1= no problems at all, 9= many problems). These items were then correlated with similar
items from the adulthood IPB measure. Self reported problems with drug and alcohol
correlated 0.60 (p< .001) with our ratings of adulthood alcohol use and 0.49 (p< .001)
with our ratings of drug use. Self-reported problems with the law correlated 0.53 with the
number of arrests rating on the IPB and 0.38 with the number of ticket or warrants, both
were significant at the p< .01 level. These results, like those from the childhood and
adolescent correlations, partially validate the IPB as a measure of problem behaviors
during adulthood.

27
IPB percent scores. There were two potential issues with the use of raw scores
from the IPB as the dependent variable throughout this dissertation. First, the lack of
developmentally consistent indices of problem behaviors and, second, the unequal
number of possible problem behaviors across different life stages. As an example of the
first issue, parental disobedience was a problem behavior that was measurable in both
childhood and adolescence but, because children leave their parent’s home when they
reach adulthood, it was not an appropriate measure of adulthood problem behavior.
Rather, social disobedience, measured by arrests, convictions, and tickets or warrants,
was considered a good indicator of adult problem behavior and conceptually paralleled
obedience in earlier life stages. Second, the number of potential behaviors that
individuals can display that are considered as problematic may differ with age.
Consequently, more items need to be included in the later life stages to cover the full
range of possible problem behaviors—rendering the use of raw scores problematic. For
example, a score of 4 in childhood is not equivalent to a score of 4 in adolescence,
because the total possible scores are different—37 in childhood and 73 in adolescence. A
score of four represents a much higher proportion of the total possible score during
childhood than it does during adolescence (11% versus 5%, respectively). Therefore,
percent scores were used as the measure of latent behavior problems in all of the analyses
in this dissertation. IPB percent scores were calculated by dividing the total score within
an age range by the total possible within that age. Mean percent scores were 7% during
childhood (SD= 0.07, range= .00 - .41), 8% during adolescence (SD= 0.08, range= .00 -
.41), and 3% during adulthood (SD= 0.06, range = .00 - .38) In Chapter 3 of this
dissertation, I also investigate the correlations in rank order across the life stages to gain a
sense of the individual-level stability of problem behaviors across the life span.
Specific indicators of Birth/Adoptive mother’s adjustment. The Minnesota
Multiphasic Personality Inventory (MMPI) T-scores were the basis for rating both the
biological and adoptive mother’s psychological functioning. The MMPI is a highly valid
and reliable measure of both personality and state of psychological functioning (Butcher
& Tellegen, 1966). The MMPI was administered to the biological mothers by a staff

28
clinical psychologist at the home/agency from which the participants were adopted. The
adoptive parents were also administered the MMPI upon entry into the Texas Adoption
Project. Because nearly all of the adoptive mothers were the primary care givers
(therefore acting as the primary socialization agent) only the mothers’ scores were used.
The MMPI is comprised of nine subscales (Dahlstrom, Welsh, & Dahlstrom,
1960): Hypochondriasis (Hs), chronic worrying over ones health despite lack of
evidence for a medical diagnosis; Depression (D), severe and prolonged feeling of
sadness, hopelessness, and persistent thoughts of death; Hysteria (Hy), the use of
physical symptoms to deal with conflict; Psychopathic deviate (Pd), total disregard for
social convention, rules, and norms, lack of empathy, compassion, anxiety, or fear of
punishment, and moral bankruptcy; Masculinity-femininity (Mf), designed to detect
“male sexual inversion” (i.e., males with female gender orientation); Paranoia (Pa),
delusional beliefs; Psychasthenia (Pt), obsessive ruminations and compulsive behaviors
(i.e., obsessive compulsive disorder); Schizophrenia (Sc), bizarre thought and/or
behaviors; and Hypomania (Ma), hyperactivity, emotional excitement, and flight of ideas.
T-scores on all of the subscales, except Mf, were used to predict problem behaviors in the
adopted and biological offspring. Table 2.8 gives the average scores on each of the
subscales for the adoptive and biological mothers. The birth mothers and the adoptive
mothers had small and positive correlations on three of the MMPI sub-scale—
Hypochondriasis, Psychopathic Deviance, and Psychasthenia. These relations should be
considered when interpreting any outcomes based on mothers’ sub-scale scores as they
may inflate the relationship of either the genetic or environmental estimates based on
these measures. I attempted to control for the influence of these relationships by
controlling for birth mothers’ scores, when the effects of the adoptive mothers’ scores are
being investigated, and vise versa.
General measures of Birth/Adoptive mother psychosocial adjustment. All MMPI
subscale T-scores, except the masculinity/femininity scale, were used to construct an
index of overall psychosocial functioning for both the biological and adoptive mothers.
For each subscale that the mothers scored two standard deviation above the normative

29
sample mean (i.e., T-score = 70 or more) the subjects received a “1.” These were then
summed, for a possible scale range of 0-8, and used as an index of psychosocial
adjustment for each mother. The birth mother’s index of psychological adjustment ranged
from 0-6 (mean= 0.51, SD= 1.12, Skewness= 1.58), while the adoptive mothers’ index
scores ranged from 0-5 (mean= 0.23, SD= 0.72, Skewness= 4.52). Note that these scales,
particularly for the adoptive mothers, were highly skewed. Many of the mothers had no
scale scores above 70.
Birth/adoptive mothers’ IQ was measured using Revised Beta Examination
standardized scores (Kellogg, Morton, Lindner, & Gurvitz, 1946). The Revised Beta is a
valid measure of intelligence, scores from which correlate 0.92 with Wechsler IQ scores.
This measure was also administered in the home for unwed mothers by a trained, in-
house psychiatrist. IQs for these mothers ranged from 70-124, or in the ranges of
Defective to Superior (Kellogg et al., 1946). The mean IQ of the biological mothers in
this sample was 108 (SD= 8.77), or in the Average range. The adoptive mothers’ IQs
ranged from 89-127, Below Average to Superior. The mean adoptive mother IQ was
114.05 (SD= 7.07), in the Above Average range.
Demographic Variables
Adoptees’ age at Time 1 was entered only into the regression equations that did
not use scores on the Index of Problem Behaviors, since these scores were coded
according to each individual during specific periods of their development. The mean age
of this sample at Time 1 was 7.07 (SD=2.31).
Adoptees’ sex. Because of the robust findings in the literature regarding sex
differences in problem behaviors (e. g., Else-Quest, Hyde, Goldsmith & Van Hulle, 2006;
Hammarberg, & Hagekull, 2006; Winsler & Wallace, 2002), sex of the adoptee was
included as a control variable in the regression equations. Sex was coded as a
dichotomous variable (0= male, 1= female). This sample was approximately 54 percent
male.

30
Adoptive parent’s socio-economic status. SES was calculated in prior research
from the Texas Adoption Project (Horn, Loehlin, & Willerman, 1982) using the
summation of the z-scores for both fathers and mothers’ education and fathers’
occupation. Father’s occupation was coded according to a modified Warner’s scale
(McGuire & White, 1955; Warner, Meeker, & Eells, 1949), with the highest status
occupations (e.g., doctors, lawyers, CEOs) receiving a “1” and the lowest occupations
(e.g., busboys, janitors, unskilled laborers) receiving a “7”. Education level was coded as
1-6 (1= elementary school, 2= 1-3 years of high school, 3= 4 years of high school, 4= 1-3
years of college, 5= 4 years of college, 6= more than 4 years of college). The occupation
scale was reversed prior to summing and arbitrary scaling factors applied to eliminate
negative signs and insure that each of the components in the equation received equal
weights. Higher scores reflect higher socioeconomic status. SES ranged from 109-210,
with the average SES for this sample of adoptive parents equal to 169.26 (SD= 23.12).
Analyses
First, to test whether the prevalence of adoptee problem behaviors differed as a
function of the birth or adoptive mothers’ index of psychosocial functioning (i.e., the total
number of elevated MMPI subscales) linear regressions were performed. Block entry was
used to detect the effect of the variables within the model when entered together. In this
series of regressions, control variables (sex, SES, and adoptive and biological mothers’
Beta IQ scores) were entered into the first block. The adoptive mothers’ index of
psychosocial functioning scores were entered as block two, biological mothers’ index
scores as block three, and the interaction between biological and adoptive mothers’ index
scores as block four. Due to the significant correlations between the birth mothers’ and
adoptive mothers’ scale scores (see Table 2.8), the adoptive mothers’ scores were entered
before the birth mothers’ psychological profile scores. Doing so maximized the chance of
detecting maternal environmental effects, should they occur. Cohen’s (1992) effects sizes
(f2) for multiple regressions were calculated after each block entry, as an estimate of the
importance of any significant findings within that block. Following Cohen’s convention,

31
an effect size of 0.02 was considered a small effect, while effects sizes of 0.15 and 0.35
were considered to be moderate and large, respectively.
Second, to estimate the specificity of the origin of behavioral tendencies another
set of linear regressions, using the mothers’ individual MMPI sub-scale T-scores rather
then an index indicating the number of elevated sub-scales, were calculated. As with the
first set of regressions, controls were entered into the first block and each of the subscale
scores were then entered into block two. This was done separately for the birth mothers
and the adoptive mothers. Based on prior findings that have shown a specific and direct
genetic influence between parent and offspring antisocial social behaviors (e.g., Mednick
et al, 1983 ), it was predicted that the birth mothers’ psychopathic deviate subscale scores
would predict problem behavior development in the adopted away offspring, during each
developmental phase.
Results
The Development of Behavior Problems as a Function of Biological/Adoptive Mothers’
General Psychosocial Functioning
In all the tables presenting regression models in this chapter, results are presented
as standardized beta coefficients. The model coefficients, therefore, should be interpreted
as, using the Block 4 equation from Table 2.9 for example, for every standard deviation
increase in birth mothers’ index score there was 0.09 of a standard deviation decrease in
adoptees childhood IPB percent score, or a decrease of .6 percentage points (.09 * .07=
.006). The R2 values illustrate the cumulative effect of the model after each block and the
f2 values illustrate the effect size of the variable entered in a specific block only. Taking
block 4 of Table 2.9 as an example again, the cumulative effect of the entire model is
0.03, meaning that 3% of the variance in childhood problem behavior development is
accounted for by the adoptees sex, adoptive family SES, adoptive mothers’ IQ, birth

32
mothers’ IQ, maternal index scores, and the interaction between both mothers’ index
scores. The effect size of entering the interaction term alone is 0.01, which means that it
accounts for only 1% of the variance in IPB scores (if it were significant). Although
effect sizes are of primary interest for significant findings, for consistency I calculated
them after all block entries.
Tables 2.9, 2.10, and 2.11 display the results of the regression models using
adoptive mothers’ and biological mothers’ general psychosocial functioning to predict the
development of childhood, adolescent, and adulthood behavior problems, respectively.
Adoptees’ sex, SES, adoptive mothers’ IQs, and birth mothers’ IQs were entered first as
controls. Consistent with what was predicted; adoptive mothers’ index of psychosocial
functioning scores did not predict problem behavior development during any stage of the
adoptees development from childhood up through middle adulthood. Contrary to the
hypothesis that birth mothers’ psychosocial profiles would predict the development of
problem behaviors across the life span, results found from the linear regressions failed to
show that the birth mothers’ general psychological functioning predicted behavior, during
childhood or adolescence, as measured by the Index of Problem Behaviors. While the
birth mothers’ index score did significantly and positively influence problem behaviors in
their adult offspring, this result failed to reach significance once the interaction between
adoptive mother and biological mother functioning was added into the model. These
results suggest that problem behavior development among adoptees from the Texas
Adoption Project is not significantly related to the overall psychosocial well-being of
either the birth mothers or the adoptive mothers.
Although entered as a control variable, it was also found that adoptive mothers’
IQ had a significant and positive influence on the development of adoptee problem
behaviors during adulthood (Table 2.11). This result suggests that adoptees with brighter
adoptive mothers had more problem behaviors in adulthood. For every 10 point (1
standard deviation) increase in adoptive mother IQ there was an increase of 0.16
percentage points in adulthood problem behaviors.

33
The Development of Behavior Problems as a Function of Biological/ Adoptive Mothers’
MMPI T-scores
Linear regressions were used to estimate the influence of each of the biological
mothers’ individual MMPI subscale T-scores on problem behavior development in
childhood, adolescence, and adulthood, separately. Results from these analyses can be
found in Table 2.12. As with the presentation of the regression models testing general
maternal psychosocial functioning, these models display the standardized beta
coefficients, R2, and f2 for each block of the entry in each model. In this set of models
controls were entered as the first block and the individual MMPI T-scores were entered
together in the second block. Beyond the prediction that the biological mothers’ Pd T-
scores would be the strongest predictor of behavior problems in their adopted away
offspring, results suggest that psychopathic deviance (Pd) scale was the only significant
sub-scale to predict problem behavior development among the adopted away offspring.
This was found to be the case during each stage of development. This means that for
every 10 point increase (1 SD) in birth mothers’ Pd there was a .21 of a standard
deviation increase in offspring IPB percent score, which corresponds to a 1.5 percentage
point increase in problem behaviors during childhood, 2.2 percentage point increase
during adolescence, and 1.6 percentage point increase during adulthood.
The same series of regressions was run for the adoptive mothers’ MMPI subscale
scores to assess whether specific personality or psychological characteristics of the
primary care givers influenced behavior problem development throughout the life course.
Results (Table 2.13) indicated that during childhood there was a significant, negative
relationship between adoptive mothers’ Hs T-scores and problem behavior development.
Adopted children whose adoptive mothers displayed fewer problems with “imagined”
physical dysfunctions had higher problem behavior scores than those whose adoptive
mothers had higher scores on the MMPI hypochondriasis sub-scale. None of the adoptive
mother subscale scores appeared to predict adolescent problem behavior development,
and during adulthood only the birth mothers’ psychological profile score significantly
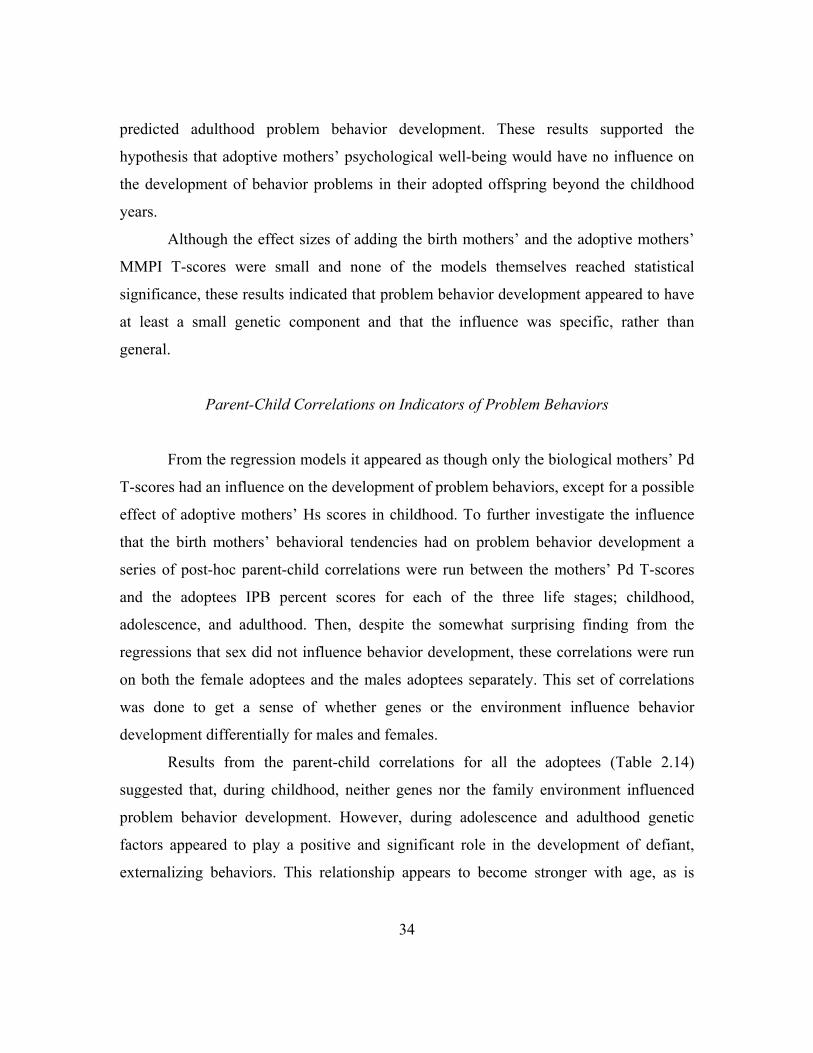
34
predicted adulthood problem behavior development. These results supported the
hypothesis that adoptive mothers’ psychological well-being would have no influence on
the development of behavior problems in their adopted offspring beyond the childhood
years.
Although the effect sizes of adding the birth mothers’ and the adoptive mothers’
MMPI T-scores were small and none of the models themselves reached statistical
significance, these results indicated that problem behavior development appeared to have
at least a small genetic component and that the influence was specific, rather than
general.
Parent-Child Correlations on Indicators of Problem Behaviors
From the regression models it appeared as though only the biological mothers’ Pd
T-scores had an influence on the development of problem behaviors, except for a possible
effect of adoptive mothers’ Hs scores in childhood. To further investigate the influence
that the birth mothers’ behavioral tendencies had on problem behavior development a
series of post-hoc parent-child correlations were run between the mothers’ Pd T-scores
and the adoptees IPB percent scores for each of the three life stages; childhood,
adolescence, and adulthood. Then, despite the somewhat surprising finding from the
regressions that sex did not influence behavior development, these correlations were run
on both the female adoptees and the males adoptees separately. This set of correlations
was done to get a sense of whether genes or the environment influence behavior
development differentially for males and females.
Results from the parent-child correlations for all the adoptees (Table 2.14)
suggested that, during childhood, neither genes nor the family environment influenced
problem behavior development. However, during adolescence and adulthood genetic
factors appeared to play a positive and significant role in the development of defiant,
externalizing behaviors. This relationship appears to become stronger with age, as is
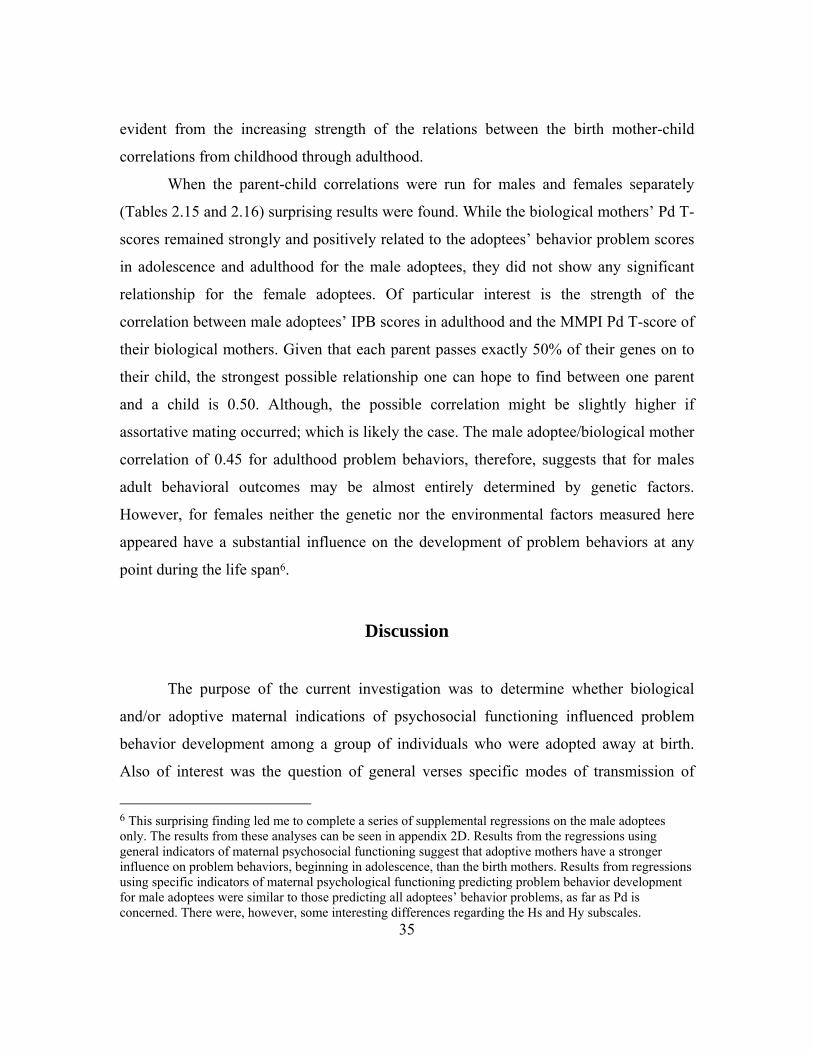
35
evident from the increasing strength of the relations between the birth mother-child
correlations from childhood through adulthood.
When the parent-child correlations were run for males and females separately
(Tables 2.15 and 2.16) surprising results were found. While the biological mothers’ Pd T-
scores remained strongly and positively related to the adoptees’ behavior problem scores
in adolescence and adulthood for the male adoptees, they did not show any significant
relationship for the female adoptees. Of particular interest is the strength of the
correlation between male adoptees’ IPB scores in adulthood and the MMPI Pd T-score of
their biological mothers. Given that each parent passes exactly 50% of their genes on to
their child, the strongest possible relationship one can hope to find between one parent
and a child is 0.50. Although, the possible correlation might be slightly higher if
assortative mating occurred; which is likely the case. The male adoptee/biological mother
correlation of 0.45 for adulthood problem behaviors, therefore, suggests that for males
adult behavioral outcomes may be almost entirely determined by genetic factors.
However, for females neither the genetic nor the environmental factors measured here
appeared have a substantial influence on the development of problem behaviors at any
point during the life span6.
Discussion
The purpose of the current investigation was to determine whether biological
and/or adoptive maternal indications of psychosocial functioning influenced problem
behavior development among a group of individuals who were adopted away at birth.
Also of interest was the question of general verses specific modes of transmission of
6 This surprising finding led me to complete a series of supplemental regressions on the male adoptees only. The results from these analyses can be seen in appendix 2D. Results from the regressions using general indicators of maternal psychosocial functioning suggest that adoptive mothers have a stronger influence on problem behaviors, beginning in adolescence, than the birth mothers. Results from regressions using specific indicators of maternal psychological functioning predicting problem behavior development for male adoptees were similar to those predicting all adoptees’ behavior problems, as far as Pd is concerned. There were, however, some interesting differences regarding the Hs and Hy subscales.

36
problem behaviors. Therefore, using biological and adoptive mothers’ T-scores on MMPI
subscales, a general index of psychosocial functioning was created and specific subscale
T-scores were examined as potential risk factors for the development of problem
behaviors during childhood, adolescence, and adulthood. Finally, a post-hoc analysis of
the genetic effects of problem behavior development was assessed using parent-child
correlations on indicators of behavior problems. Because I was surprised not to have
found an effect of gender on problem behavior development in the regression models, I
ran the parent-child correlations both together and separately for males and females.
From this set of correlations I hoped to uncover whether the influence of maternal genetic
and environmental effects differed between males and females.
Genetic Risk for Problem Behavior Development
While many studies have found maternal (and paternal) mental illness to be
associated with behavior problems among offspring (e.g., Burt, Van Dulmen, Carlivati,
Egeland, Sroufe, Forman, Appleyard & Carlson, 2005; Foley, Pickles, Simonoff, Maes,
Silberg, Hewitt, & Eaves, 2001; Rhule, et al., 2004; Verona et al., 2005), suggesting that
mental illness, in general, is linked to problem behavior development. This relationship is
difficult to assess unless genetically informed samples are used to investigate the
question. If mental illness, in general, has an impact on problem behavior development
then we should have found that 1) general psychosocial deficits in the biological mothers
were associated with problem behavior development in their adopted-away children, 2)
other biological mother MMPI sub-scale T-scores, including the depression sub-scale,
were related to problem behaviors in the adoptees, and 3) that biological parent-child
correlations were the same regardless of gender. None of these were found to be true.
Instead it was found that the birth mothers’ psychopathic deviate (Pd) T-scores,
but not their general psychosocial functioning, predicted problem behavior development
in their adopted away offspring across the entire lifespan. In addition, when the male and
female adoptees were investigated separately to see how similar they were to their

37
biological mothers on measures indicating defiant and externalizing behaviors, males
were found to be moderately similar to their biological mothers during adolescence and
very similar to them in adulthood. Together, these results suggest that it is not the
number of different elevated subscales (i.e., level of general psychosocial functioning)
that influence problem behavior development later in life for the adopted-away offspring,
but rather that problem behavior development is very specifically associated with the
behavioral tendencies (i.e., psychopathic deviance) of their biological mothers. In
addition, this specific relationship appears to get stronger with age and may hold true for
males alone.
Though few studies have investigated the transmission of maternal antisocial
behaviors to their adopted away offspring from childhood into middle adulthood, the
conclusion that behavioral tendencies are transmitted through genetic factors is supported
by several other studies that have used genetically informed samples. For example, the
Colorado Adoption Project (DeFries, et al., 1994) is another longitudinal investigation of
adopted individuals and their families that has found a relationship between biological
mothers’ behavioral tendencies and the behaviors of their adopted away children. Using a
subset (N=88) of adoptees for whom biological mothers’ antisocial data (a short
inventory assessing how often the birth mothers got into fights, ran away from home, or
skipped school) was available, O’Conner, et al. (1998) also found a significant parent-
child correlation between birth mothers’ antisocial tendencies and externalizing in the
adopted away offspring from age 7-12 years old. Gender was not considered as a factor in
the O’Conner et al. study. Another particularly relevant finding was that of Mednick et al.
(1983), mentioned in the introductory section of this chapter. Though Mednick and his
colleagues looked at the relationship between criminal convictions of biological fathers,
adoptive fathers and their adopted away sons and we looked at the biological and
adoptive mothers and all adopted offspring; both studies investigated the same data for
both the birth and adoptive parents—making them unique and very informative samples
to study. These results support the conclusion that individuals, males in particular, inherit
a biological vulnerability toward problem behavior development from their birth parents.

38
However, neither of these studies helps to explain why biological mothers’
defiance would predict behavior problems in their sons but not their daughters. One
explanation may lie in the typical measurement of externalizing behaviors. While the
Index of Problem Behaviors, as well as other previously validated measures of
externalizing, antisocial behaviors, tapped into what is typically thought of as problem
behaviors, many of the items may be measuring more typical male externalizing
behaviors—especially during adolescence. Some researchers of gender differences in
aggressive behaviors have found that male and female aggressions tend to take different
forms. Specifically, males have been found to aggress with more direct physical and
verbal methods, while females tend to act out using more indirect, relational aggression,
such as gossip (Coyne, Archer, & Eslea, 2006). Therefore, it is possible that had the IPB
included items capturing the use of gossip, correlations between birth mother Pd T-scores
and female adoptees’ behavior may have been higher. Future research using a
longitudinal behavior genetic design and measures including more female-typical forms
of aggression would be informative in answering this question.
Environmental Risk for Problem Behavior Development
To test the hypothesis that the psychosocial functioning and deviant tendencies of
the adoptive mothers would render adopted children vulnerable toward problem behavior
development, the same set of linear regressions were run using the adoptive mothers’
psychosocial characteristics as predictors of behavioral outcomes across the life span. In
the childhood model using adoptive mothers’ MMPI sub-scale T-scores as predictors of
childhood IPB percent scores, a significant relationship between the adoptive mothers’
functioning and the behavioral tendencies of the adoptees emerged. Specifically, adoptees
with more problem behaviors during childhood had adoptive mothers who displayed
fewer problems with hypochondriasis (physical complaints of illness in the absence of
medical proof). In addition, when investigating the role of birth and adoptive mothers’
general psychosocial functioning on adulthood problem behavior development, the IQ of

39
the adoptive mothers was found to have a positive effect—suggesting that adoptees with
brighter adoptive mothers were more likely to develop problem behaviors during
adulthood. There were no specific predictions with regard to the effects of the adoptive
mothers’ specific areas of deficit. But it was predicted that if there was an association
between adoptive mothers’ psychosocial functioning and the adoptees problem behavior
development it would only occur during the childhood years. This expectation was
realized. Thus, while some significant relations between adoptive mothers’ adaptation
and problem behavior development in their adopted children, the relationships found may
not prove viable in future attempts at replication.
There are a number of possible reasons for finding a positive association between
adoptive mother’s characteristics and problem behavior development in their adopted
children. First, adoptive mothers’ levels of psychological functioning could be
influencing problem behavior development in their adopted children. This conclusion
would be consistent with the socialization hypothesis, that individuals develop behavioral
tendencies based on their environment (Bandura, Ross, & Ross, 1961). However, the
results from the adoptive parent-child correlation for Pd, which yielded correlations of
essentially zero, do not support this conclusion. Second, children with a lot of problem
behaviors may cause their adopted mothers to have more problems with their own
psychosocial and behavioral adjustment. This conclusion would be consistent with
findings from Finley and Aguiar (2002) that adoptive parents’ levels of psychological
functioning are negatively affected by the ill behaviors of their adopted children.
However, the effect found here, that adoptive mothers who had fewer problems with
hypochondriasis had adopted children with more problem behaviors, is in the opposite
direction than would be expected if the adopted children were negatively influencing the
psychosocial well-being of the adoptive mothers. In addition, the adoptive mothers were
measured at Time 1, before most of the problem behaviors had appeared. Therefore,
parental response to child pathology does not appear to be a plausible explanation for the
results found here.

40
Finally, the trend observed in this analysis, between adoptive mother
characteristics and problem behaviors in their adopted children might be an artifact of the
method of data collection. Recall that the Index of Problem Behaviors was coded based
on the interviews with the parents of the adopted children. It might be the case that the
characteristics of the parents who agreed to the Time 3 interview biased the way in which
the adopted children were viewed. One way to address the possibility of obtaining these
results due to selective attrition would be to test whether those parents who did not agree
to be interviewed (or could not be located) at Time 3 were different from those who did.
Table 2.17 presents a series of post hoc t-tests assessing mean differences in the
characteristics of the adopted children, their biological mothers, the adoptive mothers and
their ratings of the adopted children (taken during Times 1 and 2) between families who
took part in the Time 3 interviews and those who did not. It does appear that the parents
who consented to an interview in the time 3 data collection phase of the Texas Adoption
Project were different in some respects from those who did not. Wealthier adoptive
parents and smarter and more educated mothers were more likely to grant us an interview
than those who did not. In addition, the parents who participated had children with less
deviant biological mothers. These results indicate that there was some amount of
selective attrition going on, and that it was influenced by the characteristics of the
adoptive parents. However, since there did not appear to be any significant differences in
the way the adoptive mothers rated their children during childhood and adolescence, it
seemed unlikely that mothers of particularly “good” or particularly “bad” kids chose to
participate.
Limitations
One possible limitation of this investigation is the validity of the measure of
problem behavior. Though the results from the correlations between prior,
contemporaneous mother ratings and the rating from the three independent raters
provided evidence of congruent validity for the use of the IPB scales, and the t-tests

41
comparing interviewed to non-interviewed families did not appear to invalidate the use of
the latent measure of problem behaviors, the reliability of the childhood scale was less
than 0.70. Perhaps other researchers who are interested in tracking the inheritance of
behavior problems using interviews or questionnaire methodologies could benefit from
using a previously validated measure of behavior problems, such as Achenbach’s (1991)
Child Behavior Checklist, or use a clinically diagnostic inventory. This would be
especially helpful when attempting to assess childhood problem behaviors. In addition,
most items on the Index of Problem Behaviors were positively skewed. While most
participants scored on the low end of the distribution on the items, most statistical
procedures are robust enough to handle skewness (Graziano & Raulin, 2004), especially
when all the items are skewed in the same direction. It is also relevant to note that
skewness for item endorsement is typical in other measures of problem behaviors, such as
the Child Behavior Checklist, and that adopted samples tend to have similarly skewed
distributions to non-adopted samples (Moffitt, 2005).
Finally, with regard to the potential limitations of the Index of Problem Behavior,
a review of Appendix 2C reveals that each item was most often rated as “not indicated.”
Items rated in this way should not be interpreted as not having occurred. The raters
simply had to check “not indicated” when there was no mention of the behavior in the
interview notes. It is possible, even probable, that individuals actually participated in a
number of behaviors that the raters had no knowledge of. In a number of cases, for
example, parents reported that their child used a lot of drugs during their teen years, but
made no specific mention of his or her alcohol use. While it is likely that one who uses a
lot of drugs also drinks alcohol, the independent raters and I made no assumptions and, in
instances like these, marked “not indicated” for alcohol use. Scores on the IPB should
therefore be viewed as conservative estimates of problem behavior among the
participants of the Texas Adoption Project.
As is always an issue with longitudinal investigations, the Texas Adoption Project
was only able to locate and interview a little over 55 percent of the original 300 families.
While the sample of families who agreed to the Time 3 interview did not appear to differ

42
based on the personality of their children, they did systematically differ on the amount of
education obtained by the adoptive mothers, the adoptive mothers’ Beta IQ scores, and
the adoptive families’ SES. In addition, the adoptees in the families we interviewed had
birth mothers with lower Pd T-scores than those whose parents declined an interview or
could not be located. Therefore, it is possible that we missed out on the opportunity to
interview families with children who displayed more severe problem behaviors. The
inclusion of those individuals, however, would likely have strengthened the results, rather
than weakened them.
It is also possible that selective placement, on the part of the adoption agency,
may have influenced the ability to detect true effects. For example, if the agency
attempted to place infants from the less troublesome birthmothers into the wealthier or
more educated families, restriction of range in the predictors (i.e., limited range in SES or
maternal education) could keep significant effects from being detected. In fact, a slight
negative correlation (r= -.18, p= .001, N= 350) between adopted parents’ SES and
birthmothers’ Pd scores was found to exist. Although the relationship is relatively small,
it is possible that the genetic effects found in the analyses presented in this chapter were
underestimated due to restriction of range.
Despite these limitations, the current investigation did find a link between
measures of problem behavior tendencies of the biological mothers and the amount of
problem behaviors displayed by their adopted away offspring from childhood through
mid-adulthood. This connection appears to get stronger with age, but may be confined to
males.
Future Research
With the establishment of a genetic relationship between maternal antisocial
tendencies and offspring behavior problems it is possible to look for potential protective
factors that decrease the likelihood for high-risk individuals to develop externalizing,
antisocial behaviors across the life span. One possibility would be to investigate the
ability of the adoptive environment, given the advantages that it confers on the adoptees

43
as far as access to educational and emotional resources, to act as a buffer between
biological vulnerability and the actual display of problem behaviors. This could be done
in several ways. First, trajectories of problem behavior development could be estimated.
These trajectories could then be used to compare the relative changes in problem
behaviors across the lifespan between adoptees and biological children within the same
families. In this way it could be determined whether the genetic, or environmental,
factors are associated with the stability and change in problem behaviors over time. For
example, trajectories of problem behavior development could be plotted separately for
both adopted children and children reared by their biological parents to determine
whether both samples have similar patterns of development. Then intraclass correlations
could be run between biologically related siblings and biologically unrelated siblings at
each stage of development to get a sense how alike people are, behaviorally speaking,
when they are reared in the same household but either share, or do not share, genes in
common. Finally, intraclass correlations on change scores between life stages between
biologically related and biologically unrelated siblings could be run to assess the degree
to which changes in problem behaviors throughout the life span are genetically or
environmentally influenced. This series of analyses is presented in Chapter Three of this
dissertation.
Another possible way in which the influence of the adoptive environment can be
investigated is presented in Chapter Four. In particular, the characteristics of the adoptees
and their families were used as predictors of problem behaviors. Models for higher-risk
(i.e., vulnerable) and lower-risk adoptees were run separately, with risk defined by the
birth mothers’ Pd T-scores. In this way, factors of the adoptive family environment were
investigated as potential protective factors for the development of problem behaviors
across the lifespan.

44
Table 2.1 T-tests for mean differences between adoptees from the Texas Adoption Project with and without available IQ Scores from their Birth Mothers.
Variables
Mean (SD) for
Adoptees with BM IQ Scores (N=181)
Mean (SD) for
Adoptees without BM IQ Scores
(N=346)
t value
Age (T1) Sex Wechsler IQ Extraversion (T1) Well-Socializd (T1) Em. Stability (T1) Extraversion (T2) Well-Socializd (T2) Em. Stability (T2) AM age AM Beta IQ AM education AM Pd T-score AP SES BM age BM Beta IQ BM Pd T-score
7.07 (2.31) 1.46 (0.50)
111.74 (11.50) 49.23 (7.62) 32.37 (7.04) 47.73 (6.05) 44.61 (8.02) 31.51 (8.22) 46.57 (6.14) 37.26 (4.80)
113.82 (7.69) 5.47 (1.24) 13.66 (3.36)
169.26 (23.12) 19.52 (3.65)
108.01 (8.97) 64.86 (10.47)
10.06 (4.07) 1.51 (0.50)
111.66 (10.79) 46.93 (8.83) 33.04 (6.90) 47.82 (6.07) 44.95 (8.54) 33.03 (7.24) 47.26 (6.23) 39.05 (4.87)
114.28 (6.38) 5.50 (1.19) 13.47 (2.95)
169.60 (22.08) 19.07 (3.45)
- 61.17 (9.28)
-8.211*** -0.944 -0.230
2.672** -0.849 -0.136 -0.316 -1.503 -0.870
-3.769*** -0.598 0.214 0.543 -0.139 0.489
- 1.187
Note: AM = adoptive mother, AP = adoptive parents, BM = biological mother, T1= Time 1, T2 = Time 2, Pd = MMPI psychopathic deviance scale. *p< .05, ***p< .001.

45
Table 2.2 Descriptive Statistics for the Childhood IPB Items and Total Raw Score.
Item Min. Max Mean (SD) Skewness
Type of student Rule abiding Phys. Aggres Tantrums Truant Petty theft Manipulative Lied Bullied others Cruelty to childrn Cruelty to anim Inap. sex behav Ran away Dx w/ disorder Tot. Child Score
0 0 0 0 0 0 0 0 0 0 0 0 0 0 0
3 3 3 3 3 3 3 3 3 2 2 2 2 2 18
0.91 (.833) 0.54 (.772) 0.11 (.501) 0.09 (.456) 0.02 (.234) 0.04 (.305) 0.07 (.439) 0.08 (.438) 0.08 (.407) 0.06 (.274) 0.06 (.229) 0.04 (.215) 0.05 (.224) 0.15 (.533) 2.29 (2.48)
0.64 1.56 4.88 5.55 10.24 7.80 6.19 60.7 5.53 4.71 3.91 6.45 4.97 3.18 2.57

46
Table 2.3 Items that make up the childhood and adolescent personality scales, as rated by the adoptive mothers during Time 1 and Time 2. Extraversion Warm-hearted
Happy-go-lucky Socially bold Unrestrained Critical (-)
Well-Socialized Conscientious
Controlled Careless of social rules (-) Frivolous (-) Unresponsive to threats (-) Affected by feelings (-)
Emotional Stability Emotionally stable
Tense (-) Apprehensive (-) Unfrustrated Complacent.
Note: items marked with a (-) indicate items that were reverse scored for scale construction.

47
Table 2.4 Correlations between Time 3 Index of Problem Behavior items and Time 1 mother rated personality scalesb. ________________________________________________________________________ Childhood Personality Scales Extraversion Well-
Socialized Emotional Stability
Childhood IPB Items Type of Student 0.06 -0.02 -0.02 Rule abiding (r) 0.05 -0.25*** -0.10 Physically aggressive 0.03 -0.20*** -0.05 Threw tantrums 0.00 -0.18** -0.22*** Truant from school 0.09 -0.11 0.05 Petty theft -0.06 -0.10 -0.08 Manipulative 0.11 -0.20** -0.08 Told lies -0.06 -0.07 -0.06 Bullied others 0.06 -0.19** -0.04 Cruelty to other children -0.06 -0.08 -0.02 Cruelty to animals a a a Inappropriate sexual behavior -0.06 0.05 -0.08 Ran away from home 0.02 -0.05 -0.01 Diagnosed with a disorder 0.05 -0.09 -0.13* Note: (r) indicates reverse coded items. a. no child with complete data reported to display this behavior, therefore, correlation estimate could not be calculated. b. (N= 164) limited to participants with complete data who were between 4-12 years-old at Time 1. * p< .05, ** p< 01, *** p< .001.

48
Table 2.5 Descriptive Statistics for the Adolescent IPB Items and Total Score.
Item Min. Max Mean (SD) Skewness Type of student Truant Rule abiding (r) Lied Physically Aggressive Verbally Aggressive Manipulative Snuck out Destruction of property Alcohol use Drug use Theft (major) Sex assault (perpetrator) Promiscuous Arson Self-mutilation # at fault car accidents # arrests # convictions # tickets/warrants # illegitimate pregnancy # ran away # suicide attempts Dx w/ disorder Tot. Teen Score
0 0 0 0 0 0 0 0 0 0 0 0 0 0 0 0 0 0 0 0 0 0 0 0 0
3 3 3 3 3 3 3 3 3 3 3 2 2 2 2 2 4 4 2 4 1 4 3 2 32
1.36 (.856) 0.12 (.515) 0.84 (.984) 0.17 (.650) 0.18 (.655) 0.17 (.629) 0.13 (.584) 0.33 (.839) 0.02 (.217) 0.37 (.863) 0.48 (.863) 0.15 (.481) 0.02 (.161) 0.09 (.356) 0.03 (.210) 0.04 (.283) 0.21 (.742) 0.09 (.383) 0.01 (.114) 0.13 (.624) 0.04 (.201) 0.12 (.592) 0.02 (.204) 0.13 (.496) 5.24 (5.44)
0.39 4.80 1.00 3.74 3.57 3.67 4.45 2.47 13.75 2.25 1.82 3.24 8.50 4.36 7.92 9.74 3.88 5.71 15.68 5.20 4.59 5.62 11.51 3.52 2.04
Note: (r) indicates reverse coded items, Dx=diagnosed

49
Table 2.6 Correlations between Time 3 adolescent Index of Problem Behavior items and Time 2 mother rated personality scalesb. ________________________________________________________________________ Adolescent Personality Scales Extraversion Well-
Socialized Emotional Stability
Adolescent IPB Items Type of Student -0.12 -0.31*** -0.40*** Truant from school -0.10 -0.29*** -0.23** Rule abiding (r) 0.04 -0.15 -0.11 Told lies 0.03 -0.29*** -0.14 Physically aggressive -0.06 -0.12 -0.19* Verbally Aggressive -0.09 -0.10 -0.14 Manipulative 0.05 -0.19* -0.13 Snuck out/stayed out past curfew 0.02 -0.12 -0.10 Destruction of property a a a Used alcohol 0.05 -0.08 -0.04 Used drugs -0.05 -0.22 -0.15 Theft -0.07 -0.27*** -0.17* Sexual assault (perpetrator) -0.02 -0.08 -0.03 Promiscuous -0.02 -0.07 -0.03 Incidence of arson a a a Incidence of self mutilation a a a # of at fault car accidents 0.00 -0.09 -0.04 # of arrests -0.10 -0.03 -0.02 # of convictions 0.12 0.06 0.24** # of tickets/warrants 0.08 -0.07 -0.04 # of illegitimate pregnancies -0.2 0.00 0.01 # of time ran away -0.08 -0.30*** -0.20* # of suicide attempts -0.17* -0.06 -0.16* Diagnosed with a disorder 0.09 -0.17* -0.02 Note: (r) indicates reverse coded items. a. no child with complete data reported to display this behavior, therefore, correlation estimate could not be calculated. b. (N= 142) limited to participants with complete data who were between 13-19 years-old at Time 2. * p< .05, ** p< 01, *** p< .001.

50
Table 2.7 Descriptive Statistics for the Adulthood IPB Items and Total Score.
Item Min. Max Mean (SD) Skewness
Physical Aggression Verbal Aggression Tells lies Manipulative Destruction of property Alcohol use Drug use Gambling Theft (major) Sex assault (perpetrator) Promiscuous Arson Self-mutilation Child abandon Child abuse Adultery Check/credit fraud # divorces # illegitimate pregnancy # at fault car ac. # arrests # convictions # tickets/warrants # suicide attempts Diagnosed w/ disorder Tot. Adult Score
0 0 0 0 0 0 0 0 0 0 0 0 0 0 0 0 0 0 0 0 0 0 0 0 0 0
3 3 3 3 3 3 3 3 2 4 2 2 2 2 2 2 2 4 4 4 4 4 4 3 4 27
0.09 (.443) 0.11 (.517) 0.09 (.491) 0.12 (.565) 0.01 (.155) 0.26 (.791) 0.21 (.702) 0.01 (.186) 0.06 (.337) 0.03 (.246) 0.05 (.298) 0.01 (.115) 0.01 (.115) 0.04 (.045) 0.02 (.185) 0.02 (.185) 0.07 (3.65) 0.30 (.640) 0.06 (.345) 0.05 (.344) 0.09 (.462) 0.04 (.320) 0.06 (.431) 0.02 (.199) 0.23 (.677) 2.10 (4.13)
5.61 4.82 5.52 4.75 19.37 2.93 3.36 14.41 5.32 12.42 6.24 8.52 8.52 6.66 8.54 8.54 4.89 2.52 7.30 8.66 5.91 10.65 7.77 10.92 2.80 3.04

51
Table 2.8 Average MMPI sub-scale T-scores for the biological and adoptive mothers from the Texas Adoption Project.
MMPI Sub-Scale
Biological Mothers (n=181)
Adoptive Mothers (n=246)
Correlation Between AM and
BM Scores Hs*** D*** Hy
Pd** Pa*** Pt*** Sc*** Ma***
Psychosocial Index***
53.4 56.8 57.8 66.0 59.9 58.9 60.6 59.1 0.51
50.3 50.6 55.6 53.0 54.7 52.1 51.3 51.6 0.20
0.19** 0.05 0.01 0.19* -0.07
0.21** 0.04 0.00 0.13*
Note: The normative T-score on all subscales is 50. Hs=hypochondriasis, D=depression, Hy= hysteria, Pd= psychopathic deviate, Pa= paranoia, Pt= psychasthenia, Sc= schizophrenia, Ma= hypomania, BM= biological mothers, AM= Adoptive mothers. N for correlations was 178. Asterisks next to the Sub-scale labels indicate significant differences in the mean scores between the Biological and Adoptive mothers’ scores. *p < .05, **p < .01, ***p< .001.
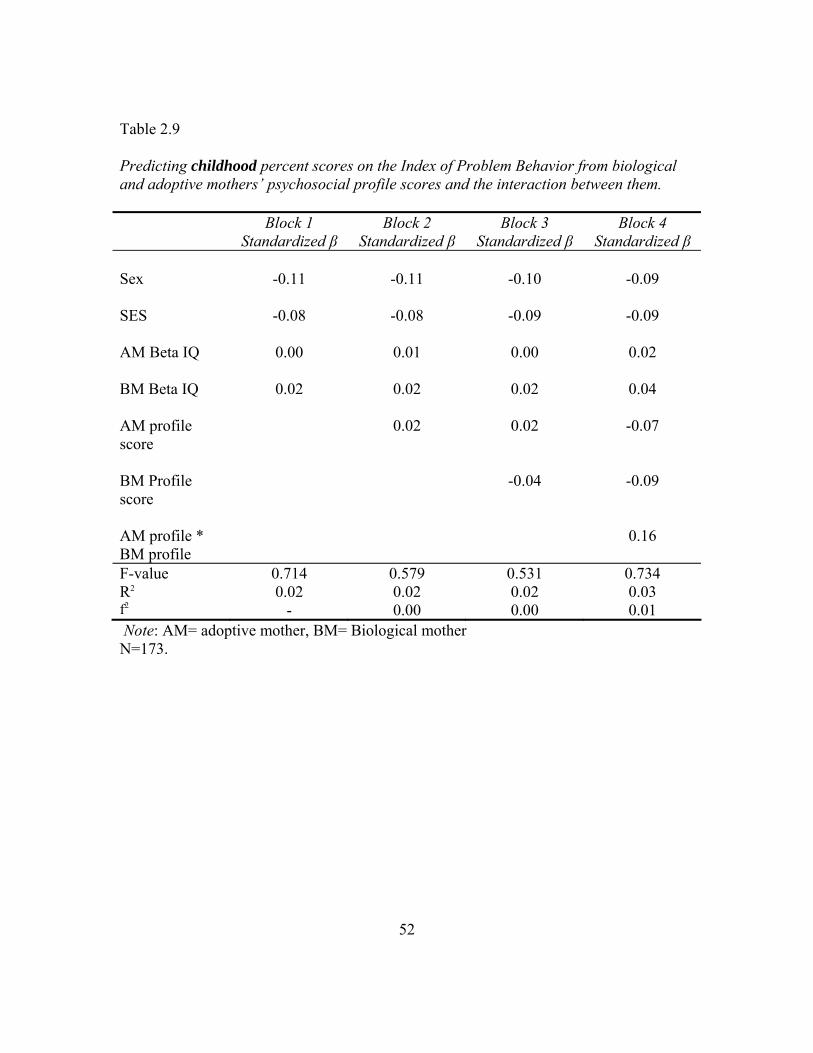
52
Table 2.9 Predicting childhood percent scores on the Index of Problem Behavior from biological and adoptive mothers’ psychosocial profile scores and the interaction between them. Block 1
Standardized β Block 2
Standardized β Block 3
Standardized β Block 4
Standardized β Sex SES AM Beta IQ BM Beta IQ AM profile score BM Profile score AM profile * BM profile
-0.11
-0.08
0.00
0.02
-0.11
-0.08
0.01
0.02
0.02
-0.10
-0.09
0.00
0.02
0.02
-0.04
-0.09
-0.09
0.02
0.04
-0.07
-0.09
0.16
F-value R2
f2
0.714 0.02
-
0.579 0.02 0.00
0.531 0.02 0.00
0.734 0.03 0.01
Note: AM= adoptive mother, BM= Biological mother N=173.

53
Table 2.10 Model predicting adolescent percent score on the Index of Problem Behavior from biological and adoptive mothers’ psychosocial profile scores and the interaction between them. Block 1
Standardized β Block 2
Standardized β Block 3
Standardized β Block 4
Standardized β Sex SES AM Beta IQ BM Beta IQ AM profile score BM Profile score AM profile * BM profile
-0.04
0.04
0.11
0.04
-0.04
0.04
0.13
0.04
0.12
-0.05
0.06
0.14
0.04
0.10
0.11
-0.05
0.06
0.14
0.05
0.09
0.10
0.02
F-value R2
f2
0.964 0.02
1.232 0.04 0.02
1.347 0.05 0.01
1.153 0.05 0.00
Note: AM= adoptive mother, BM= Biological mother N=174.

54
Table 2.11 Model predicting adulthood percent score on the Index of Problem Behavior from biological and adoptive mothers’ psychosocial profile scores and the interaction between them. Block 1
Standardized β Block 2
Standardized β Block 3
Standardized β Block 4
Standardized β Sex SES AM Beta IQ BM Beta IQ AM profile score BM Profile score AM profile * BM profile
-0.01
0.01
0.13
0.03
0.00
0.00
0.16*
0.03
0.15
-0.01
0.03
0.16*
0.03
0.13
0.16*
-0.01
0.03
0.16*
0.03
0.13
0.16
-0.01
F-value R2
f2
0.841 0.02
1.415 0.04 0.02
1.876 0.06 0.02
1.160 0.06 0.00
Note: AM= adoptive mother, BM= Biological mother N=173. * p < .05.

55
Table 2.12 Model predicting problem behaviors across the life span from biological mothers’ MMPI sub-scale T-scores. Childhood Adolescence Adulthood Block 1
Stand. β Block 2 Stand. β
Block 1 Stand. β
Block 2 Stand. β
Block 1 Stand. β
Block 2 Stand. β
Controls Sex SES AM Beta IQ BM Beta IQ AM profile score
-0.10
-0.09
0.01
0.05
0.03
-0.09
-0.14
0.00
0.06
0.00
0.01
0.01
0.16
0.02
0.16*
0.00
-0.01
0.17*
0.03
0.17*
-0.04
0.05
0.13
0.05
0.13
-0.04
0.03
0.13
0.03
0.11
MMPI Sub-Scale T-scores Hs D Hy Pd Pa Pt Sc Ma
-0.05
-0.11
-0.13
0.21*
-0.19
0.10
0.05
-0.07
-0.02
-0.04
-0.02
0.27**
0.03
0.03
-0.06
0.01
-0.04
-0.13
0.04
0.26**
-0.13
0.07
-0.05
0.010
F-value R2
f2
0.627 0.02
-
1.117 0.09 0.08
1.409 0.04
-
1.292 0.10 0.07
1.302 0.04
-
1.492 0.12 0.09
Note: AM=adoptive mother, BM=biological mother, Hs=hypochondriasis, D=depression, Hy=hysteria, Pd=psychopathic deviate, Pa=paranoia, Pt= psychasthenia, Sc=Schizophrenia, Ma=Hypomania. N=163 for childhood model, 162 for adolescent model, and 161 for adulthood model.

56
Table 2.13 Model predicting problem behaviors across the life span from adoptive mothers’ MMPI sub-scale T-scores. Childhood Adolescence Adulthood Block 1
Stand. β Block 2 Stand. β
Block 1 Stand. β
Block 2 Stand. β
Block 1 Stand. β
Block 2 Stand. β
Controls Sex SES AM Beta IQ BM Beta IQ BM profile score
-0.10
-0.08
0.00
0.02
-0.04
-0.10
-0.12
0.03
-0.01
-0.05
-0.05
0.06
0.12
0.05
0.12
-0.04
0.07
0.15
0.05
0.12
-0.02
0.04
0.14
0.03
0.17*
0.00
0.02
0.17*
0.02
0.16*
MMPI Sub-Scale T-scores Hs D Hy Pd Pa Pt Sc Ma
-0.24*
0.14
0.04
0.10
0.03
-0.08
-0.04
0.16
0.00
0.07
-0.19
0.00
-0.03
0.09
0.11
0.03
-0.07
0.14
-0.03
0.10
0.06
-0.19
0.09
0.10
F-value R2
F2
0.622 0.02
-
1.034 0.08 0.07
1.432 0.04
-
1.289 0.10 0.07
1.681 0.05
-
1.139 0.09 0.04
Note: AM=adoptive mother, BM=biological mother, Hs=hypochondriasis, D=depression, Hy=hysteria, Pd=psychopathic deviate, Pa=paranoia, Pt= psychasthenia, Sc=Schizophrenia, Ma=Hypomania. N=175 for childhood model, 174 for adolescent model, and 173 for adulthood model.

57
Table 2.14 Pearson product moment correlations between adoptees problem behavior development and indicators of psychopathic deviance in their biological and adoptive mothers. MMPI Psychopathic Deviancy T-scores Birth Mothers (N=181) Adoptive Mothers (N=246) IPB raw scores during Childhood 0.08 0.03 Adolescence 0.17* 0.04 Adulthood 0.25** 0.03 * p< .05, **p< .01 Table 2.15 Pearson product moment correlations between male adoptees problem behavior development and indicators of psychopathic deviance in their biological and adoptive mothers. MMPI Psychopathic Deviancy T-scores Birth Mothers (N=98) Adoptive Mothers (N=130) IPB raw scores during Childhood 0.16 0.02 Adolescence 0.22* -0.03 Adulthood 0.45*** 0.04 * p< .05, ***p< .001 Table 2.16 Pearson product moment correlations between female adoptees problem behavior development and indicators of psychopathic deviance in their biological and adoptive mothers. MMPI Psychopathic Deviancy T-scores Birth Mothers (N=83) Adoptive Mothers (N=116) IPB raw scores during Childhood 0.02 0.05 Adolescence 0.13 0.11 Adulthood 0.08 0.03 * p< .05, **p< .01

58
Table 2.17 T-tests for mean differences between Texas Adoption Project participants whose parents did or did not participate in the Time 3 interview.
Variables
Mean (SD) for Ss
with Time 3 Interview (N=358)
Mean (SD) for Ss without Time 3
Interview (N=306)
t value
Age 8.51 (3.60) 8.00 (3.69) -1.746 Sex 1.49 (0.50) 1.45 (0.50) -1.022 Wechsler IQ 111.71 (11.15) 111.39 (11.92) -0.343 Extraversion (T1) 47.51 (8.23) 48.51 (7.78) 1.524 Well-socialized (T1) 32.67 (6.98) 32.48 (5.99) -0.362 Emotional Stability (T1)
47.77 (6.05) 48.51 (7.78) 1.466
Extraversion (T2) 44.77 (8.25) 45.36 (8.67) 0.652 Well-socialized (T2) 32.22 (7.80) 31.81 (7.69) -0.489 Emotional Stability (T2)
46.90 (6.18) 47.79 (6.88) 1.296
AM age 37.66 (4.86) 37.44 (4.89) -0.586 AM Beta IQ 114.05 (7.07) 111.50 (7.62) 4.421*** AM education 5.49 (1.21) 5.20 (1.21) -3.006** AM occupation 4.53 (2.56) 4.27 (2.34) -1.345 AP SES 169.43 (22.58) 162.51 (26.81) -3.563*** AM Pd t-score 52.98 (7.88) 52.95 (8.29) 0.160 BM Beta IQ 108.01 (8.97) 109.26 (8.72) -1.342 BM Pd t-score 64.61 (10.42) 67.46 (12.51) -2.322* Note: AM = adoptive mother, AP = adoptive parents, BM = biological mother, T1= Time 1, T2 = Time 2, Pd = MMPI psychopathic deviance scale. *p< .05, ***p< .001.

59
Appendix 2A
List of Interview Probes
Please write down for us the full names and birthdates of each of your children from oldest to youngest. Beginning with your oldest child, Jimmy, how old was he when you brought him home (if they then said this was a natural child we inquired about the delivery/term of pregnancy) As an INFANT: Was he a good sleeper, eater? Did he have any unusual illnesses/health problems? Did he cry a lot? How would you describe him as a baby, fairly easy, difficult, or somewhere in between? As a TODDLER: Some babies, when you hold them, mold themselves to you and appear to enjoy the contact. Other babies squirm, go rigid, or cry when held? In general, how would you say Jimmy was when you held and tried to cuddle with him? How active was he as a toddler? Was he a risk taker or was he cautious as a toddler? Was he a climber? When he was about 3 years old and playing with same age friends would you say he more often led the activities or follow what the other children were doing? CHILDHOOD: Did he go to Kindergarten? How was he on his first day of school? Was he clingy, tearful or was he ready to go? In grade school, what kind of student was he? Did he like school? Did he participate in any extra-curricular activities? Did he have a favorite subject? Did he have any problems with friends or teachers? Did he have a lot of friends or one or two close friends he always played with? How about Junior High? Type of student, extracurricular activities, favorite subjects? ADOLESCENCE: Once he was in high school (same as above), what percentile of his class did he graduate in? Did he have a lot of friends or one or two close friends he always hung around with? How old was he when he started dating? Did he date a lot? Any problems during his adolescent years with behavior?

60
List of Interview Probes Cont.,
ADOLESCENCE cont., Did he drink alcohol? Do any drugs? Was there ever any problem with the law? How old when got drivers license? Car? Any major car accidents? Were they his fault? Any tickets? Did he ever sneak out at night or stay out past curfew? Did he work while he was in HS? What did he do after graduation? ADULTHOOD: Did he ever marry? If no, was he ever close? Is he still married? Ever Divorced Has he changed jobs frequently? Does he still have problems with (something named during adolescent period)? How often would you say he drinks alcohol? Does he have any children? What kind of father is he? Would you describe him as a responsible, mature person? What would you say is his best quality? His worst? Anything else you would like us to know? The same series of questions was then asked of the subsequent children, going from oldest to youngest. Each interview took approximately 45 minutes per child to complete.
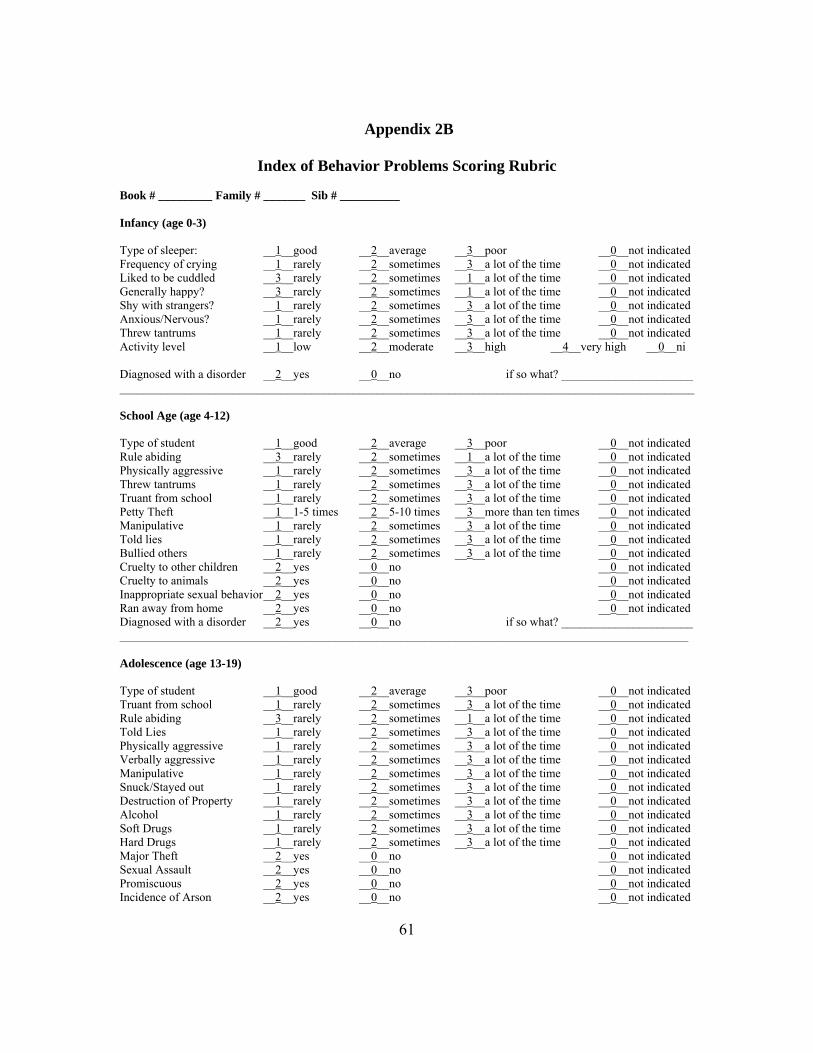
61
Appendix 2B
Index of Behavior Problems Scoring Rubric Book # _________ Family # _______ Sib # __________ Infancy (age 0-3) Type of sleeper: __1__good __2__average __3__poor __0__not indicated Frequency of crying __1__rarely __2__sometimes __3__a lot of the time __0__not indicated Liked to be cuddled __3__rarely __2__sometimes __1__a lot of the time __0__not indicated Generally happy? __3__rarely __2__sometimes __1__a lot of the time __0__not indicated Shy with strangers? __1__rarely __2__sometimes __3__a lot of the time __0__not indicated Anxious/Nervous? __1__rarely __2__sometimes __3__a lot of the time __0__not indicated Threw tantrums __1__rarely __2__sometimes __3__a lot of the time __0__not indicated Activity level __1__low __2__moderate __3__high __4__very high __0__ni Diagnosed with a disorder __2__yes __0__no if so what? ______________________ ________________________________________________________________________________________________ School Age (age 4-12) Type of student __1__good __2__average __3__poor __0__not indicated Rule abiding __3__rarely __2__sometimes __1__a lot of the time __0__not indicated Physically aggressive __1__rarely __2__sometimes __3__a lot of the time __0__not indicated Threw tantrums __1__rarely __2__sometimes __3__a lot of the time __0__not indicated Truant from school __1__rarely __2__sometimes __3__a lot of the time __0__not indicated Petty Theft __1__1-5 times __2__5-10 times __3__more than ten times __0__not indicated Manipulative __1__rarely __2__sometimes __3__a lot of the time __0__not indicated Told lies __1__rarely __2__sometimes __3__a lot of the time __0__not indicated Bullied others __1__rarely __2__sometimes __3__a lot of the time __0__not indicated Cruelty to other children __2__yes __0__no __0__not indicated Cruelty to animals __2__yes __0__no __0__not indicated Inappropriate sexual behavior __2__yes __0__no __0__not indicated Ran away from home __2__yes __0__no __0__not indicated Diagnosed with a disorder __2__yes __0__no if so what? ______________________ _______________________________________________________________________________________________ Adolescence (age 13-19) Type of student __1__good __2__average __3__poor __0__not indicated Truant from school __1__rarely __2__sometimes __3__a lot of the time __0__not indicated Rule abiding __3__rarely __2__sometimes __1__a lot of the time __0__not indicated Told Lies __1__rarely __2__sometimes __3__a lot of the time __0__not indicated Physically aggressive __1__rarely __2__sometimes __3__a lot of the time __0__not indicated Verbally aggressive __1__rarely __2__sometimes __3__a lot of the time __0__not indicated Manipulative __1__rarely __2__sometimes __3__a lot of the time __0__not indicated Snuck/Stayed out __1__rarely __2__sometimes __3__a lot of the time __0__not indicated Destruction of Property __1__rarely __2__sometimes __3__a lot of the time __0__not indicated Alcohol __1__rarely __2__sometimes __3__a lot of the time __0__not indicated Soft Drugs __1__rarely __2__sometimes __3__a lot of the time __0__not indicated Hard Drugs __1__rarely __2__sometimes __3__a lot of the time __0__not indicated Major Theft __2__yes __0__no __0__not indicated Sexual Assault __2__yes __0__no __0__not indicated Promiscuous __2__yes __0__no __0__not indicated Incidence of Arson __2__yes __0__no __0__not indicated

62
Index of Behavior Problems Scoring Rubric continued..,
Adolescence continued.., Incidents of self-mutilation __2__yes __0__no __0__not indicated Number of “at fault” car accidents _0-4_ Number of arrests _0-4_ Number of convictions _0-4_ Number of ticketable offenses (class B misdemeanor or above) _0-4_ Number of Illegitimate Pregnancies _0-4_ Number of times ran away from home _0-4_ Number of suicide attempts _0-4_ Diagnosed with a disorder __2__yes __0__no if so what? ______________________ ________________________________________________________________________________________________ Adulthood (age 20 and up) Physically aggressive __1__rarely __2__sometimes __3__a lot of the time __0__not indicated Verbally aggressive __1__rarely __2__sometimes __3__a lot of the time __0__not indicated Told lies __1__rarely __2__sometimes __3__a lot of the time __0__not indicated Manipulative __1__rarely __2__sometimes __3__a lot of the time __0__not indicated Destruction of Property __1__rarely __2__sometimes __3__a lot of the time __0__not indicated Used Alcohol __1__rarely __2__sometimes __3__a lot of the time __0__not indicated Used Drugs __1__rarely __2__sometimes __3__a lot of the time __0__not indicated Gambled __1__rarely __2__sometimes __3__a lot of the time __0__not indicated Major Theft __2__yes __0__no __0__not indicated Sexual Assault (perp) __2__yes __0__no __0__not indicated Promiscuous __2__yes __0__no __0__not indicated Incidence of Arson __2__yes __0__no __0__not indicated Incidents of self-mutilation __2__yes __0__no __0__not indicated Child Abandonment __2__yes __0__no __0__not indicated Child Abuse (accused, caught or convicted) __2__yes __0__no __0__not indicated Adultery (accused, caught, or admitted) __2__yes __0__no __0__not indicated Check or Credit Fraud __2__yes __0__no __0__not indicated Number of divorces _0-4_ Number of Illegitimate Pregnancies _0-4_ Number of “at fault” car accidents _0-4_ Number of arrests _0-4_ Number of convictions _0-4_ Number of ticketable offenses (class B misdemeanor or above) _0-4_ Number of suicide attempts _0-4_ Diagnosed with a disorder __2__yes __0__no if so what? ____________________ ______________________________________________________________________________________________ Please write any other major problem behaviors or events that are not indicated above and indicate the approximate age during which it/they occurred. ________________________________________________________________________________________________________________________________________________________________________________________________________________________________________________________________________________________________________________________________________________________________________________________________________________________________________________________________________________________________________________________________________________________________________________________________

63
Appendix 2C
Index of Behavior Problems Rating Frequencies Book # _________ Family # _______ Sib # __________ Infancy (age 0-3) Type of sleeper: __78__good __16__average __24__poor _267_not indicated Frequency of crying __16__rarely __14__sometimes __18__a lot of the time _333_not indicated Liked to be cuddled __59__rarely __19__sometimes _159_a lot of the time _144_not indicated Generally happy? __13__rarely __5__sometimes __73_a lot of the time _290_not indicated Shy with strangers? __41__rarely __4__sometimes __18_a lot of the time _308_not indicated Anxious/Nervous? __9__rarely __4__sometimes __6__a lot of the time _362_not indicated Threw tantrums __5__rarely __2__sometimes __6__a lot of the time _368_not indicated Activity level __2__low __27__moderate __40__high __34__very high _278_ni Diagnosed with a disorder __7__yes _374_no if so what? ______________________ ________________________________________________________________________________________________ School Age (age 4-12) Type of student _165_good __65__average __17__poor _134_not indicated Rule abiding __16_rarely __18__sometimes _121_a lot of the time _226_not indicated Physically aggressive __8__rarely __5__sometimes __8__a lot of the time _360_not indicated Threw tantrums __7__rarely __3__sometimes __7__a lot of the time _364_not indicated Truant from school __0__rarely __3__sometimes __1__a lot of the time _377_not indicated Petty Theft __2__1-5 times __4__5-10 times __2__more than ten times _373_not indicated Manipulative __0__rarely __3__sometimes __7__a lot of the time _371_not indicated Told lies __4__rarely __2__sometimes __7__a lot of the time _368_not indicated Bullied others __2__rarely __9__sometimes __3__a lot of the time _367_not indicated Cruelty to other children __3__yes __18__no _360_not indicated Cruelty to animals __0__yes __21__no _360_not indicated Inappropriate sexual behavior __2__yes __1__no _369_not indicated Ran away from home __1__yes __16__no _364_not indicated Diagnosed with a disorder __2__yes __0__no if so what? ______________________ ________________________________________________________________________________________________ Adolescence (age 13-19) Type of student _190_good __96__average __46__poor __49_not indicated Truant from school __9__rarely __4__sometimes __9__a lot of the time _359_not indicated Rule abiding __40_rarely __38_sometimes _123_a lot of the time _180_not indicated Told Lies __5__rarely __8__sometimes __15_a lot of the time _353_not indicated Physically aggressive __6__rarely __11_sometimes __14_a lot of the time _350_not indicated Verbally aggressive __6__rarely __12_sometimes __12_a lot of the time _351_not indicated Manipulative __3__rarely __4__sometimes __13_a lot of the time _361_not indicated Snuck/Stayed out __15_rarely __17_sometimes __25_a lot of the time _324_not indicated Destruction of Property __0__rarely __0_sometimes __2__a lot of the time _379_not indicated Used Alcohol __25_rarely __19_sometimes __26_a lot of the time _311_not indicated Used Drugs __66_rarely __22_sometimes __24_a lot of the time _269_not indicated Major Theft __20_yes __16_no _345_not indicated Sexual Assault (perp) __1__yes __6__no _374_not indicated Promiscuous __9__yes __15_no _357_not indicated Incidence of Arson __3__yes __0__no _378_not indicated Incidents of self-mutilation __2__yes __0__no _379_not indicated

64
Index of Behavior Problems Rating Frequencies continued.., Adolescence continued.., Number of “at fault” car accidents 346= 0, 10= 1, 13= 2, 4= 3, 8= 4 Number of arrests 354= 0, 22= 1, 3= 2, 1= 3, 1= 4 Number of convictions 379= 0, 1= 1, 1= 2, 0= 3, 0= 4 Number of ticketable offenses (class B misdemeanor or above) 364= 0, 2= 1, 5= 2, 4= 3, 6= 4 Number of Illegitimate Pregnancies 365= 0, 16= 1, 0= 2, 0= 3, 0= 4Number of times ran away from home 359= 0, 11= 1, 4= 2, 0= 3, 7= 4 Number of suicide attempts 376= 0, 3= 1, 1= 2, 1= 3, 0= 4 Diagnosed with a disorder __25__yes _356_no If so what? ______________________ ________________________________________________________________________________________________ Adulthood (age 20 and up) Physically aggressive __6__rarely __4__sometimes __6__a lot of the time _359_not indicated Verbally aggressive __8__rarely __4__sometimes __9__a lot of the time _354_not indicated Told lies __0__rarely __3__sometimes __9__a lot of the time _363_not indicated Manipulative __4__rarely __1__sometimes __13_a lot of the time _357_not indicated Destruction of Property __0__rarely __0__sometimes __1__a lot of the time _374_not indicated Used Alcohol __7__rarely __9__sometimes __24_a lot of the time _335_not indicated Used Drugs __11_rarely __7__sometimes __18_a lot of the time _339_not indicated Gambled __0__rarely __1__sometimes __1__a lot of the time _373_not indicated Major Theft __10_yes __4__no _361_not indicated Sexual Assault (perp) ____yes ____no ____not indicated Promiscuous __8__yes __2__no _365_not indicated Incidence of Arson __0__yes __5__no _370_not indicated Incidents of self-mutilation __0__yes __5__no _370_not indicated Child Abandonment __4__yes __7__no _364_not indicated Child Abuse (accused, caught or convicted) __2__yes __5__no _368_not indicated Adultery (accused, caught, or admitted) __2__yes __5__no _368_not indicated Check or Credit Fraud __12_yes __4__no _359_not indicated Number of divorces 289= 0; 66= 1; 13= 2; 6= 3; 1=4 Number of Illegitimate Pregnancies 358= 0; 13= 1; 2= 2; 1= 3; 1= 4 Number of “at fault” car accidents 367= 0; 3= 1; 2= 2; 2= 3; 1= 4 Number of arrests 356= 0; 9= 1; 6= 2; 2= 3; 2= 4 Number of convictions 366= 0; 7=1; 0= 2; 0= 3; 2= 4 Number of ticketable offenses (class B misdemeanor or above) 366= 0; 2= 1; 3= 2; 1= 3; 3= 4 Number of suicide attempts 368= 0; 6= 1; 0= 2; 1= 3; 0= 4 Diagnosed with a disorder __41_yes _333_no if so what? ____________________ ________________________________________________________________________________________________ ________________________________________________________________________________________________________________________________________________________________________________________________

65
Appendix 2D
Supplemental Analyses on Male Adoptees Only Table D.1 Predicting childhood percent scores on the Index of Problem Behavior from biological and adoptive mothers’ psychosocial profile scores and the interaction between them, for males only. Block 1
B (Std. Error) Block 2
B (Std. Error) Block 3
B (Std. Error) Block 4
B (Std. Error) SES AM Beta IQ BM Beta IQ AM profile score BM Profile score AM profile * BM profile
-0.10
0.04
0.08
-0.11
0.07
0.09
0.14
-0.11
0.07
0.09
0.14
-0.01
-0.12
0.09
0.09
0.05
-0.05
0.15
F-value R2
f2
0.395 0.01
-
0.732 0.03 0.02
0.580 0.03 0.00
0.609 0.04 0.01
Note: AM= adoptive mother, BM= Biological mother N=92.

66
Table D.2 Predicting adolescent percent scores on the Index of Problem Behavior from biological and adoptive mothers’ psychosocial profile scores and the interaction between them, for males only. Block 1
B (Std. Error) Block 2
B (Std. Error) Block 3
B (Std. Error) Block 4
B (Std. Error) SES AM Beta IQ BM Beta IQ AM profile score BM Profile score AM profile * BM profile
0.06
0.03
0.06
0.04
0.09
0.08
0.27*
0.05
0.10
0.09
0.26*
0.05
0.06
0.08
0.08
0.35*
0.10
-0.15
F-value R2
f2
0.364 0.01
-
1.941 0.08 0.08
1.583 0.08 0.00
1.453 0.09 0.01
Note: AM= adoptive mother, BM= Biological mother N=91.
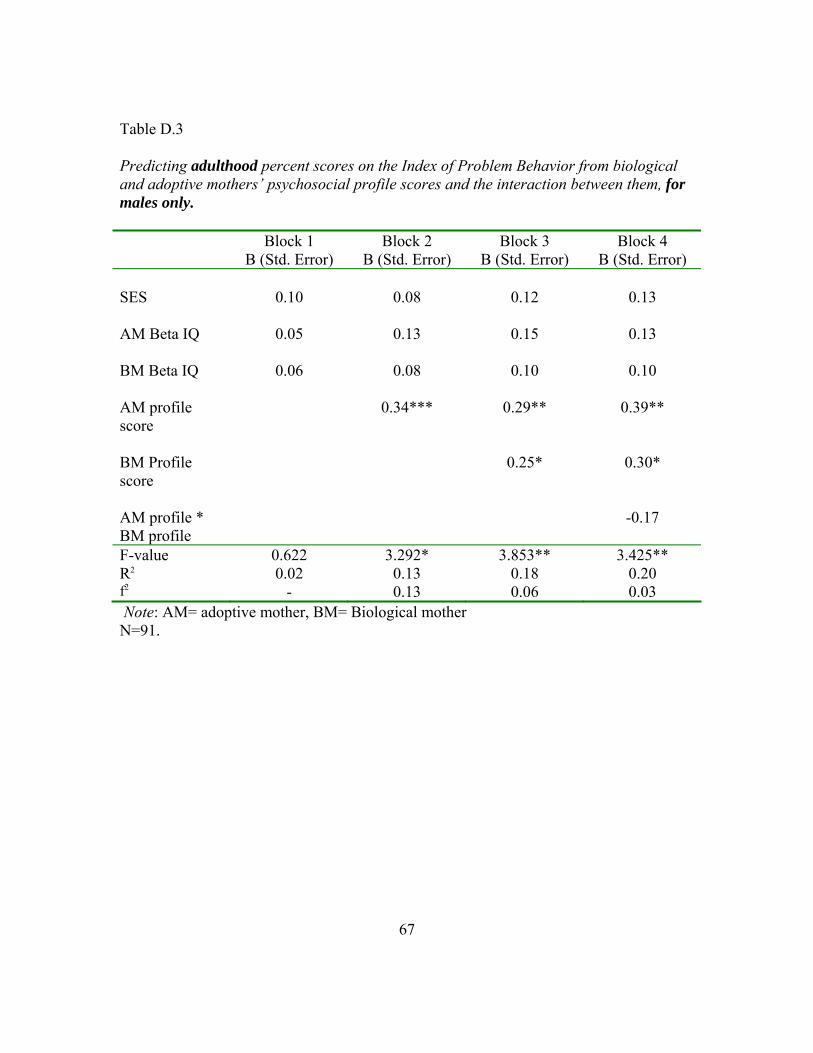
67
Block 1
Table D.3 Predicting adulthood percent scores on the Index of Problem Behavior from biological and adoptive mothers’ psychosocial profile scores and the interaction between them, for males only.
B (Std. Error) Block 2
B (Std. Error) Block 3
B (Std. Error) Block 4
B (Std. Error) SES AM Beta IQ BM Beta IQ AM profile score BM Profile score AM profile * BM profile
0.10
0.05
0.06
0.08
0.13
0.08
0.34***
0.12
0.15
0.10
0.29**
0.25*
0.13
0.13
0.10
0.39**
0.30*
-0.17
F-value R2
f2
0.622 0.02
-
3.292* 0.13 0.13
3.853** 0.18 0.06
3.425** 0.20 0.03
Note: AM= adoptive mother, BM= Biological mother N=91.

68
Table D.4 Model predicting problem behaviors across the life span from biological mothers’ MMPI sub-scale T-scores, for males only. Childhood Adolescence Adulthood Block 1
B (S.E) Block 2 B (S.E)
Block 1 B (S.E)
Block 2 B (S.E)
Block 1 B (S.E)
Block 2 B (S.E)
Controls SES AM Beta IQ BM Beta IQ AM profile score
-0.10
0.10
0.11
0.16
-0.16
0.06
0.18
0.12
0.07
0.11
0.10
0.30**
0.11
0.09
0.10
0.26*
0.11
0.13
0.09
0.37***
0.09
0.12
0.14
0.21
MMPI Sub-Scale T-scores Hs D Hy Pd Pa Pt Sc Ma
-0.38*
0.14
0.13
0.13
-0.31
0.14
0.23
0.18
-0.18
-0.12
0.21
0.21
-0.21
0.08
0.05
0.20
-0.33*
-0.01
0.27*
0.33*
-0.17
0.09
0.26
-0.12
F-value R2
F2
0.854 0.04
-
1.291 0.17 0.16
2.298 0.10
-
1.992* 0.24 0.18
3.684** 0.15
-
3.161*** 0.34 0.29
Note: AM=adoptive mother, BM=biological mother, Hs=hypochondriasis, D=depression, Hy=hysteria, Pd=psychopathic deviate, Pa=paranoia, Pt= psychasthenia, Sc=Schizophrenia, Ma=Hypomania. N=92 for childhood model, 91 for adolescent model, and 91 for adulthood model.

69
Table D.5 Model predicting problem behaviors across the life span from adoptive mothers’ MMPI sub-scale T-scores, for males only. Childhood Adolescence Adulthood Block 1
B (S.E) Block 2 B (S.E)
Block 1 B (S.E)
Block 2 B (S.E)
Block 1 B (S.E)
Block 2 B (S.E)
Controls SES AM Beta IQ BM Beta IQ BM profile score
-0.10
0.05
0.08
0.03
-0.18
0.06
0.02
0.04
0.08
0.05
0.08
0.11
0.01
0.09
0.06
0.14
0.15
0.10
0.09
0.31**
0.10
0.12
0.06
0.31**
MMPI Sub-Scale T-scores Hs D Hy Pd Pa Pt Sc Ma
-0.36
0.20
0.21
0.12
-0.09
-0.04
-0.08
0.30*
-0.18
0.15
-0.01
-0.17
-0.09
0.27
0.12
0.19
-0.16
0.14
0.08
0.11
-0.02
-0.10
0.12
0.17
F-value R2
F2
0.307 0.01
-
0.997 0.13 0.14
0.518 0.02
-
1.559 0.19 0.21
2.624* 0.11
-
1.339 0.17 0.07
Note: AM=adoptive mother, BM=biological mother, Hs=hypochondriasis, D=depression, Hy=hysteria, Pd=psychopathic deviate, Pa=paranoia, Pt= psychasthenia, Sc=Schizophrenia, Ma=Hypomania. N=92 for childhood model, 91 for adolescent model, and 91 for adulthood model.

70
Chapter Three: Stability and Change in Patterns of Problem Behavior Development
as a Function of Gender, Adoptive Status, and Risk Status
The study of the developmental trend of problem behaviors is not a new topic.
Many investigations of problem behavior development show stability of behavior across
time (e.g., Farrington, 1994; Olweus, 1979; Stattin & Magnusson, 1989; van den Oord &
Rowe, 1997; van der Valk, Verhulst, Neale, & Boomsma, 1998). However, few have
investigated stability across a significant period of time (e.g., more than 3 or 4 years), or
beyond early adulthood. One notable exception is the work of Terrie Moffitt and her
colleagues, who have followed a cohort of individuals born in Dunedin, New Zealand
between 1972 and 1973 (e.g., Moffitt & Caspi, 2001, 2005; Moffitt, Caspi, Harrington,
Milne, 2002). The current study used longitudinal data, which allowed us to map trends
of problem behaviors over the course of three and a half decades. Results from this
investigation add to the evidence of developmental trends over an extended period of
time and through multiple life stages.
An important consideration when investigating developmental trends is whether
all groups follow the same predictable trend. While it has generally found that most
individuals peak in the amount of problem behaviors they display during adolescence
(Patterson, Capaldi, & Bank, 1991), Moffitt (1993) identified two separate, yet salient,
trajectories for criminal and antisocial problem behaviors. Moffitt defined the individuals
who fell into these two developmental patterns as adolescent-limited (characterized by
antisocial behavior that is only manifest during the adolescent phase) and life-course-
persistent (characterized by externalizing, delinquent, and antisocial tendencies
throughout childhood, adolescence, and adulthood). Moffitt and her colleges also
identified another category of individuals who showed an increase in criminal behavior in
adulthood, but this was rare (Moffitt, 1993). Loeber and Stouthamer-Loeber (1998)
challenged that there also exist a group of individuals who show signs of externalizing
behaviors, specifically aggression, only during childhood—outgrowing the tendency by
adolescence. These results suggest that there is no one predictable path of behavior,

71
which suggests that groups selected by various criteria may also show differential
patterns of problem behaviors over time.
Little research to date has distilled samples, beyond gender, to investigate whether
there are between-group differences problem behaviors from early childhood through
middle adulthood. For example, do adoptees follow the same developmental trend as
children reared by their biological parents? And, do those who are classified as higher-
risk follow the same developmental trend as those classified as lower-risk? In those
studies that do exist, adoptees have been found to display higher levels of problem
behavior than their non-adopted siblings (Weinberg, Waldman, van Dulmen, & Scarr,
2004) and individuals who are at higher risk for developing problem behaviors tend to
display more externalizing behaviors than those who are at lower risk (Crowel,
Beauchaine, Gatzke-Kopp, Sylvers, Mead & Chipman-Chacon, 2006; Hastings, Zahn-
Waxler, Robinson, Usher, & Bridges, 2000; Polaha, Larzelere, Shapiro, & Pettit, 2004;
Puttler, Zucker, Fitzgerald & Bringham, 1998), though risk is defined in different ways.
Hastings et al. (2000), for example, defined risk according to mother and teacher ratings
of behavior problems at one point in time (either 4-5 years or 6-7 years) to predict
problem behavior two years later. Puttler et al. (1998) used alcoholic family subtypes
(antisocial alcoholics, non-antisocial alcoholics, and non-alcoholic families) to
investigate the development of behavior problems in early to mid-childhood. Only one of
these studies (Hastings et al., 2000), however, followed individuals over time to track
developmental patterns—finding that the amount of concern for others a child has early
on in development mediates the relationship between early and later externalizing.
As so little research has been done to investigate the difference in behavioral
trajectories between adopted and non-adopted samples, which could have important
implications for individuals involved in the adoptive process, the current investigation
divided the sample according to both sex and adoption status to ascertain whether overall
mean stability and/or intraindividual continuity differs between these groups. In addition,
because of the findings in Chapter Two, which revealed that biological mothers’ Pd T-
scores influenced problem behavior development in adoptive individuals and because risk

72
status has been found by others (cited above) to influence developmental trends, I also
divided the adoptive sample according to their relative risk for behavior problem
development (based on their birth mothers’ Pd scores) to investigate the question of
between-group differences in the stability of problem behaviors from childhood through
adulthood.
The first goal was to assess the group differences in the mean level stability of
problem behaviors using independent samples t-tests. Among studies that have mapped
growth curves, or trajectories, of problem behaviors into adulthood it has been shown that
a definite upward trend exists between childhood and adolescence (e.g., Moffitt, 1993).
Based on these findings, it was hypothesized that the mean level of problem behaviors
would increase from childhood to adolescence, and decrease between adolescence and
adulthood, regardless of group membership. However, because of the rate at which the
birth mothers scored markedly above the norm on the Pd scale and the association found
between birth mothers’ scores and problem behavior development (in Chapter Two), I
expected the adoptive sample to show higher average rates of delinquent behaviors than
the biological children of the adoptive parents at each point in the life span, but to follow
a similar pattern (i.e., peaking during adolescence).
Next, to explore whether mean differences emerge as a function of relative risk
status, the adopted individuals identified as Higher-Risk toward behavior problem
development, based on indications of elevated deviance in their biological mothers, were
compared to adoptees that were identified as Lower-Risk. Derived from van den Oord
and Rowe’s (1997) findings, which suggested moderate genetic effects on problem
behavior development, I expected adoptees that had mothers with highly elevated Pd T-
scores to exhibit more problem behaviors than the adoptees whose mothers were
moderately elevated on the MMPI Pd sub-scale. Also, based on Moffitt’s (1993) research
I expected the Higher-Risk adoptees to show more behavioral stability across time than
the Lower-Risk adoptees.
Finally, because of the frequency with which sex differences that have been
found, with males displaying higher rates of externalizing problems than females, males

73
were predicted to display more problem behaviors within each of the group comparisons.
In other words, I expected male biological offspring, male adoptees, Higher-Risk males,
and Lower-Risk males to display more problem behaviors than their female counterparts
at each stage of development.
The second goal of this investigation was to assess the intra-individual continuity
of problem behaviors across the life span for each of the groups (adopted, biological,
Higher-Risk, Lower-Risk), using correlations between rank order on the amount of
problem behaviors at one point in time (e.g., childhood) with the rank order on the
amount of problem behaviors at another point in time (e.g., adolescence). One of the most
robust findings with regard to problem behavior research is that earlier problem behaviors
predict later problem behaviors (Bardone, Moffitt, Caspi, Dickson, Stanton, & Silva,
1998; Keenan & Wakschlag, 2002; Moffitt, 1993; Farrington, 1991, 1994; Patterson,
1992; Stattin & Magnusson, 1989; Caspi, Elder, & Bem, 1987; Olweus, 1979). It has also
been found that those who are the most persistent (i.e., stable) in displaying delinquent
and antisocial behaviors are those who are the most deviant (Loeber, 1982; Loeber &
Farrington, 1998; West & Ferrington, 1973). Therefore, it seemed likely that those who
ranked the highest during childhood, which I predicted would be the Higher-Risk
adoptees, would also be among the highest in rank order during adolescence and
adulthood. Therefore, I predicted that the Higher-Risk adoptees would display the
greatest continuity of behavior across the life span.
Factors that Influence the Development and Continuity of Problem Behaviors
In addition to the investigation of developmental trends, developmental
researchers have turned to behavior genetic methodology to investigate the how genetic
factors influence the trends we observe in problem behavior development over time.
Using data from the National Longitudinal Survey of Youth, van den Oord and Rowe
(1997), followed a group of biologically related individuals (full and half siblings, and
first cousins) from mid-childhood into early adolescence, finding that both genetic and

74
stable family environmental factors were sources of liability that influenced the stability
of problem behaviors across time.
Building on the findings of van den Oord and Rowe, the final goal of the analyses
presented in this chapter was to assess the influence of both genetic and within-family
environmental sources of liability on the development and continuity of problem
behaviors during each of three life stages: childhood, adolescence, and adulthood. To this
end, a series of intra-class correlations were performed on both biologically related and
biologically unrelated sibling pairs from the Texas Adoption Project (TAP). Similar to
the findings in Chapter Two as well as other studies from TAP (e.g., Loehlin, et al., 1985,
1987), which found no similarity between adoptive mother and child, I expected to find
no similarity between biologically unrelated siblings, reared in the same home, on either
the development or stability of problem behaviors throughout the life course; however, I
did expect to find a positive relationship between biological siblings on both the
development and stability of problem behaviors across time.
In summary, the analyses presented in this chapter build upon the existing
literature of stability and continuity of problem behaviors by following a sample of
adopted and biological individuals over a 30 year time span, investigating whether
gender, adoptive status, or level of genetic risk influence the pattern of development
between groups, or the intra-individual continuity of problem behaviors within groups.
Based on prior research, males, adoptees, and those at high risk of developing problem
behaviors were predicted to show more problem behaviors across the lifespan and
Higher-Risk adoptees (males in particular) were predicted to show the greatest amount of
behavioral continuity. Finally, the influence of common genetic factors and common
environmental factors on the development and continuity of problem behaviors was
assessed, with common genes, not common environments, predicted to influence both the
development and continuity of behavior problems among siblings.

75
Method
Subjects
Subjects (N=381) for this investigation came from the Texas Adoption Project, a
longitudinal adoption project which began in 1979. The participants in this study
included both the adopted and biological children of 300 Texas families who adopted at
least one child from a particular adoption agency within the state of Texas. Data has
been collected at three time points, roughly 10 years apart, covering childhood (average
age 8), adolescence (average age 17), and adulthood (average age 30) (for detailed
description of data see the method section in Chapter Two). All adoptees in this study
were adopted away at birth and all adoptions were closed record adoptions. Virtually all
participants were of Caucasian decent and 54% of the sample was male.
To assess whether there are any stable within-family differences that exist among
participating families with and without biological children a series of t-tests were
conducted. Table 3.1 presents the results of the t-tests, showing that TAP families who
had at least one biological child included more children in the household and had
adoptive mothers with more emotional stability.
Measures
Problem behaviors. As described in detail in Chapter Two, each individual was
scored on the number of problem behaviors to create a latent problem behaviors variable
for each of the three life stages: childhood (age 4-12), adolescence (age 13-19), and
adulthood (age 20 and over). Higher scores indicated more problem behaviors. Because
the number of behaviors measured at each of the life stages differed, and because the
same underlying characteristic may manifest itself differently from one life stage to the
next, percent scores (rather than raw scores) on the IPB were used as a measure of
problem behaviors across the life span. Percent scores for each life stage were calculated
by summing the ratings on all of the items within a developmental stage and dividing by
the number of total possible “points” for that stage. Percent scores during childhood

76
ranged from 0-0.49 (mean = 0.062, SD= 0.067, skewness= 2.56), 0-0.44 (mean= 0.072,
SD= 0.075, skewness= 2.04) during adolescence, and 0-0.38 (mean= 0.029, SD= 0.057,
skewness= 3.04) during adulthood. The distribution of percent scores was markedly
skewed during each of the three developmental stages, an issue which was addressed in
Chapter Two.
Risk status. According to the results found in Chapter Two, having a biological
mother with an elevated score on the Minnesota Multiphasic Personality Inventory
(MMPI) psychopathic deviance (Pd) sub-scale may leave biological children, even
though adopted away at birth, at increased risk for developing problem behaviors
throughout their life span. Therefore, I used the biological mothers’ MMPI Pd T-scores
as an indicator of genetic liability toward problem behavior development. Pd T-scores
equal to or greater than 65 represent a score that is at least one and a half standard
deviations above the normative adult sample (normative mean = 50, SD= 10) and is
predictive of individuals diagnosed with antisocial personality disorder (Dahlstrom, et al.,
1960). The average Pd T-score of the biological mothers within this sample was 64.61
(SD= 10.42). Given that adolescents tend to score above the normative mean (Dahlstrom,
et al., 1960) in general, and the average age of the biological mothers in this sample was
19 years, this definition of liability is appropriate for determining whose biological
mothers were truly problematic—including about the top third of the women in this age
group. Since the children born to these women were adopted away within 30 days of their
birth, any similarity between the birth mothers and their adopted away offspring was
assumed to be the result of genetic overlap7 (Loehlin, et al., 1982).
Sex. Because of the robust findings in the literature regarding sex differences in
problem behaviors (e.g., Else-Quest, et al., 2006), and because of the findings presented
in Chapter Two of this dissertation (Tables 2.12 and 2.13), the t-tests and correlations
between rank order were also conducted separately for each group by sex. Sex was coded
as 0=male, 1=female, and the sample was 54% male.
7 Although this assumption may not be entirely accurate due to the fact that some selective placement did occur; the adoptive and biological mothers are correlated on IQ (r= 0.15) and some of the MMPI scale scores (Table 2.8).In addition, prenatal.environmental effects cannot be ruled out.

77
Analyses
Four sets of analyses were carried out. First, to test for overall (i.e., mean)
stability of problem behaviors across the three life stages, paired t-tests were run between
Time 1 and 2 (i.e., childhood and adolescence) percent scores on the Index of Problem
Behavior (IPB) ratings and between Time 2 and 3 (i.e., adolescence and adulthood).
Second, in order to see whether individuals’ behaviors remain relatively stable, each
participant was ranked at each life stage according to his or her score on the IPB and
Pearson correlations between the rank orders at each life stage were estimated.
Significant correlations support the conclusion that individuals’ behaviors at one point in
time are associated with the amount of problem behaviors they display at another point in
time (Matjasko, Ernst, Grunden, and Ammon, 2006) and suggest continuity in problem
behaviors across the life span. Third, to estimate the influence of both genetics and the
shared family environment on the development of problem behaviors from childhood to
adulthood, sibling intraclass correlations were calculated. In this set of analyses, any
similarity between genetically unrelated (i.e., adopted) siblings was assumed to be the
result of environmental factors alone, while similarity between biologically related
siblings was assumed to be the result of both genetic and environmental overlap (Loehlin
et al., 1981, 1982). Finally, in order to assess the influence of genetics and the family
environment on the stability of problem behaviors, intraclass correlations were calculated
on the IPB change scores between siblings, both biological and unrelated, between
childhood and adolescence and between adolescence and adulthood.

78
Results
Mean Level of Problem Behaviors across the Life Span
To test for changes in the level problem behaviors over time, paired t-tests were
run on the IPB percent scores between childhood and adolescence and between
adolescence and adulthood. These analyses were done for males and females separately
to ascertain whether mean level stability differs as a function of sex. In addition, to gauge
whether adopted children are more stable than children raised by their biological parents,
paired T-tests were also conducted for the following four groups: adopted males, adopted
females, biological males, and biological females. Again, based on prior research, it was
predicted that problem behaviors would rise between childhood and adolescence and
taper off thereafter, that males would show more problem behaviors than females,
adoptees more than biological offspring, and Higher-Risk adoptees more than Lower-
Risk adoptees.
Percent scores were calculated by summing the ratings on all of the items within a
developmental stage and dividing by the total possible score for that stage. Mean percent
scores were than compared, using paired t-tests, to assess changes in problem behaviors
between childhood, adolescence, and adulthood. Figure 3.1 shows that, indeed, behavior
problem across the life span did peak during adolescence for both males and females. The
mean percent scores for behavior problems showed an increase from childhood to
adolescence for both males and females, t(190)= -2.532, p< .05 and t(181)= -4.134,
p<.001, respectively, followed by a decrease between adolescence and adulthood,
t(187)= 9.768, p<.001 for males and t(179)=10.813, p<.001 for females. Figure 3.2
illustrates the mean difference in percent scores between the adopted males and females
and biological males and females. Paired t-tests indicated that while the adopted children
differed significantly in the amount of problem behaviors they displayed between
childhood and adolescence, t(135)= -2.954, p<.01 for adopted males and t(121)= -4.620,
p<.001 for adopted females, children reared by their biological parents did not, t(54)=

79
0.281, p= .78 for biological males and t(59)= -0.033, p=.97 for biological females. In
fact, from the trend line pictured in Figure 3.2, it appears that both the biological males
and females actually decrease somewhat in their amount of problem behaviors between
childhood and adolescence. Lastly, as can be seen in Figure 3.2, all four groups did
display significant decreases in the amount of behavior problems between adolescence
and adulthood, t(133)= 8.268, p<.001 for adopted males and t(120)= 9.573, p<.001 for
adopted females, t(53)= 5.709, p< .001 for biological males, and t(58)= 5.382, p< .001
for biological females. This figure indicates that, while the adopted sample indeed
followed the predicted pattern of problem behaviors across the life span, the children who
were born naturally to the adoptive parents showed relatively little mean change between
childhood and adolescence, before declining in the amount of problem behaviors into
adulthood. In other words, the biological offspring of the adoptive parents in this sample
showed greater behavioral stability than did the adopted children, as a group. However,
only the adoptees trend followed prediction.
Breaking down the adoptive sample further, I looked into whether
individuals who may have been more at risk for problem behaviors, due to having a
biological mother with indications of defiant behaviors herself, exhibited more problem
behaviors than individuals who were not genetically at risk. According to the findings in
chapter 2, adoptees whose mothers had elevated scores on the MMPI Pd scale were more
likely to exhibit problem behaviors during childhood, and adolescence. Therefore, the
following analysis sought to uncover whether these “Higher-Risk” adoptees showed
differing patterns of behavior across the life span than did the “Lower-Risk” adoptees.
The results in Figure 3.3 illustrate that while both the Higher-Risk and Lower-Risk
adoptees showed the same general pattern, with behavior problems peaking in
adolescence, the rise in percent scores from childhood to adolescence was only
significant for the Higher-Risk group, t(74)= -2.177, p< .05. As predicted, the Higher-
Risk adoptees displayed higher percent scores across the life span. However, the
behavioral difference between the two groups was only significant during adulthood,
t(177)= -2.830, p< .01.
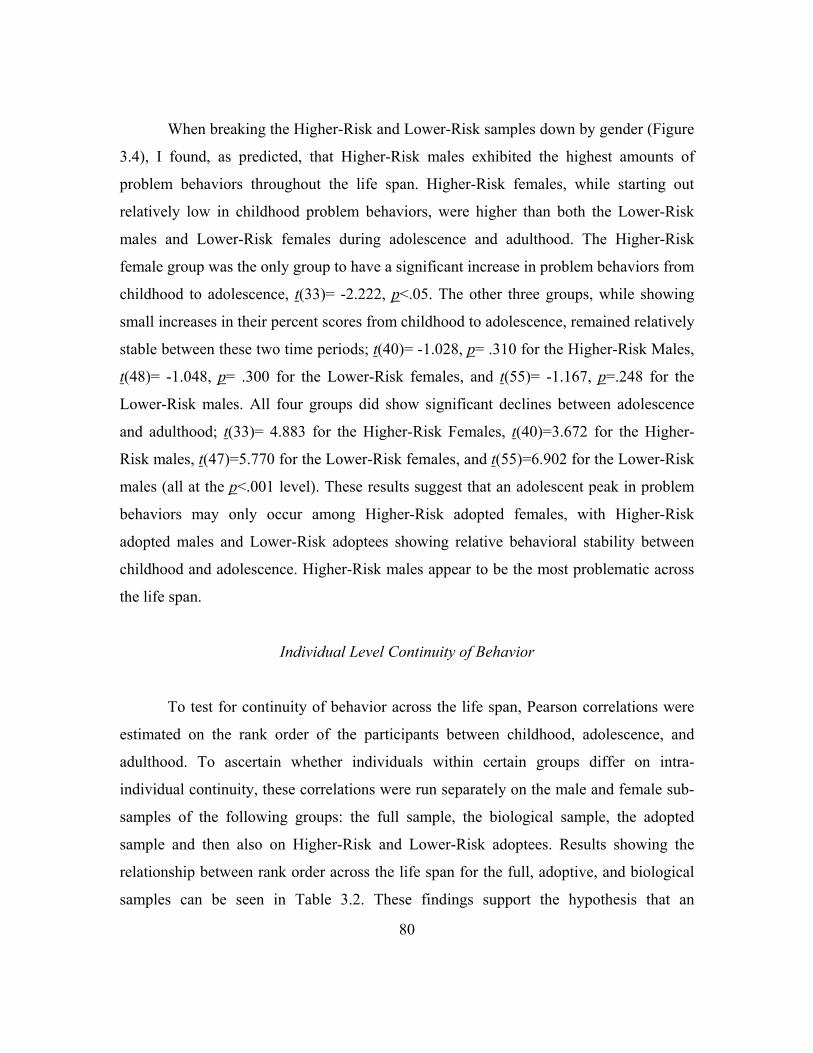
80
When breaking the Higher-Risk and Lower-Risk samples down by gender (Figure
3.4), I found, as predicted, that Higher-Risk males exhibited the highest amounts of
problem behaviors throughout the life span. Higher-Risk females, while starting out
relatively low in childhood problem behaviors, were higher than both the Lower-Risk
males and Lower-Risk females during adolescence and adulthood. The Higher-Risk
female group was the only group to have a significant increase in problem behaviors from
childhood to adolescence, t(33)= -2.222, p<.05. The other three groups, while showing
small increases in their percent scores from childhood to adolescence, remained relatively
stable between these two time periods; t(40)= -1.028, p= .310 for the Higher-Risk Males,
t(48)= -1.048, p= .300 for the Lower-Risk females, and t(55)= -1.167, p=.248 for the
Lower-Risk males. All four groups did show significant declines between adolescence
and adulthood; t(33)= 4.883 for the Higher-Risk Females, t(40)=3.672 for the Higher-
Risk males, t(47)=5.770 for the Lower-Risk females, and t(55)=6.902 for the Lower-Risk
males (all at the p<.001 level). These results suggest that an adolescent peak in problem
behaviors may only occur among Higher-Risk adopted females, with Higher-Risk
adopted males and Lower-Risk adoptees showing relative behavioral stability between
childhood and adolescence. Higher-Risk males appear to be the most problematic across
the life span.
Individual Level Continuity of Behavior
To test for continuity of behavior across the life span, Pearson correlations were
estimated on the rank order of the participants between childhood, adolescence, and
adulthood. To ascertain whether individuals within certain groups differ on intra-
individual continuity, these correlations were run separately on the male and female sub-
samples of the following groups: the full sample, the biological sample, the adopted
sample and then also on Higher-Risk and Lower-Risk adoptees. Results showing the
relationship between rank order across the life span for the full, adoptive, and biological
samples can be seen in Table 3.2. These findings support the hypothesis that an

81
individual’s rank order at one time (e.g., childhood) was predictive of the individual’s
rank order at another (e.g., adolescence). Results were, however, different when
comparing the adoptive and biological sub-samples. For the adoptive samples the
correlations were stronger between each of the life stages, when compared to the
biological sample. The adoptive sample also showed moderate stability of problem
behaviors across the entire life span. The biological sample, on the other hand, showed
only moderately low correlations between adjacent life stages (i.e., childhood to
adolescence and adolescence to adulthood).
The next table (Table 3.3) shows the results from the rank order correlations for
the male and female sub-samples and compares them to the entire sample. This picture is
very similar to that of the adopted versus biological samples. Males were moderately
stable in the amount of problem behaviors they displayed from childhood up through
their mid- to late thirties. Females, on the other hand, were found to be moderately stable
from childhood to adolescence and highly stable from adolescence to adulthood.
However, when individuals were grouped according to both sex and adoption status a
more differentiated picture emerged (Table 3.4). From these results it appeared that only
adopted males showed stability in the amount of problem behaviors they display from
childhood through adulthood and that adopted females were moderately stable between
childhood and adolescence but highly stable in problem behaviors from adolescence to
adulthood. Biological males were also moderately stable from childhood to adolescence
and from adolescence to adulthood, but less so than adopted males in both instances.
Biological females showed only moderate behavioral stability from adolescence to
adulthood.
Finally, when the adopted individuals were classified as Higher-Risk or Lower-
Risk, based upon their birth mothers’ MMPI Pd T-scores (Tables 3.5 and 3.6), I found
that while both groups showed moderate to high stability on the amount of problem
behaviors they displayed across the life span when sex is not accounted for, Higher-Risk
males are clearly the most stable from childhood through adulthood. Higher-Risk females
showed no significant relationship between rank order during one life stage to their rank
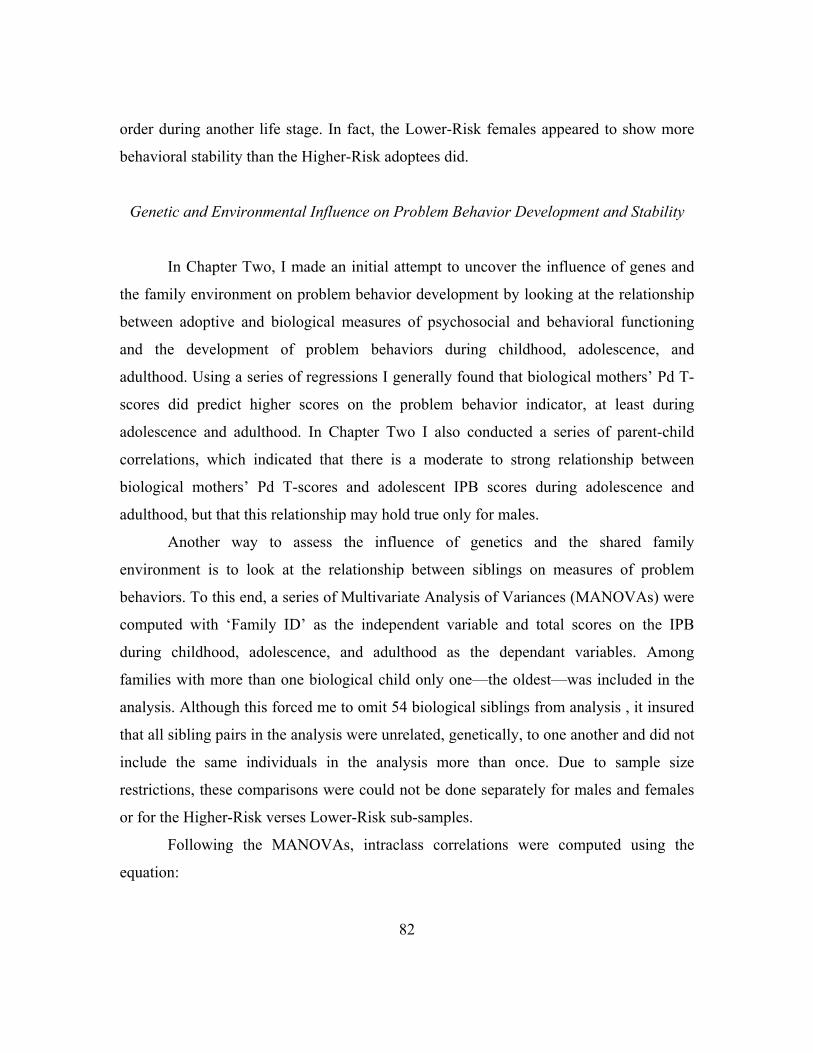
82
order during another life stage. In fact, the Lower-Risk females appeared to show more
behavioral stability than the Higher-Risk adoptees did.
Genetic and Environmental Influence on Problem Behavior Development and Stability
In Chapter Two, I made an initial attempt to uncover the influence of genes and
the family environment on problem behavior development by looking at the relationship
between adoptive and biological measures of psychosocial and behavioral functioning
and the development of problem behaviors during childhood, adolescence, and
adulthood. Using a series of regressions I generally found that biological mothers’ Pd T-
scores did predict higher scores on the problem behavior indicator, at least during
adolescence and adulthood. In Chapter Two I also conducted a series of parent-child
correlations, which indicated that there is a moderate to strong relationship between
biological mothers’ Pd T-scores and adolescent IPB scores during adolescence and
adulthood, but that this relationship may hold true only for males.
Another way to assess the influence of genetics and the shared family
environment is to look at the relationship between siblings on measures of problem
behaviors. To this end, a series of Multivariate Analysis of Variances (MANOVAs) were
computed with ‘Family ID’ as the independent variable and total scores on the IPB
during childhood, adolescence, and adulthood as the dependant variables. Among
families with more than one biological child only one—the oldest—was included in the
analysis. Although this forced me to omit 54 biological siblings from analysis , it insured
that all sibling pairs in the analysis were unrelated, genetically, to one another and did not
include the same individuals in the analysis more than once. Due to sample size
restrictions, these comparisons were could not be done separately for males and females
or for the Higher-Risk verses Lower-Risk sub-samples.
Following the MANOVAs, intraclass correlations were computed using the
equation:

83
r = [MSb – MSw]/[MSb + (m-1)MSw]
where MSb= mean squares between families, MSw= mean squares within families, and m= mean number
of siblings per family.
If a positive intraclass correlation was found it would indicate that siblings were
more alike than one would expect given the general variation in the sample. If a negative
correlation were found it would suggest that siblings were less alike than randomly paired
members of the sample. Finally, a correlation of zero would have indicated that siblings
were no more alike than randomly paired members of the sample. The F-test from the
MANOVA served as the test of significance for the intraclass correlation (McNemar,
1969).
As predicted, results (Table 3.7) indicated that during all three life stages—
childhood, adolescence, and adulthood, siblings reared within the same home but who
shared no (naturally varying) genes in common resembled each other no more than
randomly paired individuals from within the sample. Given the positive correlations
between the biological sibling pairs, it was found that the genetically related siblings did
resemble one another more than random pairs, though only significantly so during
adulthood. These findings support the theory that problem behavior development,
especially during adulthood, is influenced more by one’s genetic makeup than by one’s
family environment. In addition, similar to the biological parent-child correlations found
in Chapter Two, the resemblance between biologically related siblings appears to get
stronger with age.
To test for the influence of genes and the environment on the stability of problem
behaviors throughout the life course, intraclass correlations were also estimated on the
change scores between childhood and adolescence and between adolescence and
adulthood for both biologically related and unrelated sib-pairs. As can be seen in Table
3.8, neither the biological siblings nor the unrelated siblings were similar to one another
at the p< .05 level, though the number of biologically related sib pairs may have been too
small to detect a relationship (n=27). According to these results, the stability of problem

84
behaviors over time is related to neither genetic nor shared environmental factors.
However, the direction of the relationship between the biologically related siblings is in
the proper direction (i.e., positive correlation), suggesting a relationship may exist, but
was could not be established.
Discussion
There were three goals for this chapter. The first goal was to assess the stability
and continuity of problem behaviors among the children of 300 Texas families having at
least one adopted child. The second goal was to determine whether groups differ as a
function of sex, adoption status, or risk status, in mean level stability and/or individual
continuity of problem behaviors across a thirty year time span. The final goal for this
chapter was to uncover to what extent genes and shared family environments influence
the development and stability of problem behaviors from early childhood through middle
adulthood.
Mean Stability and Individual Continuity of Behavior for Adoptive, Biological, Higher-
Risk, and Lower-Risk Males and Females
Results generally supported the hypothesis that mean levels of problem behaviors
would peak during adolescence, but that adopted individuals would display higher means
across the life span than the biological offspring of the adoptive parents. However, as a
group the biological children in this sample appeared to be relatively stable on mean level
of problem behaviors between childhood and adolescence, with mean percent scores
remaining in the lowest five to six percent. In addition, once the adoptive sample was
divided into groups as a function of gender and relative risk status, more group
differences in the relative stability of problem behaviors over time emerged. Specifically,
Higher-Risk males and Lower-Risk adoptees in general showed small but insignificant
increases between childhood and adolescence. Higher-Risk females comprised the only

85
group to show significant change between childhood and adolescence, within the
adoptive sample.
It was also found that the adopted sample was higher on problem behaviors across
each of the three time points, which was predicted to occur because of the number of
biological mothers in the sample that had elevated scores on the psychopathic deviancy
scale of the Minnesota Mutiphasic Personality Inventory. While previous research has
found that adoptive samples tend to show more problem behaviors than children in
comparable families who are reared by their biological parents (Brodzinsky, Radice,
Huffman, Merkler, 1987; Hutchings & Mednick, 1973), these investigations have taken
only a snap-shot view of one time point. This investigation adds to this finding by
showing that adoptees from the Texas Adoption Project displayed elevated rates of
problem behaviors, compared to their non-adopted siblings, across three decades.
While only 167 of the original 300 parents from the Texas Adoption Project were
located and interviewed, it does not appear that selection was responsible for this
outcome. t-Tests comparing participants whose parents agreed to be interviewed to those
whose parents did not, presented in Chapter Two (Tables 2.17), found no individual
differences between subjects whose parents were or were not interviewed with respect to
general levels of intelligence, mother rated disposition during childhood (Time 1) and
adolescence (Time 2), age of the subject at the initial interview, or the subject’s sex. A
significant difference in birth mothers’ Pd T-scores was found between the subjects
whose parents did and did not participate: namely, the subjects of the non-participating
families had mothers with higher psychopathic deviancy scores, suggesting that some of
the worse cases may not have been captured in this study. Therefore, selective attrition
does appear to have taken place, but does not explain the finding that the adopted
children in this sample tended to have more problem behaviors than the children reared
by their biological parents. If anything, the effect may have been underestimated because
of the attrition. These findings add to the literature by showing that indeed adoptive
samples did persist in displaying higher mean levels of problem behaviors (compared to
their non-adopted siblings) well into their adult years.

86
Based on such findings, some have argued that adoption itself is a risk factor for
problem behavior development (Brodzinsky, et al., 1987; Miller, 2005; Weinberg, et al.,
2004). However, studies comparing groups of individuals whose parents are mentally ill
and are either adopted away or remain with their mentally ill biological parent suggest
that adoption is actually a protective factor. For example, Goodwin (1977) studied
daughters of alcoholic biological parents, some of whom were adopted away shortly after
birth some of whom were not. The adopted away daughters displayed significantly less
depression during young adulthood than did the daughters who grew up in the homes
with their biological alcoholic parent; although both groups displayed higher rates of
alcoholism than was expected from the general population. As was mentioned earlier,
individuals who are given up for adoption are not a randomly selected group. Most of
their biological mothers are teenagers and teenage pregnancy has been found to be
associated with a number other risk factors, such as low SES, self-esteem, and academic
achievement, early puberty and troubled family histories (Holden, Nelson, Velasquez &
Ritchie, 1993)—all of which have a heritable component. Therefore, the fact that many
samples of adopted individuals have shown elevated levels of mental and behavioral
problems seems to be more a reflection of the genetic risk possessed by the population of
individuals who tend to give their children up for adoption than a reflection of the
adoptive process. It should also be noted that while there is a tendency for adopted
samples to manifest more behavior problem than their non-adopted siblings, most
adopted individuals develop quite satisfactorily.
Finally, the hypothesis that Higher-Risk adoptees would score the highest on the
Index of Problem Behaviors across all three developmental stages was supported, though
this finding appears to be mostly due to the levels of behavior problems displayed by the
Higher-Risk males. These findings are supported by those of Foley, et al. (2001), who
also found an increase in oppositional-defiant disorder and conduct disorder in the male
offspring of mothers who had a history of antisocial personality disorder (while taking
co-morbidity and concordance of paternal disorders into account), but did not find this
relationship for the female offspring. While past studies have indicated that a genetic

87
component exists for defiant behaviors, none has indicated why males who inherit these
genes would manifest more stable behavioral patterns than females who inherit them.
Why, for instance, would Higher-Risk females start out among the lowest scoring
on a measure of behavior problems during childhood to end up among the highest during
adolescence—especially when most studies (using non-adoptive samples) have found
that externalizing tends to decrease as females make the transition from childhood to
adolescence, even among those females diagnosed with conduct disorder as children
(e.g., Patterson & Stoolmiller 1991; Zoccolillo, 1992)? It is possible that this sample of
females directly selected for sexual behavior (because they were pregnant teens), not
conduct disorder or antisocial behavior disorder. Therefore, the externalizing behaviors in
their offspring might not be manifest until puberty. Another possibility may be that
defiance is a trait which is associated with a gene on the X chromosome, protecting
females and making males more susceptible (because males only have one X, so getting a
single copy of the gene affects them, whereas females, having two X chromosomes, may
need to have two copies of the gene before being affected). The explanation for this goes
beyond the scope of this chapter, but future researchers are encouraged to investigate the
possible reasons why these sex differences may have been found.
Another possibility for the gender differences found in behavioral stability may be
due to the Index of Problem Behavior’s ability to detect problem behaviors among
females as well as it does for males. As discussed in Chapter Two, the items on the IPB
may be biased toward male-typical behaviors. Other approaches to scale construction
may also be useful. For example, some previous research has used factor analyses and
found indications of both minor and major delinquency (Center for Human Research,
2002; Matjasko, et al, 2006). Minor delinquency included items such as stealing
something worth under $50, skipping school, and experimenting with drugs. Major
delinquency, on the other hand, included items with more severe behaviors such as
stealing something worth over $50, using a knife, gun, or other weapon against another
individual, and being in a physical altercation where they the other person ended up in the
88
hospital. The use of different factors of problem behaviors seems a fruitful area to
explore in future research.
Genetic and Environmental Influences on the Development and
Continuity of Problem Behaviors
To further investigate the influence of both genetics and the shared family
environment on the development of problem behaviors, a series of intraclass correlations
were calculated between biologically related and unrelated sibling pairs. As
hypothesized, results indicated that sibling pairs who are reared within the same
household, but who share no naturally varying genes in common, are no more alike than
randomly paired individuals from within the sample. This finding is contrary to past
findings which have shown that there is a considerable shared environmental effect on
problem behavior development. Van der Valk, van den Oord, Verhulst, and Boomsma
(2003), for example found that shared environmental factors explained nearly 30% of the
variation in behavior problems among a sample of 7-year-old twins. However, when van
der Valk, Verhulst, Neale, and Boomsma (1998) used an adoptive sample to assess
genetic and environmental effects on externalizing behaviors they too found no shared
environmental effects. In addition, van der Valk et al. (1998) found genetic effects to
account for a majority of the variance (89%) in problem behaviors, using ACE model
fitting procedures. The findings from the sibling correlations in this chapter also
correspond with the parent-child correlations from Chapter Two of this dissertation.
Therefore, it appears that when adoptive samples are used, no shared environmental
effects are found.
It is possible that, since twin samples come from a broader range of the
population (more variance in SES, parental education, etc), we should expect to find
more shared environmental effects in those samples than in adoptive sample. As was
mentioned earlier in this dissertation, adoptive parents tend to be older, more educated,
and have higher SES than parents from the general population (Loehlin et al. 1983),

89
resulting in a more homogeneous population of parents than those of twins. Twins (at
least prior to the drastic increase in fertility drug use) could occur in any set of parents
regardless of the SES or educational attainment of the individuals. With a larger variation
of SES and education also come a broader variety of factors associated with those
demographic characteristics, such as percent of mothers that stay at home to care for their
children, quality of schools the children attend, and neighborhood characteristics.
Therefore, it is possible that no shared environmental effects are found within adoptive
homes because the homes between adoptive families are too similar to one another.
Moffitt (2005) also pointed out that adoptive samples may interrupt the natural
interaction between individuals’ genetic make-up and their environment, therefore
underestimating the influence of the environment on behavior. For example, a mother
with antisocial tendencies not only passes on the genes for these tendencies but also
interacts with her problem behavior child in such a way (e.g., hitting, slapping, scolding,
or berating) as to reinforce or even exacerbate the problem behavior. This gene-
environment interaction may not be as free to act on children whose parents are not their
biological parents. One way to test this hypothesis, Moffitt suggests, is to see if
environmental factors present in adoptive homes (e.g., harsh putative practices) increases
adoptees’ problem behaviors more among adoptees whose biological parents themselves
had high problem behaviors (indicating genetic risk) than among adoptees whose
biological parents did not have high problem behaviors. If harsh parenting increases the
amount of problem behaviors among those adoptees with high genetic risk, but not in the
adoptees with low genetic risk, than, Moffitt suggests, evidence of a gene-environment
interaction is provided.
Similarly, if specific factors are present in the adoptive home, such as maternal
warmth, and high-risk adoptees manifest fewer problem behaviors, but lower-risk
adoptees do not, a protective gene-environment effect may be occurring. This method
was used in Chapter Four to see if adoptees whose birth mothers had elevated Pd scores
are protected from developing problem behaviors due to specific environmental factors
within their adoptive homes. Similarly, adoptees whose birth mothers did not have

90
extremely high Pd scores will be assessed to see whether any specific adoptee family
characteristics put them at increased risk for developing problem behaviors across the life
span.
Also as predicted, the intra-class correlations revealed that biological siblings,
also reared in the same household, did resemble one another more than would be
expected from random pairings of individuals within the sample—particularly in
adulthood. Although this latter set of findings did not reach statistical significance for the
childhood and adolescent correlations it should be noted that the calculations were based
on only 27 pairs. Studies using twin and family studies have found that biologically
related siblings, reared in the same home, typically resemble each other on problem
behaviors (van der Valk, et. al, 2003). These findings have led to the conclusion that
there is a shared environmental effect on problem behavior development. The findings
from the sibling correlations presented here, as well as from other studies using adoptive
samples (van der Valk et al., 1998), do not support this conclusion. This may be an
indicator of the superiority of the adoption method to detect shared environmental effects
because it does not carry the risk of genetic “contamination” of the outcome. However, it
is also possible that parents with both biological and adopted children (29% of the TAP
families) overemphasize the differences between the two, since the biological children
are likely more similar to themselves, making the adoptive child(ren) seem more alien in
the home. To investigate this question, future work could investigate the difference scores
between siblings during childhood and adolescence using adoptive status a predictor of
the difference.
The final set of intraclass correlations was calculated in order to estimate the
degree to which either the genes or the shared environment influence the stability of
problem behaviors over time. As predicted, the unrelated siblings were no more alike
than random pairs of individuals from this population. While the biological sibling
correlations were in the positive direction, indicating that they were more similar than
randomly paired individuals, these correlations were not significant. However, the
number of sibling pairs was rather small, which may account for the lack of statistical

91
significance found here. In addition, significant findings may not have been found due to
the inherent unreliability of change scores. Change scores, because they are the result of
the subtraction of scores from two time points, inherit the error of both their constituent
parts, making them less reliable than either of the individual scores used to make them.
Therefore, had the sample of genetically related sibling pairs been larger the relations
found may have reached statistical significance. Future research using a larger sample of
siblings that vary in the degree of genetic overlap may be helpful in ascertaining whether
intraindividual continuity in problem behavior has a genetic component.
Limitations and Future Research
While the Texas Adoption Project does provide a unique opportunity to
investigate both the genetic and shared environmental influences on behavioral
development, the longitudinal adoption method is not without its limits. As would be
expected with any investigation following the same individuals over a 30 year time span,
subject attrition was a potential issue. Out of the original 600+ participants, the current
investigation was only able to utilize 381 for whom there was relatively complete data
available. However, as noted earlier, those participants whose parents did not agree to be
interviewed or who could not be reached did not appear to differ in meaningful ways
from those whose parents were reached and agreed to the interview at Time 3.
Another possible limitation of the current investigation was the measure used to
assess problem behaviors across the life span. Although the ratings for the measurement
of problem behaviors were conducted by three independent raters and the interrater
reliability was good, they were based on retrospective parental interviews—sometimes
with only one of the two adoptive parents present. Therefore, the behaviors that were
reported were subject to several forms of bias including; retrospective bias (e.g., “Jonny
is horrible now and always has been”), comparative bias (e.g., “Sarah was always a
handful compared to Katie”), and limited awareness of their children’s behaviors outside
the home.

92
The issue of retrospective bias was addressed in Chapter Two (Tables 2.4 and 2.6)
and suggested that retrospective bias was not a major concern. One possible way to
assess whether comparative bias had occurred would be to investigate the influence that
sibling rank has on problem behavior development—a factor that will be utilized in
Chapter Four where I attempt to uncover individual and family factors that served as risk
or protective factors for developing problem behaviors across the life span. Finally, to
address the issue of limited parental awareness of adolescent and adulthood behaviors,
future research could look at ratings from other sources, such as self-ratings or sibling
ratings of problem behaviors. This will be possible, to a limited extent, with additional
data collected by TAP between 2002 and 2006, but not ready for use in time for this
dissertation project. Some time after the parent interviews were completed the offspring
themselves were sent short questionnaires in the mail assessing educational attainment,
current occupation and marital status, retrospective accounts of parental closeness, and
school behaviors, current accounts of problems with anxiety/depression, drug and alcohol
use, and the law, and a brief personality scale. In addition, siblings rated each other on
these same items (when mutual consent was given), and the parents filled out these same
questionnaires regarding themselves as well as their children. Using data from these
questionnaires it will be possible to investigate adult outcomes using multiple sources of
data.
Despite these limitations, the research presented in this chapter was able to
uncover some interesting differences in trends between adopted children and children
reared by their biological parents and between Higher-Risk female adoptees and other
adoptees. It was also found that intra-individual continuity of behaviors differs by sex,
adoption status, and the relative level of genetic risk faced by an adoptee. Without the use
of a genetically informed design and the classification of the adoptees into multiple risk
categories, I would have failed to unveil this more nuanced pattern of development for
Higher-Risk males. Future research into problem behavior development should consider
using similar methods to further tease apart the potential explanation for the sex, and
other group, differences in behavioral continuity throughout the life span.

93
Results from this investigation, if substantiated by further research, may also help
practitioners think differently about the prognosis of certain individuals. Should moderate
to highly consistent patterns of problem behaviors in Higher-Risk males continue to be
found, research into the effectiveness of early intervention strategies may be helpful in
determining how Higher-Risk males might be shifted to a behavioral trajectory with
fewer problem behaviors.

94
Table 3.1
Mean differences in the Time 3 participating families with and without biological children. TAP Families w/
Biological Child(ren)
(N=79)
TAP Families w/o Biological Child(ren)
(N=82)
t-value
Family Characteristic SES AM age AM IQ AM education AM warmth AM emotional stab. AM profile score # of children
168.06 (21.8) 37.06 (4.56)
113.63 (6.71) 5.43 (1.17) 5.47 (1.86) 6.80 (1.59) 0.17 (.513) 2.83 (.804)
168.45 (23.6) 38.29 (5.01)
113.47 (7.63) 5.44 (1.23) 5.48 (1.80) 5.67 (1.71) 0.21 (.695) 1.90 (.483)
0.102 1.512 -0.126 0.009 -0.836
-4.023*** 0.361
-8.224***

0
0.01
0.02
0.03
0.04
0.05
0.06
0.07
0.08
Childhood Adolescence Adulthood
Life Stage
Inde
x of
Pro
blem
Beh
avio
r Per
cent
Sco
re
Males (n=191) Females (n=182) Figure 3.1. Mean level Problem Behavior Percent Scores for Male and Female Participants in the Texas Adoption Project from Childhood through Adulthood.
95

0
0.01
0.02
0.03
0.04
0.05
0.06
0.07
0.08
0.09
0.1
Childhood Adolescence Adulthood
Life Stage
Inde
x of
Pro
blem
Beh
avio
r Per
cent
Sco
re
Adopted Males (n=135) Adopted Females (n=121) Biological Males (n=54) Biological Females (n=59) Figure 3.2. Mean Level Problem Behavior Percent Scores as a Function of Gender and Adoptive Status for the Participants in the Texas Adoption Project from Childhood through Adulthood.
96

0
0.01
0.02
0.03
0.04
0.05
0.06
0.07
0.08
0.09
0.1
Childhood Adolescence Adulthood
Life Stage
IPB
Per
cent
Sco
re
Higher-Risk (N=75) Lower-Risk (N=106) Figure 3.3. Mean Level Problem Behavior Percent Scores as a Function of Risk Status for the Adopted Sample from the Texas Adoption Project, from Childhood through Adulthood.
97
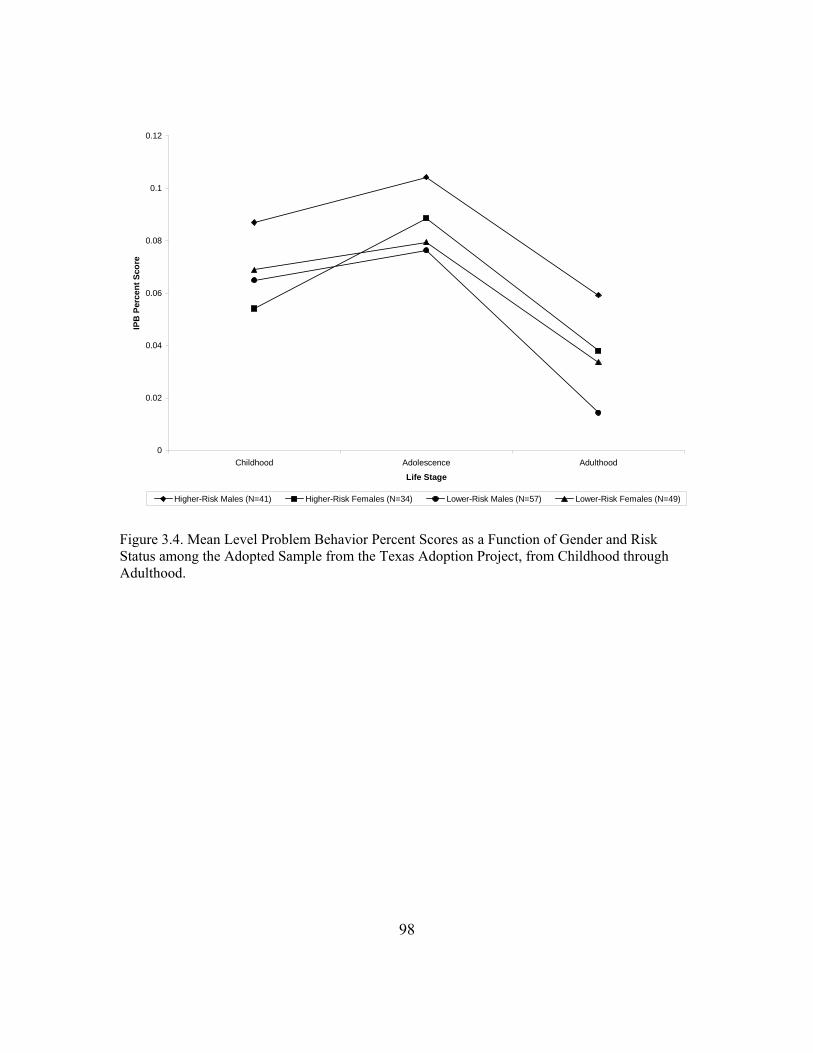
0
0.02
0.04
0.06
0.08
0.1
0.12
Childhood Adolescence Adulthood
Life Stage
IPB
Per
cent
Sco
re
Higher-Risk Males (N=41) Higher-Risk Females (N=34) Lower-Risk Males (N=57) Lower-Risk Females (N=49) Figure 3.4. Mean Level Problem Behavior Percent Scores as a Function of Gender and Risk Status among the Adopted Sample from the Texas Adoption Project, from Childhood through Adulthood.
98

99
Table 3.2 Continuity of problem behaviors over time for the whole sample and the adopted and biological sub-samples of the Texas Adoption Project. Whole Sample Adoptees Only Biological Only
Childhood Rank
Adolescent Rank
Childhood Rank
Adolescent Rank
Childhood Rank
Adolescent Rank
Adolescent Rank
.32*** .31*** .22*
Adulthood Rank
.23*** .44*** .26*** .41*** .04 .28**
Ns for whole sample correlations ranged from 375-381, for the adoptee only correlations Ns ranged from 255-258, and for the biological correlations Ns ranged from 113-115. *p < .05, **p < .01, ***p < .001. Table 3.3 Continuity of problem behaviors over time for the whole sample and male and female sub-samples of the Texas Adoption Project. Whole Sample Males Only Females Only
Childhood Rank
Adolescent Rank
Childhood Rank
Adolescent Rank
Childhood Rank
Adolescent Rank
Adolescent Rank
.32*** .36*** .22**
Adulthood Rank
.23*** .44*** .29*** .35*** .13 .46***
Ns for whole sample correlations ranged from 375-381, for the male only correlations Ns ranged from 188-192, and for the female only correlations Ns ranged from 180-182. *p < .05, **p < .01, ***p < .001.

100
Table 3.4 Continuity of problem behaviors over time, differences between sub-groups classified by sex and adoption status. Adopted Offspring Biological Offspring Males Females Males Females Childhood
RankAdolescent
Rank Childhood
RankAdolescent
Rank Childhood
RankAdolescent
Rank Childhood
RankAdolescent
Rank
Adolescent Rank
.37*** .24** .30* .14
Adulthood Rank
.37*** .32*** .15 .50*** .02 .29* .07 .27*
The range of the Ns for the correlations by group were as follows: 134-137, adopted males; 121-122 adopted females; 54-55 biological males; 59-60, biological females. *p < .05, **p < .01, ***p < .001. Table 3.5 Continuity of problem behaviors over time for the adopted sample and the Higher-Risk and Lower-Risk sub-samples from the Texas Adoption Project. Adoptees Only Higher-Risk Adoptees
OnlyLower-Risk Adoptees
Only Childhood
RankAdolescent
RankChildhood
RankAdolescent
Rank Childhood
RankAdolescent
RankAdolescent Rank
.31*** .24* .36***
Adulthood Rank
.26*** .41*** .44** .43*** .20* .35***
Ns for the adoptee only correlations Ns ranged from 255-258, n=75 for the Higher-Risk correlations, and 104-105 for the Lower-Risk adoptee correlations. *p < .05, **p < .01, ***p < .001.
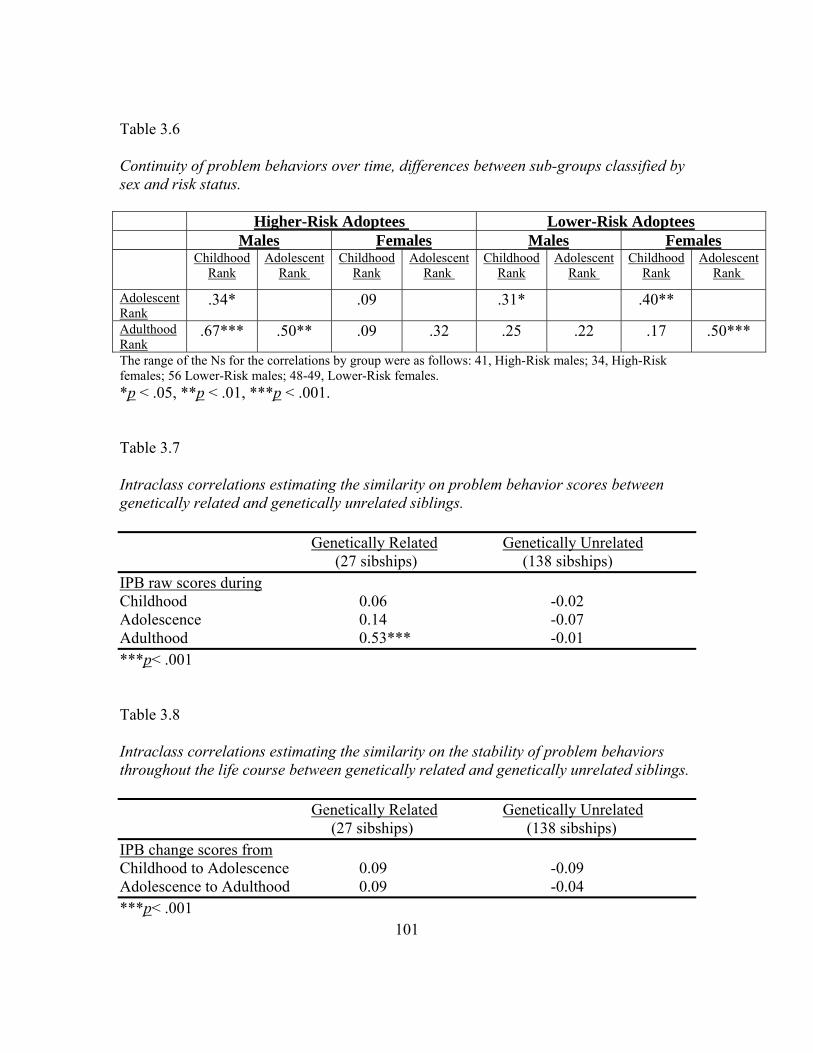
101
Table 3.6 Continuity of problem behaviors over time, differences between sub-groups classified by sex and risk status. Higher-Risk Adoptees Lower-Risk Adoptees Males Females Males Females Childhood
RankAdolescent
Rank Childhood
RankAdolescent
Rank Childhood
RankAdolescent
Rank Childhood
RankAdolescent
Rank
Adolescent Rank
.34* .09 .31* .40**
Adulthood Rank
.67*** .50** .09 .32 .25 .22 .17 .50***
The range of the Ns for the correlations by group were as follows: 41, High-Risk males; 34, High-Risk females; 56 Lower-Risk males; 48-49, Lower-Risk females. *p < .05, **p < .01, ***p < .001. Table 3.7 Intraclass correlations estimating the similarity on problem behavior scores between genetically related and genetically unrelated siblings. Genetically Related Genetically Unrelated (27 sibships) (138 sibships) IPB raw scores during Childhood 0.06 -0.02 Adolescence 0.14 -0.07 Adulthood 0.53*** -0.01 ***p< .001 Table 3.8 Intraclass correlations estimating the similarity on the stability of problem behaviors throughout the life course between genetically related and genetically unrelated siblings. Genetically Related Genetically Unrelated (27 sibships) (138 sibships) IPB change scores from Childhood to Adolescence 0.09 -0.09 Adolescence to Adulthood 0.09 -0.04 ***p< .001

102
Chapter Four: An Exploration of Individual and Family Characteristics as
Potential Risk/Protective Factors for Problem Behavior Development among
Higher-Risk and Lower-Risk Samples of Adoptees
In Chapter Two of this dissertation, it was found that adoptees’ rates of problem
behaviors were related to their mothers’ scores on the MMPI Psychopathic Deviate (Pd)
sub-scale during adolescence and adulthood. In Chapter Three I found that classifying the
adoptees according to their relative risk toward developing problem behaviors helped to
better isolate the stability of behavioral patterns for certain groups from childhood
through adulthood. For example, it was found that while Higher-Risk males were
moderately to highly stable from childhood through adulthood, Lower-Risk males only
showed stable behavioral patterns from childhood to adolescence. Conversely, while
Higher-Risk females showed little evidence of behavioral stability across the lifespan,
Lower-Risk females were moderately stable from childhood to adolescence and from
adolescence to adulthood. The purpose of the analyses presented in the present chapter
was to explore individual and family characteristics that serve as risk or protective factors
among Higher- and Lower-Risk adoptees.
Classifying adoptees according to their relative risk status allowed me to explore
what factors differentiate Higher-Risk adoptees who did display high amounts of problem
behavior from those who did not (i.e., predictability vs. resiliency), as well as addressing
what factors differentiate Lower-Risk individuals who do display high levels of deviance
from those who do not (i.e., vulnerability vs. predictability). Figure 1 illustrates the
groups that were compared. Research into the “off-diagonal” outcomes, resilient and
vulnerable, has become increasingly cited as an important area of study within the
literature on risk and resilience (Kim-Cohen, Moffitt, Caspi, & Taylor, 2004).
Research on risk and resilience has typically focused on 1) identifying factors that
are associated with an increase in the probability of negative outcomes (i.e., risk factors)
and 2) identifying factors that promote positive developmental outcomes in the face of
substantial risk for negative developmental outcomes (i.e., protective factors) (Luthar &

103
Cicchetti, 2000). While many studies have attempted to identify individual and
environmental sources of risk (e.g., Garmezy, 1991, 1993; Gore & Eckenrode, 1996;
Masten, Kandel, Mednick, Sorensen, Hutchings, Knop, Rosenberg, & Schulsinge, 1988;
Werner, 1993), fewer studies have looked toward genetic factors as sources of risk. Of
those that have considered genetic risk factors for problem behavior development (e.g.,
Jaffee, Caspi, Moffitt, Dodge, Rutter, Taylor, & Tully, 2005) it has been found that
environmental factors appear to have stronger influences on individuals with high genetic
risk than on individuals with low genetic risk. Jaffee et al. (2005) found that childhood
maltreatment increased the probability of being diagnosed with conduct disorder by 2%
for 5-year-old children who were at low genetic risk but increased the probability of
being diagnosed by 24% among those with high genetic risk. Genetic risk in the Jaffee et
al. study was defined by the diagnosis status of a co-twin. Specifically, those children
who had a twin with conduct disorder were considered to be at high-risk for developing
conduct disorder themselves. Jaffee el al. concluded that “prediction of behavioral
pathology can attain greater accuracy if both pathogenic environments and genetic risk
are ascertained.”
Among the multitude of factors that have been found to influence positive
outcomes among individuals at risk for future problem behaviors most can be classified
into one of three types 1) individual characteristics, such as personality/temperament
(Cote, Tremblay, Nagin, Zoccolillo, Vitaro, 2002; Ernst, 2004; Kim-Cohen et.al., 2004;
Loukas, Krull, Chassin, & Carle, 2000; Zuckerman & Kuhlman, 2000) and IQ (Ernst,
2004; Masten, et al., 1988); 2) family environment, such as maternal warmth/hostility
(Harold & Conger, 1997; Kim-Cohen, et al, 2004), and maternal emotional stability (Frye
& Garber, 2005; Kim-Cohen, Moffitt, Taylor, Pawlby, & Caspi, 2005); and 3) social
support, such as having a positive relationship with an adult, whether inside or outside
the family (Garmezy, 1991, 1993; Gore et al, 1996; Werner, 1989).
The current investigation classified individuals as being at Higher-Risk and
Lower-Risk for problem behavior development, according to their biological mothers’ Pd

104
scale T-scores and explored a number of individual and family characteristics as potential
protective factors for individuals who were at greater risk.
The first set of analyses present descriptive findings on the differences in
individual, family, and social characteristics between four groups: Higher-Risk adoptees
who displayed above average levels of problem behaviors, Higher-Risk adoptees who
displayed below average levels of problem behaviors (Resilient adoptees), Lower-Risk
adoptees who displayed above average levels of problem behaviors (Vulnerable
adoptees), and Lower-Risk adoptees who displayed below average levels of problem
behaviors.
Beyond Description to Potential Causation
In her 2005 paper on the interplay of genes and environment on the development
of antisocial behavior, Moffitt pointed to the family as an important source of
risk/protective factors because of the well established finding that 10 percent of families
within any community are responsible for more than half of the crimes committed within
that community (Farrington, Jolliffe, Loeber, Stouthamer-Lober, & Kalb, 2001; Rowe &
Farrington, 1997). In this same article, Moffitt (2005) also outlined several
methodological ways in which genetically informed designs can be used to assess the
influence of the within-family environment on the development of externalizing,
antisocial behaviors over time. The adoption design was among those that were pointed
out as being strong, methodologically, because of the ability to disentangle the potential
for genes to confound the influence that family environments may have on the
development of problem behaviors. Moffitt asserted that when the adoptive family
environment is found to influence the behaviors, over and above the influence of the
biological parents, a true within family environmental effect can be confirmed.
A number of investigators have used such adoption designs to test theories of both
genetic and environmental influence on problem behavior development. Mednick, et al.
(1983), for example, used a Danish adopted sample to study the transmission of

105
criminality and found that biological fathers’ criminal activity greatly predicted the
likelihood of their adopted away son’s being convicted of a felony crime. However, using
the same sample of adoptees, VanDusen, Mednick, Gabrielli, and Hutchings (1983)
showed that even after this genetic influence was taken into account the social class
environment of the adopted family still had a direct influence on the adoptees’ probability
of criminal offending. Together, these findings support Moffitt’s position that both
genetics and the family environment are important in determining who goes on to
develop externalizing, antisocial behaviors and who does not. Also, because the ability of
genetically informed designs to isolate genetic contributions from environmental ones,
conclusions about causation can be asserted better than from studies in which genetic and
environmental sources are not isolated (i.e., traditional family studies that do not account
for genetic overlap between parents and children, Moffitt, 2005).
Based on Moffitt’s theory that genes and family environments are important
sources of risk/protective factors in the development of problem behaviors and the
findings from the risk and resilience literature that individual characteristics may serve as
important risk/protective factors as well, the current investigation used a longitudinal
adoption sample to assess the effects of individual characteristics and family
environments8 on the level of problem behaviors manifested in adoptees across three life
stages—while controlling for possible confounding genetic effects. Two separate binary
regressions were run to assess the influence of these factors on problem behaviors during
childhood, adolescence, and adulthood for Higher-Risk and Lower-Risk adoptees.
Because problem behaviors have often been found to be predicted by past behaviors, the
individual characteristics tested in each of the regressions will be from the participants’
previous life stage. For example, childhood behavior problems will be predicted by infant
behaviors and characteristics, adolescent behaviors from both childhood and infant
characteristics, and so on. As in the descriptive analyses, differences between those who
8 Unfortunately, no direct measures of social support were available in the data. However, the adoptive parents’ SES, adoptive mothers’ IQs, and adoptive mothers’ education variables may be seen as proxies for social support due to their high correlation with social support measures (Lu, 1995).

106
behaved predictably were compared to those who behaved in unpredicted ways (i.e.,
Resilient and Vulnerable adoptees).
Though these analyses are primarily exploratory, past research on the relationship
between genes and environments lead to some predictions. Because antisocial personality
disorder and other disorders associated with externalizing behaviors (such as conduct
disorder and attention deficit hyperactivity disorder) have been found to be moderately
heritable (American Psychiatric Association, 1994), once genetic factors were taken into
consideration, I expected to find that adoptees’ individual characteristics, more than
adoptive family factors, would influence the behavioral development of individuals
whose biological mothers showed varying degrees of psychopathic deviance. Also,
because adoptive environments have been found to influence characteristics such as
personality and intelligence (Loehlin, et al, 1981, 1982), I expected the adoptive family
environmental factors, heretofore suggested as main effects variables, would interact with
individuals’ characteristics to influence behavioral outcomes,
METHOD
Subjects As described in detail in previous Chapter Two, the Texas Adoption Project
(TAP) is a longitudinal investigation into the lives of 300 Texas families who adopted at
least one child from a particular Texas adoption agency. Data from TAP was collected at
three time points covering childhood (average age 8), adolescence (average age 17), and
adulthood (average age 30). The data used in this chapter includes only those from the
adopted children for whom complete data was present (n=181) and included: interview
data from the adoptive parents taken between the summer of 2000 and the spring of 2002;
IQ and personality data from the birth mothers; and parent and self-report data from
childhood, adolescence, and adulthood.

107
Measures
Grouping Variables
Each participant was grouped according to 1) relative risk toward developing
problem behaviors and 2) whether they were considered to be higher or lower on the
Index of Problem Behaviors (IPB) during each of the three life stages measured. The
following section describes the grouping procedures:
Risk status. The Minnesota Multiphasic Personality Inventory (MMPI) was
administered to the biological mothers by a staff clinical psychologist at the home/agency
from which the participants were adopted, prior to the inception of the Texas Adoption
Project. The MMPI is a highly valid and reliable measure of both personality and state of
psychological functioning (Butcher, 1966). Of particular use for this measure of risk was
the psychopathic deviancy (Pd) subscale, a 50-item scale primarily measuring social
maladjustment and antisocial tendencies (Dahlstrom, et al., 1960). The average age of the
biological mothers of the adoptees in this sample was approximately 19 years old. For
adult females a T-score of 50 is average while a T-score of 70 (2 standard deviations
above the mean) indicates an individual who is highly impulsive, displays severe mood
swings, is generally resentful, and shows no regard for consequence or convention
(Carson, 1969). However, the mean Pd T-score for females below 20 years of age is
59.52 (SD=11.07) (Swenson, 1970). A subject was considered Higher-Risk if their
biological mother had an MMPI Pd T-score of 65 or higher. A T-score of 65 (1.5
standard deviations above the mean for women 20 and older and half a standard deviation
above the mean for women under 20) was chosen as the cut point for the indicator of
vulnerability because it is a clear indication of elevated tendencies toward deviant
behavior, but is not so strict a cut-point as to limit the numbers of individuals with
elevated scores.
Individuals whose birth mothers scored at or above 65 on this measure of
psychopathic deviance received a “1” for this measure and were classified as “Higher-
Risk”, while those whose birth mothers had a Pd T-score of 64 or below this level
received a “0,” and were classified as “Lower-Risk.” Seventy-five individuals, out of the

108
181 for whom complete biological mother data was available, were classified as Higher-
Risk for developing problem behaviors according to this definition, the remaining 106
adoptees were classified as Lower-Risk.
Index of problem behaviors. As described in Chapter Two, typical behaviors
throughout the life span were assessed during in-home interviews with the parents of the
participants. Extensive notes were taken by the interviewers regarding each individual
living in the home. Three independent raters then coded each participant’s relevant
information from the interview notebooks according to a checklist created for this
investigation (see Appendix 2B), hereafter referred to as the Index of Problem Behaviors
(IPB). Problem behavior scores were then computed for each of the life stages: childhood
(age 4-12), adolescence (age 13-19), and adulthood (age 20 and up). The mean problem
behavior scores were then computed and the mean score of the biological offspring was
used as the reference point on which to judge whether individuals scored high or low
(2.01 for childhood, 3.37 for adolescence, and 1.07 for adulthood). The mean IPB scores
of the biological children of the adoptive parents in the Texas Adoption Project were
used, rather than the mean or median score for the whole sample, because they were more
representative of the national population than a sample comprised of 70% adoptive
children (i.e., they are children who were born and raised by their biological parents).
Therefore, the adopted children who had IPB scores that were above the biological
children’s mean score were considered “higher” scorers, while those who had scores
below the biological children’s mean score were considered “lower” scorers. Higher
scorers comprised 43% of the adoptive sample in childhood, 54% in adolescence, and
35% in adulthood (compared to 24%, 30%, and 21% of the biological offspring that were
considered higher scorers during the same life stages, respectively. The fact that 30% or
less of the biological children scored above the mean is reflection of the highly positive
skewness of the scores in the IPB measure).
A dichotomous variable was created indicating whether each individual was
“higher”=1, or “lower”=0, for each of the three life stages.
109
Table 4.1 provides the number of adoptees that were classified into each of the
groups. It should be noted that during childhood the mean biological IPB score was 2.01.
In an attempt to make a clearer distinction between higher and lower scorers, anyone who
scored below 1.96 was considered a lower scorer. Anyone who scored above 2.06 was
considered a higher scorer. Because the range of the average score included the whole
integer 2, and 2 was a common score in the childhood IPB scale, a number of subjects
(60) were not included in the childhood analyses. This was not a problem during
adolescence or adulthood because the biological mean scores fell in between integers.
Biological Mother Characteristics
Age. Because teen pregnancy has been found to be related to a number of factors
that are also associated with problem behaviors, such as low SES, troubled family life,
and academic failure (Holden et al., 1993) those birth mothers who were younger when
giving their babies up for adoption may have also been more problematic. Because I
wanted to control for the genetic effects of problem behavior development, in order to
better isolate important environmental characteristics, I included age as a genetic control
variable. The age of the birth mother was recorded upon entry into the home for unwed
mothers. Among our sample of participants, the birth mothers’ ages ranged from 13-38
years (mean= 19.5, SD= 3.63), among those with complete data the mean was 19.1 years
(SD=3.55). This age is also within a few months of the age at which the birth mothers
gave up their children for adoption and the age at which they took the tests described
below, which is important to consider because teen females have higher mean scores than
adult females, even in normative populations (Dahlstrom et al., 1960).
IQ. The IQ of the birth mothers was measured using the standardized Revised
Beta Examination (Kellogg, et al., 1946). The Revised Beta is a valid measure of
intelligence, and is correlated 0.92 with Wechsler IQ scores. This measure was also
administered in the home for unwed mothers by a staff clinical psychologist. The birth
mother Beta IQs were available for only 181 of our participants. IQs for these mothers

110
ranged from 70-124, or Defective to Superior (Kellogg et al., 1946). The mean IQ of the
biological mothers in this sample was 108 (SD= 8.77), or in the Average range.
Index of psychosocial functioning. For this investigation, psychosocial functioning
was assessed using the number of elevated MMPI T-scores for which an individual
scored 70 or above (see Chapter Two). The number of elevated MMPI T-scores for all of
the subscales, except for the masculinity/femininity subscale, was summed for a
theoretical index score range of 0-8. For our sample of birth mothers, index scores on
this measure of psychosocial functioning ranged from 0-6 (mean=0.507, SD= 1.12). Thus
the birth mothers’ scores on this measure of functioning were highly skewed in a positive
direction9, with approximately 50% showing no extreme scale scores and only 16%
scoring 3 or more.
Family Characteristics
Adoptive parent’s socio-economic status. SES scores were calculated in prior
research from the Texas Adoption Project (Horn, et al, 1982) based on both fathers and
mothers’ education and fathers’ occupation (see Chapter Two for a more complete
description).
Adoptive mother’s education. During the initial interview with TAP the highest
level of education completed was reported on a six point scale (1= elementary school, 2=
1-3 years of high school, 3= 4 years of high school, 4= 1-3 years of college, 5= 4 years of
college, 6= more than 4 years of college). The mean level of adoptive mother education
was 3.49 (SD= 1.211), or some college.
Adoptive mother’s IQ. As with the biological mothers, the adoptive mothers’ IQs
were assessed using the standardized Revised Beta Examination scores. The adoptive
mothers’ IQs ranged from 89-127, below average to superior. The mean adoptive mother
IQ was 114.05 (SD= 7.07), or above average (Kellogg et al., 1946).
Adoptive mother’s warmth. Maternal warmth was assessed using the Factor A
scale taken from the Cattell 16 Personality Factor (16PF) self-rated questionnaire (Cattell,
9 The skewness of the data and its implications are discussed more fully in Chapter Two.
111
Eber, & Tatsuoka, 1985). The adoptive mothers’ responses to eight bipolar items (e.g.,
Cool, Aloof vs. Attentive to People; Precise, Objective vs. Softhearted, Casual; and Cold
vs. Warmhearted) led to a scale score that fell between “1”(reserved) and “10” (warm)
(mean= 5.64, SD= 1.832).
Adoptive mother’s emotional stability. Maternal emotional stability was also
assessed using a scale from the Cattell 16PF, Factor C. This scale was comprised of the
adoptive mothers’ responses to six bipolar items (e.g., Gets emotional when frustrated vs.
Emotionally Stable; Easily perturbed vs. Calm; and Worrying vs. Unruffled) resulting in
a scale score ranging from “1” (reactive) to “10” (stable). The mean scale score for
maternal emotional stability was 6.34 (SD=1.732).
Adoptive mother’s psychosocial functioning was measured in the same way as the
psychological functioning of the birth mothers. The adoptive mothers’ index scores were
narrower in range than the birth mothers’ score, they ranged from 0-5, and were even
more dramatically skewed, with a mean of 0.197 (SD= 0.63), indicating that 80% of the
birth mothers were relatively well-functioning at the time the MMPI was administered.
Number of siblings. The number of siblings residing in a household has been
found to be associated with problem behavior development (Ma, 2001), with greater
numbers being associated with more problem behaviors. The number of children in each
household was reported by the adoptive parents at Time 2. The full sample sibship size
ranged from 1-5 (mean= 2.50, SD=0.796).
Average sibling rank. Past research on problem behavior development has also
found that the behavior problems of siblings are related to one another (Conger & Rueter,
1996; Rowe, Rodgers, & Meseck-Bushey, 1992). To ascertain whether the behavior of
siblings influenced the development of individuals’ problem behaviors among adoptive
samples, each participant was ranked according to their IPB score (relative to all the other
participants) during each of the three life stages. Rank order ranged from 1-100 (with 1
being the lowest percentile and 100 the highest or most deviant) and individuals with the
same score during a particular life stage received the same rank for that stage. Lower
rankings corresponded to less problem behaviors. For each participant with at least one

112
sibling, the average of all their siblings’ ranks during childhood, adolescence, and
adulthood were also calculated—by summing the individuals’ sibling ranks and dividing
by the number of siblings each participant had. For example, if a given participant had
two siblings, one of whom had a childhood rank order of 54 the other 28, than that
participant would have a childhood average sibling rank of 41. Then during adolescence
this participant would have the average sibling rank that corresponded to the average of
his/her two sibs during that life stage. Therefore, each participant that had at least one
sibling had three average sibling rank values, one for each stage: childhood, adolescence,
and adulthood. Participants who had no siblings were treated as having missing data for
this variable. The mean average sibling rank during childhood was 48.75 (SD= 24.05),
48.30 (SD= 24.05) during adolescence, and 47.47 (SD= 26.11) during adulthood.
Individual differences
Parental reports of infant behavior were provided during an in-home interview
during the third data collection phase of the Texas Adoption Project, and rated and scored
on the IPB (see Chapter Two). In accordance with Thomas and Chess’s (1977)
conception of “easy” versus the “difficult” temperament, each participant was scored on
regularity of sleep, general disposition, and level of anxiety and activity they displayed as
infants and toddlers (age 0-3 years). The infant behavioral checklist was comprised of 9
items, most with 4 possible choices (1=rarely, 2=sometimes, 3=a lot of the time, 0=not
indicated/missing) which were coded by three independent raters (see Chapter Two).
Positive items were reverse scored. Possible scores ranged from 0-19, with higher scores
indicating more problematic, or “difficult,” infants (see Appendix 2B). Actual scores for
the adoptive sample ranged from 0-13, with a mean score of 3.61 (SD=2.93). For some of
the analyses individual item scores were used. For the logistic regression analyses, the
infant scores were then transformed into z-scores to make interactions run more
smoothly.
Childhood IQ was assessed by the Texas Adoption Project, during the first data
collection phase, using an age appropriate Wechsler intelligence test—most often the

113
Wechsler Intelligence Scale for Children (WISC) (Wechsler, 1949)—which has
outstanding reliability (split-half reliabilities 0.92-0.94 for the full-scale IQ) and validity
(correlations range from .85 with the Stanford-Binet to .95 with the Revised Beta
Examination) for assessing intellectual capacity (Wechsler, 1949). The adoptees from the
Texas Adoption Project had a full-scale IQ range of 76 (Borderline Defective) to 145
(Very Superior). The mean IQ score of the adoptees was 111.43 (SD= 11.32), or
Bright/Above Average (Wechsler, 1946).
Childhood and adolescent personality were rated by the adoptive mothers during
the first and second data collection phases of the Texas Adoption Project. The measures
included 24 bipolar items on which the adoptive mother indicated her perception of each
child’s placement on each bipolar personality dimension (Appendix 2A). Three scales—
Extraversion, Emotional Stability, and Well-Socialized—were then constructed using
factor analytic techniques (Loehlin, et al., 1981). Items for the Extraversion scale
included: Warm-hearted, Happy-go-lucky, Socially bold, Restrained(-), and Critical(-);
for the Well-Socialized scale: Conscientious, Controlled, Careless of social rules(-),
Frivolous(-), Unresponsive to threats(-), Affected by feelings; and for the scale of
Emotional Stability: Emotionally stable, Tense(-), Apprehensive(-), Unfrustrated,
Complacent. Items were reversed in scoring as indicated above by the (-) (see Appendix
A of Loehlin et al., 1981, for more information on item and scale scoring).
Analyses
First, a series of one-way Analyses of Variance (ANOVA) were run to estimate
between-group differences on biological mother characteristics, within-family
environmental factors, and individual characteristics for groups of adoptees that varied
according to risk status (Higher or Lower) and the relative levels of problem behaviors
they displayed (above average= Higher, below average= Lower) during childhood,
adolescence, and adulthood. Post hoc Bonferonni tests of multiple comparisons were also
used to identify which of the groups were statistically different from one another on each
of the measures for which significant group differences were indicated. ANOVAs were
114
run, rather than MANOVAs, because of the small group Ns and because the analyses
presented here were primarily for exploratory purposes.
Next, binary logistic regressions were used in order to assess potential individual
and family factors that directly influenced the development of problem behaviors
throughout the life course. Because the limited numbers of subjects that qualify as
members of each group, multinomial logistic regressions could not be used. Instead, two
separate binary regressions were run for each of the three life stages measured in this
investigation: one for the Higher-Risk group and one for the Lower-Risk group. It should
be noted that even the use of binary logistic regression on samples as small as those in
these analyses may render unreliable estimates. However, given the exploratory spirit of
this investigation, the use of the binary models best addresses the question of who
develops higher or lower problem behaviors within each of the risk groups.
Within each model, lower versus higher scorers on the IPB were compared. To
control for the influence of genetic factors that may influence problem behavior
development among adoptees, the birth mothers characteristics were entered in the first
block. Then, to test for shared family environmental effects, factors pertaining to the
adoptive family environment were entered in the second block of the regression
equations. Individual characteristics were entered in block three, to test their effects
above and beyond those of the birth mother and family environmental characteristics.
Finally, a couple of adoptive mother-child interaction terms were entered into the last
block.
The coefficients presented in the tables are Betas (or log-odds) and can be
difficult to interpret. Therefore, I have also presented a table with exponentiated Betas, or
odds ratios, for the significant factors to aid interpretation. I also elucidate the meaning of
the odds ratios for each of the significant effects in the text in the results section.
115
RESULTS
Though these analyses were exploratory in nature, results from the ANOVAs
supported the prediction that individual differences would differentiate individuals who
displayed high levels of problem behaviors across the life span. In childhood (Table 4.2)
children with higher IQs were least likely to display above average amounts of problem
behaviors, regardless of which risk group they were in. Children who displayed above
average levels of behavior problems also appeared to have been poorer sleepers and did
not like to cuddle during infancy. In addition, children who were at lower risk of
developing problem behaviors but who turned out to display above average levels of
behavior problems were generally rated as more difficult during infancy than all other
groups, although they were not statistically different from the Higher-Risk, Higher
Problem Behavior children. By definition, the birth mothers’ psychosocial index score
differentiated the Higher-Risk adoptees from the Lower-Risk adoptees. However, this
birth mother characteristic did not differentiate those children who developed above
average amounts of problem behaviors from those who developed below average levels.
Finally, none of the eight family environmental factors differentiated between risk groups
or problem behavior development levels.
Adolescent comparisons paint a similar picture (Table 4.3). Again, biological
mothers’ psychosocial index scores differentiated the Higher-Risk from the Lower-Risk
groups but none of the groups differed by adoptive family characteristics. Also the groups
were found to significantly differ from one another on a couple of key individual
differences. First, childhood rank order was found to differentiate both by risk status and
by problem behavior development. In general the adolescent Higher-Risk groups were
ranked higher in childhood problem behaviors than the Lower-Risk groups. However, the
Lower-Risk, Higher problem behavior adolescents were not found to differ significantly
from the Higher-Risk, Lower Problem Behavior adolescents on childhood rank order.
Second, the two “off diagonal” groups (i.e., the Resilient and the Vulnerable groups)
differed from one another on their adoptive mothers’ ratings of emotional stability
116
assessed during the adoptees childhood years. In other words, the Higher-Risk
adolescents who did not engage in excessive externalizing behaviors had been rated by
their adoptive mothers, during childhood, as being more emotionally stable than the
Lower-Risk adoptees that did manifest above average levels of externalizing, antisocial
types of behaviors during adolescence. A similar difference was observed for mothers’
ratings of socialization, although this difference was not statistically significant.
Table 4.4 presents the ANOVA results comparing the four groups of adoptees
during their adult years. Once again, the same pattern of group differences in birth mother
psychosocial adjustment emerged and similar individual characteristics were found to
differentiate the groups. As during childhood, significant between group differences were
found for intelligence. This time, although the overall pattern of means was similar, only
the Higher-Risk, Higher Problem Behavior adults were significantly lower in IQ than the
Lower-Risk, Lower Problem Behavior adults. As was found during adolescence, previous
rank order predicted group membership, and the same finding for mother-rated childhood
emotional stability emerged between the Higher-Risk, Lower problem behavior and
Lower-Risk, Higher problem behavior adults as was found during adolescence. In
addition, adolescent rank differentiated the higher problem behavior adults from the
lower problem behavior adults and mother ratings of socialization during adolescence
differentiated the Higher-Risk, Higher Problem Behavior Adults from the Higher-Risk,
Lower problem behavior adults. These final two results, together, suggest that
problematic adolescents (i.e., those who are rated as not being well socialized and those
who display relatively high levels of problem behaviors) become problematic adults.
During adulthood, one new finding was the ability for adoptive family factors to
differentiate between groups. Specifically, adoptive mothers’ IQ and psychosocial index
scores were found to significantly differ between groups. Lower-Risk, Higher problem
behavior adults tended to have smarter adoptive mothers than Higher-Risk, Lower
problem behavior adults. Higher-Risk, Higher Problem Behavior adults tended to have
adoptive mothers with more psychosocial problems than the Lower-Risk, Lower problem
behavior adults.

117
While informative, ANOVAs only had the ability to describe what individual,
biological mother, and family characteristics differed between the groups, not what
factors might have been an influence on how the Higher-Risk and Lower-Risk adoptees
developed over time. To explore questions of this nature more sophisticated statistical
techniques were used.
Binary Logistic Regressions
Binary logistic regressions were run to explore the influence of individual and
family level factors on the amount of problem behavior during childhood, adolescence,
and adulthood. Biological mother characteristics were entered as the first block to control
for the influence of the mothers’ genes on problem behavior development, home
environment characteristics were entered as block 2, individual characteristics as block
three, and interaction terms as block 4. Because of the low N in many of the group
comparisons (Ns equaled 25 and 27 for the Higher-Risk, Low and Higher-Risk, High
groups, respectively, during childhood), binary regression models were run separately for
the Higher-Risk and Lower-Risk groups, rather than using one multinomial regression
model. This method allowed the questions of causal inference to be explored. Due to the
sample sizes, however, care is advised when interpreting the outcome of the model
coefficients because of the possibility of type I error.
It should also be noted that the R2s presented at the bottom of each regression
table are Cox & Snell R2s, which some argue are not the same as those found in ordinary
least squares (OLS) regressions (UCLA Academic Technology Services, 2006). Others
(e.g., Wuensch, 2006), however, argue that Cox & Snell R2 s can be interpreted in the
same fashion (i.e., percent of the variance accounted for by the model). I have used the R2
values as they are used in OLS regressions. However, due to the debate regarding their
use, I did not use the R2 values to estimate effect sizes as I did in Chapter Two. Readers
are cautioned that the interpretations of the models presented may be debatable.
During childhood (Table 4.5), the model predicting higher vs. lower problem
behaviors among the Higher-Risk children indicated that both family and individual

118
characteristics influenced the development of problem behaviors. Once the interaction
between adoptive mother characteristics and the children’s characteristics were entered
into the model, no one specific factor remained significant. Although one should note the
relatively large standard errors in the final model. The size of those standard errors,
combined with the inconsistencies between the models with and without the interactions,
raises doubt regarding the reliability of the solution in the final model. The model itself
was significant and including all the factors and interactions accounted for 60% of the
difference in problem behaviors between Higher-Risk, Higher-Problem Behavior
children and Higher-Risk, Lower-Problem Behavior children. Although, due to the
previously mentioned sample size issue, this finding too might be questionable.
The models predicting higher and lower problem behaviors among the Lower-
Risk adoptees, during childhood are presented in Table 4.6. For the Lower-Risk adoptees
the only significant predictor of childhood behavior classification was the infant Index of
Problem Behavior z-score. Lower-Risk children who developed a higher number of
problem behaviors were more problematic as infants than Lower-Risk children who
developed lower amounts of behavioral problems. Specifically, for every additional point
increase on the infant IPB score the odds of falling into the Higher-Problem Behavior
group (vs. the Lower-Problem Behavior group) increased by a factor of 1.246 (Table
4.7). The infant score remained a significant predictor even after the interaction between
adoptive mother and adopted children’s characteristics were entered into the model.
While the final model (like that for the Higher-Risk children) was significant, the amount
of variance captured by the model distinguishing higher and lower problem behavior
children for the Lower-Risk adoptees was only 21 percent—relatively small compared to
the 60% that was accounted for by the same factors for the Higher-Risk group.
Regardless, this model implies that among individuals who do not have biological
mothers with strong indicators of defiant tendencies, having a difficult disposition as an
infant may be a risk factor for developing problem behaviors during childhood.
During adolescence (Tables 4.8 and 4.9), the models for the Higher-Risk and
Lower-Risk groups also differed from one another. For the Higher-Risk adolescents,

119
individual differences in childhood extraversion, socialization, and behavioral rank
positively and significantly predicted being in the higher problem behavior category.
Looking at the odds ratios presented in Table 4.7, a single percentage point increase in
childhood rank order increased the odds of a Higher-Risk adolescent being in the Higher-
Problem Behavior category by a factor of 1.051. A single point increase on the mother
rated extraversion scale (during childhood) increased the odds that a Higher-Risk
teenager would display above average levels of behavior problems by a factor of 1.201,
and a single point increase in childhood socialization increased the odds of being in the
Higher-Problem behavior group by a factor of 1.198.
As in the childhood model for Higher-Risk adoptees, the final model accounted
for 40 percent of variance in problem behaviors between the Higher-Risk, Higher-
Problem Behavior adolescents and the Higher-Risk, Lower-Problem Behavior
adolescents. None of the individual or family factors measured here were found to predict
higher verses lower problem behavior development among the Lower-Risk adolescent
adoptees. Results from the adolescent models suggest that, for the Higher-Risk
adolescent adoptees, previous indications of problematic behavior, extraversion, and
being well-socialized as a child10 may be risk factors for developing above average levels
of problem behavior during adolescence.
Finally, the adulthood models revealed yet another picture. While there were still
no significant environmental influences found in either of the full models (see Table 4.10
and 4.11), there were also no significant individual predictors of problem behavior
development in adulthood. The only significant predictor in both of the models was birth
mothers’ psychosocial functioning. However, the influence of birth mother psychosocial
functioning was in opposite directions and of very different magnitude between the
Higher- and Lower-Risk groups. While the Higher-Risk adults were more likely to score
10 Although the average age of the TAP participants was around eight-years-old when the adoptive mothers first rated them on their personality and general behavioral tendencies, some of the participants were adolescents at the time. However, most of the older participants were the biological children of the adoptive parents. So while a few of the adoptees may have been adolescents, most were children when this measure was taken.

120
in the high range of behavior problems when their biological mothers displayed more
problems with their overall psychosocial functioning, the Lower-Risk adults were more
likely to display higher amounts of problem behaviors when their biological mothers
exhibited fewer problems with overall psychosocial adjustment. Specifically, for each
elevated birth mother subscale, Higher-Risk adults odds of being in the Higher-Problem
Behavior category increased by a factor of 4.535, while the Lower-Risk adults odds
decreased by a factor of 0.011. This result was unexpected and will be explored in further
detail in the discussion section.
Also, unlike the childhood and adolescent models, the amount of variance
accounted for in both the Higher-Risk model and the Lower-Risk model was nearly
identical, 49 percent in the case of the Higher-Risk adults, 47 percent for the Lower-Risk
adults. However, the model was only significant for the Lower-Risk adults (most likely
due to the smaller N in the Higher-Risk adult model). Results from the adulthood models
suggest that once individuals reach full maturity their biological mothers’ general
psychosocial functioning may prevail in determining whether or not they go on to display
above average levels of problem behaviors, but how her functioning affects individuals
may first depend on her levels of deviant behavior.
DISCUSSION
The purpose of this investigation was to explore a unique data set, looking for
clues as to what factors might potentially serve as risk or protective factors for
individuals who have a genetic liability toward developing problem behaviors and to see
if these same factors influence problem behavior development among individuals who
are not at particularly high risk, genetically. Research presented in Chapter Two of this
dissertation supported the conclusion that biological mothers who give up their offspring
for adoption and who have elevated scores on the psychopathic deviate scale of the
Minnesota Multiphasic Personality Inventory leave these offspring at risk for developing
problem behaviors during childhood, adolescence, and up into middle adulthood.

121
According to this definition of risk, the current investigation explored the mean
differences, via ANOVAs, between Higher-Risk adoptees whose development went as
predicted and those who were resilient (i.e., Higher-Risk but displayed below average
levels of problem behaviors) on several individual and family level characteristics. In
addition, the same factors were investigated to see if they also differentiated individuals
who were classified as Lower-Risk. In other words, were the same factors related to the
development of predicted (i.e., lower) or unpredicted (i.e., higher) problem behaviors.
In an attempt to uncover some potentially causal factors, rather than simply
descriptive differences, binary logistic regressions were then used to test for the
significant main effects and interactions. Individual and family characteristics were
investigated as potential risk or protective factors for the two risk groups. Though this
investigation was exploratory in nature, past findings inspired a few predictions—namely
that individual characteristics, more than family factors, would influence the behavioral
development of individuals whose biological mothers showed varying degrees of
psychopathic deviance prior to the adoptees’ birth, and that family environmental factors,
heretofore suggested as main effects variables, would instead have interactive effects,
once genetic factors were taken into consideration.
Mean Difference
Results from the one-way ANOVAs supported the hypothesis that individual
characteristics would differ between groups of adoptees classified according to risk status
and behavioral outcome. The four groups of adoptees also showed significant differences
on some key biological mother characteristics. During childhood, adolescence, and
adulthood biological mothers’ index of psychosocial functioning scores showed the same
pattern across the four groups. Based on the means, it appeared as though the biological
mothers of the Higher-Risk adoptees tended to have more psychological problems than
psychopathic deviancy. From the definition of risk status, I expected most birth mothers
of the Higher-Risk adoptees to have at least one elevated sub-scale (the Pd sub-scale);

122
however, the mean number of birth mothers’ sub-scale elevations was around 2 for the
Higher-Risk adoptees. While the Higher-Risk, Higher-Problem Behavior group did not
significantly differ from the Higher-Risk, Lower-Problem Behavior group on the birth
mothers’ index scores, during adolescence and adulthood those who displayed fewer
problem behaviors tended to have birth mothers with slightly less psychosocial problems.
During childhood, however, the opposite trend was found with the birth mothers of the
High-Risk, Low-Problem Behavior Adoptees showing signs of more maladjustment.
While this difference was not statistically significant, this childhood finding is similar to
earlier findings from the Texas Adoption Project (Loehlin et al., 1982) which found that
the adoptees of more maladjusted mothers were rated by their adoptive mothers as better
functioning than adopted siblings whose birth mothers showed fewer signs of
maladjustment.
In addition, the ANOVA results showed that indicators of prior difficult behavior
(i.e., infant IPB score, childhood rank, and/or adolescent rank) differentiated the groups
by risk status and behavioral classification across the lifespan. For example, Lower
Problem Behavior children had lower scores on the infant total scale score than did the
Higher Problem Behavior children—with the Lower-Risk, High-Problem Behavior
children tending to be rated as the most difficult during infancy. Additionally, adolescents
and adults that manifested above-average levels of problem behaviors tended to be
ranked higher during earlier life stages than the adolescents and adults who developed
fewer problem behaviors, regardless of risk status. These findings support past work of
Moffitt (1993) and others (e. g., Bennett, Lipman, Brown, Racino, Boyle, & Offord,
1999; Jones & Forehand, 2003; Reitz, Dekovic, & Meijor, 2005), who have found
externalizing, antisocial behaviors to be relatively stable over time.
Particularly interesting was the finding that adoptees indications of childhood
emotional stability (as rated by the adoptive mothers’) tended to differ between the off
diagonal groups. During both adolescence and adulthood the Higher-Risk, Lower-
Problem Behavior (i.e., Resilient) adoptees and the Lower-Risk, Higher-Problem
Behavior (i.e., Vulnerable) adoptees significantly differed by how their adoptive mothers
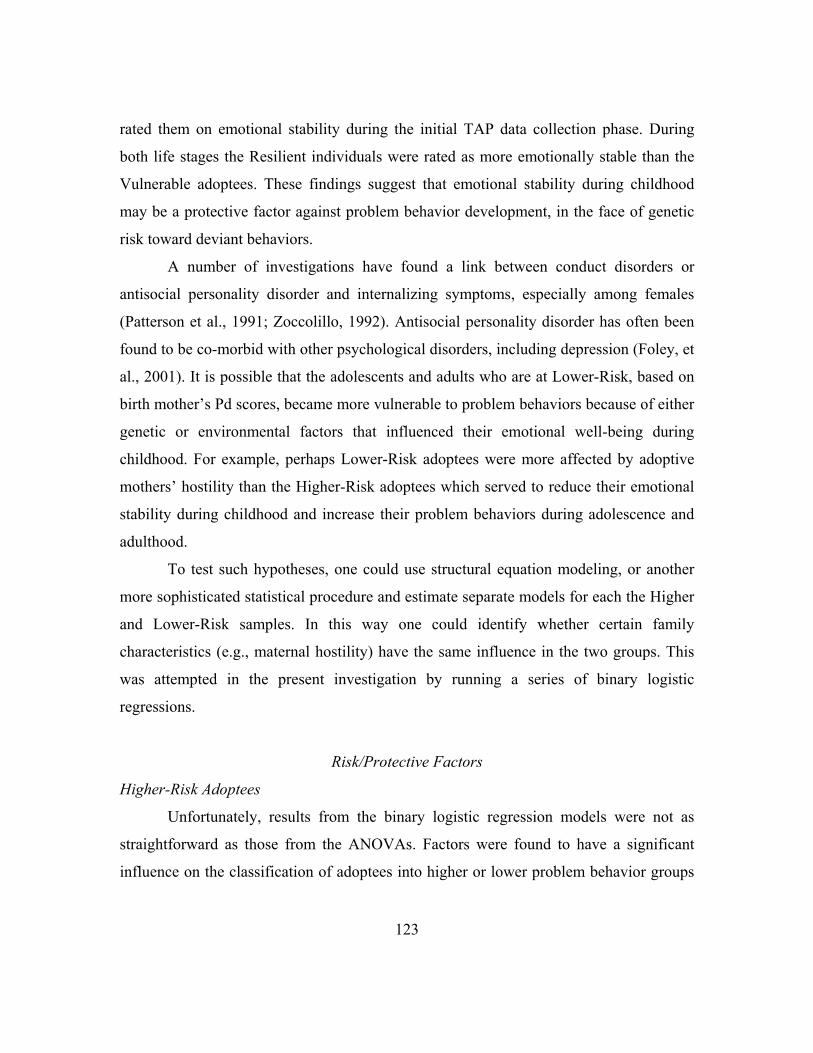
123
rated them on emotional stability during the initial TAP data collection phase. During
both life stages the Resilient individuals were rated as more emotionally stable than the
Vulnerable adoptees. These findings suggest that emotional stability during childhood
may be a protective factor against problem behavior development, in the face of genetic
risk toward deviant behaviors.
A number of investigations have found a link between conduct disorders or
antisocial personality disorder and internalizing symptoms, especially among females
(Patterson et al., 1991; Zoccolillo, 1992). Antisocial personality disorder has often been
found to be co-morbid with other psychological disorders, including depression (Foley, et
al., 2001). It is possible that the adolescents and adults who are at Lower-Risk, based on
birth mother’s Pd scores, became more vulnerable to problem behaviors because of either
genetic or environmental factors that influenced their emotional well-being during
childhood. For example, perhaps Lower-Risk adoptees were more affected by adoptive
mothers’ hostility than the Higher-Risk adoptees which served to reduce their emotional
stability during childhood and increase their problem behaviors during adolescence and
adulthood.
To test such hypotheses, one could use structural equation modeling, or another
more sophisticated statistical procedure and estimate separate models for each the Higher
and Lower-Risk samples. In this way one could identify whether certain family
characteristics (e.g., maternal hostility) have the same influence in the two groups. This
was attempted in the present investigation by running a series of binary logistic
regressions.
Risk/Protective Factors
Higher-Risk Adoptees
Unfortunately, results from the binary logistic regression models were not as
straightforward as those from the ANOVAs. Factors were found to have a significant
influence on the classification of adoptees into higher or lower problem behavior groups

124
among both the Higher-Risk and Lower-Risk samples of adoptees. However, no one
factor stood out as being a clear risk or protective factor across time for either group.
Among the adoptees classified as Higher-Risk, it seemed that the family
environment, along with the sex of the adoptees, influenced whether the adoptees, as
children, developed above average amounts of problem behaviors. Specifically, the
environment created by smart and caring mothers with well-behaved siblings influenced
the development of lower levels of problem behaviors among adoptees whose birth
mothers showed strong indications of defiant tendencies. However, these effects were no
longer significant once the interactions between adoptive mother and child characteristics
were added to the model. This result is contrary to my hypothesis that adoptive family
characteristics would interact with the adoptees’ individual characteristics to influence
problem behavior development. However, the relative effect size of adding the
interactions, compared to adding both the family and individual characteristics, was
small. In addition, the large standard errors in the model with the interactions and the
inconsistencies between the models with and without the interactions raise some doubt
regarding the accuracy of the results in the final (block four) model. It is possible that
with larger samples the individual and environmental effects would have remained after
the addition of the interaction terms.
During adolescence, the Higher-Risk adoptees levels of behavior problem
development were found to be predicted by their childhood personality and behavior.
While these findings were consistent with the ANOVA results, different personality
indicators were found to be associated with problem behavior development in the Higher-
Risk regression model. Here it was found that adoptive mothers’ ratings of extraversion
and socialization, not emotional stability, were related to problem behavior development.
Extraversion has been found to have two main components, sociability and impulsivity
(Eysenck & Eysenck, 1963), and impulsivity has been found to be strongly related to
externalizing behaviors (Eisenberg, Sadovsky, Spinrad, Fabes, Losoya, Valiente, et al.,
2005) and negatively related to adjustment (Eysenck & Eysenck, 1963). Therefore, it
seems likely that Higher-Risk adoptees that were also high on impulsivity would be

125
likely to exhibit more problem behaviors in adolescence, due to an underlying
temperamental/physiological propensity that keeps these individuals from assessing the
consequences of their actions and delaying gratification.
Though the direction of the effect between socialization and odds of being in the
Higher-Risk, Higher-Problem Behavior group may at first seem counterintuitive,
previous findings from the Texas Adoption Project may help shed some light on why this
result was found. In a study mentioned earlier, adoptees whose biological mothers were
more maladjusted were rated as better socialized during childhood. However, these same
adoptees were later rated by their adoptive mothers, during adolescence, as the least well-
socialized (Loehlin et al., 1987). The findings here may be a reflection of these same
tendencies. Consistent with earlier results, it appeared here that the adoptive family
environment may have had an influence on problem behavior development among
Higher-Risk adoptees during childhood, but that effect seems to have disappeared by
adolescence. The results from the adult Higher-Risk sample also provide little evidence
to suggest that the adoptive family environment has a lasting influence on the
development of behavior problems among adopted individuals.
Lower-Risk Adoptees
For the Lower-Risk adoptees, problematic infants tended to be more problematic
children. This result finds a good deal of support in the developmental literature,
especially that of Thomas and Chess (e.g., Chess, 1967; Thomas & Chess, 1977) and
Jerome Kagen and his colleagues. For example, Thomas, Chess, and Korn (1982) found
that more difficult infants—characterized by biological irregularity, inadaptability to
change, and strong emotional reactivity—displayed more externalizing behaviors both in
the classroom and in the home. Likewise, Rimm-Kaufman and Kagan (2005) have found
a moderate association between infant measures of reactivity to novel stimuli (high-
reactivity vs. low-reactivity) to adjustment and behavior problems in kindergarten. While
neither of the results mentioned above identified the infants according to level of risk, the
Lower-Risk adoptees measured in this analyses fall closer to the average risk value of

126
random individuals in the population (with birth mothers Pd T-scores averaging 57.65,
compared to the normative adolescent female mean of 59.52) than did the Higher-Risk
group (whose birth mothers’ average Pd T-score was 74.45). Therefore, the Lower-Risk
adoptees problem behaviors may have more typical indicators of childhood behavior
problem development, such as infant temperament, than the Higher-Risk adoptees.
None of the factors measured here, whether individual or family environmental,
predicted whether Lower-Risk adolescent adoptees developed above average or below
average behavior problems. This could be due to the fact that I was not able to capture the
factors that do predict externalizing behaviors for this group in the measurements or that
behavior problem development, to the extent that this group did develop behavior
problems, was more normative for this group. Moffitt’s (1993) results on problem
behavior development suggest that within more normative samples acute increases of
externalizing behaviors, even severe criminal delinquency, may be normative during
adolescence. Therefore, there may not be any “typical” childhood or family indicators of
adolescent behavior problems among non-High-Risk groups. Instead, other
environmental factors that are unique to the individual (i.e., non-shared), such as having a
caring relationship with an adult outside the home (Garmezy, 1991, 1993; Werner, 1993;
Werner & Smith, 1992) or experiencing a trauma, such as the death of a close friend
(Werner 1993), may act as protective (in the former case) or risk (in the latter case)
factors toward problem behavior development among Lower-Risk groups.
In adulthood, the same factors did significantly predict the development of above
average levels of problem behaviors for both the Higher-Risk and Lower-Risk adoptees.
Specifically, the birth mothers’ index of psychosocial functioning predicted behavioral
outcomes in adulthood, positively for the Higher-Risk adoptees but negatively for the
Lower-Risk adoptees. While the former result is consistent with the theory that there is an
underlying genetic basis for problem behavior development, the latter, while also
suggesting some sort of genetic hypothesis, seems counterintuitive. However, this finding
bears some resemblance to the results mentioned earlier (Loehlin et al., 1982) regarding
the shift in maternal rating of adoptees with more maladjusted birth mothers. Although

127
this particular finding reversed by adolescence, when the adoptive sibling with the most
maladjusted birth mother displayed more adjustment problems, perhaps for Lower-Risk
group some sort of negative relationship between more biological mother maladjustment
and less adoptee maladjustment has continued. In other words, perhaps the Lower-Risk
adoptees who have birth mothers with more generalized psychological maladaptation
continue to be among the least problematic throughout the life span. However, because
most adolescents increased on the amount of problem behaviors during adolescence, the
relationship between birth mothers’ psychological maladjustment and the Lower-Risk
adoptees problem behaviors could not be detected until after the adolescent peak
subsided. In any case, it is possible that shared environmental factors not measured here,
or non-shared environmental factors may also be involved. Further research using
genetically informed designs that follow individuals into adulthood may help isolate
other aspects of the environment which may be influencing the development of problem
behaviors. Twin methods may be helpful in investigating the effects of the non-shared
environment on problem behavior outcomes. Specifically, by looking at the differences in
behaviors between MZ twins the influence of non-shared environmental factors can be
assessed.
The finding that birth mothers’ general psychosocial functioning had opposite
effects on the adoptees with Higher and Lower-risk might conceivably reflect the method
used to split the sample. Any time samples are chosen by an extreme score on a
measure—such as the Higher-Risk sample being selected based on a Pd T-score of 65 or
higher—the sample is susceptible to restriction of range on other, correlated factors. A
post-hoc set of correlations between birth mothers’ Pd T-scores and their scores on the
general index of psychosocial functioning (i.e., summation of elevated MMPI subscales)
revealed that the two measures were moderately strongly correlated (r= 0.48, p< .001)
for the Higher-Risk adoptees, but less correlated for the Lower-Risk adoptees (r= 0.29,
p< .05). This might result in more restriction of range for mothers’ psychopathology in
the Higher-Risk group, but seems unlikely to have reversed the direction of the
relationship altogether.

128
Because of the nature of the sample used to investigate the question of problem
behavior development among two groups of adoptees who differed in the amount of
relative risk they possessed, this investigation was done in an exploratory spirit. Cutting
an already small sample into smaller groups did not enable me to fully test the models
presented here. In addition, small samples can present problems with the reliability of the
estimation of effects when using logistic regression, therefore, making the conclusion
tenuous that shared environmental factors have no effect. I have appended a correlation
matrix (Appendix 4A) for anyone interested in pursuing alternative interpretations of the
models presented in this chapter.
Some readers may also wonder if the insignificant family influences were the
result of adding genetic controls into the model first and not just a sample artifact.
Therefore, I have conducted a series of supplemental analyses where I do not include the
birth mothers’ characteristics into the models first. Specifically, the family factors were
entered in the first block, the adoptees’ characteristics in block two, and the adoptive
mother, adoptive child interactions were entered into the third block. No birth mother
characteristics were specified in the model. Comparing the outcomes of the two sets of
models, those with and without the birth mothers’ characteristics, allowed me to test
whether the shared-family factors have emerge as significant predictors of behavior
problem development in the absence of genetic controls. In addition, if significant family
factors were to emerge, I would be more able to draw conclusions about the interaction
between genes and the environment.
The results of these models are presented in the Appendix 4B through 4G, and
only partially support the idea that without genetic controls common family factors would
be significant indicators. For Higher-Risk children (Appendix 4B) and Lower-Risk adults
(Appendix 4G) some of the shared family characteristics emerged as significant
predictors of Higher-Problem Behaviors versus Lower-Problem Behaviors. For the other
four models (Lower-Risk children, Higher-and Lower-Risk adolescents, and Higher-Risk
adults) the results were very similar with and without the birth mothers characteristics.

129
The major conclusion regarding the limited ability of the shared family factors measured
here to influence problem behavior development among adoptees remains supported.
Further investigation into the development of problem behaviors, across the
lifespan, using large genetically informed samples is needed in order to tease apart the
influence of shared and non-shared environmental factors on groups who differ in the
amount of genetic risk they face. The findings presented here may help to guide future
research by providing potential within-family characteristics to investigate, such as
maternal intelligence and sibling behaviors, as well as an alternate method of identifying
resilient and vulnerable individuals who vary in the amount of genetic risk for problem
behaviors.
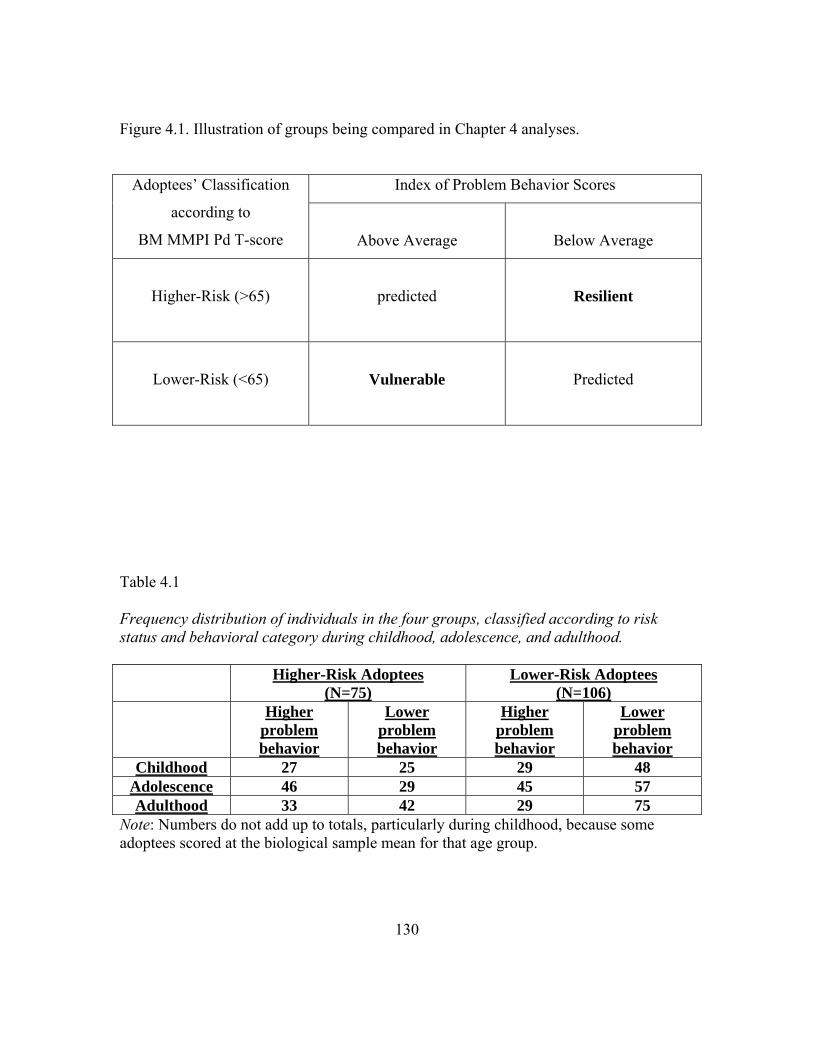
130
Figure 4.1. Illustration of groups being compared in Chapter 4 analyses.
Index of Problem Behavior Scores Adoptees’ Classification
according to
BM MMPI Pd T-score
Above Average
Below Average
Higher-Risk (>65)
predicted
Resilient
Lower-Risk (<65)
Vulnerable
Predicted
Table 4.1 Frequency distribution of individuals in the four groups, classified according to risk status and behavioral category during childhood, adolescence, and adulthood. Higher-Risk Adoptees
(N=75)Lower-Risk Adoptees
(N=106) Higher
problem behavior
Lower problem behavior
Higher problem behavior
Lower problem behavior
Childhood 27 25 29 48 Adolescence 46 29 45 57 Adulthood 33 42 29 75
Note: Numbers do not add up to totals, particularly during childhood, because some adoptees scored at the biological sample mean for that age group.

131
Table 4.2 Mean Differences in Biological Mother Characteristics, Family Environment, and Individual Characteristics by Risk Status and Behavioral Category, during Childhood.
Group Means (Std. Error) Higher-
Risk, Hi PB (N=27)
Higher-Risk,
Lo PB (N=25)
Lower-Risk, Hi PB (N=29)
Lower-Risk, Lo PB (N=48)
F Statistics
Biological Mother Characteristics Age at birth of Ss Beta IQ Psychosocial index Score
19.67 (1.00) 105.52 (1.78) 1.96 (.28)a,c
18.76 (.487) 110.13 (1.57) 2.28 (1.7)b,d
18.79 (.477) 109.46 (1.47) 0.42 (.14)a,b
19.60 (.331) 106.37 (1.64) 0.41 (.12)c,d
0.740 1.657
21.951***
Family Environment SES AM Beta IQ AM Education AM warmth AM emotional stb. AM Psychosocial Index score # of siblings Siblings’ ave. child IPB rank
168.44 (4.74) 111.38 (1.76)
5.44 (.229) 5.50 (.401) 5.62 (.364)
0.630 (.245)
2.30 (.158) 41.81 (4.13)
169.16 (4.86) 114.32 (1.10)
5.32 (0.25) 6.12 (.452) 6.08 (.364) 0.20 (0.10)
2.32 (.802)
46.70 (5.75)
165.03 (4.20) 115.21 (1.51)
5.48 (.208) 5.55 (.342) 6.48 (.320) 0.10 (.076)
2.28 (.156)
47.73 (4.99)
167.04 (3.50) 114.62 (1.05)
5.33 (.177) 5.39 (1.41) 6.57 (1.85) 0.23 (.116)
2.31 (.108)
45.63 (3.91)
0.159 1.424 0.140 0.899 1.787 2.241
0.018 0.260
Individual Characteristics Sex Wechsler IQ Type of sleeper Freq. of crying Liked to be cuddled (r) Generally happy (r) Shy w/ strangers Anxious/nervous Freq. of tantrums Activity level Total infant scale score
0.30 (.090) 106.6 (2.4)a,d
0.78 (.202) 0.19 (.120) 1.26 (.217) 0.41 (.162) 0.26 (.147) 0.07 (.074) 0.22 (.154) 1.44 (.347) 4.63 (.706)
0.64 (.098) 115.5 (2.3)a,b
0.32 (.095) 0.16 (.125) 0.80 (.191) 0.24 (.133) 0.24 (.133) 0.04 (.040 0.12 (.120) 0.84 (.293) 2.76 (.494)a
0.41 (.044) 109.4 (2.1)b,c
0.79 (.201) 0.59 (.202) 1.55 (.190) 0.55 (.145) 0.17 (.087) 0.00 (.000) 0.17 (.122) 1.21 (.303)
5.03 (.502)a, b
0.50 (.073) 114.3 (1.8)c,d
0.29 (.084) 0.23 (.091) 0.92 (.151) 0.35 (.105) 0.38 (.128) 0.15 (.079) 0.00 (.000) 0.73 (.192) 3.04 (.367)b
2.286 3.666* 3.750* 2.020 3.203* 0.813 0.494 0.962 1.153 1.519
4.859**
Note: Groups that share superscripts on an item/measure are statistically different from one another at the p< .05 level. AM= adoptive mother, IPB= Index of Problem Behavior. Ns do not add up to the total adoptive sample size of 181 because of 60 of the adoptees childhood IPB scores were equal to the biological children’s average score.

132
Table 4.3 Mean Differences in Biological Mother Characteristics, Family Environment, and Individual Characteristics by Risk Status and Behavioral Category, during Adolescence.
Group Means (Std. Error) Higher-
Risk, Hi PB (N=46)
Higher-Risk,
Lo PB (N=29)
Lower-Risk, Hi PB (N=48)
Lower-Risk, Lo PB (N=57)
F Statistics
Biological Mother Characteristics Age at birth of Ss Beta IQ Psychosocial index Score
19.57 (.643) 108.33 (1.32) 2.09 (.232)a,c
19.24 (.739) 108.62 (1.20) 1.86 (.316)b,d
18.79 (.446) 108.62 (1.48) 0.35 (.091)a,b
19.81 (.382) 107.94 (1.29) 0.49 (.120)c,d
0.773 0.059
24.851***
Family Environment SES AM Beta IQ AM Education AM warmth AM emotional stb. AM Psychosocial Index score # of siblings Siblings’ ave. child IPB rank Siblings’ ave. teen IPB rank
164.85 (3.52) 112.02(1.25) 5.33 (.189) 5.49 (.303) 5.89 (.264) 0.43 (.154)
2.43 (.119)
50.48 (3.37) 47.03 (3.81)
172.90 (4.66) 113.52 (1.18)
5.52 (.236) 5.82 (.443) 6.64 (.338) 0.17 (.100)
2.34 (.151)
43.42 (5.01) 45.53 (4.91)
173.33 (2.76) 115.88 (1.45)
5.69 (.171) 5.29 (.238) 6.48 (.236) 0.08 (.050)
2.46 (.849)
47.90 (3.93) 43.30 (4.05)
165.72 (3.29) 113.69 (.973)
5.42 (.162) 5.47 (.199) 6.45 (.236) 0.19 (.098)
2.26 (.095)
47.75 (3.49) 47.99 (3.17)
1.686 2.034 0.738 0.496 1.484 1.993
0.654 0.442
0.310
Individual Characteristics Sex Wechsler IQ Total infant scale score Extraversion (T1) Well-Socialized (T1) Emotional Stability (T1) Childhood Rank
0.41 (.073) 108.69 (1.78)
3.93 (.479) 50.25 (1.01) 32.61 (1.19) 47.43 (.936) 50.25 (1.01)a
0.52 (.094) 112.43 (2.25)
3.79 (.598)48.04 (1.65) 33.58 (1.54) 50.41 (1.10)a
48.04 (1.65)
0.44 (.072) 111.43 (1.59)
4.02 (.372)48.11 (1.24) 30.25 (.882) 46.61 (.877)a
48.11 (1.24)b
.49 (.067) 113.76 (1.52)
3.49 (.390)47.65 (1.01) 32.83 (.833) 48.05 (.647) 47.65 (1.0)a,b
0.364 1.683 0.323 1.055 1.754 2.697*
4.917**
Note: Groups that share superscripts on an item/measure are statistically different from one another at the p< .05 level. AM= adoptive mother, IPB= Index of Problem Behavior.

133
Table 4.4 Mean Differences in Biological Mother Characteristics, Family Environment, and Individual Characteristics by Risk Status and Behavioral Category, during Adulthood.
Group Means (Std. Error) Higher-
Risk, Hi PB (N=33)
Higher-Risk,
Lo PB (N=42)
Lower-Risk, Hi PB (N=29)
Lower-Risk, Lo PB (N=75)
F Statistics
Biological Mother Characteristics Age at birth of Ss Beta IQ Psychosocial index Score
19.76 (.897) 108.50 (1.22) 2.39 (.271)a,c
19.19 (.508) 108.40 (1.35) 1.69 (.249)b,d
18.62 (.582) 106.00 (2.11) 0.28 (.121)a,b
19.61 (.341) 109.12 (1.08) 0.49 (.844)c,d
0.712 0.811
27.407***
Family Environment SES AM Beta IQ AM Education AM warmth AM emotional stb. AM Psychosocial Index score # of siblings Siblings’ ave. child IPB rank Siblings’ ave. teen IPB rank Siblings’ ave. adult IPB rank
166.79 (4.35) 113.03(1.38) 5.33 (.233) 5.42 (.337) 5.94 (.325) 0.58 (.209)a
2.42 (.151)
48.65 (4.12) 46.35 (4.89)
52.09 (4.96)
168.88 (3.78) 112.2 (1.18)a
5.45 (.190) 5.78 (.366) 6.38 (.277) 0.14 (.064)
2.38 (.118)
46.91 (3.98)
46.50 (3.76) 45.30 (3.90)
170.97(3.88) 113.6 (.904) 5.76 (.231) 4.97 (.312) 6.69 (.314) 0.21 (.104)
2.38 (.144)
42.23 (4.89) 42.99 (5.41)
43.71 (5.45)
168.84 (2.70) 117.3 (1.26)a
5.47 (.139) 5.58 (.173) 6.36 (.198) 0.12 (.071)a
2.35 (.092)
49.92 (3.09) 47.22 (2.85)
45.39 (3.30)
0.921 2.769* 0.649 1.199 0.980 3.361*
0.074 0.650
0.186
0.602
Individual Characteristics Sex Wechsler IQ Total infant scale score Extraversion (T1) Well-Socialized (T1) Emotional Stability (T1) Extraversion (T2) Well-Socialized (T2) Emotional Stability (T2) Childhood Rank Adolescent Rank
0.36 (.085) 107.0 (2.28)a
4.09 (.655) 50.56 (1.08) 30.91 (1.54) 47.03 (1.21) 43.43 (1.73) 26.78 (1.99)a
45.17 (1.35) 68.47(4.35)a,b
70.5 (4.97)a,b
0.52 (.078) 112.54 (1.68)
3.71 (.425)48.46 (1.34) 34.62 (1.10) 49.82 (.850)a
43.37 (2.00) 33.71 (1.79)a
46.96 (1.34) 44.09 (4.47)a
52.1 (3.96)b,c
0.55 (.094) 108.41(2.06) 4.24 (.522)
46.41 (1.87) 30.04 (1.25) 45.22 (1.00)a
43.33 (1.87) 30.88 (1.92) 44.65 (1.58) 60.23 (5.53) 70.6 (4.78)c,d
.43 (.057) 114.3 (1.27)a
3.53 (.321)48.32 (.827) 32.21 (.708) 48.24 (.613) 45.44 (.908) 32.00 (.942) 47.33 (.732) 48.71 (2.88)b
45.9 (3.15)a,d
1.075 4.014** 0.527 1.458 2.910*
4.000** 0.659 3.250* 1.245
6.571*** 9.856***
Note: Groups that share subscripts on an item/measure are statistically different from one another at the p< .05 level. AM= adoptive mother, IPB= Index of Problem Behavior.

134
Table 4.5 Childhood Binary Logistic Regression Model predicting High or Low Index of problem Behavior Scores among individuals who were at Higher-Risk toward developing behavior problems. Block 1
B (S.E.) Block 2 B (S.E.)
Block 3 B (S.E.)
Block 4 B (S.E.)
Biological Mother Characteristics IQ Age at birth of child Psychosocial Profile Score
-0.07 (.041) 0.05 (.078) -0.07 (.194)
-0.09 (.050) 0.02 (.121) -0.16 (.281)
-0.16 (.085) -0.03 (.169) 0.02 (.486)
-0.58 (.383) -0.51 (.471) -0.53 (.787)
Adoptive Family Characteristics SES AM education AM IQ AM warmth AM emotional stability AM psychosocial profile score # of sibs Mean sib IPB rank
-0.01 (.038) 0.76 (.755) -0.14 (.081) -0.41 (.257) -0.22 (.288) 1.19 (.866)
1.16* (.590) -0.03 (.020)
-0.10 (.071) 2.88 (1.59)
-0.25* (.125) -0.93* (.465) -0.27 (.460) -0.03 (1.40)
2.77* (1.32) -0.12* (.053)
-0.48 (0.321) 13.02 (8.66) -0.72 (.470) -3.48 (2.15) -1.23 (1.09) -2.57 (2.25)
10.59 (6.99) -0.58 (.386)
Individual Characteristics Sex IQ score Infant IPB score
-5.23* (2.381) -0.15 (.079) 0.23 (.712)
-21.23 (13.5) -0.54 (.366) -0.43 (.472)
Interactions AM warmth X Infant IPB score AM IQ X Child IQ
-3.36 (2.40)
3.45 (3.39) Constant Chi-square R2
6.96 (4.64) 4.348 0.09
25.24* (12.22) 18.569 0.33
75.30* (30.89) 36.35**
0.55
284.40 (177.2) 42.37***
0.60 Note: AM= adoptive mother, IPB= Index of Problem Behavior ratings. *p< .05, **p< .01, N=46

135
Table 4.6 Childhood Binary Logistic Regression Model prediction High or Low Index of problem Behavior Scores among individuals who were at Lower-Risk toward developing behavior problems. Block 1
B (S.E.) Block 2 B (S.E.)
Block 3 B (S.E.)
Block 4 B (S.E.)
Biological Mother Characteristics IQ Age at birth of child Psychosocial Profile Score
-0.02 (.021) 0.02 (.055) 0.02 (.131)
-0.02 (.023) -0.02 (.057) -0.04 (.143)
-0.01 (.027) 0.03 (.062) -0.04 (.160)
0.00 (.028) 0.03 (.062) -0.09 (.167)
Adoptive Family Characteristics SES AM education AM IQ AM warmth AM emotional stability AM psychosocial profile score # of sibs Mean sib IPB rank
-0.02 (.016) 0.52 (.320) -0.02 (.029) -0.05 (.123) -0.09 (.115) 0.17 (.242) 0.18 (.270)
-0.01 (.008)
-0.01 (.017) 0.30 (.349) -0.02 (.031) 0.06 (.133) -0.04 (.125) 0.10 (.268) 0.25 (.308)
-0.01 (.009)
-0.01 (.017) 0.31 (.351) -0.01 (.032) 0.10 (.139) -0.04 (.126) 0.13 (.269) 0.17 (310)
-0.01 (.009)
Individual Characteristics Sex IQ score Infant IPB score
-0.80 (.442) -0.05 (.020)
0.23** (.083)
-0.76 (.449) -0.05 (.021) 0.22* (.086)
Interactions AM warmth X Infant Score AM IQ X Childhood IQ
-0.31 (240)
0.12 (.227)
Constant Chi-square R2
1.31 (2.575) 0.980 0.01
6.14 (4.365) 7.010 0.06
6.40 (5.304) 24.86* 0.19
5.97 (5.362) 26.987*
0.21 Note: AM= adoptive mother, IPB= Index of Problem Behavior ratings. N= 105. *p< .05, **p< .01

136
Table 4.7 Odds ratios for significant effects from models 4.5-4.6 and 4.8-4.11 (Block 4 full models only). Higher-Risk Adoptees Lower-Risk Adoptees Childhood Infant IPB score Adolescence Childhood rank order Childhood Extraversion Childhood Socialization Adulthood BM general psychosocial functioning
.650
1.051* 1.201* 1.198*
4.535*
1.246*
1.018 0.994 0.972
0.011*
Note: IPB= Index of Problem Behavior, BM= biological mother. Group Ns range from 42-62 for the Higher-Risk group and 60-105 for the Lower-Risk group. *p<.05.

137
Table 4.8 Adolescent binary logistic regression model predicting High or Low Index of problem Behavior Scores among individuals who were Higher-Risk toward developing behavior problems. Block 1
B (S.E.) Block 2 B (S.E.)
Block 3 B (S.E.)
Block 4 B (S.E.)
Biological Mother Characteristics IQ Age at birth of child Psychosocial Profile Score
0.00 (.033) 0.01 (.060) 0.12 (.165)
0.02 (.039) 0.02 (.069) 0.02 (.198)
0.04 (.069) -0.05 (.101) 0.33 (.285)
0.05 (.075) -0.03 (.109) 0.33 (.328)
Adoptive Family Characteristics SES AM education AM IQ AM warmth AM emotional stability AM psychosocial profile score # of sibs Mean sib IPB rank
-0.02 (.027) 0.27 (.502) -0.01 (.050) -0.06 (.149) -0.34 (.190) 0.50 (.466) 0.41 (.392)
0.01 (.013)
0.01 (.039) -0.41 (.701) -0.01 (.084) -0.07 (.199) -0.45 (.267) 0.30 (.580) 0.73 (.547)
0.02 (.018)
0.03 (.044) -0.86 (.812) -0.05 (.102) -2.67 (.258) -0.50 (.291) 0.04 (.668) 0.86 (.608)
0.02 (.019)
Individual Characteristics Sex IQ score Infant z-score Child rank Extraversion (1) Well-socialized (1) Emotional Stability (1)
-0.51 (.959) 0.02 (.039) -0.09 (.159) 0.04* (.018) 0.16* (.075) 0.15 (.081) -0.21 (.127)
-0.61 (1.09) 0.04 (.047) -0.12 (.169) 0.05* (.021) 0.18* (.082) 0.18* (.084) -0.51 (.332)
Interactions AM IQ X Child IQ AM ES X Child ES
1.11 (.852) 0.05 (.050)
Constant Chi-square R2
0.10 (3.76) 0.59 0.01
1.66 (4.78) 9.96 0.15
-7.78 (13.23) 28.38 0.37
5.89 (18.98) 32.36* 0.41
Note: AM= adoptive mother, Ss=participant, IPB= Index of Problem Behavior ratings, ES= emotional stability. N=62 *p< .05, **p< .01

138
Table 4.9 Adolescent binary logistic regression model predicting High or Low Index of problem Behavior Scores among individuals who were at Lower-Risk toward developing behavior problems. Block 1
B (S.E.) Block 2 B (S.E.)
Block 3 B (S.E.)
Block 4 B (S.E.)
Biological Mother Characteristics IQ Age at birth of child Psychosocial Profile Score
0.00 (.027) -0.09 (.078) -0.14 (.288)
-0.01 (.029) -0.12 (.085) 0.03 (.317)
-0.01 (.034) -0.15 (.096) 0.00 (.386)
-0.01 (.035) -0.16 (.097) 0.04 (.396)
Adoptive Family Characteristics SES AM education AM IQ AM warmth AM emotional stability AM psychosocial profile score # of sibs Mean sib IPB rank
0.01 (.017) -0.11 (.311) 0.02 (.032) -0.12 (.159) -0.09 (.151) -0.35 (.507) 0.35 (.326)
-0.01 (.010)
0.04 (.021) -0.45 (.363) 0.02 (.035) -0.11 (.175) -0.03(.170) -0.19 (.595) 0.34 (.352)
-0.01 (.011)
0.03 (.022) -0.41 (.376) 0.02 (.036)
-1.62 (1.799) -0.02 (.172) -0.13 (.642) 0.34 (.358)
-0.02 (.013)
Individual Characteristics Sex IQ score Infant z-score Child rank Extraversion (1) Well-socialized (1) Emotional Stability (1)
-0.32 (.564) -0.03 (.027) 0.14 (.115) 0.02 (.011) 0.01 (.038) -0.03 (.049) 0.00 (.063)
-0.34 (.569) -0.04 (.030) 0.12 (.115) 0.02 (.011) -0.01 (.040) -0.03 (.051) -0.18 (.227)
Interactions AM IQ X Child IQ AM ES X Child ES
0.23 (.298) 0.03 (.039)
Constant Chi-square R2
1.89 (3.397) 1.653 0.02
-0.53 (4.78) 7.994 0.09
-1.56 (6.772) 19.743 0.21
11.26 (13.222) 21.083 0.22
Note: AM= adoptive mother, IPB= Index of Problem Behavior ratings, ES= emotional stability *p< .05, **p< .01 N=83

139
Table 4.10 Adulthood Binary Logistic Regression Model prediction High or Low Index of problem Behavior Scores among individuals who were Higher-Risk toward developing behavior problems. Block 1
B (S.E.) Block 2 B (S.E.)
Block 3 B (S.E.)
Block 4 B (S.E.)
Biological Mother Characteristics IQ Age at birth of child Psychosocial Profile Score
0.07 (.042) 0.05 (.147) 0.41 (.217)
0.07 (.050) 0.09 (.167) 0.48 (.280)
-0.12 (.070) -0.09 (.262) 0.99 (.539)
0.18 (.104) -0.52 (.493) 1.51* (.745)
Adoptive Family Characteristics SES AM education AM IQ AM warmth AM emotional stability AM psychosocial profile score # of sibs Mean sib IPB rank
0.03 (.037) -0.30 (.665) 0.06 (.069) -0.15 (.225) -0.13 (.240) 1.25 (.807) 0.46 (.540)
0.01 (.017)
0.05 (.053) -1.13 (1.01) 0.14 (.115) 0.01 (.319) -0.32 (.441) 0.48 (.884) 0.50 (.900)
0.02 (.026)
0.06 (.056) -1.02 (1.11) 0.20 (.168) -2.16 (4.01) -0.83 (.637) 1.70 (1.82) 0.31 (.855)
0.04 (.032)
Individual Characteristics Sex IQ score Child rank Adolescent rank Extraversion (2) Well-socialized (2) Emotional Stability (2)
-0.06 (1.35) 0.03 (.048) 0.05 (.030) 0.03 (.026) -0.04 (.070) -0.08 (.055) 0.06 (.103)
-0.21 (2.03) -0.01 (.063) 0.06 (.035) 0.01 (.031) -0.07 (.084) -0.14 (.098) -0.31 (.449)
Interactions AM IQ X Child IQ AM ES X Teen ES
-2.12 (1.51) 0.06 (.089)
Constant Chi-square R2
-8.99 (5.22) 5.99 0.13
-20.05 (10.69) 11.85 0.25
-37.50 (18.47) 24.65 0.44
-21.30 (30.47) 28.60 0.49
Note: AM= adoptive mother, IPB= Index of Problem Behavior ratings, ES=emotional stability. *p< .05, **p< .01 N=42

140
Table 4.11 Adulthood Binary Logistic Regression Model prediction High or Low Index of problem Behavior Scores among individuals who were at Lower-Risk toward developing behavior problems. Block 1
B (S.E.) Block 2 B (S.E.)
Block 3 B (S.E.)
Block 4 B (S.E.)
Biological Mother Characteristics IQ Age at birth of child Psychosocial Profile Score
-0.02 (.044) -0.17 (.136) -0.98 (.734)
-0.03 (.058) -0.05 (.160)
-1.54 (.1.071)
-0.08 (.090) -0.11 (.303)
-2.69* (1.32)
-0.14 (.151) -0.19 (.607)
-4.49* (2.24)
Adoptive Family Characteristics SES AM education AM IQ AM warmth AM emotional stability AM psychosocial profile score # of sibs Mean sib IPB rank
-0.01 (.033) 0.80 (.568) 0.02 (.060) -0.54 (.309) 0.26 (.264) 0.69 (1.77) -0.85 (.603)
0.01 (.014)
-0.03 (.044) 1.09 (.841) 0.10(.094)
-0.20 (.356) -0.61 (.442) 3.28 (3.46) -1.60 (.934)
0.02 (.027)
0.00 (.070) 0.91 (1.367) 0.11 (.178) 18.35 (10.4) 0.38 (.847) 7.22 (7.27) -2.65 (1.56)
0.06 (.056)
Individual Characteristics Sex IQ score Child rank Adolescent rank Extraversion (2) Well-socialized (2) Emotional Stability (2)
-0.78 (1.121) -0.05 (.063) 0.03 (.027) 0.05 (.034) -0.09 (.092) 0.12 (.096) -0.10 (.112)
-1.66 (2.030) -0.21 (.169) 0.04 (.045) 0.08 (.055) -0.23 (.142) 0.26 (.156) 1.81 (1.028)
Interactions AM IQ X Child IQ AM ES X Teen ES
0.55 (1.258) -0.40 (.223)
Constant Chi-square R2
3.86 (5.807) 4.466 0.07
-0.71 (10.243) 14.749 0.22
2.629 (17.923) 28.85* 0.38
-62.528 (49.85) 38.01**
0.47 Note: AM= adoptive mother, IPB= Index of Problem Behavior ratings, ES= emotional stability *p< .05, **p< .01 N=60
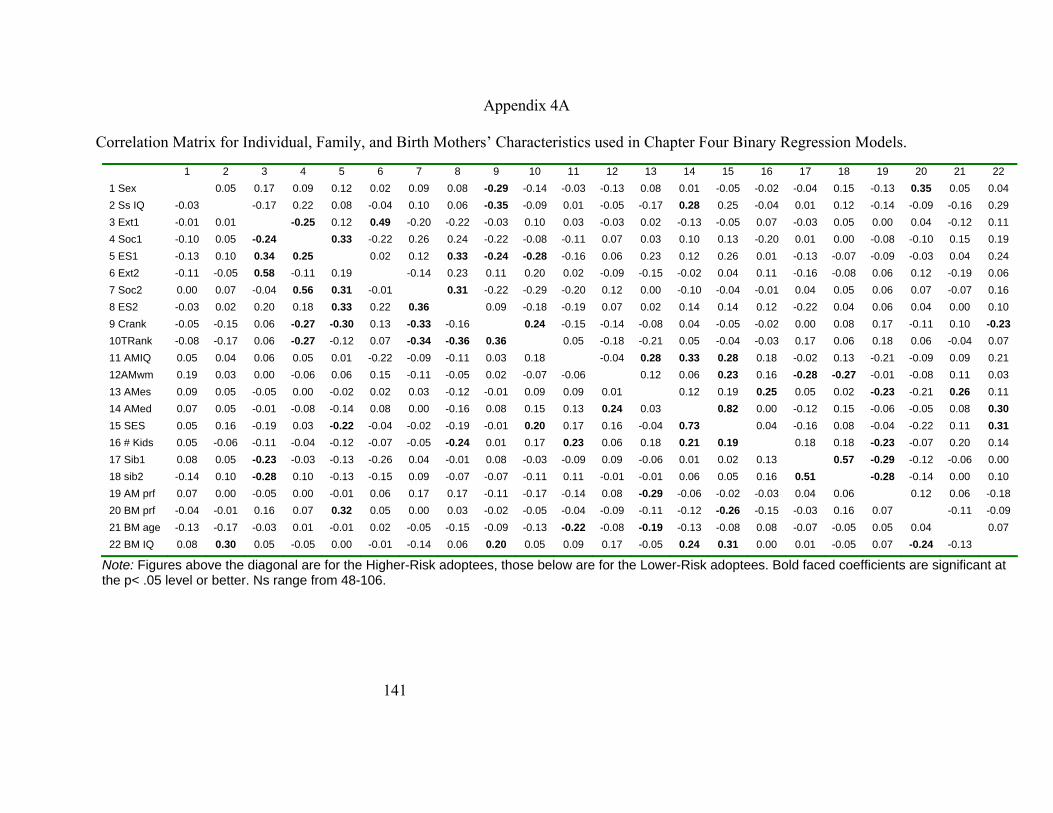
141
Appendix 4A Correlation Matrix for Individual, Family, and Birth Mothers’ Characteristics used in Chapter Four Binary Regression Models.
1 2 3 4 5 6 7 8 9 10 11 12 13 14 15 16 17 18 19 20 21 22
1 Sex
0.12 -0.22 0.04 0.06 0.04 0.00 0.10 9 Crank -0.05 -0.15 0.06 -0.27 -0.30 0.13 -0.33 -0.16 0.24 -0.15 -0.14 -0.08 0.04 -0.05 -0.02 0.00 0.08 0.17 -0.11 0.10 -0.23 10TRank -0.08 -0.17 0.06 -0.27 -0.12 0.07 -0.34 -0.36 0.36 0.05 -0.18 -0.21 0.05 -0.04 -0.03 0.17 0.06 0.18 0.06 -0.04 0.07 11 AMIQ 0.05 0.04 0.06 0.05 0.01 -0.22 -0.09 -0.11 0.03 0.18 -0.04 0.28 0.33 0.28 0.18 -0.02 0.13 -0.21 -0.09 0.09 0.21 12AMwm 0.19 0.03 0.00 -0.06 0.06 0.15 -0.11 -0.05 0.02 -0.07 -0.06 0.12 0.06 0.23 0.16 -0.28 -0.27 -0.01 -0.08 0.11 0.03
0.05 -0.05 0.00 -0.02 0.02 0.03 -0.12 -0.01 0.09 0.09 0.01 0.12 0.19 0.25 0.05 0.02 -0.23 -0.21 0.26 0.11 0.05 -0.01 -0.08 -0.14 0.08 0.00 -0.16 0.08 0.15 0.13 0.24 0.03 0.82 0.00 -0.12 0.15 -0.06 -0.05 0.08 0.30
15 SES 0.05 0.16 -0.19 0.03 -0.22 -0.04 -0.02 -0.19 -0.01 0.20 0.17 0.16 -0.04 0.73 0.04 -0.16 0.08 -0.04 -0.22 0.11 0.31 16 # Kids 0.05 -0.06 -0.11 -0.04 -0.12 -0.07 -0.05 -0.24 0.01 0.17 0.23 0.06 0.18 0.21 0.19 0.18 0.18 -0.23 -0.07 0.20 0.14 17 Sib1 0.08 0.05 -0.23 -0.03 -0.13 -0.26 0.04 -0.01 0.08 -0.03 -0.09 0.09 -0.06 0.01 0.02 0.13 0.57 -0.29 -0.12 -0.06 0.00 18 sib2 -0.14 0.10 -0.28 0.10 -0.13 -0.15 0.09 -0.07 -0.07 -0.11 0.11 -0.01 -0.01 0.06 0.05 0.16 0.51 -0.28 -0.14 0.00 0.10 19 AM prf 0.07 0.00 -0.05 0.00 -0.01 0.06 0.17 0.17 -0.11 -0.17 -0.14 0.08 -0.29 -0.06 -0.02 -0.03 0.04 0.06 0.12 0.06 -0.18 20 BM prf -0.04 -0.01 0.16 0.07 0.32 0.05 0.00 0.03 -0.02 -0.05 -0.04 -0.09 -0.11 -0.12 -0.26 -0.15 -0.03 0.16 0.07 -0.11 -0.09 21 BM age -0.13 -0.17 -0.03 0.01 -0.01 0.02 -0.05 -0.15 -0.09 -0.13 -0.22 -0.08 -0.19 -0.13 -0.08 0.08 -0.07 -0.05 0.05 0.04 0.07 22 BM IQ 0.08 0.30 0.05 -0.05 0.00 -0.01 -0.14 0.06 0.20 0.05 0.09 0.17 -0.05 0.24 0.31 0.00 0.01 -0.05 0.07 -0.24 -0.13
0.05 0.17 0.09 0.12 0.02 0.09 0.08 -0.29 -0.14 -0.03 -0.13 0.08 0.01 -0.05 -0.02 -0.04 0.15 -0.13 0.35 0.05 0.042 Ss IQ -0.03 -0.17 0.22 0.08 -0.04 0.10 0.06 -0.35 -0.09 0.01 -0.05 -0.17 0.28 0.25 -0.04 0.01 0.12 -0.14 -0.09 -0.16 0.293 Ext1 -0.01 0.01 -0.25 0.12 0.49 -0.20 -0.22 -0.03 0.10 0.03 -0.03 0.02 -0.13 -0.05 0.07 -0.03 0.05 0.00 0.04 -0.12 0.114 Soc1 -0.10 0.05 -0.24 0.33 -0.22 0.26 0.24 -0.22 -0.08 -0.11 0.07 0.03 0.10 0.13 -0.20 0.01 0.00 -0.08 -0.10 0.15 0.195 ES1 -0.13 0.10 0.34 0.25 0.02
0.12 0.33 -0.24 -0.28 -0.16 0.06 0.23 0.12 0.26 0.01 -0.13 -0.07 -0.09 -0.03 0.04 0.24
6 Ext2 -0.11 -0.05 0.58 -0.11 0.19 -0.14
0.23 0.11 0.20 0.02 -0.09 -0.15 -0.02 0.04-0.04
0.11-0.01
-0.16 -0.08 0.060.04 0.05 0.06 0.07
0.12 -0.19-0.07
0.060.16 7 Soc2
8 ES2 0.00 -0.03
0.07 0.02
-0.04 0.20
0.560.18
0.310.33
-0.010.22
0.31
-0.220.09
-0.29-0.18
-0.20-0.19
0.12 0.00 -0.100.07 0.02 0.14 0.14 0.36
13 AMes14 AMed
0.090.07
Note: Figures above the diagonal are for the Higher-Risk adoptees, those below are for the Lower-Risk adoptees. Bold faced coefficients are significant at the p< .05 level or better. Ns range from 48-106.

142
Appendix 4B
Binary Models without Birth Mother Characteristics, Higher-Risk Children
Block 1
B (S.E.) Block 2 B (S.E.)
Block 3 B (S.E.)
Adoptive Family Characteristics SES AM education AM IQ AM warmth AM emotional stability AM psychosocial profile score # of sibs Mean sib IPB rank
-0.01 (.030)
0.56 (.593)
-0.13* (.066)
-0.37 (.219)
-0.13 (.233)
1.24 (.765)
0.84 (.521)
-0.02 (.018)
-0.06 (.055)
2.07 (1.08)
-0.21* (.090)
-0.69* (.340)
-0.14 (.375)
-0.02 (.891)
2.04* (1.03)
-0.09* (.039)
-0.09 (.067)
2.62 (1.39)
-0.25* (.118)
-0.90* (.384)
-0.24 (.446)
-0.23 (.730)
2.29* (1.16)
-0.12* (.051)
Individual Characteristics Sex IQ score Infant IPB score
-3.57* (1.47)
-0.15* (.066)
0.20 (.196)
-4.86* (2.11)
-0.17* (.074)
0.05 (.220)
InteractionsAM warmth X Infant IPB score AM IQ X Child IQ
-0.62 (.486)
0.42 (.946) Constant Chi-square R2
14.57* (12.22) 14.89 0.27
44.60** (16.42) 34.39***
0.51
55.60** (21.40) 36.50***
0.53 Note: AM= adoptive mother, IPB= Index of Problem Behavior. N=48. *p<.05.

143
Appendix 4C Binary Models without Birth Mother Characteristics, Lower-Risk Children
Block 1
B (S.E.) Block 2 B (S.E.)
Block 3 B (S.E.)
Adoptive Family Characteristics SES AM education AM IQ AM warmth AM emotional stability AM psychosocial profile score # of sibs Mean sib IPB rank
-0.02 (.017)
0.39 (.366)
0.10 (.037)
-0.01 (.181)
-0.03 (.155)
-0.57 (.640)
-0.18 (.388)
0.00 (.011)
0.00 (.018)
0.14 (.390)
0.02 (.041)
0.64 (.340)
-0.02 (.171)
-0.72 (.723)
-0.18 (.414)
0.00 (.011)
0.00 (.019)
0.09 (.395)
0.02 (.040)
0.18 (.235)
-0.02 (.176)
-0.54 (.713)
-0.21 (.413)
0.00 (.012)
Individual Characteristics Sex IQ score Infant IPB score
0.00 (.602)
-0.03 (.025)
0.26* (.108)
-0.01 (.612)
-0.03 (.027)
0.25* (.111)
InteractionsAM warmth X Infant IPB score AM IQ X Child IQ
-0.39 (.459)
0.13 (.308) Constant Chi-square R2
-0.09 (4.59) 3.01 0.04
-1.35 (5.55) 10.79 0.15
-2.09 (5.57) 11.64 0.16
Note: AM= adoptive mother, IPB= Index of Problem Behavior. *p<.05, N=56.

144
Appendix 4D Binary Models without Birth Mother Characteristics, Higher-Risk Adolescents Block 1
B (S.E.) Block 2 B (S.E.)
Block 3 B (S.E.)
Adoptive Family Characteristics SES AM education AM IQ AM warmth AM emotional stability AM psychosocial profile score # of sibs Mean sib IPB rank
-0.02 (.023)
0.34 (.421)
-0.02 (.046)
-0.09 (.146)
-0.30 (.178)
0.44 (.435)
0.41 (.381)
0.01 (.012)
-0.01 (.029)
0.13 (.508)
-0.03 (.067)
-0.10 (.191)
-0.41 (.242)
0.11 (.470)
0.66 (.511)
0.01 (.015)
0.02 (.035)
-0.61 (.671)
-0.05 (.086)
-2.20 (2.29)
-0.50 (.270)
-0.09 (.560)
0.83 (.581)
0.02 (.017)
Individual Characteristics Sex IQ score Infant IPB score Child rank Extraversion (T1) Well-Socialized (T1) Emotional Stability (T1)
-0.04 (.843)
0.02 (.035)
-0.12 (.145)
0.04* (.017)
0.14* (.067)
0.10 (.064)
-0.16 (.100)
-0.14 (.989)
0.05 (.044)
-0.13 (.164)
0.05* (.020)
0.17* (.079)
0.16* (.074)
-0.42 (.289)
InteractionsAM warmth X Infant IPB score AM IQ X Child IQ
0.04 (.044)
1.37 (.786) Constant Chi-square R2
5.06 (5.49) 8.81 0.13
0.53 (10.22) 26.26* 0.34
7.60 (17.02) 32.01* 0.39
Note: AM= adoptive mother, IPB= Index of Problem Behavior, T1= Time 1 (i.e., childhood) *p<.05, N=64

145
Appendix 4E Binary Models without Birth Mother Characteristics, Lower-Risk Adolescents Block 1
B (S.E.) Block 2 B (S.E.)
Block 3 B (S.E.)
Adoptive Family Characteristics SES AM education AM IQ AM warmth AM emotional stability AM psychosocial profile score # of sibs Mean sib IPB rank
0.01 (.014)
-0.06 (.274)
0.03 (.031)
-0.08 (.148)
-0.06 (.137)
-0.32 (.497)
0.34 (.306)
-0.01 (.009)
0.03 (.018)
-0.27 (.311)
0.04 (.034)
-0.08 (.160)
-0.03 (.150)
-0.17 (533)
0.30 (.325)
-0.01 (.010)
0.03 (.019)
-0.25 (.329)
0.03 (.034)
-1.76 (1.53)
-0.03 (.153)
-0.06 (.558)
0.29 (.327)
-0.02 (.011)
Individual Characteristics Sex IQ score Infant IPB score Child rank Extraversion (T1) Well-Socialized (T1) Emotional Stability (T1)
-0.27 (.508)
-0.02 (.024)
0.08 (.098)
0.02 (.010)
-0.01 (.035)
-0.05 (.045)
0.02 (.054)
-0.21 (.510)
-0.03 (.027)
0.09 (.098)
0.02 (.010)
-0.02 (.036)
-0.03 (.047)
-0.18 (.192)
InteractionsAM warmth X Infant IPB score AM IQ X Child IQ
0.04 (.032)
0.29 (.284) Constant Chi-square R2
-4.77(3.88) 7.56 0.08
-4.90 (5.79) 17.58 0.17
5.39 (10.49) 19.91 0.20
Note: AM= adoptive mother, IPB= Index of Problem Behavior, T1= Time 1 (i.e., childhood). N=92

146
Appendix 4F Binary Models without Birth Mother Characteristics, Higher-Risk Adults Block 1
B (S.E.) Block 2 B (S.E.)
Block 3 B (S.E.)
Adoptive Family Characteristics SES AM education AM IQ AM warmth AM emotional stability AM psychosocial profile score # of sibs Mean sib IPB rank
0.02 (.032)
-0.14 (.568)
0.04 (.052)
-0.18 (.200)
-0.17 (.214)
0.96 (.624)
0.55 (.457)
0.00 (.014)
0.03 (.040)
-0.31 (.710)
0.07 (.075)
-0.05 (.027)
-0.23 (.307)
0.69 (.673)
0.90 (.723)
0.00 (.018)
0.03 (.045)
-0.14 (.770)
0.06 (.084)
0.30 (1.99)
-0.34 (.340)
1.22 (.876)
0.98 (.767)
0.00 (.019)
Individual Characteristics Sex IQ score Child rank Adolescent rank Extraversion (T2) Well-socialized (T2) Emotional Stability (T2)
1.13 (1.06)
0.02 (.040)
0.05 (.024)
0.03 (.018)
-0.02 (.052)
-0.04 (.044)
0.00 (.079)
1.03 (1.07)
0.00 (.043)
0.04 (.025)
0.02 (.020)
-0.01 (.054)
-0.05 (.049)
0.01 (.284) Interactions AM IQ X Ss IQ AM ES X Ss ES
-0.01 (.046)
-0.62 (.652)
Constant Chi-square R2
-20.05 (10.69) 5.81 0.13
-15.88 (12.18) 17.63 0.34
-13.82 (21.91) 18.70 0.35
Note: AM= adoptive mother, IPB= Index of Problem Behavior, T2= Time 2 (i.e., adolescence) N=43.

147
Appendix 4G Binary Models without Birth Mother Characteristics, Lower-Risk Adults Block 1
B (S.E.) Block 2 B (S.E.)
Block 3 B (S.E.)
Adoptive Family Characteristics SES AM education AM IQ AM warmth AM emotional stability AM psychosocial profile score # of sibs Mean sib IPB rank
0.00 (.026)
0.57 (.424)
0.01 (.052)
-0.65* (.301)
0.37 (.225)
0.33 (1.56)
-0.48 (.492)
0.01 (.013)
0.00 (.034)
0.38 (.535)
0.03 (.066)
-0.50 (.365)
0.51 (.304)
2.01 (2.07)
-0.71 (.559)
0.02 (.018)
0.00 (.034)
0.33 (.594)
11.32* (4.94)
0.53 (.419)
-0.34 (.340)
4.32 (4.05)
-1.23 (.785)
0.04 (.023)
Individual Characteristics Sex IQ score Child rank Adolescent rank Extraversion (T2) Well-socialized (T2) Emotional Stability (T2)
-0.15 (.874)
-0.06 (.044)
0.01 (.018)
0.03 (.021)
-0.03 (.067)
0.04 (.071)
-0.09 (.082)
-0.16 (1.02)
-0.14* (.074)
0.02 (.024)
0.05 (.028)
-0.13 (.086)
0.09 (.094)
1.17* (.511)
Interactions AM IQ X Ss IQ AM ES X Ss ES
-0.26* (.108)
-0.07 (.748)
Constant Chi-square R2
-3.43 (6.47) 12.08 0.17
0.97 (10.58) 24.05 0.31
-46.47 (23.62) 33.39* 0.41
Note: AM= adoptive mother, IPB= Index of Problem Behavior, T2= Time 2 (i.e., adolescence) *p<.05, N=64.

148
Chapter Five: General Conclusions
In the introduction of this dissertation, I outlined the three main questions for this
project. I will briefly provide answers to those questions based on the results of my
investigation. Then I will discuss the implications of these results as they pertain to a)
future research on problem behavior development, b) the treatment of antisocial
behaviors and conduct disorders, and c) individuals involved in various aspects of the
adoption process.
1) Do biological mothers with psychopathic tendencies leave their adopted away
offspring at risk for developing antisocial, problem behaviors during their lifetime?
Results from both the linear regression analyses and the biological parent-child
correlations yielded statistically significant, positive effects between birth mothers’
scores on the psychopathic deviate scale of the MMPI. Although the effects sizes were
small, leaving a lot of room for other factors to influence their development, these results
support the conclusion that there are maternal genetic influences on problem behavior
development, although the effect may only be substantial for males.
Moffitt (2005) suggests that we should only expect to find small effect sizes when
investigating the relationship between risk factors and behavioral outcomes. This will
especially be the case when main effects, rather than gene-environment interactions are
tested (Daniels & Plomin, 1985) because a large number of risk factors are thought to be
responsible for the development of antisocial problems—each of which has a small but
cumulative effect (Rutter, Giller, & Hagell, 1998). In addition, other studies that have
used genetically informed samples to investigate the link between parental antisocial
behaviors have found relationships of similar size (Mednick, et al, 1983).
The results from the parent-child correlations, that male but not females were
moderately similar to their biological mothers during adolescence and very similar to
them in adulthood, was unexpected. The supplemental regressions on males told largely

149
the same story as the regressions on the full adoptee sample. When specific indicators of
maternal maladjustment were used, a different picture emerged when mothers’ general
psychosocial indicators were investigated. In the latter set of male-only analyses, it
appeared that maternal environmental influences were predictive of male adoptees
problem behaviors during adolescence and adulthood, while maternal genetic effects only
emerged during adulthood and had smaller effects than maternal environmental factors.
These findings suggest that both genetic and environmental factors contribute to the
development of antisocial behaviors and that each source may affect males and females
differently. However, it should be noted that for males the number of adoptive mothers
with any subscale scores above 70 was only 17. Therefore, the stability of the male-only
models may be questionable. In other words, estimates from the male only models may
be undependable because of the limited number of individuals in each of the cells.
As noted in Chapter Two, one possible limitation to this study was that the
measure used to assess problem behaviors may not have captured all the potential forms
of antisocial behavior that could be displayed by females. Given the results on sex
differences in aggressive behaviors (Coyne, et al, 2006), other researchers interested in
investigating the link between maternal antisocial behaviors and problem behavior
development in their offspring are strongly advised to include items that assess malicious
gossip and other forms of relational aggression. This may also help determine whether
my finding, that mothers only pass the genetic liability for antisocial behavior on to their
sons, is true.
Additionally, information regarding the biological fathers would likely shed some
light on the transmission of antisocial behaviors from one generation to the next. As
shown in previous studies (e.g., Mednick et. al., 1983) antisocial behaviors are clearly
passed down from biological fathers to their sons. Though antisocial behavior in general
has been studied less among females (Rhule, et al., 2004), Mason and Frick (1994) found
that biological fathers also pass antisocial tendencies on to their daughters, but to a lesser
degree. Adding biological fathers’ antisocial tendencies, though practically difficult in the

150
US, would be illuminating to the question of genetic risk toward behavior problems
among adoptees.
2) Do group differences in stability and continuity of problem behaviors emerge as a
function of sex, adoption status, and genetic risk?
By breaking the sample up into groups according to gender, adoptive status, and
relative risk status, I was able to uncover a more detailed account of how problem
behaviors develop across time for different groups. When just looking at mean behavioral
trends for the males and females in the sample, it appeared that both groups followed the
predicted pattern—peaking in adolescence (Moffitt, 1993).However, the biological
sample and the Higher-Risk females did not follow this trend. Rather those groups tended
to remain relatively stable between childhood and adolescence, before declining even
further between adolescence and adulthood. This was a unique finding that merits further
exploration comparing the behavioral patterns biological and adopted offspring.
However, it suggests the possibility that individuals at both ends of the behavioral
spectrum, not just the excessively antisocial as suggested by Moffitt (1993), may remain
the most stable throughout the life span.
Similar to mean level problem behavior stability, intra-individual continuity
tended to differ depending on sex, adoption status, and risk status. Higher-Risk male
adoptees showed the most behavioral continuity from childhood through middle
adulthood, while Higher-Risk female adoptees showed the least. These results highlight
the importance of considering the characteristics of the group being investigated when
developmental stability and continuity are being investigated. If we simply looked at the
intra-individual continuity of the sample as a whole we would have concluded that
behavior problems are modestly stable across time. However, a division of the sample
revealed that was the case for adopted males, but was not the case for either adopted
females or biological males and females. Further, it was found that while genetic factors
151
are partially responsible for the development of problem behaviors they were not found
to influence the continuity of behaviors over time.
As with the results from Chapter Two, these findings might have differed had the
measure of problem behavior included more female-typical antisocial behaviors. Perhaps
had such measures been included in the IPB I would have found more behavioral stability
among the Higher-Risk females. Therefore, in addition to breaking up samples into
groups according to gender and risk status, future research on trends and trajectories of
problem behavior should also be sure to include appropriate measures to accurately map
behavioral patterns among females, as well as males.
3) What individual and stable family characteristics serve as risk and/or protective
factors for Higher-Risk and Lower-Risk adoptees, once genetic factors for maternal
psychosocial functioning are controlled?
Though the analyses used to address this question were primarily exploratory, the
results from the two methods—independent ANOVAs with Bonferroni post-hoc
comparisons and binary regressions—comparing two groups of adoptees that varied in
risk status yielded two main conclusions. The first major conclusion was that stable
family factors, such as parental SES, maternal warmth, number of siblings in the home,
and maternal psychological well-being had no significant influence on the development
of problem behaviors across the lifespan among adopted individuals. Although two
significant within-family findings presented themselves in the adulthood ANOVAs,
because these same factors were not found to predict which behavior problem group the
adoptees were in using binary regressions, I cannot be certain that these results would
replicate in future studies. Furthermore, results from the parent-child correlations, as well
as the sibling correlations from Chapter Three support the conclusion that the stable
family characteristics measured here had no direct influence on problem behavior
development among the adoptees.

152
The second major conclusion reached was that prior behavior is the best predictor
of future behavior among the adoptees in the Texas Adoption Project. The ANOVAs
showed that difficult infants were more problematic children and higher ranking children
and adolescents tended to score above average on the IPB during adolescence and
adulthood, whether they belonged to the Higher-Risk or Lower-Risk group. While results
from the binary regression models (both with and without genetic controls) were much
less consistent and their reliability is questionable, infant IPB scores also predicted
above-average levels of behavior during childhood for the Lower-Risk adoptees, and
childhood rank predicted behavioral classification during adolescence for the Higher-
Risk adoptees. This result fits in with Moffitt’s (1993) conclusion regarding the
prediction of offending from past behavior.
This study was limited in its power to detect relationships between variables due
to the small sample sizes within each of the groups. Had the samples been larger it would
have been ideal, given the sex differences found in both Chapters Two and Three, to have
also examined males and females within each risk group separately. That was not
feasible, however. A post-hoc attempt to add a sex by birth mother interaction term to
each of the binary regression models in Chapter Four rendered four out of the six models
uninterpretable. Unfortunately, the limited number of participants simply limits the
ability to address whether the results differ as a function of gender.
Implications for Future Research
The use of a genetically informative longitudinal research design further supports
the work of many who have looked into the developmental antecedents and pathways of
transmission of antisocial behavior problems (e.g., Mednick, et al., 1983; Moffit, 2005;
Moffitt & Caspi, 2001; Rhule et al., 2004; van den Valk et al., 1998, 2003); adding that
genetic factors continue to be an important influence on behavior as individuals reach
middle adulthood. When looking for factors that influence resilience or vulnerability
toward problem behavior development, future researchers should investigate aspects of

153
the environment that differ between siblings within the same home (such as major life
events or the presence of a caring adult outside the family) and to conduct analyses on
males and females and Higher-Risk and Lower-Risk groups separately. Terrie Moffitt
(2005) outlines a number of particularly strong methods for doing such investigations,
including the study of differences in environmental exposure between identical twins and
whether these differences in exposure help explain differences observed in their behavior.
The gender differences found throughout this dissertation warrant a closer look at
how female aggression and problem behaviors differ from males, as well as an overall
study of the transmission of antisocial behavior between mothers and their offspring. To
date, very little research exists on antisocial behavior among females (Moffitt & Caspi,
2001). This may be in part due to the limited number of women who manifest the
disorder—0.05-2.0% of the U.S. female population (American Psychiatric Association,
1994). However, when researchers have a better understanding of antisocial behaviors
manifested among females this figure may change. As mentioned previously,
investigating the role of relational, indirect aggression in antisocial women may prove a
fruitful endeavor and could change the definition as well as the estimates of the
prevalence of antisocial personality disorder for females.
Two factors often overlooked in studies that use adoption designs are the effects
of prenatal environment and problems during the birth of the child. It is possible that each
of these may have an influence on the development of problem behaviors—or any other
behavior or trait—among children who were adopted away shortly after birth. For
example, was the mother depressed during pregnancy? Were there any birth
complications? Was the infant premature? Studies into the effects of the prenatal
environment have found that maternal depression during pregnancy (Field, Diego, &
Hernandez-Reif, 2006) and abnormal birth (i.e., birth complications or prematurity) (De
Sousa, 1974) can affect the developing fetus and disrupt the mother-child bond during
infancy, when studied among women who raise their own children. In addition, women
who had their first depressive episode while pregnant (versus before pregnancy) had
children that experienced some language delays, but not to the same extent as the

154
children of women who experience depression prior to becoming pregnant (Sohr-Preston,
& Scaramella, 2006). To my knowledge, the effects of these same pre- and perinatal
experiences have not been studied among individuals adopted away at birth.
Given that the majority of adopted individuals from the Texas Adoption Project
were adopted from a home for unwed mothers some of these questions may be
investigated in future research. Many of the biological mothers lived at the home for the
last half of their pregnancy—usually after they began to show. Therefore, data regarding
their health and pregnancy, as well as the hospital records from when the young women
gave birth, are included in the adoption records. Adding information about the prenatal
mental health of the birth mother, as well as information regarding the normality of the
adoptees birth, into the regression models may help to uncover some previously
unstudied environmental effects on the development of problem behaviors among
adopted individuals.
Implications for the Treatment of Antisocial and Conduct Disorders
Many individuals unfamiliar with the interpretation of research using behavior
genetic methods may incorrectly conclude that nothing can be done to curtail problem
behaviors among individuals who are genetically prone to developing them. A look back
at the data presented in Chapter Four of this dissertation indicates that this was not the
case. Of the 75 individuals who were classified as Higher-Risk, based on the definition
that their birth mother had a psychopathic deviate score 0.5 standard deviations above the
mean for their age group, between 39 and 64 percent (depending on the age range) did
NOT show above average levels of problem behaviors. This indicates that there was
something about these resilient individuals and/or their environments that kept them from
manifesting problem behaviors.
Though the research presented here did not identify potential protective
environmental factors, past research on risk and resilience has consistently identified one
environmental factor that ameliorates the effect of multiple sources of adversity. That one

155
factor is the presence of warm caring relationships with adults, whether inside or outside
the home (Debold, Brown & Weseen, 1999; Laursen & Birmingham, 2003; Werner,
1993; Werner & Johnson, 2004; Werner & Smith, 1992). The presence of a caring adult
has been found to moderate the influence of parental alcoholism (Werner & Johnson,
2004), child abuse (Bysom, 2001), poverty (Garmezy, 1991, 1993; Werner, 1993; Werner
& Smith, 1992), and the experience of severe trauma, such as the death of a parent
(Werner, 1993) or an act of war (Garmezy, 1988).
Many treatment interventions have been devised based on the robustness of this
effect which include mentorship programs (Beltman & MacCallum, 2006; Everhart,
2001; Osterling & Hines, 2006) and early parent-child relationship intervention
(Sameroff, McDonoug, & Rosenblum, 2004). Osterling and Hines (2006), for example,
found that adolescents in the foster care system who took part in a mentorship program
adjusted better once they were out of the foster care system than those who did not take
part in the program. In addition, Everhart found that, among 3rd and 4th grade children
with externalizing problems who were randomly assigned into groups that underwent a
character education curriculum with or without a mentor, those who received mentor had
a greater decrease in teacher reported externalizing behaviors than those who did not.
Therefore, it should not be concluded that genetic risk equates to phenotypic inevitability.
Based on these prior findings, children at higher risk for problem behaviors may benefit
from treatments that include mentorship as part of the program.
Implications for Individuals Involved in the Adoption Process
At this juncture our understanding of what factors influence the development of
behavior problems is too limited to have any solid recommendations for either adoption
agencies or parents seeking to adopt a child. While it has been found that adopted
children have a higher prevalence of behavior problems than the children born into their
adoptive families, the majority of cases of adoptions turn out well—even among those
with highly deviant biological mothers. While it may be prudent for prospective adoptive

156
parents to get a detailed history with regard to any mental or physical health problems of
the biological parents (and their immediate families), indications of externalizing should
not be taken as a definitive sign that the child too will develop serious behavior problems.
In light of the research on risk and resilience and the ameliorating effects of caring adult
relationships, the adoption of a child at risk for behavior problems into the home of
caring and supportive parents may be enough to deflect the developmental path. Should
behavior issues arise, early interventions that increase the problem child’s social support
network may be of help.

157
References
Achenbach, T. M. (1991). Integrative guide for the 1991 CBCL/4-18, YSR, and TRF
profiles. Burlington: University of Vermont, Department of Psychiatry.
Achenbach, T. M., Verhulst, F. C., Edelbrock, C., Baron, G. D. & Akkerhuis, (1987).
Epidemiological comparisons of American and Dutch children: II.
Behavioral/emotional problems reported by teachers for ages 6 to 11. Journal of
the American Academy of Child & Adolescent Psychiatry, Vol 26(3), 326-332.
Adams, C. D., Hillman, N., Gaydos, G. R. (1994). Behavioral difficulties in toddlers:
Impact of sociocultural and biological risk factors. Journal of Clinical Child
Psychology, 23(4), Special issue: Impact of poverty on children, youth, and
families, 373-381.
American Psychiatric Association (1994). Diagnostic and statistical manual of mental
disorders, Fourth Edition. Washington, DC: American Psychiatric Association.
Anderson, K. E., Lytton, H., & Romney, D. M., (1986). Mothers’ interactions with
normal and conduct disordered boys: Who affects whom? Developmental
Psychology, 22, 604-609.
Bandura, A. A., Ross, D., & Ross, S. A. (1961). Transmission of aggression through
imitation of aggressive models. Journal of Abnormal and Social Psychology, 63,
575-582.
Bardone, A. M., Moffitt, T. E., Caspi, A., Dickson, N., Stanton, W. R., & Silva, P. A.
(1998). Adult physical health outcomes of adolescent girls with conduct disorder,
depression, and anxiety. Journal of the American Academy of Child &
Adolescent Psychiatry, 37(6), 594-601.
Baumrind, D. (1993). The average expectable environment is not good enough: A
response to Scarr. Child Development, 64, 1299-1317.
Bell, R. Q. (1968). A reinterpretation of the direction of effects in studies of socialization.
Psychological Review, 75, 81-95.

158
Beltman, S. & MacCallum, J. (2006). Mentoring and the Development of Resilience: An
Australian perspective. International Journal of Mental Health Promotion, 8(1),
21-32.
Bennett, K. J., Lipman, E. L., Brown, S., Racine, Y., Boyle, M. H., & Offord, D. R.
(1999). Predicting conduct problems: Can Higher-Risk children be identified in K
and Grade 1? Journal of Consulting and Clinical Psychology, 67 (4), 470-480.
Brodzinsky, D. M., Radice, C., Huffman, L., & Merkler, K. (1987). Prevelance of
clinically significant symptomatology in a nonclinical sample of adopted and
nonadopted children. Journal of Clinical Child Psychology, 16(4), 350-356.
Burt, K. B., Van Dulmen, M. H. M., Carlivati, J., Egeland, B., Sroufe, L. A., Forman, D.
R., Appleyard, K., & Carlson, E. A. (2005). Mediating links between maternal
depression and offspring psychopathology: The importance of independent data.
Journal of Child Psychology and Psychiatry, 46(5), 490-499.
Butcher, J. N., & Tellegen, A. (1966). Objections to MMPI items. Journal of Consulting
Psychology, 30(6), 527-534.
Bysom, T. L. (2001). Exceptions to the intergenerational transmission of violence: The
role of perceived social support. Dissertation Abstracts International, Section A:
Humanities & Social Sciences, 61(11-A), 4564.
Patterson, G. R., Capaldi, D., & Bank, L. (1991). An early starter model for predicting
delinquency. In Pepler, D. J., Rubin, K. H., & Hillsdale, NJ, (Eds), The
development and treatment of childhood aggression. England: Lawrence Erlbaum
Associates, Inc.
Canter, A., (1969). Performance characteristics of school children on the BIP Bender test.
Journal of Consulting and Clinical Psychology, Vol 33(4), 508.
Carter, A. S., Garrity-Rokous, E. F., Chazan-Cohen, R., Little, C., & Briggs-Gowen, M.
J. (2001). Maternal depression and comorbidity: Predicting early parenting,
attachment security, and toddler social-emotional problems and competencies.
Journal of the American Academy of Child and Adolescent Psychiatry, 40(1), 18-
26.

159
Caspi, A., Elder, G. H., & Bem, D. J. (1987). Moving against the world: Life-course
patterns of explosive children. Developmental Psychology, 23(2), 308-313.
Caspi, A., Moffitt, T. E., Morgan, J., Rutter, M., Taylor, A., Kim-Cohen, J., & Polo-
Tomas, M. (2004). Maternal expressed emotion predicts children’s antisocial
behavior problems: Using monozygotic twin differences to predict environmental
effects on behavioral development. Developmental Psychology, 40(2), 149-161.
Cattell, R. B., Eber H. W., & Tatsuoka, M. M. (1985). Handbook for the Sixteen
Personality Factor Questionnaire. Champaign, Illinois: Institute for Personality
and Ability Testing, Inc.
Center for Human Research (2002). A guide to the 1979-2002 National Longitudinal
Survey of Youth data. Columbus Ohio: Ohio State University.
Chess, S. (1967). The role of temperament in the child’s development. Acta
Paedopsychiatria: International Journal of Child and Adolescent Psychiatry,
34(4-5), 91-103.
Christensen, K. Vaupel, J. W., Holm, N. V., & Yashlin, A. I. (1995). Mortality among
twins after age 6: Foetal origins hypothesis versus twin method. British Medical
Journal, 310, 432-436.
Cohen, J. (1992). A power primer. Psychological Bulletin, 112(1), 155-159.
Compas, B. E., Howell, D. C., Phares, V., Williams, R. A. & Giunta, C. T. (1989). Risk
factors for emotional/behavioral problems in young adolescents: A prospective
analysis of adolescent and parental stress and symptoms. Journal of Consulting
and Clinical Psychology, 57(6), 732-740.
Conger, R. D., & Rueter, M. A. (1996). A longitudinal study of social influences in
adolescent risk for alcohol use and abuse. In G. A. Brody (Ed) Advances in
applied developmental psychology. Vol. 10. Sibling relationships: Their causes
and Consequences. West Port, CT: Ablex Publishing.

160
Côté, S., Tremblay, R. E., Nagin, D., Zoccolillo, M., & Vitaro, F. (2002). The
development of impulsivity, fearfulness, and helpfulness during childhood:
Patterns of consistency and change in the trajectories of boys and girls. Journal
of Child Psychology and Psychiatry, 43(5), 609-618.
Cox, A. D. Puckering, C., Pound, A., & Mills, M. (1987). The impact of maternal
depression in young children. Journal of Child Psychology and Psychiatry,
28(6), 917-928.
Coyne, S. M., Archer, J., & Eslea, M. (2006). “We’re not friends anymore! Unless…”
The frequency and harmfulness of indirect, relational, and social aggression.
Aggressive Behavior, 32(4), 294-307.
Crowell, S. E., Beauchaine, T. P., Gatzke-Kopp, L., Sylvers, P. Mead, H. & Chipman-
Chacon, J. (2006). Autonomic correlates of attention-deficit/hyperactivity
disorder and oppositional defiant disorder in preschool children. Journal of
Abnormal Psychology, 115(1), 174-178.
Cummings, E. M., & Davies, P. T. (1994). Maternal depression and child development.
Journal of Child Psychology and Psychiatry, 35, 73-112.
Dahlstrom, W. G., Welsh, G. S., & Dahlstrom, L. E. (1960). An MMPI Handbook:
Volume 1, Clinical Interpretation. A Revised Edition. Minneapolis, MN:
University of Minnesota Press.
Daniels, D. & Plomin, R. (1985). Differential experience of siblings in the same family.
Developmental Psychology, 21, 747-760.
Debold, E., Brown, L. M., & Weseen, S. (1999). Cultivating hardiness zones for
adolescent girls: A reconceptualization of resilience in relationships with caring
adults. In Johnson, N.G., Roberts, M.C., & Norell, J. (Eds.) Beyond appearance:
A new look at adolescent girls. Washington DC: American Psychological
Association.

161
De Sousa, A. (1974). Causes of behavior problems in children. Child Psychiatry
Quarterly, 7(1), 3-8.
Downey, G., & Coyne, J. C. (1990). Children of depressed parents: An integrative
Review. Psychological Bulletin, 108, 50-76.
Eccles, J. S., Lord, S. E., & Roeser, R. W. (1996). Round holes, square pegs, rocky roads,
and sore feet: The impact of stage-environment fit on young adolescents'
experiences in schools and families. In Cicchetti, D. & Toth, S. L. (Eds.)
Adolescence: Opportunities and Challenges. Rochester, NY: University of
Rochester Press.
Ehrensaft, M. K., Wasserman, G. A., Verdelli, C., Greenwald, S., Miller, L. S., & Davis,
M. (2003). Maternal antisocial behavior, parenting practices, and behavior
problems in boys at risk for antisocial behaviors. Journal of Child and Family
Studies, 12 (1), 27-40.
Eisenberg, N., Sadovsky, A., Spinrad, T. L., Fabes, R. A., Losoya, S. H., Valiente, C.,
Reiser, M., Cumberland, A., & Shepard, S. A. (2005). The relations of problem
behavior status to children’s emotionality, effortful control, and impulsivity:
Concurrent relations and prediction of change. Developmental Psychology, 41(1),
193-211.
Else-Quest, N. M., Hyde, J. S., Goldsmith, H. H., & Van Hulle, C. A.(2006). Gender
differences in temperament: A meta-analysis. Psycholoical Bulletin, 132(1), 33-
72.
Everhart, K.D. (2001). Promoting resiliency in at-risk children through an integrated
adult-child mentoring and character development program: An analysis of
mentoring strategies with regard to outcomes. Dissertation Abstracts
International: Section B: The Sciences & Engineering, 62(2-B), 1075.
Eysenck, S. B., & Eysenck, H. J. (1963). On the dual nature of extraversion. British
Journal of Social and Clinical Psychology, 2(1), 46-55.
Falconer, D.S., (1960). Intro to quantitative genetics. Edinburgh: Oliver & Boyd.

162
Farrington, D. P. (1991). Psychological contributions to the explanation of offending.
Issues in Criminological & Legal Psychology, 1(17), 7-19.
Farrington, D. P. (1994). Early developmental prevention of juvenile delinquency.
Criminal Behaviour and Mental Health, 4(3), 209-227.
Fergusson, D. M., Horwood, L. J., & Lynskey, M. T. (1995). Maternal depressive
symptoms and depressive symptoms in adolescents. Journal of Child Psychology
and Psychiatry, 36, 1161-1178.
Field, T. (1995). Infants of depressed mothers. Infant Behavior and Development, 18(1),
1-13.
Field, T., Diego, M., & Hernandez-Reif, M. (2006). Prenatal depression effects on the
fetus and newborn: A review. Infant Behavior & Development, 29(3), 445-455.
Finley, G. E., & Aguiar, L. J. (2002). The effects of children on Parents: Adoptee genetic
dispositions and adoptive parent psychopathology. The Journal of Genetic
Psychology, 163(4), 503-506.
Frye, A. A. & Garber, J. (2005).The relations among maternal depression, maternal
criticism, and adolescents externalizing and internalizing symptoms. Journal of
Abnormal Child Psychology, 33(1), 1-11.
Foley, D.L., Pickles, A., Simonoff, E., Maes, H. H., Silberg, J. L., Hewitt, J. K., & Eaves,
J. L. (2001). Parental concordance and comorbidity for psychiatric disorder and
associate risks for current psychiatric symptoms and disorders in a community
sample of juvenile twins. Journal of Child Psychology and Psychiatry, 42(3),
381-394.
Garber, J., Braafladt, N., & Zeman, J. (1991). The regulation of sad affect: An
information processing perspective. In J. A. Garber & K. Dodge (Eds.), The
Development of Emotion Regulation and Dysregulation. Cambridge, MA: Studies
in Social and Emotional Development.
Garmezy, N. (1988). Stressors of childhood. In Garmezy, N., & Rutter, M. (Eds) Stress,
Coping, and Development in Children. Baltimore, MD: Johns Hopkins University
Press.

163
Garmezy, N. (1991). Resilience and vulnerability to adverse developmental outcomes
associated with poverty. American Behavioral Scientist, 34(4), 416-430.
Garmezy, N. (1993). Children in poverty: Resilience despite risk. Psychiatry:
Interpersonal and Biological Processes, 56(1), 127-136.
Gelfand, D. J., & Teti, D. M. (1990). The effects of maternal depression on children.
Clinical Psychology Review, 10, 329-353.
Goodman, S. H., Adamson, L. B., Riniti, J., & Cole, S. (1994). Mothers’ expressed
attitudes: Associations with maternal depression and children’s self-esteem and
psychopathology. Journal of the American Academy of Child and Adolescent
Psychiatry, 33, 1265-1274.
Goodman, S. H., & Gotlib, I. H. (1999). Risk for psychopathology in children of
depressed mothers: A developmental model for understanding mechanisms of
transmission. Psychological Review, 106, 458-490.
Goodwin, D. W. (1977). Psychopathology in adopted and nonadopted daughters of
alcoholics. Archives of General Psychiatry, 34(9), 1005-1009.
Gore, S., & Eckenrode, J. (1996). Context and process in research on risk and resilience.
In Haggerty, Sherrod, Garmezy, & Rutter (Eds) Stress, risk, and resilience in
children and adolescents: Processes, mechanisms, and interventions. New York,
NY: Cambridge University Press.
Gross, D., Conrad, B., Fogg, L., & Wothke, W. (1994). A longitudinal model of maternal
self-efficacy, depression, and difficult temperament during toddlerhood. Research
in Nursing and Health, 17, 207-215.
Hammarberg, A., & Hagekull, B. (2006). Changes in Externalizing and Internalizing
Behaviours over a School-year: Differences Between 6-Year-Old Boys and Girls.
Infant and Child Development, 15(2), 123-137.
Hammen, C. (1999). Children of affectively ill parents. In H. C. Steinhausen & F.
Verhulst (Eds) Risk and Outcomes in Developmental Psychopathology. Oxford,
UK: Oxford University Press.

164
Harold, G. T., & Conger, R. (1997). Marital conflict and adolescent distress: The role of
adolescent awareness. Child Development, 68(2), 333-350.
Hastings, P. D., Zahn-Waxler, C., Robinson, J., Usher, B., & Bridges, D. (2000). The
development of concern for others in children with behavior problems.
Developmental Psychology, 36(5), 531-546.
Henderson, A. D., Sayger, T. V., & Horne, A. M. (2003). Mothers and sons: A look at the
relationship between child behavior problems, marital satisfaction, maternal
depression and family cohesion. Family Journal: Counseling and Therapy for
Couples and Families, 11(1), 33-41.
Holden, G. W., Nelson, P. B., Velasquez, J., & Ritchie, K. L. (1993). Cognitive,
psychosocial, and reported sexual behavior differences between pregnant and
nonpregnant adolescents. Adolescence, 28(111), 557-572.
Horn, J. M., Loehlin, J. C., & Willerman, L. (1982). Aspects of the inheritance of
intellectual abilities. Behavior Genetics, 12(5), 497-516.
Hutchings, B., & Mednick, S. A. (1973). Genetics and environmental influences on
criminality in Denmark. In Brown, B. S., & Torrey, E. F. (Eds), International
collaboration in mental health. Bethesda, MD: National Institute of Mental
Health.
Jaffee, S. R., Belsky, J., Harrington, H., Caspi, A. & Moffitt, T. E. (2006). When parents
have a history of conduct disorder: How is the care giving environment affected?
Journal of Abnormal Psychology, 115(2), 309-319.
Jaffee, S. R., Caspi, A., Moffitt, T. E. Dodge, K. A., Rutter, M., Taylor, A., & Tully L. A.
(2005). Nature × nurture: Genetic vulnerabilities interact with physical
maltreatment to promote conduct problems. Development and Psychopathology,
17(1), 67-84.
Jones, D. J., & Forehand, G. (2003). The stability of child problem behaviors: A
longitudinal analysis of inner-city African American Children. Journal of Child
and Family Studies, 12(2), 215-227.

165
Keenan, K., & Wakschlag, L. S. (2002). Can a valid diagnosis of disruptive behavior
disorder be made in preschool children? American Journal of Psychiatry, 159(3),
351-358.
Keenan, K., Loeber, R., & Green, S. (1999). Conduct disorder in girls: A review of the
literature. Clinical Child and Family Psychology Review, 2(1), 3-19.
Kellogg, CE, Morton, NW, Lindner, RM, & Gurvitz, M. (1946). Revised Beta
Examination: Manual. NY: Psychological Corp.
Kim-Cohen, J., Moffitt, T. E., Caspi, A., & Taylor, A. (2004). Genetic and
Environmental Processes in Young Children's Resilience and Vulnerability to
Socioeconomic Deprivation. Child Development, 75(3), 651-668.
Kim-Cohen, J., Moffitt, T. E., Taylor, A., Pawlby, S. J., & Caspi, A. (2005). Maternal
depression and children's antisocial behavior: Nature and nurture effects.
Archives of General Psychiatry, Vol 62(2), 173-181.
Krueger, R. F., McGue, M., & Iacono, W. G. (2001). The higher-order structure of
common DSM mental disorders: Internalization, externalization, and their
connections to personality. Personality and Individual Differences, 30(7), 1245-
1259.
Laursen, E. K. & Birmingham, S. M. (2003). Caring relationships as a protective factor
for at-risk youth: An enthnographic study. Families in Society, 84(2), 240-246.
Lee, C. M., & Gotlib, I. H. (1989). Maternal depression and child adjustment: A
longitudinal analysis. Journal of Abnormal Psychology, 98, 78-85.
Lemery, K.S., & Goldsmith, H. H. (1999). Genetically informed designs for the study of
behavioural development. International Journal for the Study of Behavioral
Development, 23(2), 293-317.
Lenzenweger, M. F., & Castro, D. D. (2005). Predicting change in borderline personality:
Using neurobehavioral systems indicators within an individual growth curve
framework. Development and Psychopathology, Vol 17(4), 1207-1237.

166
Leve, L. D., Kim, H. K., & Pears, K. C. (2005). Childhood temperament and family
environment as predictors of internalizing and externalizing trajectories from ages
5-17. Journal of Abnormal Child Psychology, 33(5), 505-520.
Loeber, R. (1982). The stability of antisocial and delinquent child behavior: A review.
Child Development, 53(6), 1431-1446.
Loeber, R., & Farrington, D. P. (1998). Serious and violent juvenile offenders. In
Loeber, Farrington, & Waschbusch, (Eds); Serious & violent juvenile offenders:
Risk factors and successful interventions. Thousand Oaks, CA: Sage Publications,
Inc.
Loeber, R., & Stouthamer-Loeber, M. (1998). Development of juvenile aggression and
violence: Some common misconceptions and controversies. American
Psychologist, 53(2), 242-259.
Loehlin, J. C., (1992). Genes and environment in personality development. Newbury
Park, CA: Sage.
Loehlin, J. C. & Nichols, J. (1976). Heredity, environment and personality. Austin, TX:
University of Texas Press.
Loehlin, J. C., Horn, J. M. , & Willerman, L. (1981). Personality resemblance in adoptive
families. Behavior Genetics, 11(4), 309-330.
Loehlin, J. C., Willerman, L., & Horn, J. M. (1982). Personality resemblance between
unwed mothers and their adopted away offspring. Journal of Personality and
Social Psychology, 42(6), 1089-1099.
Loehlin, J. C., Willerman, L., & Horn, J. M. (1985). Personality resemblance in adoptive
families when children are late-adolescent or adult. Journal of Personality and
Social Psychology, 48(2), 376-392.
Loehlin, J. C., Willerman, L., & Horn, J. M. (1987). Personality resemblance in adoptive
families: A 10-year follow-up. Journal of Personality and Social Psychology,
53(5), 961-969.

167
Loukas, A., Krull, J. L., Chassin, L., & Carle, A. C. (2000). The relation of personality to
alcohol abuse/dependence in a high-risk sample. Journal of Personality, 68(6),
Special issue: Personality processes and problem behavior, 1153-1175.
Lovejoy, M. C., Graczyk, P. A., O’Hare, E., & Neuman, G. (2000). Maternal depression
and parenting behavior: A meta-analytic review. Clinical Psychology Review, 20,
561-592.
Lu, L. (1995). Correlates of social support: Personal characteristics and social resources.
Counseling Psychology Quarterly, 8(2), 173-181.
Luoma, I., Tamminen, T., Kaukonen, P., Laippala, P., Puura, K., Salmelin, R., &
Almqvist, F. (2001) Longitudinal study of maternal depressive symptoms and
child well-being. Journal of the American Academy of Child & Adolescent
Psychiatry, 40(12), 1367-1374.
Luthar, S. S., & Cicchetti, D. (2000). The construct of resilience: Implications for
interventions and social policies. Development and Psychopathology, 12(4), 857-
885.
Lyons-Ruth, K., Connell, D., Grunebaum, H., & Botein, S. (1990). Infants at social risk:
Maternal depression and family support services as mediators of infant
development and security in attachment. Child Development, 61, 85-98.
Ma, X. (2001). Bullying and being bullied: To what extent are bullies also victims?
American Educational Research Journal, 38(2), 351-370.
Maccoby, E. & Martin, M. (1983). Socialization in the context of the family: Parent-child
interaction. In P. Mussen (Ed.) Handbook of child psychology (Vol. 4). New
York: Wiley.
Mason, D. A., & Frick, P. J. (1994). The heritability of antisocial behavior: A meta-
analysis of twin and adoption studies. Journal of Psychopathology and
Behavioral Assessment, 16(4), 301-323.
Matjasko, J. L., Grunden, L., & Ernst, J. L. (2006). Structural and dynamic process
family risk: Consequences for holistic adolescent functioning over time. In press.

168
Matjasko, J. L., Grunden, L., Ernst, J. L., & Ammon, N. (2006). Continuity, stability, and
change in patterns of adolescent adjustment over time. Under review.
McGuire, C., & White, G. D. (1955). The measurement of social status. Research paper
in human development No. 3, Laboratory of Human Behavior, Department of
Educational Psychology, University of Texas, Austin.
McNemar, Q., Psychological Statistics (4th Ed., 1969), p. 322: New York, Wiley.
Mednick, S. A., Gabrielle, W. F., & Hutchings, B. (1983). Genetic influence in criminal
behavior. In K. T. Van Dusen & S. A. Mednick (Eds.), Prospective Studies of
Crime and Delinquency, Hingham, MA: Martinus Nyhoff.
Miller, L. C. (2005). International Adoption, Behavior, and Mental Health. Journal of
the American Medical Association, 293(20), 2533-2535.
Miller, L., Warner, V., Wickramaratne, P., & Weissman, M. (1999). Self-esteem and
depression: Ten year follow-up of mothers and offspring. Journal of Affective
Disorders, 52(1-3), 41-49.
Moffitt, T. E. (1993). “Life-course-persistent” and “adolescent-limited” antisocial
behavior: A developmental taxonomy. Psychological Review, 100, 674-701.
Moffitt, T. E. (2005). The new look of behavioral genetics in developmental
psychopathology: Gene-Environment interplay in antisocial behaviors.
Psychological Bulletin, 131(4), 533- 554.
Moffitt, T. E. & Caspi, A. (2001). Childhood predictors differentiate life-course
persistent and adolescent-limited antisocial pathways among males and females.
Development and Psychopathology, 13(2), 355-375.
Moffitt, T. E. & Caspi, A. (2005). Life-course persistent and adolescent-limited antisocial
males: Longitudinal follow-up to adulthood. In Stoff, D. M., & Susman, E. J.
(Eds.) Developmental Psychobiology of Aggression. New York, NY: Cambridge
University Press.

169
Moffitt, T. E., Caspi, A., Harrington, H., Milne, B. J. (2002). Males on the life-course-
persistent and adolescent-limited antisocial pathways: Follow-up at age 26 years.
Development and Psychopathology, 14(1), 179-207.
O’Connor, T. G., Deater-Dechard, K., Fulker, D., Rutter, M., & Plomin, R. (1998).
Genotype-environment correlations in late childhood and early adolescence:
Antisocial behavioral problems and coercive parenting. Developmental
Psychology, 34(5), 970-981.
Olweus, D. (1979). Stability of aggressive reaction patterns in males: A review.
Psychological Bulletin, 86(4), 852-875.
Osterling, K. L., & Hines, A. M. (2006). Mentoring adolescent foster youth: Promoting
resilience during developmental transitions. Child and Family Social Work, 11(3),
242-253.
Overton, W. F. (Ed) (2004). Trajectories of physical aggression from toddlerhood to
middle childhood: NICHD early childcare research network. Monographs of the
Society for Research in Child Development, 69(4), Serial No. 278
Park, J., Essex, M. J., Zahn-Waxler, L., Armstrong, J. M., Klein, M. H., & Goldsmith, H.
H. (2005). Rational and overt aggression in middle childhood: Early childhood
and family risk factors. Early Education and Development, 16(2), 233-256.
Patterson, G. R. (1982). Coercive family process: Vol 3. A social learning approach.
Eugene, OR: Castalia
Patterson, G. R., & Stoolmiller, M. (1991). Replication of a dual failure model for boy’s
depressed mood. Journal of Consulting and Clinical Psychology, 51, 491-498.
Patton, P. L. (1995). Rational behavior skills: A teaching sequence for students with
emotional disabilities. School Counselor, 43(2), 133-141.
Pevalin, D. J., Wade, T. J., & Brannigan, A. (2003). Precursors, cosequences, and
implications for stability and change in preadolescent antisocial behaviors.
Prevention Science, 4(2), 123-136.

170
Plomin, R. & Ashbury, K. (2005). Nature and Nurture: Genetic and environmental
influences on behavior. The Annals of the American Academy of Psychological
Sciences, 600, 86-98.
Plomin, R. & Bergeman, C. S. (1991). The nature of nurture: Genetic influences on
“environmental” measures. Behavioral and Brain Sciences, 14, 373-427.
Plomin, R. & DeFries, J. C. (1983). The Colorado Adoption Project. Child Development,
54(2), 276-289.
Polaha, J., Larzelere, R. E., Shapiro, S. K., & Pettit, G. S. (2004). Physical discipline and
child behavior problems: A study of ethnic group differences. Parenting: Science
and Practice, 4(4), 339-360.
Price, J. (1969). Personality differences within families: Comparison of adult brothers
and sisters. Journal of Biosocial Science, 1(2), 177-205.
Puttler, L. I., Zucker, R. A., Fitzgerald, H. E., & Bringham, R. C. (1998). Behavioral
outcomes among children of alcoholics during the early and middle childhood
years: Familial subtype variations. Alcoholism: Clinical and Experimental
Research, 22(2), 1962-1972.
Reiss, D. & Neiderhiser, J. M. (2000) The interplay of genetic influences and social
processes in developmental theory: Specific mechanisms are coming into view.
Development and Psychopathology, 12(3), 357-374.
Reitz, Z. E., Dekovic, M., & Meijer, A. M. (2005). The structure and stability of
externalizing and internalizing problem behaviors during early adolescence.
Journal of Youth and Adolescence, 34(6), 577-588.
Rhule, D. M., McMahon, R. J., & Spieker, S. J. (2004). Relation of adolescent mothers’
history of antisocial behavior to child conduct problems and social competence.
Journal of Clinical Child and Adolescent Psychology, 33(3), 524-535.
Riggins-Caspers, K. M. (1997). Bias in adoption based research: Methodological and
statistical implications for behavioral genetics. Dissertation Abstracts
International: Section B: The Sciences & Engineering, Vol 58(3-B), 1569.

171
Rimm-Kaufman, S. E., & Kagan, J. (2005). Infant predictors of kindergarten behavior:
The contribution of inhibited and uninhibited temperament types. Behavior
Disorders, 30(4), 331-347.
Rowe, D. C., Rodgers, J. L., & Meseck-Bushey, S. (1992). Sibling delinquency and the
family environment: Shared and unshared influences. Child Development, 72,
583-598.
Ruesch, J., & Bowman, K. M. (1945). Prolonged post-traumatic syndromes following
head injury. American Journal of Psychiatry, 102, 145-163.
Rutter, Giller, & Hagell (1998). Antisocial behavior by young people. Cambridge,
England: Cambridge University Press.
Rutter, M., & Redshaw, J. (1991). Annotation: Growing up as a twin: Twin-singleton
differences in psychological development. Journal of Child Psychology and
Psychiatry, 32, 885-895.
Sameroff, A. J., McDonoug, S. C., & Rosenblum, K. L. (2004). Treating parent-infant
relationship problems: Strategies for intervention.
Sanders, M. R., & Ralph, A. (2005). Family intervention and prevention of behavioural
and emotional disorders in childhood and adolescence. In Hudson, J. L. & Rapee,
R. M. (Eds) Psychopathology and the Family. New York, NY: Elsevier Science.
Scaramella, L. V., & Conger, R. D. (2003). Intergenerational continuity of hostile
parenting and its consequences: The moderating influence of children's negative
emotional reactivity. Social Development, Vol 12(3), 420-439.
Scarr, S., & Carter-Saltzman, L. (1979). Twin method: Defense of a critical assumption.
Behavior Genetics, 9, 527-542.
Scarr, S. & McCartney, K. (1983). How people make their own environments. Child
Development, 54, 424-435.
Schwartz, C. E., Snidman, N., & Kagan, J. (1996). Early childhood temperament as a
determinant of externalizing behavior in adolescence. Development and
Psychopathology, 8(3), 527-537.

172
Sheppard, M. (1994). Maternal depression, child care, and the social work role. British
Journal of Social Work, 24(1), 33-51.
Shields, J. (1962). Monozygotic twins brought up apart and brought up together. London:
Oxford University Press.
Sohr-Preston, S. L., & Scaramella, L.V. (2006). Implications of timing of maternal
depressive symptoms for early cognitive and language development. Clinical
Child & Family Psychology Review, 9(1), 65-83.
Stattin, H., & Magnusson, D. (1989). The role of early aggressive behavior in the
frequency, seriousness, and types of later crime. Journal of Consulting and
Clinical Psychology, 57(6), 710-718.
Stevenson, J., Richman, N., Graham, P. J. (1985). Behaviour problems and language
abilities at three years and behavioural deviance at eight years. Journal of Child
Psychology and Psychiatry, 26(2), 215-230.
Sussman, S., Dent, C. W., McAdams, L. A., Stacy, A. W., Burton, D., & Flay, B. R.
(1994). Group self-identification and adolescent cigarette smoking: A 1-year
prospective study. Journal of Abnormal Psychology, 103(3), 576-580.
Thomas, A. & Chess, S. (1977). Temperament and development. Oxford, England:
Brunner/Mazel.
Thomas, A., Chess, S., & Korn, S. J. (1982). The reality of difficult temperament. Merril-
Palmer Quarterly, 28(1), 1-20.
UCLA Academic Technology Services (2006).
http://www.ats.ucla.edu/STAT/SPSS/output/logistics.htm
van den Oord , E. J. C. G, & Rowe, D. C. (1997). Continuity and change in children’s
social maladjustment: A developmental behavior genetic study. Developmental
Psychology, 33(2), 319-332.
van der Valk, J. C., van den Oord, E. J. C. G., Verhulst, F. C., & Boomsma, D. I. (2003).
Using shared and unique parental views to study the etiology of 7-year-old
twins’ internalizing and externalizing problems. Behavior Genetics, 33(4), 409-
420.

173
van der Valk, J. C., Verhulst, F. C., Neale, M. C. & Boomsma, D. I. (1998). Longitudinal
genetic analysis of problem behaviors in biologically related and unrelated
adoptees. Behavior genetics, 28(5), 365-380.
Van Dusen, K. T., Mednick, S. A., Gabrielli, W. F., & Hutchings B. (1983). Social class
and crime: Genetics and environment In K. T. Van Dusen & S. A. Mednick
(Eds.), Prospective Studies of Crime and Delinquency, Hingham, MA: Martinus
Nyhoff.
Verona, E. Sachs-Ericsson, N. (2005) The Intergenerational Transmission of Externalizing
Behaviors in Adult Participants: The Mediating Role of Childhood Abuse.
Journal of Consulting and Clinical Psychology, 73(6), 1135-1145.
Viding, Blair, Moffitt, T. E., & Plomin, R. (2005) Evidence for substantial genetic risk
for psychopathy in 7-year-olds. Journal of Child Psychology and Psychiatry,
46(6), 592-597.
Warner, W. L., Meeker, M., & Eells, K. (1949). Social Class in America, Chicago, IL:
Science Research Associates
Webster-Stratton, C., & Hammond, M. (1988). Maternal depression and its relationship
to life stress, perceptions of child behavior problems, parenting behavior, and
child conduct problems. Journal of Abnormal Child Psychology, 16, 299-315.
Wechsler, D. (1949). WISC manual: Wechsler intelligence scale for children. NY: The
Psychological Corporation.
Weinberg, R. A., Waldman, I., van Dulmen, M. H. M., & Scarr, S. (2004). The
Minnesota transracial adoption study: Parent reports of psychosocial adjustment
at late adolescence. Adoption Quarterly, 8(2), 27-44.
Welsh, G. S. & Sullivan, P. L. (1952). MMPI configurations in passive-aggressive
personality problems. Unpublished material as cited in Dalstrom, W. G., Welsh,
G. S., & Dalstrom’s An MMPI Handbook; Volume I, Clinical Interpretation (A
revised edition). Minneapolis, MN; University of Minnesota Press.
West, D. J., & Farrington, D. P. (1973). Who becomes delinquent? Second report of the
Cambridge Study in Delinquent Development. Oxford, England: Crane, Russak.

174
Werner, E. E. (1993). Risk, resilience, and recovery: Prospectives from the Kauai
Longitudinal Study. Development and Psychopathology, 5(4), 503-515.
Werner, E. E., & Johnson, J. L. (2004) The role of caring adults in the lives of children of
alcoholics. Substance Use and Misuse, 39(5), 699-720.
Werner, E. E., & Smith, R. S. (1992). Overcoming the odds: High risk children from
birth to adulthood. Ithica, NY: Cornell University Press.
Wilson, R. S. (1983). The Louisville Twin Study: Developmental synchronies in
behavior. Child Development, 54(2), 298-316.
Winsler, A., & Wallace, G. L. (2002). Behavior problems and social skills in preschool
children: Parent-teacher agreement and relations with classroom observations.
Early Education and Development, 13(1), 41-58.
Wuensch, K. L. (2006). Binary Logistic Regression with SPSS.
http://core.ecu.edu/psyc/wuenschk/MV/Multreg/Logistic_SPSS.doc
Zoccolillo, M. (1992). Co-occurrence of conduct disorder and its adult outcomes with
depressive and anxiety disorders: A review. Journal of the American Academy
of Child & Adolescent Psychiatry, 31(3), 547-556.
Zuckerman, M., & Kuhlman, D. M. (2000). Personality and risk-taking: Common
biosocial factors. Journal of Personality, 68(6), Special issue: Personality processes and
problem behavior, 999-1029.

175
VITA
Jody Lynn Ernst was born in La Mirada, California on May 13, 1973 to Karla
Hendrix. Jody left school in 1990 to work as a nanny. In 1992 she decided to begin taking
classes in the evenings at Golden West Community College in Huntington Beach,
California were she discovered her passion for both biology and psychology. In 1995, she
moved to the San Francisco Bay Area, continuing to work as a nanny and take classes at
Diablo Valley Community College. In 1997, Jody transferred to Mills College in
Oakland, California were she received her Bachelor of Arts degree in Psychology in May
of 1999. In August of that same year, she moved to Austin, Texas to begin her graduate
work in Differential Psychology at The University of Texas at Austin. During her time at
The University of Texas at Austin Jody taught a course in Introductory Psychology, a lab
section of Introductory Statistics, and gave guest lectures in Individual Differences and
Industrial/Organizational Psychology. She has recently published an article, with Jennifer
L. Matjasko and Leslie Grunden, in the Journal of Marriage and Family entitled
“Structural and Dynamic Process Family Risk: Consequences for Holistic Adolescent
Functioning.” Jody is currently employed as a Research Fellow for a non-profit
organization, Charter School Policy Institute, conducting research on the effectiveness of
charter schools in Texas. She is happily married to William Charles Ernst, III, with whom
she has two beautiful children, Rowan Ash and Fáelán Sé.
Permanent Address: 1822 W. 37th Street, Austin, Texas 78731
This dissertation was typed by the author.