Embed Size (px)
Citation preview
1
Storage of Energy and Voltage Regulator in Electric Grids with
Distributed Generation through Renewable Energies
Rita Simão, Instituto Superior Técnico
Abstract —Global warming is a worldwide environmental
threat. Concerning the global warming, international
targets were established, which include the increasing of
renewable energies. Therefore, we have been observing an
increase penetration of photovoltaics technology in low
voltage grids. This type of distributed generation can cause
problems in the Electrical Power Quality. More specifically,
voltage rise above the limit defined by NP EN 50160.
Usually, this problem occurs if the solar inverter is located
at the end of a feeder. The most commonly solution is to
temporary turn off the solar inverter, so that the RMS
voltage value can return to a safe range.
Microgeneration’s technology is expensive and the
solution of turn of the microgerator brings an inefficient
behaviour, causing a decrease in the microproducer’s
income.
The main objective of this study is to propose a solution
for this problem. The approach used in this study involves
a storage system combined with decentralized regulation,
based on a local closed-loop controller for reactive power.
Also, with this system it will be possible to offer other
services to the distribution grid operators, such as helping
the mitigation of sag.
In order to perform this work it was necessary to build
the microgeneration model with storage and the different
elements that are present in a low voltage grid (e.g, the
transformer of medium voltage/low voltage, low voltage
distribution lines and electric loads). The performance
simulations of the system were done using Matlab/Simulink
software.
Different trials were run to analyse of the viability of the
proposed solution. The different voltage profiles, power
flows on the electric grid, well as, currents of the
microgeneration model and state of charge of storage
system were measured.
Keywords — Microgeneration, NP EN 50160,
Overvoltage, Storage, Sag, Electrical Power Quality...
I. INTRODUCTION
lobal warming is a worldwide environmental threat.
Several countries have established international
targets, which include the increasing use of
renewable energies. In addition, we have been watching a
substantial price reduction of photovoltaic (PV) modules.
Therefore, an accelerated growing of the penetration of PV
technology in low voltage has been observed. However, the
increasing use of distributed generation (DG) comes with a cost
regarding the Electrical Power Quality (EPQ). Overvoltage is
one of the main problems and the prime subject of this paper.
Overvoltage normally occurs during summer days, when it is
high PV generation and low load periods, especially if the solar
inverter is located at the end of a feeder. In Europe, overvoltage
is charactered by a RMS value of voltage above 253 V, NP EN
50160. For the scenario presented were created different
solutions, such as:
1) Allow the DGs to absorb reactive power, which creates high
currents, losses on the distribution line and a reduction of the
active power;
2) Increase the conductors size by reducing line impedance
which is an efficient solution but very expensive for the grid
operator;
3) Consume the energy excess by adding resistive loads to DGs,
that will consume the extra power;
4) Curtail the power of DG units;
5) Reduce the secondary LV transformer voltage, adjusting the
tap of the transformer. However, this causes significant energy
loss because it is necessary to use an electronic converter, and
this solution is not reliable;
6) Most common solution is to turn off the solar inverter when
the voltage exceeds the standard maximum limit (NP EN
50160);
8) Store the power surplus for later use.
The solution described in this paper and developed in ( [1]),
is a system that combines 1) and 7). For 1) the system computes
a phase shift and adds it to the output current from the solar
inverter (normally in phase with the voltage at that point). The
phase shift on the current will decrease the active power and
increase the reactive power which will have the voltage locally
decreased. However, most of the times, this decrease is not
enough. Therefore, it is included a storage system that will act
when the reduction created by the phase shift is insufficient
(limitations from the conventional inverter).
This paper is organized as follows. In Section II, the LV
system under study is presented. In Section III the
microgeneration simplified model. Section IV the design model
of the solution proposed. The different trials of the system are
shown in Section V and finally, the conclusions are stated in
Section VI.
II. LV GRID MODEL
The example LV distribution grid model used in this study is
based on a real LV grid located in Sintra, Portugal, ( [2]).
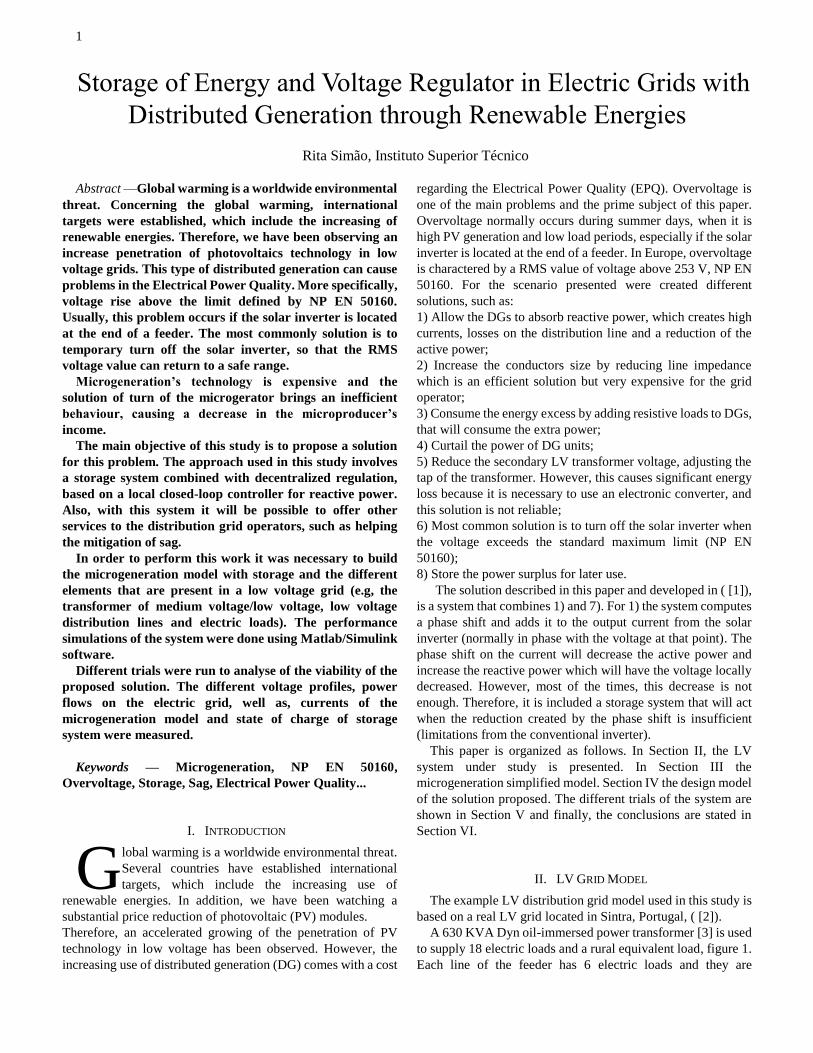
A 630 KVA Dyn oil-immersed power transformer [3] is used
to supply 18 electric loads and a rural equivalent load, figure 1.
Each line of the feeder has 6 electric loads and they are
G
2
monophasic. The power distribution, number of PV models per
electric load, and the type of distribution lines are all presented
in table 1 and 2.
Figure 1: Distribution feeder configuration.
To compute the total power for each load, a coincidence
factor, 𝐶𝑠𝑖, has to be taken in consideration. 𝐶𝑠𝑖 is a ratio of the
simultaneous maximum demand of a group of electrical
consumers:
𝐶𝑠𝑖 = 0,2 + 0,8
√𝑛𝑖 (II.1)
Each electrical load is a group of electrical consumers, in
which 𝑛𝑖 is the number of electrical consumers in a group. Each
consumer (residence) as a contracted power of 6,9x10³ VA, 𝑆𝑖 . Therefore, the power consumed, 𝑆𝐶 , for each load is given by:
𝑆𝐶 = 𝑆𝑖𝐶𝑠𝑖𝑛𝑖 (II.2)
Table i: Summary of The Grid Characteristic [4] [5] [6].
LV Grid characteristics
Transformer rated power 6,9x10³ VA
Maximum distance
Line 1 124 m
Line 2 251 m
Line3 324 m
Cable types
LSVV 1x380, LSVAV
3x185+95, LSVAV
2x16 mm2
(underground)
Table ii: Summary of the Electric loads characteristics.
Electric Loads Characteristics
Phase R S T
Load 1/7/13 2/8/14 3/9/15 4/10/16 5/11/17 6/12
/18
𝑛𝑖 3 4 2 1 1 1
𝐶𝑠𝑖 0,66 0,6 0,765 1 1 1
𝑆𝐶
[kVA] 13,68 16,56 10,57 6,9 6,9 6,9
Nº of
DGs 2 3 0 1 0 0
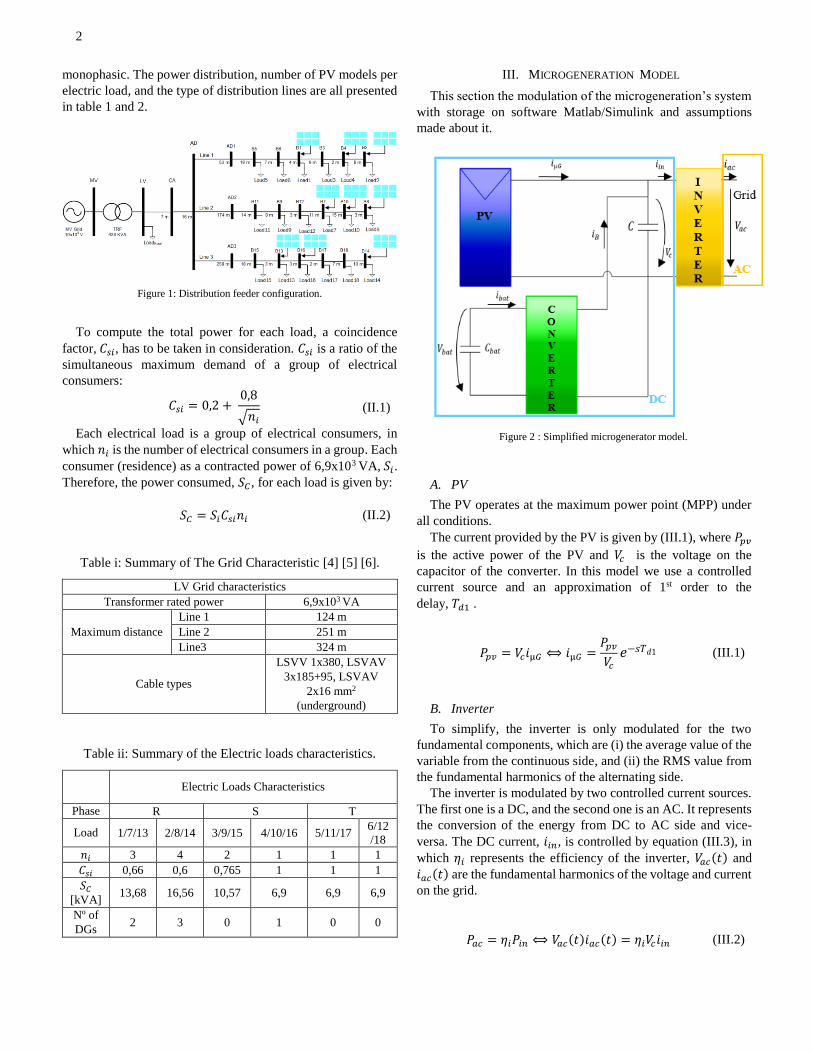
III. MICROGENERATION MODEL
This section the modulation of the microgeneration’s system
with storage on software Matlab/Simulink and assumptions
made about it.
A. PV
The PV operates at the maximum power point (MPP) under
all conditions.
The current provided by the PV is given by (III.1), where 𝑃𝑝𝑣
is the active power of the PV and 𝑉𝑐 is the voltage on the
capacitor of the converter. In this model we use a controlled
current source and an approximation of 1st order to the
delay, 𝑇𝑑1 .
𝑃𝑝𝑣 = 𝑉𝑐𝑖µ𝐺 ⟺ 𝑖µ𝐺 =𝑃𝑝𝑣
𝑉𝑐𝑒−𝑠𝑇𝑑1 (III.1)
B. Inverter
To simplify, the inverter is only modulated for the two
fundamental components, which are (i) the average value of the
variable from the continuous side, and (ii) the RMS value from
the fundamental harmonics of the alternating side.
The inverter is modulated by two controlled current sources.
The first one is a DC, and the second one is an AC. It represents
the conversion of the energy from DC to AC side and vice-
versa. The DC current, 𝑖𝑖𝑛, is controlled by equation (III.3), in
which 𝜂𝑖 represents the efficiency of the inverter, 𝑉𝑎𝑐(𝑡) and
𝑖𝑎𝑐(𝑡) are the fundamental harmonics of the voltage and current
on the grid.
𝑃𝑎𝑐 = 𝜂𝑖𝑃𝑖𝑛 ⟺ 𝑉𝑎𝑐(𝑡)𝑖𝑎𝑐(𝑡) = 𝜂𝑖𝑉𝑐𝑖𝑖𝑛 (III.2)
Figure 2 : Simplified microgenerator model.
3
𝑖𝑖𝑛(𝑡) =𝑉𝑎𝑐(𝑡)𝑖𝑎𝑐(𝑡)
𝜂𝑖𝑉𝑐 (III.3)
The output current of the inverter remains to be computed.
First of all, the inverter generates an AC output current 𝑖𝑎𝑐(t) in
phase with the AC grid voltage, 𝑉𝑎𝑐(𝑡). It is considered that
𝑉𝑎𝑐(𝑡) is the referential in time, meaning that the phase is 0.
Then, 𝑖𝑎𝑐(𝑡) is given by (III.4), where 𝐼𝑎𝑐 is the RMS value of
𝑖𝑎𝑐(𝑡) and it can be obtain by (III.5). If the 𝑖𝑎𝑐(𝑡) is in phase
with 𝑉𝑎𝑐(𝑡), then, disregarding the harmonics cos𝜙 will be
equal to one.
𝑖𝑎𝑐(𝑡) = √2𝐼𝑎𝑐𝑒𝑓 sin(𝜔𝑡) (III.4)
𝑃𝑎𝑐 = 𝐼𝑎𝑐𝑒𝑓𝑉𝑎𝑐𝑒𝑓 cos𝜙 ⟺𝐼𝑎𝑐𝑒𝑓 =𝑃𝑎𝑐
𝑉𝑎𝑐𝑒𝑓 cos 𝜙 (III.5)
C. Sizing Capacitor and Converter
The capacitor sizing is given by (III.6), where ∆𝑉𝐷𝐶 is the
ripple voltage and 𝑓 the frequency of the grid.
𝐶∆𝑉𝐷𝐶×𝑉𝑐 =𝑃𝑎𝑐𝜔⟺ 𝐶 =
𝑃𝑎𝑐2𝜋𝑓∆𝑉𝐷𝐶×𝑉𝑐
(III.6)
This type of converter, a DC-DC Buck Boost, is once again,
represented by a DC controlled current source.
The charge and discharge of the battery was regulated by a
controlled current source (III.8), and 𝜂𝐵 represents the
efficiency of the converter.
𝜂𝐵𝑉𝐵𝑎𝑡𝐼𝐵𝑎𝑡 = 𝑖𝐵𝑉𝐶 (III.7)
𝐼𝐵𝑎𝑡 =𝑉𝐶𝑖𝐵𝜂𝐵𝑉𝐵𝑎𝑡
(III.8)
The current 𝑖𝐵 must be controlled to maintain the capacitor
voltage, 𝑉𝑐 . So, the Kirshhoff’s current law is applied to the
node that connects 𝑖µ𝐺 , 𝑖𝐵 , 𝑖𝑖𝑛 (III.9).
𝐶𝑑𝑉𝑐𝑑𝑡
= 𝑖µ𝐺 + 𝑖𝐵 − 𝑖𝑖𝑛 (III.9)
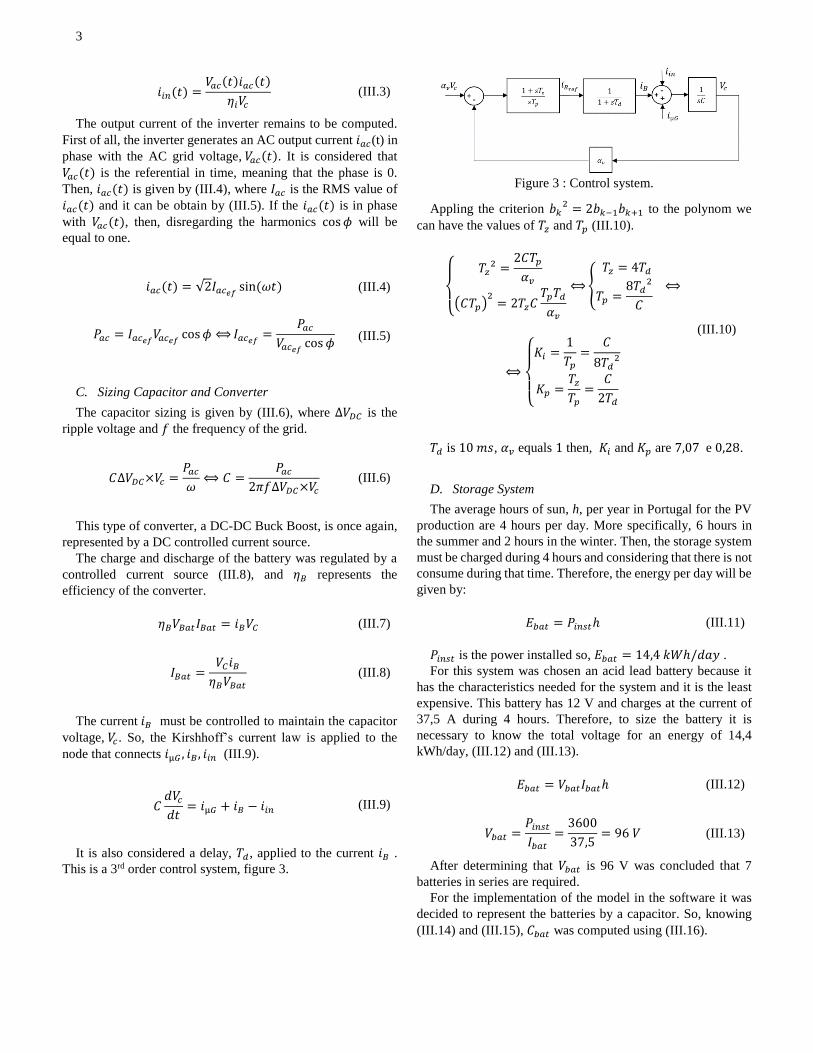
It is also considered a delay, 𝑇𝑑, applied to the current 𝑖𝐵 .
This is a 3rd order control system, figure 3.
Figure 3 : Control system.
Appling the criterion 𝑏𝑘2 = 2𝑏𝑘−1𝑏𝑘+1 to the polynom we
can have the values of 𝑇𝑧 and 𝑇𝑝 (III.10).
{
𝑇𝑧2 =
2𝐶𝑇𝑝
𝛼𝑣
(𝐶𝑇𝑝)2= 2𝑇𝑧𝐶
𝑇𝑝𝑇𝑑
𝛼𝑣
⟺{
𝑇𝑧 = 4𝑇𝑑
𝑇𝑝 =8𝑇𝑑
2
𝐶 ⟺
⟺
{
𝐾𝑖 =
1
𝑇𝑝=
𝐶
8𝑇𝑑2
𝐾𝑝 =𝑇𝑧𝑇𝑝=
𝐶
2𝑇𝑑
(III.10)
𝑇𝑑 is 10 𝑚𝑠, 𝛼𝑣 equals 1 then, 𝐾𝑖 and 𝐾𝑝 are 7,07 e 0,28.
D. Storage System
The average hours of sun, h, per year in Portugal for the PV
production are 4 hours per day. More specifically, 6 hours in
the summer and 2 hours in the winter. Then, the storage system
must be charged during 4 hours and considering that there is not
consume during that time. Therefore, the energy per day will be
given by:
𝐸𝑏𝑎𝑡 = 𝑃𝑖𝑛𝑠𝑡ℎ (III.11)
𝑃𝑖𝑛𝑠𝑡 is the power installed so, 𝐸𝑏𝑎𝑡 = 14,4 𝑘𝑊ℎ/𝑑𝑎𝑦 .
For this system was chosen an acid lead battery because it
has the characteristics needed for the system and it is the least
expensive. This battery has 12 V and charges at the current of
37,5 A during 4 hours. Therefore, to size the battery it is
necessary to know the total voltage for an energy of 14,4
kWh/day, (III.12) and (III.13).
𝐸𝑏𝑎𝑡 = 𝑉𝑏𝑎𝑡𝐼𝑏𝑎𝑡ℎ (III.12)
𝑉𝑏𝑎𝑡 =𝑃𝑖𝑛𝑠𝑡𝐼𝑏𝑎𝑡
=3600
37,5= 96 𝑉 (III.13)
After determining that 𝑉𝑏𝑎𝑡 is 96 V was concluded that 7
batteries in series are required.
For the implementation of the model in the software it was
decided to represent the batteries by a capacitor. So, knowing
(III.14) and (III.15), 𝐶𝑏𝑎𝑡 was computed using (III.16).
4
𝑄𝑏𝑎𝑡 = 𝐶𝑏𝑎𝑡𝑉𝑏𝑎𝑡 (III.14)
∆𝑄𝑏𝑎𝑡 = 𝐶𝑏𝑎𝑡∆𝑉𝑏𝑎𝑡 (III.15)
𝐶𝑏𝑎𝑡 =∆𝑄𝑏𝑎𝑡∆𝑉𝑏𝑎𝑡
=𝐼𝑏𝑎𝑡ℎ
𝑉𝐵𝑎𝑡𝑚𝑎𝑥 − 𝑉𝐵𝑎𝑡𝑚𝑖𝑛 (III.16)
Security limits were created for the battery, and these
parameters will be used in the proposed solution.
𝑉𝐵𝑎𝑡𝑚á𝑥[100%] = 7×14,4 = 100,8 𝑉 (III.17)
𝑉𝐵𝑎𝑡𝑚𝑖𝑛[0%] = 7×12 = 84 𝑉 (III.18)
Then ∆𝑉𝐵𝑎𝑡𝑚á𝑥 = 100,8 − 84 = 16,8 𝑉, therefore
20%∆𝑉𝐵𝑎𝑡𝑚á𝑥 = 3,36 𝑉 and 5%∆𝑉𝐵𝑎𝑡𝑚á𝑥 = 0,84 𝑉. Now it is
possible to compute the limits:
𝑆𝑂𝐶𝑚𝑎𝑥 = 𝑉𝐵𝑎𝑡𝑚á𝑥[100%] − 5%∆𝑉𝐵𝑎𝑡𝑚á𝑥
= 99,96 𝑉 (III.19)
𝑆𝑂𝐶80% = 𝑉𝐵𝑎𝑡𝑚á𝑥[100%] − 20%∆𝑉𝐵𝑎𝑡𝑚á𝑥
= 97,44 𝑉 (III.20)
𝑆𝑂𝐶20% = 𝑉𝐵𝑎𝑡𝑚𝑖𝑛[0%] + 20%∆𝑉𝐵𝑎𝑡𝑚á𝑥
= 87,36 𝑉 (III.21)
𝑆𝑂𝐶𝑚𝑖𝑛 = 𝑉𝐵𝑎𝑡𝑚𝑖𝑛[0%] + 10%∆𝑉𝐵𝑎𝑡𝑚á𝑥= 84,84 𝑉
(III.22)
The limits that were computed are present in figure 8.
IV. SOLUTION MODEL
The solution is divided in 3 parts. The first part identifies the
scenario (Overvoltage, Sag or Normal State). The second one,
which is a decentralized regulation, applies the phase shift to
the system (and is independent from the others). Finally, the
third part, decides which will be the 𝑃𝑝𝑣 and 𝑃𝑎𝑐 for the different
scenarios.
A. Decentralized regulation for mitigation of overvoltage
As described before, the first part of the solution is a closed-
-loop controller that computes a phase angle for the micro
generator output current in relation to the voltage at the
connection point. This, should be set in order to mitigate
overvoltage.
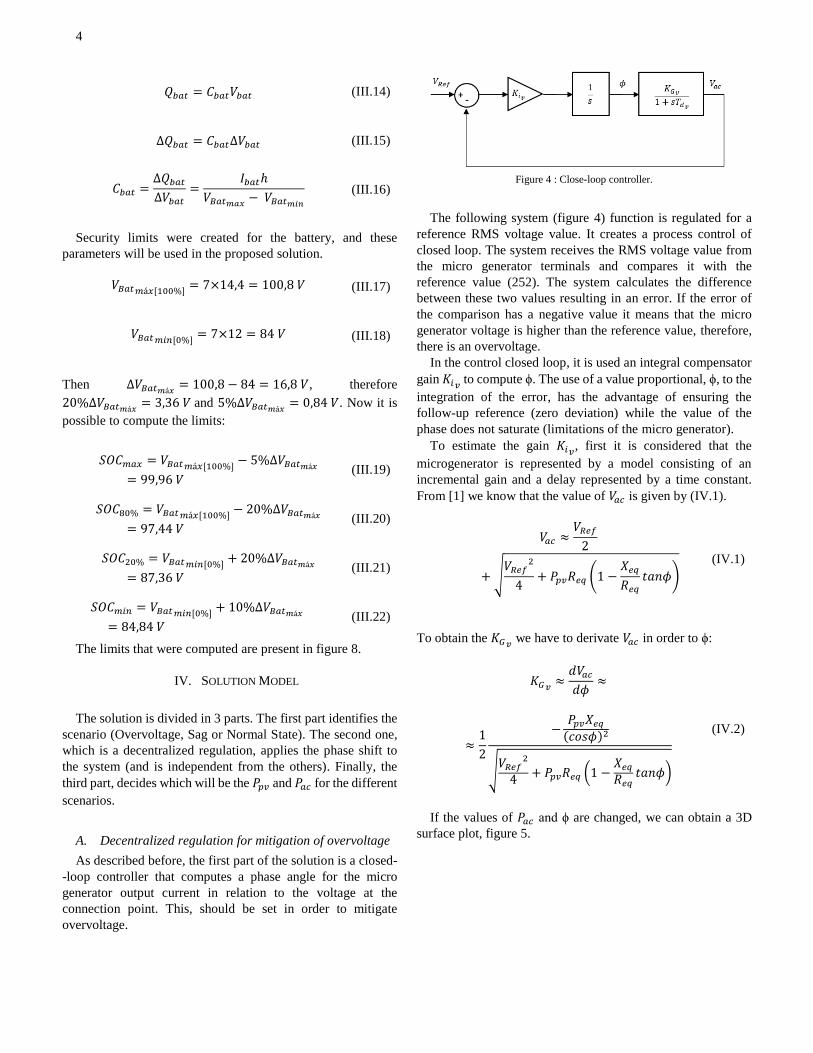
Figure 4 : Close-loop controller.
The following system (figure 4) function is regulated for a
reference RMS voltage value. It creates a process control of
closed loop. The system receives the RMS voltage value from
the micro generator terminals and compares it with the
reference value (252). The system calculates the difference
between these two values resulting in an error. If the error of
the comparison has a negative value it means that the micro
generator voltage is higher than the reference value, therefore,
there is an overvoltage.
In the control closed loop, it is used an integral compensator
gain 𝐾𝑖𝑣 to compute ϕ. The use of a value proportional, ϕ, to the
integration of the error, has the advantage of ensuring the
follow-up reference (zero deviation) while the value of the
phase does not saturate (limitations of the micro generator).
To estimate the gain 𝐾𝑖𝑣, first it is considered that the
microgenerator is represented by a model consisting of an
incremental gain and a delay represented by a time constant.
From [1] we know that the value of 𝑉𝑎𝑐 is given by (IV.1).
𝑉𝑎𝑐 ≈𝑉𝑅𝑒𝑓
2
+ √𝑉𝑅𝑒𝑓
2
4+ 𝑃𝑝𝑣𝑅𝑒𝑞 (1 −
𝑋𝑒𝑞
𝑅𝑒𝑞𝑡𝑎𝑛𝜙)
(IV.1)
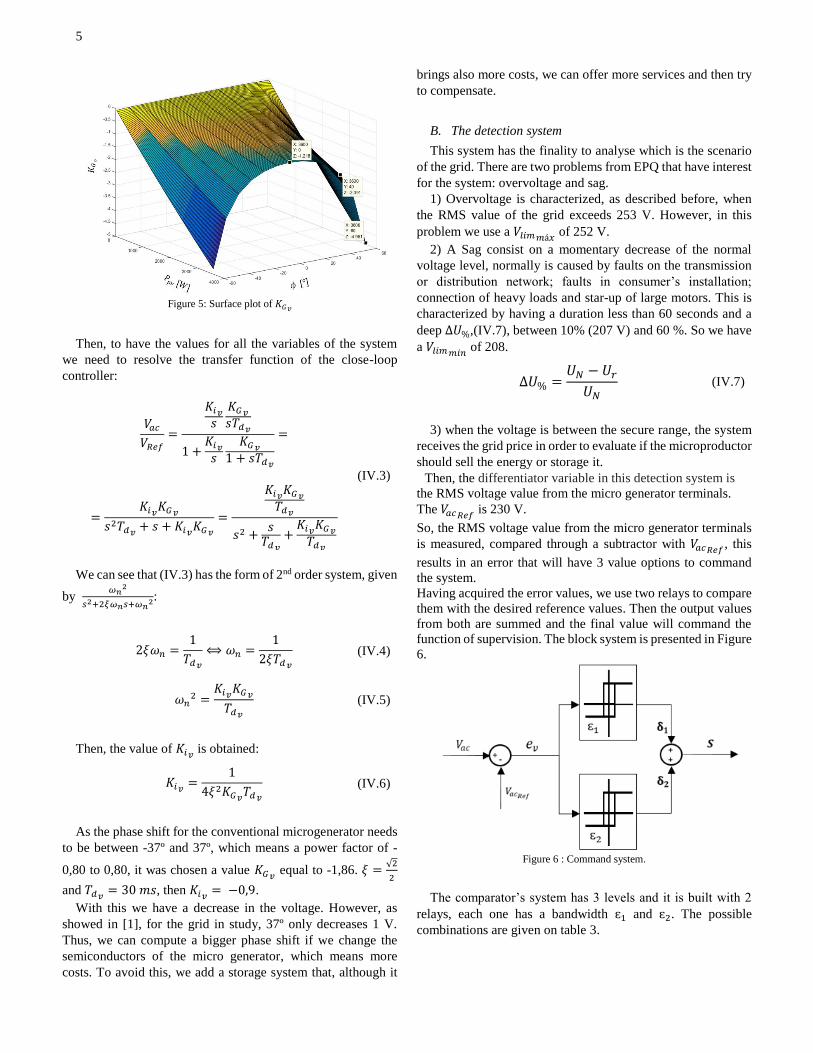
To obtain the 𝐾𝐺𝑣 we have to derivate 𝑉𝑎𝑐 in order to ϕ:
𝐾𝐺𝑣 ≈𝑑𝑉𝑎𝑐𝑑𝜙
≈
≈1
2
−𝑃𝑝𝑣𝑋𝑒𝑞(𝑐𝑜𝑠𝜙)2
√𝑉𝑅𝑒𝑓
2
4+ 𝑃𝑝𝑣𝑅𝑒𝑞 (1 −
𝑋𝑒𝑞𝑅𝑒𝑞
𝑡𝑎𝑛𝜙)
(IV.2)
If the values of 𝑃𝑎𝑐 and ϕ are changed, we can obtain a 3D
surface plot, figure 5.
5
Figure 5: Surface plot of 𝐾𝐺𝑣
Then, to have the values for all the variables of the system
we need to resolve the transfer function of the close-loop
controller:
𝑉𝑎𝑐𝑉𝑅𝑒𝑓
=
𝐾𝑖𝑣𝑠
𝐾𝐺𝑣𝑠𝑇𝑑𝑣
1 +𝐾𝑖𝑣𝑠
𝐾𝐺𝑣1 + 𝑠𝑇𝑑𝑣
=
=𝐾𝑖𝑣𝐾𝐺𝑣
𝑠2𝑇𝑑𝑣 + 𝑠 + 𝐾𝑖𝑣𝐾𝐺𝑣=
𝐾𝑖𝑣𝐾𝐺𝑣𝑇𝑑𝑣
𝑠2 +𝑠𝑇𝑑𝑣
+𝐾𝑖𝑣𝐾𝐺𝑣𝑇𝑑𝑣
(IV.3)
We can see that (IV.3) has the form of 2nd order system, given
by 𝜔𝑛
2
𝑠2+2𝜉𝜔𝑛𝑠+𝜔𝑛2:
2𝜉𝜔𝑛 =1
𝑇𝑑𝑣⟺ 𝜔𝑛 =
1
2𝜉𝑇𝑑𝑣 (IV.4)
𝜔𝑛2 =
𝐾𝑖𝑣𝐾𝐺𝑣𝑇𝑑𝑣
(IV.5)
Then, the value of 𝐾𝑖𝑣 is obtained:
𝐾𝑖𝑣 =1
4𝜉2𝐾𝐺𝑣𝑇𝑑𝑣 (IV.6)
As the phase shift for the conventional microgenerator needs
to be between -37º and 37º, which means a power factor of -
0,80 to 0,80, it was chosen a value 𝐾𝐺𝑣 equal to -1,86. 𝜉 =√2
2
and 𝑇𝑑𝑣 = 30 𝑚𝑠, then 𝐾𝑖𝑣 = −0,9.
With this we have a decrease in the voltage. However, as
showed in [1], for the grid in study, 37º only decreases 1 V.
Thus, we can compute a bigger phase shift if we change the
semiconductors of the micro generator, which means more
costs. To avoid this, we add a storage system that, although it
brings also more costs, we can offer more services and then try
to compensate.
B. The detection system
This system has the finality to analyse which is the scenario
of the grid. There are two problems from EPQ that have interest
for the system: overvoltage and sag.
1) Overvoltage is characterized, as described before, when
the RMS value of the grid exceeds 253 V. However, in this
problem we use a 𝑉𝑙𝑖𝑚𝑚á𝑥 of 252 V.
2) A Sag consist on a momentary decrease of the normal
voltage level, normally is caused by faults on the transmission
or distribution network; faults in consumer’s installation;
connection of heavy loads and star-up of large motors. This is
characterized by having a duration less than 60 seconds and a
deep ∆𝑈%,(IV.7), between 10% (207 V) and 60 %. So we have
a 𝑉𝑙𝑖𝑚𝑚𝑖𝑛 of 208.
∆𝑈% =𝑈𝑁 − 𝑈𝑟𝑈𝑁
(IV.7)
3) when the voltage is between the secure range, the system
receives the grid price in order to evaluate if the microproductor
should sell the energy or storage it.
Then, the differentiator variable in this detection system is
the RMS voltage value from the micro generator terminals.
The 𝑉𝑎𝑐𝑅𝑒𝑓 is 230 V.
So, the RMS voltage value from the micro generator terminals
is measured, compared through a subtractor with 𝑉𝑎𝑐𝑅𝑒𝑓 , this
results in an error that will have 3 value options to command
the system.
Having acquired the error values, we use two relays to compare
them with the desired reference values. Then the output values
from both are summed and the final value will command the
function of supervision. The block system is presented in Figure
6.
Figure 6 : Command system.
The comparator’s system has 3 levels and it is built with 2
relays, each one has a bandwidth ɛ1 and ɛ2. The possible
combinations are given on table 3.
6
Table 3 : Possible Combinations.
𝛅𝟏 𝛅𝟐 S Scenario
0,5 0,5 1 Overvoltage
0,5 -0,5 0 Normal
-0,5 -0,5 -1 Sag
If the error is above or equal to 22, then the S’s value should
be 1 (Figure 7). ɛ1 has a value of 2. In other hand, if the value
of the error is equal or above -22 then the S’s value should be -
1. ɛ1 has a value of -2. All the other scenarios should be equal
0.
Figure 7: Figure that represent the limits of hysteresis.
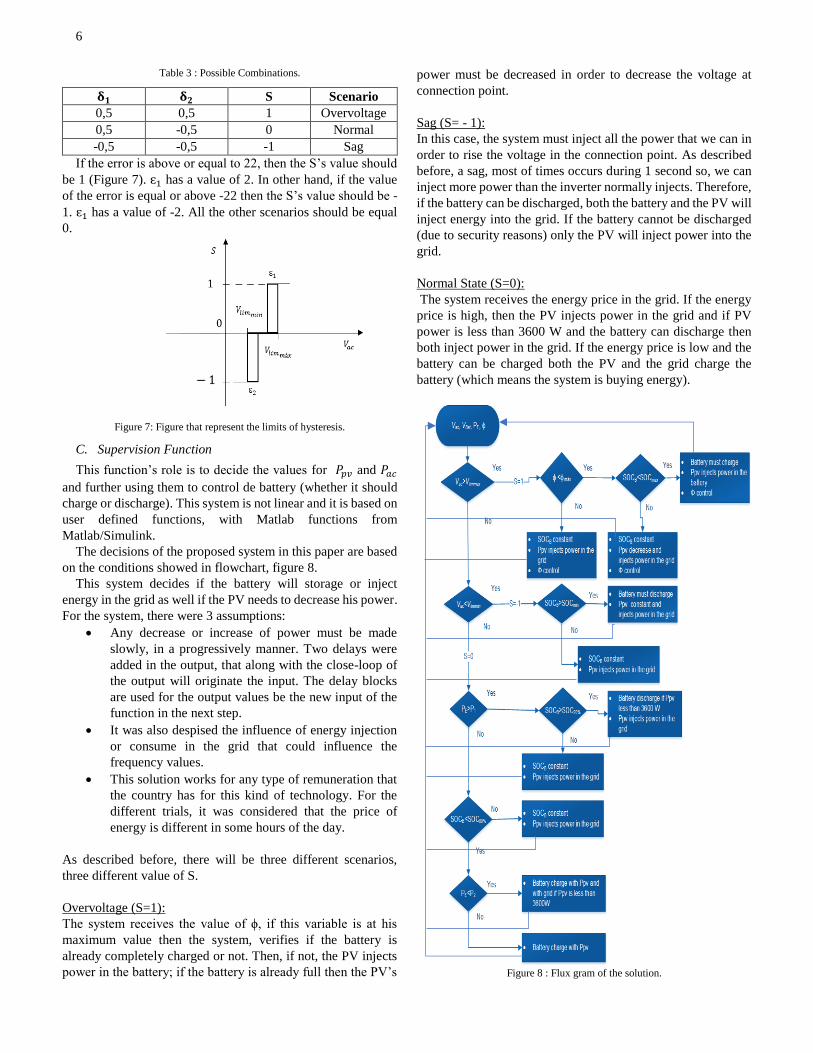
C. Supervision Function
This function’s role is to decide the values for 𝑃𝑝𝑣 and 𝑃𝑎𝑐
and further using them to control de battery (whether it should
charge or discharge). This system is not linear and it is based on
user defined functions, with Matlab functions from
Matlab/Simulink.
The decisions of the proposed system in this paper are based
on the conditions showed in flowchart, figure 8.
This system decides if the battery will storage or inject
energy in the grid as well if the PV needs to decrease his power.
For the system, there were 3 assumptions:
Any decrease or increase of power must be made
slowly, in a progressively manner. Two delays were
added in the output, that along with the close-loop of
the output will originate the input. The delay blocks
are used for the output values be the new input of the
function in the next step.
It was also despised the influence of energy injection
or consume in the grid that could influence the
frequency values.
This solution works for any type of remuneration that
the country has for this kind of technology. For the
different trials, it was considered that the price of
energy is different in some hours of the day.
As described before, there will be three different scenarios,
three different value of S.
Overvoltage (S=1):
The system receives the value of ϕ, if this variable is at his
maximum value then the system, verifies if the battery is
already completely charged or not. Then, if not, the PV injects
power in the battery; if the battery is already full then the PV’s
power must be decreased in order to decrease the voltage at
connection point.
Sag (S= - 1):
In this case, the system must inject all the power that we can in
order to rise the voltage in the connection point. As described
before, a sag, most of times occurs during 1 second so, we can
inject more power than the inverter normally injects. Therefore,
if the battery can be discharged, both the battery and the PV will
inject energy into the grid. If the battery cannot be discharged
(due to security reasons) only the PV will inject power into the
grid.
Normal State (S=0):
The system receives the energy price in the grid. If the energy
price is high, then the PV injects power in the grid and if PV
power is less than 3600 W and the battery can discharge then
both inject power in the grid. If the energy price is low and the
battery can be charged both the PV and the grid charge the
battery (which means the system is buying energy).
Figure 8 : Flux gram of the solution.
7
In the next section there made trials to show the system
behaviour to the different scenarios.
V. RESULTS
There were made different trials in [1]. However, in this
paper it’s only showed the most relevant ones.
1) Trial when we have a few consumptions from the electric
loads (2% from the power of the transformer).
2) When all the microgenerators in the LV grid are installed
and an overvoltage occurs.
3) One conventional microgenerator is replaced by one with
the solution and it tries to mitigate the sag. In this, the state of
charge of the battery is low. The maximum phase shift is 37º.
4) Two conventional microgenerators are replaced by two
with solutions. The storage system is fully charged. Again, the
maximum phase shift is 37º.
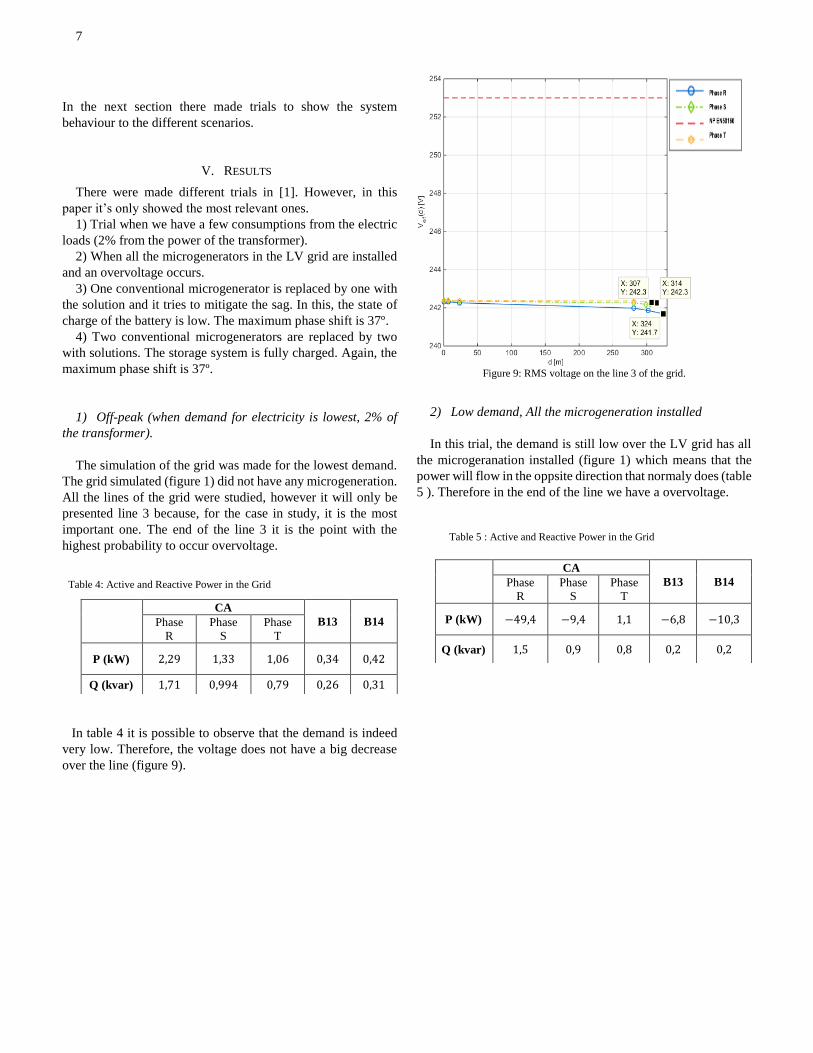
1) Off-peak (when demand for electricity is lowest, 2% of
the transformer).
The simulation of the grid was made for the lowest demand.
The grid simulated (figure 1) did not have any microgeneration.
All the lines of the grid were studied, however it will only be
presented line 3 because, for the case in study, it is the most
important one. The end of the line 3 it is the point with the
highest probability to occur overvoltage.
In table 4 it is possible to observe that the demand is indeed
very low. Therefore, the voltage does not have a big decrease
over the line (figure 9).
Figure 9: RMS voltage on the line 3 of the grid.
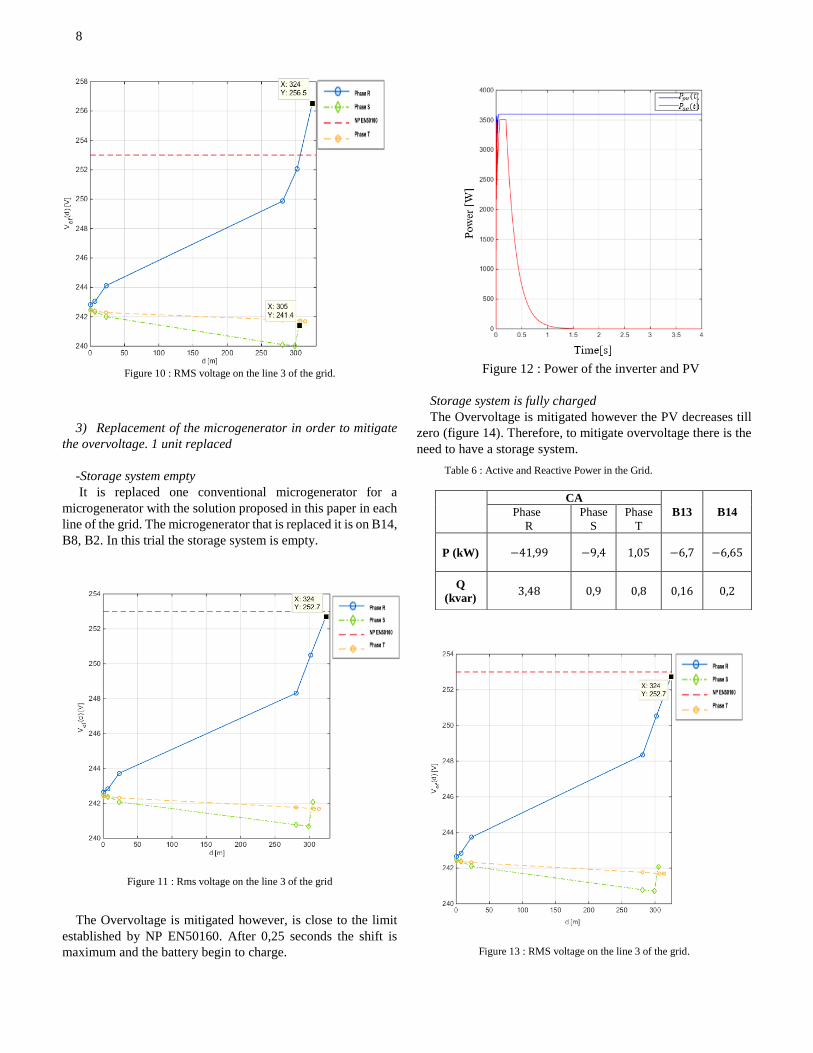
2) Low demand, All the microgeneration installed
In this trial, the demand is still low over the LV grid has all
the microgeranation installed (figure 1) which means that the
power will flow in the oppsite direction that normaly does (table
5 ). Therefore in the end of the line we have a overvoltage.
Table 4: Active and Reactive Power in the Grid
CA
B13 B14 Phase
R
Phase
S
Phase
T
P (kW) 2,29 1,33 1,06 0,34 0,42
Q (kvar) 1,71 0,994 0,79 0,26 0,31
Table 5 : Active and Reactive Power in the Grid
CA
B13 B14 Phase
R
Phase
S
Phase
T
P (kW) −49,4 −9,4 1,1 −6,8 −10,3
Q (kvar) 1,5 0,9 0,8 0,2 0,2
8
Figure 10 : RMS voltage on the line 3 of the grid.
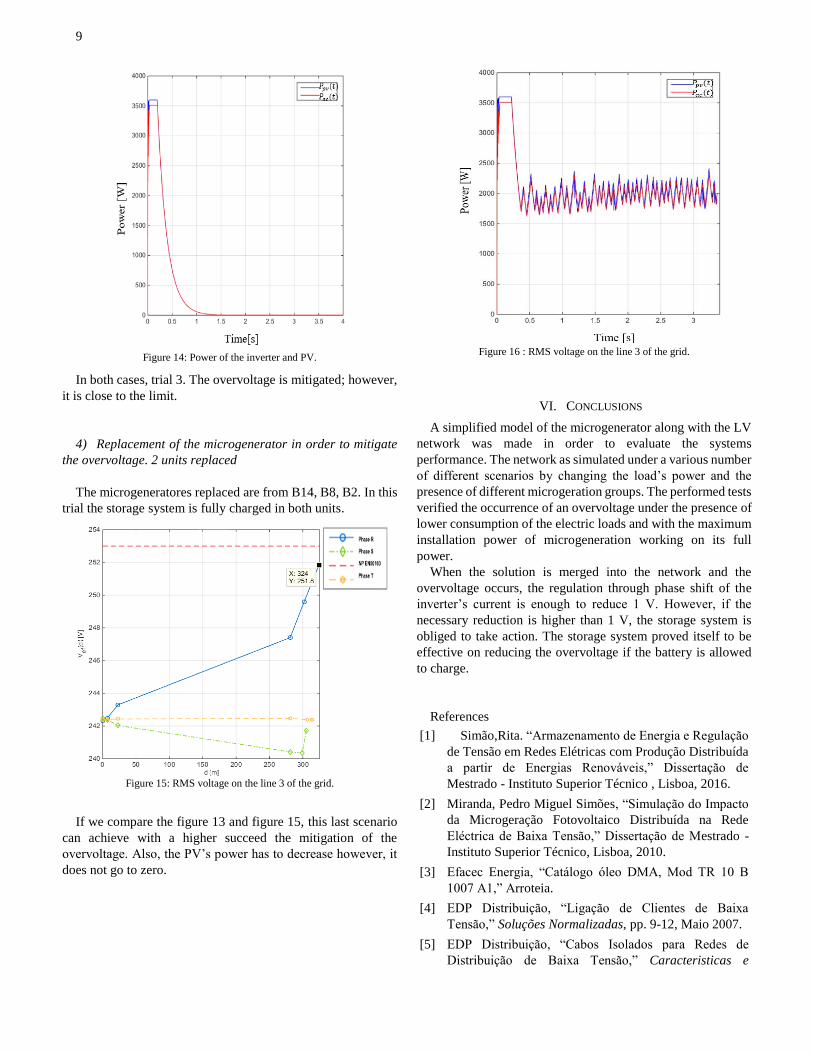
3) Replacement of the microgenerator in order to mitigate
the overvoltage. 1 unit replaced
-Storage system empty
It is replaced one conventional microgenerator for a
microgenerator with the solution proposed in this paper in each
line of the grid. The microgenerator that is replaced it is on B14,
B8, B2. In this trial the storage system is empty.
Figure 11 : Rms voltage on the line 3 of the grid
The Overvoltage is mitigated however, is close to the limit
established by NP EN50160. After 0,25 seconds the shift is
maximum and the battery begin to charge.
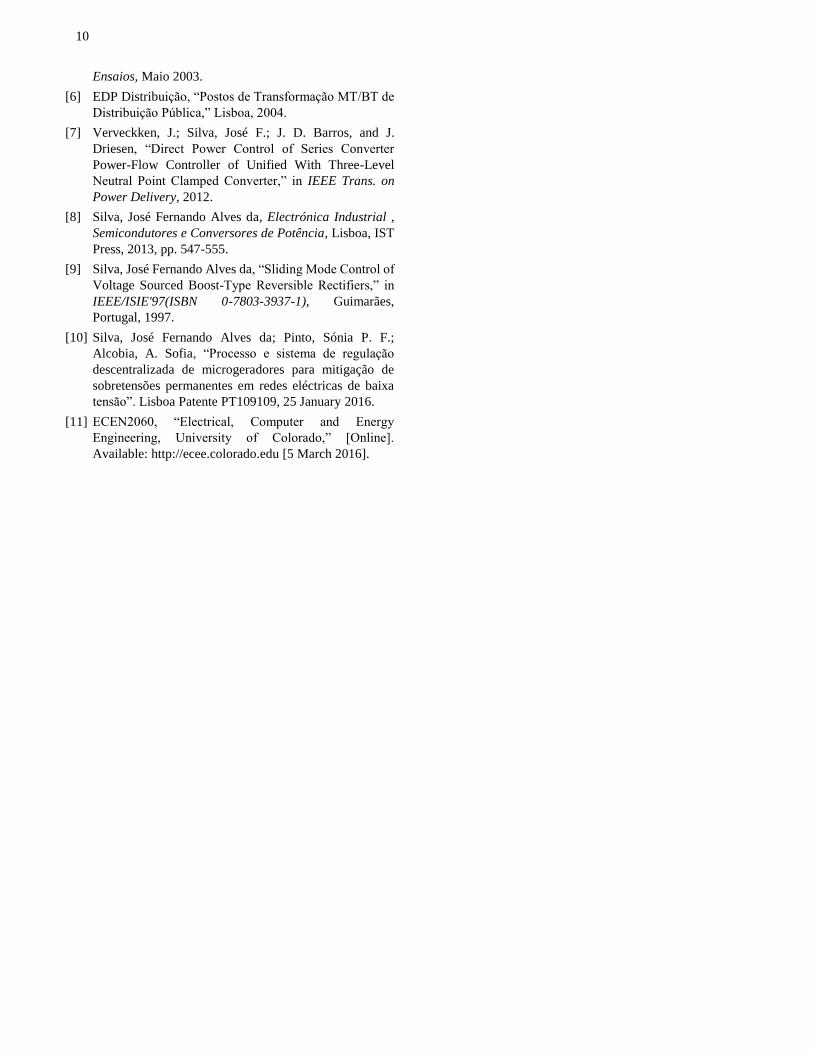
Figure 12 : Power of the inverter and PV
Storage system is fully charged
The Overvoltage is mitigated however the PV decreases till
zero (figure 14). Therefore, to mitigate overvoltage there is the
need to have a storage system.
Figure 13 : RMS voltage on the line 3 of the grid.
CA
B13 B14 Phase
R
Phase
S
Phase
T
P (kW) −41,99 −9,4 1,05 −6,7 −6,65
Q
(kvar) 3,48 0,9 0,8 0,16 0,2
Table 6 : Active and Reactive Power in the Grid.
9
Figure 14: Power of the inverter and PV.
In both cases, trial 3. The overvoltage is mitigated; however,
it is close to the limit.
4) Replacement of the microgenerator in order to mitigate
the overvoltage. 2 units replaced
The microgeneratores replaced are from B14, B8, B2. In this
trial the storage system is fully charged in both units.
Figure 15: RMS voltage on the line 3 of the grid.
If we compare the figure 13 and figure 15, this last scenario
can achieve with a higher succeed the mitigation of the
overvoltage. Also, the PV’s power has to decrease however, it
does not go to zero.
Figure 16 : RMS voltage on the line 3 of the grid.
VI. CONCLUSIONS
A simplified model of the microgenerator along with the LV
network was made in order to evaluate the systems
performance. The network as simulated under a various number
of different scenarios by changing the load’s power and the
presence of different microgeration groups. The performed tests
verified the occurrence of an overvoltage under the presence of
lower consumption of the electric loads and with the maximum
installation power of microgeneration working on its full
power.
When the solution is merged into the network and the
overvoltage occurs, the regulation through phase shift of the
inverter’s current is enough to reduce 1 V. However, if the
necessary reduction is higher than 1 V, the storage system is
obliged to take action. The storage system proved itself to be
effective on reducing the overvoltage if the battery is allowed
to charge.
References
[1] Simão,Rita. “Armazenamento de Energia e Regulação
de Tensão em Redes Elétricas com Produção Distribuída
a partir de Energias Renováveis,” Dissertação de
Mestrado - Instituto Superior Técnico , Lisboa, 2016.
[2] Miranda, Pedro Miguel Simões, “Simulação do Impacto
da Microgeração Fotovoltaico Distribuída na Rede
Eléctrica de Baixa Tensão,” Dissertação de Mestrado -
Instituto Superior Técnico, Lisboa, 2010.
[3] Efacec Energia, “Catálogo óleo DMA, Mod TR 10 B
1007 A1,” Arroteia.
[4] EDP Distribuição, “Ligação de Clientes de Baixa
Tensão,” Soluções Normalizadas, pp. 9-12, Maio 2007.
[5] EDP Distribuição, “Cabos Isolados para Redes de
Distribuição de Baixa Tensão,” Caracteristicas e
10
Ensaios, Maio 2003.
[6] EDP Distribuição, “Postos de Transformação MT/BT de
Distribuição Pública,” Lisboa, 2004.
[7] Verveckken, J.; Silva, José F.; J. D. Barros, and J.
Driesen, “Direct Power Control of Series Converter
Power-Flow Controller of Unified With Three-Level
Neutral Point Clamped Converter,” in IEEE Trans. on
Power Delivery, 2012.
[8] Silva, José Fernando Alves da, Electrónica Industrial ,
Semicondutores e Conversores de Potência, Lisboa, IST
Press, 2013, pp. 547-555.
[9] Silva, José Fernando Alves da, “Sliding Mode Control of
Voltage Sourced Boost-Type Reversible Rectifiers,” in
IEEE/ISIE'97(ISBN 0-7803-3937-1), Guimarães,
Portugal, 1997.
[10] Silva, José Fernando Alves da; Pinto, Sónia P. F.;
Alcobia, A. Sofia, “Processo e sistema de regulação
descentralizada de microgeradores para mitigação de
sobretensões permanentes em redes eléctricas de baixa
tensão”. Lisboa Patente PT109109, 25 January 2016.
[11] ECEN2060, “Electrical, Computer and Energy
Engineering, University of Colorado,” [Online].
Available: http://ecee.colorado.edu [5 March 2016].
![CHEMISTRY: SHAPING THE FUTURE - ULisboa · Pedro Góis 11h10-12h10 Oral (15 min) [O] Hélio Faustino (iMed-ULisboa) [O] Inês Mariz (IST-ULisboa) [O] Ivo Martins (IMM-ULisboa) [O]](https://img.pdfslide.us/doc/110x75/605b4e037f6ad14c3648b45d/chemistry-shaping-the-future-ulisboa-pedro-gis-11h10-12h10-oral-15-min-o.jpg)
![C:/andreia/Doutorado/ Tese/tese latex/tese latex/tese · 2018-01-31 · [Sampaio & de Souza, 2008] SAMPAIO, A.; DE SOUZA, C.. Usu´arios podem escrever especificac¸˜oes de sistemas?](https://img.pdfslide.us/doc/110x75/5ec8d4569e681779b87efd18/candreiadoutorado-tesetese-latextese-latex-2018-01-31-sampaio-de.jpg)