Embed Size (px)
Citation preview
Project No: 1011096 8th December 2010
ENVIRONMENTAL NOISE ASSESSMENT
OF A PROPOSED TESCO STORE AT
HAWKINS LANE,
BURTON UPON TRENT
Prepared by:
J. P. Murfitt
BEng (Hons). MIOA.
REPO
RT‐ T
esco, B
urton Upo
n Tren
t
The White House, London Road, Copdock, Ipswich. IP8 3JH. Website: www.sharpsredmore.co.uk Telephone: (01473) 730073 Fax: (01473) 730030 Email: [email protected] Directors: TL Redmore BEng MSc PhD MIOA; KJ Gayler CEnv BSc(Hons) MIEnvSc MIOA; RD Sullivan BA PhD CEng MIOA MAAS Sharps Redmore Partnership Limited. Registered in England No. 2593855
CONTENTS
1.0 Introduction 3
2.0 Assessment Methodology and Criteria 5
3.0 Survey Details 10
4.0 Assessment Details 14
5.0 Assessment Conclusions 23
Appendix A Site Layout Plan Showing Noise Measurement Locations
Appendix B Acoustic Terminology
Appendix C WHO Guidelines
Project No: 1011096 Page 3 of 23
1.0 Introduction
1.1 The Sharps Redmore Partnership (SRP) has been commissioned by Tesco Stores
Limited, to undertake a noise assessment for a development at Hawkins Lane,
Burton Upon Trent. The proposed development will comprise a foodstore with
associated petrol filling station, car parking and service yard.
1.2 The assessment’s objective was to determine how noise from the proposed
development would affect the amenities of existing local residents and receptors.
1.3 In this respect SRP has considered the following components of the
development:
• car parking activity
• service yard activity
• delivery vehicle activity on the access/egress road
• home delivery activity
• petrol filling station
• traffic activity on the public highway
• mechanical services plant
1.4 Each of these components is considered in turn.
1.5 This assessment report is structured as follows:
• Section 2 ‐ This section of the report contains an analysis of the appropriate
assessment methodology and criteria for each of the components of noise
listed in paragraph 1.3 above.
• Section 3 ‐ To a certain extent, the impact from a given noise source is a
function of the existing noise climate of an area. Section 3.0 of this report
sets out the findings of noise surveys undertaken in the area.
• Section 4 ‐ This section contains the assessment findings for each of the
component sources listed at paragraph 1.3 above.
Project No: 1011096 Page 4 of 23
• Section 5 ‐ Contains the conclusions of the assessment.
1.6 Appendix A shows the measurement locations on a proposed site layout plan. A
glossary of acoustic terminology is included as Appendix B of this report.
Project No: 1011096 Page 5 of 23
2.0 Assessment Methodology and Criteria
2.1 The impact of noise from a new source may be assessed by several generic
methods that may be summarised as follows:
i. the effect may be determined by comparing the noise level of the source
with recommended, absolute, noise limits contained within guidance
documents (fixed limits);
ii. the effect may be gauged by considering the change in noise level, that
would result from the proposal, against advice in guidance documents
(changes in noise level); and
iii. the impact may be determined by considering the noise level that would
result from the proposal relative to pre‐existing background noise level
of the area (a BS 4142 approach).
2.2 Each of these methods of assessment has advantages and disadvantages in
relation to the assessment of a particular noise source in a particular area.
2.3 The use of fixed limits (method i, above) is appropriate for the assessment of
sources that are contained within a finite boundary, particularly where noise
sensitive receptors are few or are grouped together. Thus, this assessment
method is appropriate to the noise from site activity, such as that within the car
park, service yard, service access road and the filling station in this case.
2.4 The assessment of impact against changes in noise level (method ii, above) is
very well suited to the analysis of noise from road traffic on the public highway
since such analysis is normally determined entirely by calculation (using the “with
scheme” and “without scheme”, traffic flows).
Project No: 1011096 Page 6 of 23
2.5 The use of BS 4142 type assessment (method iii, above) is only applicable to the
analysis of noise that is industrial in nature. Moreover, BS 4142 is better suited
to the assessment of steady noise. In this case a BS 4142 assessment is
appropriate only for assessing noise form refrigeration units on home delivery
vehicles and the setting of a noise limit for mechanical services plant.
Fixed Limits
2.6 There are a number of guidance documents that contain recommended fixed
limits. These are discussed below.
2.7 Planning Policy Guidance (PPG) 24 “Planning and Noise” contains comprehensive
advice on the subject of noise both in the circumstances of a residential
development or a noise producing development.
2.8 PPG 24 Annex 3 paragraphs 19 and 20 address the subject of commercial and
industrial development. In this section, reference is made to BS 8233:1987 (now
superseded by BS 8233:1999).
2.9 This Standard is principally intended to assist in the design of new dwellings;
however, the Standard does state that it may be used in the assessment of noise
from new sources being brought to existing dwellings.
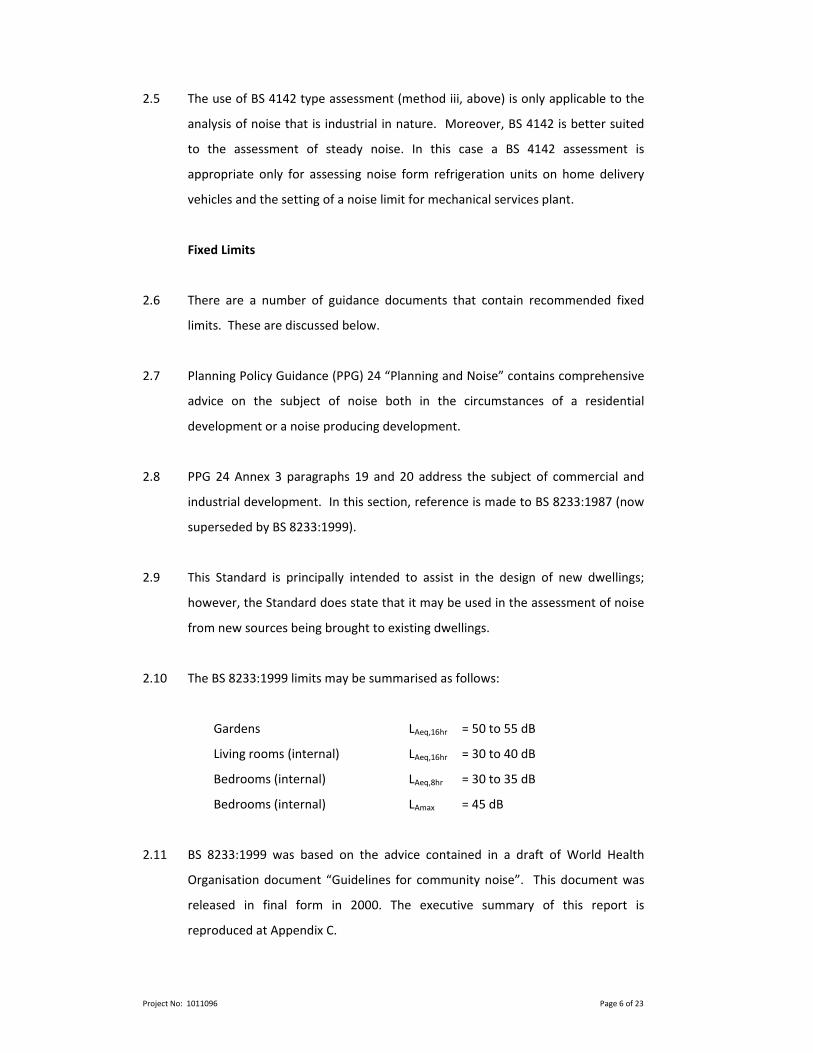
2.10 The BS 8233:1999 limits may be summarised as follows:
Gardens LAeq,16hr = 50 to 55 dB
Living rooms (internal) LAeq,16hr = 30 to 40 dB
Bedrooms (internal) LAeq,8hr = 30 to 35 dB
Bedrooms (internal) LAmax = 45 dB
2.11 BS 8233:1999 was based on the advice contained in a draft of World Health
Organisation document “Guidelines for community noise”. This document was
released in final form in 2000. The executive summary of this report is
reproduced at Appendix C.
Project No: 1011096 Page 7 of 23
2.12 The WHO advice is the most useful, comprehensive, and pertinent advice in this
case, because it is not specific to the circumstances of the assessment. Instead, it
provides guideline values at, for example, schools, dwellings and offices. The
WHO guideline values are appropriate to what are termed “critical health
effects”. This means that the limits are at the lowest noise level that would result
in any psychological, physiological or sociological effect.
2.13 Policy and associated guidance (from PPS 1) sets out the Government’s
overarching planning policies “on the delivery of sustainable development
through the planning system.” Paragraph 19 of the PPS discusses plan policies
and planning decisions and provides the following advice:
“Significant adverse impacts on the environment should be avoided and
alternative options which might reduce or eliminate those impacts pursued.
Where adverse impacts are unavoidable, planning authorities and
developers should consider possible mitigation measures.”
2.14 This policy has been reinforced and interpreted specifically in relation to noise in
the recent DEFRA publication, “Noise Policy Statement for England” (March
2010), which states three policy aims, as follows:
“Through the effective management and control of environmental,
neighbour and neighbourhood noise within the context of Government
policy on sustainable development:
• avoid significant adverse impacts on health and quality of life;
• mitigate and minimise adverse impacts on health and quality of
life; and
• where possible, contribute to the improvement of health and
quality of life.”
Project No: 1011096 Page 8 of 23
2.15 Together, the first two aims require that no significant adverse impact should
occur and that, where a noise level falls between a level which represents the
lowest observable adverse effect and a level which represents a significant
observed adverse effect, the according to the explanatory notes in the
statement:
“… all reasonable steps should be taken to mitigate and minimise adverse
effects on health and quality of life whilst also taking into consideration the
guiding principles of sustainable development. This does not mean that
such effects cannot occur.”
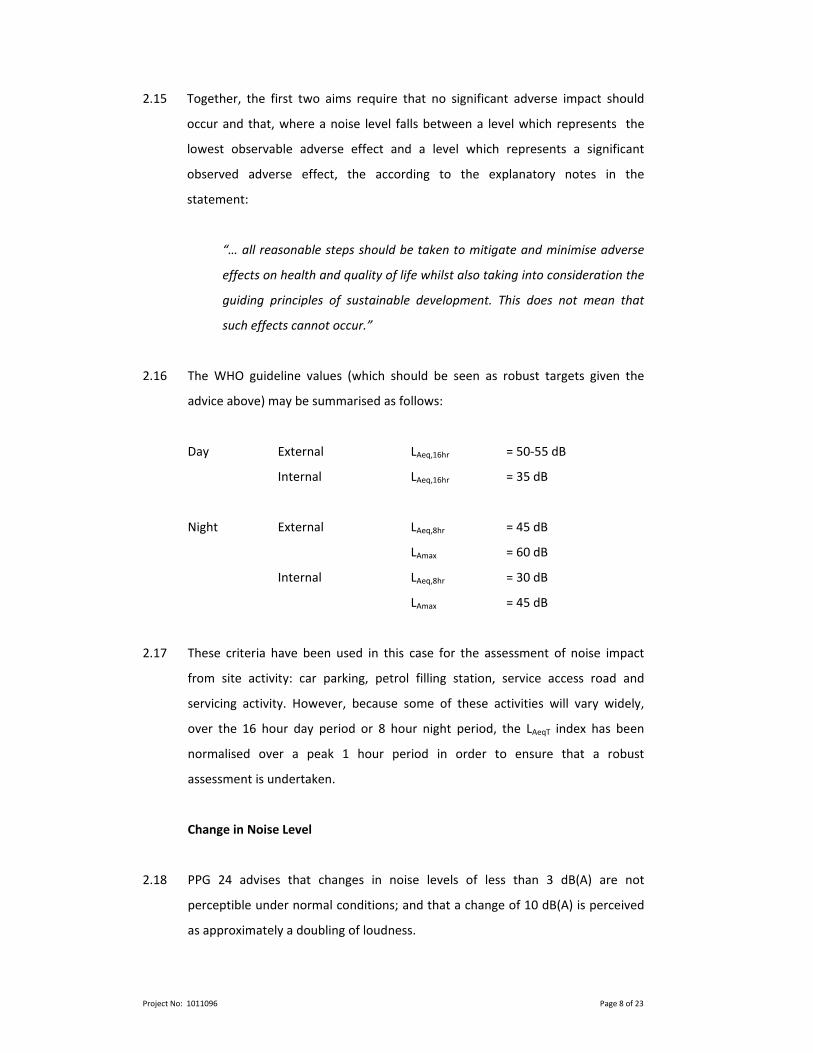
2.16 The WHO guideline values (which should be seen as robust targets given the
advice above) may be summarised as follows:
Day External LAeq,16hr = 50‐55 dB
Internal LAeq,16hr = 35 dB
Night External LAeq,8hr = 45 dB
LAmax = 60 dB
Internal LAeq,8hr = 30 dB
LAmax = 45 dB
2.17 These criteria have been used in this case for the assessment of noise impact
from site activity: car parking, petrol filling station, service access road and
servicing activity. However, because some of these activities will vary widely,
over the 16 hour day period or 8 hour night period, the LAeqT index has been
normalised over a peak 1 hour period in order to ensure that a robust
assessment is undertaken.
Change in Noise Level
2.18 PPG 24 advises that changes in noise levels of less than 3 dB(A) are not
perceptible under normal conditions; and that a change of 10 dB(A) is perceived
as approximately a doubling of loudness.
Project No: 1011096 Page 9 of 23
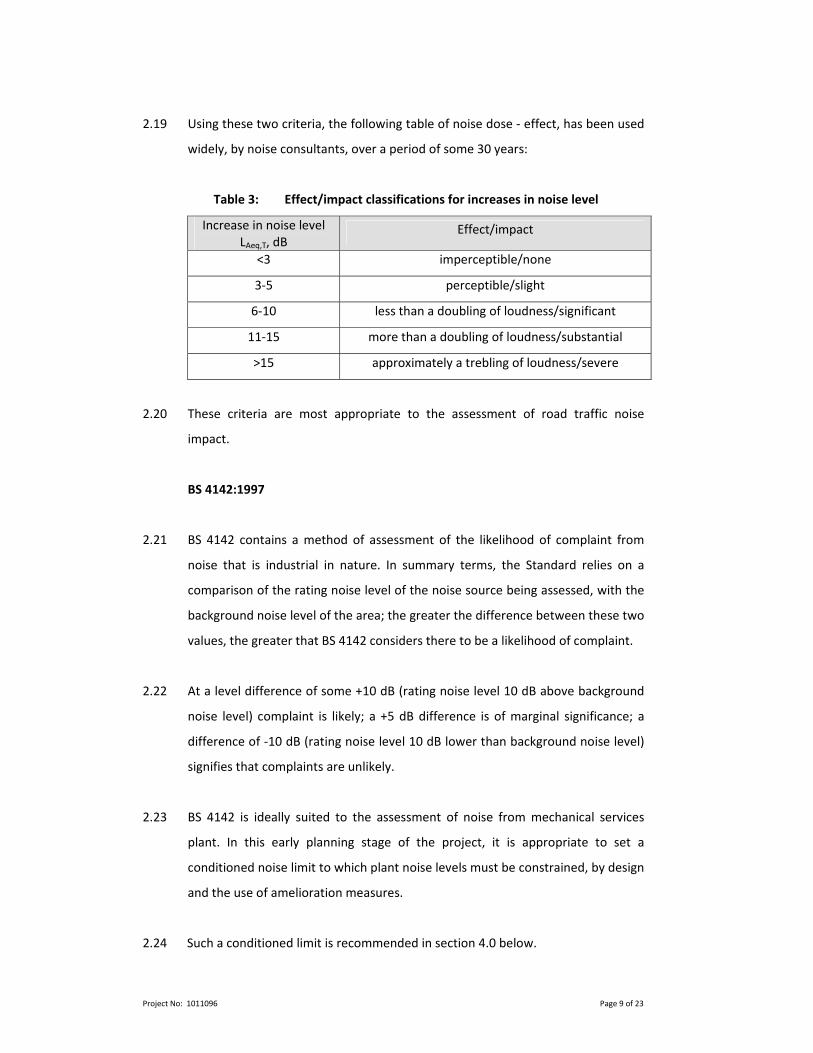
2.19 Using these two criteria, the following table of noise dose ‐ effect, has been used
widely, by noise consultants, over a period of some 30 years:
Table 3: Effect/impact classifications for increases in noise level
Increase in noise level LAeq,T, dB
Effect/impact
<3 imperceptible/none
3‐5 perceptible/slight
6‐10 less than a doubling of loudness/significant
11‐15 more than a doubling of loudness/substantial
>15 approximately a trebling of loudness/severe
2.20 These criteria are most appropriate to the assessment of road traffic noise
impact.
BS 4142:1997
2.21 BS 4142 contains a method of assessment of the likelihood of complaint from
noise that is industrial in nature. In summary terms, the Standard relies on a
comparison of the rating noise level of the noise source being assessed, with the
background noise level of the area; the greater the difference between these two
values, the greater that BS 4142 considers there to be a likelihood of complaint.
2.22 At a level difference of some +10 dB (rating noise level 10 dB above background
noise level) complaint is likely; a +5 dB difference is of marginal significance; a
difference of ‐10 dB (rating noise level 10 dB lower than background noise level)
signifies that complaints are unlikely.
2.23 BS 4142 is ideally suited to the assessment of noise from mechanical services
plant. In this early planning stage of the project, it is appropriate to set a
conditioned noise limit to which plant noise levels must be constrained, by design
and the use of amelioration measures.
2.24 Such a conditioned limit is recommended in section 4.0 below.
Project No: 1011096 Page 10 of 23
3.0 Survey Details
3.1 Surveys of noise levels were undertaken during the daytime of Thursday 14th
June 2010 (1200‐1500) and during the morning of Thursday 2nd September 2010
(0200‐0400, 0520‐0730 and 0900‐1200). Each location was used during a daytime
survey (June for Locations 1 to 3 and September at Location 4) and during the
quietest period of the night (0200 to 0400). Location 4 alone was used during the
0530‐0720 survey.
3.2 The weather during the June survey was dry, warm and cloudy (7/8 cover) with a
temperature of around 20‐22oC. There was a very gentle breeze from the South
West (less than 5ms‐1).
3.3 During the September daytime survey it was dry, cool and cloudy (often 8/8
cover) and calm with an occasional very gentle breeze from the East after 0900
hours. There was also a very light fog during the latter part of the survey. All
roads were dry at all times.
3.4 Four measurement locations were used during the surveys and represent the
closest sensitive properties to the development. Location 1 was near 17 Hawkins
Lane, 9m from the kerb. Location 2 was on the pavement between 11 and 12
Hawkins Lane, 2 metres from the kerb. Location 3 was on the pavement between
102 and 103 Horninglow Street, 2 metres from the kerb. Location 4 was near 20
Hawkins Lane, 5 metres from the kerb. Appendix A shows these locations on a
site layout plan.
3.5 All measurements were undertaken using either a Bruel and Kjaer 2236 (June
survey) or Norsonic 118 (September survey) sound level meter. The meters
allowed direct measurement of the following indices: LA10,T, LA90,T, LAeq,T and LAmax
(see Appendix B). All measurements were taken at approximately 1.5 metres
above the ground and are considered free‐field levels except Location 2 which
was a ‘façade’ location next to a brick wall.
Project No: 1011096 Page 11 of 23
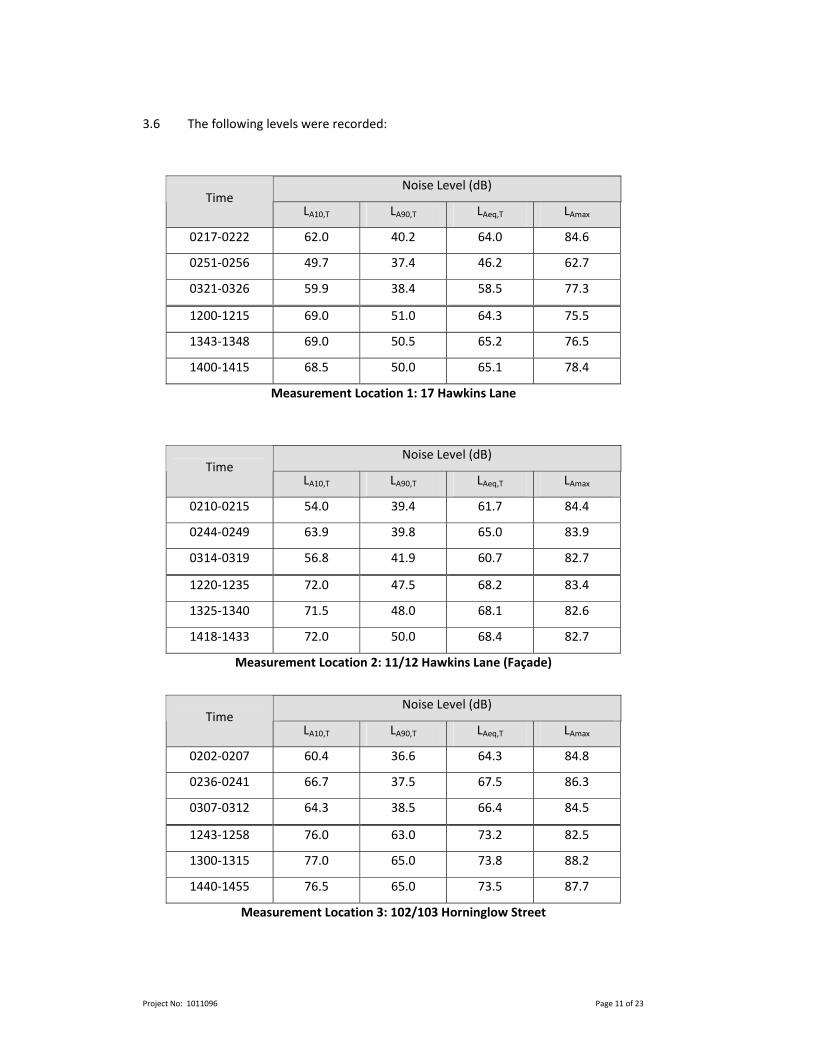
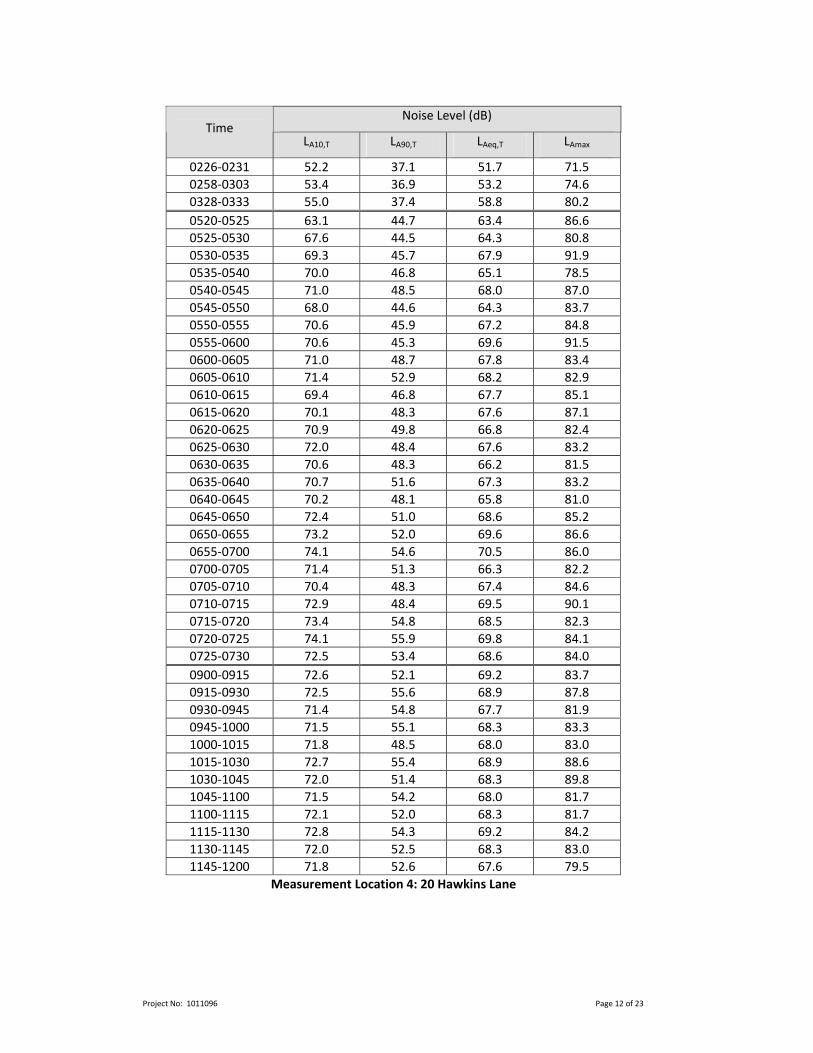
3.6 The following levels were recorded:
Measurement Location 1: 17 Hawkins Lane
Measurement Location 2: 11/12 Hawkins Lane (Façade)
Measurement Location 3: 102/103 Horninglow Street
Noise Level (dB) Time
LA10,T LA90,T LAeq,T LAmax
0217‐0222 62.0 40.2 64.0 84.6
0251‐0256 49.7 37.4 46.2 62.7
0321‐0326 59.9 38.4 58.5 77.3
1200‐1215 69.0 51.0 64.3 75.5
1343‐1348 69.0 50.5 65.2 76.5
1400‐1415 68.5 50.0 65.1 78.4
Noise Level (dB) Time
LA10,T LA90,T LAeq,T LAmax
0210‐0215 54.0 39.4 61.7 84.4
0244‐0249 63.9 39.8 65.0 83.9
0314‐0319 56.8 41.9 60.7 82.7
1220‐1235 72.0 47.5 68.2 83.4
1325‐1340 71.5 48.0 68.1 82.6
1418‐1433 72.0 50.0 68.4 82.7
Noise Level (dB) Time
LA10,T LA90,T LAeq,T LAmax
0202‐0207 60.4 36.6 64.3 84.8
0236‐0241 66.7 37.5 67.5 86.3
0307‐0312 64.3 38.5 66.4 84.5
1243‐1258 76.0 63.0 73.2 82.5
1300‐1315 77.0 65.0 73.8 88.2
1440‐1455 76.5 65.0 73.5 87.7
Project No: 1011096 Page 12 of 23
Measurement Location 4: 20 Hawkins Lane
Noise Level (dB) Time
LA10,T LA90,T LAeq,T LAmax
0226‐0231 52.2 37.1 51.7 71.5 0258‐0303 53.4 36.9 53.2 74.6 0328‐0333 55.0 37.4 58.8 80.2 0520‐0525 63.1 44.7 63.4 86.6 0525‐0530 67.6 44.5 64.3 80.8 0530‐0535 69.3 45.7 67.9 91.9 0535‐0540 70.0 46.8 65.1 78.5 0540‐0545 71.0 48.5 68.0 87.0 0545‐0550 68.0 44.6 64.3 83.7 0550‐0555 70.6 45.9 67.2 84.8 0555‐0600 70.6 45.3 69.6 91.5 0600‐0605 71.0 48.7 67.8 83.4 0605‐0610 71.4 52.9 68.2 82.9 0610‐0615 69.4 46.8 67.7 85.1 0615‐0620 70.1 48.3 67.6 87.1 0620‐0625 70.9 49.8 66.8 82.4 0625‐0630 72.0 48.4 67.6 83.2 0630‐0635 70.6 48.3 66.2 81.5 0635‐0640 70.7 51.6 67.3 83.2 0640‐0645 70.2 48.1 65.8 81.0 0645‐0650 72.4 51.0 68.6 85.2 0650‐0655 73.2 52.0 69.6 86.6 0655‐0700 74.1 54.6 70.5 86.0 0700‐0705 71.4 51.3 66.3 82.2 0705‐0710 70.4 48.3 67.4 84.6 0710‐0715 72.9 48.4 69.5 90.1 0715‐0720 73.4 54.8 68.5 82.3 0720‐0725 74.1 55.9 69.8 84.1 0725‐0730 72.5 53.4 68.6 84.0 0900‐0915 72.6 52.1 69.2 83.7 0915‐0930 72.5 55.6 68.9 87.8 0930‐0945 71.4 54.8 67.7 81.9 0945‐1000 71.5 55.1 68.3 83.3 1000‐1015 71.8 48.5 68.0 83.0 1015‐1030 72.7 55.4 68.9 88.6 1030‐1045 72.0 51.4 68.3 89.8 1045‐1100 71.5 54.2 68.0 81.7 1100‐1115 72.1 52.0 68.3 81.7 1115‐1130 72.8 54.3 69.2 84.2 1130‐1145 72.0 52.5 68.3 83.0 1145‐1200 71.8 52.6 67.6 79.5
Project No: 1011096 Page 13 of 23
3.7 Daytime noise levels at all locations were dominated by road traffic noise from
local and distant roads. This included heavy vehicles visiting the Coors brewery
facility with its entrance near to Location 2.
3.8 At night (0200‐0400), road traffic was the dominant noise source including mostly
distant traffic noise and occasional vehicles on local roads. Some birdsong was
also noticeable.
Project No: 1011096 Page 14 of 23
4.0 Assessment Details
Car Park Activity
4.1 SRP has undertaken an extensive series of measurements around the boundary
of Tesco car parks. From these measurements it has been found that sound
levels at 10 metres from the boundary of a car park vary from LAeq,1hr = 43 to 48
dB during the day period. Peak levels, from door/boot slams are “worst‐case”,
typically, LAmax= 66 dB at 10 metres.
4.2 The higher LAeq,T noise levels occur at car park locations that are relatively close to
the entrance of the store building and at peak trading periods.
4.3 Using the baseline noise levels displayed in paragraph 4.1 above, with due
allowance for distance attenuation and reflection from the building façade but no
allowance for any possible screening, the noise levels at the nearest property (17‐
19 Hawkins Road, 15 metres away) would range from LAeq,1hr = 42 to 47 dB with
an LAmax of 65 dB.
4.4 At night customers have typically been found to park within 30 metres of the
store entrance, which would lead to a night time LAmax of 58 dB.
4.5 It can be seen that noise from car park activity would be below the daytime and
night time WHO guideline values (paragraph 2.16 above) indicating that there
would be no effect from noise.
4.6 Therefore it is concluded that noise from car park activity would not be
disturbing.
Service Yard Activity
4.7 In order to calculate noise levels from service yard activity at proposed stores,
SRP has undertaken an extensive series of surveys at existing yards.
Project No: 1011096 Page 15 of 23
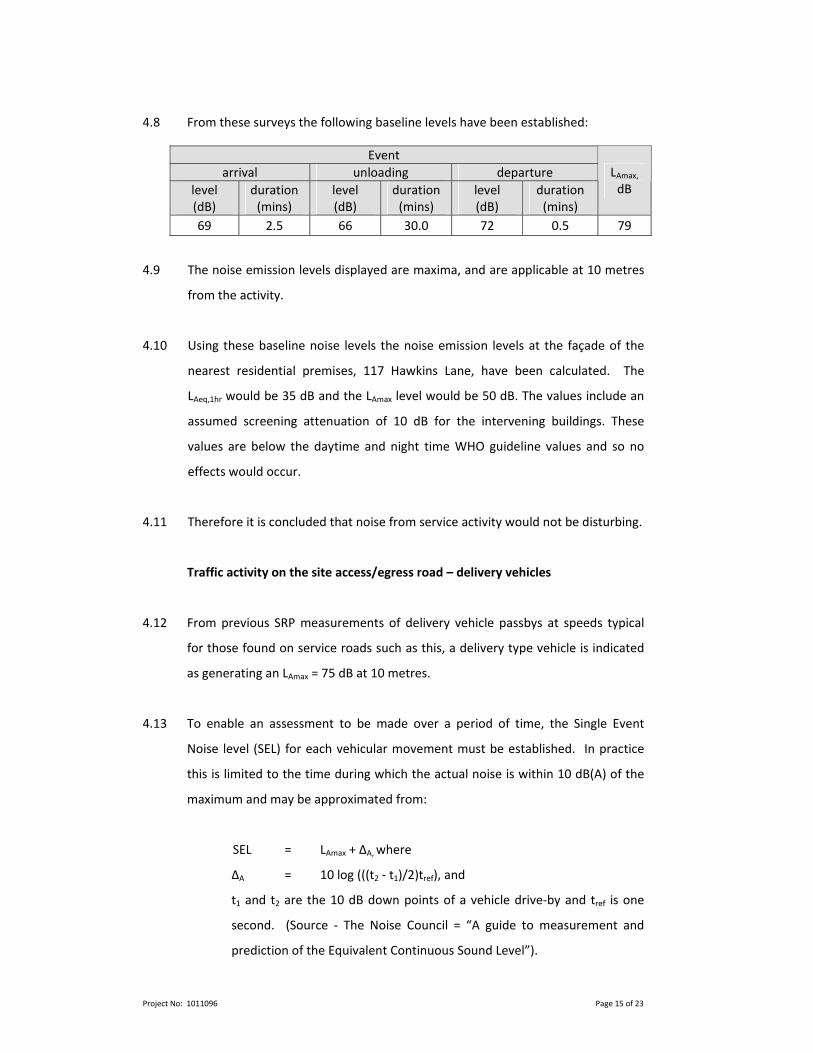
4.8 From these surveys the following baseline levels have been established:
4.9 The noise emission levels displayed are maxima, and are applicable at 10 metres
from the activity.
4.10 Using these baseline noise levels the noise emission levels at the façade of the
nearest residential premises, 117 Hawkins Lane, have been calculated. The
LAeq,1hr would be 35 dB and the LAmax level would be 50 dB. The values include an
assumed screening attenuation of 10 dB for the intervening buildings. These
values are below the daytime and night time WHO guideline values and so no
effects would occur.
4.11 Therefore it is concluded that noise from service activity would not be disturbing.
Traffic activity on the site access/egress road – delivery vehicles
4.12 From previous SRP measurements of delivery vehicle passbys at speeds typical
for those found on service roads such as this, a delivery type vehicle is indicated
as generating an LAmax = 75 dB at 10 metres.
4.13 To enable an assessment to be made over a period of time, the Single Event
Noise level (SEL) for each vehicular movement must be established. In practice
this is limited to the time during which the actual noise is within 10 dB(A) of the
maximum and may be approximated from:
SEL = LAmax + ∆A, where
∆A = 10 log (((t2 ‐ t1)/2)tref), and
t1 and t2 are the 10 dB down points of a vehicle drive‐by and tref is one
second. (Source ‐ The Noise Council = “A guide to measurement and
prediction of the Equivalent Continuous Sound Level”).
Event arrival unloading departure
level (dB)
duration (mins)
level (dB)
duration (mins)
level (dB)
duration (mins)
LAmax,
dB
69 2.5 66 30.0 72 0.5 79
Project No: 1011096 Page 16 of 23
4.14 The 10 dB down points can be calculated on the basis of vehicle speed and the
attenuation with distance that would be experienced as a vehicle approaches and
departs the reception point. For the vehicle speed of 32kph (20mph), ∆A = 5 dB
and the resulting SEL is 80 dB(A) at 10 metres.
4.15 The LAeq,T can now be calculated from the equation:
LAeq,T = SEL + 10 log n ‐ 10 log T ‐ 10 log d1/10 ‐ screening ‐ 10 log (angle of view/180)
where
n = number of events in the time period
T = number of seconds in the time period
d1 = distance from centre line of road to receiver
angle of view = angle of view of the access road
4.16 The nearest noise sensitive premise is 20 Hawkins Lane at a distance of 10 metres
from the centre of the service road. The maximum angle of view of the service
road is taken as 120 degrees and no screening attenuation has been included.
4.17 For a store such as this it is reasonable to assume a reasonable worst case
average of 2 delivery vehicle movements (1 each way) for each hour of the
daytime period. Some of these movements will be of large articulated vehicles
and the others will be smaller vehicles and therefore this prediction using data
for larger delivery vehicles is conservative. This results in a calculated (facade)
daytime noise exposure at the nearest nearby noise sensitive residential property
of LAeq,1hr = 45 dB.
4.18 It can be seen that daytime noise from vehicles on the service road are below the
WHO guideline values (paragraph 2.16 above).
Project No: 1011096 Page 17 of 23
4.19 For night time, the consideration must also be for the sleep disturbance criterion
which is based on the LAmax noise levels. On the basis of an LAmax of 75 dB (free
field) at 10 metres, the maximum unmitigated noise level at the façade of the
nearest flat under construction is calculated as LAmax = 78 dB(A), above the WHO
guideline value for night.
4.20 On the basis of the above assessment, it will be necessary to mitigate in one of
two ways. One would be to use an acoustic barrier at the side of the road to first
floor height (top of the window). This would reduce noise levels to approximately
LAmax = 68 dB(A), above the WHO guideline value for night but below the levels of
other existing noise events recorded here during the night time (note, these
would also be mitigated by this screening).
4.21 A second option would be to restrict delivery hours and it is recommended that
the majority of deliveries are made within daytime hours (0700 to 2300).
However, for operational reasons, it is desirable for delivery vehicles to arrive on
site as early as possible for daily deliveries of produce such as milk, bread and
newspapers.
4.22 These deliveries would occur during a period when the noise survey has
established that ambient noise levels would be increasing due to local activity
including vehicles on Hawkins Lane and other roads. The survey showed there
were noise levels at the measurement location of at least LAmax = 81 dB and LAeq,T
= 61 dB during each 5 minute period between 0600 and 0700.
4.23 In these circumstances it is considered that two deliveries would be acceptable
between 0600 and 0700 hours when any effects would be negligible.
Project No: 1011096 Page 18 of 23
Home Shopping Activity
4.24 SRP has obtained noise data for the home shopping activities at several
superstores. In noise terms there are two activities: firstly, there is the period
when the van’s on‐board refrigeration equipment is used to provide the initial
cooling of the refrigerated section which takes about one hour, secondly, there is
a period of up to two hours where the van is being loaded and the refrigeration
equipment operates intermittently. SRP understand that the use of the
refrigeration plant is only needed in the morning; during the remainder of the
day sufficient refrigeration takes place when the van is on its rounds.
4.25 The collected data is shown below. It will be noted that the actual loading
activity is not noisy. The noise of the refrigeration equipment is continuous for
the first hour at LAeq,1hr = 57 dB, normalised to 10 metres. After this, the loading
commences and during this activity the refrigeration equipment operates for
about 20% of the time which gives a noise level of LAeq,1hr = 50 dB at 10 metres. It
is considered that the intermittent operation of the refrigeration equipment
attracts a 5 dB(A) character “penalty” for a BS 4142 assessment.
Home shopping activity rating noise levels at 10 metres
Initial cooling phase: LAeq, 1hr = 57 dB
Loading phase: LAeq, 1hr = 55 dB
(with 5 dB penalty for intermittent cooling)
Loading activity: LAeq, 1hr = 37 dB
(no cooling)
4.26 The proposed plan shows seven home shopping delivery vehicles in the service
yard. Assuming that each loading bay is occupied the rating noise levels above
could be increased by 9 dB(A).
Project No: 1011096 Page 19 of 23
4.27 The distance between the home shopping vehicle loading bays and the closest
residential property, 117 Hawkins Lane is 150 metres. Taking into account
distance attenuation (20 log 10/150 = ‐24 dB) and with an assumed 10 dB screening
attenuation from the intervening buildings (including the proposed store)
considered, the resultant worse case (i.e. seven home shopping vehicles, on the
initial cooling phase, operating simultaneously) rating noise level from home
shopping activities at 1 metre from the façade will be LAeq,1hr = 32 dB (57+9‐24‐
10).
4.28 Background noise levels (LA90,T) in this area during the measurement survey for
the period 0600‐0700 were at least 47 dB. Using the measured values, an
assessment to BS 4142 would result in a difference of = ‐15 dB(A) which is 5dB
below the level where complaints are unlikely and thus meets the requirements
of PPS 1 that “significant environmental impacts should be avoided”.
4.29 Therefore it is concluded that noise from home shopping activity would not be
disturbing.
Petrol Filling Station
4.30 The proposed site layout plan drawing shows a six island pump forecourt. The
nearest noise sensitive properties to the petrol filling station (PFS) are 7‐12
Hawkins Lane, approximately 30 metres away to the south.
4.31 SRP has undertaken noise measurements of activity at PFS forecourts. The noise
level of these activities was found to does not exceed LAeq,1hr = 55 dB at 10 metres
(daytime) and LAeq,5min = 47 dB at 10 metres (night time). Assuming these noise
levels throughout the day or night is considered very much ‘worst case’ leading
to a robust assessment. The typical “peak” noise level is LAmax = 66 dB at 10
metres for a car door slam. All of these noise levels were measured in free field
conditions.
Project No: 1011096 Page 20 of 23
4.32 The distance attenuation to properties in Hawkins Lane is 10 dB (using 20 log 10/30) and therefore calculated PFS forecourt activity noise levels at 1 metre from
the façade of the property will therefore be:
Daytime LAeq 1 hour = 48 dB (55‐10+3)
Night time LAeq 5 mins = 40 dB (47‐10+3)
Peak noise LAmax = 59 dB (66‐10+3)
4.33 These levels are all below the guidance noise values for noise during both the
daytime and night time periods and therefore there will be no adverse noise
effects.
Traffic Activity on the Public Highway
4.34 The impact of traffic noise at properties adjacent to the public highway is best
determined by considering the change in noise level that would result from the
proposal. Such a change in noise level is largely proportional to the percentage
change in traffic flow that would result from the proposal (10 logarithm future
flow/existing flow).
4.35 SRP has been provided with traffic flow data by Transport Planning Associates,
the project transport and traffic consultants. The data supplied comprises
existing traffic flows on surrounding rounds and predicted traffic flows from the
development.
4.36 Baseline (2010, without scheme) and predicted future (2015, with scheme) traffic
flow data (Annual Average Daily Traffic, AADT, in terms of PCU – Passenger Car
units) have been used to determine the percentage flow change that would
result from the scheme and hence the resultant change in noise level. The
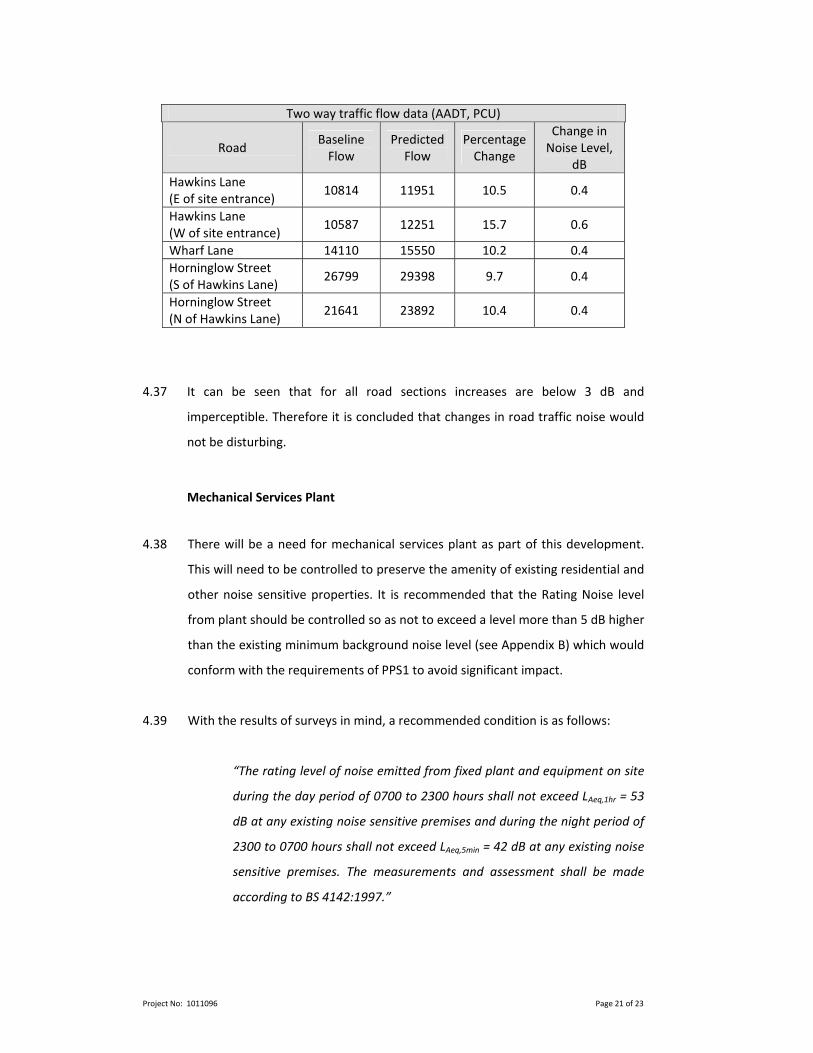
changes in flows and noise levels are summarised in the table below.
Project No: 1011096 Page 21 of 23
Two way traffic flow data (AADT, PCU)
Road Baseline Flow
Predicted Flow
Percentage Change
Change in Noise Level,
dB Hawkins Lane (E of site entrance)
10814 11951 10.5 0.4
Hawkins Lane (W of site entrance)
10587 12251 15.7 0.6
Wharf Lane 14110 15550 10.2 0.4 Horninglow Street (S of Hawkins Lane)
26799 29398 9.7 0.4
Horninglow Street (N of Hawkins Lane)
21641 23892 10.4 0.4
4.37 It can be seen that for all road sections increases are below 3 dB and
imperceptible. Therefore it is concluded that changes in road traffic noise would
not be disturbing.
Mechanical Services Plant
4.38 There will be a need for mechanical services plant as part of this development.
This will need to be controlled to preserve the amenity of existing residential and
other noise sensitive properties. It is recommended that the Rating Noise level
from plant should be controlled so as not to exceed a level more than 5 dB higher
than the existing minimum background noise level (see Appendix B) which would
conform with the requirements of PPS1 to avoid significant impact.
4.39 With the results of surveys in mind, a recommended condition is as follows:
“The rating level of noise emitted from fixed plant and equipment on site
during the day period of 0700 to 2300 hours shall not exceed LAeq,1hr = 53
dB at any existing noise sensitive premises and during the night period of
2300 to 0700 hours shall not exceed LAeq,5min = 42 dB at any existing noise
sensitive premises. The measurements and assessment shall be made
according to BS 4142:1997.”
Project No: 1011096 Page 22 of 23
4.40 This condition is based on model condition 17 of PPG 24, Annex 4 and is
considered achievable using mitigation as necessary.
Project No: 1011096 Page 23 of 23
5.0 Assessment Conclusions
5.1 The report includes a noise assessment of a proposed Tesco store at Hawkins
Lane, Burton Upon Trent.
5.2 The report assesses proposed noise sources in relation to existing residential
properties. Noise sources considered include car parking activity, service activity,
service vehicle activity on the site access / egress road, home delivery activity,
the petrol filling station, traffic activity on the public highway and mechanical
services plant.
5.3 During the night time period, maximum noise levels from service vehicles on the
site access / egress road will be above WHO guideline levels. With the relatively
existing noise levels measured here it is considered that this can be mitigated by
either an acoustic barrier or restricting deliveries to 0700‐2300 with limited
deliveries from 0600‐0700 for operational purposes.
5.4 A planning condition is recommended to control noise from mechanical services
plant so as the rating level according to BS 4142 does not exceed the measured
minimum background noise level plus 5 dB.
5.5 Noise from all other activities will be within WHO and other guidelines at all
residential properties for both the daytime and night time periods and therefore
there will be no noise effects from this development.
APPENDIX A
SITE LAYOUT PLAN SHOWING NOISE MEASUREMENT LOCATIONS
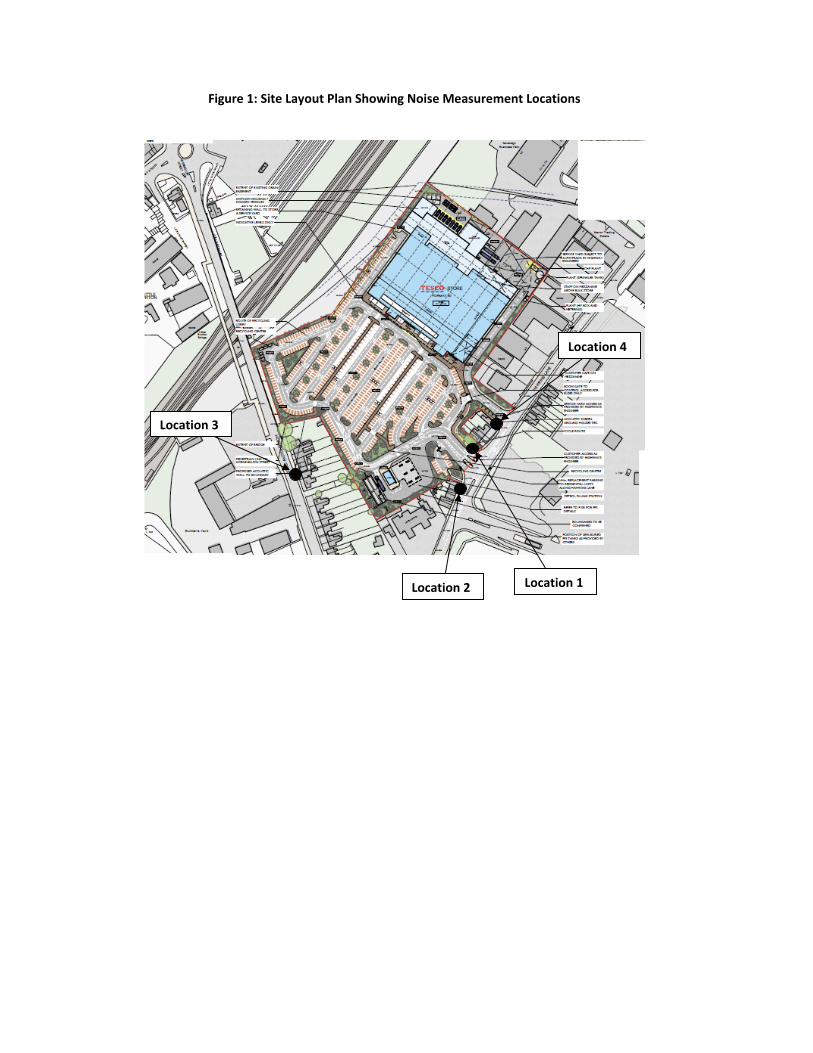
Figure 1: Site Layout Plan Showing Noise Measurement Locations
Location 2 Location 1
Location 3
Location 4
APPENDIX B
ACOUSTIC TERMINOLOGY
Acoustic Terminology
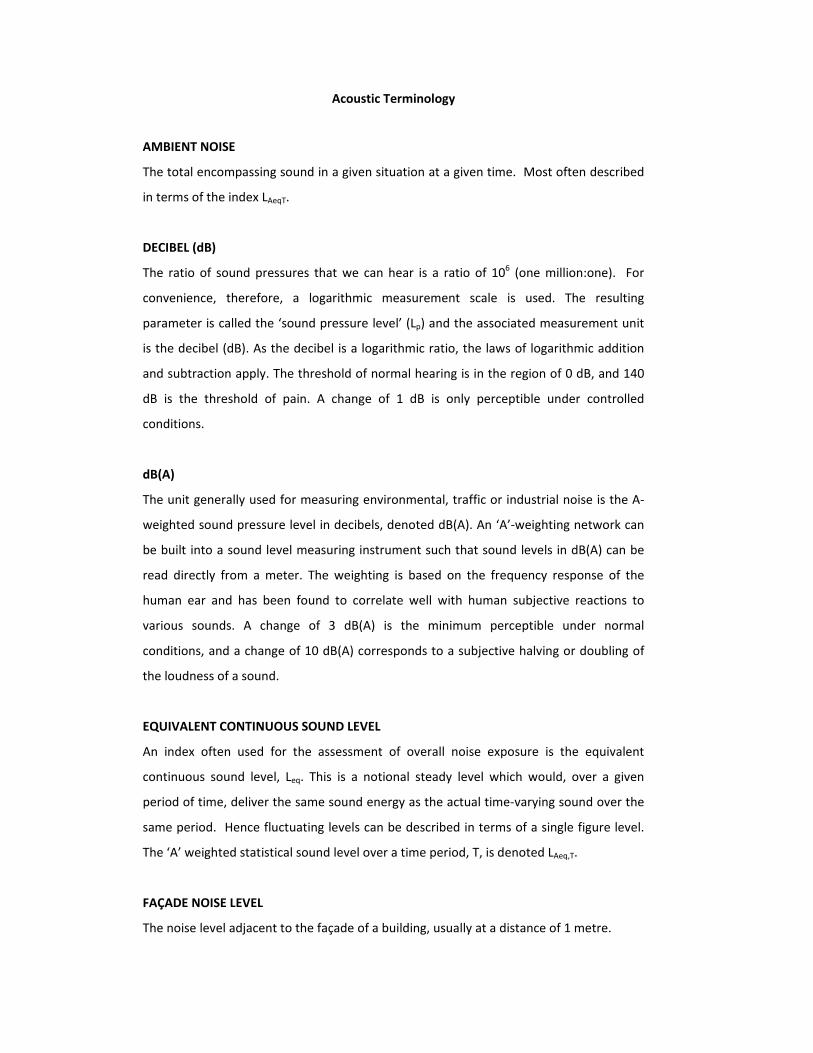
AMBIENT NOISE
The total encompassing sound in a given situation at a given time. Most often described
in terms of the index LAeqT.
DECIBEL (dB)
The ratio of sound pressures that we can hear is a ratio of 106 (one million:one). For
convenience, therefore, a logarithmic measurement scale is used. The resulting
parameter is called the ‘sound pressure level’ (Lp) and the associated measurement unit
is the decibel (dB). As the decibel is a logarithmic ratio, the laws of logarithmic addition
and subtraction apply. The threshold of normal hearing is in the region of 0 dB, and 140
dB is the threshold of pain. A change of 1 dB is only perceptible under controlled
conditions.
dB(A)
The unit generally used for measuring environmental, traffic or industrial noise is the A‐
weighted sound pressure level in decibels, denoted dB(A). An ‘A’‐weighting network can
be built into a sound level measuring instrument such that sound levels in dB(A) can be
read directly from a meter. The weighting is based on the frequency response of the
human ear and has been found to correlate well with human subjective reactions to
various sounds. A change of 3 dB(A) is the minimum perceptible under normal
conditions, and a change of 10 dB(A) corresponds to a subjective halving or doubling of
the loudness of a sound.
EQUIVALENT CONTINUOUS SOUND LEVEL
An index often used for the assessment of overall noise exposure is the equivalent
continuous sound level, Leq. This is a notional steady level which would, over a given
period of time, deliver the same sound energy as the actual time‐varying sound over the
same period. Hence fluctuating levels can be described in terms of a single figure level.
The ‘A’ weighted statistical sound level over a time period, T, is denoted LAeq,T.
FAÇADE NOISE LEVEL
The noise level adjacent to the façade of a building, usually at a distance of 1 metre.
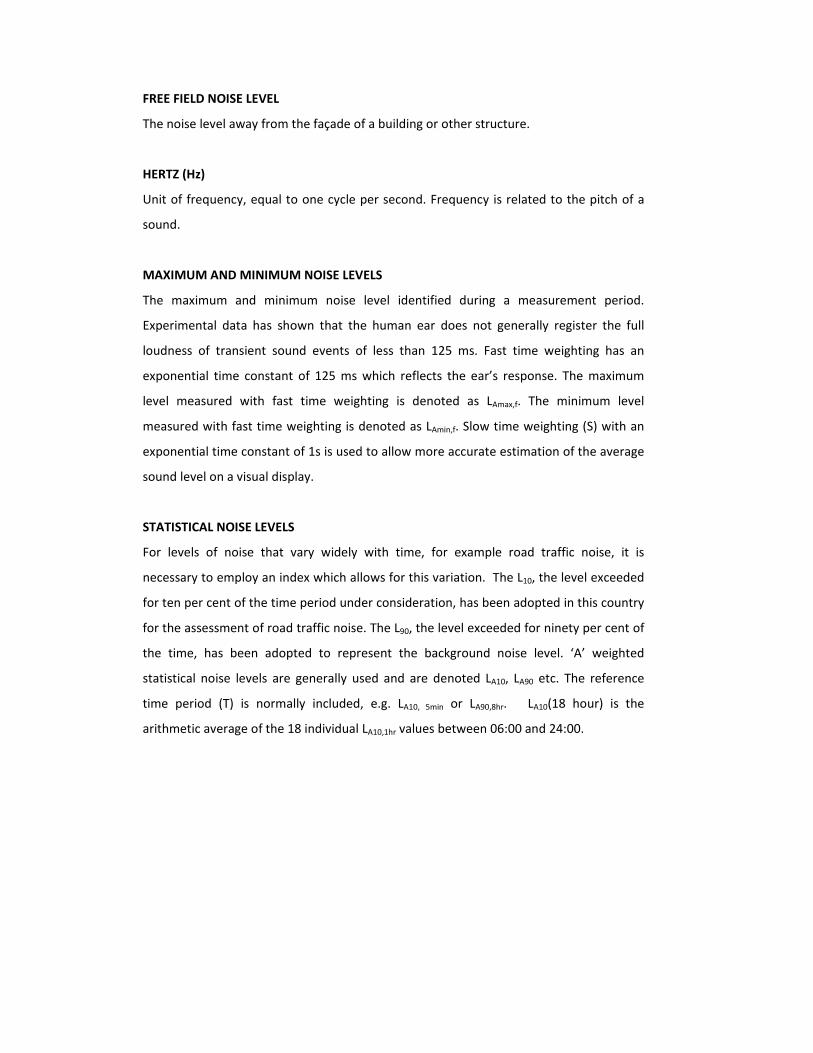
FREE FIELD NOISE LEVEL
The noise level away from the façade of a building or other structure.
HERTZ (Hz)
Unit of frequency, equal to one cycle per second. Frequency is related to the pitch of a
sound.
MAXIMUM AND MINIMUM NOISE LEVELS
The maximum and minimum noise level identified during a measurement period.
Experimental data has shown that the human ear does not generally register the full
loudness of transient sound events of less than 125 ms. Fast time weighting has an
exponential time constant of 125 ms which reflects the ear’s response. The maximum
level measured with fast time weighting is denoted as LAmax,f. The minimum level
measured with fast time weighting is denoted as LAmin,f. Slow time weighting (S) with an
exponential time constant of 1s is used to allow more accurate estimation of the average
sound level on a visual display.
STATISTICAL NOISE LEVELS
For levels of noise that vary widely with time, for example road traffic noise, it is
necessary to employ an index which allows for this variation. The L10, the level exceeded
for ten per cent of the time period under consideration, has been adopted in this country
for the assessment of road traffic noise. The L90, the level exceeded for ninety per cent of
the time, has been adopted to represent the background noise level. ‘A’ weighted
statistical noise levels are generally used and are denoted LA10, LA90 etc. The reference
time period (T) is normally included, e.g. LA10, 5min or LA90,8hr. LA10(18 hour) is the
arithmetic average of the 18 individual LA10,1hr values between 06:00 and 24:00.
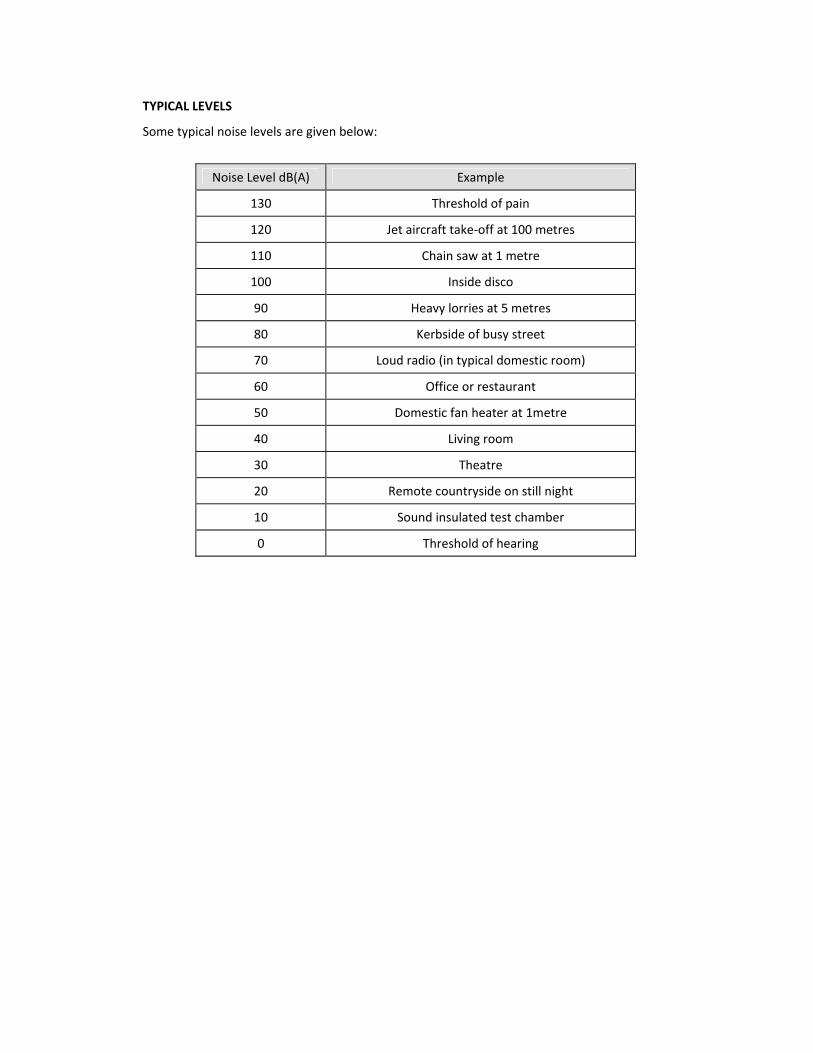
TYPICAL LEVELS
Some typical noise levels are given below:
Noise Level dB(A) Example
130 Threshold of pain
120 Jet aircraft take‐off at 100 metres
110 Chain saw at 1 metre
100 Inside disco
90 Heavy lorries at 5 metres
80 Kerbside of busy street
70 Loud radio (in typical domestic room)
60 Office or restaurant
50 Domestic fan heater at 1metre
40 Living room
30 Theatre
20 Remote countryside on still night
10 Sound insulated test chamber
0 Threshold of hearing
APPENDIX C
WORLD HEALTH ORGANISATION GUIDELINES
GUIDELINESFOR
COMMUNITY NOISE
Edited by
Birgitta BerglundThomas Lindvall
Dietrich H Schwela
This WHO document on the Guidelines for Community Noise is the outcome of the WHO- expert taskforce meeting held in London, United Kingdom, in April 1999. It bases on the document entitled“Community Noise” that was prepared for the World Health Organization and published in 1995 by theStockholm University and Karolinska Institute.
World Health Organization, GenevaCluster of Sustainable Development and Healthy Environment (SDE)
Department of the Protection of the Human Environment (PHE)Occupational and Environmental Health (OEH)
i
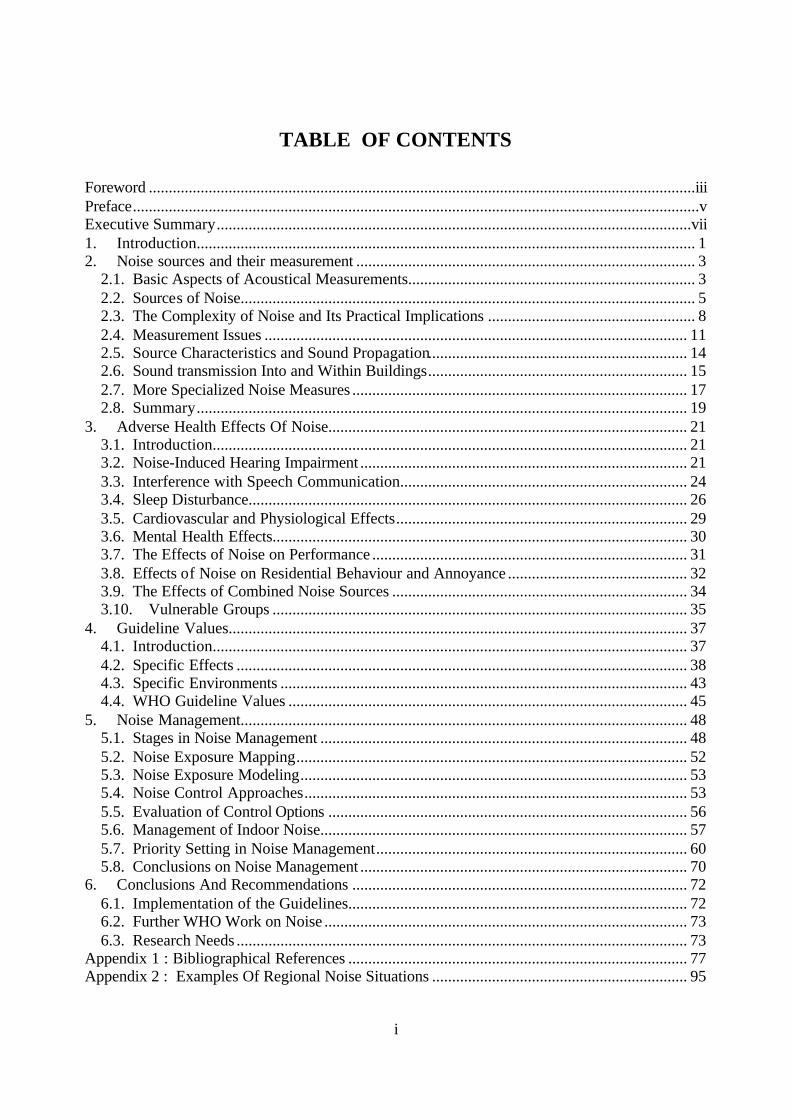
TABLE OF CONTENTS
Foreword .........................................................................................................................................iiiPreface..............................................................................................................................................vExecutive Summary.......................................................................................................................vii1. Introduction............................................................................................................................. 12. Noise sources and their measurement ..................................................................................... 3
2.1. Basic Aspects of Acoustical Measurements........................................................................ 32.2. Sources of Noise.................................................................................................................. 52.3. The Complexity of Noise and Its Practical Implications .................................................... 82.4. Measurement Issues .......................................................................................................... 112.5. Source Characteristics and Sound Propagation................................................................. 142.6. Sound transmission Into and Within Buildings................................................................. 152.7. More Specialized Noise Measures .................................................................................... 172.8. Summary........................................................................................................................... 19
3. Adverse Health Effects Of Noise.......................................................................................... 213.1. Introduction....................................................................................................................... 213.2. Noise-Induced Hearing Impairment .................................................................................. 213.3. Interference with Speech Communication........................................................................ 243.4. Sleep Disturbance.............................................................................................................. 263.5. Cardiovascular and Physiological Effects......................................................................... 293.6. Mental Health Effects........................................................................................................ 303.7. The Effects of Noise on Performance ............................................................................... 313.8. Effects of Noise on Residential Behaviour and Annoyance ............................................. 323.9. The Effects of Combined Noise Sources .......................................................................... 343.10. Vulnerable Groups ........................................................................................................ 35
4. Guideline Values................................................................................................................... 374.1. Introduction....................................................................................................................... 374.2. Specific Effects ................................................................................................................. 384.3. Specific Environments ...................................................................................................... 434.4. WHO Guideline Values .................................................................................................... 45
5. Noise Management................................................................................................................ 485.1. Stages in Noise Management ............................................................................................ 485.2. Noise Exposure Mapping.................................................................................................. 525.3. Noise Exposure Modeling................................................................................................. 535.4. Noise Control Approaches................................................................................................ 535.5. Evaluation of Control Options .......................................................................................... 565.6. Management of Indoor Noise............................................................................................ 575.7. Priority Setting in Noise Management.............................................................................. 605.8. Conclusions on Noise Management .................................................................................. 70
6. Conclusions And Recommendations .................................................................................... 726.1. Implementation of the Guidelines..................................................................................... 726.2. Further WHO Work on Noise ........................................................................................... 736.3. Research Needs ................................................................................................................. 73
Appendix 1 : Bibliographical References ..................................................................................... 77Appendix 2 : Examples Of Regional Noise Situations ................................................................ 95
ii
Appendix 3 : Glossary..................................................................................................................124Appendix 4 : Acronyms ...............................................................................................................133Appendix 5 : Equations and other technical information............................................................136Appendix 6 : Participant list of THE WHO Expert Task Force meeting on Guidelines ForCommunity Noise, 26-30 April 1999, MARC, London, UK ......................................................140
iii
ForewordNoise has always been an important environmental problem for man. In ancient Rome, rules existed as tothe noise emitted from the ironed wheels of wagons which battered the stones on the pavement, causingdisruption of sleep and annoyance to the Romans. In Medieval Europe, horse carriages and horse backriding were not allowed during night time in certain cities to ensure a peaceful sleep for the inhabitants.However, the noise problems of the past are incomparable with those of modern society. An immensenumber of cars regularly cross our cities and the countryside. There are heavily laden lorries with dieselengines, badly silenced both for engine and exhaust noise, in cities and on highways day and night.Aircraft and trains add to the environmental noise scenario. In industry, machinery emits high noise levelsand amusement centres and pleasure vehicles distract leisure time relaxation.
In comparison to other pollutants, the control of environmental noise has been hampered by insufficientknowledge of its effects on humans and of dose-response relationships as well as a lack of definedcriteria. While it has been suggested that noise pollution is primarily a “luxury” problem for developedcountries, one cannot ignore that the exposure is often higher in developing countries, due to bad planningand poor construction of buildings. The effects of the noise are just as widespread and the long termconsequences for health are the same. In this perspective, practical action to limit and control theexposure to environmental noise are essential. Such action must be based upon proper scientificevaluation of available data on effects, and particularly dose-response relationships. The basis for this istheprocess of risk assessment and risk management.
The extent of the noise problem is large. In the European Union countries about 40 % of the populationare exposed to road traffic noise with an equivalent sound pressure level exceeding 55 dB(A) daytime and20 % are exposed to levels exceeding 65 dB(A). Taking all exposure to transportation noise togetherabout half of the European Union citizens are estimated to live in zones which do not ensure acousticalcomfort to residents. More than 30 % are exposed at night to equivalent sound pressure levels exceeding55 dB(A) which are disturbing to sleep. The noise pollution problem is also severe in cities of developingcountries and caused mainly by traffic. Data collected alongside densely travelled roads were found tohave equivalent sound pressure levels for 24 hours of 75 to 80 dB(A).
The scope of WHO’s effort to derive guidelines for community noise is to consolidate actualscientific knowledge on the health impacts of community noise and to provide guidance toenvironmental health authorities and professional trying to protect people from the harmfuleffects of noise in non-industrial environments. Guidance on the health effects of noise exposureof the population has already been given in an early publication of the series of EnvironmentalHealth Criteria. The health risk to humans from exposure to environmental noise was evaluatedand guidelines values derived. The issue of noise control and health protection was brieflyaddressed.At a WHO/EURO Task Force Meeting in Düsseldorf, Germany, in 1992, the health criteria andguideline values were revised and it was agreed upon updated guidelines in consensus. Theessentials of the deliberations of the Task Force were published by Stockholm University andKarolinska Institute in 1995. In a recent Expert Task Force Meeting convened in April 1999 inLondon, United Kingdom, the Guidelines for Community Noise were extended to provide globalcoverage and applicability, and the issues of noise assessment and control were addressed inmore detail. This document is the outcome of the consensus deliberations of the WHO ExpertTask Force.

iv
Dr Richard HelmerDirector, Department of Protection of the Human EnvironmentCluster Sustainable Development and Healthy Environments
v
Preface
Community noise (also called environmental noise, residential noise or domestic noise) is defined asnoise emitted from all sources except noise at the industrial workplace. Main sources of community noiseinclude road, rail and air traffic, industries, construction and public work, and the neighbourhood. Themain indoor sources of noise are ventilation systems, office machines, home appliances and neighbours. Typical neighbourhood noise comes from premises and installations related to the catering trade(restaurant, cafeterias, discotheques, etc.); from live or recorded music; sport events including motorsports; playgrounds; car parks; and domestic animals such as barking dogs. Many countries haveregulated community noise from road and rail traffic, construction machines and industrial plants byapplying emission standards, and by regulating the acoustical properties of buildings. In contrast, fewcountries have regulations on community noise from the neighbourhood, probably due to the lack ofmethods to define and measure it, and to the difficulty of controlling it. In large cities throughout theworld, the general population is increasingly exposed to community due to the sources mentioned aboveand the health effects of these exposures are considered to be a more and more important public healthproblem. Specific effects to be considered when setting community noise guidelines include: interferencewith communication; noise-induced hearing loss; sleep disturbance effects; cardiovascular and psycho-physiological effects; performance reduction effects; annoyance responses; and effects on socialbehaviour.
Since 1980, the World Health Organization (WHO) has addressed the problem of communitynoise. Health-based guidelines on community noise can serve as the basis for deriving noisestandards within a framework of noise management. Key issues of noise management includeabatement options; models for forecasting and for assessing source control action; setting noiseemission standards for existing and planned sources; noise exposure assessment; and testing thecompliance of noise exposure with noise immission standards. In 1992, the WHO RegionalOffice for Europe convened a task force meeting which set up guidelines for community noise. A preliminary publication of the Karolinska Institute, Stockholm, on behalf of WHO, appearedin 1995. This publication served as the basis for the globally applicable Guidelines forCommunity Noise presented in this document. An expert task force meeting was convened byWHO in March 1999 in London, United Kingdom, to finalize the guidelines.The Guidelines for Community Noise have been prepared as a practical response to the need for action oncommunity noise at the local level, as well as the need for improved legislation, management andguidance at the national and regional levels. WHO will be pleased to see that these guidelines are usedwidely. Continuing efforts will be made to improve its content and structure. It would be appreciated ifthe users of the Guidelines provide feedback from its use and their own experiences. Please send yourcomments and suggestions on the WHO Guidelines for Community Noise – Guideline document to theDepartment of the Protection of the Human Environment, Occupational and Environmental Health, WorldHealth Organization, Geneva, Switzerland (Fax: +41 22-791 4123, e-mail: [email protected]).
vi
Acknowledgements
The World Health Organization thanks all who have contributed to the preparation of this document,Guidelines for Community Noise. The international, multidisciplinary group of contributors to, andreviewers of, the Guidelines are listed in the “Participant list” in Annex 6. Special thanks are due to thechairpersons and workgroups of the WHO expert task force meeting held in London, United Kingdom, inMarch 1999: Professor Thomas Lindvall, who acted as the chairperson of the meeting, Professor BirgittaBerglund, Dr John Bradley and Professor Gerd Jansen, who chaired the three workgroups. Specialcontributions from those who provided the background papers and who contributed to the success of theWHO expert meeting are gratefully acknowledged:
Professor Birgitta Berglund, Stockholm University, Stockholm, Sweden;Bernard F. Berry, National Physical Laboratory, Teddington, Middlesex, United Kingdom; Dr. HansBögli, Bundesamt für Umwelt, Wald und Landschaft, Bern, Switzerland;Dr. John S. Bradley, National Research Council Canada, Ottawa, Canada;Dr. Ming Chen, Fujian Provincial Hospital, People=s Republic of China;Lawrence S. Finegold, Air Force Research Laboratory, AFRL/HECA, Wright-Patterson AFB, OH, USA;Mr Dominique Francois, WHO Regional Office for Europe, Copenhague, Denmark;Professor Guillermo L. Fuchs, Córdoba, Argentina;Mr Etienne Grond, Messina, South Africa;Professor Andrew Hede, University of the Sunshine Coast, Maroochydore South, Qld., Australia;Professor Gerd Jansen, Heinrich-Heine-Universität Düsseldorf, Germany;Dr. Michinori Kabuto, National Institute for Environmental Studies, Tsukuba, Ibaraki, Japan;Professor Thomas Lindvall, National Institute of Environmental Medicine and Karolinska Institute,Stockholm, Sweden;Dr. Amanda Niskar, CDC/NCEH, Atlanta, Georgia, USA;Dr Sudhakar B. Ogale, Medical College and KEM Hospital, Parel, Mumbai, India;Mrs. Willy Passchier-Vermeer, TNO Prevention and Health, Leiden, The Netherlands;Dr. Dieter Schwela, World Health Organization, Geneva 27, Switzerland;Dr. Michinki So, Nihon University, Tokyo, Japan;Professor Shirley Thompson, University of SouthCarolina, Columbia, USA;Max Thorne, National Environmental Noise Service, Rotorua, New Zealand;Frits van den Berg, Science Shop for Physics, University of Groningen, Groningen, The Netherlands;Professor Peter Williams, Director MARC, King=s College London, UK;Professor Shabih Haider Zaidi, Dow Medical College, Karachi , Pakistan;
Particular thanks are due to the Ministry of Environment of Germany, which provided the funding toconvene the WHO expert task force meeting in London, United Kingdom, in March 1999 to produce theGuidelines for Community Noise.
vii
Executive Summary
1. Introduction
Community noise (also called environmental noise, residential noise or domestic noise) is defined asnoise emitted from all sources except noise at the industrial workplace. Main sources of community noiseinclude road, rail and air traffic; industries; construction and public work; and the neighbourhood. Themain indoor noise sources are ventilation systems, office machines, home appliances and neighbours.
In the European Union about 40% of the population is exposed to road traffic noise with an equivalentsound pressure level exceeding 55 dB(A) daytime, and 20% are exposed to levels exceeding 65 dB(A). When all transportation noise is considered, more than half of all European Union citizens is estimated tolive in zones that do not ensure acoustical comfort to residents. At night, more than 30% are exposed toequivalent sound pressure levels exceeding 55 dB(A), which are disturbing to sleep. Noise pollution isalso severe in cities of developing countries. It is caused mainly by traffic and alongside densely-travelled roads equivalent sound pressure levels for 24 hours can reach 75–80 dB(A).
In contrast to many other environmental problems, noise pollution continues to grow and it isaccompanied by an increasing number of complaints from people exposed to the noise. The growth innoise pollution is unsustainable because it involves direct, as well as cumulative, adverse health effects. It also adversely affects future generations, and has socio-cultural, esthetic and economic effects.
2. Noise sources and measurement
Physically, there is no distinction between sound and noise. Sound is a sensory perception and thecomplex pattern of sound waves is labeled noise, music, speech etc. Noise is thus defined as unwantedsound.
Most environmental noises can be approximately described by several simple measures. All measuresconsider the frequency content of the sounds, the overall sound pressure levels and the variation of theselevels with time. Sound pressure is a basic measure of the vibrations of air that make up sound. Becausethe range of sound pressures that human listeners can detect is very wide, these levels are measured on alogarithmic scale with units of decibels. Consequently, sound pressure levels cannot be added oraveraged arithmetically. Also, the sound levels of most noises vary with time, and when sound pressurelevels are calculated, the instantaneous pressure fluctuations must be integrated over some time interval.
Most environmental sounds are made up of a complex mix of many different frequencies. Frequencyrefers to the number of vibrations per second of the air in which the sound is propagating and it ismeasured in Hertz (Hz). The audible frequency range is normally considered to be 20–20 000 Hz foryounger listeners with unimpaired hearing. However, our hearing systems are not equally sensitive to allsound frequencies, and to compensate for this various types of filters or frequency weighting have beenused to determine the relative strengths of frequency components making up a particular environmentalnoise. The A-weighting is most commonly used and weights lower frequencies as less important thanmid- and higher-frequencies. It is intended to approximate the frequency response of our hearing system.
The effect of a combination of noise events is related to the combined sound energy of those events (theequal energy principle). The sum of the total energy over some time period gives a level equivalent to theaverage sound energy over that period. Thus, LAeq,T is the energy average equivalent level of the A-weighted sound over a period T. LAeq,T should be used to measure continuing sounds, such as roadtraffic noise or types of more-or-less continuous industrial noises. However, when there are distinctevents to the noise, as with aircraft or railway noise, measures of individual events such as the maximum
viii
noise level (LAmax), or the weighted sound exposure level (SEL), should also be obtained in addition toLAeq,T. Time-varying environmental sound levels have also been described in terms of percentile levels.
Currently, the recommended practice is to assume that the equal energy principle is approximately validfor most types of noise and that a simple LAeq,T measure will indicate the expected effects of the noisereasonably well. When the noise consists of a small number of discrete events, the A-weighted maximumlevel (LAmax) is a better indicator of the disturbance to sleep and other activities. In most cases,however, the A-weighted sound exposure level (SEL) provides a more consistent measure of single-noiseevents because it is based on integration over the complete noise event. In combining day and nightLAeq,T values, night-time weightings are often added. Night-time weightings are intended to reflect theexpected increased sensitivity to annoyance at night, but they do not protect people from sleepdisturbance.
Where there are no clear reasons for using other measures, it is recommended that LAeq,T be used toevaluate more-or-less continuous environmental noises. Where the noise is principally composed of asmall number of discrete events, the additional use of LAmax or SEL is recommended. There are definitelimitations to these simple measures, but there are also many practical advantages, including economyand the benefits of a standardized approach.
3. Adverse health effects of noise
The health significance of noise pollution is given in chapter 3 of the Guidelines under separate headingsaccording to the specific effects: noise-induced hearing impairment; interference with speechcommunication; disturbance of rest and sleep; psychophysiological, mental-health and performanceeffects; effects on residential behaviour and annoyance; and interference with intended activities. Thischapter also considers vulnerable groups and the combined effects of mixed noise sources.
Hearing impairment is typically defined as an increase in the threshold of hearing. Hearing deficits maybe accompanied by tinnitus (ringing in the ears). Noise-induced hearing impairment occurspredominantly in the higher frequency range of 3 000–6 000 Hz, with the largest effect at 4 000 Hz. Butwith increasing LAeq,8h and increasing exposure time, noise-induced hearing impairment occurs even atfrequencies as low as 2 000 Hz. However, hearing impairment is not expected to occur at LAeq,8h levelsof 75 dB(A) or below, even for prolonged occupational noise exposure.
Worldwide, noise-induced hearing impairment is the most prevalent irreversible occupational hazard andit is estimated that 120 million people worldwide have disabling hearing difficulties. In developingcountries, not only occupational noise but also environmental noise is an increasing risk factor for hearingimpairment. Hearing damage can also be caused by certain diseases, some industrial chemicals, ototoxicdrugs, blows to the head, accidents and hereditary origins. Hearing deterioration is also associated withthe ageing process itself (presbyacusis).
The extent of hearing impairment in populations exposed to occupational noise depends on the value ofLAeq,8h, the number of noise-exposed years, and on individual susceptibility. Men and women areequally at risk for noise-induced hearing impairment. It is expected that environmental and leisure-timenoise with a LAeq,24h of 70 dB(A) or below will not cause hearing impairment in the large majority ofpeople, even after a lifetime exposure. For adults exposed to impulse noise at the workplace, the noiselimit is set at peak sound pressure levels of 140 dB, and the same limit is assumed to be appropriate forenvironmental and leisure-time noise. In the case of children, however, taking into account their habitswhile playing with noisy toys, the peak sound pressure should never exceed 120 dB. For shooting noisewith LAeq,24h levels greater than 80 dB(A), there may be an increased risk for noise-induced hearingimpairment.
ix
The main social consequence of hearing impairment is the inability to understand speech in daily livingconditions, and this is considered to be a severe social handicap. Even small values of hearingimpairment (10 dB averaged over 2 000 and 4 000 Hz and over both ears) may adversely affect speechcomprehension.
Speech intelligibility is adversely affected by noise. Most of the acoustical energy of speech is in thefrequency range of 100–6 000 Hz, with the most important cue-bearing energy being between 300–3 000Hz. Speech interference is basically a masking process, in which simultaneous interfering noise rendersspeech incapable of being understood. Environmental noise may also mask other acoustical signals thatare important for daily life, such as door bells, telephone signals, alarm clocks, fire alarms and otherwarning signals, and music.
Speech intelligibility in everyday living conditions is influenced by speech level; speech pronunciation;talker-to-listener distance; sound level and other characteristics of the interfering noise; hearing acuity;and by the level of attention. Indoors, speech communication is also affected by the reverberationcharacteristics of the room. Reverberation times over 1 s produce loss in speech discrimination and makespeech perception more difficult and straining. For full sentence intelligibility in listeners with normalhearing, the signal-to-noise ratio (i.e. the difference between the speech level and the sound level of theinterfering noise) should be at least 15 dB(A). Since the sound pressure level of normal speech is about50 dB(A), noise with sound levels of 35 dB(A) or more interferes with the intelligibility of speech insmaller rooms. For vulnerable groups even lower background levels are needed, and a reverberation timebelow 0.6 s is desirable for adequate speech intelligibility, even in a quiet environment.
The inability to understand speech results in a large number of personal handicaps and behaviouralchanges. Particularly vulnerable are the hearing impaired, the elderly, children in the process of languageand reading acquisition, and individuals who are not familiar with the spoken language.
Sleep disturbance is a major effect of environmental noise. It may cause primary effects during sleep,and secondary effects that can be assessed the day after night-time noise exposure. Uninterrupted sleep isa prerequisite for good physiological and mental functioning, and the primary effects of sleep disturbanceare: difficulty in falling asleep; awakenings and alterations of sleep stages or depth; increased bloodpressure, heart rate and finger pulse amplitude; vasoconstriction; changes in respiration; cardiacarrhythmia; and increased body movements. The difference between the sound levels of a noise event andbackground sound levels, rather than the absolute noise level, may determine the reaction probability. Theprobability of being awakened increases with the number of noise events per night. The secondary, orafter-effects, the following morning or day(s) are: reduced perceived sleep quality; increased fatigue;depressed mood or well-being; and decreased performance.
For a good night’s sleep, the equivalent sound level should not exceed 30 dB(A) for continuousbackground noise, and individual noise events exceeding 45 dB(A) should be avoided. In setting limitsfor single night-time noise exposures, the intermittent character of the noise has to be taken into account. This can be achieved, for example, by measuring the number of noise events, as well as the differencebetween the maximum sound level and the background sound level. Special attention should also begiven to: noise sources in an environment with low background sound levels; combinations of noise andvibrations; and to noise sources with low-frequency components.
Physiological Functions. In workers exposed to noise, and in people living near airports, industries andnoisy streets, noise exposure may have a large temporary, as well as permanent, impact on physiologicalfunctions. After prolonged exposure, susceptible individuals in the general population may developpermanent effects, such as hypertension and ischaemic heart disease associated with exposure to highsound levels. The magnitude and duration of the effects are determined in part by individualcharacteristics, lifestyle behaviours and environmental conditions. Sounds also evoke reflex responses,particularly when they are unfamiliar and have a sudden onset.
x
Workers exposed to high levels of industrial noise for 5–30 years may show increased blood pressure andan increased risk for hypertension. Cardiovascular effects have also been demonstrated after long-termexposure to air- and road-traffic with LAeq,24h values of 65–70 dB(A). Although the associations areweak, the effect is somewhat stronger for ischaemic heart disease than for hypertension. Still, these smallrisk increments are important because a large number of people are exposed.
Mental Illness. Environmental noise is not believed to cause mental illness directly, but it is assumed thatit can accelerate and intensify the development of latent mental disorders. Exposure to high levels ofoccupational noise has been associated with development of neurosis, but the findings on environmentalnoise and mental-health effects are inconclusive. Nevertheless, studies on the use of drugs such astranquillizers and sleeping pills, on psychiatric symptoms and on mental hospital admission rates, suggestthat community noise may have adverse effects on mental health.
Performance. It has been shown, mainly in workers and children, that noise can adversely affectperformance of cognitive tasks. Although noise-induced arousal may produce better performance insimple tasks in the short term, cognitive performance substantially deteriorates for more complex tasks. Reading, attention, problem solving and memorization are among the cognitive effects most stronglyaffected by noise. Noise can also act as a distracting stimulus and impulsive noise events may producedisruptive effects as a result of startle responses.
Noise exposure may also produce after-effects that negatively affect performance. In schools aroundairports, children chronically exposed to aircraft noise under-perform in proof reading, in persistence onchallenging puzzles, in tests of reading acquisition and in motivational capabilities. It is crucial torecognize that some of the adaptation strategies to aircraft noise, and the effort necessary to maintain taskperformance, come at a price. Children from noisier areas have heightened sympathetic arousal, asindicated by increased stress hormone levels, and elevated resting blood pressure. Noise may alsoproduce impairments and increase in errors at work, and some accidents may be an indicator ofperformance deficits.
Social and Behavioural Effects of Noise; Annoyance. Noise can produce a number of social andbehavioural effects as well as annoyance. These effects are often complex, subtle and indirect and manyeffects are assumed to result from the interaction of a number of non-auditory variables. The effect ofcommunity noise on annoyance can be evaluated by questionnaires or by assessing the disturbance ofspecific activities. However, it should be recognized that equal levels of different traffic and industrialnoises cause different magnitudes of annoyance. This is because annoyance in populations varies notonly with the characteristics of the noise, including the noise source, but also depends to a large degree onmany non-acoustical factors of a social, psychological, or economic nature. The correlation betweennoise exposure and general annoyance is much higher at group level than at individual level. Noise above80 dB(A) may also reduce helping behaviour and increase aggressive behaviour. There is particularconcern that high-level continuous noise exposures may increase the susceptibility of schoolchildren tofeelings of helplessness.
Stronger reactions have been observed when noise is accompanied by vibrations and contains low-frequency components, or when the noise contains impulses, such as with shooting noise. Temporary,stronger reactions occur when the noise exposure increases over time, compared to a constant noiseexposure. In most cases, LAeq,24h and Ldn are acceptable approximations of noise exposure related toannoyance. However, there is growing concern that all the component parameters should be individuallyassessed in noise exposure investigations, at least in the complex cases. There is no consensus on amodel for total annoyance due to a combination of environmental noise sources.
Combined Effects on Health of Noise from Mixed Sources. Many acoustical environments consist ofsounds from more than one source, i.e. there are mixed sources, and some combinations of effects arecommon. For example, noise may interfere with speech in the day and create sleep disturbance at night.
xi
These conditions certainly apply to residential areas heavily polluted with noise. Therefore, it isimportant that the total adverse health load of noise be considered over 24 hours, and that theprecautionary principle for sustainable development be applied.
Vulnerable Subgroups. Vulnerable subgroups of the general population should be considered whenrecommending noise protection or noise regulations. The types of noise effects, specific environmentsand specific lifestyles are all factors that should be addressed for these subgroups. Examples ofvulnerable subgroups are: people with particular diseases or medical problems (e.g. high blood pressure);people in hospitals or rehabilitating at home; people dealing with complex cognitive tasks; the blind;people with hearing impairment; fetuses, babies and young children; and the elderly in general. Peoplewith impaired hearing are the most adversely affected with respect to speech intelligibility. Even slighthearing impairments in the high-frequency sound range may cause problems with speech perception in anoisy environment. A majority of the population belongs to the subgroup that is vulnerable to speechinterference.
4. Guideline values
In chapter 4, guideline values are given for specific health effects of noise and for specific environments.
Specific health effects.
Interference with Speech Perception. A majority of the population is susceptible to speech interferenceby noise and belongs to a vulnerable subgroup. Most sensitive are the elderly and persons with impairedhearing. Even slight hearing impairments in the high-frequency range may cause problems with speechperception in a noisy environment. From about 40 years of age, the ability of people to interpret difficult,spoken messages with low linguistic redundancy is impaired compared to people 20–30 years old. It hasalso been shown that high noise levels and long reverberation times have more adverse effects in children,who have not completed language acquisition, than in young adults.
When listening to complicated messages (at school, foreign languages, telephone conversation) thesignal-to-noise ratio should be at least 15 dB with a voice level of 50 dB(A). This sound levelcorresponds on average to a casual voice level in both women and men at 1 m distance. Consequently,for clear speech perception the background noise level should not exceed 35 dB(A). In classrooms orconference rooms, where speech perception is of paramount importance, or for sensitive groups,background noise levels should be as low as possible. Reverberation times below 1 s are also necessaryfor good speech intelligibility in smaller rooms. For sensitive groups, such as the elderly, a reverberationtime below 0.6 s is desirable for adequate speech intelligibility even in a quiet environment.
Hearing Impairment. Noise that gives rise to hearing impairment is by no means restricted tooccupational situations. High noise levels can also occur in open air concerts, discotheques, motor sports,shooting ranges, in dwellings from loudspeakers, or from leisure activities. Other important sources ofloud noise are headphones, as well as toys and fireworks which can emit impulse noise. The ISOstandard 1999 gives a method for estimating noise-induced hearing impairment in populations exposed toall types of noise (continuous, intermittent, impulse) during working hours. However, the evidencestrongly suggests that this method should also be used to calculate hearing impairment due to noiseexposure from environmental and leisure time activities. The ISO standard 1999 implies that long-termexposure to LAeq,24h noise levels of up to 70 dB(A) will not result in hearing impairment. To avoidhearing loss from impulse noise exposure, peak sound pressures should never exceed 140 dB for adults,and 120 dB for children.
xii
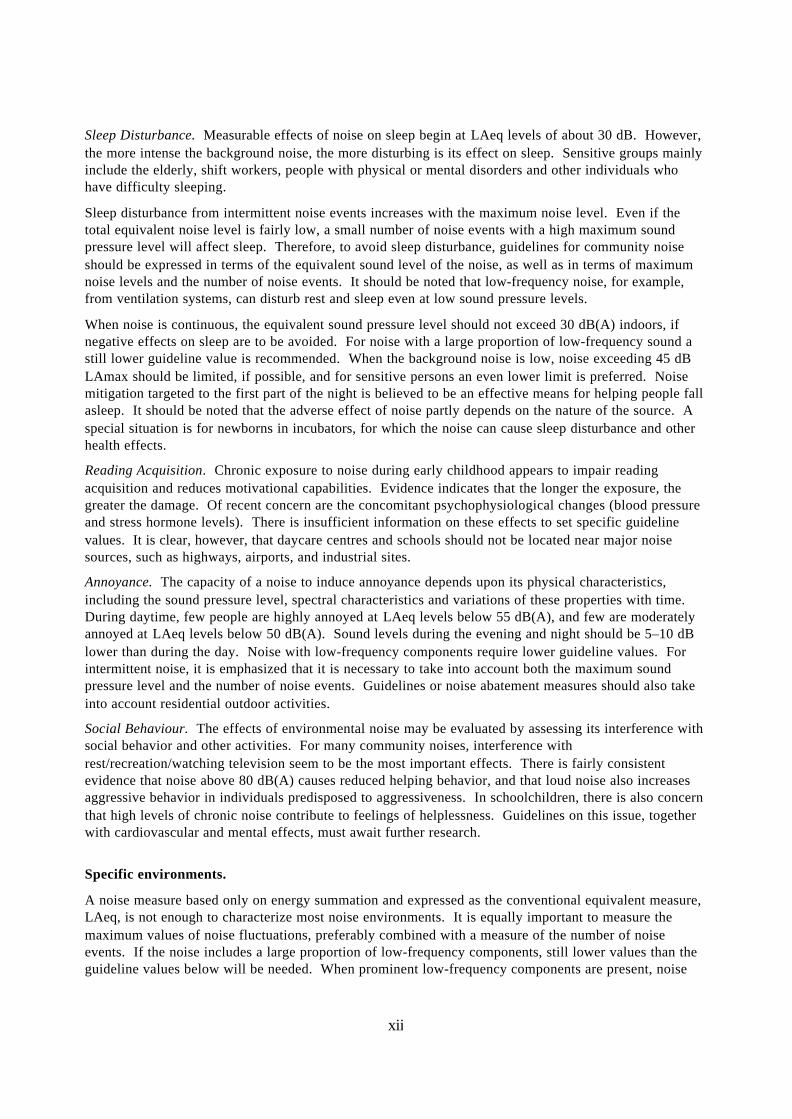
Sleep Disturbance. Measurable effects of noise on sleep begin at LAeq levels of about 30 dB. However,the more intense the background noise, the more disturbing is its effect on sleep. Sensitive groups mainlyinclude the elderly, shift workers, people with physical or mental disorders and other individuals whohave difficulty sleeping.
Sleep disturbance from intermittent noise events increases with the maximum noise level. Even if thetotal equivalent noise level is fairly low, a small number of noise events with a high maximum soundpressure level will affect sleep. Therefore, to avoid sleep disturbance, guidelines for community noiseshould be expressed in terms of the equivalent sound level of the noise, as well as in terms of maximumnoise levels and the number of noise events. It should be noted that low-frequency noise, for example,from ventilation systems, can disturb rest and sleep even at low sound pressure levels.
When noise is continuous, the equivalent sound pressure level should not exceed 30 dB(A) indoors, ifnegative effects on sleep are to be avoided. For noise with a large proportion of low-frequency sound astill lower guideline value is recommended. When the background noise is low, noise exceeding 45 dBLAmax should be limited, if possible, and for sensitive persons an even lower limit is preferred. Noisemitigation targeted to the first part of the night is believed to be an effective means for helping people fallasleep. It should be noted that the adverse effect of noise partly depends on the nature of the source. Aspecial situation is for newborns in incubators, for which the noise can cause sleep disturbance and otherhealth effects.
Reading Acquisition. Chronic exposure to noise during early childhood appears to impair readingacquisition and reduces motivational capabilities. Evidence indicates that the longer the exposure, thegreater the damage. Of recent concern are the concomitant psychophysiological changes (blood pressureand stress hormone levels). There is insufficient information on these effects to set specific guidelinevalues. It is clear, however, that daycare centres and schools should not be located near major noisesources, such as highways, airports, and industrial sites.
Annoyance. The capacity of a noise to induce annoyance depends upon its physical characteristics,including the sound pressure level, spectral characteristics and variations of these properties with time. During daytime, few people are highly annoyed at LAeq levels below 55 dB(A), and few are moderatelyannoyed at LAeq levels below 50 dB(A). Sound levels during the evening and night should be 5–10 dBlower than during the day. Noise with low-frequency components require lower guideline values. Forintermittent noise, it is emphasized that it is necessary to take into account both the maximum soundpressure level and the number of noise events. Guidelines or noise abatement measures should also takeinto account residential outdoor activities.
Social Behaviour. The effects of environmental noise may be evaluated by assessing its interference withsocial behavior and other activities. For many community noises, interference withrest/recreation/watching television seem to be the most important effects. There is fairly consistentevidence that noise above 80 dB(A) causes reduced helping behavior, and that loud noise also increasesaggressive behavior in individuals predisposed to aggressiveness. In schoolchildren, there is also concernthat high levels of chronic noise contribute to feelings of helplessness. Guidelines on this issue, togetherwith cardiovascular and mental effects, must await further research.
Specific environments.
A noise measure based only on energy summation and expressed as the conventional equivalent measure,LAeq, is not enough to characterize most noise environments. It is equally important to measure themaximum values of noise fluctuations, preferably combined with a measure of the number of noiseevents. If the noise includes a large proportion of low-frequency components, still lower values than theguideline values below will be needed. When prominent low-frequency components are present, noise
xiii
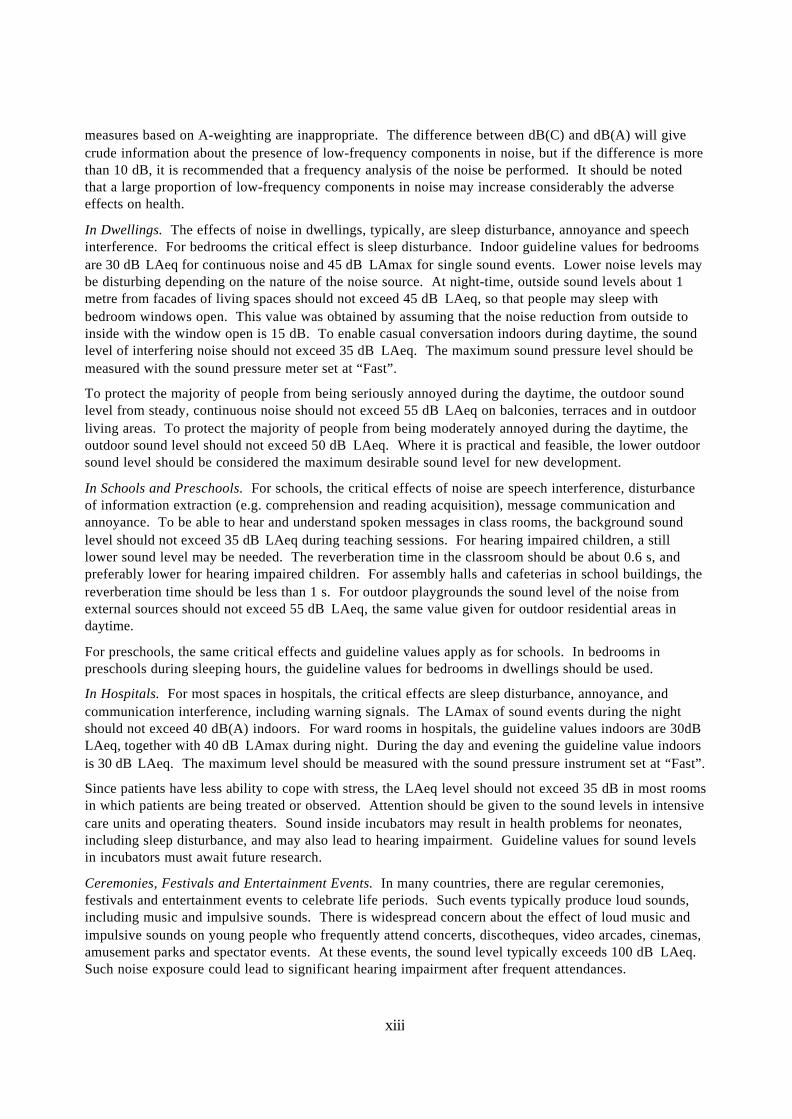
measures based on A-weighting are inappropriate. The difference between dB(C) and dB(A) will givecrude information about the presence of low-frequency components in noise, but if the difference is morethan 10 dB, it is recommended that a frequency analysis of the noise be performed. It should be notedthat a large proportion of low-frequency components in noise may increase considerably the adverseeffects on health.
In Dwellings. The effects of noise in dwellings, typically, are sleep disturbance, annoyance and speechinterference. For bedrooms the critical effect is sleep disturbance. Indoor guideline values for bedroomsare 30 dB LAeq for continuous noise and 45 dB LAmax for single sound events. Lower noise levels maybe disturbing depending on the nature of the noise source. At night-time, outside sound levels about 1metre from facades of living spaces should not exceed 45 dB LAeq, so that people may sleep withbedroom windows open. This value was obtained by assuming that the noise reduction from outside toinside with the window open is 15 dB. To enable casual conversation indoors during daytime, the soundlevel of interfering noise should not exceed 35 dB LAeq. The maximum sound pressure level should bemeasured with the sound pressure meter set at “Fast”.
To protect the majority of people from being seriously annoyed during the daytime, the outdoor soundlevel from steady, continuous noise should not exceed 55 dB LAeq on balconies, terraces and in outdoorliving areas. To protect the majority of people from being moderately annoyed during the daytime, theoutdoor sound level should not exceed 50 dB LAeq. Where it is practical and feasible, the lower outdoorsound level should be considered the maximum desirable sound level for new development.
In Schools and Preschools. For schools, the critical effects of noise are speech interference, disturbanceof information extraction (e.g. comprehension and reading acquisition), message communication andannoyance. To be able to hear and understand spoken messages in class rooms, the background soundlevel should not exceed 35 dB LAeq during teaching sessions. For hearing impaired children, a stilllower sound level may be needed. The reverberation time in the classroom should be about 0.6 s, andpreferably lower for hearing impaired children. For assembly halls and cafeterias in school buildings, thereverberation time should be less than 1 s. For outdoor playgrounds the sound level of the noise fromexternal sources should not exceed 55 dB LAeq, the same value given for outdoor residential areas indaytime.
For preschools, the same critical effects and guideline values apply as for schools. In bedrooms inpreschools during sleeping hours, the guideline values for bedrooms in dwellings should be used.
In Hospitals. For most spaces in hospitals, the critical effects are sleep disturbance, annoyance, andcommunication interference, including warning signals. The LAmax of sound events during the nightshould not exceed 40 dB(A) indoors. For ward rooms in hospitals, the guideline values indoors are 30dBLAeq, together with 40 dB LAmax during night. During the day and evening the guideline value indoorsis 30 dB LAeq. The maximum level should be measured with the sound pressure instrument set at “Fast”.
Since patients have less ability to cope with stress, the LAeq level should not exceed 35 dB in most roomsin which patients are being treated or observed. Attention should be given to the sound levels in intensivecare units and operating theaters. Sound inside incubators may result in health problems for neonates,including sleep disturbance, and may also lead to hearing impairment. Guideline values for sound levelsin incubators must await future research.
Ceremonies, Festivals and Entertainment Events. In many countries, there are regular ceremonies,festivals and entertainment events to celebrate life periods. Such events typically produce loud sounds,including music and impulsive sounds. There is widespread concern about the effect of loud music andimpulsive sounds on young people who frequently attend concerts, discotheques, video arcades, cinemas,amusement parks and spectator events. At these events, the sound level typically exceeds 100 dB LAeq. Such noise exposure could lead to significant hearing impairment after frequent attendances.
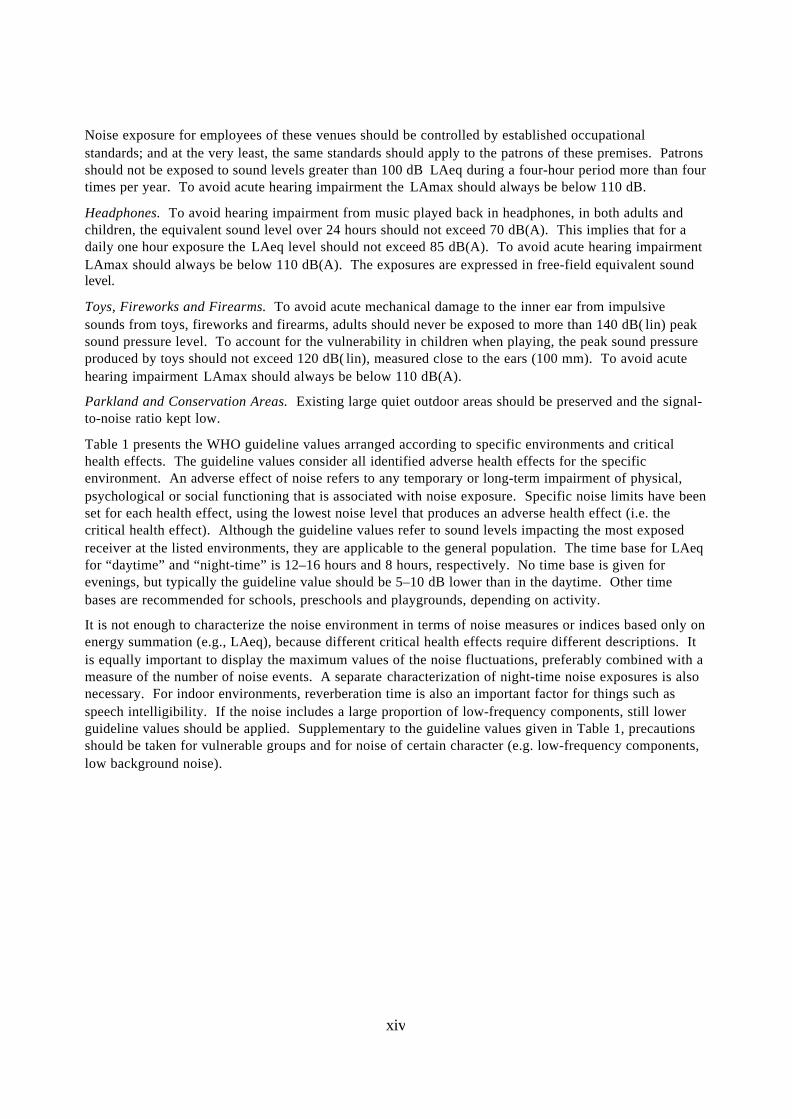
xiv
Noise exposure for employees of these venues should be controlled by established occupationalstandards; and at the very least, the same standards should apply to the patrons of these premises. Patronsshould not be exposed to sound levels greater than 100 dB LAeq during a four-hour period more than fourtimes per year. To avoid acute hearing impairment the LAmax should always be below 110 dB.
Headphones. To avoid hearing impairment from music played back in headphones, in both adults andchildren, the equivalent sound level over 24 hours should not exceed 70 dB(A). This implies that for adaily one hour exposure the LAeq level should not exceed 85 dB(A). To avoid acute hearing impairmentLAmax should always be below 110 dB(A). The exposures are expressed in free-field equivalent soundlevel.
Toys, Fireworks and Firearms. To avoid acute mechanical damage to the inner ear from impulsivesounds from toys, fireworks and firearms, adults should never be exposed to more than 140 dB( lin) peaksound pressure level. To account for the vulnerability in children when playing, the peak sound pressureproduced by toys should not exceed 120 dB( lin), measured close to the ears (100 mm). To avoid acutehearing impairment LAmax should always be below 110 dB(A).
Parkland and Conservation Areas. Existing large quiet outdoor areas should be preserved and the signal-to-noise ratio kept low.
Table 1 presents the WHO guideline values arranged according to specific environments and criticalhealth effects. The guideline values consider all identified adverse health effects for the specificenvironment. An adverse effect of noise refers to any temporary or long-term impairment of physical,psychological or social functioning that is associated with noise exposure. Specific noise limits have beenset for each health effect, using the lowest noise level that produces an adverse health effect (i.e. thecritical health effect). Although the guideline values refer to sound levels impacting the most exposedreceiver at the listed environments, they are applicable to the general population. The time base for LAeqfor “daytime” and “night-time” is 12–16 hours and 8 hours, respectively. No time base is given forevenings, but typically the guideline value should be 5–10 dB lower than in the daytime. Other timebases are recommended for schools, preschools and playgrounds, depending on activity.
It is not enough to characterize the noise environment in terms of noise measures or indices based only onenergy summation (e.g., LAeq), because different critical health effects require different descriptions. Itis equally important to display the maximum values of the noise fluctuations, preferably combined with ameasure of the number of noise events. A separate characterization of night-time noise exposures is alsonecessary. For indoor environments, reverberation time is also an important factor for things such asspeech intelligibility. If the noise includes a large proportion of low-frequency components, still lowerguideline values should be applied. Supplementary to the guideline values given in Table 1, precautionsshould be taken for vulnerable groups and for noise of certain character (e.g. low-frequency components,low background noise).
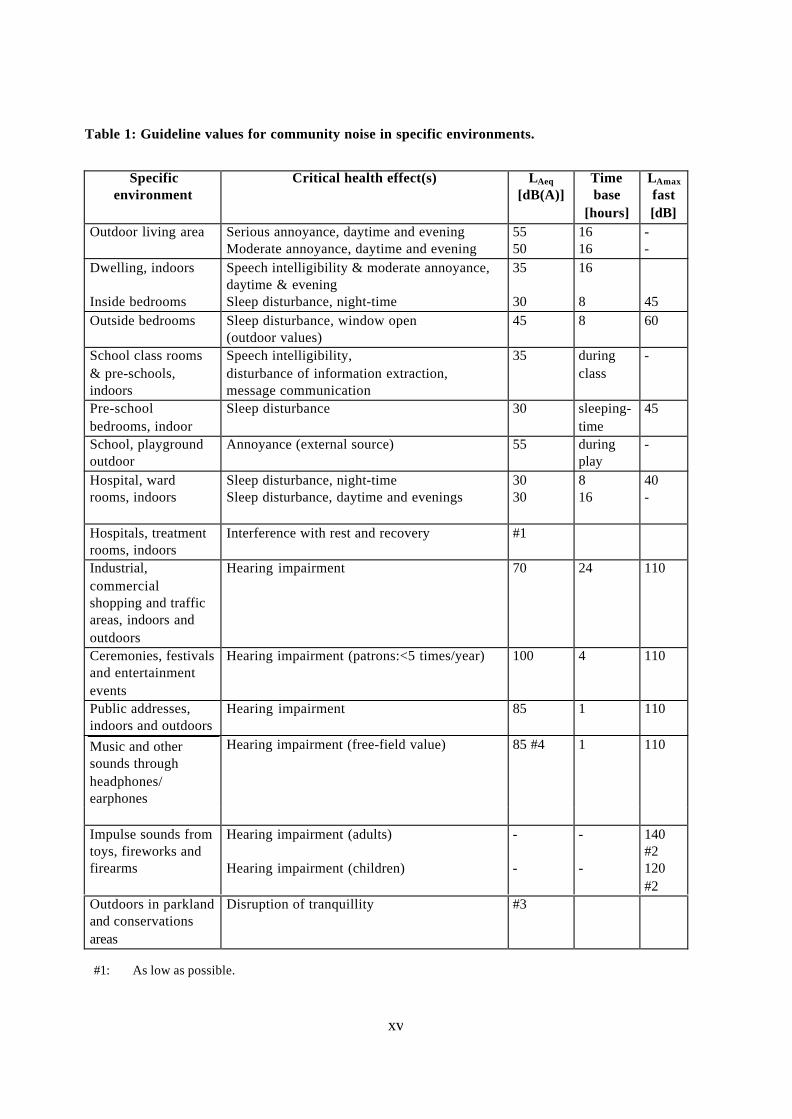
xv
Table 1: Guideline values for community noise in specific environments.
Specificenvironment
Critical health effect(s) LAeq
[dB(A)]Timebase
[hours]
LAmax
fast[dB]
Outdoor living area Serious annoyance, daytime and eveningModerate annoyance, daytime and evening
5550
1616
--
Dwelling, indoors
Inside bedrooms
Speech intelligibility & moderate annoyance,daytime & eveningSleep disturbance, night-time
35
30
16
8 45Outside bedrooms Sleep disturbance, window open
(outdoor values)45 8 60
School class rooms& pre-schools,indoors
Speech intelligibility,disturbance of information extraction,message communication
35 duringclass
-
Pre-schoolbedrooms, indoor
Sleep disturbance 30 sleeping-time
45
School, playgroundoutdoor
Annoyance (external source) 55 duringplay
-
Hospital, wardrooms, indoors
Sleep disturbance, night-timeSleep disturbance, daytime and evenings
3030
816
40-
Hospitals, treatmentrooms, indoors
Interference with rest and recovery #1
Industrial,commercialshopping and trafficareas, indoors andoutdoors
Hearing impairment 70 24 110
Ceremonies, festivalsand entertainmentevents
Hearing impairment (patrons:<5 times/year) 100 4 110
Public addresses,indoors and outdoors
Hearing impairment 85 1 110
Music and othersounds throughheadphones/earphones
Hearing impairment (free-field value) 85 #4 1 110
Impulse sounds fromtoys, fireworks andfirearms
Hearing impairment (adults)
Hearing impairment (children)
-
-
-
-
140#2120#2
Outdoors in parklandand conservationsareas
Disruption of tranquillity #3
#1: As low as possible.
xvi
#2: Peak sound pressure (not LAF, max) measured 100 mm from the ear.#3: Existing quiet outdoor areas should be preserved and the ratio of intruding noise to
natural background sound should be kept low.#4: Under headphones, adapted to free-field values.
5. Noise Management
Chapter 5 is devoted to noise management with discussions on: strategies and priorities in managingindoor noise levels; noise policies and legislation; the impact of environmental noise; and on theenforcement of regulatory standards.
The fundamental goals of noise management are to develop criteria for deriving safe noise exposurelevels and to promote noise assessment and control as part of environmental health programmes. Thesebasic goals should guide both international and national policies for noise management. The UnitedNation's Agenda 21 supports a number of environmental management principles on which governmentpolicies, including noise management policies, can be based: the principle of precaution; the "polluterpays" principle; and noise prevention. In all cases, noise should be reduced to the lowest level achievablein the particular situation. When there is a reasonable possibility that the public health will beendangered, even though scientific proof may be lacking, action should be taken to protect the publichealth, without awaiting the full scientific proof. The full costs associated with noise pollution (includingmonitoring, management, lowering levels and supervision) should be met by those responsible for thesource of noise. Action should be taken where possible to reduce noise at the source.
A legal framework is needed to provide a context for noise management. National noise standards canusually be based on a consideration of international guidelines, such as these Guidelines for CommunityNoise, as well as national criteria documents, which consider dose-response relationships for the effects ofnoise on human health. National standards take into account the technological, social, economic andpolitical factors within the country. A staged program of noise abatement should also be implemented toachieve the optimum health protection levels over the long term.
Other components of a noise management plan include: noise level monitoring; noise exposure mapping;exposure modeling; noise control approaches (such as mitigation and precautionary measures); andevaluation of control options. Many of the problems associated with high noise levels can be prevented atlow cost, if governments develop and implement an integrated strategy for the indoor environment, inconcert with all social and economic partners. Governments should establish a "National Plan for aSustainable Noise Indoor Environment" that applies both to new construction as well as to existingbuildings.
The actual priorities in rational noise management will differ for each country. Priority setting in noisemanagement refers to prioritizing the health risks to be avoided and concentrating on the most importantsources of noise. Different countries have adopted a range of approaches to noise control, using differentpolicies and regulations. A number of these are outlined in chapter 5 and Appendix 2, as examples. It isevident that noise emission standards have proven insufficient and that the trends in noise pollution areunsustainable.
The concept of environmental an environmental noise impact analysis is central to the philosophy ofmanaging environmental noise. Such an analysis should be required before implementing any project thatwould significantly increase the level of environmental noise in a community (typically, greater than a 5dB increase). The analysis should include: a baseline description of the existing noise environment; the
xvii
expected level of noise from the new source; an assessment of the adverse health effects; an estimation ofthe population at risk; the calculation of exposure-response relationships; an assessment of risks and theiracceptability; and a cost-benefit analysis.
Noise management should:1. Start monitoring human exposures to noise.2. Have health control require mitigation of noise immissions, and not just of noise source
emissions. The following should be taken into consideration:- specific environments such as schools, playgrounds, homes, hospitals.- environments with multiple noise sources, or which may amplify the effects of noise.- sensitive time periods such as evenings, nights and holidays.- groups at high risk, such as children and the hearing impaired.
3. Consider the noise consequences when planning transport systems and land use.4. Introduce surveillance systems for noise-related adverse health effects.5. Assess the effectiveness of noise policies in reducing adverse health effects and exposure, and in
improving supportive "soundscapes".6. Adopt these Guidelines for Community Noise as intermediary targets for improving human
health.7. Adopt precautionary actions for a sustainable development of the acoustical environments.
Conclusions and recommendations
In chapter 6 are discussed: the implementation of the guidelines; further WHO work on noise; andresearch needs are recommended.
Implementation. For implementation of the guidelines it is recommended that:
• Governments should protection the population from community noise and consider it an integralpart of their policy of environmental protection.
• Governments should consider implementing action plans with short-term, medium-term and long-term objectives for reducing noise levels.
• Governments should adopt the Health Guidelines for Community Noise values as targets to beachieved in the long-term.
• Governments should include noise as an important public health issue in environmental impactassessments.
• Legislation should be put in place to allow for the reduction of sound levels.• Existing legislation should be enforced.• Municipalities should develop low noise implementation plans.• Cost-effectiveness and cost-benefit analyses should be considered potential instruments for
meaningful management decisions.• Governments should support more policy-relevant research.
Future Work. The Expert Task Force worked out several suggestions for future work for the WHO in thefield of community noise. WHO should:
• Provide leadership and technical direction in defining future noise research priorities.• Οrganize workshops on how to apply the guidelines.

xviii
• Provide leadership and coordinate international efforts to develop techniques for designingsupportive sound environments (e.g. "soundscapes").
• Provide leadership for programs to assess the effectiveness of health-related noise policies andregulations.
• Provide leadership and technical direction for the development of sound methodologies forenvironmental and health impact plans.
• Encourage further investigation into using noise exposure as an indicator of environmentaldeterioration (e.g. black spots in cities).
• Provide leadership and technical support, and advise developing countries to facilitatedevelopment of noise policies and noise management.
Research and Development. A major step forward in raising the awareness of both the public and ofdecision makers is the recommendation to concentrate more research and development on variables whichhave monetary consequences. This means that research should consider not only dose-responserelationships between sound levels, but also politically relevant variables, such as noise-induced socialhandicap; reduced productivity; decreased performance in learning; workplace and school absenteeism;increased drug use; and accidents.
In Appendices 1–6 are given: bibliographic references; examples of regional noise situations (AfricanRegion, American Region, Eastern Mediterranean Region, South East Asian Region, Western PacificRegion); a glossary; a list of acronyms; and a list of participants.

Sharps Redmore Partnership The White House London Road Copdock Ipswich IP8 3JH
Telephone: (01473) 730073
Fax: (01473) 730030 www.sharpsredmore.co.uk