Embed Size (px)
Citation preview
terveystalo.com #terveystalo
TERVEYSTALO - LEADING THE WAY IN CUSTOMER-CENTRIC PROACTIVE CARE

© Terveystalo
Agenda
• Terveystalo in brief 1 • Terveystalo as an investment 2 • 2018 highlights 3 • Q&A 4
3
© Terveystalo
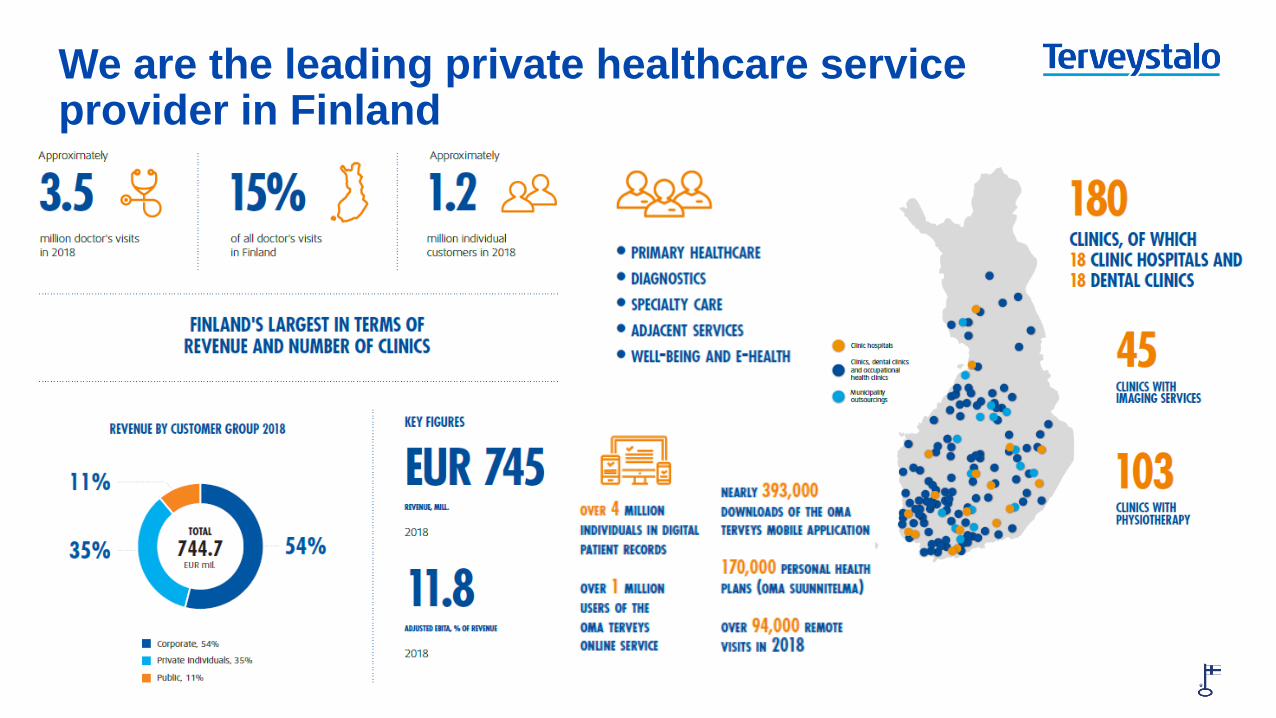
We are the leading private healthcare service provider in Finland
4
© Terveystalo
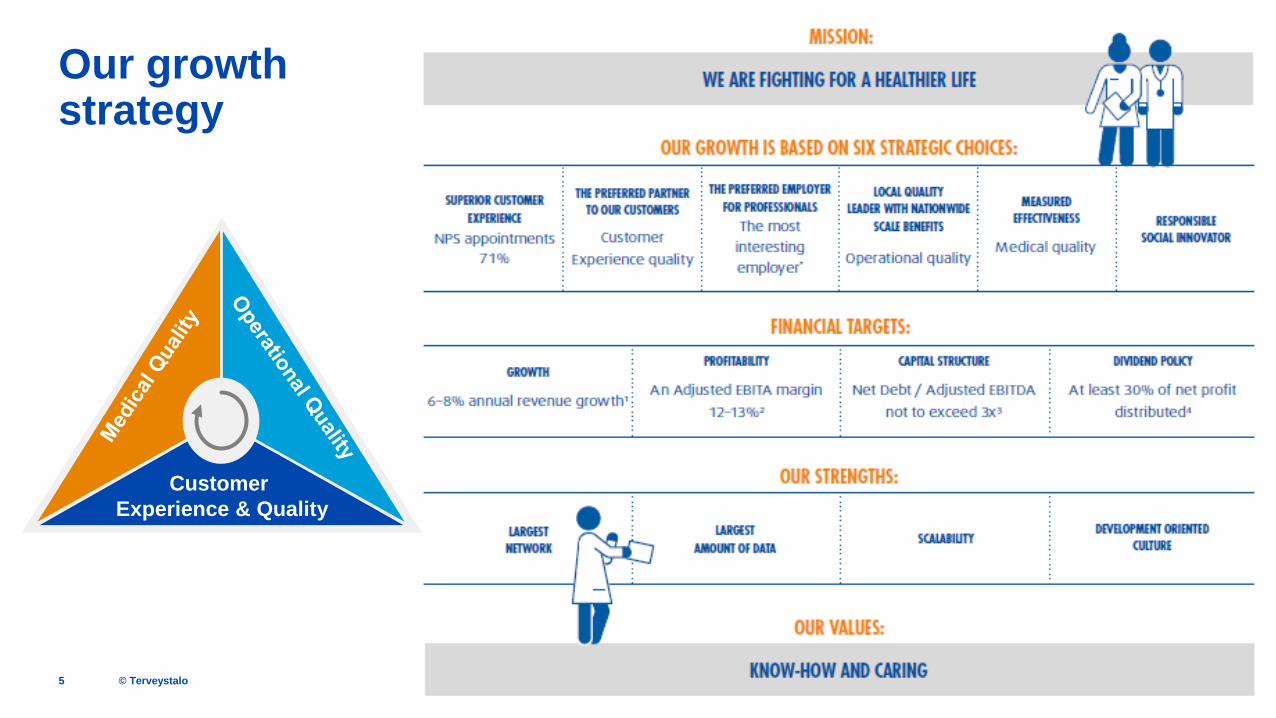
Our growth strategy
5
Customer Experience & Quality
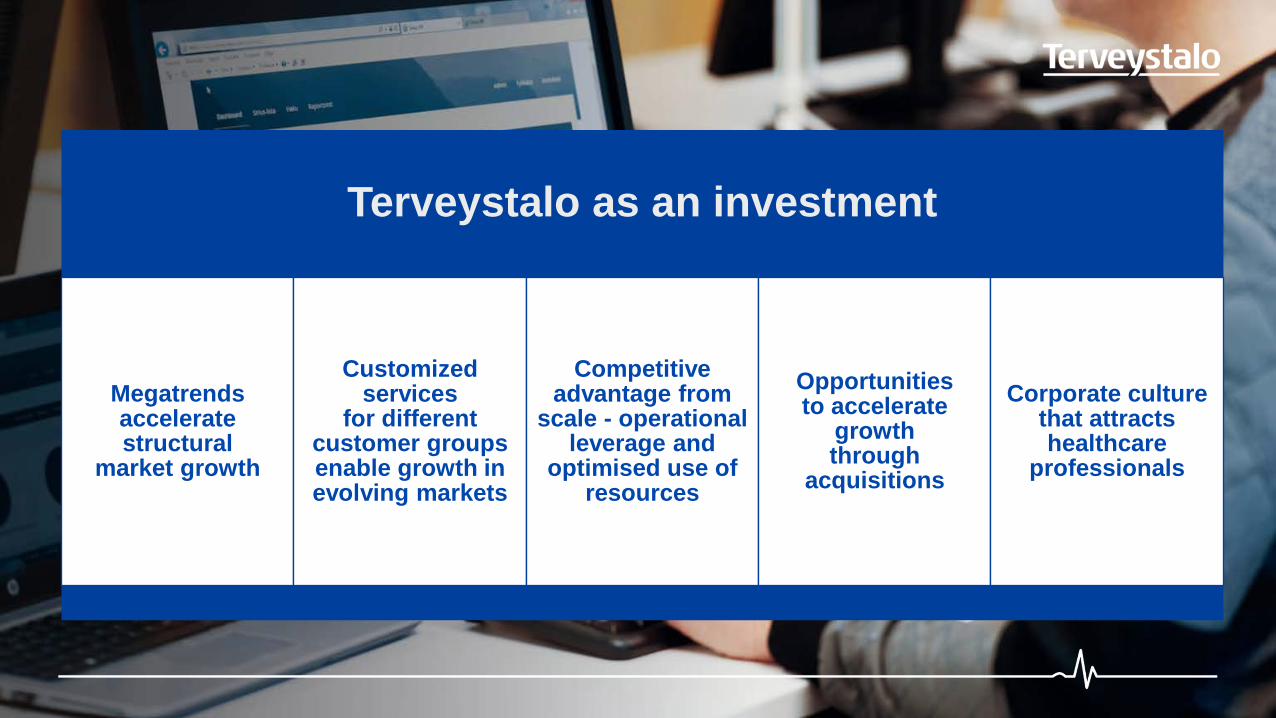
Terveystalo as an investment
Megatrends accelerate structural
market growth
Customized services
for different customer groups enable growth in evolving markets
Competitive advantage from
scale - operational leverage and
optimised use of resources
Opportunities to accelerate
growth through
acquisitions
Corporate culture that attracts healthcare
professionals
© Terveystalo
8,4 8,9
9,4 9,9 10,7 11,0 11,4
12,2 12,8
13,4 13,5 13,9 14,2 14,4 14,9
15,5 16,0
16,6 17,3
1 598
2 575
2004 2006 2008 2010 2012 2014 2016E 2018F 2020F 2022F
7
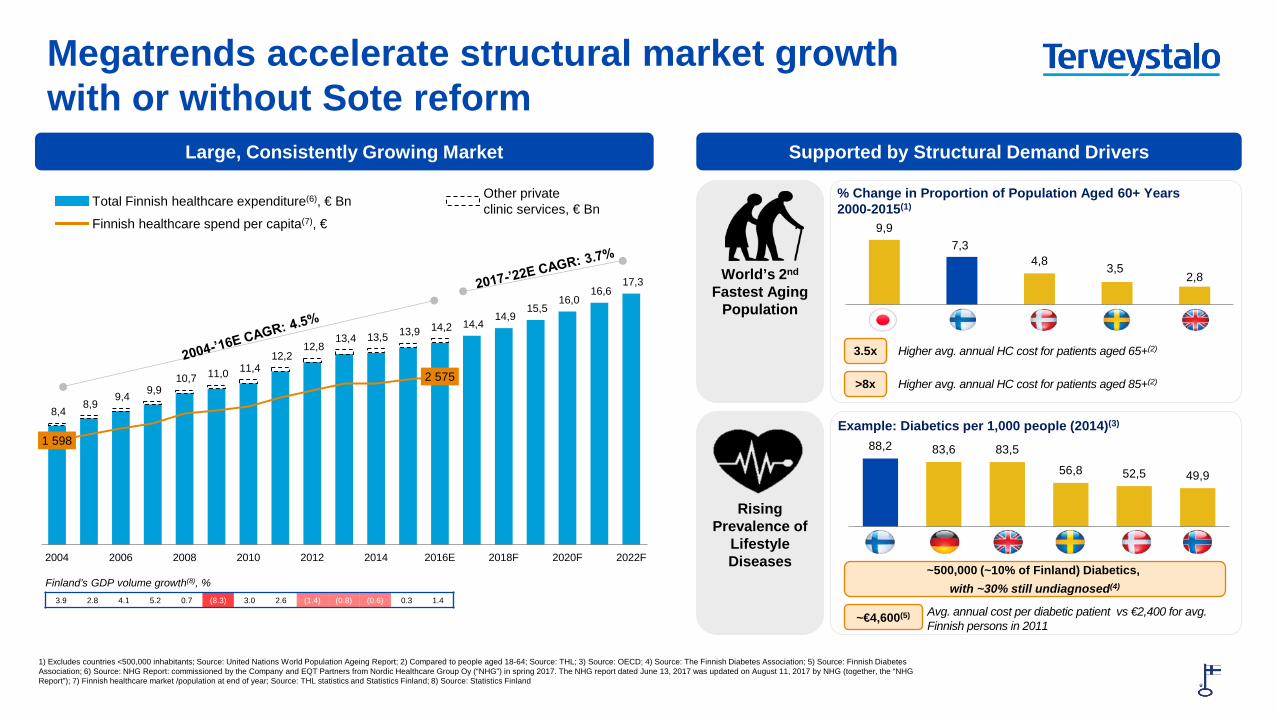
1) Excludes countries <500,000 inhabitants; Source: United Nations World Population Ageing Report; 2) Compared to people aged 18-64; Source: THL; 3) Source: OECD; 4) Source: The Finnish Diabetes Association; 5) Source: Finnish Diabetes Association; 6) Source: NHG Report: commissioned by the Company and EQT Partners from Nordic Healthcare Group Oy (“NHG”) in spring 2017. The NHG report dated June 13, 2017 was updated on August 11, 2017 by NHG (together, the “NHG Report”); 7) Finnish healthcare market /population at end of year; Source: THL statistics and Statistics Finland; 8) Source: Statistics Finland
World’s 2nd Fastest Aging
Population
Rising
Prevalence of Lifestyle Diseases
9,9 7,3
4,8 3,5 2,8
Japan Fin Den Swed UK
% Change in Proportion of Population Aged 60+ Years 2000-2015(1)
3.5x
>8x
Example: Diabetics per 1,000 people (2014)(3)
~500,000 (~10% of Finland) Diabetics, with ~30% still undiagnosed(4)
Avg. annual cost per diabetic patient vs €2,400 for avg. Finnish persons in 2011
~€4,600(5)
88,2 83,6 83,5
56,8 52,5 49,9
Fin Ger UK Swe Den Nor
Higher avg. annual HC cost for patients aged 65+(2)
Higher avg. annual HC cost for patients aged 85+(2)
Megatrends accelerate structural market growth with or without Sote reform
Large, Consistently Growing Market Supported by Structural Demand Drivers
Total Finnish healthcare expenditure(6), € Bn
Finnish healthcare spend per capita(7), €
Finland’s GDP volume growth(8), %
3.9 2.8 4.1 5.2 0.7 (8.3) 3.0 2.6 (1.4) (0.8) (0.6) 0.3 1.4
Other private clinic services, € Bn
© Terveystalo
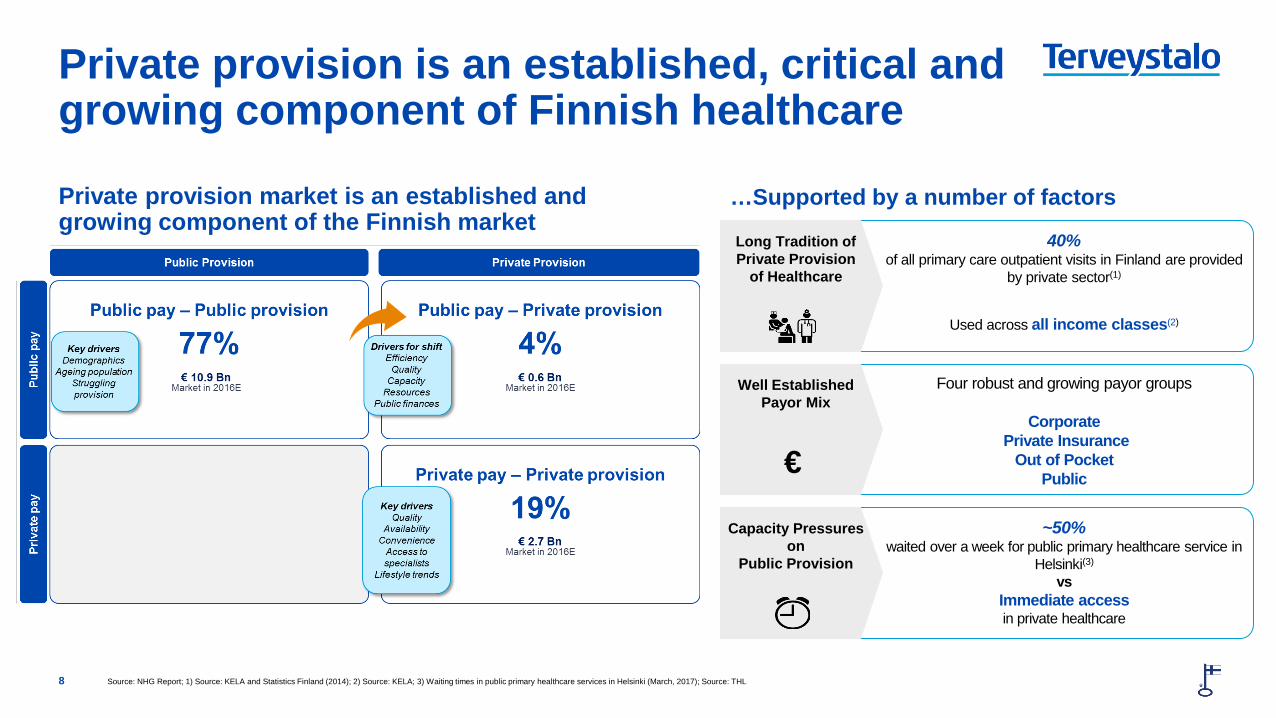
Private provision market is an established and growing component of the Finnish market
…Supported by a number of factors
8
Private provision is an established, critical and growing component of Finnish healthcare
40% of all primary care outpatient visits in Finland are provided
by private sector(1)
Used across all income classes(2)
Long Tradition of Private Provision
of Healthcare
Four robust and growing payor groups
Corporate Private Insurance
Out of Pocket Public
Well Established Payor Mix
~50% waited over a week for public primary healthcare service in
Helsinki(3) vs
Immediate access in private healthcare
Capacity Pressures on
Public Provision
€
Source: NHG Report; 1) Source: KELA and Statistics Finland (2014); 2) Source: KELA; 3) Waiting times in public primary healthcare services in Helsinki (March, 2017); Source: THL
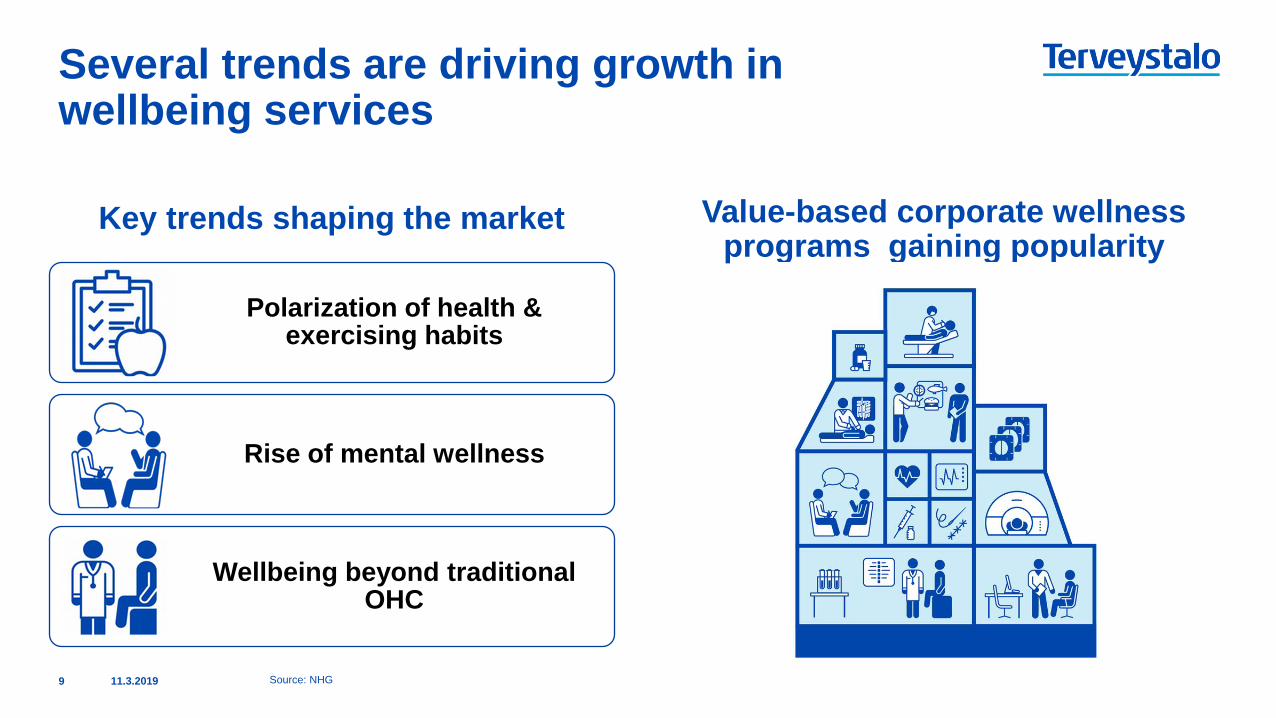
Key trends shaping the market
Polarization of health & exercising habits
Rise of mental wellness
Wellbeing beyond traditional OHC
Value-based corporate wellness programs gaining popularity
11.3.2019 9
Several trends are driving growth in wellbeing services
Source: NHG
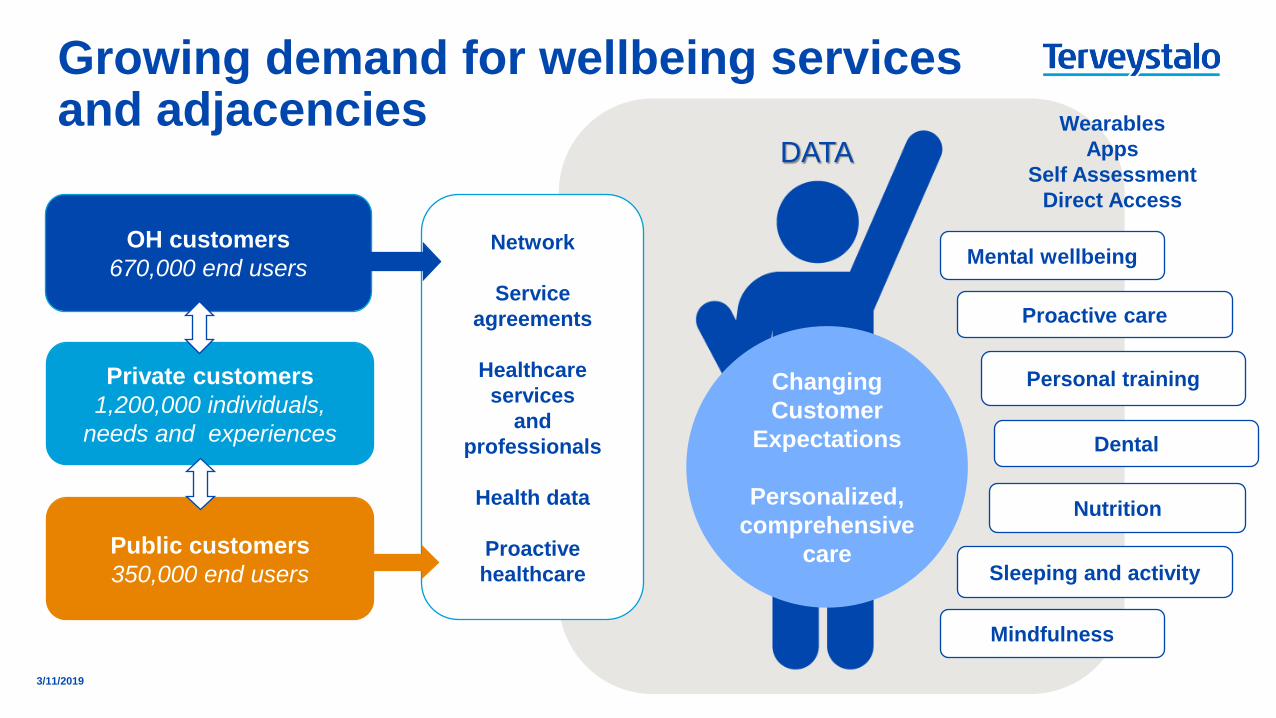
Growing demand for wellbeing services and adjacencies
3/11/2019
OH customers 670,000 end users
Public customers 350,000 end users
Private customers 1,200,000 individuals,
needs and experiences
Network
Service agreements
Healthcare
services and
professionals
Health data
Proactive healthcare
Changing Customer
Expectations
Personalized, comprehensive
care
Dental
Mindfulness
Sleeping and activity
Nutrition
Wearables Apps
Self Assessment Direct Access
Mental wellbeing
Proactive care
Personal training
DATA
© Terveystalo
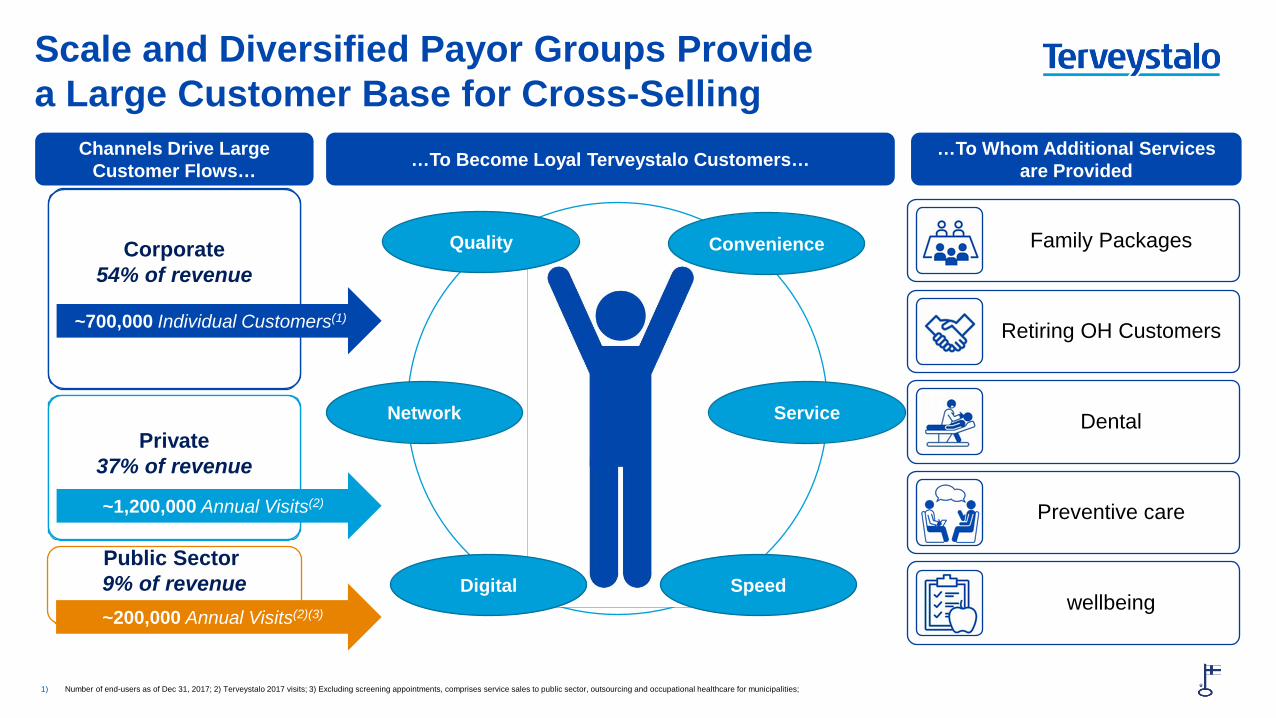
Private 37% of revenue
Public Sector 9% of revenue
Corporate 54% of revenue
Channels Drive Large Customer Flows…
…To Whom Additional Services are Provided …To Become Loyal Terveystalo Customers…
Convenience Quality
Speed Digital
Service Network
~700,000 Individual Customers(1)
~200,000 Annual Visits(2)(3)
~1,200,000 Annual Visits(2)
Family Packages
Retiring OH Customers
Dental
Preventive care
wellbeing
11 1) Number of end-users as of Dec 31, 2017; 2) Terveystalo 2017 visits; 3) Excluding screening appointments, comprises service sales to public sector, outsourcing and occupational healthcare for municipalities;
Scale and Diversified Payor Groups Provide a Large Customer Base for Cross-Selling
© Terveystalo
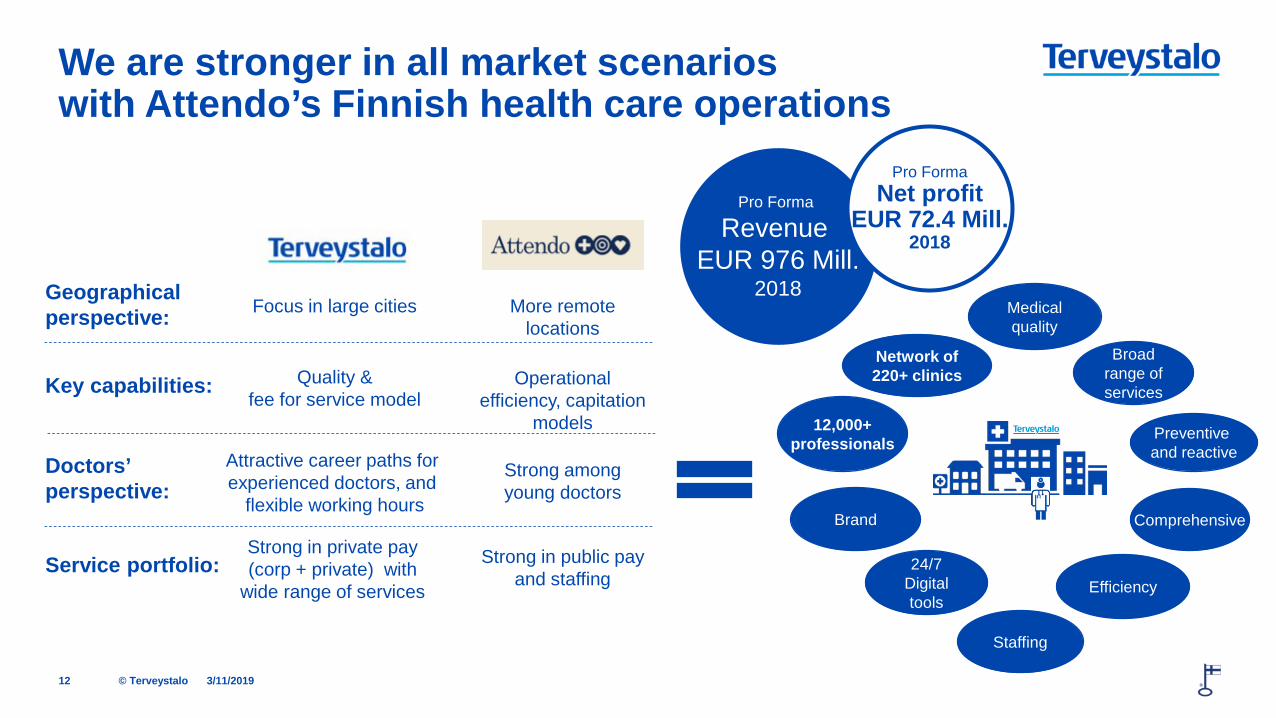
We are stronger in all market scenarios with Attendo’s Finnish health care operations
3/11/2019 12
Geographical perspective:
Key capabilities:
Doctors’ perspective:
Service portfolio:
Focus in large cities More remote locations
Quality & fee for service model
Operational efficiency, capitation
models
Attractive career paths for experienced doctors, and
flexible working hours
Strong among young doctors
Strong in private pay (corp + private) with
wide range of services
Strong in public pay and staffing
Medical quality
Broad range of services
Brand
24/7 Digital tools
Staffing
Efficiency
Preventive and reactive
12,000+ professionals
Comprehensive
Network of 220+ clinics
Pro Forma
Revenue EUR 976 Mill.
2018
Pro Forma Net profit
EUR 72.4 Mill. 2018
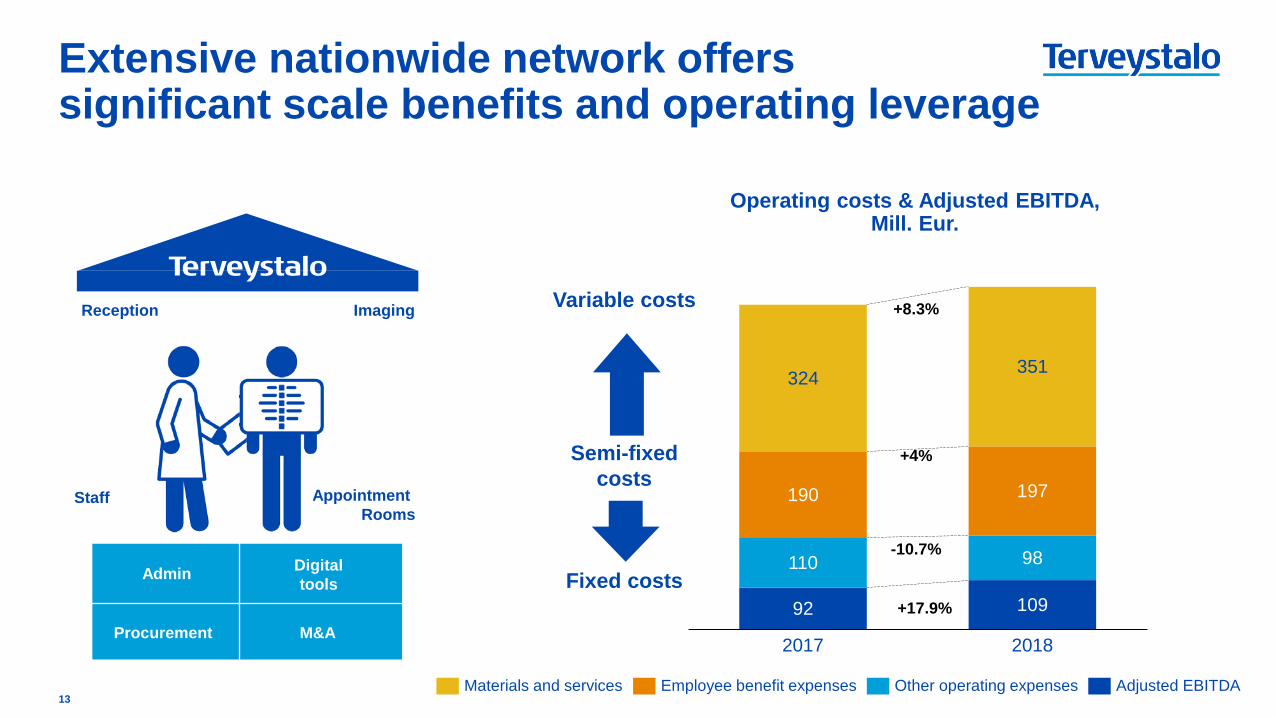
Extensive nationwide network offers significant scale benefits and operating leverage
13
Operating costs & Adjusted EBITDA, Mill. Eur.
Admin
Procurement
Digital tools
M&A
Reception
Staff
Variable costs
Semi-fixed costs
Fixed costs
Appointment Rooms
Imaging
92 109
110 98
190 197
324 351
2018 2017
Materials and services Employee benefit expenses Other operating expenses Adjusted EBITDA
+8.3%
+4%
-10.7%
+17.9%
© Terveystalo
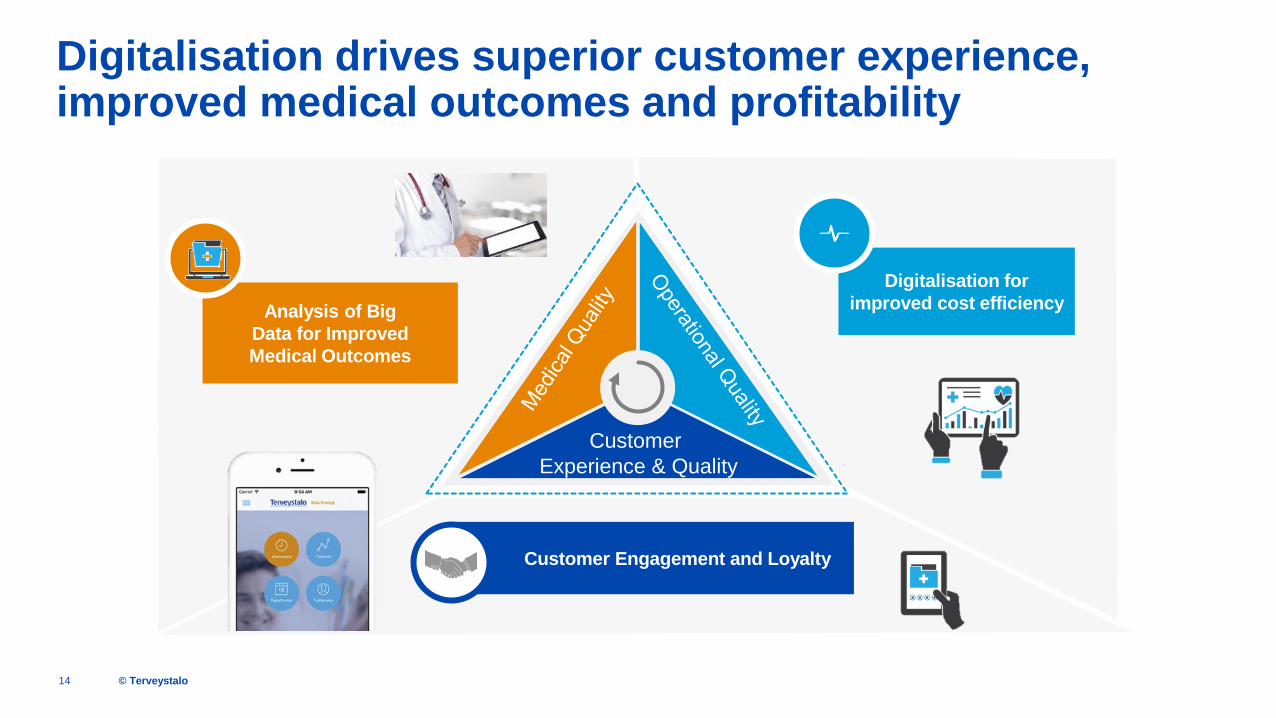
Digitalisation drives superior customer experience, improved medical outcomes and profitability
14
Analysis of Big
Data for Improved Medical Outcomes
Digitalisation for improved cost efficiency
Customer Engagement and Loyalty
Customer Experience & Quality
© Terveystalo
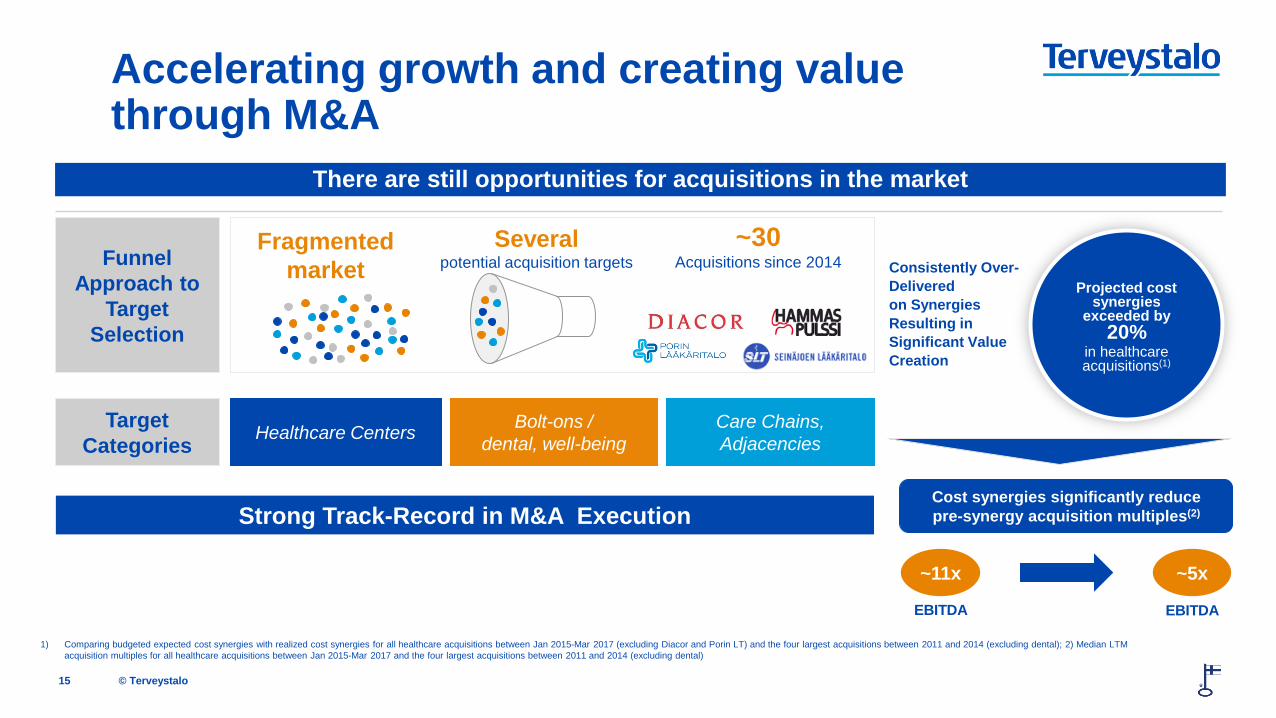
Funnel Approach to
Target Selection
Accelerating growth and creating value through M&A
There are still opportunities for acquisitions in the market
15
Projected cost synergies
exceeded by 20%
in healthcare acquisitions(1)
Target Categories Healthcare Centers Bolt-ons /
dental, well-being Care Chains, Adjacencies
Fragmented
market Several
potential acquisition targets ~30
Acquisitions since 2014
1) Comparing budgeted expected cost synergies with realized cost synergies for all healthcare acquisitions between Jan 2015-Mar 2017 (excluding Diacor and Porin LT) and the four largest acquisitions between 2011 and 2014 (excluding dental); 2) Median LTM acquisition multiples for all healthcare acquisitions between Jan 2015-Mar 2017 and the four largest acquisitions between 2011 and 2014 (excluding dental)
Consistently Over-Delivered on Synergies Resulting in Significant Value Creation
Cost synergies significantly reduce pre-synergy acquisition multiples(2)
~11x ~5x
EBITDA EBITDA
Strong Track-Record in M&A Execution
© Terveystalo
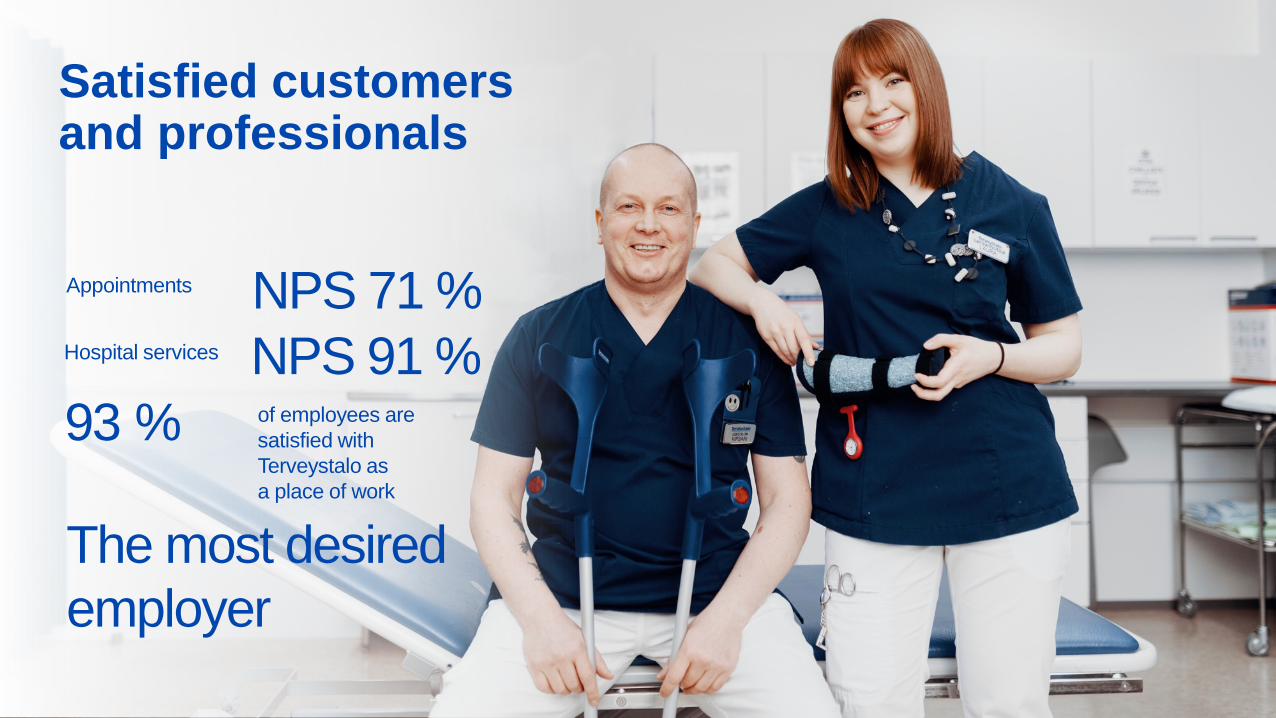
Satisfied customers and professionals
NPS 71 % Appointments
NPS 91 % Hospital services
93 % of employees are satisfied with Terveystalo as a place of work
The most desired employer
© Terveystalo
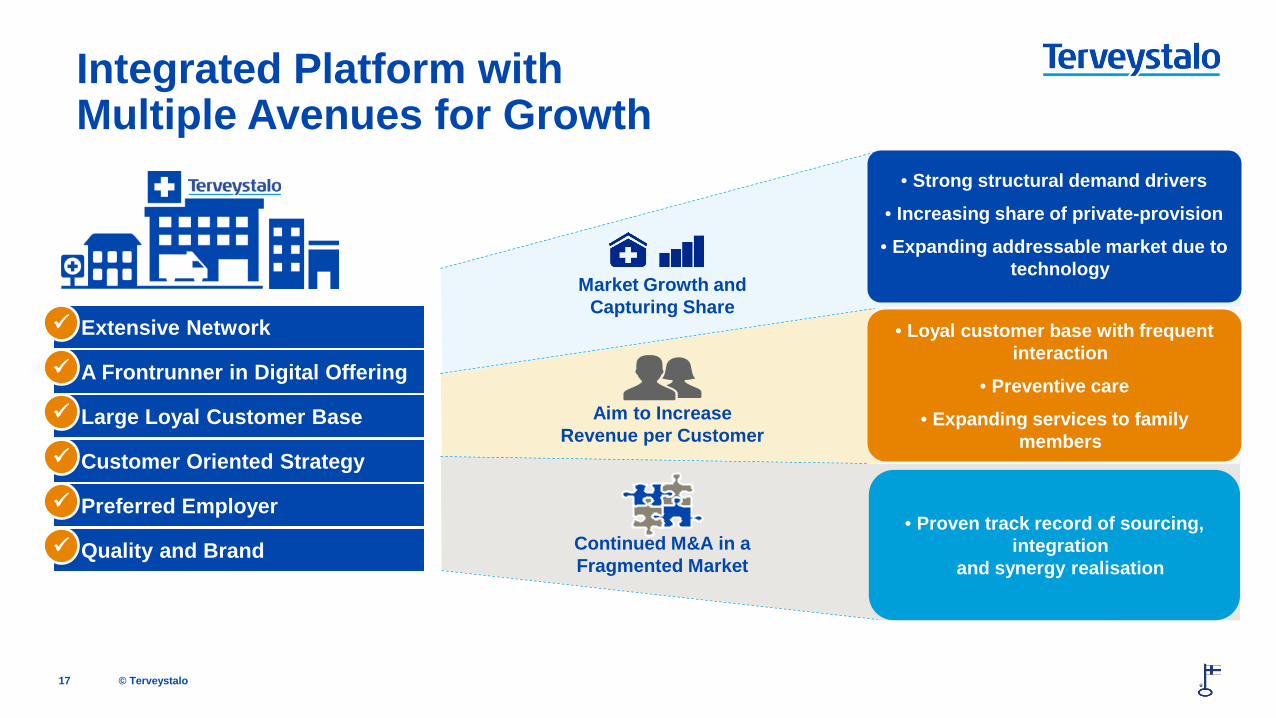
Integrated Platform with Multiple Avenues for Growth
17
Extensive Network
Large Loyal Customer Base
Customer Oriented Strategy
Preferred Employer
A Frontrunner in Digital Offering
Quality and Brand
Market Growth and Capturing Share
Continued M&A in a Fragmented Market
Aim to Increase Revenue per Customer
• Proven track record of sourcing, integration
and synergy realisation
• Strong structural demand drivers
• Increasing share of private-provision
• Expanding addressable market due to technology
• Loyal customer base with frequent interaction
• Preventive care
• Expanding services to family members
terveystalo.com #terveystalo
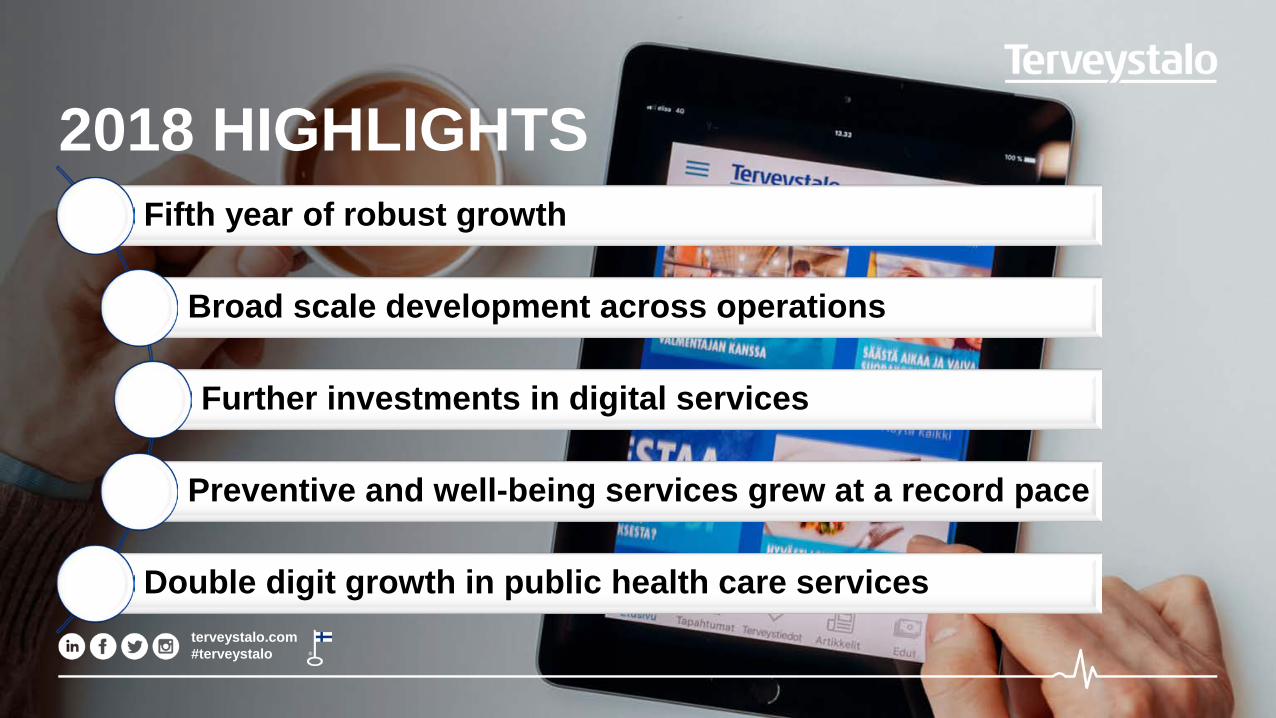
2018 HIGHLIGHTS
Fifth year of robust growth
Broad scale development across operations
Further investments in digital services
Preventive and well-being services grew at a record pace
Double digit growth in public health care services
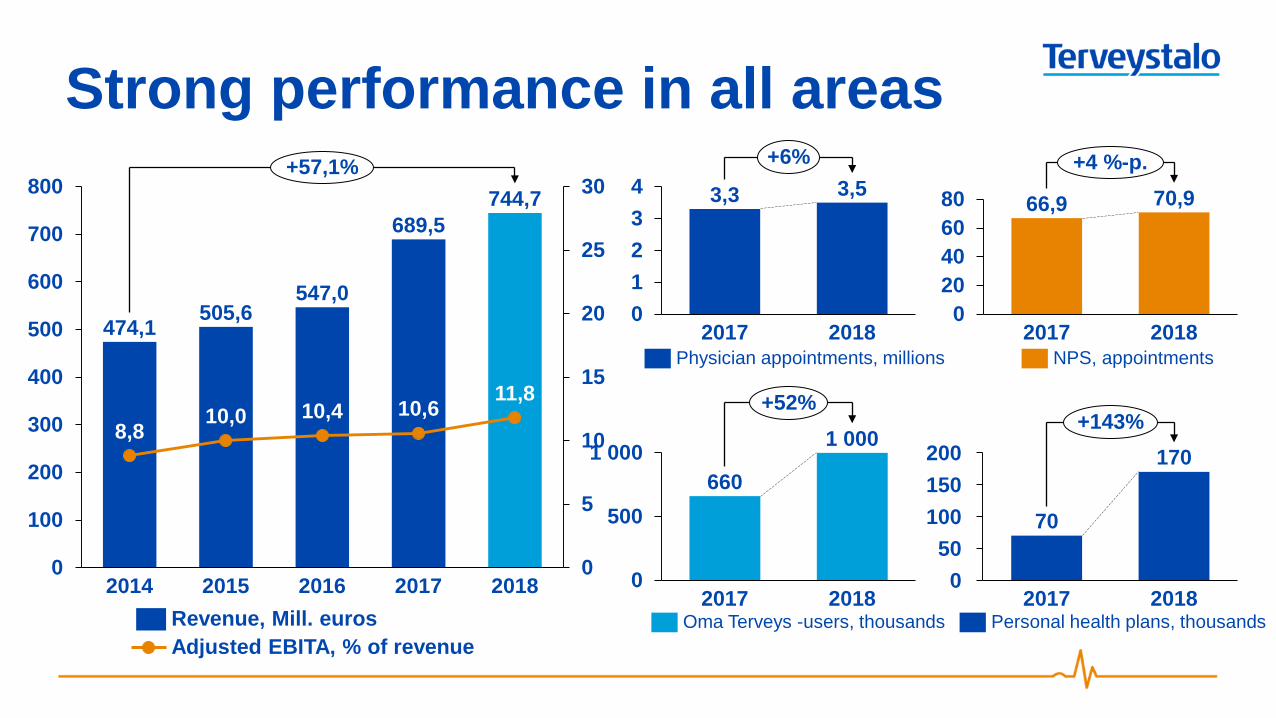
474,1 505,6
547,0
689,5 744,7
8,8 10,0 10,4 10,6
11,8
0
5
10
15
20
25
30
0
100
200
300
400
500
600
700
800
2017 2018 2014 2016 2015
+57,1%
Revenue, Mill. euros Adjusted EBITA, % of revenue
3,3 3,5
01234
2017 2018
+6%
Physician appointments, millions
66,9 70,9
020406080
2017 2018
+4 %-p.
NPS, appointments
150
0
200
100 50
2018 2017
70
170 +143%
Personal health plans, thousands
660
1 000
0
500
1 000
2017 2018
+52%
Oma Terveys -users, thousands
Strong performance in all areas
© Terveystalo
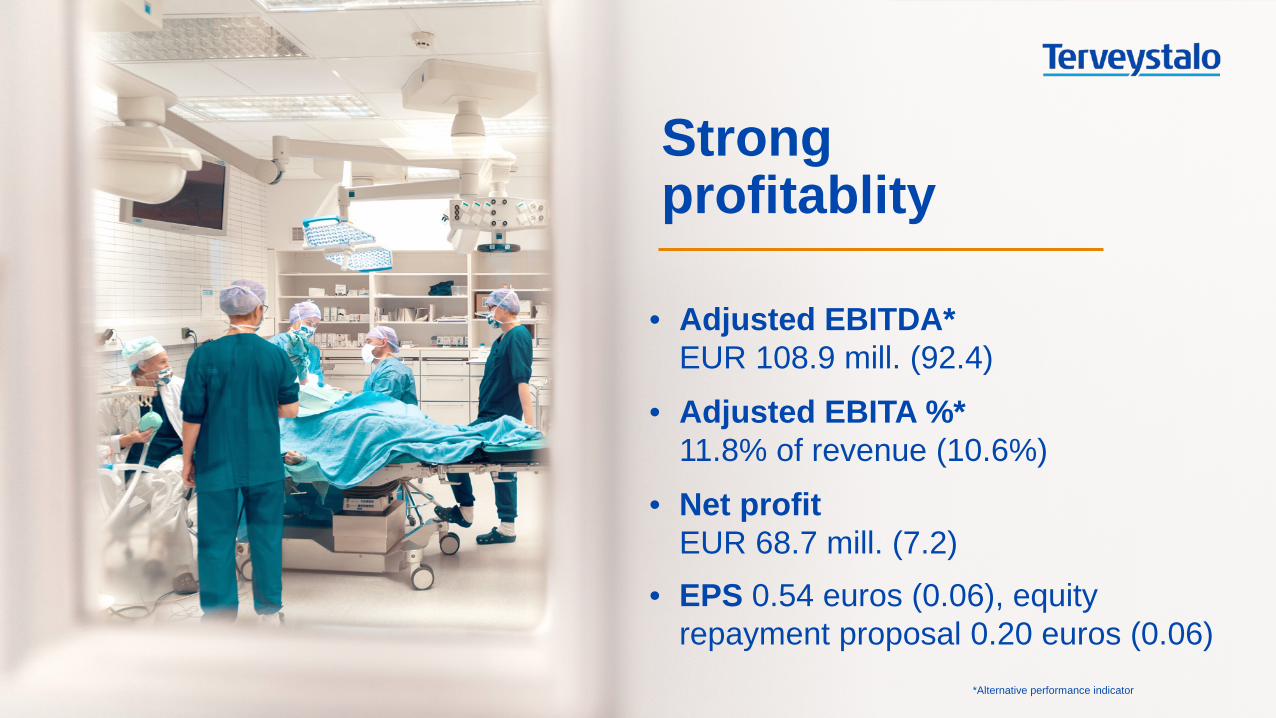
Strong profitablity
• Adjusted EBITDA* EUR 108.9 mill. (92.4)
• Adjusted EBITA %* 11.8% of revenue (10.6%)
• Net profit EUR 68.7 mill. (7.2)
• EPS 0.54 euros (0.06), equity repayment proposal 0.20 euros (0.06)
*Alternative performance indicator
© Terveystalo
Outlook
• Employment and consumer confidence remain at a high level.
• If the health care and social welfare reform is delayed, demand in public outsourcings is expected to grow.
• Should the reform move forward it would enable private service providers to offer publicly funded health center services basically similar to the current services.
• Corporate customers keep up a steady demand, and the relative share of preventive services is increasing.
• Private customer demand remains likewise at a steady level but new capacity on the market decreases Terveystalo’s revenue growth. This capacity growth has reached its peak, however.
11.3.2019 21

terveystalo.com #terveystalo
Q & A

terveystalo.com #terveystalo
FINANCIAL PERFORMANCE
• Steady demand in the corporate and private customer groups. • Increased clinic and hospital capacity in private health care
has created intense competition, especially in Finland’s major cities, with the exception of the Helsinki metropolitan area.
• Significant capacity growth has stalled, however, and the demand for Terveystalo’s services has remained strong.
• The Government proposal on the health care and social welfare reform is still being reviewed by the Constitutional Law Committee.
• If the health care and social welfare reform is delayed, demand in public outsourcings is expected to grow.
• Should the reform move forward it would enable private service providers to offer publicly funded health center services basically similar to the current services.
11.3.2019 24
Market review
© Terveystalo
© Terveystalo
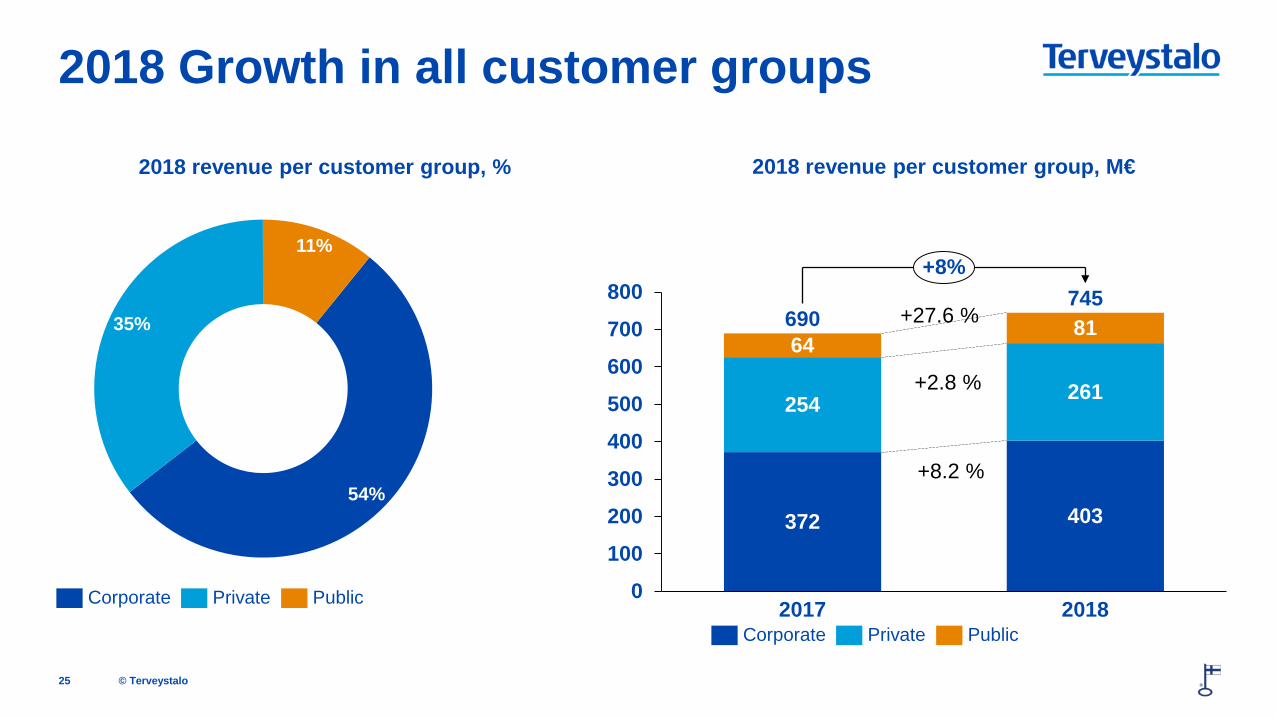
2018 revenue per customer group, M€
25
2018 Growth in all customer groups
372 403
254 261
64 81
0
100
200
300
400
500
600
700
800
2018 2017
690 745
+8%
Corporate Private Public
+27.6 %
+2.8 %
+8.2 % 54%
35%
11%
Corporate Private Public
2018 revenue per customer group, %
© Terveystalo
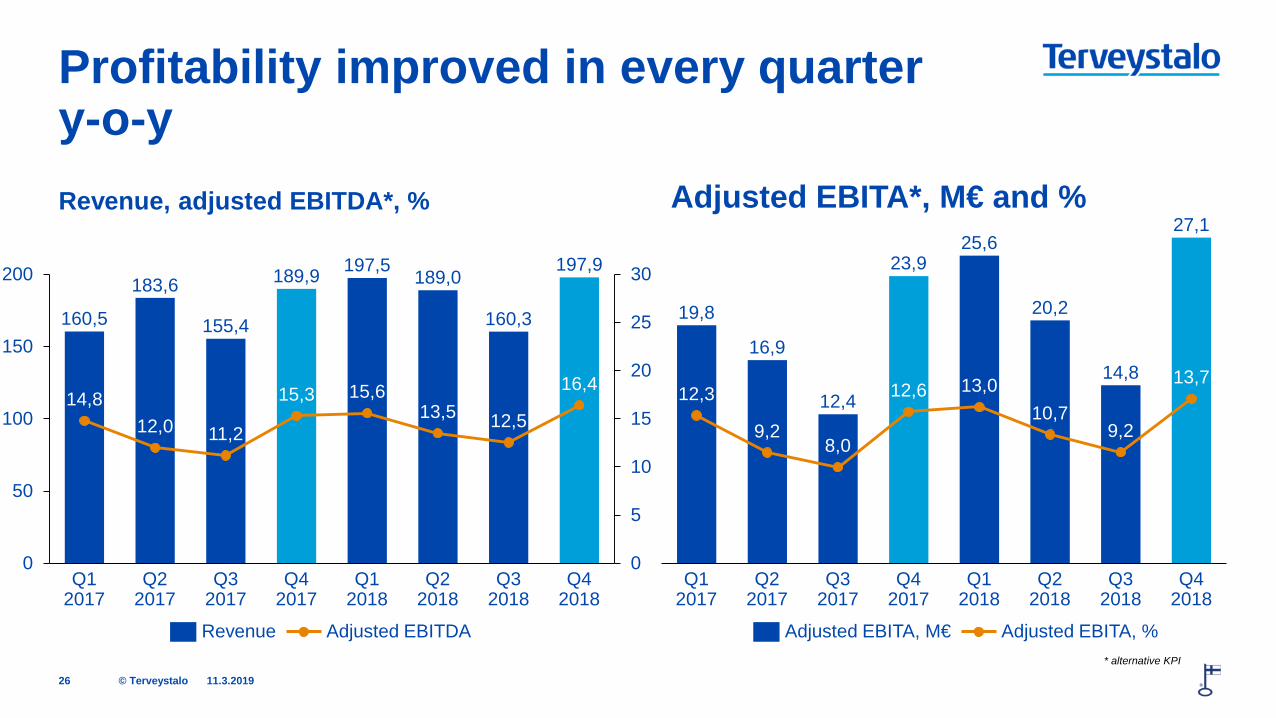
Revenue, adjusted EBITDA*, % Adjusted EBITA*, M€ and %
11.3.2019 26
Profitability improved in every quarter y-o-y
160,5
183,6
155,4
189,9 197,5 189,0
160,3
197,9
14,8 12,0 11,2
15,3 15,6 13,5 12,5
16,4
0
5
10
15
20
25
30
0
50
100
150
200
Q1 2018
Q1 2017
Q4 2017
Q3 2017
Q2 2017
Q4 2018
Q2 2018
Q3 2018
Adjusted EBITDA Revenue
19,8
16,9
12,4
23,9 25,6
20,2
14,8
27,1
12,3
9,2 8,0
12,6 13,0 10,7
9,2
13,7
Q2 2017
Q1 2017
Q3 2017
Q4 2017
Q4 2018
Q2 2018
Q1 2018
Q3 2018
Adjusted EBITA, M€ Adjusted EBITA, % * alternative KPI
© Terveystalo
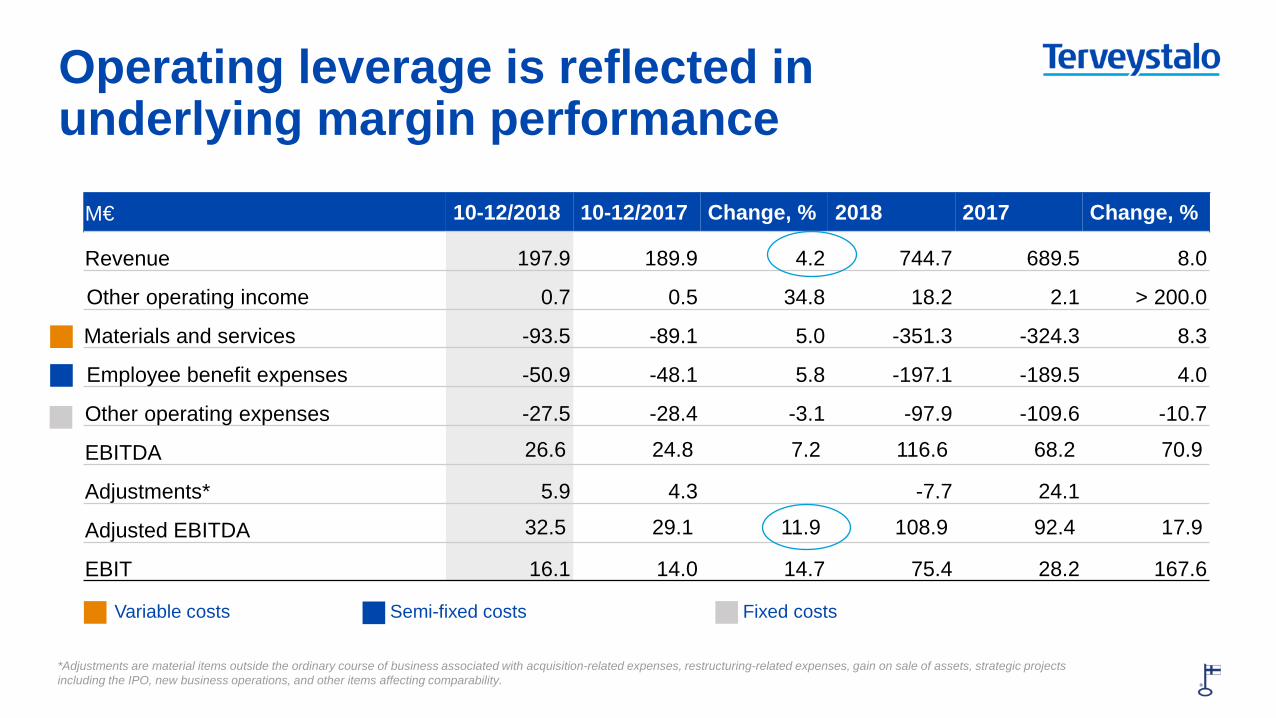
Operating leverage is reflected in underlying margin performance
M€ 10-12/2018 10-12/2017 Change, % 2018 2017 Change, %
Revenue 197.9 189.9 4.2 744.7 689.5 8.0
Other operating income 0.7 0.5 34.8 18.2 2.1 > 200.0
Materials and services -93.5 -89.1 5.0 -351.3 -324.3 8.3
Employee benefit expenses -50.9 -48.1 5.8 -197.1 -189.5 4.0
Other operating expenses -27.5 -28.4 -3.1 -97.9 -109.6 -10.7
EBITDA 26.6 24.8 7.2 116.6 68.2 70.9
Adjustments* 5.9 4.3 -7.7 24.1
Adjusted EBITDA 32.5 29.1 11.9 108.9 92.4 17.9
EBIT 16.1 14.0 14.7 75.4 28.2 167.6
11.3.2019 27 27
Group P&L *Adjustments are material items outside the ordinary course of business associated with acquisition-related expenses, restructuring-related expenses, gain on sale of assets, strategic projects including the IPO, new business operations, and other items affecting comparability.
Variable costs Fixed costs Semi-fixed costs
© Terveystalo
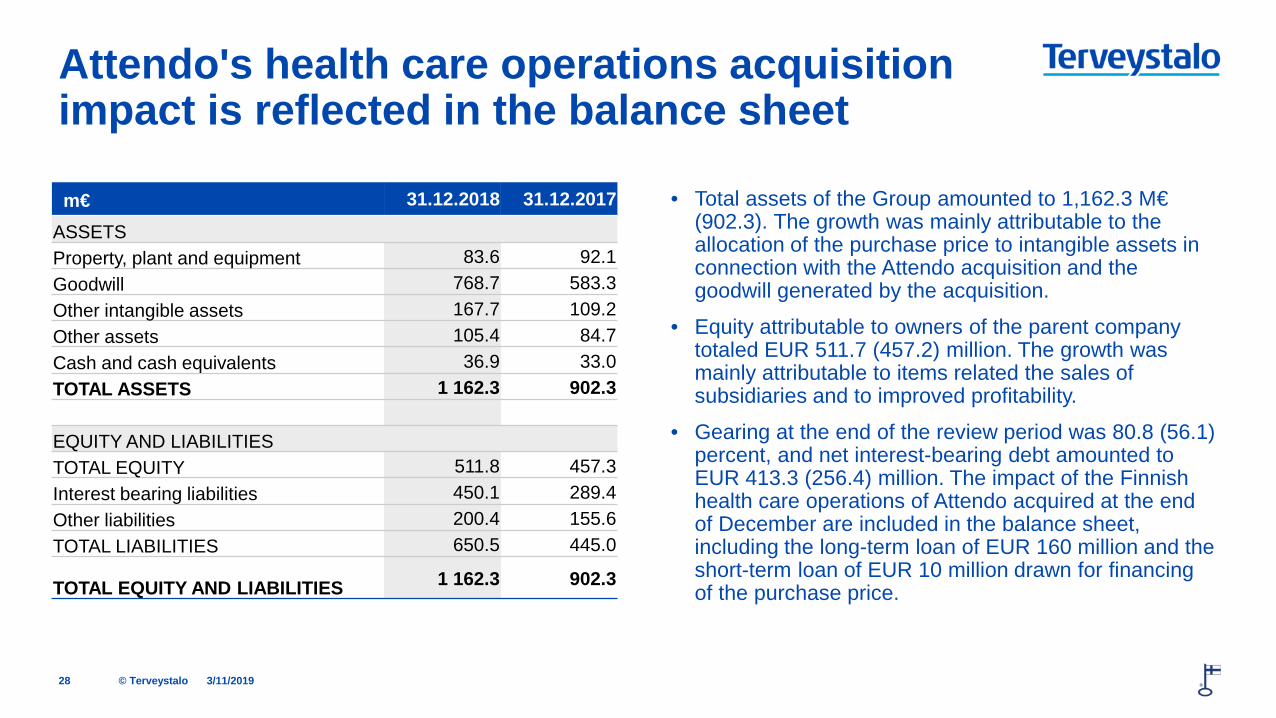
Attendo's health care operations acquisition impact is reflected in the balance sheet
m€ 31.12.2018 31.12.2017
ASSETS Property, plant and equipment 83.6 92.1 Goodwill 768.7 583.3 Other intangible assets 167.7 109.2 Other assets 105.4 84.7 Cash and cash equivalents 36.9 33.0 TOTAL ASSETS 1 162.3 902.3
EQUITY AND LIABILITIES TOTAL EQUITY 511.8 457.3 Interest bearing liabilities 450.1 289.4 Other liabilities 200.4 155.6 TOTAL LIABILITIES 650.5 445.0
TOTAL EQUITY AND LIABILITIES 1 162.3 902.3
• Total assets of the Group amounted to 1,162.3 M€ (902.3). The growth was mainly attributable to the allocation of the purchase price to intangible assets in connection with the Attendo acquisition and the goodwill generated by the acquisition.
• Equity attributable to owners of the parent company totaled EUR 511.7 (457.2) million. The growth was mainly attributable to items related the sales of subsidiaries and to improved profitability.
• Gearing at the end of the review period was 80.8 (56.1) percent, and net interest-bearing debt amounted to EUR 413.3 (256.4) million. The impact of the Finnish health care operations of Attendo acquired at the end of December are included in the balance sheet, including the long-term loan of EUR 160 million and the short-term loan of EUR 10 million drawn for financing of the purchase price.
3/11/2019 28
© Terveystalo
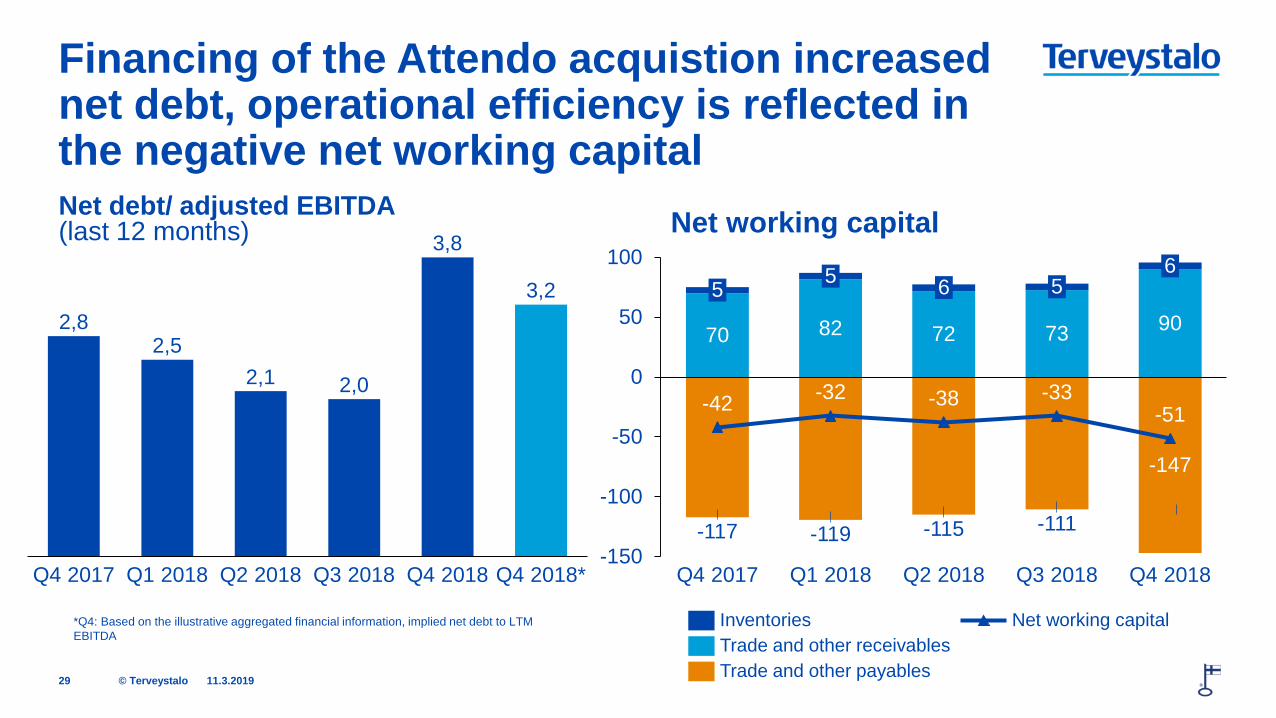
Net debt/ adjusted EBITDA (last 12 months) Net working capital
11.3.2019 29
Financing of the Attendo acquistion increased net debt, operational efficiency is reflected in the negative net working capital
70 82 72 73 90
-117 -119 -115 -111
-147
-42 -32 -38 -33 -51
-150
-100
-50
0
50
1005 5 6
Q4 2017 Q1 2018 Q2 2018
5
Q3 2018
6
Q4 2018
Trade and other payables
Inventories Trade and other receivables
Net working capital *Q4: Based on the illustrative aggregated financial information, implied net debt to LTM EBITDA
2,8 2,5
2,1 2,0
3,8
3,2
Q4 2017 Q1 2018 Q2 2018 Q4 2018 Q3 2018 Q4 2018*
© Terveystalo
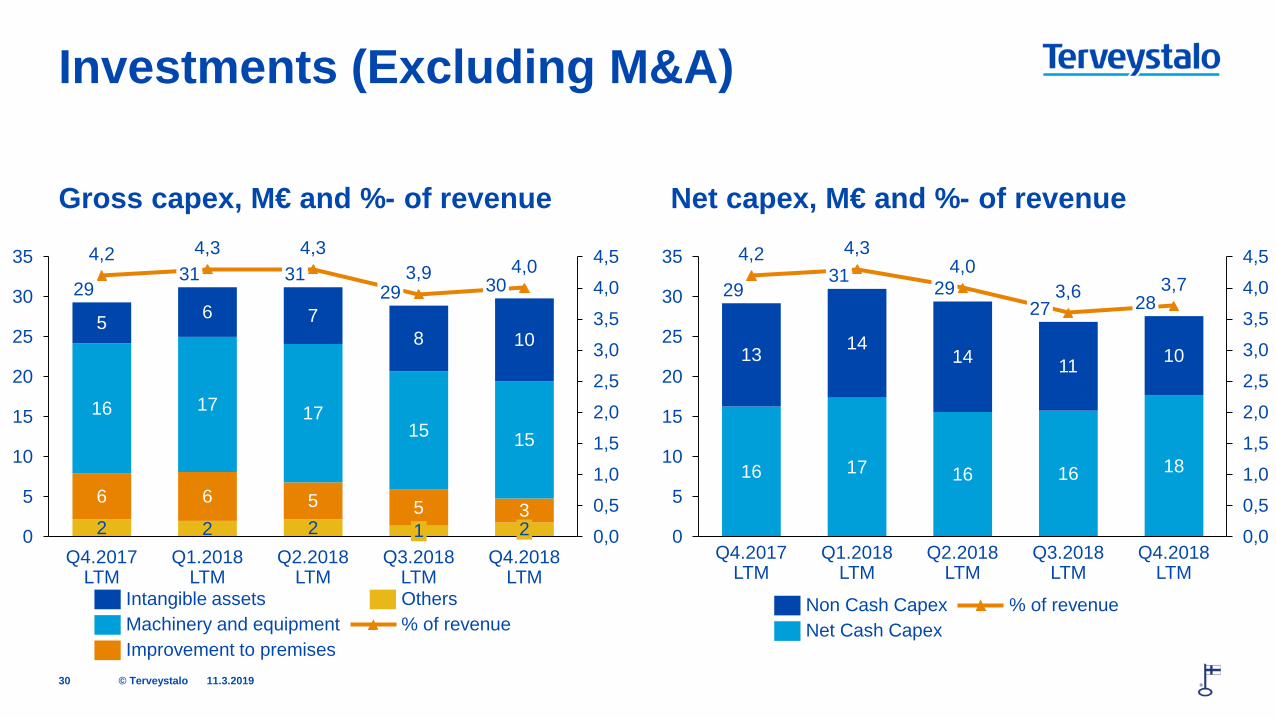
Gross capex, M€ and %- of revenue Net capex, M€ and %- of revenue
11.3.2019 30
Investments (Excluding M&A)
2 2 2
6 6 5 5 3
16 17 17 15 15
5 6 7 8 10
4,2 4,3 4,3 3,9 4,0
0,0
0,5
1,0
1,5
2,0
2,5
3,0
3,5
4,0
4,5
0
5
10
15
20
25
30
35
Q1.2018 LTM
30
Q4.2017 LTM
1 Q2.2018
LTM Q3.2018
LTM
31
2 Q4.2018
LTM
29 31
29
% of revenue Machinery and equipment Intangible assets
Improvement to premises
Others
16 17 16 16 18
13 14 14 11 10
4,2 4,3 4,0
3,6 3,7
0,0
0,5
1,0
1,5
2,0
2,5
3,0
3,5
4,0
4,5
0
5
10
15
20
25
30
35
Q4.2018 LTM
Q4.2017 LTM
Q2.2018 LTM
Q1.2018 LTM
Q3.2018 LTM
29 31
29 27 28
Non Cash Capex Net Cash Capex
% of revenue
© Terveystalo
Q4 FY 2018
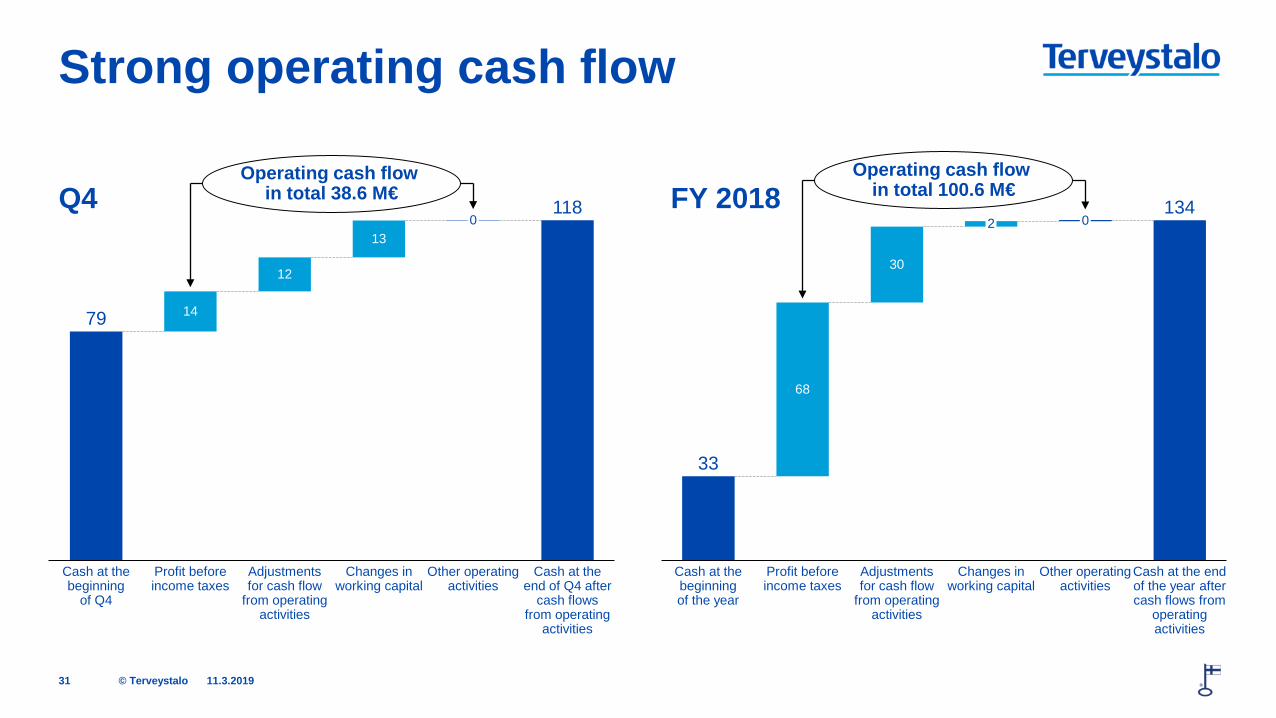
11.3.2019 31
Strong operating cash flow
79
118
14
12
13
Changes in working capital
Profit before income taxes
Cash at the beginning
of Q4
Cash at the end of Q4 after
cash flows from operating
activities
Adjustments for cash flow
from operating activities
0
Other operating activities
Operating cash flow in total 38.6 M€
33
134
68
30
Changes in working capital
Other operating activities
2
Cash at the beginning of the year
Profit before income taxes
Adjustments for cash flow
from operating activities
0
Cash at the end of the year after cash flows from
operating activities
Operating cash flow in total 100.6 M€

© Terveystalo
IFRS 16 Leases – the impact of standard for financial year 2019
11.3.2019 32
• Terveystalo has decided to apply the IFRS 16 using the modified retrospective approach.
• At this moment the estimated preliminary value of the discounted lease liability to be recognized at 1.1.2019 is EUR 202.5 million and the value of right of use asset is respectively EUR 202.5 million based on the lease contracts that are classified under the general requirements of IFRS 16 standard.
• According to the estimated preliminary calculations for financial year 1.1.-31.12.2019 EBITDA will increase EUR 40 million, EBITA will increase EUR 1.2 million and the effect to net profit after recognizing the IFRS 16 financing expenses and deferred taxes will be EUR – 1.8 million.

terveystalo.com #terveystalo
APPENDIX SLIDES
© Terveystalo
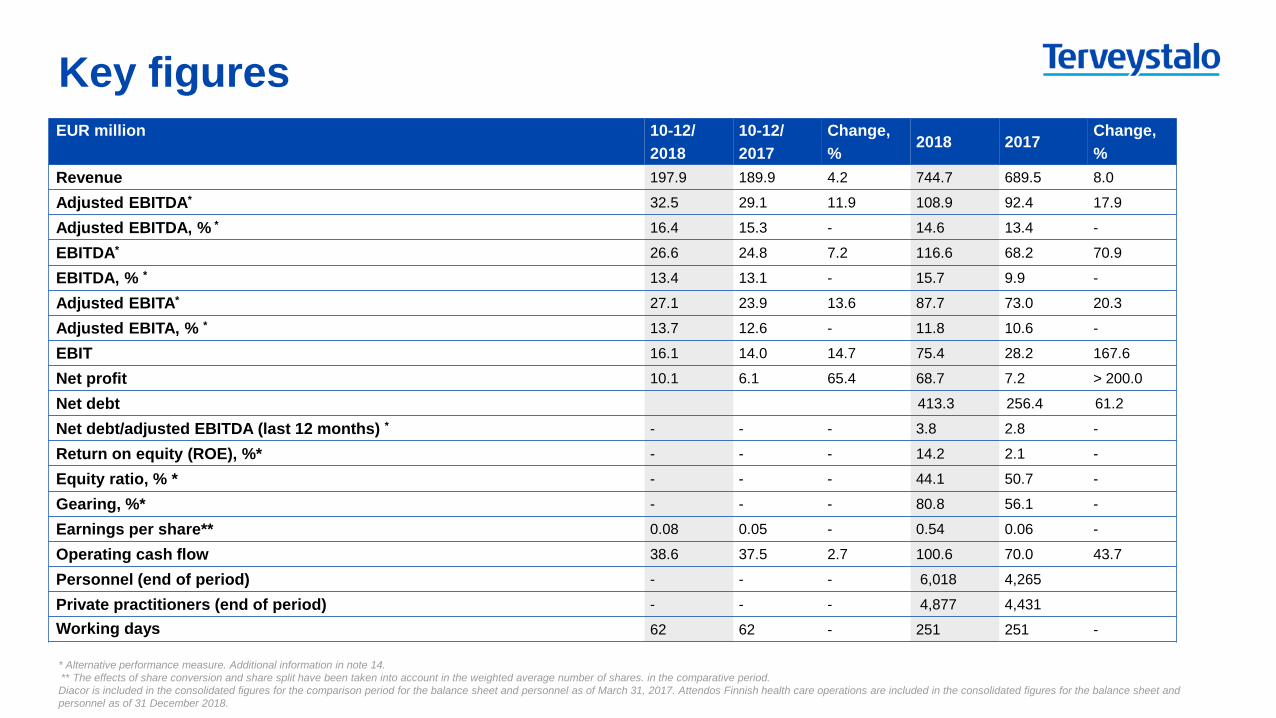
Key figures
3/11/2019 34 * Alternative performance measure. Additional information in note 14. ** The effects of share conversion and share split have been taken into account in the weighted average number of shares. in the comparative period. Diacor is included in the consolidated figures for the comparison period for the balance sheet and personnel as of March 31, 2017. Attendos Finnish health care operations are included in the consolidated figures for the balance sheet and personnel as of 31 December 2018.
EUR million 10-12/ 2018
10-12/ 2017
Change, %
2018 2017 Change, %
Revenue 197.9 189.9 4.2 744.7 689.5 8.0
Adjusted EBITDA* 32.5 29.1 11.9 108.9 92.4 17.9
Adjusted EBITDA, % * 16.4 15.3 - 14.6 13.4 -
EBITDA* 26.6 24.8 7.2 116.6 68.2 70.9
EBITDA, % * 13.4 13.1 - 15.7 9.9 -
Adjusted EBITA* 27.1 23.9 13.6 87.7 73.0 20.3
Adjusted EBITA, % * 13.7 12.6 - 11.8 10.6 -
EBIT 16.1 14.0 14.7 75.4 28.2 167.6
Net profit 10.1 6.1 65.4 68.7 7.2 > 200.0
Net debt 413.3 256.4 61.2
Net debt/adjusted EBITDA (last 12 months) * - - - 3.8 2.8 -
Return on equity (ROE), %* - - - 14.2 2.1 -
Equity ratio, % * - - - 44.1 50.7 -
Gearing, %* - - - 80.8 56.1 -
Earnings per share** 0.08 0.05 - 0.54 0.06 -
Operating cash flow 38.6 37.5 2.7 100.6 70.0 43.7
Personnel (end of period) - - - 6,018 4,265
Private practitioners (end of period) - - - 4,877 4,431
Working days 62 62 - 251 251 -
© Terveystalo
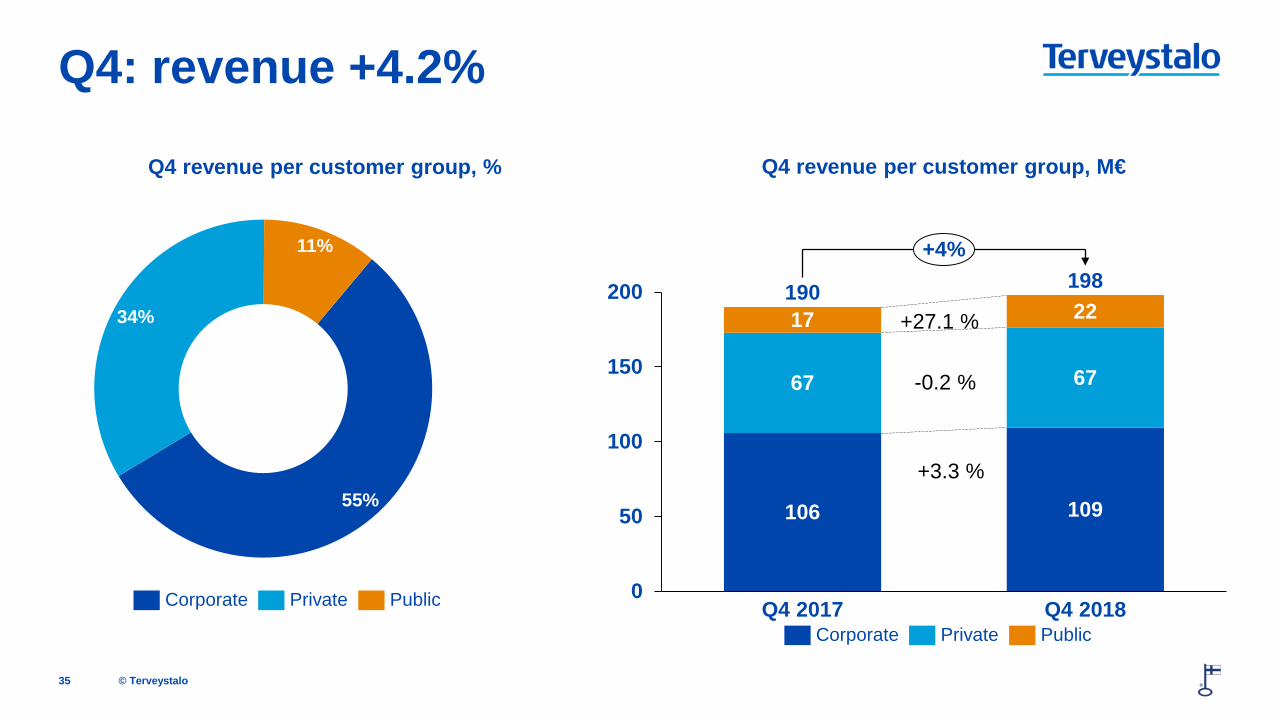
Q4 revenue per customer group, M€
35
Q4: revenue +4.2%
106 109
67 67
17 22
0
50
100
150
200
Q4 2017 Q4 2018
190 198 +4%
Corporate Public Private
+27.1 %
-0.2 %
+3.3 % 55%
34%
11%
Corporate Private Public
Q4 revenue per customer group, %
© Terveystalo
2018 Goodwill Customer relationships
Trademarks Other intangible assets and advances paid
Total
EUR Mill. Acquisition cost 1 Jan 2018 651.3 83.8 82.9 30.0 848.0 Business combination 185.4 65.7 - 2.3 253.4 Additions - - - 10.3 10.3 Reclassifications - - - -0.0 -0.0 Acquisition cost 31 Dec 2018 836.7 149.5 82.9 42.7 1,111.7 Accumulated amortisations and impairment losses 1 Jan 2018 -68.0 -51.3 -16.9 -19.3 -155.5 Amortisation for the reporting period - -10.8 -4.1 -5.0 -19.9 Accumulated amortisations and impairment losses 31 Dec 2018 -68.0 -62.1 -21.0 -24.4 -175.4 Carrying amount 1 Jan 2018 583.3 32.5 66.0 10.7 692.5 Carrying amount 31 Dec 2018 768.7 87.4 61.9 18.4 936.4 2017 Goodwill Customer
relationships Trademarks Other intangible assets and
advances paid Total
EUR Mill.
Acquisition cost 1 Jan 2017 517.1 74.5 83.0 23.7 698.4 Business combination 134.1 9.3 - 1.5 145.0 Additions - - - 5.1 5.1 Disposals - - -0.1 -0.3 -0.5 Acquisition cost 31 Dec 2017 651.3 83.8 82.9 30.0 848.0 Accumulated amortisations and impairment losses 1 Jan 2017 -68.0 -40.9 -12.7 -13.8 -135.3 Amortisation for the reporting period - -10.4 -4.2 -5.1 -19.8 Impairment losses - - - -0.4 -0.4 Accumulated amortisations and impairment losses 31 Dec 2017 -68.0 -51.3 -16.9 -19.3 -155.5 Carrying amount 1 Jan 2017 449.1 33.6 70.3 10.0 563.0 Carrying amount 31 Dec 2017 583.3 32.5 66.0 10.7 692.5
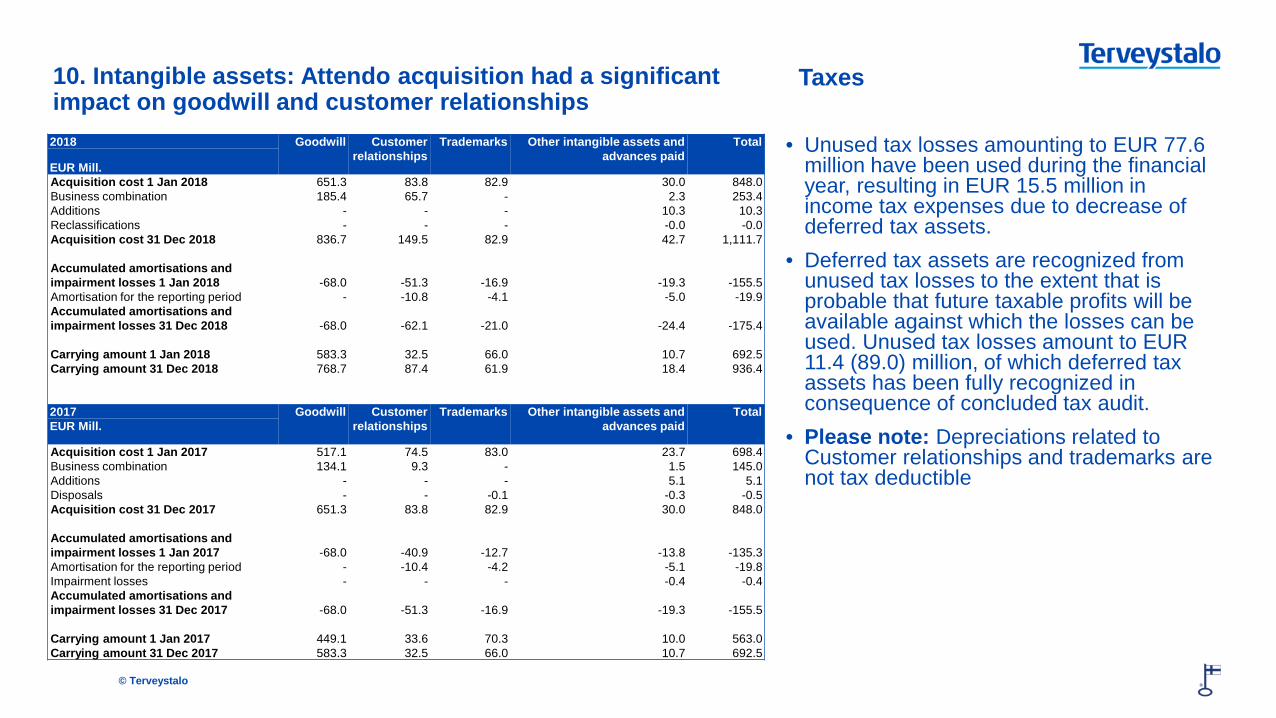
10. Intangible assets: Attendo acquisition had a significant impact on goodwill and customer relationships
Taxes
• Unused tax losses amounting to EUR 77.6 million have been used during the financial year, resulting in EUR 15.5 million in income tax expenses due to decrease of deferred tax assets.
• Deferred tax assets are recognized from unused tax losses to the extent that is probable that future taxable profits will be available against which the losses can be used. Unused tax losses amount to EUR 11.4 (89.0) million, of which deferred tax assets has been fully recognized in consequence of concluded tax audit.
• Please note: Depreciations related to Customer relationships and trademarks are not tax deductible
© Terveystalo
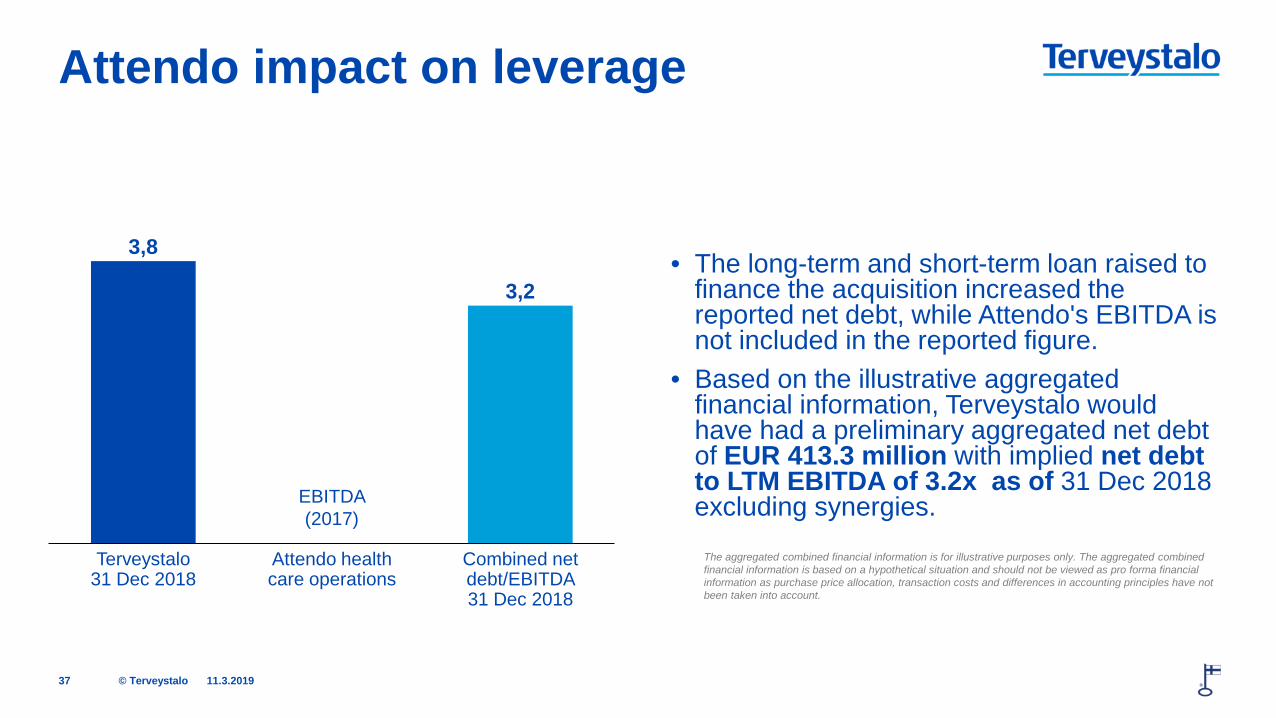
• The long-term and short-term loan raised to finance the acquisition increased the reported net debt, while Attendo's EBITDA is not included in the reported figure.
• Based on the illustrative aggregated financial information, Terveystalo would have had a preliminary aggregated net debt of EUR 413.3 million with implied net debt to LTM EBITDA of 3.2x as of 31 Dec 2018 excluding synergies.
11.3.2019 37
Attendo impact on leverage
The aggregated combined financial information is for illustrative purposes only. The aggregated combined financial information is based on a hypothetical situation and should not be viewed as pro forma financial information as purchase price allocation, transaction costs and differences in accounting principles have not been taken into account.
3,8
3,2
Attendo health care operations
Terveystalo 31 Dec 2018
Combined net debt/EBITDA 31 Dec 2018
EBITDA (2017)
© Terveystalo
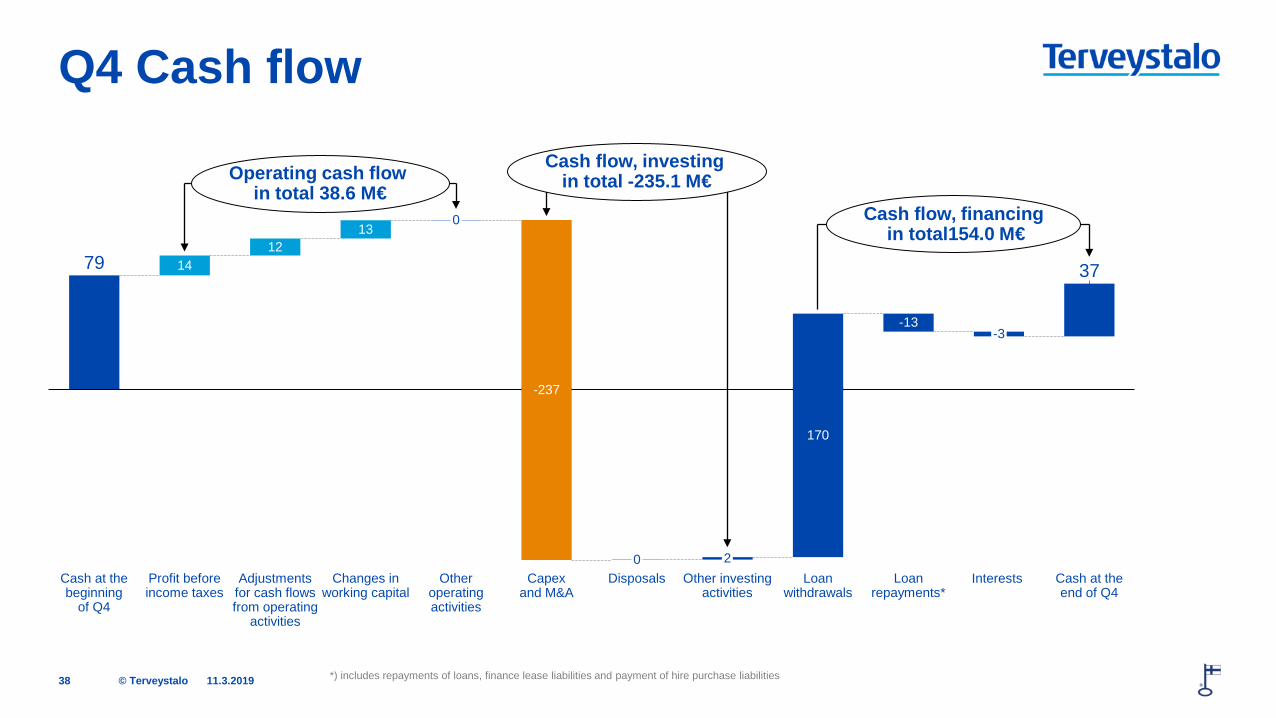
Q4 Cash flow
11.3.2019 38
79 14 12
13
37
-3 -13
Interests Loan withdrawals
Other investing activities
2 0 Cash at the end of Q4
Capex and M&A
-237
170
Other operating activities
Disposals Changes in working capital
0
Adjustments for cash flows from operating
activities
Cash at the beginning
of Q4
Profit before income taxes
Loan repayments*
Operating cash flow in total 38.6 M€
Cash flow, investing in total -235.1 M€
Cash flow, financing in total154.0 M€
*) includes repayments of loans, finance lease liabilities and payment of hire purchase liabilities
© Terveystalo
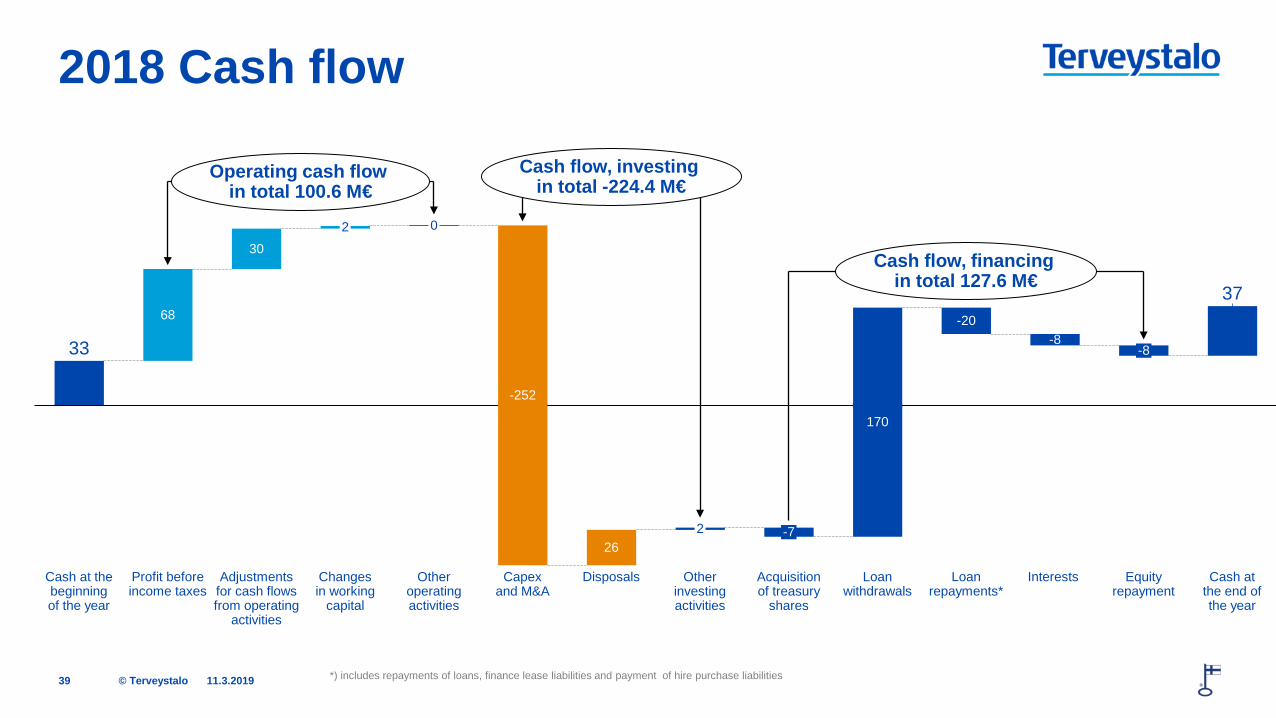
2018 Cash flow
11.3.2019 39
33
68
30
37
0
-252
Capex and M&A
26
170
Other investing activities
Loan withdrawals
-20
Loan repayments*
-8
Interests
-8
Equity repayment
2
Cash at the beginning of the year
Adjustments for cash flows from operating
activities
Profit before income taxes
2
Acquisition of treasury
shares
Changes in working
capital
Disposals
-7
Other operating activities
Cash at the end of the year
Operating cash flow in total 100.6 M€
Cash flow, investing in total -224.4 M€
Cash flow, financing in total 127.6 M€
*) includes repayments of loans, finance lease liabilities and payment of hire purchase liabilities
© Terveystalo
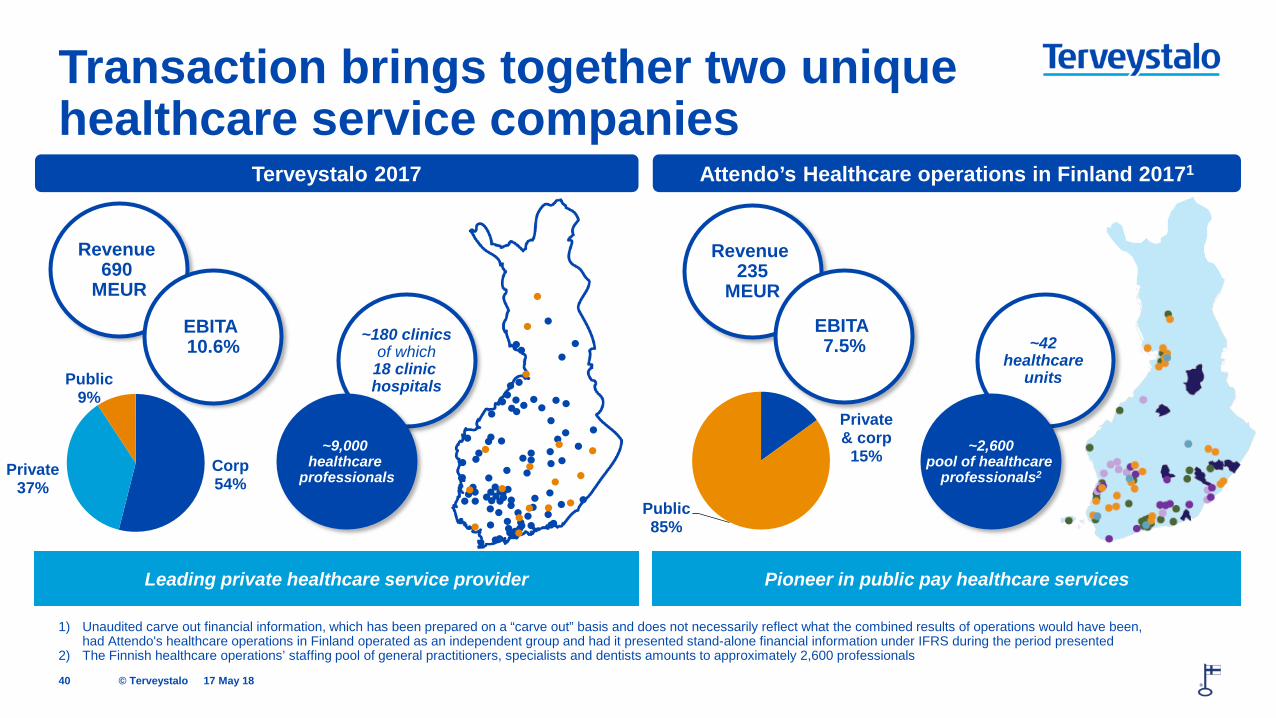
Transaction brings together two unique healthcare service companies
40
1) Unaudited carve out financial information, which has been prepared on a “carve out” basis and does not necessarily reflect what the combined results of operations would have been, had Attendo's healthcare operations in Finland operated as an independent group and had it presented stand-alone financial information under IFRS during the period presented
2) The Finnish healthcare operations’ staffing pool of general practitioners, specialists and dentists amounts to approximately 2,600 professionals
Terveystalo 2017
Corp 54%
Private37%
Public 9%
Revenue 690
MEUR
~180 clinics of which
18 clinic hospitals
~9,000 healthcare
professionals
Revenue 235
MEUR
Attendo’s Healthcare operations in Finland 20171
~42 healthcare
units
~2,600 pool of healthcare
professionals2
Leading private healthcare service provider Pioneer in public pay healthcare services
EBITA 10.6%
EBITA 7.5%
Private & corp
15%
Public 85%
17 May 18
© Terveystalo
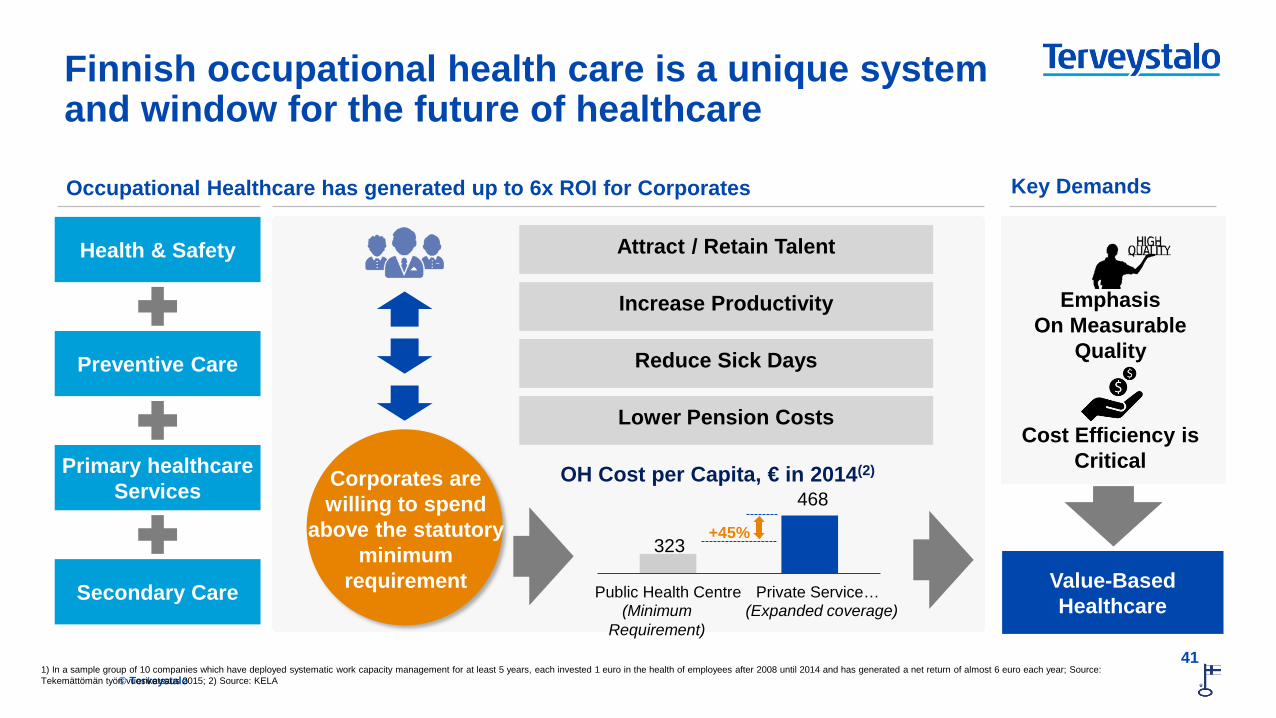
Finnish occupational health care is a unique system and window for the future of healthcare
Attract / Retain Talent
Increase Productivity
Lower Pension Costs
Reduce Sick Days
Value-Based Healthcare
Occupational Healthcare has generated up to 6x ROI for Corporates
Key Demands
Health & Safety
Preventive Care
Primary healthcare Services
Emphasis On Measurable
Quality
Cost Efficiency is Critical
Secondary Care
OH Cost per Capita, € in 2014(2)
323
468
Public Health Centre Private Service…
+45%
(Minimum Requirement)
(Expanded coverage)
Corporates are willing to spend
above the statutory minimum
requirement
41 1) In a sample group of 10 companies which have deployed systematic work capacity management for at least 5 years, each invested 1 euro in the health of employees after 2008 until 2014 and has generated a net return of almost 6 euro each year; Source: Tekemättömän työn vuosikatsaus 2015; 2) Source: KELA
© Terveystalo
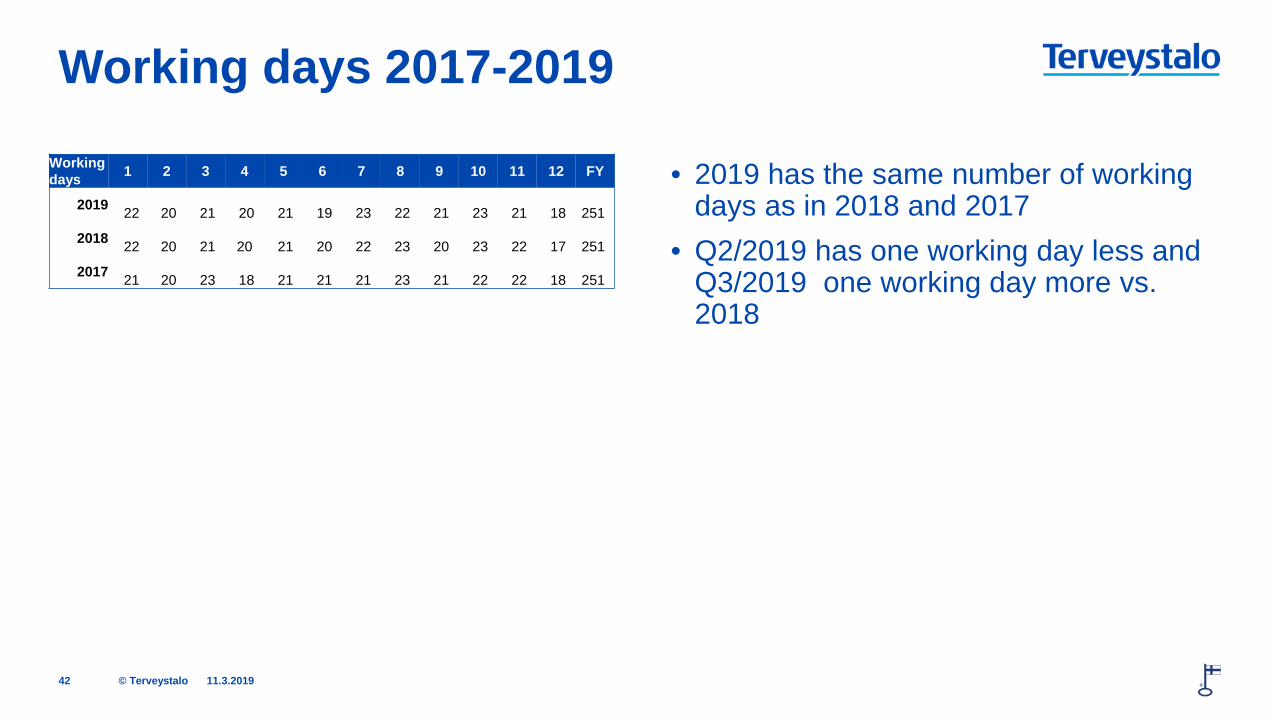
Working days 2017-2019
Working days 1 2 3 4 5 6 7 8 9 10 11 12 FY
2019 22 20
21
20
21
19
23
22
21
23
21
18
251
2018 22 20
21
20
21
20
22
23
20
23
22
17
251
2017 21 20
23
18
21
21
21
23
21
22
22
18
251
• 2019 has the same number of working days as in 2018 and 2017
• Q2/2019 has one working day less and Q3/2019 one working day more vs. 2018
11.3.2019 42

terveystalo.com #terveystalo