Embed Size (px)
Citation preview

TERTIARY ALKYL PRIMARY AMINES AS STABILIZERS FOR MIDDLE DISTILLATE FUELS
Rajiv Banavali and Bharati Chheda, Rohm and Haas Company, Deer Park, Texas 77536
ABSTRACT Degradation of middle distillate fuels under both the prolonged storage and high-temperature thermal stress is of concern. There is a continued challenge in developing stabilizers that are increasingly cost-effective, do not degrade the performance of fuel, and are environmentally acceptable We are interested in developing branched tertiary alkyl primary amines (TAF'A) as multi-functional fuel additives. They are ashless, combustible, and nonextractable stabilizers. The results of stability experiments for thermal and oxidative degradation of various middle distillate fuels (diesel, jet fuel, fuel oil) are presented. The TAF'A individually and in combination with other additives, are evaluated in these stability tests. An attempt is made to form a general interpretation of stabilization mechanisms of TAPA as radical chain breakers, peroxide decomposers, metal deactivators, solubilizers, dispersants, and as acid scavengers.
INTRODUCTION The useful life of fuel is a function of its quality and of storage conditions. Depending on the crude source and amount of cracked fraction, middle distillate fuels can contain very different amounts of gum and color precursors, waxes, aromatics, and other products. Estimated usehl life' of good quality middle distillate fuels, under normal storage conditions, varies from about 1 year for Diesel and Heating fuel to 3-4 years for Jet fuels. However, fuels are often stored for much longer periods because of logistical and economic necessities. This is particularly so for military use where it is necessary that the fuel quality remains fit for use throughout the storage period. Both the low-temperature storage and high-temperature thermal degradation, are of concern. There may be a relationship between the chemistry of deposit formation during normal long term storage and the deposits obtained by thermal stressing ofjet fuel.
Fuels containing higher amounts of olefins, certain nitrogen and sulfur compounds, organic acids, or dissolved metals are likely to degrade more and faster. Sediments and gums which result from the oxidation reactions act to block filters and deposit on surfaces. The progressive lowering of sulfur levels has greatly reduced the instability of diesel. On the other hand, potential new problems resulting from increased processing and the resultant removal of natural antioxidants has occurred. Additionally, to meet increasing demands for fuels, refiners have turned to blending significant proportions of cracked stock as middle distillate fuel extenders. The cracking process produces components of lower stability than straight-run distillates,
Hydrotreating is generally considered the most effective means of improving the stability. However, often the cost of stability improvement by additives doping can be less than the hydrotreatment costs. Demand for additives in these markets is projected (The Freedonia Group estimate) to increase nearly 15% a year to $350 million in 1998. The stability enhancing additives for middle distillate fuels include hindered phenols (jet fuels), phenylenediamines, tertiary amines, metal deactivators and dispersants. Tertiary amines are generally considered* better than secondary or primary amines as fuel antioxidants.
Phenylenediamine type antioxidants are more effective than hindered phenols in neutralizing peroxides. Research' on peroxide formation in several diesel fuels found that low sulfur and aromatics content fuels (Swedish fuels) are likely to form more peroxides upon aging. It was found that traditional amine stabilizers fail to control peroxide formation adequately. Also, these amines, while being more effective than hindered phenols in gasoline, are not being used in diesel because they degrade distillate fuel stability.jb Phenylenediamines have been shown to participate in side reactions forming sediments" and increasing color body formation.3E
Primary amines have not received much attention as fuel stabilizers because they are not considered as good radicallperoxide quenchers as secondary or tertiary amines. This is true for typical straight-chain fatty amines. However, we are mainly interested in a special class of primary amines that possess branched alkyl chains with the primary amino group attached to a tertiary carbon. We will refer to these as tertiary alkyl primary amines (TAF'A).4 This feature of having a tertiary carbon attached to nitrogen is very beneficial because it imparts important

characteristics' to these amines The structural differences between fatty and TAPA amines are illustrated in the following figure.
1-Octylarnine n - 0 c t v l a m i n e en
l t rogen
Branched tertiary alkyl primary amines possess6 excellent oil solubility, thermal and oxidative stability, strong basicity, and fluidity over a wide temperature range. These properties make them well suited for enhancing the performance of petroleum fluids' as well as lubricants.' The fact that there are no a-hydrogens attached to nitrogen gives TAPA better oxidative stability because this weak C-H bond is most prone to oxidation. The lack of a-hydrogens also ensures that unstable imines are not formed which can deaminate in the presence of water. This makes TAPA oxidatively more stable than their corresponding linear amines. The fact that TAF'A can be used as fuel stabilizers, and are better than normal primary amines, was first shown in 1960.9 We will describe the work carried out at Rohm and Haas research laboratories with TAPA, individually and in combination with other additives, for their ability to stabilize middle distillates.
EXPERIMENTAL Fresh test fuels without any additives were obtained from commercial sources. The fuel samples were analyzed to ensure conformace with specifications and stored under ambient temperature, in dark, and under nitrogen atmosphere. All tests were started within a month of obtaining the fresh samples. All commercial additives used were as received without further purifications. All the C8, C12, and C18 TAPA samples were commercial products sold under the trademark Primene by Rohm and Haas company. The details ofthe stability test methods are given below.
I. Furnace Oil Stability Test: Fuel samples of 500 mL were stored in 600 mL beakers covered with watch glasses in oven at 40°C At arbitrary intervals, optical density measurements were made on samples bcfore and after filtering a small portion of vigorously shaken sample through a CORNING 30 F fritted glass crucible. The unused portion was immediately returned to the oven for further aging. The failure time was determined by three methods: I ) the number of days to a stated level of optical density difference (A OD) of 0.12 between unfiltered portions, 2) days to reach an OD value of 1.00 for the untiltered sample, and 3) days to reach a residue level of 2.0 mg/100 mL as determined by filtration. The data is given in Table I.
II. Fuel Oil No. 2 Stability Test: A 50 mL sample of fuel oil in a test tube is stored in a 300'C bath for 90 minutes. M e r removal from the bath it is allowed to cool to room temperature (about 2 hr.). The aged fuel is then filtered through 4.25 cm Whatman No 1 filter paper. The paper is then washed with heptane and the color of the filter paper is compared to a set of standards ( I = No color, 20 = dark brown). A color of 7 or less is considered acceptable. The data is given in Table 11.
tU. Modified ASTM 2274 Diesel Oxidation Stability. A 350 mL sample of fuel is heated at 95°C for 16 hr. (or 40 hr.) while oxygen is bubbled through at the rate of 3 liters per hour. M e r aging, the sample is cooled to room temperature and filtered to obtain the filterable insoluble quantity. Adherent insolubles are then removed from the associated glassware with trisolvent (TAM). The TAM is then evaporated to obtain the adherent insolubles. The sum of filterable and adherent insolubles, expressed as milligrams per 100 mL., is reported as total insolubles. The data is given in Table 111.
IV. Thermal Oxidation Stability of Jet Fuels (JRTOT): 600 mL of test fuel is pumped at a rate of 3 mL/min through an aluminum heater tube(JFT0T apparatus) at 260°C (or 325'C) for 150 minutes, and passed through a 17 pm SS filter. The essential data derived is the amount of deposits on the heater tube, and the rate of plugging of the filter(pressure drop). The deposits on the heater tube are rated by the ASTM Color Standard. The data is given in Table IV.
RESULTS AND DISCUSSION The results of the various stability tests as measured by color, sediments and gum formation show clearly that addition of TAPA, at few ppm levels, significantly improves the stability of fuel oils and diesel. Table I shows that the stability of catalytically cracked furnace oil can be improved by C,z TAPA doping at 30 ppm. Several commercial fuel stabilizers at the same dosage level show similar or worse performance. Similar behavior is noted for the No. 2 fuel oil stability. The data
185

9 that TAPA are equal or better stabilizers is also seen in comparative experiments with'two commercial additives. The fuel oil stability results using the Clz TAPA in combination with a dispersant and/or a metal deactivator show that the performance over the TAPA alone is not significantly improved. Oxidative stability of diesel fuel was studied on fuel samples cokcted from three major regions around the world; namely, North America, Latin America, and Asia. Once again, improvement in the oxidative stability is obvious with the addition of 30 ppm of TAPA. The diesel data, in addition, shows the differences in activity of various TAF'A additives. This data allows both dosage and structure-activity relationships establishment. Furthermore, JFTOT tests with TAF'A show improvement in thermal stability benefit. Particularly noteworthy is the effect seen at 325 "C heat exposure. This is significantly higher exposure than the traditional 260 "C tests. This result is not only supportive of TAF'A benefit,, but important in light of the current need to develop aircraft fuels which can operate under supercritical conditions.
Several chemistries may contribute to fuel stabilization. Antioxidants act to inhibit the reactions that form sediment. Most additives control peroxide formation, but do not curb formation of polymerized gum products. Dispersants act to suspend any sediment particles that form and prevent them from agglomerating and becoming a problem. The sediment and gum formation mechanisms have been studied in great detailsL1' and can be summarized' as. acid-base reactions involving N, 0, and S species, free radical induced polymerization reactions involving unsaturated hydrocarbons, and esterification reactions involving aromatic and heterocyclic species. The mechanism by which TAPA act as antioxidants is not completely understood, but an attempt is made here to form a general interpretation of their stabilization mechanisms. The additive concentration and structure effect suggest that the stabilization properties of TAF'A result from factors such as radical scavenging, acid scavenging, hydroperoxide decomposition, metal deactivation, dispersing of gums and particulates, or any combination of these factors.
CHAIN BREAKING MECHANISMS Hindered phenols and aromatic amines are considered radical chain breakers. The chain carrying peroxy radical is scavenged by the phenol or amine by hydrogen atom donation. The resulting radicals are resonance stabilized and are eventually destroyed by reaction with another peroxy radical. Hindered amines can also react with free radicals to form stable intermediates that do not readily take part in chain reactions. Although they are not as resonance stabilized, they can regenerate by scavenging another hydrogen radical.
REDUCTION OF PEROXIDES AND HYDROPEROXIDES Amines in general, and tertiary amines in particular, are well known peroxide decomposers. The catalytic efficiency of the amines generally correlate with their ionization potentials. This correlation supports the mechanistic interpretation that a charge transfer complex between the amine and the peroxide weakens the 0-0 bond. Quenching by amines is also subject to steric effects.
METAL DEACTIVATORS It is anticipated that middle distillates will have a higher metal content" than gasoline, and the content increases with increasing metal contents of the crude. Complexes of Fe, Mn, Co, and Ni, when solubilized as fuel soluble salts, are all known to be oxidation catalysts and are present in most middle distillate fuels in trace amounts. These metals will promote oxidation of the fuel with subsequent gum formation and deposit build-up. The MDA is believed to form a caged complex with dissolved metal salts(especial1y copper) that is generally less active as an oxidation catalyst than the free metal itself TAPA can also effectively chelate these metal atoms. Molecular modeling shows that the resulting complexes can effectively shield the metal atoms thereby reducing their ability to catalyze degradative reactions. The TAF'A also migrate to new surfaces,
ng the formation of soluble metal salts. Their filming action can also lead to protection of metal surfaces and thus inhibiting metal ions solubilization,
SOLUBILIZATION AND DISPERSANCY For a good stabilizer, it is important not only to mitigate the oxidative process, but also to help resolve problems caused by them. TAPA act by forming fuel soluble salts with acidic by-products of oxidation. Furthermore, their complexation with metals and other species allows suspension of gums and particles. The role of TAPA in minimizing gums and sediment formation by ''solvating ability"of the branched alkyl chains of TAPA is also likely. By keeping the sediment particles from agglomerating they can be kept small enough to be dispersed through the fuel filters. Despite their dispersant action they are unlike many additives that cause emulsions when fuels containing them mix with water. In fact, they also act as demulsifiers and provide another benefit to the fuel storage.
,
786
ACID SCAVENGERS Hazelett has shown’* the correlation of carboxylic and sulfonic acids in increasing deposit formation. The reaction of certain acidic compounds, such as naphthalene sulfonic acid, with nitrogen compounds, such as indoles, quinolines, and carbazoles, appears to be one of the mechanisms for fuel insolubles formation. Dodecylbenzenesulfonic acid promotes sediment formation and also may get incorporated into the sediment. Tertiary amines were shown” to be effective in reducing deposits in fuel blends containing acids. For weak acids, the amines exhibit more than 1: 1 action and certain amines exert favorable behavior only if they are strong organic bases. TAPA are strong bases” and can readily react with acidic species, sacrificing themselves to form salts that are miscible in these liquids and thus do not precipitate
CONCLUSIONS We have shown that Fuel deterioration is delayed, color degradation is inhibited and sludge formation is reduced by addition of TAPA to the middle distillate fuels. The tertiary alkyl primary amines are highly effective stabilizers for the prevention of sludge formation in fuel oils and diesel and their effectiveness depends on the structure of the amine. They inhibit the reactions responsible for sludge formation and also disperse the gum and sediment from depositing. They also improve the thermal stability of jet fuels. In addition, these amines are also ashless and completely combustible. They are virtually insoluble in water and are not leached from fuels by contact with water during storage and handling. Additionally, they do contribute beneficially to other fuel properties. Corrosion inhibition is another benefit that can be obtained by the use of TAF’A. Water contained within fuel, or permeating from external sources, combines with air to attack iron to form rust. This can be prevented by protecting metallic surfaces with an additive film by using TAPA or their salts. The polar portion of the molecule adheres to the metal surface and forms the protective film.
’
ACKNOWLEDGMENTS We would like to thank Rohm and Haas company for providing the support for this work and permission to publish the results.
REFERENCES Chevron USA Inc.; Long-Term Fuel Storage Technical Bulletin, 1981
Beaver, B.; Fuel Science And Technology Intl., 1992, lo(]), 1.
a)Bart, R. J.; Henry, C. P.; Whitesmith, P. R.; Proceedings of the 5th International Conference on Long Term Storage Stability of Liquid Fuels, 1995; Eds.; Giles, H. N.; National Technical Information Service, Springfield, Va, Vol. 2, 761. b)Hazlett, R. N.; Hardy, D. R.; NRL Letter Report 6180-832, Naval Research Laboratory, Washington, DC, 1984. c)Henry, C.; Proceedings of the 2nd Intl Conf on Long Term Storage Stabilities of LiquidFuels, Stavinova, L L.; Ed.; SWRI, San Antonio, TX; 1986, p 807.
These TAPA are commercially available from R o h and Haas Company as Primene@ Amines. The C-8 is available as Primenem TOA, C-12 as Primenem 81-R and C-18 as Primene@ JM-T.
Banavali, R.; Ellis, M. J.; Piccolini, R. J., Resin Review, Rohm and Haas, Philadelphia, Pa, 1993, XLIII, 1, 13.
Banavali, R.; Chheda, B.; In International Symposium on Production and Application of Lube Base Stocks, Singh, H.; Prasada Rao, T.S. R.; Eds.,Tata McGraw-Hill, New Delhi, 1994; p 318.
Banavali, R.; Chheda, B.; Uhran, J.; In ZndBrarilian Symposium on Lubricants, Instituto Brasileiro de Petroleo, 1995, p 1
Banavali, R.; Karki, S. B.; Prepr. Pap.- Am. chem. SOC. Div. Of Pet. Chem., 1997, 42(1), p 232.
H. J. Andress, Jr., Mobil Oil Co., U.S. Patent # 2 945 749, 1960
Mushrush, G. W.; Speight, J . G.; In “Petroleum Products: Instability and Incompatibility”, Taylor and Francis, Washington, DC; 1995.11) Woodle, R. A,; Chandler, W. B.; Ind Eng. Chem., 44(1 l), 2591, 1952.
Hazlett, R. N.; Fuel Science and Technology, 6(2), 185,1988
Rohm and Haas Research Laboratory Unpublished Data

TABLES Table I. Fuel Oil Stability Test (Catalytically Cracked Furnace Oil)
Table 11. Accelerated Storage Stability Tests P o . 2 Fuel Oil)
Additive I Dosage I Louisiana Sample I Mid-West Sample I
Table 111. Oxidative stability Results Using ASTM 2274 Test Method(Diese1)
Insolubles mg/100 mL Additives I Dosage (ppm) I Gulf Coast I LAR Sample I Asian Sample I Gulf Coast
Table IV. Thermal Oxidation Stability Using (JIVOT) ASTM -D 3241(Jet Fuel)

COMPUTER SIMULATION OF HIGH PRESSURE SLUDGE LIQUEFACTION REACTOR
Sung-Chul Yi’ , Sung-Yeol Bael, Ho-Tae Lee’, and Wang-Lai Yoon’
1. Department of Chemical Engineering, Hanyang University, Seoul, Korea 2. Korea Institute of Energy Research, Daejun, Korea
Keywords:
INTRODUCTION The increasing population of municipal area and the improved activity of the economy are causing more polluted water in streams. However, the public demand more action on the environmental protection, resulting in more than 70% treatment of total sewage/waste water in 1997. The volume of sludge from the sewage/waste water treatment plants is increasing and it is expected to be 8000 ton per day in 1997. Seventy to eighty percent of water content in the sludge makes landfill of sludge an ineffective way of treating sludge. Thus, the development of sludge treatment technologies is inevitable in the direction of reducing water content of sludge to prevent odor generation and to reduce the leaching of heavy metal in some area.
Overall objective of this research is to develop a sludge treatment technology to recover organic portion of sludge as a fuel oil using a high pressure liquefaction technique. The result would be the reduction of the volume and the weight of sludge to be land filled while generating useful energy from wastes. A bench scale liquefaction process has been operated for several months and the scale up process is underway.
The detailed understanding of the behavior of a high pressure sludge reactor during transient operation is crucial to the design of scale up process.
THEORETICAL FOUNDATION OF THE MODEL Nature of the Analysis The starting point of the present analysis is the set of elliptic partial-differential equations that express the conservation of mass, momentum and energy in two-dimensional transient non- Newtonian flow.
These equations are reduced to finite-difference equations exhibiting ‘upwind’ formulation of the coefficients over a grid that covers the domain of interest. Appropriate boundary conditions are supplied to the procedure which is incorporated into a computer program. The computation is a set of grid-node values for the velocity components, pressure, and temperature.
Differential Equations All dependent variables such as velocity components in two dimensions and energy, with the exception of pressure, appear as the subjects of differential ‘conservation’ equations. Although these equations are deduced from physical principles, they are all expressed in a standard form, in which
mathematical model, sewage/waste water sludge, high pressure liquefaction
stands for a generic fluid property [ 1,2].
d i v { ( p ~ D + J,)} = S, (1) where p, u, J0,Sm are density, velocity vector, diffusive-flux vector and source rate per unit volume.
The pressure variable is associated with the continuity equation:
in anticipation of the so-called pressure correction equation [ I ] which is deduced from the finite- difference form of the continuity equation.
div(pu) = 0 (2)
The diffusive flux J,I, is given by: J , = -r,gUd@ where r0 denotes the effective exchange coefficient of @
(3)
DETAILS OF COMPUTATIONS PERFORMED Outline Because of the exploratory nature of the computations, simplifications in the modeling of the reactor have been introduced. These simplifications include the treatment of the problem as two-dimensional, ai-symmetric reactor. A coarse-grid, consisting of 84 x 18 control cells, has been chosen, and grid-spacing is such as to model the geometric features as accurately as
I 8 9

possible shown in Fig. 1
@jal and B 0 ~ d - q C&@tjons To complete the mathematical analysis, it is necessary to provide initial and boundary conditions. For the typical reactor problem illustrated in Fig. 2, these conditions are as follows:
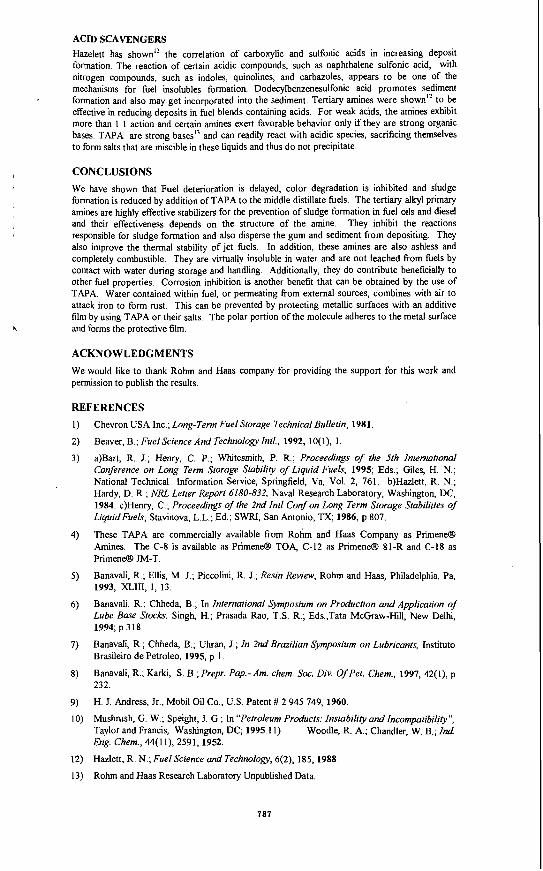
At the inlet to the reactor, mass flux of sludge and temperature are prescribed; the momentum flux at the inlet is computed from the prescribed mass flux and the known area. Temperature is defined with respect to incoming sludge and is therefore set equal to room temperature. Table 1 shows the inlet velocities based on the various speed of pump strokes. At the reactor wall, the non-slip condition is used for velocity components parallel to the wall. Thermal boundary conditions on reactor wall can be modeled with specified temperatures due to three zone heaters around the wall.
Physical Properties Physical properties of sludge (thermal conductivity, heat capacity, density) assumed 'same as those of water since sludge contains 80 - 90% of water. Unreacted raw sludge behaves as a highly non-Newtonian flow. However, when heated in the reactor vessel, it quickly turns Newtonian flow.
The Solution. Procedure The procedure adopted for the solution of the equations is the SIMPLE algorithm[l]. reader is directed to the above reference for further details.
Viscosity of the sludge is assumed to be a function of temperature.
The
PRESENTATION OF THE RESULTS Many results were obtained during the present study but space considerations dictate that only a part of these can be presented. Representative sample predictions for two cases are shown in Figs. 3 and 4, mainly in the form of maps of temperature distributions. Fig. 5 is the streamline contours.
DISCUSSION OF RESULS The coarseness of the finite-difference grid used does not allow the results to be quantified in detail. It does allow, however, the description of their qualitative nature, and the study of the relative differences coming from changes to design conditions.
Table 2 shows experimental conditions such as reaction time and a temperature at each zone for runs performed.
The temperature distribution across the reactor is presented in Figs. 3 and 4 at 5 , 15, and 30 minutes for Cases 1 and 8. It can be seen that first section of the reactor could serve as a preheating zone. Since the temperature development through the reactor is strongly affected by the second and third heaters as well as the sludge residence time, these variables should be optimized to minimize coking phenomena on the reactor wall. Fig. 5 is the streamlines which represent the flow field of the fluid in the reactor. Due to the highly viscous of initial sludge condition the inlet velocity to the reactor is quite slow, eddies caused by sudden expansion do not appear. The predicted average outlet temperature and the outlet temperature experimentally obtained are shown in Table 2. Predicted outlet temperatures was 15 - 20 %higher than experimental outlet temperature. This is due to the sludge cokes formed on inner reactor wall which inhibits a heat transfer from the wall.
This allows the simple design of reactor is feasible.
CONCLUSIONS A numerical modeling approach is developed for prediction of transport phenomena in the high pressure sludge reactor using the operation parameters of the laboratory scaled continuous process. The heat transfer phenomena in the reactor was reasonably predicted and will be better predicted including the sludge coking effect. The computer modeling tools are based on a computational fluid dynamics code developed in our laboratory.
Although the test cases considered in this paper are rather limited, the computer program can handle more complicated situations and serve as a useful design guide.
REFERENCES [ I ] Spalding, D.B., Recent Advances in Numerical Methods of Fluids, 1 (1980) [2] Yasuda, Y., Water Science and Technology, 23 (1991)
190
0.01242
20 40 1406 0.00933
30 30 1070 0.00710
Case I.
Case 8.
Experimental outlet temperature
382 K deg
404 K deg
Predicted outlet temperature
446. I3 K deg
482.63 K deg
Figure 1. The sludge reactor considered and its finite difference representation
791

Figure 2. Schematic of sludge reactor
W U F E D C B A W
T M P
11)BB75 48575 431.825 e 7 . 5 *s375 43825 4241 a +I DBm JB6874 S2748
Jbum MUS74 S 2 B W 31 21 2*
se,m
(a) Time = 5 min Lmsl TEMP
F w 0 7 5 e 4 5 7 5 D 431.825 c 467.5 E 45ssn
0 4251125 A 4 8 2 5
(b)Time = 15 min
Lmu TEMP
( c ) Time = Steady
3BD75 40575 431.825 u17.5 45s375 43825 4251 25 41 I SUB75 1275 SBhB25 sM5 WU375 32625 31 21 a
Figure 3. The maps of temperature for casel.
792

W E F E 0 c
A B
n
I \ iir -1 I
(a) Time = 5 min
(b) Time = IS min
TBAP
56858 512125 5n*w 97.25 4&112 472315 454837
428082
S51W 587.748
SZt.74 S l Y Y
437.4~3
4~2824
~58312
LSM TEMP
F 566858 E J2125 0 , X 4 E W C 507.25 8 408012
8 +%BY
7 4 2 m m E 42824 5 5851w 4 587.748 3 S5611312 2 P28H 1 %MY
A 472375
8 437.4~8
LBIE TBAP
I 6 8 5 8 5)21 a 5n*EW W7.25 408112 +72S75
(c) Time = Steady
Figure 4. The maps of temperature for case8
7 Figure 5. Streamlines in the reactor
193
t

RECOVERY RATE OF CHI FROM CHeHYDRATE IMMERSED IN COPCHI MIXTURES
SHirohama, Y.Shimoyama,A Wakabayashi, Chiyoda Corp.,Yokohama 221 Japan,
STatuda, LNorikyo, Hokuriku Electric Power Co., Toyama 93O,Japan, N.Nishida, Sugino Machme Ltd.Uozu 937,Japan.
INTRODUCTION
Occurrence of subterranean CH4-hydrate layers is known and inferred in all over the world. A vast quantity of CHI contained in the hydrate layers can be one of the main energy sources in the next century (Holder et al. 1984, Kvenvolden, 1994). Injection of liquid COZ into the hydrate layers might be a promising technique to recover CHI simultaneously segregating COP from the biosphere as COz-hydrate, because some portion of CHI-hydrate is converted to COz-hydrate by simply immersing it in liquid phase containing COz(Hirohama et al. 1996). Mass-transfer in hydrate solid is presumed to determine the rate because CHI-hydrate at the interface with the liquid phase is initially converted to COz-hydrate which can inhibit further conversion.
As CHI content in the liquid phase increases, the recovery rate can decrease because of decrease in the driving force. So that evaluation of this technique requires that the effect of the composition on the rate of the conversion is known in a wide composition range. However there has been no datum on the effect of the liquid composition. Although Hirohama et al. (1996) proposed a diffusion model to describe the mass-transfer in hydrate solid, its accuracy was not tested a t altered compositions of the liquid phase.
This article proposes data on the conversion rate under varied compositions of the liquid phase. The accuracy of the model is discussed by comparing the data with the prediction.
EXPERIMENTAL
The experimental setup is the same as that used by Hirohama et al.(1996). The apparatus consists of a reactor, a feeding system for each component, a temperature controlled water bath and a back pressure regulator. The experiments were conducted by the following procedure:
Formation of CHI-hvdrate: Water and CH4 were charged in the reactor. Quantity of consumed CH4 was determined from the temperature, the pressure and the volume of the gas phase before and after the formation of CH4-hydrate.
Pureine CH4 in eas Dhase bv caseous Con: Gaseous COZ was fed to the reactor to purge the CH4 in the gas phase keeping the total pressure of the reactor above the dissociation pressure of CH4-hydrate at the temperature.
Iniection of CH4 and Con: Liquid COz and CHI were fed to the reactor. The change of the total pressure was monitored for about 600-1100 hours while the temperature was kept constant.
Discharee from the reactor: The total pressure of the reactor was reduced to the atmospheric pressure to vaporize all of the liquid and dissociate all the hydrate. The volume and the composition of the outlet gas were measured to determine the quantities of CH4 and COz existed in the reactor.
The experimental conditions and the results are listed in Table 1. The material balance of CHI and COz through the procedures are between 90% and 105%. The change of the total pressure of the reactor is shown in Fig.1.
CONVERSION RATE
Quantity of recovered CH4 can be determined from the total pressure and the temperature by solving the following material balance and volume balance simultaneously.
194

y-Vhy = = G / p , + L l p , (3)
Eliminating Gand Lfrom the equations above gives:
In Eq.(4), X C H I , J C H I , p~ and pc were calculated by the Patel-Teja equation of state Pa te l and Teja,1982) from the temperature and the pressure. The effects of HzO on the vapor-liquid equilibria and the material balance were neglected because the solubdity of Hz0 in liquid COz is less than 0.5 mol% (Wiebe and Gaddy,1941). The value of RCOZ,hy was estimated assuming that all the hee HzO was consumed to form COz-hydrate shortly after the injection of COZ. My was estimated from the supeficial density of the hydrate solid measured by Hirohama et al(1996).
Figure 2 shows the quantity of CH4 recovered from the hydrate phase. As the initial mole fraction of CH4 in the liquid phase increased, the rate of the conversion decreased. A rapid increase in the pressure in the first 10 hours was not taken in account, because the homogenization of the gas and the liquid in the reactor takes about 10 hours. Figure 3 shows the effect of the liquid composition on the amount of methane recovered in 600h. As the CH4 content increased, the rate of the conversion decreased dramatically.
DISCUSSION
CH~hydra te at the interface with the liquid phase can be initially converted to the hydrate of COz-CH4 mixture through which Con, CH4 and/or Hz0 permeate to continue the conversion. The following diffusion-like equation proposed by Hirohama et aL(1996) was applied to calculate the flux (N) of COZ and CH4in hydrate solid.
where 8: - (8,.IvI + ~s , , v , ) / ( v , + v2) (6)
Chemical potential 01,) was calculated by the following empirical equation of which parameter values were determined by fitting to the rigorous solution of the solid solution theory (Waals et al., 1959, Ssuto et al.,1964) which gave good prediction for the initial hydrate forming pressures of CHI-C0z mixtures.
In Eq.(7),ffcoz and f f C H 4 were 21.5 MPaL and 9.98 maL respectively a t 274K. Quantity of CH4 recovered from the hydrate phase was calculated by solving Eqs.(4)-(7) simultaneously under the same boundary conditions as those used by Hirohama et al.(1996).
No single value of solute mobility was able to describe the effect of the CHI content on the decrease in the conversion rate. So that the cause of the effect of the liquid composition can not be attributed only to the decrease in the driving force if the equilibrium model is applicable at the conditions. The fact implies that the composition of the liquid phase might influence the solute mobility in the layer of initially converted hydrate at the surface of the hydrate solid.
This work tempted to correlate the solute mobility as a function of the fraction of vacant cage as follows:
In(RTw) - AB: + B (8)
795

where 0: = 1 - 2 0;'
A and B are empirical parameters of which values were determined SO as to describe the data of all runs. The values of A and Bwere 610 and 10.1 respectively. Simulation was carried out by solving Eqs.(4)-(9) simultaneously. The model was capable of describing well the tendency of the experimental results as shown in Figs.2 and 3.
CONCLUSIONS
Conversion rate of CHI-hyrate to COz-hydrate immersed in the liquid phase of varied compositions was determined. As the CHI content increased, the conversion rate decreased more rapidly than predicted from the decrease in the dnving force calculated by the solid solution theory. An empirical equation was proposed to correlate the solute mobility as a function of the fraction of vacant cage.
NOMENCLUTURE
empirical parameter in Eq.(8) empirical parameter in Eq.(8) quantity of gas phase fugacity Langmuir constant for simplified model quantity of liquid phase quantity of component i pressure gas constant temperature time volume mole fraction in liquid mole fraction in gas depth chemical potential fraction of water of cage type j occupancy of component i in cage type j average occupancy of component i density cage number in a unit volume of hydrate effective mobility of solute
<Subscript> G gasphase hy: hydrate solid i,k: component identification number j: cage type L: liquid phase t: total v: vacant
LITERATURE CITED
Adisasmito, S., R. J . Frank, 111, and E. D. Sloan, Jr.; J. Chem. Eng. Data, 36, p68 (199 1)
Hirohama,S., YShimoyama, A.Wakabayashi, S.Tatuda and N.Nishida; J. Chem.
Holder, G. D., V. A. Kamath and S. P. Godbole; Ann. Rev. Energy, 9, p427 (1984) Kvenvolden K.A.: "International Conference on Natural Gas Hydrate", Annals of
the New York Acad. of Sciences, vol715, The New York Acad. of Sciences, New York, USA. , p 232 (1994)
Eng. Japan, 29, p1014 (1996)
Patel, N. C. and A. S. Teja; Chem. Eng. Sci, 37, 3, p463 (1982) Saito, S., D. R. Marshall and R. Kobayashi; A.1.Ch.E. Journal, Sep., p734 (1964) Waals, J . H. van der, and J. C. Platteeuw; Advances in Chemical Physics, v01.2, 1st
796

ed., Interscience, New York,U.S.A. p 1 (1959) Wiebe,R and V.L.Gaddy;”Vapor Phase Composition of Carbon Dioxide-water
Mixtures a t Various Temperatures a t Pressures to 700 Atmospheres,” J.Am.Chem.Soc.,63,475-477(1941)
Table 1. Experimental conditions and results
items unit Hirohama et al.( 1996) This work Formation of CH,-hydrate
HzO charged [moll 31.29 31.71 31.10 31.97 CH, trapped in hydrate [moll 4.23 3.14 4.16 4.52 HzO remained free [moll 6.95 10.23 7.18 5.98
Purging CH, in gas phase by CO,
CH, remained in gas phase [moll 0.52 0.35 0.38 0.52 COz existed in gas phase [moll 5.12 5.35 5.34 5.25
Soaking CH,-hydrate in CO2-CH, mixture liquid CO, charged CH, charged
[moll 10.3 10.3 10.94 10.16 [moll 0 0 2.48 5.23
temperature [Kl 274 276 274 274 Material balance CH, [%I 96 91 103
coz [%I 96 96 94
CH, recovery [XI 13 16 8 2 Reaction time [hl 800 800 600 I100
7.0
6.5
6.0 - g 5.5 u
E 2 5.0 e a
4.5
4.0
3.5 0 500 1000 1500
time [h]
Hirohama et aL(l996)
initial xcH4 Temp,
A 0.02 274U
a 0.01 276K
This work
initial xcw T ~ ~ ~ ,
0 0.07 274K - 0.15 274K
Fig.l Change of total pressure
797
L

0.7
0.6
r -7
Z 0.5 E
5 0.4
2 0.3
5
u TI
0
c
E 0.2
0.1
0
Exp. Hirohama et all1 996)
A 0.01 276K A 0.02 274K This work
0 0.07 274K . 0.15 274K
initial xW4
initial xW4 Temp.
Calc.by Eq.(8).274K initial xW4
- 0.02 .... 0.07
0.15
0 200 400 600 800
time [h]
Fig.2 CH4 recovered Gom the hydrate phase
1 .oo = E 0 :WP
8
u -c 0 - :Calc. by Eq.(8) LI U
_ _ _ _ _ _ :Calc. .-
E 0.10 ( R T w 3 . 2 ~ 1 O-”) B ?
5 a, m
E 0.01
0.00 0.05 0.10 0.1 5 0.20 initial mole fraction of CH4 [-I
Fig.3 Effect of CHI content on methane recovery
798

SEARCHING FOR MICROBES AND OTHER BlOREMEDlATlON TOOLS
Lisa Murdock Amtrak West
The National Railroad Passenger Corporation 810 N. Alarneda St.
Los Angeles. CA 90012
Charles Lin Amtrak
The National Passenger Railroad Corporation 400 North Capitol St. NW Washington, D. C 20001
Introduction
of selecting bioremediation tools to enhance our waste water treatment systems. The primary contaminants of our waste water is diesel fuel, lube oil, and gear lubricants. The goal is to have a tool capable of being used at any Amtrak location in the United States. The bioremediation products are tested on a bench scale in Washington, D. C. and pilot tested in Los Angeles. Los Angeles is the chosen test site due to its mild climate and infrequent rain. The waste water treatment system in Los Angeles is a series of three settling ponds with a belt oil skimmer.
The National Passenger Railroad Corporation (Amtrak) is in the process
Experimental
a 10-gallon aquarium, a small air pump, a thermometer, 3 gallons of tap water, The bench scale testing was performed using the following materials:
20 drops of waste water from the Wilmington facility, a plaitic teaspoon, a screen, a pipette, one 16 ounce glass bottle, and % mug of sea salt. Microbes are supplied for these experiments by various vendors, 1. The procedure is to aerate the aquarium filled with the tap water for
approximately 1 hour. 2. Add 20 drops of the waste water to the aquarium. 3. Fill a 16 oz glass bottle with a waste water sample from the aquarium and
place it in a cooler for analysis. 4. Empty the aquarium. 5. Repeat steps 1 and 2. 6. Spray % teaspoon of microbes through the screen over the waste water in
the aquarium. 7. Conditions: Temperature 74" F and pH 9.5.
Repeat the experiment using fertilizer and a greater concentration of waste water. 1. 2.
3. 4. 5. 6.
7.
Aerate aquarium for 2 hours. Fill 16 oz glass bottle with 100 drops of waste water and tap water. Place in the cooler for analysis. Place 100 drops of waste water in a plastic tubing in the aquarium. Filtered fertilizer into the tank using a mesh screen. Spray %teaspoon of microbes through screen over oil in the tubing. Place a foam partition between tubing and air pump to eliminate over spill at the tubing. Conditions: Temperature 72" F and pH 9.5.
The pilot testing was performed using the following materials: three 21b. bags of bacteria, three 2 Ib. bagsof nutrients, nine 55-gallon drums of catalyst, Microbes are supplied for these experiments by various vendors. The products were introduced into three settling ponds 52 feet by 52 feet and 8 feet
799
'k

Before 692 mglL 3.340 mglL
800
After Analytical Method 102 mglL 8015 1,840 mglL 418.1

Month 4 Observations All Ponds appear to be clear at the surface. The sludge looks darker and can be Seen very clearly.
The analytical test results show a c decrease in the surface oil in all three ponds. The most oil contaminated pond S-1 showed the largest decrease in diesel and other petroleum hydrocarbons. See the attached Figures 1-6.
Conclusions Bench testing of microbes can be correlated to pilot scale testing under
industrial scale conditions. In both tests the microbes decreased the amount of surface oil in the waste water over time. The larger the amount of oil contamination the greater the activity of the microbes in degrading the oil. The efficiency of the microbes was observed in all cases to be greater than 80%. The time was controlled in these experiments and perhaps that had an impact on microbe efficiency. The additional time would probably cause this to increase.
The increased soil hydrocarbon numbers was not caused by surface oil migrating to the sludge phase. The more likely conclusion is that microbes migrated to the sludge phase after all of the surface oil was degraded. The beginning of the sludge degradation is observed with a large initial increase in petroleum concentration and then a tapering. If the pilot test had been maintained longer a decrease in the sludge petroleum concentrations should be observed. In the future, tests will be conducted with new microbes using the same methods on waste water. There will also be additional tests performed on soil and sludge under similar conditions.
The success of bioremediation tools is very important to the railroad industry. A reasonably priced treatment technology can save thousands of dollars in disposal costs. The disposal costs including treatment and transportation for fuel contaminated soil is generally between $26.00-$35.00 per ton. The price to treat soil using bioremediation methods is approximately $2- $10 per ton. Bioremediation of water has similar costs comparison that is why it is so important to have test methods that prove which products are really successful.
References 1. Disinfection of Wastewater-Task Force Report EPA430/9-75-013. U. S.
Environmental Protection Agency, Washington, D. C. 1976.
Hydrocarbons: Water Solubility Data. Chemical Engineering, April, pp. 177- 182.
3. Hutchins, S. R., Sewell, G. W.. Kovacs, D. A., and Smith, G.A. 1991b, Biodegradation of aromatic hydrocarbons by aquifer microorganisms under nitrifying conditions. Environ. Sci. Technol. 25, 68-76.
Criteria, Proceedings of the Hazardous Materials and Environmental Management Conference WesVSpring. Long Beach, CA 1993.
5. Environmental Compliance Handbook for Short Line Railroads, U. S. Environmental Protection Agency and U. S. Department of Transportation, Washington, D. C. April 1996.
2. Yaws, C. L.. H-C. Yang, J. R. Hopper, and K. C. Hansen 1990.232
4. Kaufman, A. K., Krueger, C. C.. Applied Bioremedial Technology: Feasibility
801

Figure 1 Pond S I Sl-Top S-1-Middle S-I -Bottom
1800 23 8400 1300 11 49,000
11 9.4 42,000
Figure 2 Pond S2 S-2-Top S-2-Middle S-2-Bottom
8.9 6 2500 5.1 181 21,000 5.1 5.1 29,000
Figure 3 Pond S3 S-3-Top S-3- Middle S-3-Bottom
0 0 7.0 3 3 5,000 3 4 4,300
Figure 4
Pond tl TPHDhgel
OS A c 1 2 3
Figure 5
Figure 6
Pond S-3 TPH-DIesel
802

MODIFICATION OF COAL-DERIVED MATERIALS BY RHODOCOCCUS SPP.
D. L. Stoner,' I. G. Joky, R. B. Wright, and K. S. Miller Idaho National Engineering and Environmental Laboratory
Lockheed Martin Idaho Technologies Company, Inc. P. 0. Box 1625, IdahoFalls, ID 83415-2203
INTRODUCTION
The isolation and identification of microorganisms which degrade organic sulfur compounds is often considered the first step in the development of a biological process for the removal of coal organic sulfur (1-4, 7-9). Organic sulfur compounds which contain thiophene, sulfide, disulfide, or thiol groups are used as analogs of the sulfur-containing functionalities and compounds found in coal and coal-derived materials. Because the organic sulfur moieties are assumed to be an integral part of the macromolecular structure, the'preferred coal beneficiation process would selectively remove the sulfur and leave the carbon matrix intact with a minimum of oxidation. Microorganisms which degrade dibenzothiophene via the excision of the thiophenic sulfur (2, 3, 5, 6, 10) are of particular interest to the biological treatment of coals containing relatively
high proportions of thiophenic sulfur.
Two bacteria, UMX3 and UMX9, isolated by Purdy et al(6) are able to desulfurize dibenzothiophene or dibenzothiophene sulfone. These bacteria, tentatively identified as members of the genus Rhodococnrs are capable of sustained growth in media in which DBT or DBT- sulfone are the only added source of sulfur. Sulfur is selectively removed leaving 2 phenylphenol. Desulfurization activity is manifested during growth and is repressed by the presence of sulfate.
In order to be effective for coal desulfurization, microorganisms must be able to mediate the desired enzymatic transformation on coal, a chemically complex and heterogeneous material. This paper describes the evaluation of microbial strains UMX3 and UMX9 for the ability to modify water-soluble coal-derived materials. Soluble coal materials (Fig. 1) have been used as substrates to assess microbial desulfurization (7-9). The soluble coal materials are chemically representative but are without the physical limitations inherent with the use of particulate coal.
i
c
I RAW COAL
NaOH Treatment HCI Precipitation
SOLUBILIZED COAL
Oxone Treatment Dissolve in NaOH HCI Precipitation
ACID WASHED OXIDIZED COAL
Dissolve in NaOH I SOLUBLECOAL I '
7 HCI Precipitation
ACID WASHED OXIDIZED COAL
Figure 1: Schematic of the methods used to prepare water-soluble coal materials.
METHODS
Cultures UMX3 and UMX9 were provided by Bailey Ward, University of Mississippi, University, MS. Prior to their use in this study, cultures were transferred 3 times and confirmed for growth on sulfur-limited (SL) medium containing DBT-sulfone as the sole source of sulfur (6).
Cultures UMX3 and UMX9 were tested for the ability to remove sulfur from the soluble coal and oxidized soluble coal materials. Cells from starter cultures of uMX3 and UMX9 were harvested by centrifugation and washed twice with several volumes of sterile phosphate buffered saline (F'BS) solution. The washed cells were resuspended in a small volume of PBS. Approximately one-half of the cells were used to inoculate the soluble coal medium and the remaining cells used to inoculate the oxidized soluble coal media. Cultures were shaken at 30°C for 7 days.
In an experiment which utilized a relatively large amount of biomass, one liter cultures of uMX3
803

and UMX9 were cultivated on SL medium. harvested as noted previously, and washed twice with sterile PBS. Approximately one-half of these cells were used to inoculate 1 liter of medium amended with 100 mg of oxidized soluble coal material (from a filter-sterilized 2.5% solution) while the remaining cells were used to inoculate medium which was amended with 20 mh4 MgSO, to inhibit desulfurization activity. There were cell-free controls for each treatment. Cultures were analyzed at 3 days.
To prepare samples for analysis, cells were removed by centrifugation followed by filtration (0.2pm pore size membrane filters). The coal material was precipitated by acidification to pH 1 .5 using 6 N HCI. The precipitate was collected by centrifugation and washed twice with pH 1.5 water (acidified with HCI), then freeze-dried. Elemental composition was determined using an elemental analyzer (Model EA1 108, CarloErbdFisons Instruments, Valencia, CA). Fourier transform infrared (FTIR) spectra of coal and soluble coal materials formed into KBr pellets were obtained by using an FTIR spectrometer (model FTS-65; Digilab) For X P S spectra (PHI 5400 ESCA, Perkin Elmer, Inc.), energy corrections (downwards by 0.5 to 1 eV) were made to correct for sample charging based on the C(ls) peak position at 284.5 eV. Data in Tables 1 and 2 were obtained using the services of Huffman Laboratories, Inc., (Golden, CO).
RESULTS AND DISCUSSION
ANALYSIS %
MOISTURE* CARBON
HYDROGEN OXYGEN
NITROGEN SULFUR
ASH
Water-soluble materials derived by alkali treatment of weathered or low-grade coals have been used to examine the mechanisms by which bacteria modify coal organic sulfur (7-9). The water- soluble characteristic of the coal products makes them an excellent and easy-to-use substrate for biodesulfurization studies. The accessibility of the organic functional groups to microbial attack may be enhanced by the water solubility, while the absence of inorganic sulfur facilitates the interpretation of data. In this study, the sulfur (Table 1 ) in water-soluble materials derived from Ugljevik coal was almost entirely organic sulfur (Table 2) . '$
RAW SOLUBLE OXIDIZED ACID WASH ACID WASH SOLUBLE OXIDIZED
7 1 6 5 4 7 1 2 9 6 56 5 57 0 57 8 59 2 57 9 4 9 4 1 4 5 4 4 4 3
24 1 27 5 30 6 29 9 31 I 1 5 1 8 1 8 1 7 1 7 6 8 6 4 56 5 9 5 0 I 5 0 3 9 0 4 0 3 0 2
TOTALSULFUR SULFATE SULFUR PYRITIC SULFUR ORGANIC SULFUR
TABLE 2. SULFUR FORMS DATA FOR RAW. SOLUBLE AND OXIDIZED SOLUBLE 1
SOLUBLE SOLUBLE OXIDIZED 6.8 6.2 5.6 5.9 5.0 0.3 0.7 I .3 0.1 0.1
1 .1 <. 2 <0.2 0.0 0.04
5.4 5.6 4.3 5.7 4.9
COAL MATERIALS DERIVED FROM UGLJEVIK COAL. ANALYSIS(%) I RAW SOLUBLE OXIDIZED ACID WASH ACIDWASH
The cultures grew in medium amended with the water-soluble Ugljevik coal material. UMX3 increased from 4 . 1 ~ 1 0 ~ celldml to 3 . 8 ~ 1 0 ~ celldml, while UMX9 increased from 8.4~10 ' cells to 3 . 6 ~ 1 0 ~ celldml. M e r 7 days of incubation, the cultures appeared to do little to the elemental composition of soluble coal material (Table 3).
804

TABLE 3. ELEMENTAL ANALYSIS OF WATER-SOLUBLE UGLJEVIK COAL
I
t L
'.
c
I
MATERIAL Sample
!&& Control u M x 3 u M x 9
Control u M x 3 u M x 9
EATED WITH BACTERIAL CULTURES UMX3 AND uMX9 C H N S CIS S
(%) ("w (%) (% control)
57.720.2 4 .650 .2 1.9kO.O 5 . 7 2 0 . 2 10 .120 .4 58.2kO.l 4.8+0.0 1.920.0 5 .9+0.0 9 . 9 5 0 . 1 103.220.7 57.920.2 4.8+0.1 1.9&0.0 5.9+0.0 9 .8+0.1 103.920.3
58.220.2 4 .920 .1 2.0+0.0 5 .750 .1 10.220.1 58.720.3 4 .920 .2 2.1fO.O 5 .7 f0 .1 10.3?0.2 99 .521 .8 59.1+0.2 4 .720 .1 2.1+0.0 5.820.2 10.220.4 101.823.1
When cultivated on oxidized water-soluble coal material UMX3 increased from 7.lxlO' celldml on day 0 to 4x10⁹ celldml on day 7. uMX9 increased from 6.6~10' celldml to 2 . 6 ~ 1 0 ~ celldml. NO desulfurization activity was detected with the oxidized coal (Table 4).
TABLE 4. ELEMENTAL ANALYSIS OF OXIDIZED WATER-SOLUBLE UGLJEVIK COAL I MATERIAL
Sample
!&& Control UMx3 u M x 9 L&J Control u M x 3 u M x 9
EATED WITH BACTERIAL CULTURES UMX3 AND UMX9 C H N S CIS S
("w (%) (%) ("h) (" control)
56.420.3 4 . 7 2 0 0 1.820.0 5 . 2 2 0 . 0 10.9+0.1 55.221.0 4 . 5 t 0 . 2 1.8+_0.1 5.1+_0.0 10.950.2 98.350.7 56 .320 .1 4 .620 .1 1.8+0.0 5.3+0.1 10.620.2 102.5k1.9
57.820.2 4.8+0.1 2 .020 .0 5 2 2 0 . 2 11.220.5 57.920.1 4 .920 .1 2 .1+0.0 5.1+0.1 11.520.2 97 .7k1 .5 56.320.2 4.720.1 2.0+0.0 5 .220 .1 10.9+0.1 100.251.2
The inability to detect changes in the sulfur content of bacterially-treated coal material may have been due to the extremely small amounts required for cell growth. The sulfur requirement for growth is only 0.2% of the wet weight of the biomass. Table 5 reports the data for an experiment in which a relatively high amount of biomass was used. Again, the bacterial cultures did not appear to desulfurize the coal material.
COAL MATI TABLE 5. ELEMENTAL ANALYSIS OF OXIDIZED WATER-SOLUBLE UGLJEVIK
IAL TREATED WITH HIGH BIOMASS C H N S S
Starting Material Sulhr "Limited" Control u M x 3 u M x 9 Sulfate Amended Control u M x 3 UMx9
CIS (%CONT) ("h) (%) ("A) (%)
54.920.6 4 .350 .1 1.720.0 5 .320 .1 10.3+0.1
54.6+0.1 4 . 2 2 0 . 1 1.9+0.0 5 .220 .1 10.4+0.2 54.720.1 4 .320 .1 2.2+0.0 5 . 3 k 0 . 2 10.5+0.4 98.323.8 54.5k0.2 4 .420 .1 2 .320 .0 5 .020 .3 10 .920 .6 96.625.3
53.7k0.2 4 . 3 2 0 . 0 1.8+0.0 5.320.1 10.820.2 54.5+0.4 4 . 7 2 0 . 0 2 .420 .0 4 .920 .1 11.2+0.2 92.722.4 54.720.2 4.5+0.1 2 .420 .0 S . O l t O . 1 10.9+0.1 95.1+1.0
As determined by FTIR analysis, the treatment of the soluble coal materials with cultures UMX3 and UMX9 had little effect on the organic constituents ofthe materials (Data not shown). The microbially-treated oxidized coal material exhibited a slight depletion in the region of 3330 to 3400 cm'l while the microbially-treated soluble coal material exhibited an enhanced signal in this region. This region was assigned to water and coal-OH and coal-NH functionalities. Both UMX3 and uMX9 treated oxidized coal material exhibited greater absorbances in the regions of 1780 cm-l, 1630 cm", and 1540 cm-I. The increased absorbances at 1780 and 1630 cm" were attributed to highly conjugated carbonyl functionalities. The absorbance at 1630 cm-l may also
' 805

have been due to primary amines or water. The peak at 1540 cm.' was attributed to carboxylate anion functionalities, aromatic groups or conjugated and aromatic nitro groups.
Both UMX3 and UMX9-treated soluble coal had slight increases in absorbances in the regions of 3400, 1630, and 1030 cm". An increase in absorbance at 1780 and 1540 cm" was observed for UMX3-treated soluble coal material while these same regions exhibited a decrease for soluble coal material treated with UMX9.
In view of the data presented here and in earlier publications (Stoner et al., 1990, 1991) the use of model compounds to select for bacteria that can desulfurize coal may be problematic. The effectiveness of such microorganisms may be dependent on the relative abundance of that organosulfur form in the coal. In this case, the ability of UMX3 and UMX9 to desulfurize the water-soluble coal materials may have been dependent on the amount of thiophenic moieties that were present. Coal and coal-derived materials are complex substrates, whose chemical structures are still undefined. The coal materials behave as complex polymers which would be quite different from the model compounds used to select the bacteria. Therefore, there is the possibility of steric hindrance interfering with enzymatic activity.
ACKNOWLEDGEMENTS
This work was supported under contracts DE-AC07-76ID01570 and DE-AC01-94-ID13223 from the U. S. Department of Energy to the Idaho National Engineering Laboratory
LITERATURE CITED
1. Constanti, M., A. Bordons, and Jaume Giralt. 1994. Degradation of dibenzothiophene by Pseudomonaspufida. Letts. Appl. Microbiol. 18: 107-1 11. 4
2. Kilbane, J. J., 1990. Microbial removal of organic sulfur from coal: Current status and research needs. p. 487-506. In Bioprocessing and Biotreatment of Coal. D. L. Wise, (ed.), Marcel Dekker, Inc., New York.
3. Kilbane, J. J., 1990. Sulfur-specific microbial metabolism of organic compounds. Res. Conserv. Recycl. 3:69-79.
4. Krawiec, S . 1990. Transformations of dibenzothiophene by axenic cultures of SuIfolobus acidocaldurius and other bacteria: A critique. p. 569-601. In Bioprocessing and Biotreatment of Coal. D. L. Wise, (ed.), Marcel Dekker, Inc., New York.
5 . Omori, T., L. Monna, Y. Saiki, and T. Kodama. 1992. Desulfurization ofdibenzothiophene by Coynebacterium sp. strain SYI, Appl. Environ. Microbiol. 58:91 1-915.
6. Purdy, R. F., B. Ward, and J. E. Lepo. 1991. Microbial extraction ofsulfur from model coal organosulfur compounds. p. 63-82. In Proceedings of the Third Symposium on Biotechnology of Coal and Coal-Derived Substances. DGMK, Hamburg, Germany.
7. Stoner, D. L., 1993. Microbial transformation of organic nitrogen and sulfur in low rank coals. p. 157-169. In Microbial Transformations of Low Rank Coals. D. L. Crawford (ed.) CRC Press, Boca Raton, FL.
8. Stoner, D. L., K. S. Miller, K. B. Barrett, J. B. Tingey, R. B. Wright, and J. E. Wey. 1991. The use of water-soluble coal products to examine microbial coal desulfurization. p. 549-566. In. Processing and Utilization of High Sulfur Coals, IV. P. R. Dugan, D. R. Quigley and Y. A Attia, (eds.) Elsevier Science Publishers, B. V. Amsterdam.
9. Stoner, D. L., J. E. Wey, K. B. Barrett, J. G. Joky, R. B. Wright, and P. R. Dugan. 1990 Modification of water-soluble coal-derived products by dibenzothiophene-degrading microorganisms. Appl. Environ. Microbiol. 56:2667-2676.
IO. van AfFerden, M., S. Schacht, J. Klein, and H. G. Triiper. 1990. Degradation of dibenzothiophene by Brevibacferium sp. DO. Arch. Microbiol. 153:324-328.
806

I
BIOREMEDIATION OF SYNTHETIC CHEMICALS AS A CONSEQUENCE OF GROWTH ON PETROLEUM HYDROCARBONS.
Charles C. Somerville* and Erica S . K. Becvart USAF Armstrong Laboratory, Environics Directorate*
and Applied Research Associatest 139 Barnes Drive, Tyndall AFB, FL 32403
INTRODUCTION
. \
Y
The Department of Defense uses approximately 8.5 million gallons of light distillate fuels each day ( I ) . At this level of use, spills or leaks during transport, storage, or use can lead to a large environmental burden of fuel hydrocarbons. The Air Force alone has more than 2,500 sites that are contaminated with petroleum hydrocarbons. Fortunately, the components of light fuels are naturally occurring compounds. Because of their long term presence and wide distribution in the environment, many soil microorganisms have adapted to the degradation of fuel compounds. In fact, it is likely that all natural products can be degraded by one or more microbial species under the proper conditions (2). This does not mean that spills and leaks of light fuels are unimportant or that such contamination will always be amenable to bioremediation. However, it does mean that natural or augmented biological processes are important tools in the cleanup of fuel-contaminated sites.
Unfortunately, environmental contamination is not limited to naturally occurring chemicals. Some man-made chemicals (e.g. highly substituted chloro- and nitro-compounds) are common environmental contaminants and are known to resist biodegradation. However, the presence of petroleum hydrocarbons at contaminated sites can adtually aid, directly or indirectly, in the degradation of synthetic co-contaminants, In this report, we consider the biodegradation of two types of synthetic compounds influenced by the presence of petroleum hydrocarbons in the environment. The first type includes the chlorinated ethenes: tetrachloroethylene (PCE), trichloroethylene (TCE), the isomers of dichloroethylene (DCEs), and vinyl chloride (VC). The second type includes substituted aromatic compounds such as chloro- and nitroaromatics
CHLORINATED ETHENES
PCE and TCE have been used extensively in dry cleaning. degreasing of metals, and as solvents (3). The prevalent use of these solvents has led to widespread environmental contamination. TCE has been reported to be the major volatile organic contaminant of groundwater in the United States (4). There ale a growing number of reports on the degradation of chlorinated ethenes by bacterial consortia and isolated bacterial species. The biotic degradation of chlorinated ethenes appears to occur in one of two ways: (i) cometabolic attack by non-specific oxygenases, or (ii) dehalorespiration.
Cometabolic Oxidation. Several species of bacteria produce enzymes which cometabolize PCE and/or TCE. The enzymes studied in the greatest detail are methane monooxygenase, toluene dioxygenase, and toluene monooxygenase. All three types of enzymes have relaxed substrate specificity and will fortuitously degrade chlorinated ethenes. The presence of fuel hydrocarbons in the environment can lead to the establishment of conditions favoring cometabolism of chlorinated ethenes.
In the jet fuel JP-4 E-alkanes constitute 32% of the mixture by weight (5). The o-alkanes of intermediate chain length are degraded by terminal oxidation to a carboxylic acid followed by p- oxidation. The acetyl-coenzyme A produced as a result is further metabolized to carbon dioxide by the tricarboxylic acid cycle for energy production, or converted to cellular carbon via the glyoxylate cycle. Then-alkanes of odd chain length result in the formation of propionyl-coenzyme A which is further metabolized to pyruvic acid with the concomitant production of hydrogen ( 6 ) . The consumption of oxygen coupled with the production of carbon dioxide and hydrogen produces conditions favorable to the biological formation of methane. Methanotrophic bacteria, in turn, utilize methane via a series of oxidations to yield carbon dioxide (6) . The initial oxidation of methane to methanol is catalyzed by the enzyme methane monooxygenase (MMO). Methanotrophic bacteria characterized to date produce two forms of the enzyme: a membrane- associated particulate form (pMMO) which requires copper for activity, and a soluble form (sMMO) which is expressed under copper-limited conditions (7). Both pMMO and sMMO oxidize TCE, but sMMO degrades TCE at higher rates (8) and has been demonstrated to catalyze the transformation of DCEs (9). A series of reactions leading to methane formation and TCE transformation is outlined in Fig. I .
Aromatic compounds account for approximately 20% of the jet fuel JP-4 by weight ( 5 ) . Mineralization of aromatic substrates is usually initiated by hydroxylation of the ring by either dioxygenase or monooxygenase reactions. Many of the enzymes which initiate degradation of aromatic compounds (e.g. toluene) are also capable of attacking TCE (Fig. 2). Therefore, the contamination of a site with fuel hydrocarbons can select for a microbial population pre-adapted to the degradation of TCE. In fact, exogenous addition of aromatic hydrocarbons has been shown to stimulate the degradation of TCE in situ ( I 1-13). Fortuitous oxidation of TCE has generally not been observed in the absence of inducer compounds such as phenol or toluene. Recently, however, Leahy et al. (14) confirmed that the toluene monooxygenase of some strains is induced by TCE. Still, TCE does not serve as a source of carbon or energy for these strains, and thus can
801

not sustain the degrader population. Unfortunately, none of the aromatic oxygenases have been demonstrated to attack PCE or VC, and only toluene dioxygenase has activity against the DCE isomers (see Fig. 2). Another drawback of toluene/TCE cometabolism is a high demand for oxygen which is required as a co-substrate in the oxidation of both TCE and the primary substrate. Oxygen is also required as a terminal electron acceptor by the host bacterium. Oxygen limitation has been shown to inhibit TCE degradation in soil (15). The addition of nitrate to contaminated soils may overcome oxygen limitation for denitrifying strains, but some of the best studied TCE- degrading isolates (e.g. Burkholderia cepacia G4 and Pseudomonas purida FI) are not denitrifiers
Toluene and methane oxygenases have been most extensively studied. However, other bacterial oxygenases, including ammonia monooxygenase ( I 6) and propane monooxygenase (17), also degrade TCE. Propane monooxygenase is notable for its ability to degrade DCEs and VC. Chloroethene degradation, however, does not appear to be a common property of bacterial oxygenases. Wackett et al. (17) showed that nitropropane dioxygenase, cyclohexanone monooxygenase, cytochrome P-450 monooxygenases, 4-methoxybenzoate monooxygenase, and hexane monooxygenase do not attack TCE.
Dehalorespiration. In the process of dehalorespiration, chlorinated compounds serve as terminal elcctron acceptors for anaerobic bacteria growing on an appropriate carbon source. Dehalorespiration differs from cometabolism in that the bacteria that mediate reductive dechlorination gain energy from the process. The combination of chloroethenes with a suitable electron donor can thus support growth of strains capable of coupling dechlorination to energy production. Reductive dechlorination of halogenated aliphatic compounds was first reported in the early 1980’s (18). Vogel and McCarty (19) later established the pathway for reductive dechlorination of PCE to VC under methanogenic conditions. Although [I4C]PCE mineralization was demonstrated by the detection of labeled carbon dioxide, the major products of dechlorination were TCE and VC. The formation of VC represents an increase in toxicity over TCE or PCE, and seemed to indicate that reductive dechlorination would be deleterious at contaminated sites. It was later found that PCE and TCE could be dehalogenated to ethylene (ETH) under methanogenic conditions (20). However, the dehalogenation of VC was rate limiting, and in many situations VC was found to persist (21). A breakthrough was made when DiStefano et al. (21) tested a mixed culture of predominantly methanogenic bacteria for dehalogenation of PCE. At very high initial levels of PCE, methanogenesis was completely inhibited, and the culture gave a nearly complete conversion of PCE to ETH. Further study of the culture showed that hydrogen was the direct electron donor for reductive dechlorination and that the bulk of the hydrogen was produced by acetogenic bacteria growing on methanol. High levels of PCE selectively inhibited the methanogenic bacteria that would otherwise compete for available hydrogen (22). The organism responsible for dehalogenation of chloroethenes has recently been isolated and identified as a eubacterium tentatively named Dehalococcoides ethenogenes (23). Furthermore, Sharma and McCarty (24) isolated a facultative enterobacterium that dehalogenates PCE primarily to cis-I ,2- DCE in the absence of oxygen, nitrate, and fermentable carbon sources. The ability to work with pure cultures represents a major advance in the effort to determine the conditions most favorable for complete dehalogenation of chloroethenes. The pathway for the dehalogenation of PCE to ETH is shown in Fig. 3.
(14).
SYNTHETIC SUBSTITUTED AROMATICS
Synthetic substituted aromatic compounds are common industrial chemicals and are often found as soil and groundwater contaminants. Microorganisms that mineralize synthetic aromatic compounds can be isolated from contaminated soil and groundwater but have not been isolated from uncontaminated sites. This suggests that a selection or adaptation process must occur after site contamination. One hypothesis is that the enzymes which attack synthetic aromatics are homologous to enzymes specific for naturally-occurring aromatic hydrocarbons. The isolation and sequencing of the genes encoding degradative enzymes have allowed us to test that hypothesis for chlorobenzene and nitrotoluene degradative pathways.
Pseudomonas sp. strain P5 1 grows on 1,2-dichlorobenzene, 1,4- dichlorobenzene, and I ,2,4-trichlorobenzene as sole sources of carbon and energy (25). The metabolic pathway for chlorobenzenes in strain P5 1 proceeds from an initial dioxygenase attack to yield a chloro-dihydrodiol intermediate which is rearomatized by the action of a diol dehydrogenase to form a di- or trichlorocatechol. The aromatic ring is opened in the ortho position by a chlorocatechol dioxygenase, and the substrate is mineralized by a series of reactions analogous to the P-ketoadipate pathway (6, 25). Removal of the chloro substituents is thought to occur after ring cleavage. The striking similarities between the metabolism of chlorobenzenes and naturally occurring aromatic hydrocarbons (e.g. benzene, phenol, toluene) strongly suggests that pre- existing enzymes have become adapted to chlorinated compounds. The genes that encode the initial chlorobenzene dioxygenase from strain P51 have been isolated and sequenced (26), and that data can be used to determine the phylogeny of the enzyme.
Fig. 4 is a phylogram of large subunits of the terminal dioxygenase (ISPLs) of ten aromatic ring dioxygenases identified by their primary substrate. The phylogenetic analysis indicates a close and statistically significant relationship between chlorobenzene dioxygenase and benzene and toluene dioxygenases. The topology of the phylogram suggests that the chlorobenzene dioxygenase of strain P51 shares a recent common ancestor with benzene and toluene dioxygenases, and that their common ancestor evolved from a biphenyl dioxygenase. The data clearly support the theory that enzymes which attack chloroaromatics arise by adaptation of
Chlorobenzenes.
808

enzymes specific for aromatic petroleum hydrocarbons. The metabolic pathways for both 2-nitrotoluene (2-NT) and 2,4-
dinitrotoluene (2.4-DNT) are initiated by dioxygenase reactions which form diol-derivatives of the Parent compounds (37,38). The degradation of these nitroaromatic compounds differs from that of the chlorobenzenes in three respects: (i) rearomatization of the ring occurs spontaneously, (ii) rearomatization is accompanied by elimination of a substituent nitro group prior to ring cleavage, and (iii) the ring is opened by a metu ring cleavage. Although the initial reactions differ in these details, the overall degradation of nitrotoluenes is analogous to .the meta-cleavage pathway of naturally-occurring aromatic compounds (6) . Sequence data are available for three oxygenases that attack nitrotoluenes (39-41). and can be used to establish the origin of these enzymes.
Fig. 5 is a phylogram of the ISPLs of ten aromatic ring dioxygenases including the three nitrotoluene dioxygenases. The nitrotoluene degrading enzymes form a statistically significant, exclusive group, and clearly share a recent common ancestor with enzymes that hydroxylate polyaromatic hydrocarbons. This relationship again implies that enzymes for naturally-occurring substrates have adapted to the degradation of synthetic compounds (although the chemical similarity between PAHs and nitrotoluenes is not immediately apparent). The fact that the three nitrotoluene dioxygenase sequences cluster together is interesting because the organism that degrades 2-NT was found at a site hundreds of miles away from the site where the 2.4-DNT degraders were found (37, 44). This observation suggests that enzymes which attack synthetic compounds do not arise de novo at each contaminated site; however, more data will have to be collected before the mechanisms of adaptation are clear.
Nitrotoluenes.
CONCLUSIONS
The studies of chlorinated ethenes, chloroaromatics, and nitroaromatics clearly show that the presence of bacteria adapted to the degradation of fuel hydrocarbons can have a positive impact on the bioremediation of man-made chemicals. Cometabolic processes are clearly of interest; however, there are obstacles to relying on these processes for site remediation. Because cometabolism does not provide the bacterial community with carbon or energy, it is not a self- sustaining process. The cometabolism of TCE by methane or toluene oxygenases is oxygen intensive, and will therefore be of limited extent in unamended soil and groundwater. Also, the enzymes which catalyze the breakdown of chloroethenes are primarily limited to TCE degradation and will not be useful at sites where PCE or VC have accumulated.
Dehalorespiration is an exciting alternative to cometabolic oxidation of chloroethenes for two reasons. First, the biological degradation of light fuels is an oxygen-intensive process. Removal of oxygen inhibits cometabolic degradation but favors reductive dehalogenation. Second, reductive dehalogenation appears to function on a much wider range of chloroethenes than cometabolism indicating that the process could prove useful at many contaminated sites. Furthermore, the presence of DCEs and VC at sites known to have been contaminated with PCE or TCE indicates that reductive dehalogenation is already occurring in the environment (45-47).
Wc now know that enzymes which attack chlorobenzenes and nitrotoluenes are homologous to enzymes specific for naturally occurring compounds. Therefore, the presence of petroleum hydrocarbons at a site co-contaminated with one or more of these synthetic compounds may enrich for the presence of the genotypes required for bioremediation of the man-made chemicals. Research is now in progress to answer some of the basic questions regarding how bacteria adapt to the degradation of xenobiotic compounds.
Based on the information presented here, we recommend careful analysis of data from contaminated sites in order to take advantage of fortuitous interactions between co-contaminants. We encourage both industry and regulatory agencies to continue to look for opportunities to use in situ biological remediation strategies as alternatives, or supplements, to physical remediation of sites contaminated with synthetic compounds.
LITERATURE CITED
( I ) Wells, R. Personal communication, 1996. (2) Alexander, M. Biodegradation and Bioremediation. Academic Press: San Diego, 1994. (3) Budavari, S.; O’Neil, M.J.; Smith, A.; Heckelman, P.E (eds.). The Merck Index (1 Ith
(4) Shields, M.S; Reagin, M.J. Appl. Environ. Microbiol.. 1992.58, 3977-3983. ( 5 ) Spain, J.C.; Somerville, C.C.; Lee, T.J.;Butler, A.C; Bourquin, A.W. Degradation of Jet
Fuel Hydrocarbons by Aquatic Microbial Communities. (AFESC ESL-TR-83-26), 1983. (6) Gottschalk, G. Bacterial Metabolism (2nd edition). Springer-Verlag: New York, 1986. (7) Zahn, J.A.; DiSpirito, A.A. J. Bacteriol. 1996,178, 1018-1029. (8) McDonald, I.R.; Uchiyama, H Kambe, S.; Yagi, 0.; Murrell, J.C. Appl. Environ.
(9) Oldenhuis, R.; Vink, R.L.M.K.; Janssen, D.B.; Witholt, B. Appl. Environ. Microbiol.
(IO) Little, C.D.; Palumbo, A.V.; Herbes. S.E.; Lidstrom, M.E.; Tyndall, R.L.; Gilmer, P.J.
(1 1) Gibson, S.A.; Sewell, G.W. Appl. Environ. Microbiol. 1992.58, 1392-1393. (12) Major, D.W.; COX, E.E. pp. 48-56 In In siru Bioremediation Symposium. Niagara-on-the-
(13) Hopkins, G.D.; McCarty, P.L. Environ. Sci. Technol. 1995,29, 1628-1637.
edition). Merck & Co.: Rahway, NJ. 1989.
Microbiol. 1997, 63, 1898-1904.
1989.55, 2819-2826.
Appl. Environ. Microbiol. 1988.54, 951-956.
Lake, Canada, 1992.
809

Leahy, J.G.; Byrne, A.M.; Olsen, R.H. Appl. Environ. Microbiol. 1996.62, 825-833. Fan, S.; Scow, K.M. Appl. Environ. Microbiol. 1993, 59, 191 1-1918. Vannelli. T.; Logan, M.; Arciero, D.; Hooper, A.B. Appl. Environ. Microbiol. 1990,56, 1169-1171. Wackett, L.P.; Brusseau, G.A.; Householder, S.R.; Hanson, R.S. Appl. Environ. Microbiol. 1989, 55, 2960-2964. Bouwer, E.J.; McCarty, P.L. Appl. Environ. Microbiol. 1983,45, 1286-1294. Vogel, T.M.; McCarty, P.L. Appl. Environ. Microbiol. 1985,49, 1080-1083. Freedman, D.L.; Gossett, J.M. Appl. Environ. Microbiol. 1989, 55, 2144-2151. DiStefano, T.D.; Gossett, J.M.; Zinder, S.H. Appl. Environ. Microbiol. 1991.57, 2287- **A^
LLYL. (22) Mavmb-Gatell. X.; Tandoi, V.; Gossett, J.M.; Zinder. S.H. Appl. Environ. Microbiol. .. . ,
1995, 61, 3928-3933.
American Sociery for Microbiology. Miami, FL, 1997. (23) Maym6-Gatel1, X.; Gossett, J.; Zinder, S.H. Abstract no. Q-96, 97th Annual Meeting of the
(24) Sharma, P.K.; McCarty, P.L. Appl. Environ. Microbiol. 1996,62, 761-765. (25) van der Meer, J.R.; van Neerven, A.R.W.; de Vries, E.J.; de Vos, W.M.; Zehnder, A.J.B.
J. Bacteriol. 1991. 173. 6-15. (26) Werlen, C.; Kohler, H.P.; van der Meer, J.R. J . Biol. Chem. 1996,271, 4009-4016. (27) Kurkela, S.; Lehvaeslaiho, H.; Palva, E.T.; Teeri. T.H. Gene 1988, 73, 355-362. (28) Kimbara, K.; Hashimoto, T.; Fukuda, M.; Koana, T.; Takagi, M.; Oishi, M.; Yano, K. J.
(29) Zylstra, G.J.; Gibson, D.T. J. Biol. Chem. 1989,264, 14940-14946. (30) Neidle, E.L.; Hartnett, C.; Ornston, L.N.; Bairoch, A.; Rekik, M.; Harayama, S . Eur. J.
(31) Taira, K.; Hirose, J.; Hayashida, S.; Furukawa, K. J. Bid . Chem. 1992,267, 4844-4853. (32) Simon, M.J.; Osslund, T.D.; Saunders, R.; Ensley, B.D.; Suggs, S . ; Harcourt, A.A.; Suen,
W.-C.; Cruden, D.L.; Gibson, D.T.; Zylstra, G.J. Gene 1993, 127, 31-37. (33) Tan, H.M.; Tang, H.Y.; Joannou, C.L.; Abdel-Wahab, N.H.; Mason, J.R. Gene 1993,
130, 33-39. (34) Thompson, J.D.; Higgins, D.G.; Gibson, T.J. Nucl. Acids Res. 1994.22, 4673-4680. (35) Asturias, J.A.; Diaz, E.; Timmis, K.N. Gene 1995, 156, 11-18. (36) Masai, E.; Yamada, A.; Healy, J.M.; Hatta, T.; Kimbara, K.; Fukuda, M.; Yano, K. Appl.
Environ. Microbiol. 1995.61, 2079-2085. (37) Spanggord. R.J.; Spain, J.C.; Nishino, S.F.; Mortelmans, K.E. 1991. Appl. Environ.
Microbiol. 1991,57, 3200-3205. (38) Haigler, B.E.; Wallace, W.H.; Spain, J.C. Appl. Environ. Microbiol. 1994, 60, 3466-
3469. (39) Parales, J.V.; Kumar, A,; Parales, R.E.; Gibson, D.T. Gene 1996, 181, 57-61. (40) Suen, W.C.; Haigler, B.E.; Spain, J.C. J . Bacteriol. 1996, 178, 4926-4934. (41) Haigler, B.E.; Somerville, C.C.; Spain, J.C.; Jain, R.K. Abstract no. Q34.3, 97th Annual
Meeting of the American Society for Microbiology. Miami Beach, FL, 1997. (42) Denome,S.A.; Stanley, D.C.; Olson, E.S.; Young, K.D. J. Bacteriol. 1993, 175. 6890-
6901. (43) Takizawa, N.; Kaida, N.; Torigoe, S.; Moritani, T.; Sawada, T.; Satoh, S . ; Kiyohara, H. J.
Bacteriol. 1994, 176, 2444-2449. (44) Haigler, B.E.; Spain. J.C. Appl. Environ. Microbiol. 1993,59, 2239-2243. (45) Kitanidis, P.K.; Semprini, L.; Kampbell, D.H.; Wilson, J.T. pp. 57-60 In Symposium on
Bioremediation of Hazardous Wastes: Research, Development, and Field Evuluations (EPA/600/R-93/054), Dallas, TX, 1993.
(46) Weaver, J.W.; Wilson, J.T.; Kampbell, D.H. Natural Bioattenuation at the St. Joseph, Michigan Superfund Site (EPA/600/SV-95/001), 1995.
(47) Wilson, J.T.; Kampbell, D.; Weaver, J.; Wilson, B.; Imbriglotta, T.; Ehlke, T. Symposium on Bioremediation of Hazardous Wastes: Research. Development, and Field Evaluations. Rye Brook, NJ, 1995
Bacteriol. 1989, 171, 2740-2747.
Biochem. 1992,204, 113-120.
81 0

:
4 h
i \
\
0 2 Pehdeum Anoxic conditions * C02+H2
Hydmcarbom
I
COZ 4 CH4
k NADH +H+ 0 2
NAD* ma
5oUrcBs
Fig.1. A proposed scheme for the involvement of petroleum hydrocarbon degradation in cometabolism of TCE. The formation of dichloroacetic acid and glyoxylic acid was proposed by Little et al. ( IO) . The abbreviation PQQ refers to the coenzyme methoxa- tin which is reduced in the oxidation of methane to carbon dioxide (6 ) .
& A.
Fig. 2. (A) Enzymes involved in the degradation of toluene, and (B) their ability to co- metabolize chloroethenes. Symbols: a, toluene dioxygenase; b, toluene dihydrodiol dehydrogenase;c, toluene-ortho-monooxygenase; d, toluene-meta-monooxygenase; e, toluene-para-monooxygenase; f, toluene oxidase; g. benzyl alcohol dehydrogenase; h, benzaldehyde dehydrogenase; i, benzoate oxidase.
CI CI I I I I
CI CI
H H ;cs: H-C-C -H
H H L? f L
CI H
H CI
Fig. 3. Pathway for the reductive dechlorination of PCE based on the work of Vogel and McCarty (19) and Maym6-Gatell et al. (23). Question marks (?) represent trans- formations with unknown intermediates. Astericks (*) indicate reactions not coupled to cell growth in Dehalococcoides ethenogenes (23) .
811

I benzoate (30) , naphthalene (32)
1000 naphthalene (27) 1000
biphenyl (31) biphenyl (28)
0.1 -
Fig. 4. Phylogram depicting the relationships between selected aromatic di- oxygenases. Amino acid sequences were aligned, evolutionary distances were corrected for multiple substitutions, and bootstrap analysis was performed using the ClustalW package (34). Numbers indicate the frequency that the topology shown at each node was recovered out of IO00 bootstrap replicates.
toluene (29) benzene (33) 2-nitrotoluene (39)
2,4-dinitrotoluene (41) naphthalene (42) naphthalene (27)
naphthalene (32)
Fig. 5. Phylogram depicting the relationships between selected aromatic dioxy- genases. Analyses and symbols are as described in Fig. 4.
?
812

NATURAL ATTENUATION EVALUATION AND MODELING OF GASOLINE IMPACTED GROUNDWATER
K. Brown, L. Tyner, B. Sibbett, D. Daftary, T. Perina I T Corporation
312 Director’s Drive Knoxville, TN 37923
Denise Caron, Vandenberg AFB, CA
ABSTRACT Natural attenuation was evaluated as a containment option for a gasoline-impacted aquifer located at the Vandenberg, AFB (VAFB) Base Exchange Service Station (BXSS). The site, which was found to have a complex geological and hydro geological profile, was impacted through releases from a leaking underground storage tank (LJST). Elements of the site evaluation included records search, placement of approximately 40 Geoprobe points and 7 monitoring wells, slug testing of 18 wells, groundwater and soil sampling and analysis, development of a site conceptual model, and completion of fate and transport modeling.
INTRODUCTION IT Corporation, contracted through the Air Force Center for Environmental Excellence, completed the evaluation of natural attenuation as a containment option at the VAFB BXSS. The VAFB BXSS was established in 1967 to provide motor vehicle fuel to residents. The BXSS currently consists of the main office building with three gasoline dispensing islands, six automobile service bays, and a four-bay car wash building. It is immediately bordered by trees to the west and south and grassy open fields to the east and north.
In 1967, four 10,000-gallon, single-walled underground fuel tanks, a 250-gallon single walled underground waste oil storage tank, and associated piping were installed at the BXSS. In 1985, two of the four 10,000-gallon USTs were replaced with two 10,000-gallon double-walled fiberglass tanks. In 1991, the two remaining 1967 USTs, along with the associated piping and the underground waste oil storage tank, were replaced with 10,000-gallon USTs.
Site contaminants of concern include benzene, toluene, ethyl benzene, and xylenes (BTEX), total petroleum hydrocarbons (TPH), and methyl tertiary butyl ether (MTBE). The majority of contamination at the site is centralized around the old pump island. Highly contaminated soil in this area extended from 4 to 12 feet bgs. Although no free product was present at the site, the impacted soil appeared to be the source of the groundwater contamination. Outside of the old pump island, soil concentrations dropped off to non detect. Groundwater concentrations of BTEX, TPH, and h4TBE increased in and around the old pump island (Figures 1 and 2). Based on the biodegradability ofBTEX and TPH, the lack ofBTEX and MTBE migration, and the absence of human or ecological receptors in the area, natural attenuation was deemed a feasible alternative for site remediation.
Natural attenuation is most accurately viewed as an effective, natural plume containment process, whereby the intrinsic capacity of the impacted and downgradient aquifer to assimilate con- taminants exceeds the contaminant migration rate. As a result, most plumes undergoing natural attenuation achieve a steady-state or stability within a moderate period of time following the release. Some of the advantages of natural attenuation include the fact that it is nonintrusive, less costly than conventional methods and that the most mobile and toxic fuel compounds are generally the most susceptible to biodegradation. The primary limitations of natural attenuation include the fact that it is affected by changes in local hydro geologic conditions, potential future releases, and aquifer heterogeneity and that time frames for completion may be relatively long.
In order to pursue natural attenuation or any technology as a remedy, evidence must be generated documenting the potential and effectiveness of the process. The objectives of the natural attenuation evaluation were to collect evidence to verify or eliminate the potential of natural attenuation as a remedy at the BXSS.
MATERIALS AND METHODS Forty Geoprobe points were installed during the site investigation. The Geoprobe method drives a 2-inch-diameter sampler mounted on the end of 1-inch-diameter drive rods into the soil, pushing the soil aside until the desired sample depth is reached. During this process soil and groundwater sampling may be collected. Ten soil samples were collected during the direct-push investigation and analyzed by EPAMethods 6010,8015,8260, and 9045 for iron, TPH, VOCs, and pH, respectively. Additional analysis for ammonia as nitrogen, total phosphate, microbial
813

enumerations, and soil moisture was also conducted, Thirty-five groundwater samples were analyzed by an on-site, mobile laboratory for BTEX and MTBE by modified EPA Method 8020.
Geoprobe data were used to guide the placement of seven additional groundwater monitoring wells around the BXSS. The wells were installed to a depth of 20 feet with a hollow-stem auger in a IO-inch-diameter boring. The wells were completed with 4-inch-diameter polyvinyl chloride casing and 15 feet of screen. Conductivity and natural gamma logs were run in 14 monitoring wells (7 existing and 7 newly installed) and 1 soil boring to characterize the subsurface and provide another method for correlating beds between the new and existing wells.
Site monitoring wells were sampled and analyzed by a fixed-facility using EPA Methods 8260, 801 5 , for VOC and TPH, as well as several general water chemistry analyses. During groundwater sampling, an electronic water-level indicator was used to measure depth to groundwater and depth to the bottom in each monitoring well. Wells were purged and sampled with a 2-inch “readiflow-2” Grundfos pump at a rate of 1 L/min. Field parameters, such as p Y specific conductivity, turbidity, and dissolved oxygen, were measured with a Horiba U-10 water- quality checker. Turbidity was measured with the HACH 2100P turbidity meter. Redox potential was measured with an Orion 290A pH concentration meter. H2S was measured with a qualitative H,S kit, and ferrous iron (Fe 11) was measured with the HACH 2000 Spectrophotometer.
Following sampling and analysis, slug testing was conducted on 18 wells to characterize the aquifer, A 2.36-inch-diameter, 5 . I-foot-long slug constructed of a flush-threaded, 5-foot-long section of stainless-steel pipe with steel caps at both ends was used for the slug tests performed on 4-inch-diameter wells. A 1 -inch-diameter, 5.2-foot-long slug constructed of a 5-foot-long section of steel pipe with steel cap at both ends was used for the slug tests performed in 2-inch- diameter wells.
Prior to the slug test, depth to static groundwater was measured using an electrical water level indicator. Changes in water level were digitally recorded during the test using IO-pound-per- square-inch pressure transducers, eight channel Hermit 2000, and LTM 3000 data loggers. The drawdown data were recorded in feet, with a specified reference point of zero feet. Before the tests were started, the pressure transducer constants and test numbers were verified by reviewing the input parameters in the data loggers.
Following the collection of all field data, modeling exercises were initiated. A finite-difference groundwater flow program MODFLOW was selected for the flow portion of the model. MT3D was selected for the transport portion of the model; this code offers a choice of different numerical solution schemes for the transport and can be directly linked to MODFLOW. A graphical processor M O D E for MODFLOW and MT3D was used for model input and output. The degradation of a solute in MT3D is simulated using a first order decay; both dissolved and sorbed phase can be degraded. Only the dissolved phase was allowed to degrade in the presented model. hfT3D was selected because of the model’s ability to link with USGS MODFLOW. simulate time-varying constant concentration at the source, and inpudoutput portability.
RESULTS Geologically, the BXSS sits on an uplifted late Pleistocene marine terrace covered with well- sorted, fine-grained sand and clay beds deposited in a shallow marine or lagoon setting. The sands are very well sorted with rounded and polished quartz grains. A fine-grained to silty sand is present from the surface to a depth of 19 to 28 feet. An upper clay bed 2 to 4 feet thick occurs within the sand, between depths of 12 and 16 feet. The bed consists of silty clay and clayey sand, and is highly deformed with high-angle to vertical beds or blocks of sand within the clay. The clay bed may have been deformed by large animal bioturbation, grazing animals sinking into soft sediments, or some other mechanism of soR sediment deformation. The apparent variable thickness of the upper clay bed may be due to its deformed or irregular nature,
A deep clay bed, approximately 4 to 5 feet thick, is present at a depth of 19 feet under the east side of the site, dipping to a depth of 28 feet northwest of the BXSS. The deep clay grades from a fat clay to a clayey silt and clayey sand from top to bottom. The clay bed is continuous under the site and dips to the northwest.
A perched saturated zone is present from approximately 9 feet below the surface to the deep clay bed Both the piezometric surface and the underlying clay slope to the northwest. Sand and gravel beds below the deep clay bed are unsaturated, and a deep saturated zone was not found to a depth of 60 feet below the site. A deeper perched groundwater was not found above the clayey silt bed at 38 feet depth, which suggests that little water is migrating through the deep vadose zone. The clay bed at a depth of 15 feet is not expected to be a barrier to groundwater movement
814
1

I
b e c a w ofthe disturbed nature of the bed. The deep clay bed forms an impermeable bottom of the d d o w saturated zone and prevents vertical migration of contaminants.
The shallow saturated zone water table was found to be unconfined. The saturated thickness of the s.hallow zone ranges from approximately 10 feet to 21 feet. Groundwater flow direction is approximately to the north with an average hydraulic conductivity of 0.52 Wday. Flow into the aquifer beneath the site occurs predominantly from the south and west. Groundwater is also likely recharged from a car wash at the site. The evapotranspiration of Eucalyptus trees along California Avenue appears to have a significant impact on the groundwater flow budget. A groundwater flow model of the site was completed using MODFLOW and a fit within 0.66 foot ofthe observed water levels was achieved.
Once the site groundwater flow model was established, groundwater data were collected and evaluated to determine the occurrence of biological activity at the site and the loss of con- taminants of concern. Biological activity at the site has created a reducing environment in the plume source area (ix., in or near the old pump island). This area is dominated by anaerobic metabolic pathways such as iron and manganese respiration, sulfate reduction, and methanogensis. The plume fringe has a high capacity for aerobic metabolism with increased concentrations of nitratdnitrite and a positive redox. Overall, the biocapacity of the aquifer to assimilate the release exceeds the sum BTEX detected during the September 1996 sampling event.
A first order decay rate for BTEX removal was calculated following correction of the BTEX concentrations for loss of a recalcitrant tracer (1,3,5-trimethylbenzene). Corrected concentrations indicated that within the plume core, 99 percent of the benzene concentrations were removed by biological reduction rather than physical attenuation. Based on these corrected concentrations, a first order decay rate for BTEX was estimated. A decay of 0.12 yf' BTEX removal was calculated. Based on the potential biological reduction of the tracer under field conditions, this rate is considered overly conservative.
Once the plumes were delineated, concentrations determined, and the groundwater flow model calibrated, MT3D was used to simulate contaminant fate and transport. The sum of BTEX components was used to represent the contaminant concentrations in the fate and transport model (MT3D). The results of groundwater sampling were used to represent the current distribution of concentrations. The sum of current maximum concentrations of BTEX components was assumed to represent the current source concentration.
It was assumed that groundwater was first impacted in 1970. The source concentration at the time of release was assumed to be 20 times higher than the current source concentration and was assumed to exponentially decrease over time. A combined aerobichaerobic biodegradation rate was used to predict loss due to biological activity. The model results indicate the model is in agreement with the high concentrations in the center of the plume, while concentrations higher than observed were calculated at the plume edges (a conservative result). This may be explained by a faster, aerobic degradation of the actual contaminants at the plume edges. The BTEX attenuation time to achieve 1 part per billion was estimated at less than 100 years.
An exponentially decreasing source concentration was also used to determine the fate and transport of hlTBE the rate of decrease was the same as the rate estimated for the BTEX source. No biological degradation of MTBE was assumed in the model. The h4TBE concentrations persisted at the site, with the maximum concentrations occurring in the vicinity of well 1-MW-3. The concentration buildup in this area may be explained by groundwater uptake by the trees, Additional sampling rounds will facilitate the calibration of the fate and transport models.
Although contaminants may persist at the site for an extended period of time, no migration of the MTBE or BTEX plume was identified or predicted. The risk to human health and the environment is also negligible. No drinking water sources are present within 3 miles upgradient or downgradient of the site. And all near- site groundwater production wells are screened from 200 to 400 feet deep. Based on fate and transport modeling, the plume will never reach these wells.
CONCLUSION Based on the documented occurrence of biological contaminant reduction, lack of contaminant migration, and the absence of risk that the impacted groundwater poses, natural attenuation should be considered as a means of site remediation and potential closure.
815

'@ GROUNDWATER MONITORING WELL MW-13
o DIRECT-PUSH SOIL BORING SE8
@ AUGER SOIL BORING 5841
~ BENZENE CONCENTRATIONS IN ug/L
(c- NO - NON-DETECT
FIGURE1 BENZENE QROUNDWATER
CONCENTRATlON CONTOURS SEPTEMBER 1998
BASE EXCHANQE SERVICE STATION PREPARED FOR
U.S. AIR FORCE VANDENBERQ AIR FORCE BASE
CALIFORMA
816

EXPLANATION
GROUNDWATER MONITORING WELL MW-13
DIRECT-PUSH SOIL BORING SEB
@ AUGER SOIL BORING SEI1
7 MTBE CONCENTRAllONS IN ug/L
FIGURE 2
MTBE GFIOUNDWATER CONCENTRATION CONTOURS
SEPTEMBER 1008 BASE EXCHANQE SERVICE STATION
PREPARED FOR
US. AIR FORCE VANDENBERG AIR FORCE BASE
CALIFORNIA f - - NO - NON-OETECT
817

EX SITU BIOLOGICAL PETROLEUM REMEDIATION: LANDFARM CASE HISTORY
Kevin M. Brackney, M.S., P.G.; andR.L. Crawford, Ph.D. Center for Hazardous Waste Remediation Research
University of Idaho, Moscow, ID 83844-1052
INTRODUCTION
In the late 1980s. the University of Idaho (Up negotiated an option to purchase an 1 I-acre indus- trial parcel in Moscow, Idaho, for possible university expansion. Phase I and Jl environmental site investigations took place at three former petroleum bulk plants on this site, and at four un- derground storage tank sites (USTs) on the UI campus. The investigations identified =20,00 yd3 of soil with weighted average total petroleum hydrocarbon (TPH) concentrations of 947 ppm oil, 465 ppm diesel, and 624 ppm gasoline. The Idaho Divisjon of Environmental Quality (IDEQ) petroleum cleanup requirements mandated remediation levels of 40 ppm gasoline, 100 ppm diesel, and 40 ppm oil based on depth to groundwater (<25 ft) and proximity to surface water (< I00 ft). The low permeability of the contaminated silt-clay-sand sediments and refractory long- chain hydrocarbons indicated that in situ remediation would be unlikely to achieve cleanup levels in an acceptable time period. Excavation was considered necessary, but the high cost of low- temperature thermal desorption ($1.3 million at $65/ton, plus trucking) and lack of a local commercial landfarm required that UI design and construct its own landfarm to bioremediate the petroleum-contaminated soil (PSC). An administrative decision was made to maintain ownership of the PCS over concerns about potential liabilities from the landfarm operation or residual contamination. Negotiations with the responsible parties were conducted on a sliding scale based on shared responsibility with a service fee of =$35/yd3.
Idaho Division of Environmental Quality siting criteria for land application of petroleum-con- [aminated soils (IDEQ, 1994) specified six major landfarm siting criteria: 12% maximum slope, 100-ft minimum distance from surface water, 100-ft minimum distance to water wells, 931-ft setback from buildings (based on estimated contaminant concentrations and volumes), and >25 ft to groundwater. In addition, treated soils were not be used for food-chain agricultural purposes, regardless of the level of remediation. On the basis of these criteria, three critical questions were raised: ( I ) Could the landfarm be designed to prevent surface and groundwater contamination? (2) Would the contaminants be degraded in the acceptable 2-year time frame? (3) Would residual metal contamination perpetually classify the soil as hazardous waste, preventing the return of the land to agricultural use?
SITE DESCRIPTION AND EXPERIMENTAL METHODS
Hydrogeologic site investigations consisted of a literature review, consulting water well boring logs in a 2-mile radius, and drilling a total of 12 hollow-stem-auger boreholes to characterize the shallow stratigraphy. The chosen landfarm site is located on a northwesterly trending ridge =900 ft long, 200 to 450 ft wide, and covering = I O acres within the city limits of Moscow, Idaho. The average slope is about 9%. with 80 ft of elevation change from top to bottom. Previous land use at the site was pasture for the UI beef herd.
Since the landfarm was designed to be placed on an unlined parcel of agricultural land, careful consideration was given to the regional and site hydrogeology to assess probable impacts to groundwater. Detailed hydrogeologic investigations previously conducted at the UI Aquaculture Site, located =I600 ft to the northeast of the landfarm (Kopp, 1994), and the UI Groundwater Research Site, located 2500 ft northeast (Li, 1991), indicated that a basalt aquitard separates the shallow alluvial and upper fractured basalt sub-aquifer from the upper drinking water aquifer. This site-specific hydrological barrier, combined with a relatively thick vadose zone (135 ft) composed of silt, clay, and basalt, suggested that impacts to groundwater would be minimal at the landfarm site. Interpretation of the data indicated that the petroleum was at residual saturation in the soil, so free product migration was unlikely to be a problem. Dissolved organics were a potential problem but were considered degradable in the aerobic vadose zone beneath the land- farm, or in the shallow drainfield in the stormwater discharge ’zone. Absence of surface water runon, generally well-drained soils with a high soil moisture-holding capacity, and reinfiltration of the limited quantity of stomwater runoff prevented any direct surface water impacts from the landfarm. The primary concern for off-site contaminant migration was from soil erosion. The fine-grained, unconsolidated contaminated soils placed on an 8% slope were highly erodible, so considerable efforts were expended to prevent offsite soil migration.
818

One to two feet of topsoil was stripped from the landfarm , placed in a berm along the perimeter, and covered with straw and coconut fiber erosion control mats to stabilize the berm and to con- tain all Contaminated soils within the landfarm area. To minimize erosion on the landfarm during the winter and spring, the soil was aerated with a subsoil ripper along contour and covered with composted manure and animal bedding, and silt fences were installed and spaced on 50-ft centers parallel to contour (Gill, et al., 1997).
\
i
- .
\
1
A seasonal perched water table was identified on the lower third of the landfarm (Brackney, 1995). A Stomwater runoff and leachate collection system was keyed into a low-permeability “B-soil” horizon. It was designed as an underdrain to prevent ponding by gathering water into tWO IC@O-gallon sediment-settling and oil-water separator tanks. A 12-inch culvert drains the tanks and discharges to a trapezoidal flume where stormwater effluent is gauged with an ISCO 4230 bubbler flow meter and sampled with an ISCO 3700 stormwater sampler prior to discharg- ing to a shallow drainfield. Six groundwater monitoring wells were installed, four upgradient and two downgradient from the landfarm, including three multi-point standpipe well clusters. These were sampled to characterize petroleum and inorganic impacts to the shallow groundwater.
A literature review indicated the following optimal conditions for petroleum biodegradation: Maintain soil 0 2 levels at near atmospheric conditions by thin spreading the soil and tilling whenever levels are <5%; maintain soil moisture levels to 60-70% of field capacity; and balance the carbon:nitrogen:phosphorus levels to 10-20: 1 :O. 1
The landfarm was irrigated with secondarily treated sewage effluent from the municipal waste- water treatment plant which was applied with a wheel line sprinkler irrigation system. Soil moisture was measured in the field by Soil Moisture Equipment tensiometers (model 2725AR) installed in three arrays from 6 to 36 inches deep. The contaminated soils were aerated monthly during the growing season by a subsoil ripper with 2.5 ft ripper teeth, spaced on 2.5 ft. centers, with an attached ripper shoe to increase soil fracturing. Soil 0 2 levels were sampled with an AMs soil vapor probe and analyzed with a hand held combustible gad02 meter.
Because of the heterogeneity of the petroleum concentrations from seven sites in various stages of weathering, three 30-ft-diameter grids were installed across the site. Although the contami- nated soil had been placed on the site in fall 1994, change in TPH concentrations over time were measured in each grid in May and October 1995 to estimate the progress of degradation over the entire site. Three different treatments were designed for the grids: Grid 1 was planted in perennial ryegrass and irrigated, Grid 2 was tilled and irrigated, and Grid 3 was tilled without irrigation. Most probable number (MPN) bacterial counts, with hexadecane as a sole-carbon source, were measured from soil samples collected during the May and October 1995 sampling periods. A random number radial-coordinate system was generated to select sample locations within each grid. At the end of the first season, a crop of rapeseed and perennial ryegrass was planted for ero- sion control. At the beginning of the second season (June 1996) the entire site was sampled, establishing uniform gridlines across the site. On each gridline random numbers were generated to select sample locations along the line. Because the oil fraction was considered to be the slow- est to degrade, EPA Method 418.1, TPH-Oil, was selected to monitor remediation progress. In June 1997 another round of soil samples will be collected to measure residual contamination.
RESULTS
Very little dissolved or miscible petroleum products were transported offsite from stormwater runoff (Figure 1). Ethylbenzene and xylene were detected only on November I , 1994, with total concentrations of 0.036 m g L Maximum TPH-diesel was 1 mg/L in December 1994, while the maximum TPH-oil of 2.6 mg/L was measured in March 1995. The low levels of TPH-diesel and oil may reflect interference from the high organic concentrations leached from the composted animal manure. The erosion controls at the site worked remarkably well, and no contaminated soil left the landfarm, largely as a result of the compost covering the site.
Leachate from the compost contributed high nitrogen concentrations (NHs, NO3, and organic N), chemical oxygen demand (COD), and total dissolved solids (TDS) to stormwater runoff (Figure 2). Maximum concentrations of total nitrogen (400 m&), COD ( I ,800 m a ) , and TDS (2,800 mg/L) occurred in December 1994. Dissolved lead concentrations were also elevated during this period, peaking at 22 bg/L (data not shown). These dissolved inorganic constituents declined during the first year and stabilized by March 1996, with lead concentrations dropping to below detection limit ( I pg/L).
The downgradient monitor well network showed elevated nitrate during spring 1995, with maximum concentrations of 61 mg/L N03-N in the perched aquifer, as compared to a back-
819

ground of 1-2 mg/L N03-N in the upgradient wells (Figure 3). COD increases in shallow groundwater is more difficult to assess, since several of the of the upgradient wells apparently have COD concentrations similar to those of the downgradient compliance wells.
During the first season, changes in TPH-oil concentrations were most significant in Grid 1, seeded with ryegrass (Figure 4). Mean TPH changed from 203 f452 to 32 f 7 9 mgkg (error band = 1 SD). Grid 2, tilled and irrigated, changed from 230 t268 to 165 f29S mg/kg. Grid 3, tilled but not irrigated, was essentially unchanged from 5Sk47 to S4k28 mgkg. MPN bacterial counts measured from the samples ranged from 3.0 X 10’ to 2.7 x IO6 colony forming units per gram of soil (Table 1). When the entire landfarm was sampled at the onset of the second season, mean TPH-oil was estimated at 131f38 mgkg (p = 0.95); 45% of the samples were below the reme- diation criteria of 100 m g k g TPH. The maximum concentration from the June 1996 sampling was 620 mglkg, compared to the May 1995 maximum of 2,004 mg/kg.
Spot checks of soil 0 2 analysis indicate that at both 1- and 2-ft depths, 0 2 concentrations were >5% (data not shown). Soil moisture was maintained at 60 to 70% of field capacity on all areas of the landfarm except for the upper 6 inches of Grid 1 which were seeded to ryegrass (data not shown). Though the ryegrass was green throughout the season, evapotranspiration from this plot exceeded our ability to maintain the desired soil moisture levels.
Metal concentrations were determined to be the greatest potential impediment to returning the landfarm to pasture once degradation was completed. IDEQ conservatively interprets all TPH-oil concentrations as used engine oil with potentially toxic levels of heavy metals, particularly lead. Lead analyses, made routinely during the environmental site investigation, showed 149 soil sam- ples to have a mean lead concentration of S7+57 mglkg (error band = 1 SD) with maximum con- centrations of 640 mgkg. TCLP (toxicity leaching control procedure) analysis, conducted on two of the most contaminated samples, showed <5 mg/L lead in the resulting leachate, indicating that these soils did not test positive for the toxicity characteristic of hazardous waste. It was deter- mined that 74% of samples with lead concentrations greater than the mean came from depths 4 . 5 ft below ground surface. Of these, 40% had petroleum concentrations less than detection limit. Since background soil lead concentrations for nativehndisturbed Palouse soils range from 10-20 mgkg, mean lead concentrations for the contaminated soil are 3 to 6 times background.
DISCUSSION
The highly erodible soil at the landfarm was stabilized primarily by the high residue content of the comRosted manure, available at no charge and in unlimited quantities adjacent to the land- farm site. The unconsolidated and saturated contaminated soils were largely inaccessible to heavy equipment until they froze during the winter. Lack of adequate manure-spreading capability and a relatively short window of opportunity required that manure be spread with a dump truck and bulldozer, resulting in overapplication of compost. The unintended consequences were excessive nitrogen, COD, and TDS concentrations. The high organic content of the leachate apparently may have caused chelation of lead and other ions from the soil. These relatively short-lived problems had limited environmental consequences due to the minimal volumes of stormwater runoff from the site (data not shown). The high organic content of the compost may have helped limit the mobility of the petroleum by sorbing it onto the compost. Heavy fall rains brought earthworm populations to the surface through the contaminated soil, causing near-total earthworm mortality. However, by the next spring earthworms began to recolonize the site. The growth of healthy ryegrass and rapeseed crops indicates that the present soil toxicity is minimal.
Landfarm management was capable of maintaining 0 2 , soil moisture, and nutrient levels at near optimum conditions for petroleum degradation. Precipitation during the first season was suffi- cient to prevent Grid 3 from receiving enough moisture stress to differentiate its treatment from that of Grid 2. Since the initial TPH concentrations of Grid 3 were lower than the remediation criteria of 100 mgkg, the lack of significant change in TPH concentration in Grid 3 is inconclu- sive. Experience at the site showed that tillage was required less frequently than originally con- sidered necessary. Tilling only when soil moisture levels were at near-optimum conditions pre- vented compaction of too-wet soils, and avoided pulverizing soils that were too dry. The subsoil tillage was highly effective at fracturing the soils, and 0 2 stress was never detected. However, this was true even for the soil planted in ryegrass. This area, Grid 1, had the greatest total change in TPH concentration, possibly due to an enhanced microbial environment in the rooting zone of the ryegrass. Additional controlled research is needed to confirm this possibility.
Residual metal concentration in landfarm soils represents a potential long-term detriment to the site. The bioavailability of the lead is unknown. Even if the lead is not absorbed by forage crops,
820

\
\ \
\
Some may be ingested in soil by grazing animals. The absorption characteristics of lead in the gut of an animal is beyond the scope of this research. However, it is planned to cover the treated soil with the Stockpiled topsoil, reducing the potential for ingestion of lead-contaminated soil by cattle. Additional metal analysis planned for June 1997 will better assess the actual metal concen- trations of the landfarm soils. Though the soils exceed the background concentrations for lead, preliminary data indicates that the values are still relatively low, and we are optimistic that the landfarm can be returned to productive agricultural use.
ACKNOWLEDGMENTS
We would like to thank Ken Gill for his assistance in managing the field operations at the land- farm and Jennifer Meehan for microbiological work. We are grateful to the University of Idaho College of Agriculture for lending us some highly productive grazing land for use in landfarming petroleum-contaminated soil. We are optimistic that it will soon be returned, no worse for the wear it bas taken during the course of our research.
REFERENCES CITED
Brackney, K. M., J. Lee, and T. Bourque, 1995. Stormwater pollution prevention plan, petroleum contaminated soil landfarm. Center for Hazardous Waste Remediation Research, University of Idaho, p. 59.
Gill, K. W., S. M. Miller, and R. L. Crawford, 1997. Erosion control and water-quality monitor- ing at a petroleum landfarm, p. 137.141. In Proceedings of Conference 28, International Erosion Control Association, Feb. 25-28, 1997, Nashville, Tennessee.
IDEQ, 1994. Idaho Division of Environmental Quality, Boise. UST Information Series no. 7. Kopp, W.P., 1994. Hydrogeology of the upper aquifer of the Pullman-Moscow Basin at the
Li, T., 1991., Hydrogeologic characterization of a multiple aquifer fractured basalt system. Ph.D.
/’ 7
University of Idaho Aquaculture site. M.S. thesis, University of Idaho, Moscow, p. 192.
dissertation, University of Idaho, Moscow.
I 10
1
0.1 2
0.01
OTPH-Cas M B T M OTPH-Diesel OTPH-Oil I Figure 1. Petroleum concentrations of landfarm stormwater.
lw00
1000
$ 100
10
1
/OTotal-N MCOD OTDS I Figure 2. Stormwater analysis. Total N = NH3-N, N03-N, and organic nitrogen; COD = chemical oxygen demand, TDS = total dissolved solids.
821

Figure 3. Groundwater concentrations of inorganic compounds, spring 1995. Monitor well cluster [email protected] ft and 16 ft is immediately downgradient from the landfarm. The 4.5 ft depth is located in the same perched water table that the stormwater collection facility is keyed into. Petroleum was not detected in any of the wells (data not shown). The 16-ft-deep well is located in a sand lens on top of the underlying basalt in a seasonal aquifer that is moderately protected by a clayey-silt aquitard. MW-9 is downgradient; the other wells are either upgradient or lateral to the landfarm. The nitrate and COD concentrations of wells, except for MW-5, probably indicate background levels on fertile pasture under range management. Elevated nitrate concentrations in MW-5 may result from lateral groundwater interflow from the landfarm, or the presence of cattle manure.
Date May, 1995 October, 1995
Grid 1 Grid 2
E IW95 B
E
Grid 1 Grid 2 Grid 3 7.69M.75 x IO5 1 . 6 1 M . 1 2 ~ IO6 3.47M.2 x IO6 2.67M.08 x IO6 1.03M.07 x IO6 3.01M.O x IO5
Total Landfam
I
Figure 4. Total petroleum hydrocarbon (TPH) concentrations over time. Grid 1 (ryegrass and irrigation); Grid 2 (tillage and irrigation); Grid 3 (tillage only). Rapeseed and ryegrass were planted over the majority of the landfarm in October 1995. The total landfarm was sampled in June 1996, when a mature rapeseed crop covered the majority of the landfarm, except for Grid 1, which had a mature ryegrass covercrop. Error bars = 1 SD.
Table 1. Most probable number bacterial counts in colony forming units per gram of soil.
822

\
f
POTENTIALS AND LIMITATIONS OF BlOREMEDlATlON OF A DIESEL FUEL CONTAMINATED SITE
Martin Steiof I, Matthias Meier-Lohr ’, Gerhard Battermann ’ and Wolfgang Dott
I Institute for Environmental Microbiology and Hygiene, Technical University of Berlin, Germany ’ Technologieberatung Grundwasser und Umwelt (TGU) GmbH, Koblenz, Germany
Department of Hygiene and Environmental Medicine, RWTH Aachen, Germany
ABSTRACT
In situ bioremediation relies on the stimulation of microbial activity and enhancement of the mass transfer rate of contaminants from nonaqueous phase liquids (NAF’L) into the aqueous phase. Over a period of four years, a sandy aquifer contaminated with residual constituent compounds of aged diesel fuel was infiltrated with H202 and nutrient-amended water. The release and biodegradation of the hydrocarbons was improved by a factor of about 20 - 50. However, it became apparent through soil analysis that the mass transfer kinetic was the limiting factor. The conclusion was reached that the soil clean-up levels are too far below the levels which are perceived to be technically and economically feasible. Nevertheless, GC-analysis showed that the more soluble aromatic compounds, which have been widely regarded as the primary contaminants affecting groundwater, had been completely removed Evidence gathered while monitoring the groundwater for one year following the bioremediation process indicated that the established water clean-up levels could easily be maintained through the 111 situ treatment.
INTRODUCTION
The In situ bioremediation of the described diesel oil contamination started in the beginning of 1992, ended 4 years later, and was in a final monitoring phase in the beginning of 1997 In 1992, the authorities established limiting values (clean-up levels) for total petroleum hydrocarbons (TPH) of 500 mg/kg dry weight for soil and 500 pglL for groundwater In order to evaluate the efficiency of the remediation, an attempt was made to follow the reduction of hydrocarbons in groundwater and soil. In general, the balancing of the degradation during an in siru bioremediation and the dcmonstdtion of the remediation success afterwards is very difficult, due to several problems in monitoring a ‘black-box’ system (Madsen, 1991).
MATERlAL AND METHODS
Description of the Contaminated Site The contamination caused by a leaking pipeline 45 to 50 years ago was assumed to be associated with diesel oil. The estimated amount of leaked diesel oil was 15,000 to 17,000 L, and most of the oil floating on the groundwater was removed at the end of the I970s, leaving approximately 5,700 kg The subsoil of the contaminated area is characterized as a Pleistocene aquifer with fine- and medium-grained sands. The average permeability (kf) is l o 4 to 5 x IO4 d s . The highest concentration of TPH was about 18,000 mdkg dry weight (see Figure 2, at a depth of 6 to 7 m). The pollution is distributed to a depth of 4 to 9 m below ground level, thus lying in the aquifer (the groundwater level is approximately 4.5 m below ground level). Gaschromatographic profiles of water and soil extracts showed no typical n-alkanes, thus indicating that these compounds had already been degraded. Details concerning the chemistry of the contamination (Steiof, 1993) and the inorganic parameters of this bioremediation (Steiof & Dott, 1995) have been described previously. A top view of the contaminated area, illustrating the positions of the production and infiltration wells, all observation wells, and the distribution of the hydrocarbons is given in Fig. 1
Remediation Design The in situ remediation design included two infiltration wells, two production wells, and an on-site groundwater processing plant. This groundwater treatment-plant consisted of an iron-removal filter, an oxygenator (using technical oxygen gas), 2 manganese-removal filter, and an air stripping column. Before the reinfiltration of the treated groundwater, it was possible to add electron acceptors and nutrients. To meet the electron acceptor demand, hydrogen peroxide and nitrate were added to the reinfiltrated water. Phosphate was added to meet the nutrient demand. During the four years of operation, the following amounts were added tothe infiltration water: H202 : 33 t (about 15 t 02) ; NaN03 : 5 t; (NaPO,). : 0,4 t (about 0,3 t PO4).
823

The two production wells had a joint average production rate of 5-10 m3/h and the two infiltration wells ajoint average rate of 3-6 m3/h during the four years of operation. The groundwater velocity during operation was about 2 d d , in contrast to 0.4 d d without operation. The average residence time of the circulated groundwater in the aquifer was about I5 days (Battermann & Meier-Lohr, 1996).
RESULTS AND DISCUSSION
Hydrocarbons in Soil The hydrocarbon concentrations in the soil samples of ram boring S3 during the remediation are given in Figure 2. The samples ‘-100 days’ represent the concentrations 100 days before the bioremediation was started. Afterwards samples were taken from the same location with a horizontal shifting of 10 cm each year. Some samples from later ram borings contained higher TPH concentrations than earlier samples. After 1340 days of remediation TPH concentrations higher than the limiting value remained in some samples. The soil samples of the ram borings S 1, S2 and S4 showed similar results. Because of the heterogeneity of the subsoil and the typical inhomogeneous distribution of the contaminants, soil samples can not be regarded as representative. A significant reduction of the contaminants was observed only in an advanced stage of the remediation process. Obviously, the homogeneity and the permeability of the aquifer have a decisive influence on the success or failure of an in sifu remediation.
Eydrocarbons in Groundwater The TPH concentrations in groundwater samples from three observation wells are given in Figure 3 . During the first year of bioremediation, no effect from addition of electron acceptors and nutrients could be observed. The highest TPH concentration was about 2,100 pgR. in well 8 5 (in most observation wells C1,OOO )I&) and there was no significant decrease during this time. However, a decrease was not expected because a permanent re-solubilization of hydrophobic fuel oil compounds from the soil matrix into the water matrix occurred. After two years of bioremediation, the TPH concentrations in all observation wells settled down below the given limiting value of 500 p&. The gaschromatographic profile of the hydrocarbons in the groundwater of observation well B5 (exemplarily for all observation wells within the contaminated zone) in the beginning of the remediation process is given in Figure 4. In contrast to the GC-MS analysis of the hydrocarbons in soil, only aromatic hydrocarbons could be identified in the groundwater extracts. Iso-alkanes could not be identified. After about 3.5 years of operation, the typical aromatic compounds (see Figure 4) were completely removed and the TPH concentrations declined below the clean-up level of 500 )I@.
Methodical Approach to the Quantification of Hydrocarbon Degradation Because of the lacking representativity of the soil samples and the lacking correspondence of TPH in soil and groundwater samples, a different approach to balance the success of the fuel oil degradation was made (Meier-Lohr, 1997). For this indirect attempt, the consumption of added electron acceptors (oxygen from hydrogen peroxide; nitrate) as well as the production of inorganic carbon species (free carbon acid and hydrogencarbonate) had to be determined in groundwater samples. Unfortunately, the complete quantification of these compounds is complicated (Zeyer et al., 1995) since additional sources ( eg . mobilization of mineral lime) and sinks (oxydation of inorganic compounds) are difficult to estimate. A balance applying this approach (consumption of electron acceptors and production of inorganic carbon species, measured as acid- and base- capacity) showed that about 3,500 to 3,700 kg (60 to 65% of the starting amount) of the hydrocarhons were degraded.
Registration of the Risk Potential Experiences with different in sifu bioremediations showed that the given limiting values often were not reached in all soil samples. Nevertheless, there is not enough knowledge to estimate the risk potential of these remaining hydrocarbons at the end of a bioremediation. On the other hand, a bioremediation usually leads to a reduction of the contaminants and the toxicity in the groundwater (Dasappa & Loehr, 1991) and, as a consequence, the risk potential will be lowered or eliminated. It is generally accepted, that the mobility and bioavailability of contaminants have a crucial influence on the risk potential of a polluted site (Rippen et a1.,1994). Therefore, it is more important to monitor the TPH concentrations in the groundwater than in the soil. In addition, the application of toxicity tests is necessary (DECHEMA, 1995). Chemical analysis of environmental samples usually does not lead to reasonable predictions of biological or ecological effects. Toxicity tests, however, integrate the effects of all mobile and bioavailable contaminants and complement
824

7
the chemical analysis of a contaminated site. W e conducted the bioluminescence test assay with Vibrio fischeri according to the German Standard Methods (1991). The ECso-values of the groundwater samples of the remediation zone and downstream of the contaminated area did not reach toxic levels (data not shown here).
CONCLUSIONS
During a final control phase, the groundwater was examined with special attention given to the TPH concentrationc and the toxicity. Although the TPH concentration in some soil samples exceeded the limiting values, the authorities agreed to bring the remediation to an end. The TPH concentration in the groundwater in combination with the results o f the toxicity tests seemed to verify, that the risk potential o f this contamination has been eliminated. However, it became apparent through soil analysis that the mass transfer kinetic from the NAPL attached to the soil surface in the groundwater was the limiting factor. The conclusion was reached that the soil clean-up levels are too far below the levels which are perceived to be technically and economically feasible. Nevertheless, GC-analysis showed that the more soluble aromatic compounds, which have been widely regarded as the primary contaminants affecting groundwater, had been completely removed. Also, the dissolution of the remaining low soluble aliphatic hydrocarbons did not reach detectable levels and therefore did not affect the groundwater quality. Evidence gathered while monitoring the groundwater for one year following the bioremediation process indicated that the established water clean-up levels could easily be maintained through the in situ treatment. Given that the main objectives are the clean-up and protection of water resources, the application of an in situ remediation technology is technically and economically effective.
ACKNOWLEDGEMENTS
We thank the 'Berliner Wasser-Betriebe' (water works) for their research grant
REFERENCES
Battermann, G. and M. Meier-Lohr. 1996. ,,Etfahmngen aus zwei in situ Sanierungen in der ges;ittiyen Bodenzone". In Kreysa,G. u. Wiesner, I. (Eds.): In-Silu Sanierung van Baden, l l . DECH- Fachgesproch Untweltschutz, DECHEM, Frankfull n.M., 163-JYO.
Dasappa, S M. and R. C. Loehr. 1991. "Toxicity Reduction in Contaminated Soil Bioremediation Process." Wat. Res. 25(9): 1121-1130.
DECHEMA (Dott, W. and K. Hund). 1995. "Bioassays for Soil" In G. Kreysa and J. Wiesner (Eds.), 4fh Report of the Interdisciplinary DECHEMA Committee .,Environmental Biotechnology - Soil", Ad-hoc- Commrtee ,.Methods for Toxicological/ Ecoloxicological Assessmenl ofSoils", Ibpuges, DECHEMA e.V.. Frankfurt a.M..
German Standard Methods. 1991. "Testverfahren mil Wasserorganismen, Bestimmung der Hemmwirkung yon
Bakterien." Deulsche Einheitmerfahren zur Wasser-. Abwasser- und Schlammuntersuchung DIN 38412 Teil 34, L34.
Madsen, E. L. 1991. "Determining in situ Biodegradation."Environ. Sci. Technol. 25(10): 1663-1673.
Meier-Lohr, M. 1997. ,,BilanzieNng und Modellierung von biologischen und physikalischshemischen Prnzessen bei der In-Situ Sanierung von kohlenwasserstoffverunreinigten Grundwassersystemen", PhD Thesis. Technical University of Dresden, Germany
Morgan, P. and R.J. Watkinson. 1992. "Factors Limiting the Supply and Efficiency of Nutrient and Oxygen Supplements for the in situ Biotreatment of Contaminated Soil and Groundwater". Wat. Res 26( I): 73-78.
Rippen, G., T. Held, and P. Ripper. 1994. Ecotoxicological and Toxicological Considerations." Environ. Sci. Poll Res. l(3): 185-189.
Steiof, M. 1993. "Biologische in situ Sanierung eines mil Dieselol kontaminierten Aquifers." Ph. D. Thesis and Publication from the Department of Hygiene, Technical University of Berlin, Germany.
Steiof, M. and W. Dott. 1995. "Application of Hexametaphosphate as a Nutrient for In Silu Bioreclamation". In R. E. Hinchee, I. A. Kittel and H. J. Reisinger (Eds.), Applied Bioremediation of Petroleum Hydrocorbons, pp.301- 3 IO. Battelle Press, Columbus, OH.
Eyer, J., P. Hohener, D. Hunkeler and D. Hahn. 1995. "In silu Bioremediation of Mineral Oil Contaminated Soils and Aquifers: Quantification of Degradation Rates and Fate of Hydrocarbons." In W. I. van den Brink, R. Bosman and F. Arendt (Eds.), Contaminated Soils '95, pp. 3 19-326. Kluwer Academic Publishers, Netherlands.
\
1 Abwasser aufdie Lichtemission von Photobacterium phosphoreum - Leuchtbakterien-Ahwassenat mit konservierte
"Microbiological Remediation of Waste-Oil Polluted Soils -
825

LEGEND:
gl Production Well 0 Observotion Well
- Concentratlo" contours Of ~ Hydrocurbons in Soil (mg/kg)
-> Groundwater Flow Direction
- _ a lnflltrOtlOn well . + Point 01 Rum Boring
0 Vopor Monitoring Point
FIGURE 1. Top view of the contaminated area with TPH concentration and the position of all wells and points of ram boring with open sided tube.
a i
4-5
FIGURE 2. Hydrocarbon concentrations in the soil of ram boring S3.
826

t
G
2
bL 5 30
Time (min )
1
A: 1.2,CTrimethylbenzene 6: 1.2.3-Trimethylbenzene C: 1-Methyl-2-propylbenzene D: 2,3-Dihydroxy-l-methyl-l H-indene E: 4-Ethyl-1.2-dimethylbenzene F: 1,2,3,5-Tetramethylbenzene G: 1.2.4.5-Tetramethylbenzene H: 2,3-Dihydroxy-l.6-dimethyl-lH-indene
I: 1,2.3.4-Tetrahydroxy-5-methylnaphth. J: five-fold alcylated benzene K: 2,3-Dihydroky-4,7-dimethyl-l H-indene L: 1-Methylnaphthalene M: 1,6-Dimethylnaphthalene N: 1,2-Dimethylnaphthalene 0: 2,3-Dimethylnaphthalene P: Elhylmethylbenzothiophene
-200 0 200 400 600 800 1000 1200 1400 1600 1800 2000
Days after Start of Remediation
o Observabon Well 61 Obsetvabon Wen 82 A Observation Well 65 Trend Well 61 __ Trend Well 82 - - - Trend Well 85 -
FIGURE 3. Hydrocarbon concentrations in the groundwater of the observation wells B 1, B 2 and B 5.
17eI 7000
I I
FIGURE 4. Gaschromatographic analysis of the hydrocarbons in the groundwater of Observation well B 5 (TPHsoncentration: 1,800 p&).
827

CHEMICAL COMPOSITION CHANGES AND BIODEGRADATION POTENTWS OF NINE ALASKAN OILS UNDER FRESHWATER INCUBATION CONDITIONS.
Zhendi Wang, S. Blenkinsopp, M. Fingas, G. Sergy, M. Landriault, and L. SigoUin ESD, Environment Canada, 3439 River Road, Ottawa, ON KIA OH3
J. Foght and K. Semple Dept. of Biological Sciences, Univ. of Alberta, Edmonton, AB T6G 2E9
D. W. S. Westlake Westec Microbes Ltd., Victoria BC V9C 1x4
ABSTRACT Nine representative Alaskan crude oils and oil products commonly transported in Alaska
were weathered and incubated using the Environment Canada fkshwater oil biodegradation protocol. A complete ‘’total oil analysis method by GC/MS and GC/FID” was developed for monitoring and quantifying the resultant compositional changes of the biodegraded oils. All of the oils exhibited measurable hydrocabon losses after incubation. Various indices were deiined to describe the biodegradability of the oils. The Jet B Fuel and Diesel No.2 were more biodegradable than Alaska North Slope and Cook Inlet crude oils, while the Bunker C/Diesel mixture was found to be less biodegradable than these crude oils. The screening procedure developed in this work would be useful in optimizing the application of bioremediation technology for the cleanup of spilled oils in selected freshwater environments. In addition, an analytical method bas been developed to differentiate oil composition changes due to weathering fiom those due to biodegradation.
XNTRODUCXION Bioremediation has received much attention as an option for oil spill cleanup [I-81,
especially for inaccessible or sensitive environments. However, before bioremediation can be considered a realistic method for spill response, two factors must be considered. First, is the oil relatively biodegradable? Secondly, if the oil is biodegradable, to what degree does the oil composition change? These data are critical for making the least environmentally damaging and most cost-effective cleanup decisions. Oils vary greatly in their chemical composition, depending on their geological sources. There is no point in using an effective and relatively non-toxic bioremediation agent on a crude oil or oil product that is not going to degrade readily.
At present, little information exists on the biodegradation potential of crude oils and oil products in Arctic fkshwater systems. The purpose of this study is to determine the biodegradation potential, under freshwater conditions, of nine crude oils and oil products commonly transported in Alaska, using a defined microbial inoculum and quantitative oil analysis, ranking the 9 oils, in terms of susceptibility to biodegradation. With this data, spill responders would be able to make judicious decisions regarding clean-up effort and the potential use of bioremediation strategies in Arctic freshwater environment.
METHODS Weathering of Nine Oils and Oil Products
Nine oil and oil products were selected for biodegradation tests under fkshwater incubation conditions based on discussions with the Alaska Department of Environmental Conservation (Camille Stephens), the Cook Met Regional Citizens Advisory Council (Ruth Post) and the Cook Inlet Spill Response Group (Eric Haugstaud). They are North Slope (NS) oils collected from Northern Pipeline, Middle Pipelie, and Southern Pipeline respectively, Jet B, Diesel No.2, Cook Met (Granite Point), Cook Inlet (Trading Bay), Cook Met (Swanson River), Bunker C/Diesel Mixture.
The oils were collected in uncoated one gallon (US.) paint cans and were weathered at the Environmental Technology Centre (ETC) by pouring them into 250 mL beakers and letting them stand for 24 hours in a h e h o o d . The evaporative loss by mass varied in a wide range from 0.23% for Bunker C/Diesel mixture to 22.16% for Cook Inlet (Granite Point).
Oil Biodegradation Method The nine weathered Alaskan oils were tested for biodegradation potential in batch of three.
Eight flasks were prepared for each oil (Table 1). Briefly, the tests were conducted as follows: Two hundred mL of standard freshwater medium 19) was added to a 500 mL Erlenmeyer flask and sterilized with an autoclave. After cooliag, the appropriate flasks were supplemented with 4 mL of a filter-sterilized stock solution of nibgen and phosphate (+N, P) (1 g/L of NH,Ch 2 g/L of KNO,; 0.5 g L &HPO,). Six microbial Strains (3 aliphatic degrade= and 3 aromatic degraders) comprised the standard freshwater inoculum used in the hshwater oil biodegradation potential test. Oil was added gravimetrically (400 mg) to each flask, using a 5 mL ground glass syringe, weighed before and after each oil addition to the nearest 0.1 mg. Duplicate, uninoculated flasks served as sterile ‘weathering’ controls to account for abiotic oil losses through volatility and dissolution during the
828

FLASK ALASKAN OIL FRESHWATER OF INTEREST INOCULUM
NUTRIENTS (NJ)
Chemical Analysis of Oil Composition Changes Each residual oil extract was made up to 5.0 mL with hexane using a 5.0 mL volumelric flask.
A 200 pL aliquot of the diluted residual oil extract (about 16 mg of oil) was quantitatively transferred onto the pre-conditioned silica-gel column for oil hydrocarbon group tiadonation [IO].
The following groups will be referred to when describing and discussing oil composition changes during biodegradation:
TPH or total gas chromatograph (GC) detectable petroleum hydrocarbons (GC-TPH): the sum of concentrations of all GC-resolved and unresolved hydrocarbons. The resolvable hydrocarbons appear as peah and the unresolvable hydromrbons appear as the area between the lower baseline and the curve defining the base of resolvable peaks;
Total aliphatics: the sum of concentrations of all resolved and unresolved aliphatic hydrocarbons including the total n-alkanes, branched alkanes, and cyclic saturates;
Total aromatics: GC-TPH minus the totalsaturates; Total n-alkanes: the sum of concentrationr of all resolved n-alkanes @om C,to C,, plus
pristane andphytane); Total of 5 alkylated PAHhomologous series: the sum of concentrations of f ie target alkylated
homologues of naphthalene, phenanthrene, dibenzothiophene, fluorene, and chrysene determined by GCIMS.
Analyses for n-alkane distribution and total petroleum hydrocarbons (TPH) were performed on a Hewlett-Packard (HP) 5890 gas chromatograph equipped with a flame-ionization detector (FID) and an HP 7673 autosampler. A 30-m x 0.32-mm id. (0.25-pm film) DB-5 fused silica capillary column (J&W, Folsom, CA, USA) was used. The carrier gas was helium (2.5 mumin). The injector and detector temperatures were set at 290 e and 300' C, respectively. The oven temperature program was: a 2 minute hold at 50 e; ramp to 300 % at 6 OC/min, and finally a 16 minute hold at 300 %. A 1 pL aliquot was injected in splitless mode with a 1 minute purge-off.
Analyses of target polycyclic aromatic hydrocarbons (PAHs) and biomarker compounds were performed on an HP Model 5890 GC equipped with a Model HP 5972 mass selective detector (MSD). System control and data acquisition were achieved with an HP G1034C MS ChemStation (DOS series). The MSD was operated in the selected ion monitoring (SIM) mode for quantitation of target compounds. An HP-5 fused-silica column with dimensions of 30-m x 0.25-mm id. (0.25- pm film) was used. The chromatographic conditions were as follows: carrier gas, helium (1.0 mL/min); injection mode, splitless; injector and detector temperature, 290 '?2 and 306 C respectively. The temperahue program for target PAHs was: 90 OC for 1 minute, ramp to 160 OC at 25 OC/min and then to 290 OC at 8'C/min, and hold for 15 minutes. The temperature program for alkylated PAHs and biomarker compounds was: 50 for 2 minutes, ramp to 300 'C at 6OC/min and hold 16 minutes.
For details of methodologies of fractionation, analysis quality control and quantification, please refer to references [IO-141.
RESULTS AND DISCUSSIONS Chemical Composition of the Weathered Source Oh
Figures 1 through 4 show representative GC chromatograms of sterile controls, negative controls, and positive controls, illustrating the changes in chemical composition of biodegraded oil samples. However, in order to put the biodegradation data in perspective, a brief overview of the initial composition (YO by weight) of the weathered crude oils and weathered oil products is usem. All of the crude oils and oil products tested had a ratio of aromatics to saturates of about 1:3, with
829
Positive Controls (+N,P); n = 3 Negative Controls (-N,P); n = 3 Sterile Controls
d d d
d d E
d E d

the exception of the Bunker C/Diesel mixture, in which it was about 1:l (Fig. 5). The n-alkanes accounted for 13 to 19% of the saturate 6action in all of the oils and oil products, with the exception of the Bunker C/Diesel mixture, in which they accounted for only 8%. The 5 PAH homologous series accounted for a very small fraction of the total aromatics in all of the oils and oil products, ranging h m 4% in the Bunker C/Diesel mixture to 13% in Diesel No. 2. The distribution of 5 alkylated PAH homologous series was quite similar for all of the crude oils, with the two most dominant being naphthalenes (approx 70%) and phenanthrenes (approx. 20%). However, the relative contribution of dibenzothiophenes was notably different between the North Slope and Cook Inlet oils. The North Slope oils had approximately 9% dibenzothiophenes, while the Cook Inlet oils had only approximately 1% dibemthiophenes. The three oil products differed significantly &om the crude oil pattern and from each other. The alkyl naphthalene series accounted for 99% of the 5 alkylated PAH homologous series for Jet B Fuel and 86% for Diesel No. 2, respectively. In the Bunker C/Diesel mixture, naphthalenes and phenanthrenes each accounted for approximately 35%, and chrysene accounted for 18%.
In addition to the features described above, the following characteristics of the oil products should be noted, since they are very different h m the crude oils. The composition of Jet B Fuel (sterile conwols) was as follows:
(1) The n-alkanes formed a narrow Gaussian distribution fiom n-C, to n-C,, with maxima at n-C,,. The sample also contain a large amount of unresolved complex mixture (UCM).
(2) The ratios of GC-resolved peaks to total GC area was much higher than for all the crude oils (-0.36 and 0.33 for F1 and F3 of the sterile control respectively).
(3) Concentrations of pristane and phytane were very low. (4) C,-phenanthrene, C,dibenzothiophene, and alkylated chrysene homologues were not
(5) For other PAHs, only low molecular weight and low-number-ring PAHs such as biphenyl,
(6) Biomarker compounds were not detected. The sterile controls of Diesel No. 2 showed similar chemical composition features as Jet B
Fuel sterile controls with the following exceptions: (1) A broader distribution of n-alkane f b m n-C, to n-C, with a maximum being around n-C
to n-C,,. (2) A significant amount of n-C,, and pristane, and n-C,, and phytane. (3) Significantly higher abundances of alkylated phenanthrene (C& J, dibenzothiophene
(4) Very low concentrations (sub-ppm levels) of C&, terpanes. The GC traces of Bunker C sterile control revealed that the Bunker C sample was a mixture
of a large portion of heavy residual fuel (so-called “old-type Bunker C”) with a smaller portion of lighter diesel fuel. The n-alkane distribution featured two “humps”, with the maxima around n-C ,3
and n-C,.
Chemical Composition Changes of Xydrocarbons due to Biodegradation General biodegradation trends of various hydrocarbon groups are summarized as follows.
Biodegradation of GC-TPH, total saiurates and total n-alkanes: For all of the crude oils and oil products, biodegradation were greatly enhanced when
nutrients were present, as shown by the reductions in GC-TPH, total saturates and total n-alkanes (Figs. 6 and 7). When nutrients were present, GC-TPH, total saturate and total n-alkane losses were greater than 20%, 20%, and 90%, respectively for the crude oils, and greater than 15%, 20%, and 70%, respectively, for the oil products. In contrast, in the absence of nutrients, however, GC-TPH, total saturate and total n-alkane losses were on average i lo%, 40% and 4 5 % , for all crude oils and oil products except for the Bunker C/Diesel mixture, which had a total n-alkane loss of approximately 30%.
In the Bunker UDiesel mixtUre. the largest losses of n-alkanes occurred in the lighter components of the diesel portion. The resolved aliphatics, including n-alkanes and isoprenoids, remained largely unchanged even when nutrients were added in both Jet B Fuel and Diesel No. 2. Biodegradation of total oromatics and 5 alkylated PAH homologous series:
For crude oils, the degradation of total ammatics and 5 alkylated PAH homologous series was not enhanced by addition of nutrients (Figs. 8 and 9). In some cases, greater losses occurred in the absence of nutrients. It is interesting to note that the biodegradation of both Jet B Fuel and Diesel NO. 2 was enhanced for the aromatics and 5 alkylated PAH homologous series when nutrients were added (Figs. 8 and 9). However, it should be noted that lower molecular weight PAHs were the dominant components in Jet B and Diesel No. 2. In contrast, the losses in the higher molecular weight Bunker C/Diesel mixture were more similar to those of the crude oils (Figs. 8 and 9).
b o n g the 5 alkylated PAH homologous series, the alkyl homologues of naphthalene (the most abundant, 2-rings) were the most easily degradable, followed in order, by alkyl homologues of dibenzothiophene (sulph&-containing 3 rings), fluorene (3 rings, 13 carbons) and then phenanthrene (3-Mgs, 14 carbons). Alkylated chrysenes (4-rings) were the most biodegradation
detected.
acenaphthalene, and acenaphthene were detected.
(C,-C,), and fluorene (C,-C,) series.
830
I
I
I

I
resistant of the target PAH homologues. No significant signs of degradation in the homologous chrysenes Was observed in most samples.
The target parent PAHs such as naphthalene, dibenzothiophene, fluorene, and phenanthrene were the most significantly degraded in each alkylated PAH series. The degradation order of Co*,*s3X4 derivatives of the PAHs is pronounced, and particularly striking within the alkylated naphthalene family. It is clear that both the rate and degree of degradation decrease h a t i d l y as the number and size of substitute alkyl groups in aromatic rings increase.
Among the 5 target alkylated PAH series, the alkylated naphthalene series, especially naphthalene and its Cl-, C2-, and C, derivatives made up the largest portion of the losses of the five target alkylated PAH series. Among other target PAHs, the low-molecular-weight PAHs with lower ar0matiC ring numbers such as biphenyl and acenaphthalene were nearly completely lost, while the high-rhg-number PAHs did not degraded to a significant degree or not degraded at all. (Note that no other high-ring PAHs were detected in the source Jet B Fuel and Diesel No. 2). BTHand AIRylbenrenes:
The crude oils and oil products contained significant amounts of BTEX compounds and alkylbenzenes, but the corresponding sterile controls only contained very small amounts. This indicates that evaporative loss of BTEX and alkylbenzenes occurred during the incubation period.
In the oils and oil products, two major alkylbenzene peaks eluted before the naphthalene peak (retention time, 12.65 min) in the sterile control. They were identified to be 1,2,3,4-ter&amethylbenzene (RT= -1 1.84 min) and 1,2,3,5-tertramethylbenzene (RT= -1 1.06 min). These two C,-benzene compounds were biodegradable, with greater losses observed when nutrients was added. The C4-benzene compounds, especially the lateeluted 1,2,3,4- and 1,2,3,5-terhamethylbnzenes, were more biodegradation-resistant than naphthalene, and C r and C2-naphthalenes. Biomarker Compounh:
the crude oils and oil product samples.
Biodegradation Potential Index All ofthe oils tested had measurable losses of hydrocarbons as a result of incubation with the
standard microbial inoculum. Abiotic losses were accounted for through the use of sterile controls, therefore the reported losses are definitely due to biodegradation. In addition, the use of various analytical chemistry indices and loss patterns also confirmed that the reported losses are. due to biodegradation [IS].
In terms of ranking the tested crude oils and oil products with respect to oil biodegradation potential, the following philosophy was applied. Fmt, the ranking index was to be kept relatively simple, so that it could be understood and used by a wide audience. Of the 5 groupings discussed in the preceding section (that .s, TPH, total saturates, total n-alkanes, total aromatics, total 5 alkylated PAH homologous series), it was felt that the losses in GC-TPH and total aromatics were of the most use. An overall measure of oil biodegradation was desired, which is readily provided by the GC-TPH grouping. However, since the GC-TPH grouping is largely composed of saturates, a means of quantifying the degradation of the aromatics was also desired, since aromatics are considered to be more recalcitrant and some of their bio-oxidation products are potentially more toxic than those derived from saturate metabolism. The total aromatics grouping was chosen as being the most representative index. Note that of the remaining groupings discussed in the previous section, the n-alkane and 5 alkylated PAH homologous series groupings are but small subsets of the total saturates and total aromatics, respectively. In addition, since total saturates are generally quite degradable, and are already accounted for in the GC-TPH, this grouping was not considered a relevant addition to the biodegradation index calculations.
An important consideration is the relative weight assigned to the losses of the GC-TPH and total aromatics for creating a biodegradation potential index. In previous studies by Environment Canada and N O M [ 161, two different weightings of the GC-TPH and total aromatic losses have been proposed (on a scale of 0 to 10):
Equation A Equal weighting:
No noticeable sign of degradation of biomarker terpanes and steranes was observed in all of
Index Value = [O.S(mean YO GC-TPH loss) + 0.5(mean Yo Total Aromatics loss)]/lO
Equation B: A 30:70 ratio: Index Value = [0.3(mean % GC-TPH loss) + O.7(mean % Total Aromkcs loss)]/lO
For example, given that the crude oil Cook Met (Granite Point) had a mean GC-TPH loss of 29.3% and a mean total aromatics loss of 7%, in the nutrient-amended flasks, the calculations for Equation A would be performed as follows:
Granite Point Index Value = [0.5(29.3) + 0.5 (7)]/10 = 1.8
\ 831

Equations A and B were used to generate index values for each crude oiYoil product tested in this study (Fig. 1OA and IOB). The trends depicted are similar in both plots, i.e., the oil products Jet B Fuel and Diesel No. 2 are more biodegradable than the crude oils, while the Bunker C1 Diesel Fuel mixture is the least biodegradable.
The bottom line is that laboratory pre-screening can identifl oils which should be considered for bioremediation. The Bunker C/Diesel mixture would definitely not be as amenable to bioremediation as the other tested oildoil products. A similar conclusion was reached by Song et al. [17] when investigating the bioremediation potential of terrestrial fuel spills of gasolie,jet fuel, heating oil, diesel oil, and Bunker C. Bunker C was found to be the most recalcitrant, with close to 80% persisting after one year of incubation.
Interesting trends were noted with respect to nutrient addition. For both crude oils and oil products, the addition of nutrients enhanced GCD-TPH, total n-alkane and total saturate loss. Although nutrient addition did not enhance aromatic or PAH degradation in crude oils, enhancement due to nutrient addition was apparent for Jet B Fuel and Diesel No. 2. This phenomenon is discussed in detail by Blenkinsopp et a1 [9].
ACKNOWLEDGEMENTS This project was funded by the Alaska Department of Environmental Conservation and the
Emergencies Science Division of Environment Canada. The 6ndings and conclusions presented by the authors are their own and do not necessarily reflect the views or position of the Alaska Department of Environmental Conservation or of Environment Canada. The use of the trade names or commercial products in this manuscript does not constitute endorsement for their use.
I .
2. 3.
4.
5.
6.
7. 8.
9.
10. 11. 12. 13. 14.
15.
16.
17.
REFERENCES Cooney, J. 1. The fate ojpePoleumpollufants in~e .hva te r ecosystems, in R. M. Atlas (ed.) Petroleum Microbiology, Macmillan, New Yo&, NY, 1984. Leahy, J. G.; Colwell, R. R Microbiology Rev., 1990,54,305-315. Chaheau, Claude-Henri. Morel, Jean-Louis. M o t , J. Environ. Sci. Technol. 1995,29,1615-
Lee, K. Tremblay, G. H. Cobanli, S. E. in Proceedings of 1995 International Oil Spill Conference, American Petroleum Institute, Washington, D.C., 1995, 105-1 13. Lee, K. Levy, E. M. in Aquatic Toxicology and Water Qualiw Management, J. 0. Nriagu and J. S. S. Lakshmiinarayana (eds.), John Wiley and Sons, Inc., New York, 1989,217-243. Atlas, R M. Bartha, R in Advunce in Microbial Ecology, K. C. Marshall (ed.), Plenum Press, New York, ~12,1992,287-338. Bragg, J. R; Prince, R C.; Harner, E. J.; Atlas, R M. Nature, 1994,368,413418. Bra& J. R; Prince, R C.; Hamer, E. J.; Atlas, R M. Bioremediation for Shoreline Cleanup Following the 1989 Alaska Oil Spill, EXXON Company, USA, Houston, TX, 1992. Blenkinsopp, S.; Wan& Z. D.; Foght, J.; Westlake, D. W. S.; Sergy, G.; Fingas, M.; Landriault, M.; Sigouin, L.; and Semple, K. in Proceedings of The 20th Arctic and Marine Oil Spill Program (AMOP) Technical Seminar, June 11-13, 1997, Vancouver, Canada, Environment Canada: Ottawa, 1991. Wang, Z. D.; Fmgas, M.; Li, K. J. Chromatogr. Sci. 1994,32,361-366, and 377-382. Wan& Z. D.; Fingas, M.; Sergy, G. Environ. Sci. Technol. 1994,28,1733-1746. Wang, Z. D.; Fingas, M.; Sergy, G. Environ. Sci. Technol. 1995,29,2622-2631. Wan& Z. D.; Fingas, M. J. Chromatography A, 1995,712,321-343. Wag, Z. D.; Fingas, M.; Landriault, M.; Sigouin, L.; and Mullin, J. J. Chromatography A, 1991, in press. Wan& Z. D.; Fingas, M.; Blenkinsopp, S.; Sergy, G.; Landriault, M.; Sigouin, L.; Foght, J.; Westlake, D. W. S. in Proceedings of the 19th Arctic andMmne Oil Spill Program Technical Seminar, Environment Canada, Ottawa, Vol. 1, pp. 163-183,1996. Hoff, R Z.; Blenkinsopp, S.; Sergy, G.; Henry, C.; Fogbt, J.; Wan& Z. D.; Roberts, P.; and Westlake, D. in Proceedings of the 18th Arctic and Marine Oilspill Program Technical seminar, Environment Canada, Ottawa, Vol. 2, pp. 1233-1241,1995. Song, H.-G.; Wan& X.; Bartha, R Applied and Environmental Microbiology, 1990, 56,
1621. (~ 1
652-656.
832

Figure 1 GC Chromatograms for TPH analysis of biodegradation North Slope (NS) oil Samples. Assterile control, B, positive control, C,negative control
C
Figure 2 Changes of n-alkane distribution of NS oil samples under the standard inoculum conditions (28 days at 10 degrees C)
Figure 4 Distribution changes of 5 target alkylated PAH homologous series in NS oil samples due to biodegradation
833

Figure 5 Weathered Alaskan cNde oils and oil products: Aromatic and Saturate
6) 250
$ 2 0 0
I 150 8 , 3 1 1 0 3
e-so E 3
4 0 n
I 'iaure 6 GCD-TPH loss after incubation under Freshwater Conditions at 10 dearees -
Celcius for 28 days, for all tested CNde oils and oil products. A) % loss. E) Actual measured loss.
120
100
Bo
60
40
20
0
:igure 7 Total nalkane loss after Incubation under Freshwater conditions at 10 degrees Celcius for 28 Days, for all tested cmde oils and oil products. A] % loss. E) Actual Measured Loss.
834
1
r

for 28 Days, for all test CNde oils and oil products.
I mWlTHNUTRlENTS
OWlTHOUT NUTRIENTS % $
3%; I d ' _eP$ 2
Y O
3 1 3j 3 1 $! jr iJ 1 3 j a j
ZMM i 1- 1; I-
!! : i Z I P t f 3 1 j$ fa i z 1 2 j a i
I Figure 9 Total SPAH homologue loss after incubation under freshwater conditions
at IO'C for 28 Days, forail tested CNde oils and oil products. A) % Loss. 6) Actual Measured Loss.

INTERACTION OF FUEL HYDROCARBONS AND CHLORINATED SOLVENTS AT AN
AVIATION MAINTENANCE FACILITY
Austin I . Cooley, P.E. W. Alan Hopkins, P.G.
Brown and Caldwell 1415 Louisiana, Suite 2500
Houston, TX 77002
Mark S. Nelson, P.E. Transcontinental Gas Pipe Line Corporation
2800 Post Oak Boulevard Houston, Texas 77251-1396
ABSTRACT
Releases of fuel hydrocarbons and chlorinated solvents from a former waste management unit at an aviation maintenance facility have resulted in impacts to soil and groundwater. As a result of the fuel hydrocarbon releases, strongly reducing conditions have been created in the source area. This has resulted in reductive dechlorination through dehalorespiration. Outside the source area aerobic conditions exist, resulting in biologically mediated oxidation of fuel hydrocarbons and chlorinated solvent daughter products, including vinyl chloride. The overall rate of natural attenuation in groundwater is sufficient to prevent plume migration, allowing for site closure with no active remediation. In addition to examining the interaction of the fuel hydrocarbons with the chlorinated solvents, the impact of naturally occurring inorganic electron acceptofs on plume behavior is discussed.
INTRODUCTION
The site is an active aviation maintenance facility for corporate aircraft. A 500-gallon underground storage tank was used as a waste management unit to store used aviation fuel, waste ",<'-and spent solvents starting in 1980. The waste management unit was decommissioned and removed in 1991. During the removal, evidence of a release was observed due to visibly stained soil. Confirmation samples collected from the excavation indicated the soil was impacted with fuel hydrocarbons and chlorinated solvents.
MATERIALS AND METHODS
In response to the discovered release, soil borings were performed to collect soil samples to determine the extent of the impact. Because the impacted soils extended into the saturated zone, an array of seven monitoring wells was installed and sampled. Groundwater is encountered at a depth of 12 feet in a silty sand unit, which is overlain by a clay confining unit. Hydraulic conductivity in the saturated zone is approximately 0.5 feet per day with an effective porosity of 35%. The typical gradient of 0.005 feet per foot yields a calculated groundwater seepage velocity of 0.007 ft/day.
Benzene, toluene, ethylbenzene and xylenes (BTEX) and chlorinated aliphatic hydrocarbons (CAHs) were identified as the chemicals of concern. Industrial solvents present in the dissolved phase plume include tetrachloroethene (PCE), trichloroethene (TCE) and 1 , I ,I-trichloroethane (l,l,l-TCA). In addition, CAH daughter products are present in the dissolved phase, including isomers of dichloroethene (DCE), I,l-dichloroethane (1,l-DCA), vinyl chloride and chloroethane.
To better understand the groundwater conditions and the potential for natural attenuation as a dissolved-phase plume management strategy, a groundwater geochemistry monitoring program was initiated. Samples were analyzed for common inorganic parameters that can act as electron acceptors in biologically mediated reductiodoxidation reactions. Where measurements of electron acceptor concentrations were not reliable, concentrations of reduction by-products were measured instead (Weidemeir, et al, 1995a). For example, ferric iron (Fe3') is a potential electron acceptor, but i t is insoluble. Therefore, ferrous iron (Fe2'), the reduction by-product of ferric iron, was instead analyzed. In addition to the inorganic analyses, concentrations of ethene and ethane were measured, as these are products of complete dechlorination of CAHs. Groundwater samples were also analyzed for other indicators of natural attenuation. Table 1 shows the suite of groundwater analyses that were performed.
i l
i l
836

i
'\
RESULTS
Analysis of the data which is representative of groundwater quality at the site indicates that:
I. Fuel hydrocarbons are not migrating from source area. 2. Highly oxidized CAHs are not migrating from the source area. 3. Products of partial dechlorination are migrating from the source area. 4. The partially dechlorinated CAHs are degrading rapidly once they leave the source area. 5. Methanogenesis is occurring in the source area. 6. Depletion of nitrate, ferric iron and sulfate occur both in the methanogenic source area and
the area immediately adjacent to it. 7. High dissolved oxygen is present both upgradient and downgradient of the source area. 8 . Reductiodoxidation potential (Eh) is significantly lower in the source area than in the
upgradient and downgradient groundwater.
DISCUSSION
Through biologically-mediated redox reactions, dissolved phase fuel hydrocarbons have created strongly reducing conditions in the source area. The fuel hydrocarbons act as the electron donor, depleting dissolved oxygen, nitrate, ferric iron and sulfate, which act as electron acceptors (Weidemeir, et a1,1995b). As a result, methanogenic microbes can compete successfully in the source area, even though the rate of reaction for methanogenesis is significantly slower than reactions that utilize other common inorganic electron acceptors. Because of this differential preference, different zones have formed in groundwater at the site (Figure I) :
1. The anaerobic zone, where carbon dioxide is the primary electron acceptor, resulting in methanogenesis.
2. The anoxic zone, where sulfate, ferric iron and nitrate act as the primary electron acceptors. Dissolved oxygen is also present in this zone, but at low concentrations ( 4 . 5 mg/L).
3. The aerobic zone, where oxygen is the primary electron acceptor.
The interaction of the fuel hydrocarbons, the CAHs and the inorganic elector acceptors at the site are fairly complex as illustrated in Figure 2 .
The reduced conditions in the anaerobic zone are favorable for microbes that utilize CAHs as electron acceptors through dehalorespiration (Gosset and Zinder, 1996). As with inorganic electron acceptors, some CAHs are more favorable electron acceptors than others are. The more highly oxidized CAHs, such as PCE and l,I,l-TCA are preferential to less oxidized species, such as vinyl chloride and chloroethane (Chapelle, 1996). This is because the rates of reaction for the more oxidized CAHs are faster than for the less oxidized CAHs. In the anaerobic source area, PCE and I,I,I-TCA are degraded rapidly. This is evidenced by the lack of detections of these CAHs outside the anaerobic zone. Apparently, conditions are reduced enough in the anaerobic zone that even vinyl chloride is acting as an electron acceptor. This is indicated by the presence of ethene as a product of vinyl chloride dechlorination.
In the anoxic zone, degradation of the fuel hydrocarbons is completed, as evidenced by their absence in this zone. It is unclear how the less oxidized CAHs in the anoxic zone are reacting. Conditions are probably not reduced enough for vinyl chloride and chloroethane to act as electron acceptors in this zone. This is indicated by the lack of ethene detections in the anoxic zone. These less oxidized CAHs may be acting as electron acceptors in redox reactions where fuel hydrocarbons act as electron donors. Vinyl chloride may also act as electron donors in the anoxic zone. For example, microcosm studies have shown that vinyl chloride can act as an electron donor in a biologically mediated redox reaction where ferric iron is the electron acceptor (Bradley and Chapelle, 1996). I,I-DCA and isomers of DCE may also act as electron donors under anoxic conditions through cometabolism. A possible primary substrate for this cometabolism is methane that has migrated out of the anaerobic zone. Chloroethane readily hydrolyzes abiotically under anoxic conditions (McCarty and Semprini, 1994).
In the aerobic zone, the remaining CAHs are degraded, evidenced by their absence in this zone. These less oxidized species, including DCE isomers, l,I-DCA, vinyl chloride and chloroethane, appear to be acting as electron donors in this zone, with oxygen as the electron acceptor. I ,[- DCA, chloroethane and vinyl chloride can act as electron donors under aerobic conditions (Weidemeir et al, 1996). There is conflicting evidence as to whether or not DCE isomers can act as a carbon source under aerobic conditions (RTDF, 1996). However, aerobic cometabolism of DCE isomers is reasonably well established (Hid and Irvine, 1997).
837

A spatial analysis was performed to determine natural attenuation rate constants through linear regressions (Buscheck, et al, 1993). Table 2 show the results of this analysis. As indicated by the R2 values, the validity of the analysis is good with the exception of PCE, 1.1-DCE and cis-1,2-DCE. The poor R2 values for the DCE isomers is probably due to:
1
I . DCE being both created and destroyed through the dechlorination process. 2. DCE acting as both an electron acceptor and an electron donor within the plume 3. Limitations of primary substrates for DCE degradation under cometabolism.
The poor RZ value for PCE is due to destruction of PCE at a more rapid rate in MW-7, the area
BTEX concentrations in the overlying source area soils. Apparently, fuel hydrocarbon electron donors are being contributed to the groundwater at a more rapid rate than in this area.
CONCLUSIONS
At this site, fuel hydrocarbons created anaerobic and anoxic conditions by depleting inorganic electron acceptors. In the absence of inorganic electron acceptors, other than carbon dioxide in the anaerobic mne, highly oxidized CAHs act as electron acceptors for fuel hydrocarbons. This dehalorespiration degradation results in partial dechlorination to less oxidized CAHs. The degradation of fuel hydrocarbons is completed in the anoxic zone, where oxidation of the partially dechlorinated hydrocarbons commences. The mineralization of the remaining CAHs is completed in the aerobic zone.
As a result of the interaction of the fuel hydrocarbons, the CAHs and the inorganic electron acceptors, the plume stabilizes at a short distance from the source. Because of this, natural attenuation is a feasible plume management strategy for this site.
REFERENCES
Buscheck, T.E., K.T. O’Reilly and S.N. Nelson, 1996, Evaluation of Intrinsic Bioremediation at Field Sites The Proceedings of the 1995 Petroleum Hydrocarbons and Organic Chemicals in Groundwater: Prevention, Detection, and Remediation: 367-3 8 1
Bradley, P.M. and F.H. Chapelle, 1996, Anaerobic Mineralization of Vinyl Chloride in F e w - Reducing Aquifer Sediments Environmental Science and Technology Volume 30: 2084 - 2086
Chapelle, F.H., 1996, Identifymg Redox Conditions That Favor the Natural Attenuation of Chlorinated Ethenes in Contaminated Ground-Water Systems Symposium on Natural Attenuation of Chlorinafed Organics in Ground Water EPN540R-961509: 17-20
Gosset, I.M. and S.H. Zinder, 1996, Microbiological Aspects Relevant to Natural Attenuation of Chlorinated Ethenes Symposium on Natural Attenuation of Chlorinated Organics in Ground Water
immediately beneath the source, which skews the curve fit. This is probably attributable to greater I
EPN540/R-96/509: 10-13
Hid, P.J. and R.L. Irvine, 1997. Degradation of Perchloroethylene Using Aerobic Sequencing Batch Reactors In Situ and On-Site Bioremediation: Volume 3:87-92
McCarty, P.L. and L. Semprini, 1994, Ground-Water Treatment for Chlorinated Solvents Bioremediation of Groundwater and Geological Material: A Review of In-Situ Technologies:S-l-5-2
Remediation Technology Development Forum, 1996, Guidance Handbook on Natural Attenuation of Chlorinated Solvents
Vogel, T.M. 1994, Natural Attenuation of Chlorinated Solvents Bioremediation of Groundwater and GeologicalMaterial: A Review of In-Situ Technologies: IO- 1-1 0-25
Weidemeir, T.M., J.T. Wilson, D.H. Kampbell, R.N. Miller, and J.E. Hansen, 1995% Technical Protocol for Implemenhg Intrinsic Remediation for Natural Attenuation of Fuel Contamination Dissolved In Groundwater
Weidemeir, T.M., J.T. Wilson, and D.H. Kampbell, 1995b, Significance of Anaerobic Processes for the Intrinsic Bioremediation of Fuel Hydrocarbons The Proceedings of the 1995 Petroleum Hydrocarbons and Organic Chemicals in Groundwater: Prevention, Detection, and Remediation: 49-61
838

Weidemeir, T.M., M.A. Swanson, D.E. Moutoux, E.K. Gordon, J.T. Wilson, B.H. Wilson, D.H. Kampbell, J.E. Hansen, P. Haas, D.H. Chapelle, 1996, Technical Protocol for Evaluating Natural Attenuation of Chlorinated Solvents In Groundwater (Draft - Revision 1)
Degradatii,: Rate Parameter h/v, RZ Value Groundwater Consta!i
Velocity (Wd) (day.') - BTEX Cornpounds (R'on-Chlorinuted VOCs)
Benzene 0.0602 0.9427 0.007 4.30% ................................ ............... o,05.s3... ............................... ............................. ...........
................................................................................................................. o.oo.7 ........................................................
Toluene 0.8038 0.007 3.95%
Ethylbenzene 0.0194 0.8038 0.007 1.39% ................... ................................................................................................................................................................................
Xylenes 0.0429 0.8038 3.06%
PCE-Bused Compounds
Tetrachloroethene 0.0114 0.1662 0.007 0.81% Trichloroethene 0.0379 0.8713 0.007 2.71%
cis- 1,2-Dichloroethene 0.6230 0.007 4.14%
I , I -Dichloroethene 0.7331 0.007 6.18%
Vinyl Chloride 0.0785 0.8038 0.007 5.61% TCA-Bused Compounds
I,l,l-Trichloroethane 0.0239 0.8958 0.007 1.71%
.............................. ..... .................................. ... .......................................................................
........................................ ...................... 0;:osgo ........... ................................................................... .- .
................................................................. o,'0865 ......... ........................................................................................................
................................................................................ ............................................. ...............................................
-
............... ..................................................................... ............................................................................... I , I-Dichloroethane 0.0147 0.7413 0.007 1.05% ........................................... .- ................................................ ..................... o o o 7 ......................... ....................... 1,2-Dichloroethane 0.0499 0.9564 3.56%
Chloroethane 0.0953 0.8038 0.007 6.81%
Vinyl Chloride 0.0785 0.8038 0.007 5.61%
......................................................... .......................... ................................................................ ..............................
............................................................................... ........................................................................................ ...........................................
Table I . Groundwater Analyses Performed
Analysis
Volatile Organic Compounds Methane, Ethane, and Ethene
Sulfate
Nitrate
Dissolved Oiygen
Ferrous Iron
OxidatiodReduction Potential
Temperature
PH
Conductivity
_ _ - -_ -
- - _ _ -
Method
EPA Method 8260 ...... ... ..................................................................
RSKSOP-147 ......... - .... ............................................................... ................... EPA Method 375.4
EPA Method 353.3
Field Probe in Flow Through Cell/Hach Field Kit
Hach Field Kit
Field Probe in Flow Through Cell
Field Probe in Flow Through Cell
Field Probe in Flow Through Cell
Field Probe in Flow Through Cell
........................................................... ...........................
.................................................. .....................................
................................................................... ...............................................
..........................................................................................................
.................... .................................................. ...
......................... .........................................................................................
........ -. .................................................... ..............................................
833

e HW-12
AEROBIC ZONE
e - MW-13
Transformation
f+t Redox Reaction
Figure 2: Chemical Interactions
E40

I
Adjusting Biorernediation Expectations to the Reality of Bioavailability Maureen E. Leavitt
Paladin International, Inc. 1946 Oak Ridge Turnpike
Oak Ridge, TN 37830-6001
ABSTRACT Bioremediation of hydrocarbons in groundwater systems has been conducted with great success
at a multitude of sites, In most cases, hydrocarbon concentrations in groundwater can be brought near or below drinking water standards, This is not hard to believe since these are biodegradable contaminants that are solubilized and available for biodegradation. Attaining these low levels in soils has been a challenge in the bioremediation industry. The true issue, bioavailability, has been clouded by vendors’ eagerness to cite other limitations such as biomass or nutrients. Bioremediation of most hydrocarbon contamination is limited most by the extent of sorption of contaminants to the soil particles. Therefore contaminant properties, soil type and mixing are the primary governing factors with respect to bioremediation. This paper will illustrate the issue of bioavailahility of hydrocarbons in soil, focusing on the achievable endpoints and regulatory issues.
INTRODUCTION Biodegradation of petroleum fuels has been documented under both laboratory and field
conditions (1,2), Many different matrices including groundwater, ocean water, sediment, soil and even gravel support bacterial populations capable of mineralizing various hydrocarbons into carbon dioxide and water. It is generally accepted that biodegradation can gradually mitigate most light end petroleum hydrocarbons to an extent that biodegradation can be used to “clean” contaminated soil and groundwater.
The challenge in applying accelerated biodegradation techniques is not the ability to stimulate bacteria to degrade hydrocarbons; it is judging how low the hydrocarbon concentration can go. This judgment is based more on physicalkhemical properties of the soil and contaminants (and their interactions) which together are referred to as “bioavailability”. The following text describes the current models regarding bioavailability and how the issue is incorporated into the practice of hioremediation.
REASONS FOR BIOAVAILAEHLITY CONSIDERATION
m- The issue of bioavailability is met with mixed opinions. Some bioremediation vendors see it as an opportunity to produce and sell “elixir” products that might alleviate the limitation and further lower cleanup endpoints. Specific surfactants, bacterial blends and nutrient packages have all been offered to address the limitation of bioavailability. In cases where side by side testing with and without the product can be compared, the product does not provide a significant benefit that would justify the added cost (3). In more cases, comparable data from a test without addition of the product are not available. When site owners are uncertain of the principles of biostimulation (the practice of using indigenous bacteria), they tend to choose these products as a tangible enhancement to their system. Subsequent results are disappointing.
nt Detectim - Among the array of contaminants addressed with bioremediation, hydrocarbons present one of the most difficult analytical challenges. Most hydrocarbon contamination in soil and groundwater is derived kom fuel, which is composed of several hundred compounds. Analytically, these compounds are typically measured using a method that groups these compounds into a single number. Analyses that use this approach include diesel range organics (DRO), gasoline range organics (gro), total recoverable petroleum hydrocarbons (TRF’H), and oil and grease (O&G). With so many components influencing a single value, significant reduction in certain components can be masked. Furthermore, there is no opportunity to incorporate weighted distinction between those components that doldon’t pose health risks. The result may be more cost than is needed to protect human health and the environment.
In some cases, specific compounds have been chosen to represent the compounds of concern within a fuel blend. These compounds are typically volatiles and semivolatiles such as benzene, toluene, ethylbenzene, and xylenes (BTEX), naphthalene and methylnaphthalenes. Choosing these compounds as targets for remediation efficiency assessment is desirable since these compounds are easy to detect
841
i

and they are among the first compounds to be biodegraded in environmental systems. When these compounds are the targets, remediation systems become more predictable and more finite.
A remediation specialist may be fortunate to have contaminant that is made up of light end TRPH compounds (smaller hydrocarbons, less complexity to the compound’s configuration), reaching the endpoint in a timely manner. This specialist can be unfortunate, addressing compounds that are grouped at the heavier end of the spectrum (longer hydrocarbons, more branching), which may result in extended treatment periods. Therefore, knowing the origin of the contaminant and the means by which success will be measured is critical in determining a system’s treatment period.
I ’
I THE MODELS
, The mechanisms behind bioavailability have been explored and are still the subject of significant research efforts (4,s). From a grand scale, three explanations exist. The first is that contaminants are not available for biodegradation because they are physically occluded within the soil and do not have contact with the microorganisms, therefore they are unavailable. This is always true to some extent because contaminant migration over extended periods can result in contaminant located in areas where short-term, aqueous-based treatment supplements cannot penetrate. However, there are many techniques that provide a great degree of soil disruption prior to treatment. These techniques are generally known to produce lower endpoints, but there are occurrences where contaminants still exist at appreciable levels after treatment.
The second model is based on soil type. Sorptive properties of soils vary depending on their characteristics. Figure 1 illustrates the relative bioavailability of contaminants in different soil types. Soils that are sandy generally contain larger soil particles and less of an ionic charge. Contaminants in these soils are more likely to be bioavailable. Soils that contain clay have finer particles and more of an ionic charge.
The third model explaining persistent contamination is molecular hindrance. In this case, the contaminants are composed in such a complex manner that the molecule itself is not available for microbial attack, This model is not influenced by environmental factors. However, at sites where the original source of contamination is not known, detecting these contaminants in a TRPH measurement could be misleading, causing an extended treatment period that may not reach target endpoints. It is likely that limited bioavailability is the primary obstacle as depicted in Figure 2.
CURRENT PRACTICES
While research and development of the issues surrounding biotreatment endpoints continues, some strategies have been developed to proceed with bioremediation. Regulators have been given some degree of flexibility in determining endpoints based on Risk-Based Correction Action (RBCA) approaches. This new site-specific approach to determine how clean is clean has resulted in acceptance of higher endpoints because the risk to human health and the environment is reduced at that specific site. RBCA has been and will continue to assist in the understanding and acceptance of the limitations of bioavailability.
Stakeholders have begun to consider the grand effects bioremediation has on their site’s contamination. Bioremediation certainly decreases the overall concentration of contaminants. However, bioremediation also provides important benefits that reduce the risk of contaminants that remain on-site. By removing the most available compounds, bioremediation reduces the mobility of the remaining contaminants. Similarly, i t can reduce the leachability of the contamination. Therefore, even if the analytical value is still detectable, the remaining contamination poses a reduced risk to human health and the environment.
CONCLUSIONS While all of the activity dedicated to mitigating organic contamination in the environment continues, policy-makers and scientists must complete the database that persuades cleanup target endpoints. The goals of cleanup should be determined based on the risk to human health and the environment, not on the analytical detection capabilities. Hydrocarbons are a challenge in this regard since evaluating toxicity and health hazards of hundreds of individual compounds is time-consuming and expensive. RE3CA techniques have been successful at providing a degree of realism in endpoint decision-making;
i
I
842
I

however, more effort needs to focus on the benefit of remediation dollars spent to pursue very low endpoints. Further, this cost benefit should be directly related to estimated lives saved.
REFERENCES
Analytical Method ’
Gasoline Jet Fuel Diesel Kerosene Gas Oil Waste Oil EPA 8010 (volatiles) EPA 8015 (TRPH) EPA 418.1 (TPH)
I.
2.
3.
4.
5.
’ Molecule Range C5-ClO C9-CI6 CIO-C22 c12-CI 8
X I 2 X I 8
C2-Cl2 C7-C30 X I 4
Huesemann, M.H. 1995. “Predictive Model for Estimating the Extent of Petroleum Hydrocarbon Biodegradation in Contaminated Soils”, Env. Science and Technol. 29:7-18. cioffi, J.C. W.R. Mahaffey and T.M. Whitlock. 1991. “Successful Solid-Phase Bioremediation of Petroleum Contaminated Soil”, Remediation, Autumn, 373-389. Leavitt, M.E. and K.L. Brown. 1994. “Biostimulation Versus Bioaugmentation - Three Case Studies”, in R. Hinchee et al., (eds) Hydrocarbon Bioremediation p.72-79, CRC Press, Inc. Boca Raton. Huesemann, M.H. 1997. “Incomplete Hydrocarbon Biodegradation in Contaminated Soils: Limitations in bioavailability or Inherent Recalcitrance?” Bioremediation Journal (1):27-39. Loehr, R.C. 1996. “The Environmental Impact of Soil Contamination: Bioavailability, Risk Assessment, and Policy Implications”, National Environmental Policy Institute and the Reason Foundation.
TABLES AND FIGURES
Table 1. Analytical Methodology and Fuel Molecular Wei I Fuel Class or I Detectable Carbons Per I
Figure I . Relationship Beween Bioavailability and Treatment Endpoints
ight C :lasses
Figure 2. Soil Type Influence on Biaavailabilily
843


![ALIPHATIC & AROMATIC AMINES - jeemain.guru · (a) From Ammonolysis of alkyl halides [Hofmann's ammonolysis] : When an aqueous solution of ammonia is heated with alkyl halide all the](https://img.pdfslide.us/doc/110x75/5e0d42079bbb2e69d86e5db0/aliphatic-aromatic-amines-a-from-ammonolysis-of-alkyl-halides-hofmanns.jpg)


![AMINES [4 marks] - NEERAJ AGRAWAL - Homeneerajminichemistry.weebly.com/uploads/2/0/3/6/20360305/amines... · All primary amines exhibit functional isomerism with secondary and tertiary](https://img.pdfslide.us/doc/110x75/5a78afe77f8b9a273b8d3b8d/amines-4-marks-neeraj-agrawal-hom-primary-amines-exhibit-functional-isomerism.jpg)