Embed Size (px)
Citation preview

TERRESTRIAL SPILL MODELING -- INCREASING CONFIDENCE IN THE ESTIMATION OF HIGH CONSEQUENCE AREA (HCA) IMPACT
Don Paige, Nick Park, Jonathan Posner GeoFields, Inc.
1180 West Peachtree St, Suite 1250, Atlanta, GA, 30309, USA
ABSTRACT The determination of potential pipeline impact on High Consequence Areas requires a defensible approximation of the flow pattern of a potential release from liquids pipelines. Research indicates a lack of commercially or publicly available terrestrial spill models. Therefore, development was undertaken of an algorithm that models the overland transport of liquids releases to establish a rationale as to which pipeline sections could affect HCAs. Inputs to the model include potential release volume at points along a pipeline, elevation data, hydrology, and absorptivity information. The available data is of sufficient resolution to establish an approximation of a spill trajectory and accounts for barriers within the terrain. Stream transport is tracked allowing improved modeling of impacted waterways. Assumptions have been made that account for absent data sets. These assumptions are presented as an absorptivity factor that can be set conservatively. Further research and continuing improvement in available data sets will improve the assumptions being made. Control surfaces have been developed to validate the algorithm. Operators have also been encouraged to validate through comparison to actual releases. The presentation provides a discussion of the algorithm, data sets, assumptions, and validation.
INTRODUCTION Two methods of identifying segments which could affect High Consequence Areas (HCAs) use standard spatial analysis techniques. The first locates where the pipeline centerline crosses an HCA (direct impact). The second locates where the pipeline is within a specified distance of an HCA (indirect impact). A more rigorous analysis provides those pipeline segments that could potentially impact an HCA by modeling the behavior of a spill over terrain and hydrological features. Potential impact analysis can identify segments that may be overlooked by direct and indirect impact assessment methods. This paper focuses on a process which has been developed to model the behavior of liquid pipeline spills in order to more accurately identify pipeline segments that could affect HCAs. A simple buffering method in the absence of a terrestrial spill model has been used by some operators for identifying those segments that could affect HCAs. Such methods appear more difficult to justify as no consideration is given to terrain and hydrological transport of releases. The model described seeks to address those limitations. It is the third major version developed since initial work was performed in 1998. Over the course of the model’s development 350,000 simulated spill points have been modeled. This vast amount of modeling has allowed significant refinements to the process and algorithm. The paper discusses the data requirements for the model, and reviews the results of processing.
DATA REQUIREMENTS Several data sets are required for modeling the potential impact of a release on HCAs.
High Consequence Areas A standard set of HCA data is available as provided by the National Pipeline Mapping Systems (NPMS). HCAs are available in five categories; High Population Areas, Other Populated Areas, Commercially Navigable Waterways, and two classes of Unusually Sensitive Areas (USAs); Ecological and Drinking Water. This is supplemented with datasets from a variety of county, state, and federal sources. Local knowledge is also incorporated to enhance standard datasets by adding to and modifying pre-defined HCAs.
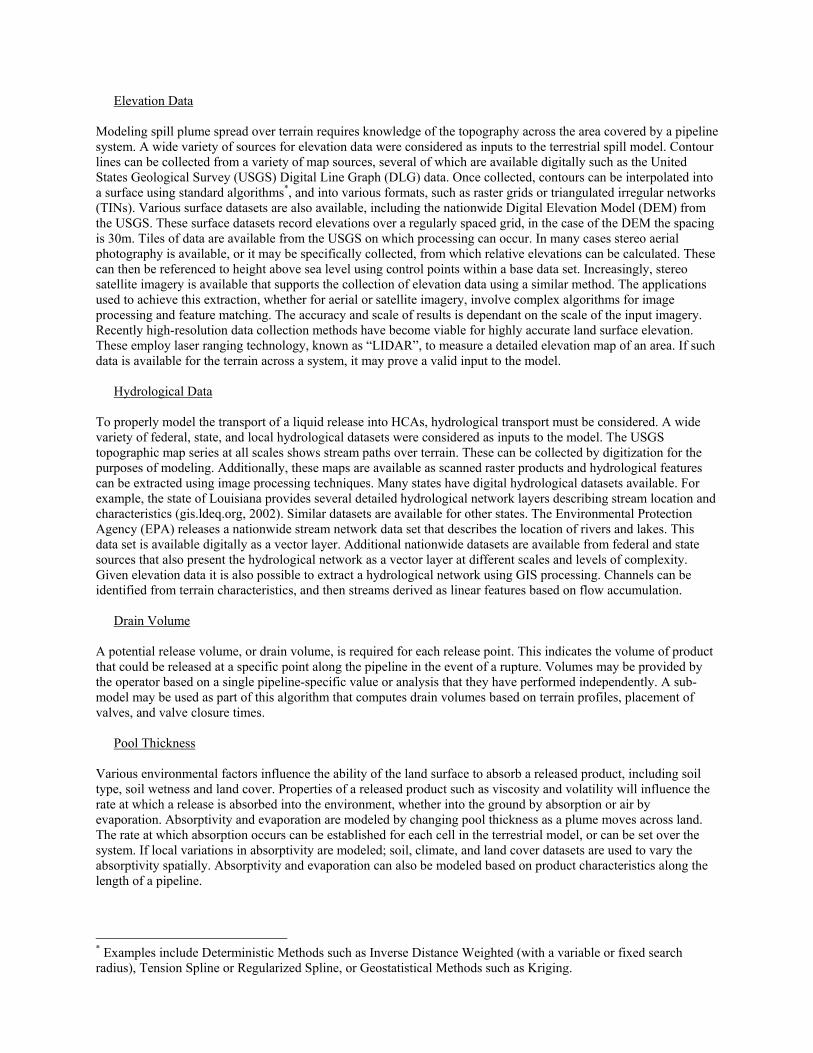
Elevation Data
Modeling spill plume spread over terrain requires knowledge of the topography across the area covered by a pipeline system. A wide variety of sources for elevation data were considered as inputs to the terrestrial spill model. Contour lines can be collected from a variety of map sources, several of which are available digitally such as the United States Geological Survey (USGS) Digital Line Graph (DLG) data. Once collected, contours can be interpolated into a surface using standard algorithms*, and into various formats, such as raster grids or triangulated irregular networks (TINs). Various surface datasets are also available, including the nationwide Digital Elevation Model (DEM) from the USGS. These surface datasets record elevations over a regularly spaced grid, in the case of the DEM the spacing is 30m. Tiles of data are available from the USGS on which processing can occur. In many cases stereo aerial photography is available, or it may be specifically collected, from which relative elevations can be calculated. These can then be referenced to height above sea level using control points within a base data set. Increasingly, stereo satellite imagery is available that supports the collection of elevation data using a similar method. The applications used to achieve this extraction, whether for aerial or satellite imagery, involve complex algorithms for image processing and feature matching. The accuracy and scale of results is dependant on the scale of the input imagery. Recently high-resolution data collection methods have become viable for highly accurate land surface elevation. These employ laser ranging technology, known as “LIDAR”, to measure a detailed elevation map of an area. If such data is available for the terrain across a system, it may prove a valid input to the model.
Hydrological Data To properly model the transport of a liquid release into HCAs, hydrological transport must be considered. A wide variety of federal, state, and local hydrological datasets were considered as inputs to the model. The USGS topographic map series at all scales shows stream paths over terrain. These can be collected by digitization for the purposes of modeling. Additionally, these maps are available as scanned raster products and hydrological features can be extracted using image processing techniques. Many states have digital hydrological datasets available. For example, the state of Louisiana provides several detailed hydrological network layers describing stream location and characteristics (gis.ldeq.org, 2002). Similar datasets are available for other states. The Environmental Protection Agency (EPA) releases a nationwide stream network data set that describes the location of rivers and lakes. This data set is available digitally as a vector layer. Additional nationwide datasets are available from federal and state sources that also present the hydrological network as a vector layer at different scales and levels of complexity. Given elevation data it is also possible to extract a hydrological network using GIS processing. Channels can be identified from terrain characteristics, and then streams derived as linear features based on flow accumulation.
Drain Volume A potential release volume, or drain volume, is required for each release point. This indicates the volume of product that could be released at a specific point along the pipeline in the event of a rupture. Volumes may be provided by the operator based on a single pipeline-specific value or analysis that they have performed independently. A sub-model may be used as part of this algorithm that computes drain volumes based on terrain profiles, placement of valves, and valve closure times.
Pool Thickness Various environmental factors influence the ability of the land surface to absorb a released product, including soil type, soil wetness and land cover. Properties of a released product such as viscosity and volatility will influence the rate at which a release is absorbed into the environment, whether into the ground by absorption or air by evaporation. Absorptivity and evaporation are modeled by changing pool thickness as a plume moves across land. The rate at which absorption occurs can be established for each cell in the terrestrial model, or can be set over the system. If local variations in absorptivity are modeled; soil, climate, and land cover datasets are used to vary the absorptivity spatially. Absorptivity and evaporation can also be modeled based on product characteristics along the length of a pipeline.
* Examples include Deterministic Methods such as Inverse Distance Weighted (with a variable or fixed search radius), Tension Spline or Regularized Spline, or Geostatistical Methods such as Kriging.

CALIBRATION AND VALIDATION
Model development and calibration was achieved through extensive consultation with pipeline operators. These operators provided input on assumptions that could be made in the model and guidance on how variables should be initially set. Variables include the location of chosen release points, pool thickness, and release volume. To evaluate the model a series of tests were performed on various surfaces and with differing hydrological networks. These are categorized as sample surfaces generated artificially, real surface data representing terrain, and real spills where plume mapping had occurred. The artificial test surfaces provided simple representative topographic features on which simulated volumes of liquid were released. The results were interpreted to determine whether they represented realistic plumes. Sixteen surfaces were generated, ranging from a flat plane (generates a circular plume from the release point), to simple inclined planes (a plume flowing downwards in a parabolic shape with limited lateral spread), to complex features (including ditch and barrier scenarios). The results of two of the test surfaces are shown in Figures 1 and 2. Results from these analyses were consistent with expectations.
Plume
Release Point
Cop
yrig
ht ©
200
2 G
eoFi
elds
Inc.
Rep
rodu
ced
with
per
mis
sion
.
Plume
`
Cop
yrig
ht ©
200
2 G
eoFi
elds
Inc.
Rep
rodu
ced
with
per
mis
sion
.
Release Point
Figure 1: Test surface depicting a flow into a ditch.
Figure 2: Test surface depicting impact on a barrier.
Many additional tests were preformed simulating release plumes over real land surfaces. Two of these are illustrated in Figures 3 and 4. Performing such tests on actual terrain surfaces provides clarification about plume behavior in specific circumstances, as well as seeking to validate the model behavior. These tests included both terrain and hydrological considerations.
Cop
yrig
ht ©
200
2 G
eoFi
elds
Inc.
Rep
rodu
ced
with
per
mis
sion
.
Release Point
Figure 3: A single spill point is illustrated against USGS 1:24,000 base map data. The map illustrates a release of approximately 11,000 barrels on a completely flat surface. Because of the flat nature of the terrain the plume forms a circle, as would be expected.

Cop
yrig
ht ©
200
2 G
eoFi
elds
Inc.
Rep
rodu
ced
with
per
mis
sion
.
ReleasePoint
Other Populated Area HCA
Impacted Stream
ImpactedLake
1 2
3
Figure 4: A single point release is illustrated against USGS 1:24,000 base map data. Frame 1 indicates the location of the release on a ridge. Flow proceeds down the north and south slopes of the hill range. To the north Bear Lake is impacted. This lake does not feed a stream and so the release is trapped. To the south the release impacts a stream - the Kroft Ditch. Released liquid is transported downstream to Bull Lake. It exits the lake and continues through the hydrological network. Frame 2 shows the down-stream transport of the release. After transport for a specified time, the release is considered to be trapped by mitigation measures, such as a boom, and transport reaches its conclusion. Frame 3 shows the release transported into an Other Populated Area HCA over 6 miles away. A release as modeled here is therefore identified as having the potential to impact an HCA, which would not be indicated using a ½ mile buffer approach.
Validating the model against actual releases is an important means of determining whether it produces realistic results. Given that any actual releases will most likely not involve the maximum volume of released liquid, it is expected that actual release extent would typically be lower than those modeled by a conservative approach. Operators have used modeled results as the basis for comparison with releases that they have incurred and in consultation have provided feedback on model variables to enhance behavior. In addition, data has been obtained on actual spills and the model compared to those measurements. For example, a specific release in Bemidji, Minnesota in 1979 has been the subject of considerable research by the US Geological Survey Bemidji Crude-Oil Research Project (USGS 1979-2002). Maps of the original 1979 release at the site were available. Comparing the mapped results to simulations run with the model yielded further confirmation that the model was appropriately simulating releases.

RESULTS
The model produces a number of results which allow an operator to integrate segments that could impact an HCA into an integrity management program. The primary outputs are a series of stationing values describing the start and end of each pipeline segment identified as having a direct, indirect and potential impact on HCAs. Additionally, map output is produced that describes the location of the release plumes and indicates the hydrological transport that occurs. Examples of these are shown in the following figures.
Cop
yrig
ht ©
200
2 G
eoFi
elds
Inc.
Rep
rodu
ced
with
per
mis
sion
.
HCA Impact Bands
Drinking Water HCA
Release Plumes
Figure 5: A sample map product showing the results of potential release modeling. The release plumes are shown emanating from the pipeline. HCAs are depicted (in this case Drinking Water) as shaded polygons across the map. The pipeline segments that could affect an HCA are shown as a series of schematic bands at the bottom of the map, categorized by HCA type and aligned with the pipeline in the map frame. The lower band, representing the Drinking Water HCA, can be seen to be mostly black, indicating substantial impact on that HCA class as a result of this analysis.
Drinking Water HCA
Ecological HCA
Cop
yrig
ht ©
200
2 G
eoFi
elds
Inc.
Rep
rodu
ced
with
per
mis
sion
.
SegmentCould Affect
HCA
½ Mile Buffer
2
1
1
Figure 6: An enlarged and annotated view of the model results. A ½ mile buffer has been added for the purposes of this illustration. The various modeled release points can be seen marked as tick marks on the pipeline. Terrestrial release plumes can be seen emanating from these modeled release points. Where a release impacts a hydrological feature an impact is illustrated by shading around that feature. Transport into HCAs by either the overland plume or hydrological transport causes a specific release point to be identified as having the potential to impact an HCA. A pipeline segment is then derived from these points. The HCAs marked [1] are correctly identified as the subject of an impact by both the terrestrial spill model and ½ mile buffer. However the Drinking Water HCA marked [2] is impacted via hydrological transport, and is some distance outside the ½ mile buffer.

AREAS FOR FUTURE DEVELOPMENT
The primary driver for enhancing the model is the availability of better datasets. The current “best of breed” approach to data will continue to evolve as new data sources become available and are assessed for possible inclusion. Several large scale surveys are currently in development, and are expected to provide enhanced elevation and hydrology data. As the number of operators using the model for HCA impact assessment continues to expand, industry knowledge driving the development of the model will continue to refine the parameters used. Additionally, as the number of spills modeled and analyzed increases, the understanding of plume interaction with terrain and hydrology will be refined.
CONCLUSION It is possible, given suitable base data sets, to construct an analytical model that predicts terrestrial flow paths, hydrological transport and the extent of potential liquid releases. The modeling algorithm and process are robust, producing repeatable results that correspond to expected results on control surfaces. This process yields a more accurate indication of the segments of a pipeline that could impact an HCA should a spill occur. The main opportunities for improvement are through the future availability of enhanced datasets. As these become available, they will be integrated into the process. The terrestrial spill modeling approach presents a complete solution to the requirement of identifying pipeline segments that could impact HCAs. This is the first step toward building a comprehensive integrity management plan.
BIBLIOGRAPHY United States Department of Transportation (USDOT), Research and Special Programs Administration, 2000, “49 CFR Parts 195, Pipeline Safety: Pipeline Integrity Management in High Consequence Areas (Hazardous Liquid Operators with 500 or More Miles of Pipeline)”: Published online at [http://ops.dot.gov/finalrule/491060p.htm] United States Geological Survey (USGS), 1979-2002, “USGS Bemidji Toxics Project”: Published online at [http://wwwmn.cr.usgs.gov/bemidji/] GeoFields and Facility Explorer are trademarks of GeoFields, Inc. All Rights Reserved.