Embed Size (px)
Citation preview

Terminology
Dr. Richard Jerz
© 2018 rjerz.com1
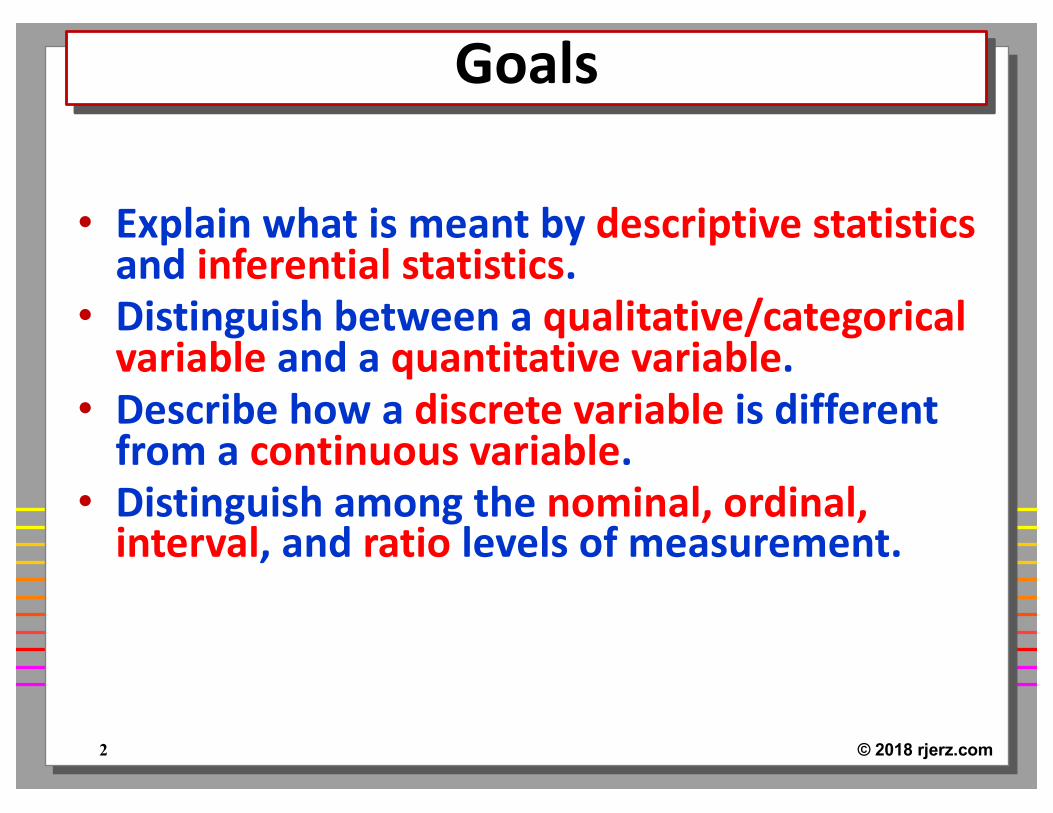
Goals
• Explain what is meant by descriptive statisticsand inferential statistics.
• Distinguish between a qualitative/categorical variable and a quantitative variable.
• Describe how a discrete variable is different from a continuous variable.
• Distinguish among the nominal, ordinal, interval, and ratio levels of measurement.
© 2018 rjerz.com2
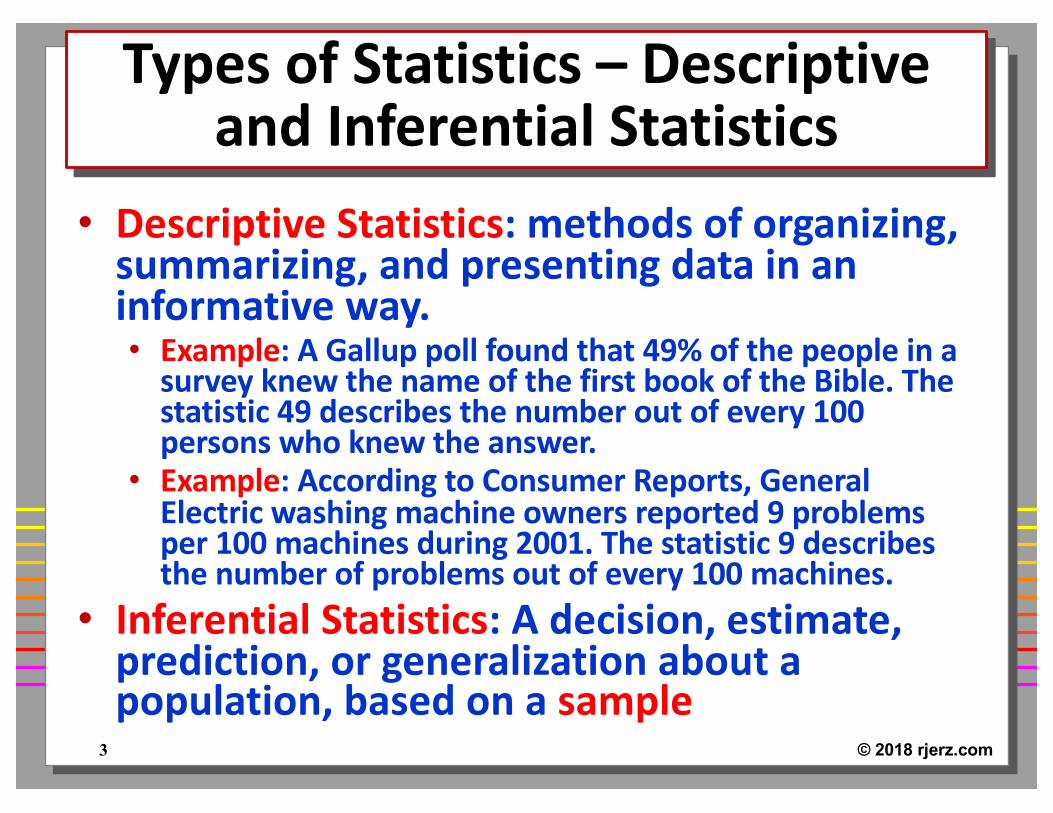
Types of Statistics – Descriptive and Inferential Statistics
• Descriptive Statistics: methods of organizing, summarizing, and presenting data in an informative way.• Example: A Gallup poll found that 49% of the people in a
survey knew the name of the first book of the Bible. The statistic 49 describes the number out of every 100 persons who knew the answer.
• Example: According to Consumer Reports, General Electric washing machine owners reported 9 problems per 100 machines during 2001. The statistic 9 describes the number of problems out of every 100 machines.
• Inferential Statistics: A decision, estimate, prediction, or generalization about a population, based on a sample
© 2018 rjerz.com3

Population versus Sample
• A population is a collection of all possible individuals, objects, or measurements of interest.
• A sample is a portion, or part, of the population of interest
© 2018 rjerz.com4
Types of Variables
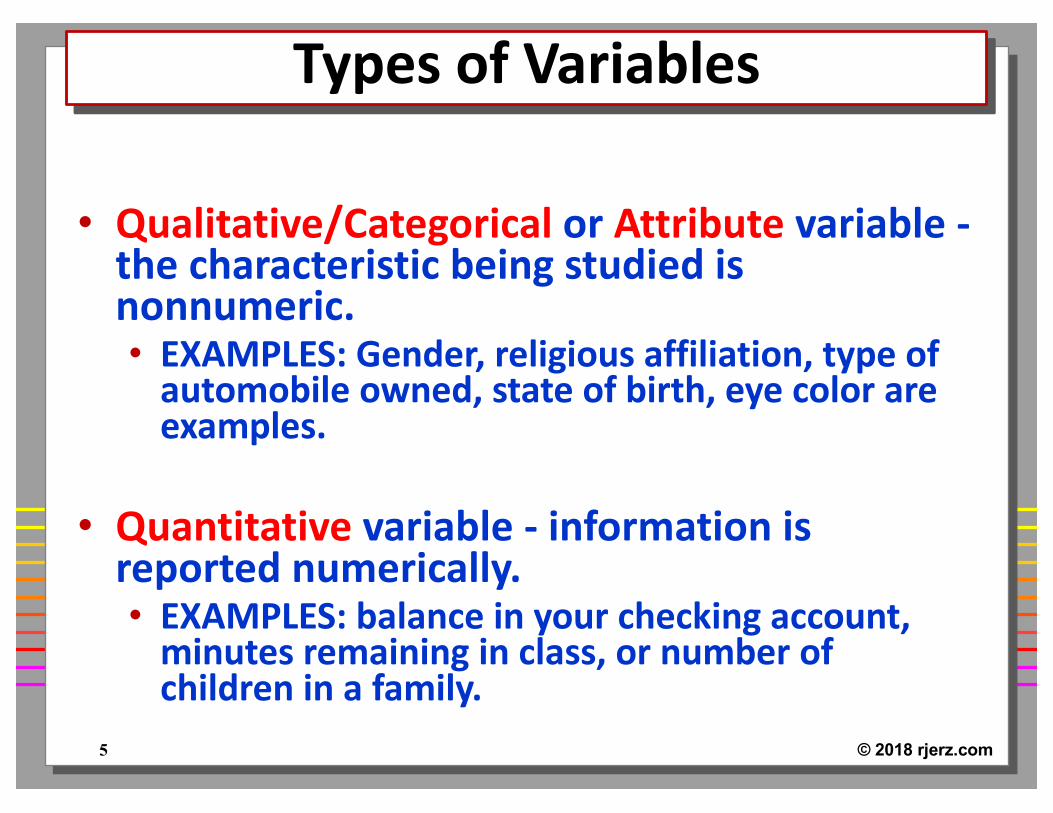
• Qualitative/Categorical or Attribute variable -the characteristic being studied is nonnumeric. • EXAMPLES: Gender, religious affiliation, type of
automobile owned, state of birth, eye color are examples.
• Quantitative variable - information is reported numerically. • EXAMPLES: balance in your checking account,
minutes remaining in class, or number of children in a family.
© 2018 rjerz.com5

Quantitative Variables –
Classifications
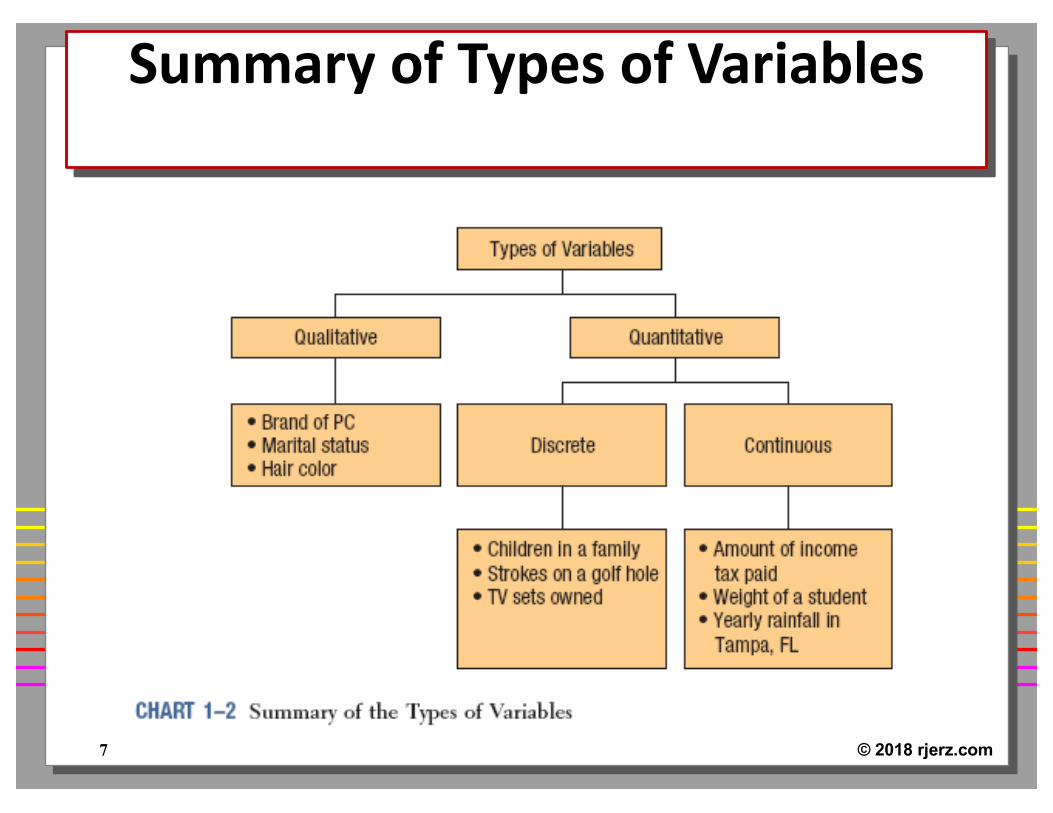
• Quantitative variables can be classified as either discrete or continuous.
• Discrete variables: can only assume certain values and there are usually “gaps” between values.
• Example: the number of bedrooms in a house, or the number of hammers sold at the local Home Depot (1,2,3,…,etc.)
• Continuous variables: can assume any value within a specified range.
• Example: The pressure in a tire, the weight of a pork chop, or the height of students in a class.
© 2018 rjerz.com6
Summary of Types of Variables
© 2018 rjerz.com7
Four Levels of Measurement
• Nominal level• Ordinal level• Interval level• Ratio level
© 2018 rjerz.com8
Nominal Level
• Data that is classified into categories and cannot be arranged in any particular (or natural) order.
• Examples: eye color, gender, religious affiliation.
© 2018 rjerz.com9
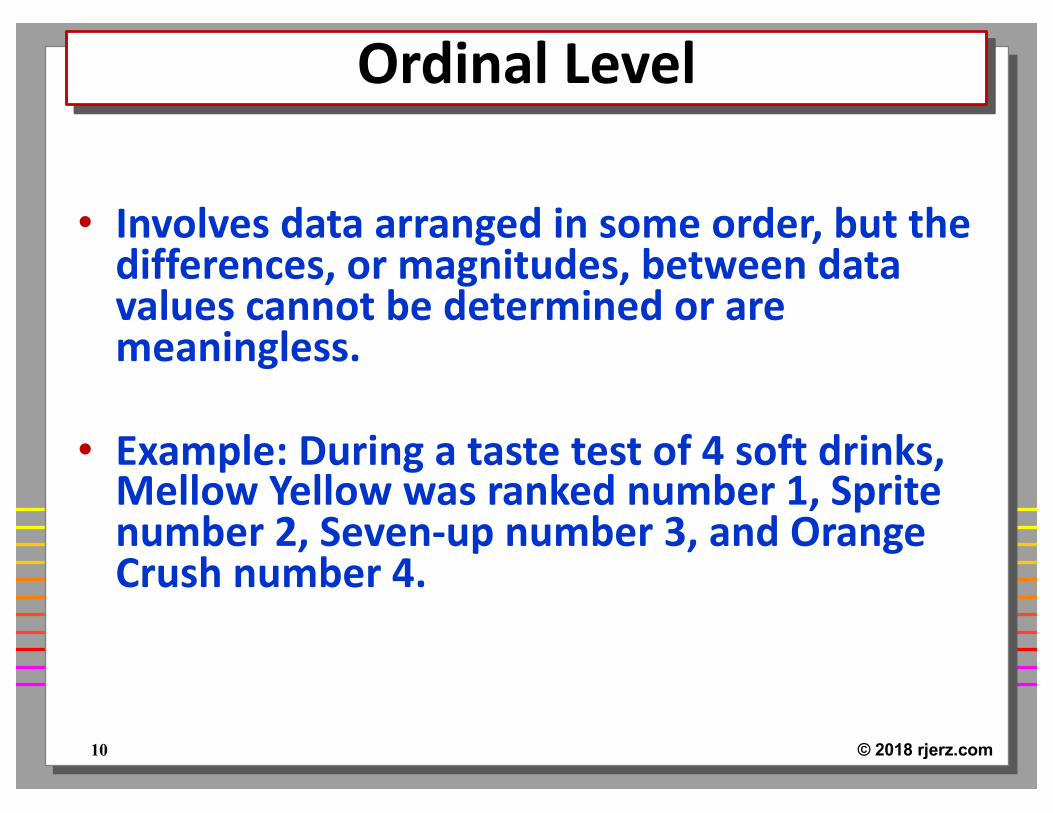
Ordinal Level
• Involves data arranged in some order, but the differences, or magnitudes, between data values cannot be determined or are meaningless.
• Example: During a taste test of 4 soft drinks, Mellow Yellow was ranked number 1, Sprite number 2, Seven-up number 3, and Orange Crush number 4.
© 2018 rjerz.com10
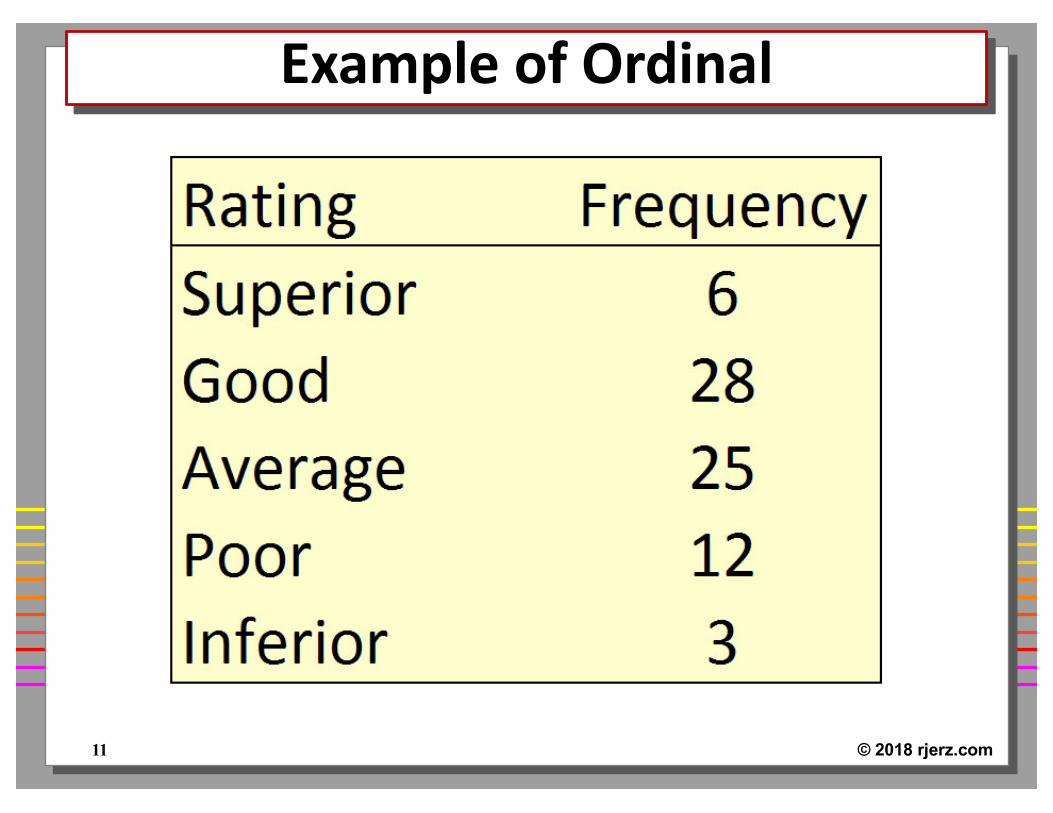
Example of Ordinal
© 2018 rjerz.com11
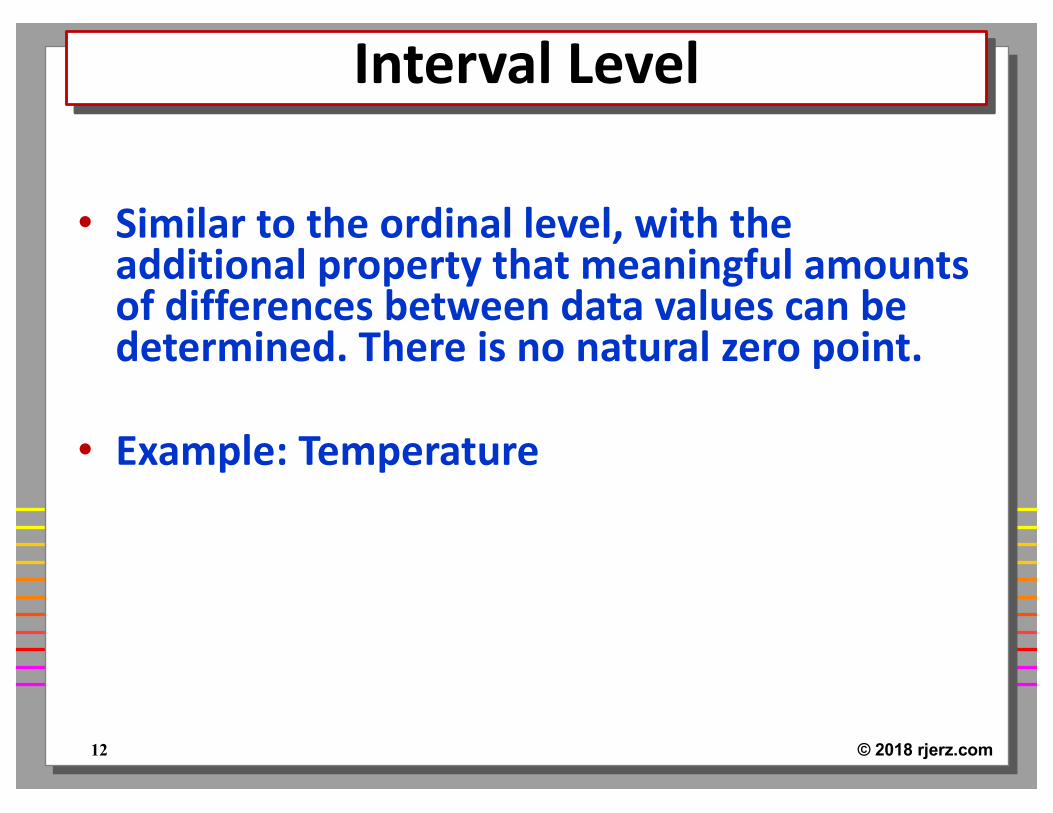
Interval Level
• Similar to the ordinal level, with the additional property that meaningful amounts of differences between data values can be determined. There is no natural zero point.
• Example: Temperature
© 2018 rjerz.com12

Ratio Level
• The interval level with an inherent zero starting point. Differences and ratios are meaningful for this level of measurement.
• Examples: Monthly income of surgeons, or distance traveled by manufacturer’s representatives per month.
© 2018 rjerz.com13
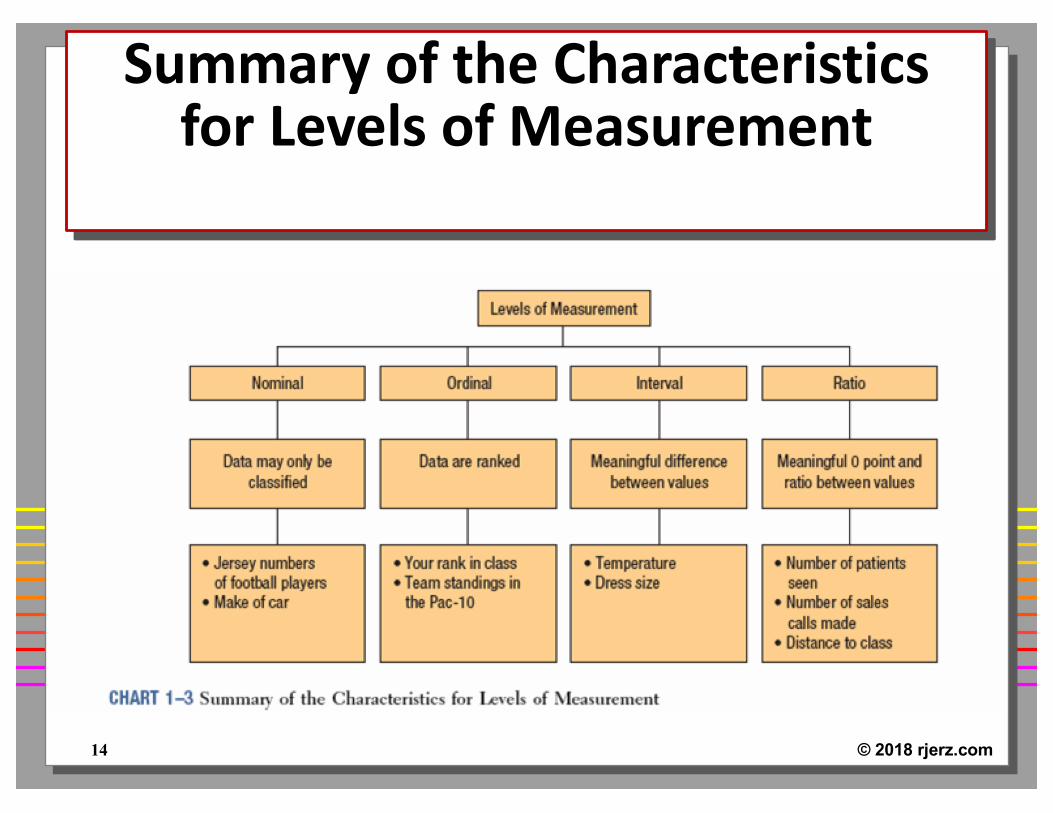
Summary of the Characteristics for Levels of Measurement
© 2018 rjerz.com14

Levels of Measurement and Types of Variables
© 2018 rjerz.com15

Why Know the Level of Measurement of a Data?
• The level of measurement of the data dictates the calculations that can be done to summarize and present the data.
• To determine the statistical tests that should be performed on the data
© 2018 rjerz.com16