Embed Size (px)
Citation preview

SOEPpaperson Multidisciplinary Panel Data Research
The GermanSocio-EconomicPanel study
Terminal Decline in Well-Being: The Role of Multi-Indicator Constellations of Physical Health and Psychosocial Correlates
Andreas M. Brandmaier, Nilam Ram, Gert G. Wagner, Denis Gerstorf
912 201
7SOEP — The German Socio-Economic Panel study at DIW Berlin 912-2017

SOEPpapers on Multidisciplinary Panel Data Research at DIW Berlin This series presents research findings based either directly on data from the German Socio-Economic Panel study (SOEP) or using SOEP data as part of an internationally comparable data set (e.g. CNEF, ECHP, LIS, LWS, CHER/PACO). SOEP is a truly multidisciplinary household panel study covering a wide range of social and behavioral sciences: economics, sociology, psychology, survey methodology, econometrics and applied statistics, educational science, political science, public health, behavioral genetics, demography, geography, and sport science. The decision to publish a submission in SOEPpapers is made by a board of editors chosen by the DIW Berlin to represent the wide range of disciplines covered by SOEP. There is no external referee process and papers are either accepted or rejected without revision. Papers appear in this series as works in progress and may also appear elsewhere. They often represent preliminary studies and are circulated to encourage discussion. Citation of such a paper should account for its provisional character. A revised version may be requested from the author directly. Any opinions expressed in this series are those of the author(s) and not those of DIW Berlin. Research disseminated by DIW Berlin may include views on public policy issues, but the institute itself takes no institutional policy positions. The SOEPpapers are available at http://www.diw.de/soeppapers Editors: Jan Goebel (Spatial Economics) Martin Kroh (Political Science, Survey Methodology) Carsten Schröder (Public Economics) Jürgen Schupp (Sociology) Conchita D’Ambrosio (Public Economics, DIW Research Fellow) Denis Gerstorf (Psychology, DIW Research Director) Elke Holst (Gender Studies, DIW Research Director) Frauke Kreuter (Survey Methodology, DIW Research Fellow) Frieder R. Lang (Psychology, DIW Research Fellow) Jörg-Peter Schräpler (Survey Methodology, DIW Research Fellow) Thomas Siedler (Empirical Economics, DIW Research Fellow) C. Katharina Spieß (Education and Family Economics) Gert G. Wagner (Social Sciences)
ISSN: 1864-6689 (online)
German Socio-Economic Panel (SOEP) DIW Berlin Mohrenstrasse 58 10117 Berlin, Germany Contact: [email protected]

Terminal Decline in Well-Being 1
Running head:
TERMINAL DECLINE IN WELL-BEING: CONSTELLATIONS OF CORRELATES
Terminal Decline in Well-Being:
The Role of Multi-Indicator Constellations of Physical Health and Psychosocial Correlates
Andreas M. Brandmaier1,2, Nilam Ram3,4, Gert G. Wagner1,3, & Denis Gerstorf3,5
1Max Planck Institute for Human Development, Berlin, Germany
2Max Planck UCL Centre for Computational Psychiatry and Ageing Research, Berlin, Germany
3German Institute for Economic Research (DIW Berlin), Berlin, Germany
4Pennsylvania State University, University Park, US
5Humboldt University, Berlin, Germany
June 15, 2017
Address correspondence regarding this manuscript to: Andreas M. Brandmaier, Center for
Lifespan Psychology, Max Planck Institute for Human Development, Lentzeallee 94, 14195
Berlin, Germany; phone: +49-(0)30-82406-423; [email protected].
Copyright © 2017 by the American Psychological Association. The official citation that should be used in referencing this material is: Brandmaier, A. M., Ram, N., Wagner, G. G., & Gerstorf, D. (2017). Terminal Decline in Well-Being: The Role of Multi-Indicator Constellations of Physical Health and Psychosocial Correlates. Developmental Psychology, 53(5), 996-1012. doi: http://dx.doi.org/10.1037/dev0000274. This article may not exactly replicate the authoritative document published in the APA journal. It is not the copy of record.
Terminal Decline in Well-Being 2
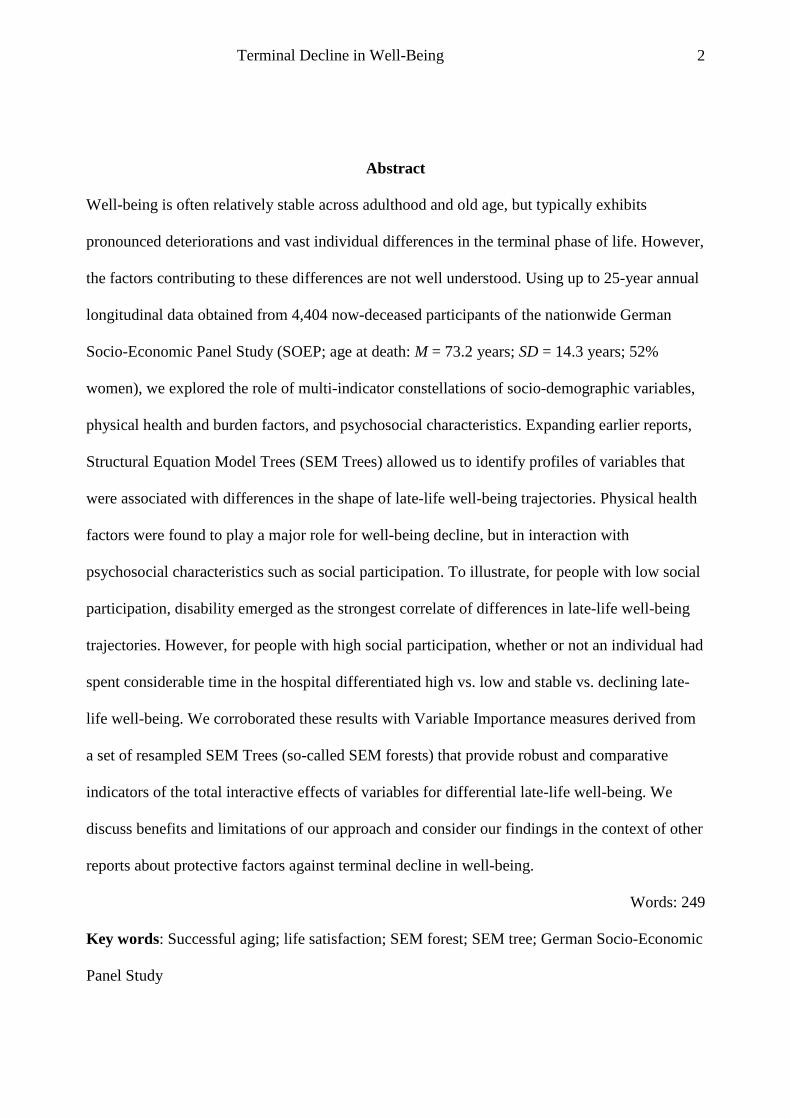
Abstract
Well-being is often relatively stable across adulthood and old age, but typically exhibits
pronounced deteriorations and vast individual differences in the terminal phase of life. However,
the factors contributing to these differences are not well understood. Using up to 25-year annual
longitudinal data obtained from 4,404 now-deceased participants of the nationwide German
Socio-Economic Panel Study (SOEP; age at death: M = 73.2 years; SD = 14.3 years; 52%
women), we explored the role of multi-indicator constellations of socio-demographic variables,
physical health and burden factors, and psychosocial characteristics. Expanding earlier reports,
Structural Equation Model Trees (SEM Trees) allowed us to identify profiles of variables that
were associated with differences in the shape of late-life well-being trajectories. Physical health
factors were found to play a major role for well-being decline, but in interaction with
psychosocial characteristics such as social participation. To illustrate, for people with low social
participation, disability emerged as the strongest correlate of differences in late-life well-being
trajectories. However, for people with high social participation, whether or not an individual had
spent considerable time in the hospital differentiated high vs. low and stable vs. declining late-
life well-being. We corroborated these results with Variable Importance measures derived from
a set of resampled SEM Trees (so-called SEM forests) that provide robust and comparative
indicators of the total interactive effects of variables for differential late-life well-being. We
discuss benefits and limitations of our approach and consider our findings in the context of other
reports about protective factors against terminal decline in well-being.
Words: 249
Key words: Successful aging; life satisfaction; SEM forest; SEM tree; German Socio-Economic
Panel Study

Terminal Decline in Well-Being 3
Terminal Decline in Well-Being:
The Role of Multi-Indicator Constellations of Physical Health and Psychosocial Correlates
A variety of conceptual perspectives and a large body of empirical literature suggest that
well-being remains largely stable throughout adulthood and old age (Brandstädter, 1999;
Brickman & Campbell, 1971; Carstensen, 2006; Diener, Suh, Lucas, & Smith, 1999). The last
years of life, in contrast, are often characterized by steep deteriorations in well-being, with
substantial individual differences in how such terminal decline proceeds (for overview, see
Gerstorf & Ram, 2013). The factors that contribute to these individual differences in terminal
decline of well-being have not yet been described in detail. In the present study, we make use of
new data mining tools to identify constellations of socio-demographic, physical health and
burden, and psychosocial characteristics that are associated with differences in terminal decline
of well-being. Pearlin (1989) reminded us of the need to move away from a focus on single life
events or strains as determinant of well-being and instead to examine constellations of acute and
chronic stressors to fully understand their potentially interactive effects on well-being. For
example, retirement may have a negative effect if associated with a loss of status but a positive
effect if considered as an opportunity for self-fulfillment. In the same sense, we here present a
data-analytic approach that specifically takes into account the interactive nature of a variety of
potential life-events and characteristics. Specifically, we use Structural Equation Modeling
Trees and Forests (Brandmaier, Prindle, McArdle, & Lindenberger, in press; Brandmaier, von
Oertzen, McArdle, & Lindenberger, 2013) applied to 25-year annual longitudinal data obtained
from 4,404 now-deceased participants of the nationwide German Socio-Economic Panel Study
(SOEP; age at death: M = 73.2 years; SD = 14.3 years; 52% women) to identify correlates of
terminal decline in well-being and their interactions.
Terminal Decline in Well-Being and its Correlates
A myriad of empirical reports converge in documenting that well-being takes a
precipitous fall in the last years of life (Berg, Hassing, Thorvaldsson, & Johansson, 2011; Burns,

Terminal Decline in Well-Being 4
Mitchell, Shaw, & Anstey, 2014; Carmel, Shrira, & Shmotkin, 2013; Diehr, Williamson, Burke,
& Psaty, 2002; Mroczek & Spiro, 2005; Palgi et al., 2014; Palgi et al., 2010; Schilling, Wahl, &
Oswald, 2013; Vogel, Schilling, Wahl, Beekman, & Penninx, 2013; Windsor, Gerstorf, &
Luszcz, 2015). In the midst of such terminal decline, large individual differences exist, with
some people experiencing steep decrements and others maintaining relatively high levels of
well-being into late life. The factors contributing to these individual differences are not yet well
understood. Theoretical work and empirical reports both suggest that socio-demographic, health
and burden, and psychosocial characteristics to be relevant correlates. First, conceptual notions
of reduced biological plasticity with advancing age (Baltes & Smith, 2003) and life-long
accumulation of socio-structural disadvantage (Mirowsky & Ross, 2007; Moen, 1996) each
suggest that the last years of life for very old adults, women, and lower educated population
strata are each portended by increased risks for broad-based dysfunction. Consistent with these
views, empirical evidence suggest that such socio-demographic characteristics are indeed
associated with compromised well-being (Diehr et al., 2002; Gerstorf, Ram, Lindenberger, &
Smith, 2013).
Second, following the Strengths and Vulnerabilities Integration model (SAVI, Charles,
2010), chronic physical health conditions increasingly undermine the application of accumulated
lifetime skills of emotion regulation. In line with this and other theoretical models (Lawton,
1983; Watson & Pennebaker, 1989), proxy variables such as pathology, disability, and
comorbidities have been linked with well-being, also late in life (Burns et al., 2014; Carmel et
al., 2013; Infurna et al., 2014; Schilling et al., 2013). In a similar vein, a variety of major life
events such as unemployment or bereavement are known to have long-lasting effects on well-
being, among other reasons because such events are often associated with profound changes in
daily routines (Lucas, 2007a).
Third, drawing from models of perceived control (Lachman, 2006), control perceptions
presumably foster well-being by, for example, buffering the effects of stressors on physiological

Terminal Decline in Well-Being 5
reactivity, helping to down-regulate negative emotions, and to mobilize social support when
needed (see Gerstorf & Ram, 2013). In line with these notions, our own work finds that
perceived personal control is associated with higher levels of late-life well-being, less severe
rates of terminal decline, and later onset of terminal decline (Gerstorf et al., 2014). Similarly,
social participation and orientation presumably boost well-being in a number of ways, for
example, because people pursue gratifying activities; because such activities promote feelings of
competence, personal control, and self-esteem; or because a socially active lifestyle helps
maintain physical and cognitive fitness (Herzog & House, 1991; Lyubomirsky & Layous, 2013).
Again consistent with these conceptual considerations, Windsor and colleagues (2015) reported
from the Australian Longitudinal Study of Aging that social engagement and satisfying
relationships were associated with higher well-being at the end of life.
Relevant for the conceptual rationale of our study are several notes. Evidence for
predictors of the between-person differences in terminal decline of well-being is generally
sparse, with most of the correlates being associated with differences in level of well-being late in
life, but not with differences in the rate of terminal decline. This is particularly true for the
physical health factors, suggesting that poor physical health is just one set of relevant variables
to consider. We argue that differential terminal decline is probably better discernible when we
do not consider marginal associations, and rather consider a hybrid of idiographic and
nomothetic analytical approaches that allow us to identify and examine constellations of risk and
protective factors. In particular, we contend that the unique and shared effects of multiple
variables, combined together, may represent the constellations of risk and protective factors that
influence terminal decline in well-being. To illustrate, it would be intriguing to examine whether
particular psychosocial characteristics are especially relevant in the context of severe health
limitations. Berg and colleagues (2011) reported from the OCTO study that people who
maintained high levels of perceived control late in life when suffering from severe physical
health constraints maintained relatively high levels of life satisfaction. In a similar way, it is

Terminal Decline in Well-Being 6
theoretically plausible that social resources boost perceived control in linear or non-linear ways
that in turn help people maintain health and well-being into late-life (Antonucci, 2001; Cohen &
Wills, 1985). In our own work, it has not been possible, so far, to empirically test such notions
in a single framework. In the current study, we move one step further by making use of a data-
analytic strategy that allows for more flexibility in how variables from different domains and
different points in time are combined and analyzed simultaneously.
Structural Equation Modeling Trees and Forests
Structural equation model (SEM) Trees and Forests have recently been introduced into
the literature as a methodological tool to structure and understand heterogeneity (Brandmaier et
al., in press; Brandmaier et al., 2013; Brandmaier, von Oertzen, McArdle, & Lindenberger,
2014). In brief, SEM Trees and SEM Forests are an instance of model-based recursive
partitioning, a non-parametric statistical method that originates from the field of machine
learning and data mining but can be traced back to early work on binary segmentation methods
from five decades ago (Sonquist & Morgan, 1964). In the same way that univariate decision
trees provide a non-parametric alternative to regression models, SEM Trees can be regarded as a
non-parametric alternative to expanding a SEM. Particularly, they offer a non-parametric way of
adding predictors of sample heterogeneity (i.e., between-group differences) to an initial theory-
driven, multivariate SEM. In the present paper, these methods are used to identify correlates of
sample heterogeneity in SEM-based growth curves.
The decision tree approach allows us to target the complex, potentially interactive nature
of a given set of hypothesized correlates in how they relate to individual differences in a given
outcome (e.g., a growth curve). The non-parametric approach offered by trees enables us to
model nonlinear interactions among the correlates (see Brandmaier et al., 2013), and also avoids
making the often too strict assumption that effects are additive (e.g., as done in linear
regression). Trees are particularly useful for data sets with a large number of potential correlates
and interrelations that are expected to be complex and interactive. Essentially, trees operate by
Terminal Decline in Well-Being 7
recursively splitting an initially heterogeneous sample into homogeneous subgroups. The
method only maintains subgroups such that individuals within one group are highly similar and
maximally different from other groups. In the present inquiry, individuals within one group are
described by a SEM-based growth model that is maximally different from other groups’ growth
models. In decision tree approaches, only those subgroups that can be inferred from the set of
candidate correlates are considered. The method resembles latent mixture models for modeling
sub-populations in the overall population, with the difference that observed correlates are
utilized to form and describe membership of individuals in subgroups. The recursive partitioning
paradigm is increasingly applied in the social, behavioral, and life sciences. For example, in
clinical decision making, decision trees have been applied to identify constellations of cognitive,
biomarker and other variables as effective correlates for outcomes as diverse as treatment
success of inpatient psychotherapy (Hannöver & Kordy, 2005), alcohol or smoking behavior
(Kitsantas, Kitsantas, & Anagnostopoulou, 2008; Kitsantas, Moore, & Sly, 2007), functional
impairment (Lemsky, Smith, Malec, & Ivnik, 1996), depression (Schmitz, Kugler, & Rollnik,
2003), subjective memory impairment (Jessen et al., 2007), suicidal ideation in older people
(Handley et al., 2014), and mortality hazards (Gruenewald, Seeman, Ryff, Karlamangla, &
Singer, 2006). Increasingly, these methods are also employed to support psychological theory-
building, for example, to explore contextual features contributing to feelings of stress in later life
(Scott, Jackson, & Bergeman, 2011), to predict longitudinal attrition in surveys (McArdle,
2013), to explore differences in cross-sectional factor profiles and developmental latent growth
curves of intelligence (Brandmaier et al., 2013), or to explore correlates of differential
trajectories of cognitive functioning in old age (Brandmaier et al., 2014).
Applying Structural Equation Modeling Trees and Forests to Study Terminal Decline (in
Well-Being)
Research on well-being has so far primarily focused on bivariate associations when
assessing how well-being relates to key correlates, such as social support, health, or socio-

Terminal Decline in Well-Being 8
economic status (see Dolan, Peasgood, & White, 2008). We have identified only two instances
in which recursive partitioning has been used to describe how a multivariate set of correlates
relate to well-being in adulthood and old age. First, Wallace, Bergeman, and Maxwell (2002)
applied recursive partitioning analyses to cross-sectional data so as to investigate associations of
protective factors (perceived control, social support coping, and physical health) with well-being
in later life. Second, Gruenewald, Mroczek, Ryff, and Singer (2008) applied decision trees to
cross-sectional data from the MIDUS study to explore social, psychological, behavioral, and
socio-demographic correlates of negative affect and positive affect in adulthood and later life.
Results revealed that correlates of well-being were in part specific to the valence category
examined (some correlates, such as gender, were identified as significant predictors for positive
affect, but not negative affect) as well as the age group considered (some correlates, such as
physical health and marital status, in a tree predicting negative affect were identified as
significant predictors among older adults, but not among middle-aged adults).
Using SEM Trees and SEM Forests, we extend these cross-sectional approaches by
investigating potential correlates of individual differences in intraindividual patterns of change
in well-being at the end of life. The decision tree approach allows us to target the complex,
potentially interactive, nature of how these correlates relate to individual differences in terminal
decline. We expect that not all relevant correlates operate in a simply additive fashion. For
example, some may have compensatory effects (e.g., social support), whereas others have
cumulative effects (e.g., perceived control and self-reported health). To illustrate, it is possible
that people who suffer from disability but who manage to maintain their social orientation and
remain socially active experience less pronounced well-being decrements relative to those with
lowered social goals and/or reduced social participation. Or, as an illustration of a positive
cumulative effects, beneficial effects of perceived control may be compounded by beneficial
effects of increased self-reported health, (Wallace et al., 2002).

Terminal Decline in Well-Being 9
The Present Study
In the current study, we use SEM Trees and SEM Forests analyses of long-term
longitudinal data from now-deceased participants in the SOEP to explore a large set of potential
correlates of differences in terminal decline of well-being. We selected three sets of variables
known to be associated with individual differences in mortality hazards and well-being (see
Gerstorf & Ram, 2013; Vaupel, 2010), including socio-demographics, health and burden factors,
and psychosocial factors. We are building on and expanding two sets of earlier reports: Studies
that used recursive partitioning to identify cross-sectional correlates of well-being in adulthood
(Gruenewald et al., 2008; Wallace et al., 2002) and studies that used traditional growth models
to identify correlates of terminal decline in well-being (Gerstorf et al., 2016). Specifically, we
apply SEM Trees and SEM Forests to well-being data obtained in the last years of life so as to
identify multi-way (nonlinear) constellations of socio-demographic, physical health and burden,
and psychosocial factors associated with differences in terminal decline. These constellations
encompass the complex combinations of conditions associated with severe forms of terminal
decline in well-being and the constellations of conditions associated with less severe rates of
decline.
Method
Participants and Procedure
The SOEP is a nationally representative annual panel study of private households that
covers by now some 50,000 residents in Germany, including immigrants and resident foreigners
(Headey, Muffels, & Wagner, 2010). Data collection began in 1984. Participants were randomly
selected from selected geographic locations in the former West and East Germany. Details of
study materials and methods can be found in Wagner, Frick, and Schupp (2007). For the present
analysis, we make use of the subsample of now deceased participants who provided data
between 1984 and 2009. From these N = 4,886 participants, we analyze data from the n = 4,404
who completed at least a single assessment of well-being during the last ten years of their life.

Terminal Decline in Well-Being 10
At the time of death, participants (52.2%, n = 2,297 male) were on average 73.6 years old (SD =
14.1, min = 18, max = 104), and had accumulated an average of 10.7 years of education (SD =
2.1). For analysis of terminal decline, all available observations obtained in the last 10 years of
life (between ages 17 and 102 years from birth) were realigned along a time-to-death time
metric (spanning the 10 to 0 years before death). The median person provided six observations
(range 1 to 11).
Measures
Well-being. Each year, participants were asked “Wie zufrieden sind Sie gegenwärtig,
alles in allem, mit ihrem Leben?” (translated as “How satisfied are you currently with your life,
all things considered?”). Responses were provided on an 11-point Likert scale ranging from 0
(totally unsatisfied) to 10 (completely satisfied) and are considered a measure of cognitive-
evaluative components of well-being (as opposed to affective-emotional components; see Fujita
& Diener, 2005; Gerstorf et al., 2008; Gerstorf et al., 2010). For comparison with other studies,
scores were rescaled to a T metric (M = 50, SD = 10) using the 2002 SOEP sample as the
reference frame (M = 6.90, SD = 1.81). On average, participants contributed 5.86 (SD = 3.38)
longitudinal measurements, with n = 3,781 (85.85%) participants contributing two or more data
points. In the SEM Trees analysis framework, these repeated measures are placed within an
SEM growth model that serves as the “outcome” of interest and is predicted by a variety of
socio-demographic characteristics, physical health and burden factors, and psychosocial
characteristics.
Socio-demographic characteristics. This category of correlates included age at death,
sex, education, and religious participation. Interviewers assessed information about year of death
and age at death either directly from relatives or neighbors or from the city registry. Death rates
and ages of death in the SOEP study parallel official life tables and so are often used as a
representative resource for mortality-related analyses in Germany (e.g., Brockmann & Klein,
2004; Burkhauser, Giles, Lillard, & Schwarze, 2005). Sex was noted as a binary variable (female
Terminal Decline in Well-Being 11
= 2). Participant’s level of education was measured as total number of years of schooling (range
= 7 to 18). Participation in religion was measured with the item “Wie oft gehen Sie in die Kirche
oder besuchen religiöse Veranstaltungen?” (translated as “How often do you attend church or
other religious events?”), answered on a 1 (every week) to 4 (never) scale that was reverse
coded so that higher scores indicate more religious participation.
Physical health and burden factors. Variables in this category encompassed
documented risk factors for poor well-being and increased hazards of mortality (Vaupel, 2010),
including physical health indicators (disability, hospitalization) and negative life events and
burden (unemployment, divorce, and severe income loss as well as events experienced by close
family members, including disability of the partner, unemployment of the partner,
hospitalization of the partner, death of the partner, and death of the parents). All indicators were
assessed annually or biennially and, before analysis, were converted into dichotomous time-
invariant variables indicating whether an event had happened at least once in the observational
period. Disability and disability of partner were measured at each occasion as self-report of
whether the participant or the participant’s partner was “officially certified as having a reduced
capacity to work or as severely handicapped” (see Lucas, 2007b). Disability indicators were thus
based on self-reports, but referred to official certifications. Hospitalization and hospitalization of
partner were designated whether the person had spent 56 nights or more in the hospital during
the previous year. Unemployment and unemployment of partner indicated whether the person
experienced a change from (fully or partly) “employed” to “registered unemployed”. Income
change indicates a change in individual gross labor income (before tax) of –1,000 or –3,000
€/month, without adjustments for household members or consumer prizes. Divorce, death of a
partner, and death of a parent (only for target persons less than age 40) were noted by responses
to the item “Hat sich an Ihrer familiären Situation im Jahr X [z. Bsp. 2002] etwas verändert?”
(translated as “Has your family situation changed since the beginning of year X [e.g., 2002]?”),
with specific designation for “wurde geschieden” (“got divorced”), “Ehepartner/Lebenspartner

Terminal Decline in Well-Being 12
ist verstorben” (“spouse/partner has died”), Vater verstorben” ( “father died”), or “Mutter
verstorben” (“mother died”).
Psychosocial characteristics. This category of correlates included social participation,
perceived control, and life goals. Social participation was measured using four items asking
about frequency of involvement (1 = each week to 4 = never) in social and cultural activities,
including going to events such as concerts, theaters, or lectures; active sport participation;
honorary activity in clubs, organizations, or social service; and participation in citizen
initiatives, parties, community politics. Responses from the last available assessment were
reverse coded and averaged to obtain a social participation scale score where higher scores
indicate more social participation (for details; see Infurna, Gerstorf, Ram, Schupp, & Wagner,
2011). Perceived control was measured using 8 items assessing the degree to which individuals
feel their life is under their control (e.g., “Ich kann ziemlich viel von dem, was in meinem Leben
passiert, selbst bestimmen.”, translated as “I determine most of what happens to me in life.”),
answered on a scale from 1 (applies completely) to 4 (does not apply). Responses from the last
available assessment were reverse coded and averaged to obtain a perceived control scale score
similar in conception to other measures of perceived control (see Lachman & Weaver, 1998;
Pearlin & Schooler, 1978). Life goals were measured using a set of items that asked participants
how much importance (1 = not at all important to 4 = very important) they attach to social goals
(to help others, be involved in social and political activity), success goals (being able to buy
things, importance of one own’s job), and family goals (having a good marriage, having a good
relationship with children; (for overview, see Headey, 2008). As with the other psychosocial
variables, the last available assessment was used to index importance of goals in each of the
three domains.
Sample Descriptives. In total, 20 variables are examined as candidate correlates of
terminal decline in well-being. Descriptive statistics for the measures under study are given in

Terminal Decline in Well-Being 13
Table 1. Correlations among the set of potential correlates and their correlations with terminal
well-being are given in Table 2.
Of note, there are no missing values for the demographic or health and burden variables,
with the exception of religious activity that was missing for a quarter of the sample. In contrast,
the amount of missing data in the psychosocial variables ranges from 11% (social participation)
to 60% (control beliefs) because these variables were only assessed in specific years (e.g.,
perceived control only measured in 1994, 1995, and 1996). As a consequence, statistical power
to detect effects is larger for the demographic and health and burden correlates than for the
psychosocial correlates. As well, the frequency of occurrence for the negative life events is often
low (e.g., about 1% for divorce), which may impede detection of correlations even if these are
present.
SEM Model of Terminal Decline in Well-Being. Terminal decline in well-being was
modeled in the SEM framework using standard latent growth curve models (LGCM; Duncan,
Duncan, & Strycker, 2013; Ferrer & McArdle, 2003; Ferrer & McArdle, 2010; Meredith &
Tisak, 1990; Ram & Grimm, 2007). In univariate, unconditional LGCMs, the observed variables
are repeated measures of the same variable. In contrast to the traditional factor model, the latent
factors do not represent psychometric factors, but chronometric factors (e.g., Duncan et al.,
2013; Preacher, 2008) capturing aspects of the change process over time. Their factor loadings
are usually fixed to determine the type of hypothesized change captured by the latent factors.
Here, the repeated measures of well-being were modeled using a quadratic LGCM. Change over
time is indicated by three latent factors, an intercept factor (I) capturing individual differences at
a given point in time (at time of death), a linear slope factor (S) capturing individual differences
in linear rate of change in well-being, and a quadratic change factor (Q) capturing accelerations
in the rate of change in well-being, and a set of unique residual factors (𝜖𝜖1to 𝜖𝜖𝑀𝑀) capturing
otherwise unexplained occasion-specific differences.

Terminal Decline in Well-Being 14
The mean vector, 𝝁𝝁, and the covariance matrix, 𝜮𝜮, of the observed variables are a
function of factor loadings, 𝜦𝜦, a latent factor covariance matrix, 𝜳𝜳, and a residual factor
covariance matrix, 𝜣𝜣 (e.g., Bollen, 1989):
𝜮𝜮 = 𝜦𝜦𝜳𝜳𝜦𝜦′ + 𝜣𝜣
𝝁𝝁 = 𝜦𝜦𝜦𝜦
Under the assumption of homoscedastic and uncorrelated residual errors (𝜎𝜎𝜖𝜖𝜖𝜖2 = 𝜎𝜎𝜖𝜖2), and the
intercept anchored at participants’ year of death, the matrices for a quadratic LGCM are
𝜦𝜦 = �
1 𝑇𝑇 − 1 (𝑇𝑇 − 1)2
1 𝑇𝑇 − 2 (𝑇𝑇 − 2)2⋮ ⋮ ⋮1 0 0
�
𝜳𝜳 = �𝜎𝜎𝐼𝐼2
𝜎𝜎𝐼𝐼𝐼𝐼 𝜎𝜎𝐼𝐼2
𝜎𝜎𝐼𝐼𝐼𝐼 𝜎𝜎𝐼𝐼𝐼𝐼 𝜎𝜎𝐼𝐼2�
𝜦𝜦 = �𝜇𝜇𝐼𝐼𝜇𝜇𝐼𝐼𝜇𝜇𝐼𝐼�
𝜣𝜣 = �𝜎𝜎𝜖𝜖2 0 00 ⋱ 00 0 𝜎𝜎𝜖𝜖2
�
where T is the number of equidistant measurement occasions and the estimated parameters
include the residual error variance, 𝜎𝜎𝜖𝜖2, the average well-being at death, 𝜇𝜇𝐼𝐼, the extent of
individual in well-being at death, 𝜎𝜎𝐼𝐼2, the average linear rate of change, 𝜇𝜇𝐼𝐼, the extent of
individual differences in that rate of change, 𝜎𝜎𝐼𝐼2, the average quadratic rate of change, 𝜇𝜇𝐼𝐼, the
extent of individual differences in that rate of change, 𝜎𝜎𝐼𝐼2, and the covariances of the latent
intercept, linear, and quadratic slope, 𝜎𝜎𝐼𝐼𝐼𝐼 , 𝜎𝜎𝐼𝐼𝐼𝐼,𝑎𝑎𝑎𝑎𝑎𝑎 𝜎𝜎𝐼𝐼𝐼𝐼. This quadratic LGCM was estimated
(within the SEM Trees framework described below) using full information maximum likelihood
(FIML), which yields unbiased estimates when data are missing completely at random (MCAR;
e.g., when missing is only due to study protocol) or missing at random (MAR; Neale, 2000;
Rubin, 1976).

Terminal Decline in Well-Being 15
Structural Equation Model Trees. Traditional SEM analyses assume sample
homogeneity in a sense that each person adheres to the same specification and parameterization
of the model. For example, a common assumption is that all individuals in the sample are
adequately represented by a single quadratic LGCM. When heterogeneity is assumed to be
present and unobserved, Growth Mixture Models (GMM; e.g.,Muthen, 2001) are often used to
retrieve a clustering structure of participants’ growth trajectories. As such, GMMs and other
related techniques that invoke learning of hidden structure in time series data (e.g., Brandmaier,
2015) can be useful for generating hypotheses about differences in change processes (see Ram
& Grimm, 2009). As an extension to GMM, predictors of latent class group membership may be
included to inform the estimation of latent class membership. This procedure requires an a priori
choice of variables predicting group membership. The chosen predictors in a GMM can then be
specified as linear and additive effects on the group membership and – unless explicitly
specified – GMM does not allow for interactions among them. In this study, we use SEM Trees
(SEM Trees; Brandmaier et al., 2013), which are a combination of SEM and decision trees to
select among a heterogeneous set of potential predictors. Trees allow examining non-linear
associations between predictors and outcomes and allow detection of interactions among
predictors. They achieve this by recursively splitting the outcome space into piecewise
homogeneous areas, which – in principle – allows estimating arbitrary functional forms. This is
in contrast to linear models that are restricted to linear relations and a priori selected
interactions. SEM Trees were proposed as a data-analytic tool that allows an exploratory search
for predictors of differences in an initially theory-guided, multivariate model as outcome. By
specifying the model of terminal decline in well-being as the SEM-based quadratic LGCM
described above, SEM Trees allow for identification and examination of predictors, which we
henceforth refer to as correlates to emphasize that they may not necessarily serve as antecedents
of decline but rather accompaniments of differences in terminal decline trajectories.

Terminal Decline in Well-Being 16
SEM Trees are decision trees, similar to classification and regression trees (CART;
Breiman, Friedman, Stone, & Olshen, 1984), which recursively partition a sample into
subgroups, such that, with respect to the outcome, participants within the subgroups are
maximally similar to each other and the subgroups themselves maximally different from each
other. Whereas standard CART analyses feature univariate outcomes, SEM Trees are model-
based trees, that is, each leaf in a SEM tree represents a multivariate model (e.g., a quadratic
LGCM) with a unique set of parameter estimates. The criterion to determine the best split in
each leaf is based on a likelihood-ratio test of differences between the groups resulting from a
given split (Brandmaier et al., 2013). At each leaf, the tree is only further split if the likelihood
ratio test indicated a significant group difference after Bonferroni-correction for multiple testing.
We note that each potential correlate is evaluated only on the data available for that specific
variable. In our case, for example, a potential split on the root of the tree for disability is based
on the entire sample (because we have no missing data for disability), whereas a potential split
for perceived control is based only on the 1,744 participants for whom data on this variable were
available.
Structural Equation Model Forests. We complement the single-tree analysis with a
SEM Forest analysis (Brandmaier et al., in press). SEM forests are ensembles of SEM trees,
with each tree being based on a randomly permuted sample of the original data, and allow for a
more robust quantification of variable importance - the impact of a given variable as an
individual correlate together with its effect in multivariate interaction with all other potential
correlates. Calculating variable importance from only a single tree has two important
drawbacks: (a) from two or more highly correlated but equally predictive variables, only a single
must be chosen for each decision node in a tree and we would have no means to accurately
estimate importance for the variable left out, and (b) we would evaluate only the specific
conditional effects of variables along the paths in a tree but there may be other conditional
effects to consider. Averaging variable importance over resampled trees in a forest allows us to

Terminal Decline in Well-Being 17
quantify the effect of a variable of interest across a diverse set of interactions. From an ANOVA
perspective, this is similar to a compound measure of the main effect of a variable and all its
possible interactions. Variable importance allows us to rank-order potential correlates of
differences in the outcome and to derive relative importance among correlates. In particular, the
variable importance statistic, VI, achieves this goal by estimating for each correlate the impact
of its absence on the predictive accuracy of the whole forest, thereby removing the effect of a
variable and its interactions when making a forest-based prediction (Brandmaier et al., in press).
In sum, extension from SEM Tree to SEM Forest and the quantification of variable importance
enables us to evaluate the set of candidate correlates with respect to the role each variable plays
in predicting differences in terminal decline trajectories in a more robust and rigorous manner
than a single tree. We employed SEM forests with 1,000 trees, subsampling as resampling
procedure for cases and randomly sampling two potential correlates at each node of the tree (see
Brandmaier et al., in press for details).
Equifinality and Multifinality. Further interpretation of the SEM Tree is facilitated by
two additionnal measures. In theoretical discussions of development, equifinality and
multifinality are often used to describe pathways of complex behavioral change (Sroufe, 1997).
In general systems theory (Von Bertalanffy, 1969), multifinality refers to a scenario in which
similar initial conditions lead to dissimilar outcomes, and equifinality describes a scenario in
which the same or a similar outcome is reached through a variety of different developmental
pathways and/or initial conditions. With some caution, trees containing variables that indicate
individuals’ differential experiences, like the negative life events and burden, allow for an
interpretation of the tree in terms of individuals’ developmental pathways (Scott, Whitehead,
Bergeman, & Pitzer, 2013). The specific path from the root to a leaf that is followed when
classifying an individual case may be interpreted as a description of that individual’s “life
experience” in a broader sense (spanning socio-demographic, physical health and burden, and
psychosocial characteristics). Note, however, that the selection criterion of variables is not

Terminal Decline in Well-Being 18
reflecting a temporal or causal ordering, but merely a statistical one. We propose a heuristic
approach to quantify the (dis)similarity of subsamples as represented by the leafs of a tree with
measures drawing upon the ideas of multi- and equifinality.
Taking a cross-sectional perspective, we quantify multifinality (same “life experiences”,
different outcome) as the extent of variability in well-being at the end of life within each leaf of
the tree, specifically, the magnitude of individual differences in terminal well-being (i.e., the
random effect of intercept, 𝝈𝝈𝑰𝑰,𝒊𝒊𝟐𝟐 ) in each leaf of the tree. As such, the proposed metric quantifies
differences in the outcome (well-being) at the year of death instead of differences in the
trajectories. Similar to a measure of explained variance, we normalize this value with the total
observed individual differences of a non-tree model derived from the entire sample (𝝈𝝈𝑰𝑰,𝒓𝒓𝒓𝒓𝒓𝒓𝒓𝒓𝟐𝟐 =
172.8). We formalize equifinality (different “life experiences”, same outcome) as the similarity
of well-being at the end of life across pairs of leafs. To this end, we employ a measure that is
inversely proportional to the standardized difference of intercept means in terminal well-being in
a Cohen’s d metric. Formally, we define Mi to be a measure for the multifinality of leaf i and Eij
a measure of the pairwise equifinality of two leafs i and j.
𝑴𝑴𝒊𝒊 = 𝒎𝒎𝒎𝒎𝒎𝒎(𝟎𝟎, 𝝈𝝈𝑰𝑰,𝒊𝒊𝟐𝟐
𝝈𝝈𝑰𝑰,𝒓𝒓𝒓𝒓𝒓𝒓𝒓𝒓𝟐𝟐 )
𝑬𝑬𝒊𝒊𝒊𝒊 = 𝟏𝟏 −𝒎𝒎𝒊𝒊𝒎𝒎(𝟏𝟏, |𝝁𝝁𝑰𝑰,𝒊𝒊−𝝁𝝁𝑰𝑰,𝒊𝒊|
𝒔𝒔𝒔𝒔�𝝈𝝈𝑰𝑰,𝒊𝒊𝟐𝟐 ,𝝈𝝈𝑰𝑰,𝒊𝒊
𝟐𝟐 �)
with sd being a function calculating the pooled standard deviation based on the two leaf’s
random effect estimates of the intercept 𝜎𝜎𝑖𝑖2 and 𝜎𝜎𝑗𝑗2:
𝑠𝑠𝑎𝑎�𝜎𝜎𝑖𝑖2,𝜎𝜎𝑗𝑗2� = �(𝑁𝑁𝑖𝑖 − 1)𝜎𝜎𝑖𝑖2 + �𝑁𝑁𝑗𝑗 − 1�𝜎𝜎𝑗𝑗2
𝑁𝑁𝑖𝑖 + 𝑁𝑁𝑗𝑗 − 2
Both measures were defined such that they range from zero to one, with higher values
representing larger degrees of multifinality and equifinality, respectively. Multifinality of zero is
achieved in a leaf for which the variability of the intercept is zero – when there is no variability
between persons in a leaf. A multifinality of one is obtained if the individual differences are
Terminal Decline in Well-Being 19
equal in a leaf and a root-only model in which the sample is assumed homogenous (i.e., no
subgroups). Pairwise equifinality is zero is when there are large differences in the average well-
being at the end-of-life between individuals of two leafs. Pairwise equifinality is one when there
is no difference between average well-being (or very small differences with very large
variances). Note that large values of equifinality indicate a similarity across a pair of leafs on
average but not necessarily that everybody across the pair of leafs shares the same outcome;
persons in both pairs could still be highly variable in their outcomes (indicated by a large
multifinality).
Results
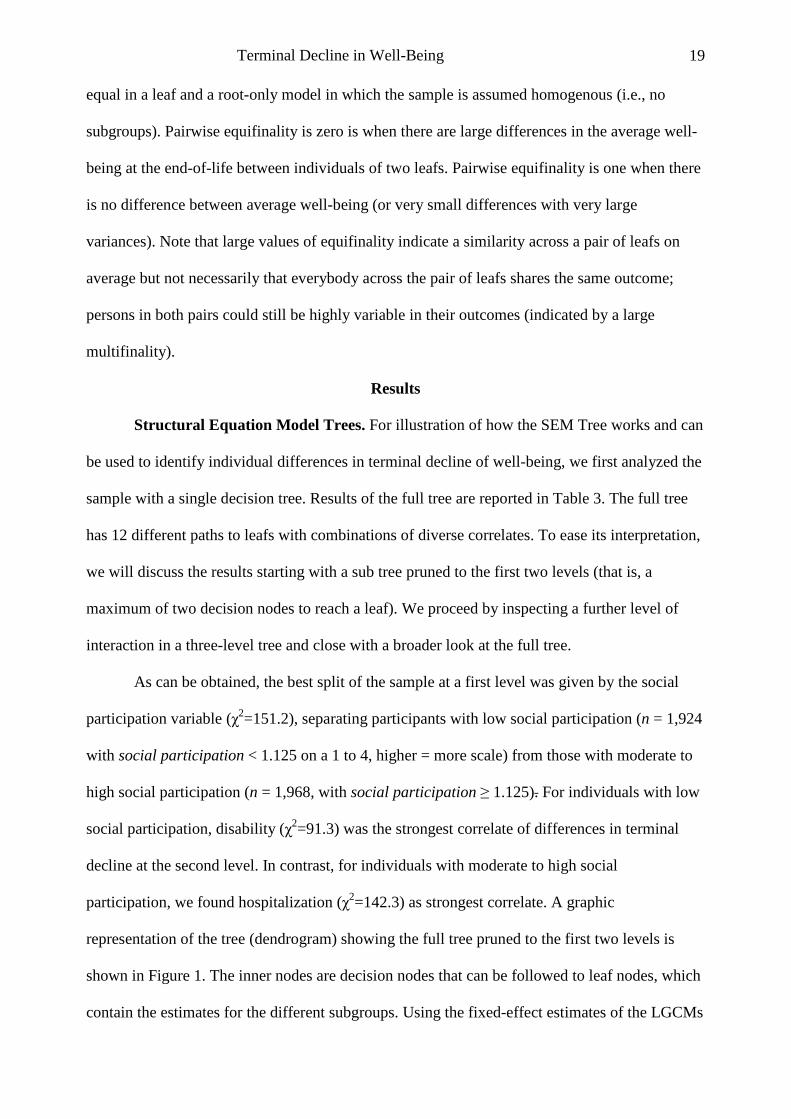
Structural Equation Model Trees. For illustration of how the SEM Tree works and can
be used to identify individual differences in terminal decline of well-being, we first analyzed the
sample with a single decision tree. Results of the full tree are reported in Table 3. The full tree
has 12 different paths to leafs with combinations of diverse correlates. To ease its interpretation,
we will discuss the results starting with a sub tree pruned to the first two levels (that is, a
maximum of two decision nodes to reach a leaf). We proceed by inspecting a further level of
interaction in a three-level tree and close with a broader look at the full tree.
As can be obtained, the best split of the sample at a first level was given by the social
participation variable (χ2=151.2), separating participants with low social participation (n = 1,924
with social participation < 1.125 on a 1 to 4, higher = more scale) from those with moderate to
high social participation (n = 1,968, with social participation ≥ 1.125). For individuals with low
social participation, disability (χ2=91.3) was the strongest correlate of differences in terminal
decline at the second level. In contrast, for individuals with moderate to high social
participation, we found hospitalization (χ2=142.3) as strongest correlate. A graphic
representation of the tree (dendrogram) showing the full tree pruned to the first two levels is
shown in Figure 1. The inner nodes are decision nodes that can be followed to leaf nodes, which
contain the estimates for the different subgroups. Using the fixed-effect estimates of the LGCMs
Terminal Decline in Well-Being 20
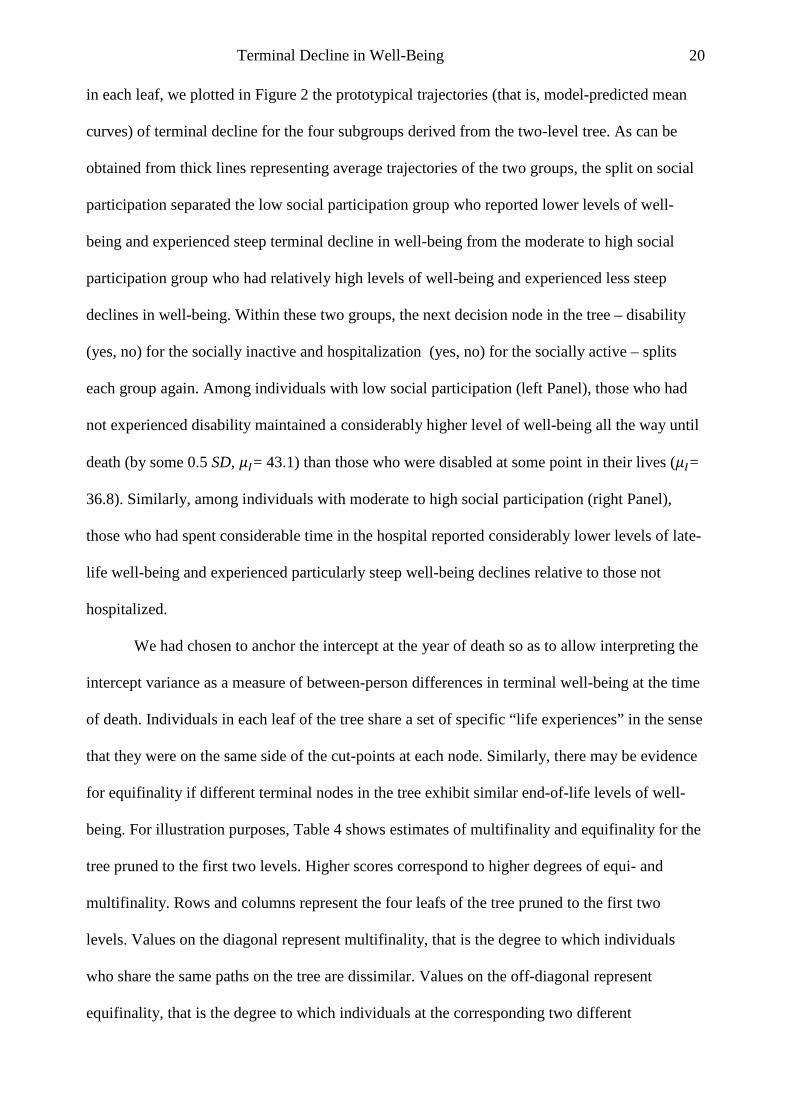
in each leaf, we plotted in Figure 2 the prototypical trajectories (that is, model-predicted mean
curves) of terminal decline for the four subgroups derived from the two-level tree. As can be
obtained from thick lines representing average trajectories of the two groups, the split on social
participation separated the low social participation group who reported lower levels of well-
being and experienced steep terminal decline in well-being from the moderate to high social
participation group who had relatively high levels of well-being and experienced less steep
declines in well-being. Within these two groups, the next decision node in the tree – disability
(yes, no) for the socially inactive and hospitalization (yes, no) for the socially active – splits
each group again. Among individuals with low social participation (left Panel), those who had
not experienced disability maintained a considerably higher level of well-being all the way until
death (by some 0.5 SD, 𝜇𝜇𝐼𝐼= 43.1) than those who were disabled at some point in their lives (𝜇𝜇𝐼𝐼=
36.8). Similarly, among individuals with moderate to high social participation (right Panel),
those who had spent considerable time in the hospital reported considerably lower levels of late-
life well-being and experienced particularly steep well-being declines relative to those not
hospitalized.
We had chosen to anchor the intercept at the year of death so as to allow interpreting the
intercept variance as a measure of between-person differences in terminal well-being at the time
of death. Individuals in each leaf of the tree share a set of specific “life experiences” in the sense
that they were on the same side of the cut-points at each node. Similarly, there may be evidence
for equifinality if different terminal nodes in the tree exhibit similar end-of-life levels of well-
being. For illustration purposes, Table 4 shows estimates of multifinality and equifinality for the
tree pruned to the first two levels. Higher scores correspond to higher degrees of equi- and
multifinality. Rows and columns represent the four leafs of the tree pruned to the first two
levels. Values on the diagonal represent multifinality, that is the degree to which individuals
who share the same paths on the tree are dissimilar. Values on the off-diagonal represent
equifinality, that is the degree to which individuals at the corresponding two different

Terminal Decline in Well-Being 21
developmental branches of the tree are similar to one another. At a purely descriptive level,
these results allow us to evaluate the variability between participants within and across leafs of a
tree. We find the largest equifinality (0.99) between individuals with low social participation
and disability and individuals with high social participation and hospitalization. This may
suggest that there is no unconditional association of social participation with well-being, but in
fact a negative compensatory role of health-related events and social participation. That is, the
positive effect of high social participation is lessened with health-related negative events.
Furthermore, we found the lowest multifinality score (0.04) in the group with low social
participation and disability and the highest score (0.15) in the high social participation and
hospitalization group. Again, at a purely descriptive level, we cautiously infer that there are
more unexplained individual differences in the group with high social participation, and we
would expect further variables to play a role in explaining the differential development, more so
than for the group with low social participation.
In the next step, we considered a third level of the SEM tree. Results are reported in
Figure 3 and suggest further splits as sub-branches of the correlate disability by perceived
control with a cut-point at around its median (2.625). A further sub-decision for those who were
not hospitalized is a person’s disability status. In conclusion, the first three levels of the tree
show interactions of physical health and burden factors with psychosocial variables.
The full, unpruned tree has a height (defined as the number of decisions on the longest
branch) of five and twelve leafs. At this level, no further significant splits of the branches were
found (at a significance level of 0.01 after Bonferroni-correction). Candidate correlates
appearing after the first three levels were sex, age at death, religion, and social goals. The full
tree is shown in tabular form in Table 5. Each row corresponds to a leaf of the tree and each
column from the set labeled “correlates” shows the observed average value people in the
respective row have. If there is no value, the respective correlate was not part of the branch from
the root to the leaf and, thus, the value of that correlate is not important to describe the

Terminal Decline in Well-Being 22
subgroup. The three columns on the right labeled “fixed effects” show the mean intercept at age
of death, 𝜇𝜇𝐼𝐼, and linear and quadratic rate of change in well-being, 𝜇𝜇𝐼𝐼 and 𝜇𝜇𝐼𝐼. A graphical
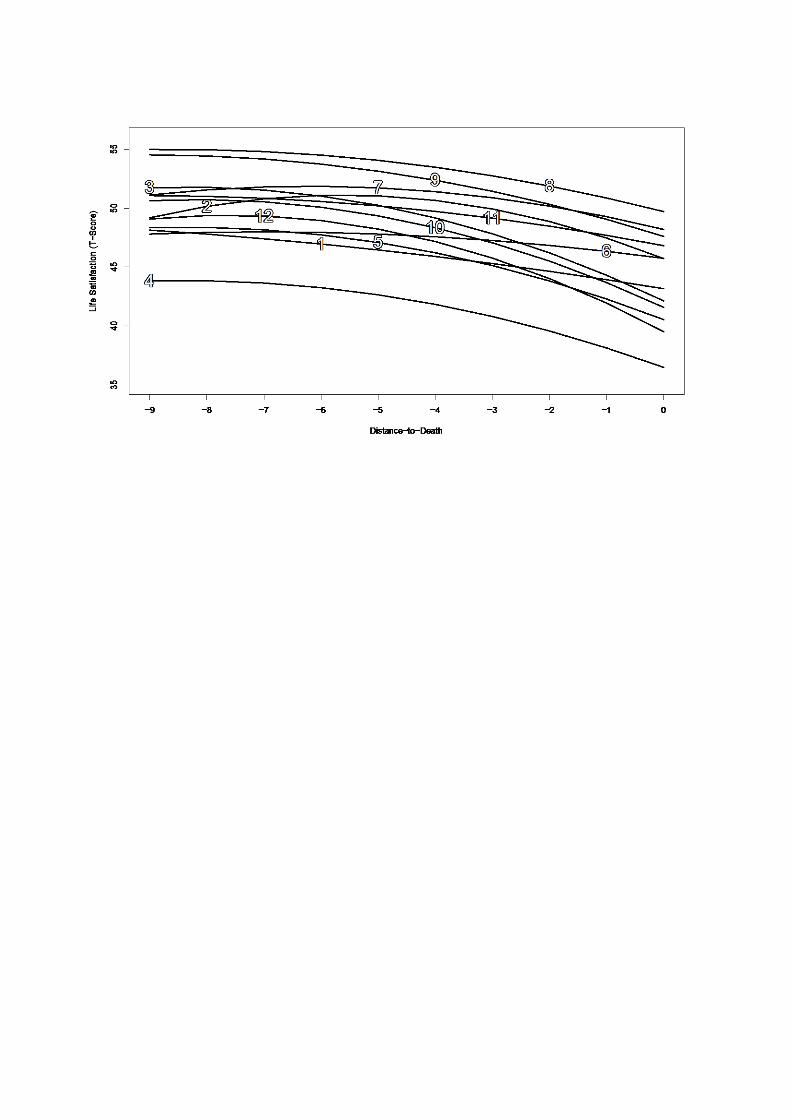
illustration of the average trajectories associated with each leaf is given in Figure 5. It can be
obtained that there are considerable differences both in level of well-being at the end of life and
in how people reach different end-points, that is, in the shape of terminal decline trajectories. In
particular, we find that trajectories not only differ in the steepness and acceleration of decline
but do also cross. This finding strengthens the notion that analyses should aim at fully
understanding the underlying developmental processes that lead to individual differences in end
points.
Structural Equation Model Forests. SEM Forest analyses allow for an accurate
comparison of the candidate variables’ importance for predicting individual differences in
terminal decline in well-being. These analyses revealed findings largely consistent with those
obtained in the single-tree analysis. Forest results represent averages over hundreds of trees and,
thus, allow a more concise quantification of the total effect of a variable for the prediction of
differential trajectories across individuals. In looser terms, forests allow for the quantification of
variable importance in the sense of a variable’s main effect and all possible interactions.
Variable importance was calculated for all candidate variables. The results are shown in Figure
4. Inference tests on variable importance typically depend on forest parameters, particularly the
number of trees, and are thus meaningless. Therefore, descriptive statistics of the correlates’
influences are advised rather than relying on overpowered inference statistics (Strobl, Malley, &
Tutz, 2009). The top five variables with the largest influence on late-life well-being and terminal
decline were – from large to small – disability, hospitalization, social participation, control
beliefs, and social goals. All five indicators appeared in the single tree described above. Reliable
estimates of importance were not obtained for death of parents, divorce, and income losses
>3000 because these variables have not appeared in any single tree. Reasons for this can be
either that these variables have a marginal association with well-being or that they have a low

Terminal Decline in Well-Being 23
incidence rate. Following Strobl et al. (2009), we use the term non-informative variables to refer
to constructs whose variable importance rating is within the range of negative estimated
importance, which reflects random variation around the true zero importance.
Discussion
Our major objective in the current study was to identify multi-way (nonlinear)
constellations of correlates that are associated with individual differences in late-life well-being
trajectories. Applying SEM Trees and SEM Forests to up to 25-year annual longitudinal data
obtained from 4,404 now-deceased participants of the nationwide SOEP study revealed that
physical health factors play a major role for terminal decline in well-being, but do so in
interaction with psychosocial characteristics, such as social participation. For example, for
people with low social participation, disability emerged as the strongest correlate of differences
in late-life well-being trajectories. In contrast, for people with high social participation, the
differentiator among high vs. low and stable vs. declining late-life well-being groups was having
spent considerable time in the hospital. We corroborated these results with Variable Importance
measures derived from resampled SEM Trees in a SEM forest that provide robust and
comparative indicators of the total interactive effects of variables for differential late-life
change. We discuss benefits and limitations of our approach and consider our findings in the
context of other reports about protective and risk factors of terminal decline in well-being.
Multi-Indicator Constellations of Physical Health and Psychosocial Correlates
Our analyses corroborate the contention that individual differences in the often steep and
accelerating end-of-life declines in well-being are associated with impairments and losses of
physical health (Roberts, Dunkle, & Haug, 1994). However, none of the burden factors emerged
among the top five factors with the largest variable importance ratings and partner-related
negative life events (death, hospitalization, or disability) were not distinguishable from the
expected random variation. It is well possible that low prevalence rates of these events (no more
than 1.1%) contributed to our finding that, for example, the variables never occurred in any tree

Terminal Decline in Well-Being 24
of a forest. Of note is also that age (at death), sex, and education that are each often identified as
relevant correlates of mortality hazards and well-being (see Gerstorf & Ram, 2013; Vaupel,
2010) were not among the top five in the variable importance rating, probably because the
relevant profiles identified here reflect some of the major ways in which these factors operate to
shape late-life well-being. We found some evidence for the relevance of religious activity
because one of the leaves of the tree reported in Table 5 was split by religious activity and it
ranked sixth in variable importance with still almost half the importance of disability. Such a
finding is consistent with the idea that religious beliefs, worldviews, and activity may act as a
buffer against stress and thereby contribute to well-being (Ellison, 1991). Our finding that social
participation and perceived control were both part of the first leaves of the tree and among the
top five variable importance (with social participation having 80% of the importance of the top
correlate, disability, and perceived control having 53% of the top correlate) ratings underscores
earlier reports of the relevance of these variables for outcomes of successful aging (Baltes &
Baltes, 1986) and late-life well-being (Gerstorf et al., 2014; Gerstorf et al., 2016; Wallace et al.,
2002).
With the current project, we corroborate and extend earlier reports (including our own) in
several major ways. Prior analyses of terminal decline have more or less exclusively focused on
average trends and single predictors of individual differences from this trend. This line of
nomothetic analyses has shown that physical health conditions and morbidity (Berg, Hassing,
Nilsson, & Johansson, 2009; Burns et al., 2014; Gerstorf et al., 2013), perceived control (Berg et
al., 2011; Gerstorf et al., 2014), and social integration (Gerstorf et al., 2016; Windsor et al.,
2015) are relevant correlates of late-life well-being. Moving several steps forward, the current
report does not target these correlates one by one, but makes use of an analytic technique that
acknowledges and models (based on statistical and not on a priori decisions) how these variables
are involved in, interact with, and operate conjointly in multi-indicator ensembles that may be
unique to subgroups of participants who share similar outcomes. In doing so, we corroborate

Terminal Decline in Well-Being 25
that physical health factors play a major role for late-life well-being decline, but do so in
interaction with psychosocial characteristics such as social participation. To illustrate, for people
with low social participation, disability emerged as the strongest correlate of differences in late-
life well-being trajectories. However, for people with high social participation, whether or not an
individual had spent considerable time in the hospital differentiated high vs. low and stable vs.
declining late-life well-being. We speculate that differences in temporal horizon and
reversibility of physical health conditions underlies at least part of the effect of why hospital
stays (an often shorter-term and reversible life condition) emerged as important for late-life
well-being among socially active people, whereas it was physical disability (an often long-term
and less reversible life condition) that emerged as particularly relevant among rather socially
inactive people. At a more general level, we infer from the interactive structure of the correlates
that no single variable alone is sufficient to describe the pronounced individual differences in
both late-life well-being and shape of terminal decline across subgroups as retrieved from the
SEM Tree, but that the variables must be interpreted as interactive constellations of risk and
protective factors. In the current study, we thus extend these earlier reports to directly
demonstrate the importance of the interplay between psychosocial factors of perceived control
and social participation and poor physical health.
Our approach may also be seen as an extension to the work of Singer, Ryff, Carr, and
Magee (1998). The authors proposed an exploratory approach to derive decision rules over
events in life histories to predict mental health outcomes. In their work, a combination of
manual and automatic variable selection was proposed to derive at individual decision rules. As
a potentially fully automated approach for generating pathways, they noted that decision trees
may be a useful alternative approach. In support of this idea, we particularly value trees and
forests as a tool that a) guides us in theory development by pointing us to interesting and
unexpected effects in our empirical data, and b) may provide a predictive baseline model
challenging purely theory-driven models for reconsideration (Brandmaier et al., in press). We

Terminal Decline in Well-Being 26
note that decision trees had previously been used to examine the variables best suited to describe
individual differences in well-being. For example, Wallace et al. (2002) had investigated
differences in later life well-being with tree analyses of cross-sectional data. Two of their
findings for compensatory associations were that (i) low perceived control did not show the
typical association with compromised well-being when people rated their physical health as
good and (ii) individuals with low perceived control combined with high social coping reported
above-average well-being. These findings align with our result, from both the single tree and the
forest analyses, that social participation, perceived control, and health-related burden factors are
main driving forces of end-of-life well-being. We are aware of only one earlier report to
examine subgroup differences in terminal decline in well-being. Specifically, Burns, Byles,
Magliano, Mitchell, and Anstey (2015) had identified five different classes of women with
distinct terminal decline trajectories in the Australian DYNOPTA study. Unfortunately,
participants in that study were examined at a maximum of four waves only and an average of six
years before death. As a consequence, very few data points were available in the year(s)
immediately prior to death when terminal declines are expected to occur. In the current study,
we expand these previous reports by using SEM trees derived from up to 25 annual waves of
longitudinal data, with about four fifths of the sample providing one or more data points in their
last two years of life. The trees aim at understanding terminal decline in well-being and provided
for consideration of the “outcome” as a longitudinal trajectory (rather than a single well-being
score). We also used a novel model-based random-forest-type (Brandmaier et al., in press)
approach to accommodate the potential instability of single-tree analyses.
SEM Trees are particularly useful to explore correlates of individual differences in
change because they allow an exploration of correlates for differences in a multivariate model
formalizing an initial theoretical understanding (here, terminal decline trajectories of well-
being). However, single trees are known to be susceptible to small perturbations of the original
data set and suffer from suppression effects when correlates covary (Brandmaier et al., in press;

Terminal Decline in Well-Being 27
Breiman, 2001). SEM Forests address these issues by generating perturbed trees and assessing
variable importance as average over all trees in a forest. Thus, it is not surprising when the order
of variable importance in forests and trees slightly diverges. We believe that the forest approach
better addresses variable importance than any single tree. Nevertheless, a single tree can
complement a forest analysis because it shows the conditionally best splits in the sample and,
thus, a particular instance of an interaction structure and how those variables may shape the
outcomes. Variable importance in model-based forests is by definition sign free, and does not
indicate the direction of the effect or what parameters in the outcome model are being
influenced (e.g., intercept or slope). Against this backdrop, findings from SEM tree and forests
analyses remarkably converge in the current set of analyses.
Limitations and Outlook
In closing, we note several limitations of our study. First, a limitation of the method
being applied here is the size of the trees. The small trees are much closer to the bivariate
models that were used as a backdrop for suggesting that trees are a useful method, and likely the
full value of using SEM trees will be obtained when scaling up to larger trees. The most
interesting splits are probably found when relatively heterogeneous groups are split and the
prime question is which constellation of correlates describes the split groups best. It is in this
sense that recursive partitioning methods are useful tools towards theory generation, and the
current report is one step towards that end. We also note that our current consideration of
trajectories allows for a better understanding of how well-being evolves late in life and is, thus,
more informative than cross-sectional analyses of well-being at some end point (e.g., the year
before death). Alternative approaches of analysis may focus solely on the slope as outcome and
specifically target correlates of isolated change. However, SEM Trees currently do not allow for
variable selection based on sub sets of model parameters. Another point to be noted about our
modeling efforts is that we deem it particularly important that the trees not be considered as a
simple flow-chart, particularly, in the sense that the ordering along a path is not representing a

Terminal Decline in Well-Being 28
temporal or even causal ordering of events, but rather a statistical ordering only. Furthermore,
we advise against a reification of the groups resulting from a single tree; specifically when
continuous variables are split, the split point represents a point of maximum separation (in an
information-theoretic sense) but may not necessarily reflect a true dichotomy. When averaging
across trees in a forest, the same variable may come up with different optimal cut points in each
tree, as each variable plays out their tree-specific conditional effect; there is no necessity that cut
points converge to a single point. Our model is longitudinal in the outcome and – depending on
the predictors – cross-sectional or longitudinal. On both sides, we use a model to derive a
higher-level description of the underlying processes. In the outcomes, we use chronometric
factors representing different linear and curvilinear change forms. On the predictor side, we use
either single snapshots (cross-sectional) or aggregate measures over time (longitudinal).
Treating all correlates as time-varying would have unfortunately gone considerably beyond the
capabilities of the data at hand. As a consequence, we cannot draw inferences about the
temporal ordering between variables and about compensatory or cumulative effects.
A second central limitation of the study is that our outcome variable is based on a single
item (nervertheless, this outcome variable is used and analyzed broadly in psychology). The
psychometric properties of single-item measures are lower than those of comprehensive multi-
item or multi-scale measures and may not be very sensitive to subtle changes in the underlying
phenomenon. As such, the measure used here may have constrained the range of variability
observed (see Gerstorf et al., 2014). Another measurement limitation is that well-being was
assessed on a 11-point Likert scale and must, strictly speaking, be analyzed by models of ordinal
outcomes. However, it is common practice to model ordinal outcomes using normal-theory
methods, especially when a Likert scale with several points is used (for instance, Wallace et al.,
2002, used CART for continuous prediction of a 13-point scale). Potential dangers of the
continuous approximation are biases in coefficients, standard errors, and statistical power. When
there are many categories and category distributions are not excessively normal, arising bias

Terminal Decline in Well-Being 29
may be acceptable (see Bauer & Sterba, 2011). We also acknowledge that our indicators of
health only tap into fractions of the larger construct space and primarily index physical
limitations and health-care utilization. In a similar vein, it would have been highly instructive to
explore the utility of additional sets of correlates. For example, our analyses only made use of
what one could consider negative life events and burden, but our models did not include the age
at which those negative life events had occurred, the frequency of negative life events, or
positive events that may have contributed to stable well-being and successful aging. Including
further sets of correlates or using a design that obtains data in closer proximity to death may
result in identifying other constellations of variables to be most relevant for terminal decline in
well-being.
Third, for our analysis of burden, we had opted for a parsimonious approach and
collapsed occurrences of negative life events into a dichotomous score of not having
experienced the event or as having experienced the event, disregarding the specific year (age)
the event happened and if the event happened more than once. Such dichotomous indicators of
negative life events correspond to the dichotomous decisions in a decision tree approach, but
neglects the exact timing and serial, potentially cumulative nature of effects. For example,
Luhmann and Eid (2009) found that experiencing a given major life event (e.g., unemployment)
a second or third time is associated with more pronounced reactions relative to the first
experience. As a consequence, future analyses should aim at including additional event-related
features (e.g., simple lifetime count of negative life events) and more closely modeling the
dynamics of the change processes in both the time-varying outcome and the time-varying
correlates. It may be promising to investigate the influence of correlates as random shocks to the
change process, as can be discerned in designs that obtain intensive longitudinal data collected
at denser intervals (e.g., weeks, days, hours).
Finally, we have proposed summary measures of differences in terminal well-being
across subgroups in a tree that draw upon ideas of developmental equi- and multifinality. These
Terminal Decline in Well-Being 30
measures are currently merely descriptive statistics to address similarity and dissimilarity of
individuals with equal or different correlates as chosen by the tree. In its current form, the
measures are limited to a comparison of terminal well-being instead of accounting for
differences in the actual developmental trajectories. Further work is needed to elaborate upon
these ideas and to devise statistical tests that allow rigorous testing of differences across
subgroups. For example, likelihood ratio tests of group differences may serve as a further means
to assess similarity between either end-points of well-being or between complete trajectories.
We note that SEM Trees and forests, as instances of the model-based recursive-partitioning
paradigm, have emerged only in the last few years, and thus are still evolving in terms of
availability, computational efficiency, and user-friendliness. However, the method has proven
useful to expand upon earlier cross-sectional results of individual differences in well-being
changes using longitudinal data and a diverse set of potential correlates. A particular advantage
of SEM Trees is their ability to provide parametric multiple-group models allowing for
immediate confirmation of the tree models in replication studies or different samples. So far,
SEM Trees do not impute missing data in the correlates but rather ignore missing cases in the
evaluation of potential splitting variables. This biases variable selection towards variables with
less missing data. Strictly, we evaluated the observed predictive importance of variables instead
of the true potential (had they been fully observed). Future work must address this issue.
Conclusion
We have successfully replicated and expanded previous reports of correlates of well-
being using novel methods combining theory-driven statistical modeling and data-driven
exploratory modeling. We have shown how SEM trees and forests can be used to support
empirical research to make comprehensive use of the data by searching a large covariate space
to allow modification of one’s initial, theory-driven hypotheses. Exploratory approaches are
probably especially useful for research on well-being for which outcomes and pathways are
often complex, highly interactive, and non-linear. We hope that similar analysis approaches with

Terminal Decline in Well-Being 31
different models and observational studies will help to shed light on the multifaceted
constellations of factors that may serve as risk for and protective factors against terminal decline
in well-being.
Terminal Decline in Well-Being: Constellations of Correlates 32
References Antonucci, T. C. (2001). Social relations: An examination of social networks, social support,
and sense of control. In J. E. Birren & K. W. Schaie (Eds.), Handbook of the
psychology of aging (pp. 427–453). San Diego, CA: Academic Press.
Baltes, P. B., & Baltes, M. M. (1986). The Psychology of Control and Aging. Hillsdale, NJ:
Lawrence Erlbaum Associates.
Baltes, P. B., & Smith, J. (2003). New frontiers in the future of aging: from successful aging
of the young old to the dilemmas of the fourth age. Gerontology, 49(2), 123-135.
doi:10.1159/000067946
Bauer, D. J., & Sterba, S. K. (2011). Fitting Multilevel Models With Ordinal Outcomes:
Performance of Alternative Specifications and Methods of Estimation. Psychological
Methods, 16(4), 373-390. doi:10.1037/A0025813
Berg, A. I., Hassing, L. B., Thorvaldsson, V., & Johansson, B. (2011). Personality and
personal control make a difference for life satisfaction in the oldest-old: findings in a
longitudinal population-based study of individuals 80 and older. European Journal of
Ageing, 8(1), 13-20. doi:10.1007/S10433-011-0181-9
Bollen, K. A. (1989). Structural Equations with Latent Variables. Oxford, UK: John Wiley.
Brandmaier, A. M. (2015). pdc: An R Package for Complexity-Based Clustering of Time
Series. Journal of Statistical Software, 67(5), 1-23. doi:10.18637/jss.v067.i05
Brandmaier, A. M., Prindle, J. J., McArdle, J. J., & Lindenberger, U. (in press). Theory-
guided Exploration with Structural Equation Model Forests. Psychological Methods.
Brandmaier, A. M., von Oertzen, T., McArdle, J. J., & Lindenberger, U. (2013). Structural
Equation Model Trees. Psychological Methods, 18(1), 71-86. doi:10.1037/A0030001
Brandmaier, A. M., von Oertzen, T., McArdle, J. J., & Lindenberger, U. (2014). Exploratory
Data Mining with Structural Equation Model Trees. In J. J. McArdle & G. Ritschard

Terminal Decline in Well-Being: Constellations of Correlates 33
(Eds.), Contemporary issues in exploratory data mining in the behavioral sciences
(pp. 96-127): New York: Routledge.
Brandstädter, J. (1999). Sources of resilience in the aging self: Toward integrating
perspectives. In T. M. Hess & F. Blanchard-Fields (Eds.), Social cognition and aging
(pp. 123-141). San Diego, CA: Academic Press.
Breiman, L. (2001). Random forests. Machine learning, 45(1), 5-32.
doi:10.1023/A:1010933404324
Breiman, L., Friedman, J., Stone, C. J., & Olshen, R. A. (1984). Classification and regression
trees. Belmont, CA: Wadsworth International
Brickman, P., & Campbell, D. T. (1971). Hedonic relativism and planning the good society.
In M. Appley (Ed.), Adaptation-level theory (pp. 287-305). New York, NY:
Academic Press.
Brockmann, H., & Klein, T. (2004). Love and death in Germany: The marital biography and
its effect on mortality. Journal of Marriage and Family, 66(3), 567-581.
doi:10.1111/J.0022-2445.2004.00038.X
Burkhauser, R. V., Giles, P., Lillard, D. R., & Schwarze, J. (2005). Until death do us part: An
analysis of the economic well-being of widows in four countries. Journals of
Gerontology Series B-Psychological Sciences and Social Sciences, 60(5), S238-S246.
doi:10.1093/geronb/60.5.S238
Burns, R. A., Byles, J., Magliano, D. J., Mitchell, P., & Anstey, K. J. (2015). The utility of
estimating population-level trajectories of terminal wellbeing decline within a growth
mixture modelling framework. Social Psychiatry and Psychiatric Epidemiology,
50(3), 479-487. doi:10.1007/s00127-014-0948-3

Terminal Decline in Well-Being: Constellations of Correlates 34
Burns, R. A., Mitchell, P., Shaw, J., & Anstey, K. J. (2014). Trajectories of terminal decline
in the well-being of older women: the DYNOPTA project. Psychology and Aging,
29(1), 44-56. doi:10.1037/a0035370
Carmel, S., Shrira, A., & Shmotkin, D. (2013). The Will to Live and Death-Related Decline
in Life Satisfaction. Psychology and Aging, 28(4), 1115-1123. doi:10.1037/a0034649
Carstensen, L. L. (2006). The influence of a sense of time on human development. Science,
312(5782), 1913-1915. doi:10.1126/science.1127488
Charles, S. T. (2010). Strength and Vulnerability Integration: A Model of Emotional Well-
Being Across Adulthood. Psychological Bulletin, 136(6), 1068-1091.
doi:10.1037/a0021232
Cohen, S., & Wills, T. A. (1985). Stress, Social Support, and the Buffering Hypothesis.
Psychological Bulletin, 98(2), 310-357. doi:10.1037//0033-2909.98.2.310
Diehr, P., Williamson, J., Burke, G. L., & Psaty, B. M. (2002). The aging and dying
processes and the health of older adults. Journal of Clinical Epidemiology, 55(3),
269-278. doi:10.1016/S0895-4356(01)00462-0
Diener, E., Suh, E. M., Lucas, R. E., & Smith, H. L. (1999). Subjective well-being: Three
decades of progress. Psychological Bulletin, 125(2), 276-302.
Dolan, P., Peasgood, T., & White, M. (2008). Do we really know what makes us happy? A
review of the economic literature on the factors associated with subjective well-being.
Journal of Economic Psychology, 29, 94-122. doi:10.1016/j.joep.2007.09.001
Duncan, T. E., Duncan, S. C., & Strycker, L. A. (2013). An introduction to latent variable
growth curve modeling: Concepts, issues, and application. New York, NY: Routledge
Academic.
Ellison, C. G. (1991). Religious Involvement and Subjective Well-Being. Journal of Health
and Social Behavior, 32(1), 80-99.

Terminal Decline in Well-Being: Constellations of Correlates 35
Ferrer, E., & McArdle, J. (2003). Alternative structural models for multivariate longitudinal
data analysis. Structural Equation Modeling, 10(4), 493-524.
doi:10.1207/S15328007SEM1004_1
Ferrer, E., & McArdle, J. J. (2010). Longitudinal modeling of developmental changes in
psychological research. Current Directions in Psychological Science, 19(3), 149-154.
doi:10.1177/0963721410370300
Fujita, F., & Diener, E. (2005). Life satisfaction set point: Stability and change. Journal of
Personality and Social Psychology, 88(1), 158-164. doi:10.1037/0022-3514.88.1.158
Gerstorf, D., Heckhausen, J., Ram, N., Infurna, F. J., Schupp, J., & Wagner, G. G. (2014).
Perceived Personal Control Buffers Terminal Decline in Well-Being. Psychology and
Aging, 29(3), 612-625. doi:10.1037/A0037227
Gerstorf, D., Hoppmann, C. A., Löckenhoff, C. E., Infurna, F. J., Schupp, J., Wagner, G. G.,
& Ram, N. (2016). Terminal decline in well-being: The role of social orientation.
Psychology and Aging, 31(2), 149-165. doi:10.1037/pag0000072
Gerstorf, D., & Ram, N. (2013). Inquiry into terminal decline: five objectives for future
study. Gerontologist, 53(5), 727-737. doi:10.1093/geront/gnt046
Gerstorf, D., Ram, N., Estabrook, R., Schupp, J., Wagner, G. G., & Lindenberger, U. (2008).
Life satisfaction shows terminal decline in old age: Longitudinal evidence from the
German Socio-Economic Panel Study (SOEP). Developmental Psychology, 44(4),
1148-1159. doi:10.1037/0012-1649.44.4.1148
Gerstorf, D., Ram, N., Lindenberger, U., & Smith, J. (2013). Age and Time-to-Death
Trajectories of Change in Indicators of Cognitive, Sensory, Physical, Health, Social,
and Self-Related Functions. Developmental Psychology, 49(10), 1805-1821.
doi:10.1037/a0031340

Terminal Decline in Well-Being: Constellations of Correlates 36
Gerstorf, D., Ram, N., Mayraz, G., Hidajat, M., Lindenberger, U., Wagner, G. G., & Schupp,
J. (2010). Late-Life Decline in Well-Being Across Adulthood in Germany, the United
Kingdom, and the United States: Something Is Seriously Wrong at the End of Life.
Psychology and Aging, 25(2), 477-485. doi:10.1037/A0017543
Gruenewald, T. L., Mroczek, D. K., Ryff, C. D., & Singer, B. H. (2008). Diverse pathways to
positive and negative affect in adulthood and later life: An integrative approach using
recursive partitioning. Developmental Psychology, 44(2), 330-343. doi:10.1037/0012-
1649.44.2.330
Gruenewald, T. L., Seeman, T. E., Ryff, C. D., Karlamangla, A. S., & Singer, B. H. (2006).
Combinations of biomarkers predictive of later life mortality. Proceedings of the
National Academy of Sciences of the United States of America, 103(38), 14158-
14163. doi:10.1073/Pnas.0606215103
Handley, T. E., Hiles, S. A., Inder, K. J., Kay-Lambkin, F. J., Kelly, B. J., Lewin, T. J., . . .
Attia, J. R. (2014). Predictors of Suicidal Ideation in Older People: A Decision Tree
Analysis. American Journal of Geriatric Psychiatry, 22(11), 1325-1335.
doi:10.1016/j.jagp.2013.05.009
Hannöver, W., & Kordy, H. (2005). Predicting outcomes of inpatient psychotherapy using
quality management data: comparing classification and regression trees with logistic
regression and linear discriminant analysis. Psychotherapy Research, 15(3), 236-247.
doi:Doi 10.1080/10503300512331334995
Headey, B. (2008). Life goals matter to happiness: A revision of set-point theory. Social
Indicators Research, 86(2), 213-231. doi:10.1007/S11205-007-9138-Y
Headey, B., Muffels, R., & Wagner, G. G. (2010). Long-running German panel survey shows
that personal and economic choices, not just genes, matter for happiness. Proceedings

Terminal Decline in Well-Being: Constellations of Correlates 37
of the National Academy of Sciences of the United States of America, 107(42), 17922-
17926. doi:10.1073/Pnas.1008612107
Herzog, A. R., & House, J. S. (1991). Productive activities and aging well. Generations, 15,
49-54.
Infurna, F. J., Gerstorf, D., Ram, N., Schupp, J., Sprangers, M. A. G., & Wagner, G. G.
(2014). Linking Concurrent Self-Reports and Retrospective Proxy Reports About the
Last Year of Life: A Prevailing Picture of Life Satisfaction Decline. Journals of
Gerontology Series B-Psychological Sciences and Social Sciences, 69(5), 695-709.
doi:10.1093/geronb/gbt055
Infurna, F. J., Gerstorf, D., Ram, N., Schupp, J., & Wagner, G. G. (2011). Long-Term
Antecedents and Outcomes of Perceived Control. Psychology and Aging, 26(3), 559-
575. doi:10.1037/A0022890
Jessen, F., Wiese, B., Cvetanovska, G., Fuchs, A., Kaduszkiewicz, H., Kolsch, H., . . . Bickel,
H. (2007). Patterns of subjective memory impairment in the elderly: association with
memory performance. Psychological Medicine, 37(12), 1753-1762.
doi:10.1017/S0033291707001122
Kitsantas, P., Kitsantas, A., & Anagnostopoulou, T. (2008). A cross-cultural investigation of
college student alcohol consumption: A classification tree analysis. Journal of
Psychology, 142(1), 5-20. doi:10.3200/Jrlp.142.1.5-20
Kitsantas, P., Moore, T. W., & Sly, D. F. (2007). Using classification trees to profile
adolescent smoking behaviors. Addictive Behaviors, 32(1), 9-23.
doi:10.1016/J.Addbeh.2006.03.014
Lachman, M. E. (2006). Perceived control over age-related declines: Adaptive beliefs and
behaviors. Current Directions in Psychological Science, 15, 282-286.
doi:10.1111/j.1467-8721.2006.00453.x

Terminal Decline in Well-Being: Constellations of Correlates 38
Lachman, M. E., & Weaver, S. L. (1998). The sense of control as a moderator of social class
differences in health and well-being. Journal of Personality and Social Psychology,
74(3), 763-773. doi:10.1037//0022-3514.74.3.763
Lawton, M. P. (1983). Environment and other determinants of well-being in older people.
Gerontologist, 23(4), 349-357. doi:10.1093/geront/23.4.349
Lemsky, C. M., Smith, G., Malec, J. F., & Ivnik, R. J. (1996). Identifying risk for functional
impairment using cognitive measures: An application of CART modeling.
Neuropsychology, 10(3), 368-375. doi:10.1037//0894-4105.10.3.368
Lucas, R. E. (2007a). Adaptation and the set-point model of subjective well-being - Does
happiness change after major life events? Current Directions in Psychological
Science, 16(2), 75-79. doi:10.1111/j.1467-8721.2007.00479.x
Lucas, R. E. (2007b). Long-term disability is associated with lasting changes in subjective
well-being: Evidence from two nationally representative longitudinal studies. Journal
of Personality and Social Psychology, 92(4), 717-730. doi:10.1037/0022-
3514.92.4.717
Luhmann, M., & Eid, M. (2009). Does It Really Feel the Same? Changes in Life Satisfaction
Following Repeated Life Events. Journal of Personality and Social Psychology,
97(2), 363-381. doi:10.1037/A0015809
Lyubomirsky, S., & Layous, K. (2013). How Do Simple Positive Activities Increase Well-
Being? Current Directions in Psychological Science, 22(1), 57-62.
doi:10.1177/0963721412469809
McArdle, J. J. (2013). Dealing with Longitudinal Attrition Using Logistic Regression and
Decision Tree Analyses. In J. J. McArdle & R. Gilbert (Eds.), Contemporary issues in
exploratory data mining in the behavioral sciences (pp. 282-311). New York, NY:
Routledge
Terminal Decline in Well-Being: Constellations of Correlates 39
Meredith, W., & Tisak, J. (1990). Latent curve analysis. Psychometrika, 55(1), 107--122.
doi:10.1007/BF02294746
Mirowsky, J., & Ross, C. E. (2007). Life course trajectories of perceived control and their
relationship to education. American Journal of Sociology, 112(5), 1339-1382.
doi:10.1086/511800
Moen, P. (1996). Gender, age, and the life course. In R. H. Binstock & L. K. George (Eds.),
Handbook of aging and the social sciences (4 ed., pp. 171-187). San Diego, CA:
Academic Press.
Mroczek, D. K., & Spiro, A. (2005). Change in life satisfaction during adulthood: Findings
from the veterans affairs normative aging study. Journal of Personality and Social
Psychology, 88(1), 189-202. doi:10.1037/0022-3514.88.1.189
Muthen, B. (2001). Latent variable mixture modeling. In G. A. Marcoulides & R. E.
Schumacker (Eds.), New developments and techniques in structural equation
modeling (pp. 1-33). Mahwah, NJ: Lawrence Erlbaum
Neale, M. C. (2000). Individual fit, heterogeneity, and missing data in multigroup structural
equation modeling. In T.D. Little, K. U. Schnabel, & J. Baumert (Eds.), Modeling
longitudinal and multiple-group data: Practical issues, applied approaches, and
specific examples (pp. 249-267). Hillsdale, NJ: Lawrence Erlbaum Associates.
Palgi, Y., Shrira, A., Ben-Ezra, M., Spalter, T., Kavé, G., & Shmotkin, D. (2014). Age-
Related and Death-Related Differences in Emotional Complexity. Psychology and
Aging, 29(2), 284-296. doi:10.1037/a0036302
Palgi, Y., Shrira, A., Ben-Ezra, M., Spalter, T., Shmotkin, D., & Kavé, G. (2010).
Delineating Terminal Change in Subjective Well-Being and Subjective Health.
Journals of Gerontology: Series B: Psychological Sciences and Social Sciences,
65(1), 61-64. doi:10.1093/Geronb/Gbp095

Terminal Decline in Well-Being: Constellations of Correlates 40
Pearlin, L. I. (1989). The Sociological-Study of Stress - Reply. Journal of Health and Social
Behavior, 30(3), 269-269. doi:Doi 10.2307/2136959
Pearlin, L. I., & Schooler, C. (1978). The structure of coping. Journal of Health and Social
Behavior, 19(1), 2-21.
Preacher, K. J. (2008). Latent growth curve modeling. Los Angeles u.a.: SAGE.
Ram, N., & Grimm, K. J. (2007). Using simple and complex growth models to articulate
developmental change: Matching theory to method. International Journal of
Behavioral Development, 31, 303-316. doi:10.1177/0165025407077751
Ram, N., & Grimm, K. J. (2009). Methods and Measures: Growth mixture modeling: A
method for identifying differences in longitudinal change among unobserved groups.
International Journal of Behavioral Development, 33, 565-576.
doi:10.1177/0165025409343765
Roberts, B. L., Dunkle, R., & Haug, M. (1994). Physical, Psychological, and Social
Resources as Moderators of the Relationship of Stress to Mental-Health of the Very
Old. Journals of Gerontology, 49(1), S35-S43. doi:10.1093/geronj/49.1.S35
Rubin, D. B. (1976). Inference and Missing Data. Biometrika, 63(3), 591-592.
doi:10.1093/biomet/63.3.581
Schilling, O. K., Wahl, H. W., & Oswald, F. (2013). Change in Life Satisfaction Under
Chronic Physical Multi-morbidity in Advanced Old Age: Potential and Limits of
Adaptation. Journal of Happiness Studies, 14(1), 19-36. doi:10.1007/s10902-011-
9313-3
Schmitz, N., Kugler, J., & Rollnik, J. (2003). On the relation between neuroticism, self-
esteem, and depression: Results from the national comorbidity survey.
Comprehensive Psychiatry, 44(3), 169-176. doi:10.1053/Comp.2003.50033

Terminal Decline in Well-Being: Constellations of Correlates 41
Scott, S. B., Jackson, B. R., & Bergeman, C. S. (2011). What Contributes to Perceived Stress
in Later Life? A Recursive Partitioning Approach. Psychology and Aging, 26(4), 830-
843. doi:10.1037/a0023180
Scott, S. B., Whitehead, B. R., Bergeman, C. S., & Pitzer, L. (2013). Combinations of
stressors in midlife: examining role and domain stressors using regression trees and
random forests. J Gerontol B Psychol Sci Soc Sci, 68(3), 464-475.
doi:10.1093/geronb/gbs166
Singer, B., Ryff, C. D., Carr, D., & Magee, W. J. (1998). Linking life histories and mental
health: A person-centered strategy. Sociological Methodology, Vol. 28 1998, 28, 1-51.
doi:Doi 10.1111/0081-1750.00041
Sonquist, J., & Morgan, J. (1964). The detection of interaction effects. A report on a
computer program for the selection of optimal combinations of explanatory variables
(35). Retrieved from Ann Arbor, MI:
Sroufe, L. A. (1997). Psychopathology as an outcome of development. Development and
Psychopathology, 9(2), 251-268. Retrieved from <Go to
ISI>://WOS:A1997XE59500004
Strobl, C., Malley, J., & Tutz, G. (2009). An Introduction to Recursive Partitioning:
Rationale, Application, and Characteristics of Classification and Regression Trees,
Bagging, and Random Forests. Psychological Methods, 14(4), 323-348.
doi:10.1037/A0016973
Vaupel, J. W. (2010). Biodemography of human ageing. Nature, 464(7288), 536-542.
doi:10.1038/nature08984
Vogel, N., Schilling, O. K., Wahl, H. W., Beekman, A. T. F., & Penninx, B. W. J. H. (2013).
Time-to-death-related change in positive and negative affect among older adults

Terminal Decline in Well-Being: Constellations of Correlates 42
approaching the end of life. Psychology and Aging, 28(1), 128-141.
doi:10.1037/a0030471
Von Bertalanffy, L. (1969). General system theory: Foundations, development,applications.
New York: G. Braziller.
Wagner, G. G., Frick, J. R., & Schupp, J. (2007). Enhancing the Power of Household Panel
Studies-The Case of the German Socio-Economic Panel Study (SOEP). Schmollers
Jahrbuch, 127, 139-169.
Wallace, K. A., Bergeman, C. S., & Maxwell, S. E. (2002). Predicting well-being outcomes
in later life: An application of classification and regression tree (CART) analysis. In
S. P. Shohov (Ed.), Advances in psychology research (Vol. 17, pp. 71-92).
Hauppauge, NY: Nova Science Publisher.
Watson, D., & Pennebaker, J. W. (1989). Health complaints, stress, and distress: exploring
the central role of negative affectivity. Psychological Review, 96(2), 234-254.
Windsor, T. D., Gerstorf, D., & Luszcz, M. A. (2015). Social resource correlates of levels
and time-to-death-related changes in late-life affect. Psychology and Aging, 30(1),
136-148. doi:10.1037/a0038757

Terminal Decline in Well-Being: Constellations of Correlates 43
Table 1
Sample descriptives for candidate correlates of terminal decline in well-being in the SOEP.
Minimum Median VR Maximum Proportion Missing
Sociodemographic variables
Age at Death 18 76 14.33* 103 0 Sex 1 1 0.48 2 0 Education 7 10.5 0.66 18 0.02 Religion 1 2 0.5 4 0.25
Physical health and burden
Disability1 0 0 0.43 1 0 Disability1 (P) 0 0 0.19 1 0 Hospitalization1 0 0 0.16 1 0 Hospitalization1 (P) 0 0 0.05 1 0 Unemployment1 0 0 0.07 1 0 Unemployment1 (P) 0 0 0.05 1 0 Death of parent1 0 0 0.01 1 0 Death (P)1 0 0 0.08 1 0 Divorce1 0 0 0.01 1 0 Income loss1 >1000 0 0 0.02 1 0 Income loss1 >3000 0 0 0 1 0
Psychosocial characteristics
Social participation 1 1.25 0.51 4 0.11 Perceived control 1 2.62 0.88 4 0.6 Success goals 2 5 0.72 8 0.43 Social goals 2 5 0.63 8 0.4 Family goals 2 7 0.69 8 0.41
Note. N = 4,404. Religious activity. (P) = partner. 1 = dichotomous variable, VR = Variation
Ratio, calculated as 1–(proportion of cases in mode), corresponds to the frequency of the less
frequent category for dichotomous variables, * = standard deviation is reported as measure of
dispersion for continuous variables, Max = Maximum.

Terminal Decline in Well-Being: Constellations of Correlates 44
Table 2
Intercorrelations among the candidate correlates of terminal decline in well-being in the SOEP.
1 2 3 4 5 6 7 8 9 10 11 12 13 14 15 16 17 18 19 20
1. Age at Death
2. Sex .22
3. Education –.13 –.25
4. Religion .13 .08 –.07
5. Disability –.03 –.11 .04 –.03
6. Disability (P) –.01 .00 –.01 .04 .18
7. Hospitalization –.04 –.03 –.01 –.03 .25 .07
8. Hospitalization (P) .03 –.01 –.01 .02 .08 .27 .08
9. Unemployment –.28 –.1 .05 –.11 .01 –.01 .04 .01
10. Unemployment (P) –.21 –.05 .01 –.08 .03 .03 .04 .05 .25
11. Death Parent –.10 –.03 .03 .00 .03 –.01 0 –.02 .11 .05
12. Death (P) .14 .08 –.04 .06 .05 .19 .05 .16 –.02 –.01 –.03
13. Divorce –.12 –.05 .03 –.04 .01 –.03 .01 –.01 .13 .05 .02 –.02
14. Income Loss >1000 –.11 –.08 .09 .00 –.02 –.01 .01 –.01 .06 .05 .06 –.03 .05
15. Income Loss >3000 –.05 –.05 .02 .00 .01 –.01 –.01 –.01 .03 .04 .04 –.02 .07 .43
16. Social Participation –.18 –.14 .36 .18 –.01 –.01 .00 .00 .05 .04 .06 –.02 .04 .11 .05
17. Perceived Control –.06 –.13 .27 –.01 –.08 –.01 –.08 .01 .06 –.01 .04 –.05 .02 .11 .04 .26
18. Success goals –.38 –.20 .21 –.04 –.04 –.03 .00 –.04 .23 .17 .07 –.06 .07 .15 .06 .23 .15
19. Social goals –.10 –.08 .22 .16 .00 .03 –.01 .01 .02 .02 .03 –.02 .01 .06 .01 .33 .15 .29
20. Family goals –.16 –.14 .09 .10 .03 .14 .00 .06 .05 .07 .02 .00 .02 .07 .03 .12 .08 .28 .31 21. Well-Being .02 –.06 .09 .12 –.20 –.03 –.22 –.04 –.05 –.05 –.02 –.04 –.04 .04 .01 .14 .19 .08 .18 .05
Note. N = 4,404. Religious activity. (P) = partner. Intercorrelations are Spearman’s rank correlation coefficient based on pairwise non-missing
values (i.e., n’s differ between table entries). Intercorrelations in bold are significantly different from zero at p = .05 (uncorrected). Well-being
taken from the assessment at one year prior to death.

Terminal Decline in Well-Being: Constellations of Correlates 45
Table 3
Descriptive statistics for subgroups of SOEP participants derived from the first two levels of the SEM Tree.
First-level split Low social participation (n = 1,924)
High social participation (n = 1,968)
Second-level split No disability (n = 1,034)
Disability (n = 890)
No hospitalization (n = 1,646)
Hospitalization (n = 340)
Model Estimates M VAR M VAR M VAR M VAR Level of well-being before death 43.1 12.6 36.8 12.9 44.9 12.3 36.7 12.1 Linear rate of change of well-being –1.4 2.4 –2.3 2.0 –1.6 1.2 –2.9 2.9 Quadratic rate of change of well-being –0.1 0.0 –0.1 0.0 –0.1 0.0 –0.2 0.0 Variables M SD M SD M SD M SD Age at death 76.5 14.1 74.7 12.0 70.5 15.3 71.5 13.4 Sex (% Women) 59.9 46.3 43.0 38.2 Years of education 10 1.5 10.1 1.4 11.5 2.4 11.3 2.3 Perceived control 2.5 0.4 2.4 0.5 2.7 0.5 2.6 0.5 Note. Level and rates of change of well-being are derived from model-based estimates and are reported as estimated mean (M) and variance
(VAR) of the corresponding latent growth factors; level is centered at year of death. The remaining variables are sample mean (M) and standard
deviations (SD). Additional model parameters are shown in the leafs of the tree in Figure 1.

Terminal Decline in Well-Being: Constellations of Correlates 46
Table 4
Estimates of Equifinality and Multifinality for the two-level tree based on SOEP data.
Node
1 2 3 4
1. Low social participation & no disability 0.91
2. Low social participation & disability 0.51 0.96
3. High social participation & no hospitalization 0.85 0.35 0.88
4. High social participation & hospitalization 0.49 0.99 0.33 0.85
Note. Node numbers correspond to leaf nodes (from left to right) in the SEM tree, which was
pruned to two levels. Values on the diagonal are indicated in bold and indicate multifinality,
quantified as the magnitude of individual differences within a leaf. Values in the off-
diagonals are pairwise measures of equifinality, quantified as the similarity (inversely
proportional to a standardized difference of the means) of well-being in a pair of leafs.
Higher values represent higher degrees of equi- and multifinality.

Terminal Decline in Well-Being: Constellations of Correlates 47
Table 5
A tabular representation of the full SEM tree for differences in trajectories of terminal decline in well-being in the SOEP.
Correlates Fixed Effects Social
participation Disability Hospitalization Control Age Sex Social goals Religion Intercept Linear Quadratic
< 1.12 No
< 2.54
42.34 –0.85 –0.03 < 1.12 No
>= 2.54
men
43.63 –2.26 –0.17
< 1.12 No
>= 2.54
women
39.67 –2.6 –0.14 < 1.12 Yes
< 2.44
34.61 –1.97 –0.1
< 1.12 Yes
>= 2.44
38.56 –2.08 –0.11 >= 1.12 No No
< 68.5
< 1.5
45.05 –0.74 –0.05
>= 1.12 No No
< 68.5
>= 1.5
46.92 –1.38 –0.1 >= 1.12 No No
>= 68.5 men
48.42 –1.37 –0.07
>= 1.12 No No
>= 68.5 women
45.99 –1.7 –0.08 >= 1.12 Yes No
< 5.5
39.2 –2.52 –0.14
>= 1.12 Yes No
>= 5.5
45.83 –1.04 –0.05 >= 1.12 Yes 36.75 –2.94 –0.17
Note. Control = perceived control. Age = age at death. Religion = Religious activity. Each row corresponds to a leaf in the tree. Correlates as
encountered when following a branch from the root of the tree to the respective leaf node are listed on the left part of the table (“Correlates”).
Estimated fixed effects for the well-being trajectories are listed on the right side (“Fixed Effects”).
Figure Caption
Figure 1. The first two levels of the SEM Tree for terminal decline in well-being comprise
social participation and health-related negative life events. Parameter estimates are maximum
likelihood estimates with their standard errors. It can be obtained that for people with low social
participation (left-hand path), disability emerged as the strongest correlate of differences in late-
life well-being trajectories. In contrast, for people with high social participation (right-hand
path), it was whether or not they had spent considerable time in the hospital that made a
difference for high vs. low and stable vs. declining late-life well-being.
Figure 2. Mean trajectories of terminal decline in well-being corresponding to the groups
implied by first-level of the tree (social participation) and the first two levels of the SEM Tree
(disability and hospitalization conditioned on social participation). The left-hand panel shows
trajectories conditional on low social participation and the right-hand panel shows trajectories
conditional on high social participation. Low and high social participation are determined by
threshold values at 1.125. It can be obtained that among individuals with low social participation
(left-hand Panel), those who had not experienced disability maintained a considerably higher
level of well-being all the way until death (by some 0.5 SD, 𝜇𝜇𝐼𝐼= 43.1) than those who were
disabled at some point in their lives (𝜇𝜇𝐼𝐼= 36.8). Among individuals with moderate to high social
participation (right-hand Panel), those who had spent considerable time in the hospital reported
considerably lower levels of late-life well-being and experienced particularly steep well-being
declines relative to those not hospitalized.
Figure 3. The first three levels of the SEM Tree for terminal decline in well-being comprise
social participation, health-related negative life events (disability and hospitalization), and
perceived control. It can be obtained that the second-level disability branch of the tree was
further differentiated at the third level by perceived control, whereas the second-level
hospitalization branch of the tree was further differentiated by disability.
Figure 4. Variable Importance for the prediction of group differences in terminal decline in
well-being. Variable Importance was derived as proportional drop in likelihood when
scrambling correlates in the SEM forest. It can be obtained that the top five variables with the
largest influence were – from large to small – disability, hospitalization, social participation,
control beliefs, and social goals.
Figure 5. Mean trajectories of terminal decline in well-being corresponding to all leafs in the
full tree. Trajectories correspond to row numbers in Table 5 that describe all predictors on the
path to each leaf and the average growth curve parameters. It can be obtained that there are

considerable differences both in well-being at the end of life and in how people reach different
end-points, that is, in the shape of terminal decline trajectories.