Embed Size (px)
Citation preview

RUHR UNIVERSITY BOCHUM Faculty of Chemistry and Biochemistry
Terahertz and Infrared
Spectroscopy of Confined Water
Dissertation
Submitted in partial fulfillment of the requirements
for the degree of Doctor of Natural Sciences
by
Trung Quan Luong
April 2012


This dissertation presents the results of my PhD study carried out from October 2008 to
April 2012 in the group of Prof. Dr. Martina Havenith, Department of Physical
Chemistry II, Faculty of Chemistry and Biochemistry, Ruhr University Bochum.
First examiner: Prof. Dr. Martina Havenith
Second examiner: Prof. Dr. Hermann Weingärtner
Examination chairman: Prof. Dr. Martin Muhler
Dean: Prof. Dr. Dominik Marx


Publications
Part of the work presented in this dissertation is based on the following publications:
• A. Patra, T. Q. Luong, R. K. Mitra, M. Havenith. Solvent dynamics in reverse
micellar water-pool: A spectroscopic investigation of DDAB/cyclohexane/water
systems. In preparation.
• N. Pérez-Hernández, T. Q. Luong, M. Febles, C. Marco, H. H. Limbach, M.
Havenith, C. Pérez, M. V. Roux, R. Pérez, J. D. Martín. The mobility of water
molecules through hydrated pores. J. Phys. Chem. C 116, 9616-9630 (2012).
• T. Q. Luong, P. K. Verma, R. K. Mitra, M. Havenith. Onset of hydrogen bonded
collective network of water in 1,4-dioxane. J. Phys. Chem. A 115, 14462-14469
(2011).
• T. Q. Luong, P. K. Verma, R. K. Mitra, M. Havenith. Do hydration dynamics
follow the structural perturbation during thermal denaturation of a protein: A
terahertz absorption study. Biophys. J. 101, 925-933 (2011).
(cover paper)
• N. Pérez-Hernández, T. Q. Luong, C. Pérez, J. D. Martín, M. Havenith. Pore
size dependent dynamics of confined water probed by FIR spectroscopy. Phys.
Chem. Chem. Phys. 12, 6928-6932 (2010).
The author also contributed to the following publications:
• T. Q. Luong, S. Hoffmann, E. Bründermann, M. Havenith. Fast detection of
biological agents by terahertz spectroscopy. In preparation.
• A. Arora, T. Q. Luong, M. Krüger, Y. J. Kim, C. H. Nam, A. Manz, M.
Havenith. Terahertz time domain spectroscopy for the detection of PCR
amplified DNA in aqueous solution. Analyst 137, 575-579 (2012).
(cover paper)


i
Contents
1 Introduction .............................................................................................................. 1
1.1 Water in biological systems ................................................................................ 1
1.2 THz and IR spectroscopy .................................................................................... 2
1.3 Models of confined water ................................................................................... 3
1.4 Kinetic THz absorption spectroscopy ................................................................. 5
1.5 Outline ................................................................................................................. 6
2 THz and IR spectrometers ...................................................................................... 7
2.1 THz time domain spectrometer ........................................................................... 7
2.1.1 Overview ..................................................................................................... 7
2.1.2 THz-TDS setup ............................................................................................ 9
2.1.3 Ti:Sa femtosecond laser ............................................................................. 10
2.1.4 Photoconductive generation of THz pulses ............................................... 12
2.1.5 Electro-optic detection of THz pulses ....................................................... 13
2.1.6 Data acquisition and analysis .................................................................... 15
2.2 FTIR spectrometer ............................................................................................ 20
2.2.1 Overview ................................................................................................... 20
2.2.2 FTIR spectrometer setup ........................................................................... 21
2.2.3 Attenuated total reflection FTIR spectroscopy .......................................... 22
2.2.4 Data acquisition and analysis .................................................................... 26
3 Water in nanopores ................................................................................................ 29
3.1 Models for biological channels ......................................................................... 29
3.2 Pore size dependent dynamics of confined water ............................................. 35
3.3 Reversibility of water dynamics in nanopores .................................................. 39
3.4 Discussion and conclusion ................................................................................ 40

ii
4 Water in reverse micelles ....................................................................................... 45
4.1 Water nanopools in DDAB/Cy/water reverse micelles .................................... 45
4.2 Dynamic light scattering measurements ........................................................... 47
4.2.1 Principle of dynamic light scattering ......................................................... 47
4.2.2 Hydrodynamic diameters of reverse micelles ........................................... 49
4.3 THz-TDS measurements ................................................................................... 50
4.4 FTIR measurements .......................................................................................... 51
4.4.1 FIR spectra ................................................................................................. 53
4.4.2 MIR spectra ............................................................................................... 54
4.5 Discussion and conclusion ................................................................................ 57
5 Water in organic solvents ...................................................................................... 61
5.1 Water confined in 1,4-dioxane .......................................................................... 61
5.2 FTIR spectra ...................................................................................................... 63
5.3 THz-TDS spectra .............................................................................................. 69
5.4 Kinetics of solvolysis reactions of benzoyl chloride ........................................ 74
5.5 Discussion and conclusion ................................................................................ 76
6 Water in hydration shells ...................................................................................... 81
6.1 Biological water ................................................................................................ 81
6.2 Structure and function of human serum albumin .............................................. 84
6.3 Thermal unfolding and refolding of human serum albumin ............................. 85
6.3.1 CD spectroscopy ........................................................................................ 86
6.3.2 Fluorescence spectroscopy ........................................................................ 91
6.3.3 THz-TDS measurements ........................................................................... 98
6.3.4 p-Ge laser measurements ........................................................................... 99
6.4 Discussion and conclusion .............................................................................. 103
7 Kinetic THz absorption upon T-jump ................................................................ 109
7.1 Focusing of THz beam .................................................................................... 110

iii
7.2 T-jump apparatus ............................................................................................ 113
7.2.1 Overview ................................................................................................. 113
7.2.2 Physical background ................................................................................ 114
7.2.3 Q-switched Nd:YAG laser ....................................................................... 115
7.2.4 Raman shifter ........................................................................................... 118
7.2.5 Experimental parameters ......................................................................... 120
7.3 Kinetic THz measurements upon T-jump ....................................................... 121
7.3.1 Heating pulse profile ............................................................................... 121
7.3.2 Static temperature dependent THz absorption of water .......................... 122
7.3.3 KITA upon T-jump of water ................................................................... 123
7.3.4 KITA upon T-jump of proteins ............................................................... 131
7.3.5 Conclusion ............................................................................................... 137
8 Summary and outlook .......................................................................................... 139
Bibliography ................................................................................................................. 145
List of figures and tables ............................................................................................. 159
List of abbreviations .................................................................................................... 163
Acknowledgements ...................................................................................................... 165


1
1 Introduction
1.1 Water in biological systems
Water (H2O) is the simplest compound of the two reactive elements, consisting of two
hydrogen atoms covalently bonded to a single oxygen atom. Water is a liquid at ambient
conditions, but it also coexists on Earth in solid and gaseous states. Liquid water is the
most extraordinary substance which exhibits a variety of anomalies, such as stable
liquid state, high heat capacity, a density maximum in the liquid state. These anomalies
result mostly from the infinite network of hydrogen bonds (H-bonds) between water
molecules [1, 2]. The oxygen atom of a water molecule is partially negatively charged
and the two hydrogen atoms are partially positively charged. In liquid water, the
hydrogen atoms are not only covalently bonded to the oxygen atom but also attracted
towards other oxygen atoms of the neighboring water molecules. This attraction forms
the H-bonds which are weaker than covalent or ionic bonds, but stronger than a van der
Waals interaction. These H-bonds break and reorganize constantly in picosecond
timescale [3]. Each water molecule can form four H-bonds in a tetrahedral geometry,
involving its two hydrogen atoms and two further hydrogen atoms from neighboring
water molecules. Furthermore, water molecules can establish dipole and induced dipole
interactions with other water molecules [4]. These heterogeneous properties of liquid
water make it flexible in different physical, chemical and biological conditions.
In living systems, water is "more than a bystander", it is called the "matrix of life",
playing essential roles [5, 6]. Many biological processes, such as protein folding and
enzymatic reactions, are inactive in the absence of water. The present of water in a
biological system is not simply to fill up the available space. Water molecules occupy
specific areas, form localized clusters, transport protons, form H-bonds with
biomolecules, mediate and participate in a wide range of biomolecular interactions [6,
7]. These versatile functions of water result particularly from its flexible three-
dimensional H-bond network and its ability to engage in directional, weak bonding with
biomolecules that facilitates structural reconfiguration and reorientation.
A living cell consists of several biomolecules with a concentration up to 400 grams per
litre [8]. Biomolecules occupy about 5 to 40% of the total volume of the cell. Therefore,

1. Introduction
2
the cell is very crowded and biomolecules are typically separated by only 1-2 nm. This
confinement is expected to change the structure and dynamics of water compared to
those of bulk water. The water H-bond network is perturbed as there are interactions
with the surface of biomolecules within a narrow space. The properties of confined
water may vary widely depending on the molecular characteristics of the surface and the
levels of confinement. Different areas in the cell exhibit different levels of confinement,
which is important for various cellular functions. The study of confined water in
different models is thus essential to understand the roles of water in biological systems.
1.2 THz and IR spectroscopy
Figure 1.1: Frequency dependent absorption coefficient of liquid water at
25°C in THz-IR region (data adapted from Ref. [9]). The highlighted
regions show the investigated frequency ranges of the main spectrometers
used in this study. THz-TDS (3-45 cm-1) is sensitive to intermolecular water
network vibrations. FIR-FTIR spectroscopy (50-650 cm-1) measures the
intermolecular network vibrations and libration motions. MIR-FTIR
spectroscopy (3000-3700 cm-1) probes the intramolecular OH stretching
modes.

1. Introduction
3
Terahertz (THz) and infrared (IR) spectroscopy is the study of the interaction between
samples and electromagnetic radiation in the frequency range approximately from 3 to
4000 cm-1. The measurement results are usually the frequency dependent spectra of the
studied samples, showing the absorption coefficient, index of refraction, or other
physical parameters. Figure 1.1 shows the frequency dependent absorption coefficient
of liquid water at 25°C in the THz and IR region. The data are taken from a previous
study [9]. Intermolecular water network vibrations dominate in the low frequency
region below 400 cm-1. The broad band around 600 cm-1 arises from librational motions
of water molecules. Two characteristic intramolecular modes appear in the region 1500-
1700 cm-1 (bending) and 3000-3700 cm-1 (OH stretch).
The main experimental methods used in this study to investigate confined water are
terahertz time domain spectroscopy (THz-TDS) and Fourier transform infrared (FTIR)
spectroscopy. THz-TDS (frequency range 3-45 cm-1) is sensitive to intermolecular
water network vibrations. FTIR measurements were carried out in far-infrared (FIR)
(50-650 cm-1) and mid-infrared (MIR) (3000-3700 cm-1) regions. FIR-FTIR
spectroscopy measures the intermolecular network vibrations and librational motions
while MIR-FTIR spectroscopy probes the intramolecular OH stretching modes of water.
The frequency ranges of the THz-TDS and FTIR spectrometers are shown in Figure 1.1.
These spectrometers cover almost all the important spectral regions of water in the THz
and IR frequency range.
1.3 Models of confined water
In order to study confined water at different levels, this study investigated four different
models: nanopores, reverse micelles, organic solvents, and hydration shells. The first
model (nanopores) is solid crystals while the others are liquid solutions. Figure 1.2
shows a schematic of water confinement in four studied systems. In general, the level of
water confinement is strongest in nanopores, followed by reverse micelles, organic
solvents, and then hydration shells.
In the first model, water molecules are confined in organic nanopores. The nanopores
are tubular crystals formed by water mediated assembly of hydroxyl acids. These
supramolecular structures have hydrated pores with pore diameter of a few Å. Water

1. Introduction
4
molecules can be permanently confined inside the pores at ambient condition. Different
pore sizes give rise to different confinement and dynamics of water.
In the second model, water nanopools inside reverse micelles (RM) are formed in
DDAB/Cy/water (didodecyldimethylammonium bromide/cyclohexane/water) mixture.
In the nonpolar organic solvent (Cy), the cationic surfactant molecules (DDAB)
aggregate into nanoscale RM structures where the hydrophilic heads form the core of
the RM and hydrophobic tails are in contact with the surrounding solvent. Water
molecules in the mixture are trapped inside the RM.
Figure 1.2: Schematic of water confinement in four studied systems:
nanopores, reverse micelles, organic solvents, and hydration shells. In
general, the level of confinement decreases from left to right. These systems
serve as models for water confinement in biological systems.
The third model is mixtures of water and 1,4-dioxane (Dx). In spite of being a nonionic
and relatively nonpolar solvent, Dx solubilizes water from highly diluted to highly
concentrated mixtures. Dx can expose non-interacting hydrophobic sites to water
molecules as well as form H-bonds with water. In water-Dx mixtures with highly
diluted concentration of water, the water-water H-bond network is disrupted, which
resembles the conditions of isolated or confined water molecules with fewer interactions
to other water molecules.

1. Introduction
5
The last model is water in hydration shells around human serum albumin (HSA) in
aqueous solution. Water dynamics in the hydration shells is determined by the structural
organization and perturbation of the protein, and vice versa, the structure and function
of the protein is governed by the water dynamics. Water dynamics in the hydration
shells is generally slowed down by the protein to match the much slower protein
dynamics. In some aspects, water molecules in the hydration shell are more confined
than bulk water and their properties are sensitive to the details of the interactions with
the protein surface.
1.4 Kinetic THz absorption spectroscopy
The kinetics of biomolecules is critical for biological functions. To study a rapid kinetic
process experimentally, a technique to rapidly change the equilibrium of the sample is
required. After being disturbed, the sample relaxes to its original equilibrium.
Temperature jump (T-jump) is the most widely used technique to initiate a kinetic
process because of its sufficient jump size, high speed, and minor disturbance to the
sample environment [10]. A fast increase in temperature can disturb an existing
equilibrium of a protein. T-jump can initiate both the unfolding to heat denatured states,
and the refolding from cold denatured states. Kinetic THz absorption spectroscopy
(KITA) is a high sensitive detection method to observe changes of water dynamics in
the hydration shells around a protein [11]. Upon T-jump, the kinetics structural change
of the protein induces corresponding change in its coupled water dynamics in the
hydration shells, which can be monitored by KITA.
In this study, a new nanosecond time resolution T-jump apparatus was setup. It
generates high power short laser pulses to initiate rapid temperature increase in aqueous
solution. The propagation of the THz beam of the existing THz spectrometer was
improved to optimize the focal size of the beam at the sample position, ensuring that the
probed area of the THz beam is within the heated area of the solution. A data
acquisition process was established to reproducibly record THz signal upon T-jump.
These preparation steps enable a feasible and successful combination between T-jump
and KITA for kinetic studies. Measurement results of the T-jump induced rapid
unfolding to heat denatured states of λ-repressor and human serum albumin, and the
rapid refolding from cold denatured states of ubiquitin reveal an observable difference
between buffer and protein solutions. This is the first study using the combination
1. Introduction
6
between T-jump and KITA to probe the coupled protein-water dynamics in the
microsecond and millisecond timescales.
1.5 Outline
This dissertation presents the study of confined water in different models and KITA
study upon T-jump. Chapter 2 describes in detail the two mainly used experimental
methods, namely THz-TDS and FTIR spectroscopy. Some further complementary
experimental techniques were also used in this study, including dynamic light
scattering, kinetics of solvolysis reactions, circular dichroism spectroscopy, time
resolved fluorescence spectroscopy, and p-germanium laser THz spectroscopy. The
principles of these techniques are given in the sections where their results are discussed.
The investigation of confined water in nanopores, reverse micelles, organic solvents,
and hydration shells are presented in Chapter 3, Chapter 4, Chapter 5, and Chapter 6,
respectively. In Chapter 7, the detailed description of the T-jump apparatus and
experimental results of T-jump induced kinetics probed by KITA are given and
discussed. Finally, Chapter 8 summarizes the studied results and gives an outlook on
possible improvements. The results of this study aim to contribute to a better
comprehension of water dynamics in confined environments which are similar to the
conditions in natural biological systems.
7
2 THz and IR spectrometers
2.1 THz time domain spectrometer
2.1.1 Overview
Terahertz (THz) radiation is electromagnetic radiation in the frequency range
approximately between 0.1 THz and 10 THz. This corresponds to wavelengths between
3 mm (0.1 THz) and 30 µm (10 THz). When converted to other units, 1 THz (1012 Hz)
is equivalent to wavenumber of 33.3 cm-1, photon energy of 0.004 eV, or wavelength of
300 µm. This THz frequency range is located between the microwave part and the
infrared part of the electromagnetic spectrum. THz is still a new research area because
of the difficulty to produce adequate THz sources and efficient detectors [12]. The low
photon energy of THz radiation makes it useful for studying low frequency phenomena
such as vibrational modes of macromolecules like proteins or DNA [13], collective
network motions of water [14], soft lattice vibrations in dielectrics [15], nondestructive
inspection of materials [16]. Furthermore, THz radiation penetrates many materials
which are impervious for visible light, such as paper, wood, textiles and plastics. This
provides opportunities for THz imaging techniques as well as several medical and
security applications [17, 18]. Terahertz spectroscopy explores frequency dependent
optical properties of a material in the THz range. There are different types of THz
spectroscopy, such as Fourier transform spectroscopy, THz narrowband spectroscopy,
p-germanium (p-Ge) laser THz spectroscopy, and THz time domain spectroscopy (THz-
TDS) [19, 20].
THz-TDS is a technique in which the time dependent electric field of a THz pulse is
measured after it interacts with a sample. This is the most recent technique, developed
in the 1980s [21, 22]. After that, several improvements and applications of THz-TDS
were reported, such as sub-ps photoconducting dipole antennas [23], THz imaging
system [24], zinc telluride (ZnTe) crystal for broadband detection [25], de-noising
techniques for THz imaging [26], and planar large-area photoconducting emitter for
impulsive generation of terahertz radiation [27]. THz-TDS technique offers a number of
advantages compared to the others. The transmitted THz electric field is detected
coherently, which provides time resolved information of both power and phase of the

2. THz and IR spectrometers
8
transmitted pulse. Subsequently, both the frequency dependent real and imaginary parts
of optical constants such as the index of refraction and the absorption coefficient can be
measured simultaneously [28]. Furthermore, information about the carrier mobility and
number density in semiconductors can be deduced [29]. THz-TDS is also implemented
in imaging systems to produce accurate spatial information of a sample [19].
The most common techniques to generate THz pulses used in THz-TDS are
photoconductive emission and optical rectification [30]. In the photoconductive
emission, femtosecond laser pulses are used to generate carriers in the conduction band
of a semiconductor under an applied bias voltage. The newly formed carriers are
accelerated by the bias. In an antenna, a time-varying electric current acts as a source
term in the Maxwell’s equations and radiates an electromagnetic pulse. The optical
rectification technique is based on properties of nonlinear crystals. Optical rectification
is a difference frequency mixing that occurs in nonlinear media with large second order
susceptibility. The interaction between femtosecond optical pulses with a nonlinear
medium and wave mixing of two frequencies result in the generation of sum-frequency
and difference-frequency, corresponding to second harmonic and dc pulses. A generated
dc pulse is the envelope of the optical pulse. As incident femtosecond optical pulses
have large bandwidth, the high-frequency components can mix with the low-frequency
components to produce pulses with much longer wavelengths at the different
frequencies from 0 to several THz. The output power of above THz sources is in the
nanowatt to microwatt range [19]. With this low THz power, thermal background
radiation from the environment is a non-negligible noise source. Therefore, coherent
detection is required for THz-TDS systems.
Similar to THz pulse generation, the most common detection methods are
photoconductive sampling and free-space electro-optic sampling. Photoconductive
sampling is similar to photoconductive emission. However, the bias across the antenna
is produced by the electric field of the incident THz pulse instead of being applied
externally as in the photoconductive emission. This bias generates a current in the
antenna which is proportional to the strength of the THz electric field. In electro-optical
sampling, the THz pulse induces birefringence in a nonlinear crystal due to the Pockels
effect. This leads to an induced change in polarization of the optical probe beam which
is the same laser beam as the one used for generation of the THz pulse. The change is
proportional to the electric field of the THz pulse. With changing optical delay, the
waveform of the THz pulse can be determined [25].

2. THz and IR spectrometers
9
In practice, there are two widely used experimental setups for THz-TDS: transmission
setup and reflection setup [31]. In the transmission setup, the THz beam generated by
the emitter is focused on the sample position and propagates through the sample. After
that, the beam is focused on the detector system. This transmission setup is used to
measure optically thin samples which allow the THz beam to pass through without
losing almost all its energy. For opaque samples, the reflection setup is required. Instead
of propagating through the sample, the THz pulse is reflected from the sample. Then the
beam is led to the detector system by a beamsplitter.
2.1.2 THz-TDS setup
Figure 2.1: Schematic of the THz-TDS (BS: 25:75 beamsplitter, L: lens,
PM: parabolic mirror, ZnTe: zinc telluride crystal, λ/4: quarter wave plate,
WP: Wollaston prism). The fs laser pulses emitted from the Ti:Sa laser are
split by a beamsplitter. One part is focused on the THz emitter for
generation of THz pulses. The other is focused on the ZnTe crystal together
with the THz pulses for coherent electro-optic detection.
Figure 2.1 shows a schematic of the THz-TDS. The Verdi laser (model Verdi V-10,
Coherent) generates continuous-wave laser radiation at 532 nm and 5 W output power.

2. THz and IR spectrometers
10
It is used to pump the Ti:Sa (titanium doped sapphire or Ti:Al2O3) laser (model MTS
Mini Ti:Sa Laser, KMLabs) for generation of femtosecond (fs) laser pulses. The THz-
TDS works in a pump-probe configuration. A beamsplitter is used to split the fs laser
beam into two parts (pump pulse and probe pulse). The pump pulse propagates via a
mechanical delay line for changing the time delay between pump and probe pulse. After
that it is focused on the THz emitter (model Tera-SED, Gigaoptics) for generation of
THz pulses. With the transmission geometry setup, the generated THz beam is focused
by two parabolic mirrors on the sample position and then focused by two other
parabolic mirrors on a nonlinear (110)-ZnTe crystal. The probe pulse is also focused on
the ZnTe crystal for coherent electro-optic detection. In the following sections, the main
components of the THz-TDS will be described in details.
2.1.3 Ti:Sa femtosecond laser
The first prerequisite to generate ultrashort pulses is that a broad spectral bandwidth or a
large number of longitudinal modes are required. When the duration and the spectral
width of the laser pulse are calculated using the standard statistical definitions, they are
related to each other by a universal inequality (Heisenberg’s uncertainty relation) [32]:
∆� · ∆� � 12 (2.1)
where ∆� is the half maximum duration of the pulse and ∆� � 2 · ∆ with ∆ is the
frequency full width at half maximum (FWHM). This relation leads to the quantum
mechanical time-energy uncertainty principle: to generate an ultrashort laser pulse
(small ∆�), a broad spectral bandwidth (large ∆�) is required.
The second prerequisite is that the different modes must be held in phase in order to
achieve constructive interference. When the laser operates in free multimodes, the
competition among the different modes causes large fluctuations in the relative phases
and amplitudes of the modes. In order to generate ultrashort pulses, the competition
between modes must be organized in such a way that their relative phases stay constant,
so that the output intensity of the laser consists of a periodic series of pulses resulting
from the travelling back and forth of a wave packet within the laser cavity. Kerr lens
mode-locking using a nonlinear medium is one of the most widely used methods to

2. THz and IR spectrometers
11
meet this requirement. The Kerr effect is a third order self-induced nonlinear index
change in a material. It describes the dependence of the index of refraction � on the
light intensity � [32]:
� � � � �� · � (2.2)
where � is the index of refraction of the material, �� is the nonlinear index coefficient
(or Kerr coefficient) of the material. The nonlinear properties of the amplifying material
naturally enhance the intensity maxima arising within the cavity by inducing a
narrowing of the pulse at each of its round trips through the cavity. This condition is
called self-locking of the modes. The amplifying medium behaves like a converging
lens and focuses the beam like a lens.
The most important advances in generation of ultrashort pulses have been based on the
development of Ti:Sa crystal as an amplifying medium. Firstly demonstrated in 1986,
Ti:Sa crystal has been widely used for generation of ultrashort laser pulses because it
meets both of the above mentioned prerequisites [33]. The crystal is created by doping
sapphire (Al2O3) with Titanium. About a few weight percent of Al3+ ions are substituted
by Ti3+ ions in the crystal structure. Because the ionic radius of Ti3+ ions is about 26%
larger than that of Al3+ ions, a strong distortion of the local environment of the Ti3+ ions
is induced and this distortion creates a strong local electric field. This results in the
unusually wide absorption band of Ti:Sa crystal in the visible spectrum (from 400 to
600 nm). The emission band is also wide and shifted towards lower energies (from 600
to 1000 nm). Using a Ti:Sa crystal, it is easy to get a broad spectral bandwidth when the
Ti:Sa crystal is pumped by a laser beam with a wavelength within its absorption band.
Furthermore, the Ti:Sa crystal has nonlinear properties and can act as the Kerr medium
in a mode-locking process. In the current setup, a continuous-wave laser beam at 532
nm and 5 W output power is used to pump the Ti:Sa crystal. At mode-locked condition,
the Ti:Sa laser emits 20 fs pulses at 94 MHz repetition rate and 500 mW average optical
output power.

2. THz and IR spectrometers
12
2.1.4 Photoconductive generation of THz pulses
Figure 2.2: Schematic of the large area THz emitter. It has a metal-
semiconductor-metal structure in gallium arsenide (GaAs) substrate, which
makes charge carriers to be accelerated in the same direction over the whole
excited area to generate THz radiation.
A photoconductive antenna generates THz pulses by transient photocarriers induced by
ultrafast laser pulses. Its main structure consists of two metal electrodes coated on a
semiconductor substrate with a gap between them. With applied bias voltage, the
electric energy is stored in the gap area. When fs laser pulses with photon energy higher
than the band gap of the semiconductor are focused on the gap, electron-hole pairs are
created. These charge carriers are accelerated by the bias field. In this case, the fs laser
pulses act like transient switches to open the stored electric energy and release it in the
form of the emission of a time dependent THz field ������� that is proportional to the
derivation of the current density ���� [34]:
������� � 14� · ���� · ��������� (2.3)
���� � ������� (2.4)

2. THz and IR spectrometers
13
where � is the vacuum permittivity, � is the area in the gap illuminated by the laser
beam, � is the speed of light in vacuum, � is the distance between the field point and the
THz source, � is density of photocarriers, � is the elementary charge, � is the mobility
of electrons, and � is the bias electric field. In principle, the energy of the THz pulse
depends on the electric energy stored across the gap by the applied bias voltage rather
than the energy of the fs pulses of the excitation laser. However, the stored electric
energy can only be released when the fs laser pulses trigger the generation of the
photocarriers. The conversion of the stored energy into THz radiation is proportional to
the number of generated photocarriers. Therefore, the energy of the fs pulses also
influences the energy of the THz pulse.
In the current setup, a large area emitter (model Tera-SED, Gigaoptics) is used to
generate THz radiation. A schematic of the THz emitter is shown in Figure 2.2. It is a
planar gallium arsenide (GaAs) photoconductor and consists of an interdigitated
electrode metal-semiconductor-metal (MSM) structure. When voltage is applied across
the electrodes, the electric field is reversed between successive fingers. The opaque
metal layer covers every second finger electrode spacing in such a way that optical
excitation is only possible in area exhibiting the same electric field direction. Therefore,
charge carriers are accelerated in the same direction over the whole excited area and the
emitted THz radiation interferes constructively in the far field [27]. The voltage applied
to the emitter is from an external source with the amplitude of 20 V and modulated
frequency of 40 kHz in square wave form. When the stored electric energy in the
emitter is switched by the fs laser pulse, THz pulses of picosecond duration are
generated at a repetition rate of 94 MHz in a beam angle of 7°. The emitted THz beam
has an average optical power of 10 to 20 µW. The modulated frequency applied to the
emitter serves as the reference frequency in a lock-in amplifier which is set, for
example, at an input gain of 20 dB, a sensitivity of 20 mV, and an integration time of
200 ms. As the power of the THz beam is rather low, the lock-in amplifier is required to
separate the THz signals from thermal noise.
2.1.5 Electro-optic detection of THz pulses
Electro-optic detection or electro-optic sampling (EOS) is a highly sensitive coherent
detection method which makes use of the linear electro-optic effect (Pockels effect).
The Pockels effect occurs only in non-centrosymmetric crystals, in which the

2. THz and IR spectrometers
14
birefringence (change of the refractive index) of the crystals is proportional to the
strength of an applied electric field. When a sensor crystal is influenced by a low
frequency polarized electric field (THz pulse), it becomes birefringent and induces a
change in the polarization of the fs probe pulse. The change in polarization is
proportional to the electric field of the THz pulse [35]. By varying the relative time
delay between the THz pulse and the probe pulse, the electric field of the whole THz
pulse can be measured.
Figure 2.3: Schematic of the electro-optic sampling. THz beam and fs laser
beam overlap at the birefringent (110)-ZnTe crystal. The linear polarized fs
laser is converted to circular polarized light by the λ/4 wave plate. The
Wollaston prism splits the polarizations into ordinary and extraordinary
parts (parallel and perpendicular to the optical axis). The difference in
intensity of these two parts is proportional to the intensity of the THz
electric field.
Figure 2.3 shows a schematic of the EOS system in the current setup. The (110)-ZnTe
crystal serves as the sensor crystal. The fs probe pulses are focused on the crystal before
being directed to propagate through the quarter wave plate and the Wollaston prism.
The quarter wave plate creates a quarter wavelength phase shift and changes the linearly
polarized probe beam to the circularly polarized beam. The Wollaston prism, which is a
polarizing beamsplitter, splits the polarized beam into two equal polarization
components with perpendicular directions: s-polarized (ordinary beam) and p-polarized
(extraordinary beam). These two beams are focused independently on the auto-balanced
detector (125 kHz Nirvana auto-balanced photoreceiver, Newport). When the THz pulse

2. THz and IR spectrometers
15
is also focused on the ZnTe crystal, its electric field makes the crystal birefringent,
which in turn changes the circular polarized beam after the quarter wave plate into
elliptical polarized beam. This means that change in the intensity of s-polarized beam
(�!) and p-polarized beam (�") relative to each other (Δ� � �! $ �") occurs. This change
is proportional to the strength of the THz electric field. The auto-balanced detector
records directly the change of Δ�, thus indirectly measures the THz electric field.
2.1.6 Data acquisition and analysis
2.1.6.1 Data acquisition
Figure 2.4: Schematic of the data acquisition in THz-TDS. The relative
delay between the THz pulse and the fs pulse is varied to record the whole
profile of the THz pulse (left). The recorded data as a function of the
distance delay are converted to the time delay (right).
The temporal intensity of the THz field is recorded by stepwise changing the relative
delay between the THz pulse and the fs laser pulse. The time resolution ∆� of the
measured THz signal is deduced from the minimum step size ∆% by the equation:
∆� � ∆%� (2.5)

2. THz and IR spectrometers
16
where � is the speed of light. In the current setup, the usually set step size of the
mechanical delay line is 20 µm, which corresponds to a time resolution of 66.67 fs.
Figure 2.4 shows a schematic of the data acquisition. Upon varying the relative delay,
each point of the THz pulse is probed. When a full scan of the delay line is done, the
THz intensities as a function of the distance delay are recorded. The step size of the
delay line is then converted to time delay. As a result, the THz pulse in time domain can
be constructed. In order to obtain the data in the frequency domain, a fast Fourier
transform (FFT) algorithm is applied to the data in the time domain.
2.1.6.2 Fast Fourier transform
A physical process can be described either in the time domain (the amplitude � of the
process as a function of time �) or in the frequency domain (the amplitude � of the
process as a function of frequency ). These two functions ���� and ��� are
considered as two different representations of the same function which can be converted
from one to the other by means of the Fourier transform equations [36]:
���� � & ����'�()*+%,-
'-
(2.6)
��� � & ������()*+%�,-
'-
(2.7)
The data acquired from THz-TDS consists of discrete values. The function ���� is
sampled at evenly spaced intervals in time. Therefore, a FFT algorithm must be used to
transform the discrete time domain values into discrete frequency domain values.
Suppose that the Fourier transform of ���� has � consecutive sampled values (� is
even) and the sampling interval is ∆�. The sequence of sampled values is:
���.� / ��0 · 1�� (2.8)
with 0 � 0, 1, 2, . . . , � $ 1

2. THz and IR spectrometers
17
The reciprocal of the time interval ∆� is called the sampling rate (the number of samples
recorded per second). When FFT is applied, the integral in equation (2.7) can be
approximately replaced by a discrete sum:
��:� ; < ���.���()*=+> · 1� � 1� · < ���.���().:/@ @'A
.B @'A
.B
(2.9)
with : / �� · 1� ; � � $ �2 , … , �2 ; �. � 0 · 1�
It is noticed that there are � � 1 values of � but the two extreme values of � are not
independent (they are equal), this reduces the count to �. Therefore, the FFT maps �
complex numbers ���.� into � complex numbers ��:�.
Figure 2.5: THz pulses of a reference and a sample in the time domain (A)
and their Fourier transform spectra in the frequency domain (B).
Figure 2.5A shows the intensity of the THz pulses of an empty cell (reference) and a
filled cell (sample) as a function of time. The sample pulse has a lower intensity because
of absorption (attenuation of the signal), and it is shifted to the right because of
refraction of the sample (delay of the THz pulse). The corresponding FFT spectra of the
THz pulses as a function of frequency are shown in Figure 2.5B. The spectrum of the
sample has lower intensity than the spectrum of the reference.

2. THz and IR spectrometers
18
2.1.6.3 Data analysis
The obtained frequency domain values of ��:� in Equation (2.9) can be expressed in
amplitude �: (absolute value) and phase �E:�:
��:� � F1� · < ���.���().:/@ @'A
.B F · �)G= � �: · �)G=
(2.10)
In THz-TDS, reference measurement (without the sample) and sample measurement
(with the sample) are needed for the analysis. The FFT yields for each frequency
component the intensity ��� and phase E�� of the transmitted THz beam. The
intensity is proportional to the absolute square of the electric field:
��� ; |���|� (2.11)
The absorption process of a laser beam passing through a sample is described by the
Lambert‐Beer’s law:
�!�� � � ���'J�*�K (2.12)
where � is the intensity of the reference measurement, �! is the intensity of the sample
measurement, % is the path length (the thickness of the sample) and L is the absorption
coefficient. The conversion of Equation (2.12) gives the value of L:
L�� � ln� �� $ ln�!��% (2.13)
The index of refraction ��� can similarly be determined from the phase E of the
reference measurement and E! of the sample measurement by [28]:
��� � �OE!�� $ E ��P2% � 1 (2.14)

2. THz and IR spectrometers
19
where � is the speed of light in vacuum. Further physical constants of the sample can be
deduced using the frequency dependent complex index of refraction which is given by:
�Q�� � ��� $ R0�� or �Q��� � ���� $ R0��� (2.15)
with � � 2 is the angular frequency, � is the real part of the complex index of
refraction, and 0 is the imaginary part of the complex index of refraction. The
imaginary part 0 indicates the amount of absorption loss when the beam propagates
through the sample. It is also called the extinction coefficient which is proportional to
the absorption coefficient:
0��� � UL���4 � �L���2� (2.16)
where U is the wavelength. The complex dielectric constant �̂��� is related to the
complex index of refraction by following relations:
�̂��� � �W��� $ R�WW��� (2.17)
�W��� � ����� $ 0���� (2.18)
�WW��� � 2����0��� (2.19)
where �W is the real part of the complex dielectric constant, and �WW is the imaginary part
of the complex dielectric constant. Apart from the optical properties of the sample
characterized by absorption coefficient and index of refraction, the complex dielectric
constant gives further insight into the liquid dynamics.
2. THz and IR spectrometers
20
2.2 FTIR spectrometer
2.2.1 Overview
Infrared (IR) spectroscopy has a long history for more than a century with broad
application areas. The IR frequency range lays between the microwave and visible
frequency range, covering the wavelength from 780 nm to 1 mm. It is divided into three
ranges: near-infrared (NIR) with the wavelength of 0.78-3 µm, mid-infrared (MIR) with
the wavelength of 3-50 µm, and far-infrared (FIR) with the wavelength of 50-1000 µm
[37]. The IR absorption peaks correspond to the frequencies of intermolecular or
intramolecular rotations and vibrations. As each sample has a unique combination of
atoms, it has a distinctive IR spectrum which represents a fingerprint of the sample.
Therefore, IR spectroscopy has been widely used for qualitative and quantitative
analysis of substances.
In the early days, dispersive IR spectrometers were developed, using prisms or
diffraction gratings as dispersive elements. The dispersive element was used to separate
an infrared light into a continuous range of frequencies. It is a part of a monochromator
which has a narrow slit to select a narrow range of frequencies. By rotating the
dispersive element, each frequency successively passes the slit before reaching a
detector. Therefore, the sample was scanned with the whole infrared frequency range.
Later, the more advanced technique Fourier transform infrared (FTIR) spectroscopy was
introduced. In an FTIR spectrometer, IR light is guided through an interferometer and
all of the IR frequencies are measured simultaneously, instead of recording every single
frequency like dispersive IR spectroscopy. This makes the measurement time of a
spectrum much faster. Multiple scans of a sample can be collected and averaged to
improve the sensitivity. The result of a measurement is an interferogram. A Fourier
transform is applied to the data to obtain a frequency dependent spectrum which is
identical to that from dispersive IR spectroscopy.
The most common interferometer used in FTIR spectroscopy is a Michelson
interferometer. In a simple setup, the interferometer consists of a beamsplitter and two
perpendicularly plane mirrors. One of the mirrors is fixed and the other can move in a
direction perpendicular to the plane. The beamsplitter bisects the planes of the two
mirrors. The moving mirror produces an optical path difference between the two arms
of the interferometer for constructive or destructive interference of the two beams. IR
2. THz and IR spectrometers
21
sources and detectors for FTIR spectrometers are different depending on the frequency
range. Globar or Nernst sources are commonly used for the MIR region, tungsten-
halogen lamps for the NIR region, and high-pressure mercury lamps for the FIR region.
Detectors for the NIR and MIR region are usually DTGS (deuterium tryglycine sulfate)
and MCT (mercury cadmium telluride) while bolometers are used in the FIR region.
2.2.2 FTIR spectrometer setup
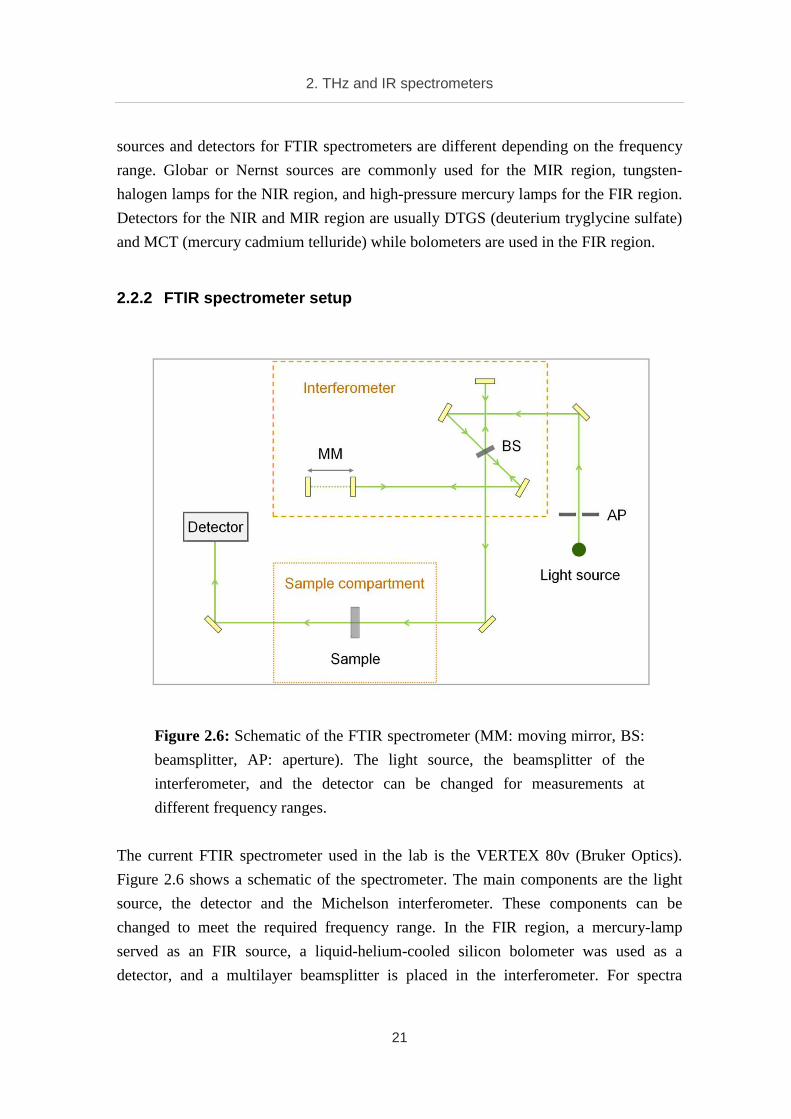
Figure 2.6: Schematic of the FTIR spectrometer (MM: moving mirror, BS:
beamsplitter, AP: aperture). The light source, the beamsplitter of the
interferometer, and the detector can be changed for measurements at
different frequency ranges.
The current FTIR spectrometer used in the lab is the VERTEX 80v (Bruker Optics).
Figure 2.6 shows a schematic of the spectrometer. The main components are the light
source, the detector and the Michelson interferometer. These components can be
changed to meet the required frequency range. In the FIR region, a mercury-lamp
served as an FIR source, a liquid-helium-cooled silicon bolometer was used as a
detector, and a multilayer beamsplitter is placed in the interferometer. For spectra

2. THz and IR spectrometers
22
acquisition in the MIR region, a built-in MIR source, an MCT detector and a KBr
(potassium bromide) beamsplitter are used.
The IR beam from the light source passes through an aperture before arriving the
interferometer. The aperture, whose diameter can vary from 0.2 to 8 mm, is used to
shape the beam. The beamsplitter reflects a half of the beam to a fixed mirror, and
transmits another half to a moving mirror. The beam reflected from these two mirrors is
passed or reflected by the beamsplitter a second time and finally recombined and
focused onto the sample position. In the interferometer, the propagation distance of the
beam reaching the fixed mirror is fixed while that of the beam reaching the moving
mirror changes. This produces an optical path difference between the two beams and the
recombined beam is the result of the interference of these two beams. The detected
signal, which is the intensity as a function of the moving mirror position, is an
interferogram. This interferogram is then analyzed to deduce a frequency dependent
spectrum.
During a measurement, the whole setup, except the sample compartment, is always kept
under vacuum (2 mbar) to avoid external influences. The sample compartment can also
be kept under vacuum if this does not affect the measured samples. The main
advantages of the FTIR spectrometer are wide frequency range, high spectral resolution,
fast spectral acquisition, and simple sample preparation. It can be used for both
qualitative and quantitative analysis of liquid and solid samples. Beside the traditional
transmission spectroscopy, a combination with a reflectance apparatus offers further
sample analyses in reflection spectroscopy.
2.2.3 Attenuated total reflection FTIR spectroscopy
Apart from the traditional transmission spectroscopy, an FTIR spectrometer can be
combined with further components to carry out measurements in reflection geometry.
The attenuated total reflection (ATR) unit is one of the mostly used components for
reflection spectroscopy. The ATR-FTIR spectroscopy has advantages for the study of
optically thick samples, hard samples, slightly curved samples, fibers, and powders.
ATR makes use of the physical phenomenon of total internal reflection. When an IR
beam is directed onto an ATR crystal with a high index of refraction at a certain angle,
it reflects off the internal surface which is in contact with a sample. This internal
reflection creates an evanescent wave which extends beyond the crystal surface into the

2. THz and IR spectrometers
23
sample [38, 39]. The sample characteristically absorbs the evanescent wave, which
results in an attenuation of the total reflected light. The absorbance spectra obtained
from the ATR-FTIR spectroscopy are comparable to those from FTIR transmission
spectroscopy.
2.2.3.1 Evanescent wave
Figure 2.7: Schematic of the propagation of an electromagnetic wave
through an interface between two media. The incident medium has higher
index of refraction than the second one (n1 > n2). When the incident angle θ1
smaller than the critical angle θc (left panel), the wave is both transmitted
and reflected at the interface. When θ1 > θc (right panel), the wave is totally
internal reflected and an evanescent wave is generated beyond the interface.
When light strikes an interface between two media of different indices of refraction, it is
partially transmitted and partially reflected (Figure 2.7, left panel). The transmitted
component is refracted at the interface. The relationship between the angles of incidence
XA and the angles of refraction X� follows the Snell’s Law:
�AsinXA � ��sinX� (2.20)

2. THz and IR spectrometers
24
where �A is the index of refraction of the incident medium, �� is the index of refraction
of the of the second medium. When light travels from a medium with a higher index of
refraction to a medium with a lower index of refraction (�A Z ��), total internal
reflection occurs if the incident angle XA is greater than the critical angle X[ which is
defined by:
X[ � sin'A \���A] (2.21)
In the case of total internal reflection (Figure 2.7, right panel), a special kind of
electromagnetic field, the evanescent wave, is established beyond the interface between
the two media [38, 39]. The electric field of the transmitted evanescent wave in space
and time ��^, _, �, �� is described as:
��^, _, �, �� � ��0,0,0, ���)O.`a,.bcP�'.de:fghijgkf':gg (2.22)
where 0 is the wave vector of the transmitted wave, ^– _ plane is the interface between
two media, the origin point (0,0,0) is the cross point between the interface and the
incident light. Equation (2.22) describes the evanescent wave that propagates along the
interface. The magnitude of its electric field decreases exponentially with increasing
distance from the interface.
The penetration depth %" of the evanescent wave into the second medium, which is the
characteristic distance at which the field strength falls off to 1/� of its value at the
interface, can be calculated with the equation:
%" � U2m�A�nR��XA $ ���
(2.23)
where U is the wavelength of the IR light. In an FTIR system utilizing total internal
reflection, the first medium is the crystal of the reflection component and the second
medium is the investigated sample. The index of refraction of the crystal (�A) must be
significantly greater than that of the sample (��). Materials with high index of refraction
which can be used as a crystal include zinc selenide, silicon, germanium, and diamond.

2. THz and IR spectrometers
25
The penetration depth %" of the evanescent wave is typically in the range from 0.5 to 5
µm. Therefore, the sample must be in good contact with the crystal. A part of the energy
of the evanescent wave is absorbed by the sample, which results in a corresponding
change in the detected IR light. Consequently, an IR spectrum of the sample can be
probed.
2.2.3.2 ATR unit
Figure 2.8: Schematic of the ATR unit. The diamond crystal with high
index of refraction is used as the sampling crystal to ensure total reflection
of the incident light. The incident angle of the IR beam is 45°. The diamond
crystal is hemispherical, which focuses the beam to the horizontal sampling
surface to produce a 0.5 mm diameter sampling area. The light intensity is
characteristically attenuated by the propagation of the evanescent wave in
the sample.
Figure 2.8 shows a schematic of the ATR unit used in the current setup. It is a single
reflection ATR with a diamond crystal (model MVP-Pro, Harrick). The IR beam with
an incident angle of 45° is focused on the ATR crystal by an aluminum mirror. The
reflected beam is focused on the detector by another aluminum mirror. The ATR crystal
is hemispherical, which additionally focuses the beam to the horizontal sampling
surface to produce a 0.5 mm diameter sampling area. This small sampling area makes
the ATR unit suitable for examining sensitive compounds with little required amount
and minor sample preparation. Solid samples are placed onto the surface of the diamond

2. THz and IR spectrometers
26
crystal and are slightly pressed against the crystal using the built-in pressure applicator
to make good contact between the sample and the crystal. For consistent and precise
measurement results, the pressure applicator is equipped with a slip-clutch for
reproducible pressure application. Liquid samples are also placed onto the crystal
surface using a designed liquid cell.
2.2.4 Data acquisition and analysis
Figure 2.9: Measured data of a reference and a sample using a FTIR
spectrometer: (A) interferograms which show the intensity of IR light as a
function of the moving mirror position, (B) Fourier transform spectra of the
interferograms in the frequency domain, (C) calculated absorbance of the
sample, (D) calculated transmittance of the sample.
The data acquired from a measurement is an interferogram, which is the intensity of IR
light versus the moving mirror position. Each position of the moving mirror corresponds
to a temporal delay between the two beams within the interferometer (one reaches the

2. THz and IR spectrometers
27
fixed mirror and the other reaches the moving mirror). The measured intensities are
therefore the data in the time domain. To obtain a spectrum in the frequency domain, a
fast Fourier transform algorithm is applied to the time domain data. In order to get a
transmittance or absorbance spectrum of a sample, two measurements must be carried
out: reference measurement (without the sample) and sample measurement (with the
sample). An example of the measured data is presented in Figure 2.9.
From the interferograms of the reference and the sample, the corresponding frequency
dependent spectra are calculated, including the intensity � of the reference and intensity
�! of the sample at each frequency. These analyses are performed by the OPUS
spectroscopic software program of Bruker Optics. The transmittance (o) and absorbance
(�) of a sample are defined by:
o � �!� (2.24)
� � pqrA \� �!] (2.25)
The absorbance can be converted to the absorption coefficient (L) if the thickness of the
sample (%) is known:
L � ln s� �!t% � � · p�10%
(2.26)
IR spectra are useful analytical tools as most of studied samples have characteristic
bands in the IR frequency range.
For measurements using the ATR unit, there are two considerable problems. First, the
penetration depth of the evanescent wave into the sample depends on the frequency as
shown in Equation (2.23), which results in a modified band intensity at different
frequencies. Second, the absorption of the sample relates to its frequency dependent
index of refraction, which causes a shift of the band positions towards smaller
frequencies. Therefore, spectra obtained from ATR-FTIR spectroscopy have to be
corrected, so that the position and the intensity of the absorption bands are similar to

2. THz and IR spectrometers
28
those of a spectrum measured with transmission spectroscopy [40, 41]. For a correction
of both mentioned problems, the "Extended ATR correction" command of the OPUS
program is used. This manipulation converts an absorbance spectrum (�) to an ATR
spectrum (�ou) using the equation:
�ou � �� · �q�n�v�� · · m�A�� sin��X� $ 1�� (2.27)
where � is the number of ATR reflections, is the wavenumber (frequency) of the IR
light, �A� is the ratio of the indices of refraction between the ATR crystal and the
sample, X is the incident angle, and � is the middle electric field at the boundary.
The ATR unit used in the current setup is a single reflection ATR with an incident angle
of 45°. The index of refraction of the ATR diamond crystal and the middle electric field
at the boundary are automatically calculated in the OPUS program. In order to perform
an extended ATR correction for ATR-FTIR spectroscopy measurements, the mean
index of refraction of the sample must be input to the program.

29
3 Water in nanopores
The studied nanopores are tubular crystals formed by water mediated assembly of
hydroxyl acids into an H-bond network. These supramolecular structures have hydrated
pores with different pore diameters. Water molecules can be permanently confined
inside the pores at ambient condition. In this chapter, attenuated total reflection (ATR)
FTIR spectroscopy in the FIR frequency range was used to investigate the pore size
dependent dynamics and the thermal stability of confined water inside these nanopores.
The presented results are part of Ref. [42, 43].
3.1 Models for biological channels
Studies of water in confined environment have gained significant interest because of the
implication in a number of biological processes [4, 7]. The permeation of water through
cellular membranes is facilitated by aquaporins, a family of proteins that form
cylindrical transmembrane pores of about 20 Å long and 2.8 Å wide at their narrowest
position [44]. This permeability of water across aquaporin channels is selective with
almost no resistance, while the hydronium ion (H3O+) cannot permeate the channels. A
detailed understanding of the forces that drive the filling of the pores by water
molecules and the functional thermodynamics of these natural pores, which are
predominantly hydrophobic, remains elusive. A full understanding of the transport of
water requires knowledge at the molecular level about structure and dynamics from a
locally well defined area [45, 46].
Water structure in biological channels has been studied using molecular dynamics (MD)
simulations [47]. This theoretical study includes models about the physiological
functioning of natural pores which are characterized by numerous chemical and
structural complexities. For more straightforward evaluations, simpler artificial models
have been investigated, such as single-walled carbon nanotubes (SWCNT) for modeling
the diffusion of water in biological structures [48, 49]. These studies usually modeled
the structural and dynamic properties of water in SWCNT and revealed concerted water
motions and density distribution patterns. However, the application of these nanoporous
structures to study the structure and dynamics of long-lived aggregates of water

3. Water in nanopores
30
molecules is limited [50, 51]. Further MD simulation studies predicted that the structure
and dynamics of water at room temperature are specific to each model and depend on
the inner diameter of the pore and its hydrophilicity [52, 53].
Figure 3.1: Chemical structures of the twelve studied monomers. The
different appendages give rise to hydrated porous compounds (HP1-6), a
hydrated nonporous compound (NP3), and anhydrous nonporous
compounds (NP1-2, NP4-6).
In natural channels, the pore diameter and hydrophilicity (or hydrophobicity) are
different along the pore. This influences the structure and dynamics of water molecules
according to their momentary location. Therefore, water diffusion in the channels will
result from the balances among the transient local structures and dynamics of water
molecules. Theoretical studies showed that water can occupy hydrophobic pores,
although there is a lack of H-bond interactions between water and the inner surface of

3. Water in nanopores
31
the pore [54, 55]. However, experimental evidence for the structural nature of water in
hydrophobic pores is lacking and a rigorous understanding of the mechanisms of water
transport through nanopores remains incomplete [56].
To obtain a more thorough understanding of the water transport in natural biological
channels, this study investigated a series of synthetic organic nanopores. The approach
involved the water mediated assembly of organic molecules into porous structures. The
biological formation of a pore is simplified by a general thermodynamically favored
process. For this reason, a set of chemically very similar organic molecules with the
ability of self-assembling into an H-bonded network to form supramolecular structures
was studied. These molecules are different from each other by their appendages. They
were synthesized by changing the number and nature of selected atoms in appendages,
following a previously published synthetic methodology [57]. Figure 3.1 shows the
monomers of the twelve studied compounds. They are hydroxyl acids of general
structure 7,7-appendage1/appendage2-5-hydroxymethyl-6-oxabicyclo[3.2.1]octane-1-
carboxylic acid. These compounds give rise to hydrated porous, hydrated nonporous,
and anhydrous nonporous crystalline structures [58]. The compounds formed by
monomers with the name HP (HP1-6) have hydrated porous structures while the ones
formed by monomers with the name NP (NP1-6) have nonporous structures. Among the
nonporous compounds, five are anhydrous (NP1-2, NP4-6) and one is hydrated (NP3).
The anhydrous nonporous compounds have no water molecules while the hydrated
nonporous compound contains water molecules that form a part of the supramolecular
structure (structural water). On the other hand, the hydrated porous compounds contain
both structural water and water molecules that reside inside the pores. These porous
compounds have served as models of biological water channels where water
confinement has been studied using spectroscopic and calorimetric techniques [59].
Another study has shown that water molecules can successfully occupy permanently the
nonpolar pores at ambient conditions in a thermodynamically controlled manner
without impairing the structure of H-bond networks [60]. The supramolecular structure
is stoichiometrically sustained by the organic monomers and by water molecules
according to the following general equation [61]:
nM � mH�O { Mj · �H�O�| � Mj � �H�O�|
(monomers) (bulk water) (hydrated pore) (anhydrous pore) (water cluster)
(3.1)

where n is the number of organic monomers (
molecules (H2O) which is
general method for the synthesis of long
synthetic approach, the number of water molecules inside the pore is constant and
independent of the inner pore diameter
monomer/water remains unchanged at
Figure 3.2: Crystal structures
[62], (B) narrow porous compound HP6
compound NP2 [58]. Fo
pores are not shown. T
which define the internal pore diameter. The distances a and
maximum distance between the
(HP1·2H2O: a = 9.3 Å, b = 12.2 Å; HP6·2H
From the monomers, crystals from all compounds were slowly grown under identical
conditions using a previously water saturated mixture of carbon tetrachloride/2,2,4
trimethylpentane mixture (ratio of 4:1). Monomers with long, branched, or cyclic
appendages which restrict conformational movements (NP1
anhydrous packing composed mostly of double stranded head
compound formed by NP3 also incorporated water molecules (two monomers with one
water molecule), but the structure is still nonporous. Only monomers with flexible
linear appendages (HP1-
3. Water in nanopores
32
is the number of organic monomers (M), and m is the num
is involved in the resulting assembly. This process describes a
general method for the synthesis of long-lived water clusters from bulk water
the number of water molecules inside the pore is constant and
independent of the inner pore diameter [59]. In all hydrated porous models, the
monomer/water remains unchanged at 1/2 (one monomer with two water molecules).
Crystal structures of: (A) wide porous compound HP1·2H
narrow porous compound HP6·2H2O [59], (C) nonporous
. For the porous compounds, water molecules
shown. The white dotted lines show the β-oriented appendages
which define the internal pore diameter. The distances a and b represent the
maximum distance between the β and α oriented appendages, respectively
O: a = 9.3 Å, b = 12.2 Å; HP6·2H2O: a = 7.7 Å, b = 11.3 Å).
From the monomers, crystals from all compounds were slowly grown under identical
previously water saturated mixture of carbon tetrachloride/2,2,4
trimethylpentane mixture (ratio of 4:1). Monomers with long, branched, or cyclic
appendages which restrict conformational movements (NP1-6 in Figure
anhydrous packing composed mostly of double stranded head-to-
compound formed by NP3 also incorporated water molecules (two monomers with one
water molecule), but the structure is still nonporous. Only monomers with flexible
6 in Figure 3.1) gave hydrated crystalline structures by
the number of water
This process describes a
lived water clusters from bulk water. With this
the number of water molecules inside the pore is constant and
models, the ratio
2 (one monomer with two water molecules).
: (A) wide porous compound HP1·2H2O
, (C) nonporous
molecules inside the
oriented appendages
b represent the
oriented appendages, respectively
O: a = 7.7 Å, b = 11.3 Å).
From the monomers, crystals from all compounds were slowly grown under identical
previously water saturated mixture of carbon tetrachloride/2,2,4-
trimethylpentane mixture (ratio of 4:1). Monomers with long, branched, or cyclic
Figure 3.1) generated
-tail arrays. The
compound formed by NP3 also incorporated water molecules (two monomers with one
water molecule), but the structure is still nonporous. Only monomers with flexible
) gave hydrated crystalline structures by
3. Water in nanopores
33
incorporation of two water molecules for each monomer. The compounds HP1·2H2O
(with β-ethyl/α-ethyl appendages), HP2·2H2O (β-ethyl/α-propyl), and HP3·2H2O (β-
ethyl/α-propenyl) have wide pores with pore diameter of about 5.9-9.4 Å [62]. Other
hydrated porous compounds (HP4·2H2O, HP5·2H2O, HP6·2H2O) with longer β-
appendages have narrow pores of about 4.2-6.5 Å [59]. In this study, both the wide and
narrow pores are referred to as nanopores.
Figure 3.2 shows representative front view crystal structures of a wide porous
compound HP1·2H2O [62], a narrow porous compound HP6·2H2O [59], and a
nonporous compound NP2 [58]. The nonporous compound consists mostly of double
stranded head-to-tail arrays. For the porous compounds, the β-ethyl appendage of
HP1·2H2O occupies less space than the β-propenyl appendage of HP6·2H2O does,
which results in wider pore size for HP1·2H2O.
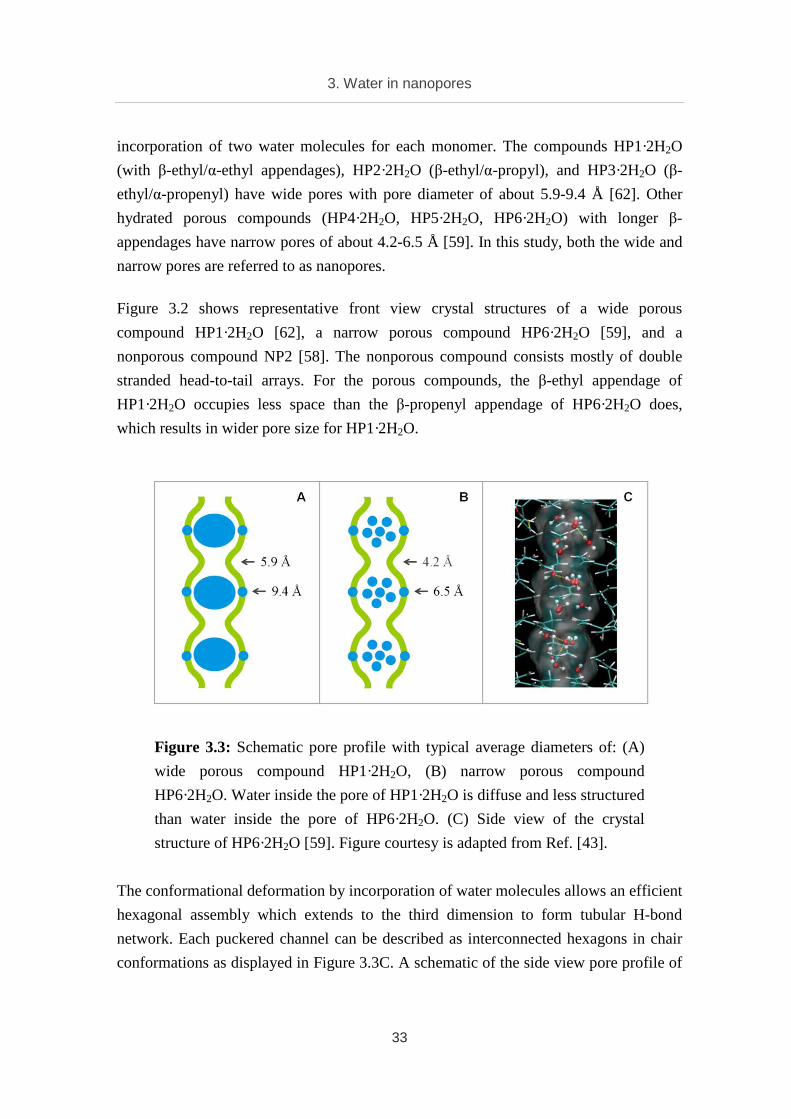
Figure 3.3: Schematic pore profile with typical average diameters of: (A)
wide porous compound HP1·2H2O, (B) narrow porous compound
HP6·2H2O. Water inside the pore of HP1·2H2O is diffuse and less structured
than water inside the pore of HP6·2H2O. (C) Side view of the crystal
structure of HP6·2H2O [59]. Figure courtesy is adapted from Ref. [43].
The conformational deformation by incorporation of water molecules allows an efficient
hexagonal assembly which extends to the third dimension to form tubular H-bond
network. Each puckered channel can be described as interconnected hexagons in chair
conformations as displayed in Figure 3.3C. A schematic of the side view pore profile of

3. Water in nanopores
34
HP1·2H2O is shown in Figure 3.3A, and that of HP6·2H2O is shown in Figure 3.3B.
Structural water (represented by blue dots on the wall) helps to fix the tubular structure
in the pore walls. Water inside the wide pore of HP1·2H2O (fat blue ellipse) is diffuse
and less structured than water in the narrow pore of HP6·2H2O (individual blue dots).
The pore diameter is not homogeneous. It changes approximately from 5.9 to 9.4 Å in
the case of HP1·2H2O and from 4.2 to 6.5 Å in the case of HP6·2H2O. To some extents,
these synthetic organic nanopores serve as models for natural biological channels.
In bulk water, the four H-bonding sites are not always fully occupied as the molecules
are mobile in the liquid state. At room temperature, each water molecule coordinates
with 3.5 neighboring water molecules on average [7]. H-bond breaking and reformation
occur continuously in a sub-ps timescale. The average H-bond network rearrangements
(water collective motions) are in the order of 1 ps [3]. When water molecules are
confined inside a nanopore, water collective motions are considerably influenced.
Changes in dynamics of confined water can be directly monitored by FIR spectroscopy.
In this study, pore size dependent dynamics of confined water in nanopores were
investigated by FTIR spectroscopy in FIR frequency range using an attenuated total
reflection (ATR) unit. Furthermore, reversibility of confined water dynamics and
thermal stability of the hydrated nanopores were examined. The study aims to
qualitatively probe the differences in the dynamics of water in nanopores of different
sizes, establish optimal conditions for chemical models of water pores, and contribute to
a better comprehension of water dynamics in nonpolar environments.
ATR-FTIR spectroscopy was used to probe the absorbance spectra of water and the
selected compounds at different temperatures in the FIR region from 20 to 700 cm-1. For
data analysis, the frequency range from 50 to 650 cm-1 was chosen because of its high
signal to noise ratio. The mean index of refraction of the samples was approximately
fixed at 1.5 for the extended ATR correction of the absorbance spectra. A detailed
description of the experimental setup and data analysis is presented in Chapter 2. For
each measurement, the solid sample was placed onto the surface of the ATR diamond
crystal and was slightly pressed against the crystal using the built-in pressure applicator.
Water and ice were also placed onto the surface of the ATR diamond crystal using a
designed liquid cell. The IR source was supplied by a mercury-lamp. A liquid-helium-
cooled silicon bolometer was used for spectra acquisition. All measurements were
carried out under vacuum (2.01 mbar). The temperature in the range from -5 to 40°C

3. Water in nanopores
35
was monitored by an external temperature controller. All samples were synthesized by
the collaborators at the Institute for Chemical Research in Seville, Spain.
3.2 Pore size dependent dynamics of confined water
The FIR spectrum of ice and temperature dependent spectra of bulk water in the
temperature range from 0 to 20°C are shown in Figure 3.4. The absorbance spectrum of
ice shows a characteristic maximum at about 200 cm-1, and a broad minimum from 300
to 500 cm-1. For frequencies above 500 cm-1, a rapid absorbance increase is found. The
absorbance of liquid water is distinct from that of ice. Water spectra show a smaller
peak at about 150 cm-1 and a broad absorbance maximum in the frequency range above
400 cm-1. With increasing temperature, the absorbance of water increases. As observed
in the inset of Figure 3.4, the temperature dependence is significant in the high
absorbance frequency region from 400 to 570 cm-1. These FIR spectra of ice and water
serve as a reference to compare with the spectra of confined water in nanopores.
Figure 3.4: Absorbance spectrum of ice and spectra of bulk water in the
range from 0 to 20°C. Inset: spectra of water in the high absorbance
frequency region from 400 to 570 cm-1. The absorbance of water increases
with increasing temperature.

3. Water in nanopores
36
The twelve studied compounds are categorized into three groups. The first group
contains hydrated porous compounds with wide pore (from 5.9 to 9.4 Å), including
HP1·2H2O, HP2·2H2O, and HP3·2H2O. The second group contains hydrated porous
compounds with narrow pore (from 4.2 to 6.5 Å), including HP4·2H2O, HP5·2H2O, and
HP6·2H2O. The third group consists of nonporous compounds with one hydrated
(NP3·0.5H2O) and five anhydrous compounds (NP1, NP2, NP4, NP5, NP6). Among the
third group, three compounds have identical α and β-appendages (NP1, NP2, NP3)
while the other three have different appendages (NP4, NP5, NP6).
Figure 3.5: Absorbance spectra at 20°C in the FIR region of: (A) wide
hydrated nanopores, (B) narrow hydrated nanopores, (C) one hydrated
nonporous compound and two anhydrous nonporous compounds with
identical appendages, (D) anhydrous nonporous compounds with different
appendages. In the frequency range from 400 to 570 cm-1 (highlighted
regions), the hydrated porous compounds have significantly higher
absorbance than the nonporous compounds.
The FIR absorbance spectra at 20°C of all compounds in the frequency range from 50 to
650 cm-1 are shown in Figure 3.5. Below 400 cm-1, the spectra of all compounds exhibit

3. Water in nanopores
37
relatively small absorbance and no characteristic absorption feature is found. However,
in the region from 400 to 570 cm-1, the absorbance of hydrated porous compounds
(Figure 3.5A, B) absorb significantly more than the nonporous compounds (Figure
3.5C, D). The absorbance of NP3·0.5H2O, which is a hydrated nonporous compound
and only has structural water is similar to that of the anhydrous compounds in region
from 400 to 570 cm-1. A comparison with FIR absorbance of water in Figure 3.4
indicates that it is possibly the water inside the nanopores that accounts for the observed
high absorbance of hydrated porous compounds in this frequency region.
Figure 3.6: Temperature dependent spectra in the range from -5 to 20°C of
three representative compounds: (A) wide hydrated nanopore HP1·2H2O,
(B) narrow hydrated nanopore HP6·2H2O, (C) anhydrous nonporous
compound NP2. The change in the absorbance with temperature of the wide
hydrated nanopore is more significant than that of the narrow hydrated
nanopore while the absorbance of the nonporous compound is almost
unchanged in the entire investigated temperature range.
In order to check the similarities in the behavior of water confined in nanopores and
bulk water, temperature dependent spectra of all compounds in the temperature range
from -5 to 20°C were measured. Figure 3.6 shows temperature dependent spectra in the
range from -5 to 20°C of three representative compounds, one for each categorized
group. These chemically similar compounds show quite different behaviors. The
absorbance of the nonporous compound NP2 (Figure 3.6C) does not change with
temperature in the whole temperature range, while the absorbance of the wide hydrated

3. Water in nanopores
38
nanopore HP1·2H2O (Figure 3.6A) and the narrow hydrated nanopore HP6·2H2O
(Figure 3.6B) increase considerably with increasing temperature, especially in the
frequency range from 400 to 570 cm-1. The change in the absorbance with temperature
of the wide hydrated nanopore is more profound than that of the narrow hydrated
nanopore. The observation is a general phenomena as an almost temperature
independent FIR absorbance is found for any anhydrous compound while a clear
temperature dependence is observed for all hydrated porous compounds.
Figure 3.7: Change in absorbance compared with absorbance at -5°C,
averaged over the frequency range from 400 to 570 cm-1 of: (A) six hydrated
porous compounds, (B) one hydrated nonporous compound and five
anhydrous nonporous compounds. The hydrated porous compounds show a
nearly linear increase in absorbance with increasing temperature and the
change for compounds with wide pores (HP1-3) is more significant than the
change for compounds with narrow pores (HP4-6). For the nonporous
compounds (NP1-6), the absorbance is independent with temperature.
For further investigation on the pore size dependent behavior, the integrated absorbance
averaged over the frequency range from 400 to 570 cm-1 of all compounds is calculated.
Figure 3.7 shows the temperature dependent change in the integrated absorbance
compared with the integrated absorbance at -5°C. As previously observed for the
anhydrous compound NP2 in Figure 3.6C, all compounds without hydrated nanopores
show an almost constant absorbance at different temperatures (Figure 3.7B). On the

3. Water in nanopores
39
other hand, the less confined water molecules in wide nanopores (HP1·2H2O,
HP2·2H2O, HP3·2H2O) show a significant linear increase in absorbance with increasing
temperature, by approximately 1.0·10-4 per 1°C (Figure 3.7A). A smaller temperature
dependent absorbance is observed for water molecules confined in narrower pores
(HP4·2H2O, HP5·2H2O, HP6·2H2O), in which the slope of the linear increase is
approximately 0.7·10-4 per 1°C (Figure 3.7A).
3.3 Reversibility of water dynamics in nanopores
Figure 3.8: Temperature dependent FIR absorbance of the hydrated
nanopore HP1·2H2O in the temperature interval from -5 to 30°C upon: (A)
heating, (B) cooling. Inset: Integrated absorbance over the frequency range
from 400 to 570 cm-1 compared to the integrated absorbance at -5°C. Upon
heating and cooling within this temperature range, a reversible behavior is
observed.
The thermal stability and reversibility of water dynamics in nanopores were studied by a
series of measurements in which the samples were first heated up and then cooled
down. The thermal behavior of the representative compound HP1·2H2O in the
temperature range from -5 ºC to 30 ºC was investigated. Figure 3.8 shows the
temperature dependent FIR absorbance spectra for the heating (Figure 3.8A) and the
subsequent cooling process (Figure 3.8B). The inset displays the temperature dependent
integrated absorbance averaged over the frequency range from 400 to 570 cm-1

3. Water in nanopores
40
compared to the integrated absorbance at -5°C. Upon heating and cooling within the
temperature range, the changes in absorbance are completely reversible. The absorbance
of the compound increases with increasing temperature, then it decreases back upon
cooling.
Figure 3.9: Decrease in FIR absorbance resulted from the release of water
of: (A) HP1·2H2O when being held at 40°C, (B) HP6·2H2O when being held
at 30°C. For both compounds, only mobile water molecules in the pores are
released as the pore structure still maintains.
The decrease in FIR absorbance of compound HP1·2H2O was observed after the
compound was heated at 40ºC for 40 and 90 minutes (Figure 3.9A). After 90 minutes,
the entire content of mobile water in the pore was released and no additional decrease in
absorbance was observed. Similar measurements of the narrow porous compound
HP6·2H2O show a similar trend (Figure 3.9B). For this compound, the release of water
began at lower temperature (30°C), and all mobile water in the pore was released after
120 minutes.
3.4 Discussion and conclusion
The FIR spectrum of ice with a maximum at about 200 cm-1, and a broad minimum
from 300 to 500 cm-1 (Figure 3.4) is in good agreement with a previous study for H2O
ice [63], as well as with the calculated data for D2O ice [64]. The spectra of liquid water

3. Water in nanopores
41
at different temperatures show a small peak at about 150 cm-1 and a broad peak in the
frequency range from 400 to 570 cm-1. A FIR study using two-fraction model for low
frequency Debye relaxation [65] and a MD simulation with instantaneous normal mode
theory [66] found similar water absorbance spectra. Experimental data measured with
FTIR transmission spectroscopy in this frequency range also showed the same behavior
[67]. In recent studies, the water absorbance peak at lower frequency is assigned to the
intermolecular H-bond stretching vibrations, while the one at higher frequency is
assigned to the librational motions [9, 68]. The observed increase in absorbance of
water with increasing temperature agrees well with a previous study at similar
temperatures and frequency range [67]. The distinct difference between the spectra of
ice and liquid water indicates that the confined water structure in ice strongly influences
the FIR absorbance.
Compared to the FIR spectra of water, the FIR spectra of the hydrated porous
compounds (Figure 3.5) also show a broad absorption peak in the frequency range from
400 to 570 cm-1, but no peak around 150 cm-1. The absence of the absorbance peak
around 150 cm-1, which is assign to intermolecular H-bond stretching vibrations, can be
explained by the absence of intermolecular water H-bond network when water is
confined in nanopores. This behavior is also observed with confined water in organic
solvents at low water content [69]. In the temperature dependent spectra (Figure 3.7),
the absorption of hydrated porous compounds in the frequency range from 400 to 570
cm-1 increase with increasing temperature, which is similar to the behavior of water,
while the absorption of nonporous compounds is unchanged with temperature. These
observations unambiguously confirm that the observed absorbance in this particular
frequency range is due to the confined water in the nanopores. Furthermore, a smaller
change in the absorbance upon increase of temperature compared to the wide nanopores
shows that water molecules in the narrow nanopores are less dynamic than water
molecules in the wide nanopores as well as water molecules in bulk water. Water
dynamic here refers to their FIR absorbance which is closely connected with the fast
solvation dynamics. A previous theoretical study revealed that the FIR absorbance
spectra of water are related to the fast fluctuations of the water dipole moments [64].
The FIR absorbance describes fluctuations of the H-bond network of water arising
partially from the breaking and reformation of H-bonds between water molecules,
which takes place in the ps timescale [3, 70]. The mentioned dynamic of water in
nanopores is therefore occurs in the ps timescale.

3. Water in nanopores
42
The temperature dependent FIR spectra upon heating and subsequent cooling in the
temperature range from -5 ºC to 30 ºC of the hydrated porous compound HP1·2H2O
(Figure 3.8) show a complete reversibility. A previous study using thermogravimetric
analysis and variable temperature powder X-ray diffraction of the same compound
indicated that the loss of some water molecules in nanopores started only when the
temperature reached 40ºC, without the collapse of the pore structure [60]. Therefore, the
observed reversibility is expected as the amount of water molecules remains unchanged
upon tuning within the studied temperature range. The release of mobile water in the
pore observed at 40°C for HP1·2H2O and at 30°C for HP6·2H2O (Figure 3.9) agrees
well with the results observed with thermogravimetric analysis [60]. This study also
found that water is not reincorporated into the pores even when the compounds were
kept under moist conditions for 24 hours. Therefore, this process is irreversible.
Figure 3.10: Temperature dependent change in the integrated absorbance
over the frequency range from 400 to 570 cm-1 compared to the integrated
absorbance at -5ºC of three compounds which are formed by the same
monomer but have different water contents (left panel). Compounds with
lower water content HP1·1.5H2O and HP1·1H2O were obtained by heating
and holding the fully hydrated compound HP1·2H2O for 40 and 90 minutes
at 40°C, respectively. The right panel (Figure courtesy adapted from Ref.
[43]) illustrates the change of the hydration in the pore upon releasing of
water in the pore. Green color represents pore walls and blue circles
represent water molecules.

3. Water in nanopores
43
When compound HP1·2H2O was heated and held 40ºC, water in the pore was released
continuously, which also changed the monomer to water ratio. When being held for 40
minutes at 40°C, the ratio changed from 1:2 to approximately 1:1.5, and the compound
became HP1·1.5H2O. After being held for 90 minutes at 40°C, mobile water in the pore
was released completely, and the ratio changed to 1:1 (HP1·1H2O), indicating that only
structural water remained in the compound. To investigate the thermal behavior of the
compounds which are formed by the same monomer but have different water contents,
FIR measurements in the temperature range from -5 to 20°C were carried out for
HP1·2H2O, HP1·1.5H2O and HP1·1H2O. Figure 3.10 shows the temperature dependent
change in the integrated absorbance averaged over the frequency range from 400 to 570
cm-1 compared to the integrated absorbance at -5ºC. The fully hydrated compound
HP1·2H2O shows the highest increase in absorbance with increasing temperature. The
partially dehydrated compound HP1·1.5H2O has less absorbance change with
temperature. The change is approximately a half of the change observed with the fully
hydrated compound. The absorbance of the dehydrated compound HP1·1H2O, in which
mobile water in the pore is fully released, is nearly constant with temperature. This
behavior is similar to that of the hydrated nonporous compound (NP3·0.5H2O) and the
anhydrous nonporous compounds. The change of the hydration in the pore upon
releasing of water in the pore is illustrated in right panel of Figure 3.10. The release of
the mobile fraction of water renders the pores more hydrophobic. A transition of the
inner pore surface from hydrophilic to hydrophobic surface occurs upon increasing the
temperature to 40°C. This may be attributed to the influence of the dynamics and
thermodynamics of confined water molecules on the pore surface affinity. The
differences in the temperature dependent dehydration of the hydrated nanopores indicate
that the behavior of water inside the pores depends on the details of the intermolecular
interactions between water molecules and the inner surface of the pores. The structure
and dynamics of confined water are strongly influenced by the temperature.
The results show that the FTIR spectroscopy in FIR region, especially temperature
dependent studies, can serve as a sensitive method to probe the water dynamics inside
hydrated nanopores. The compounds that contain water inside the pores absorb
significantly more than the anhydrous or hydrated nonporous compounds do in the
frequency range from 400 to 570 cm-1. Furthermore, the temperature dependent FIR
absorbance of water in nanopores is significantly different depending on the inherent
water dynamics in each compound, which is imposed by the size of the pores. Less
3. Water in nanopores
44
confined and thus more mobile water molecules inside the wide pores show a large
change in their absorbance upon increase of temperature. In contrast, water confined in
the narrow pores show a smaller increase in absorbance with increasing temperature.
Therefore, FIR-FTIR spectroscopy can reveal and qualitatively characterize distinct
dynamics of confined water molecules inside the hydrated nanopores by their
temperature dependent FIR absorbance. The stability and reversibility at ambient
condition of the hydrated nanopores prove that water molecules can continuously
occupy permanently the nonpolar pores. This confirms that the synthesized nanopores
can serve as model systems for biological channels. Further experimental exploration of
these model systems can be systematically studied, which may open opportunities for a
more comprehensive understanding of water dynamics in biological processes.

45
4 Water in reverse micelles
In a DDAB/Cy/water (didodecyldimethylammonium bromide/cyclohexane/water)
mixture, DDAB molecules aggregate into nanoscale reverse micelles (RM), trapping
water molecules inside the RM. Water confined in RM exhibit significantly different
properties compared to bulk water. This chapter presents the study of DDAB/Cy/water
RM systems at different water concentrations and temperatures using dynamic light
scattering (DLS), THz-TDS, and FTIR spectroscopy. The presented results are part of
Ref. [71].
4.1 Water nanopools in DDAB/Cy/water reverse micelles
RM are water-in-oil droplets stabilized by a surfactant. RM are formed when surfactant
molecules dissolved with water in a nonpolar organic solvent aggregate into nanoscale
RM structures where the hydrophilic heads form the core of the RM and hydrophobic
tails are in contact with the surrounding solvent. Water molecules in the mixture are
trapped inside the RM. Water confined in RM usually exhibit significant differences in
physical and chemical properties compared to its bulk properties. The modification
principally results from the heterogeneous bonding of the water molecules with the RM
interface. RM systems have been widely studied because of their similarity to various
biological systems. There has been a discussion on the effect of confinement on the
water dynamics. The water molecules in the vicinity of the surface are suspected to be
highly structured or retarded in their dynamics [72, 73, 74]. Nuclear magnetic resonance
(NMR) studies of confining proteins within the nanoscale interior of RM found a
significant reduced motion of the hydration water [75, 76]. Most of the previous studies
investigated RM formed by anionic AOT (sodium bis(2-ethylhexyl) sulfosuccinate) or
nonionic surfactants that form spherical RM droplets. In these systems, the curvature of
the interface has an identical contribution towards the water structure and dynamics.
The role of surface topology and the surfactant film curvature on the hydration structure
and dynamics has been neglected. Therefore, it is interesting to investigate how the
morphology of RM interface affects the structure and dynamics of confined water
molecules inside the RM waterpools.

4. Water in reverse micelles
46
Figure 4.1: Structure of DDAB (left) and schematic of a spherical water
nanopool formed by DDAB/Cy/water RM (right). In the nonpolar Cy
solvent, the cationic DDAB surfactant molecules aggregate into nanoscale
RM structures where the hydrophilic heads form the core of the RM and
hydrophobic tails are in contact with the surrounding solvent. Water
molecules in the mixture are confined inside the RM.
DDAB is a double chained cationic surfactant (Figure 4.1). DDAB/alkane/water RM
systems exhibit a rich phase and structural behavior. The maximum water solubilization
capacity of these systems are usually smaller than the conventional surfactant systems
due to the low hydrophilicity of the quaternary ammonium head group of DDAB [77].
At low degree of hydration } (} � ~water�/~DDAB�), the system mainly consists of
cylindrical aggregated structures. With increasing } , the RM changes into discrete
droplets [78, 79]. This gradual cylinder-to-sphere transformation of the RM resulted
from the fact that the elastic property of the DDAB monolayer around water in alkane
solvent undergoes substantial modifications during the process of microscopic phase
transition. A study of DDAB/Cy/water RM systems using small angle neutron
scattering (SANS) indicated that the system shows a cylindrical structure in the }
range from 2 to 8, and at } � 10, discrete droplet type structure prevails [78]. This
transition has successfully been explained on the basis of a disordered open connected
(DOC) model that describes a set of random structures and transitions between them
[80]. Using Fourier transform pulsed-gradient spin-echo (FT-PGSE) NMR, a steady
decrease in the self-diffusion coefficient of water in DDAB RM was detected with
increasing } , which is in contrast to the behavior of RM systems formed by anionic
AOT and nonionic C12E4 (tetraethylene glycol dodecyl ether) [81]. The microscopic
phase transition in DDAB RM has also been confirmed by small angle X-ray scattering

4. Water in reverse micelles
47
(SAXS) and NMR relaxation studies [82, 83]. Different from conventional RM systems,
DDAB RM systems exhibit reverse percolation of conductance which manifests a
transition from connected to discrete structures [84, 85]. The changes in microscopic
phase structure as well as the reverse percolation of conductance result in significant
modification of the properties of the surfactant monolayer at the water-oil interface.
Therefore, DDAB RM systems serve as an interesting platform to understand the
structure and dynamics of water molecules in RM systems with different morphological
states. Figure 4.1 shows the structure of DDAB and the schematic of a spherical
waterpool in DDAB/Cy/water RM. DDAB molecules aggregate into nanoscale RM
structures where the hydrophilic heads form the core of the RM and hydrophobic tails
are in contact with the surrounding nonpolar Cy solvent. Water molecules in the
mixture are trapped inside the RM.
In this study, the structure and dynamics of water molecules in the water nanopools of
DDAB/Cy/water RM systems in dependence of } and temperatures were investigated.
The geometrical dimensions of these systems were estimated using DLS technique. The
collective motions of water molecules in the THz region were investigated using THz-
TDS. FTIR spectroscopy in FIR and MIR region probed the H-bond network structure,
dynamics, and intramolecular OH stretching of water molecules. DDAB and Cy were
purchased from Sigma Aldrich at 98% or higher purity and were used as received. The
concentration of DDAB in Cy was kept constant at 0.1 M. As dry DDAB is insoluble in
Cy [86], a specified amount of water was added in DDAB/Cy mixture to prepare a RM
stock solution with } � 1. Upon further addition of water, RM systems with increased
} were prepared.
4.2 Dynamic light scattering measurements
4.2.1 Principle of dynamic light scattering
DLS, which is also known as photon correlation spectroscopy, was used to determine
the size of small particles in solution by probing the temporal fluctuations of the light
scattered by the particles. When a monochromatic light hits the particles whose size is
much smaller than its wavelength, light scattering occurs in all directions. The intensity
of the scattered light is influenced by the interaction, size and shape of the particles.

4. Water in reverse micelles
48
Furthermore, the scattered intensity fluctuates with time because the particles undergo
Brownian motion, constantly changing their position in the solution [87]. Brownian
motion is the movement of particles due to the random collision with molecules of the
liquid solvent. Assuming that a particle has spherical shape, the relationship between its
size and its speed due to Brownian motion is given by the Stokes-Einstein equation:
� � 0�o3�% (4.1)
where � is the translational diffusion coefficient, 0� is the Boltzmann constant, o is the
temperature in Kelvin, � is the viscosity of the solvent, and % is the diameter of the
particle. As deduced from the equation, large particles move slower than smaller
particles. In a DLS measurement, different movement speeds, or different particle sizes,
results in different effects on the time dependent intensity of the scattered light. An
autocorrelation of the measured intensity yields the dynamic information (diffusion
coefficient) of the particle. When the viscosity of the solvent is known, the
hydrodynamic diameter (%�), which characterizes how the particle diffuses in the
solvent, is estimated from following equation:
%� � 0�o3�� (4.2)
Figure 4.2 shows a schematic of a DLS system. A laser provides the light source to
illuminate the sample which consists of the studied particles. A part of the laser beam
passes through the sample and a part is scattered by the particles. The detector at a
scattering angle θ is used to measure the time dependent intensity of the scattered light.
It is possible to place the detector at any angle because the particles scatter light in all
directions. The autocorrelator compares the scattering intensity at successive time
intervals to derive the variation rate of the intensity. This information is analyzed by a
computer to yield the hydrodynamic diameter of the particles. The fitting of
autocorrelation data of DLS measurements assumes that the particles are spherical. For
particles with other shapes, the fitting usually yields larger sizes.

4. Water in reverse micelles
49
Figure 4.2: Schematic of a DLS system. The laser light is focused on the
sample which scatters light in all directions. The time dependent intensity of
the scattered light is measured by the detector placed at a scattering angle θ.
The measured data are processed and analyzed by the autocorrelator and the
computer to yield the hydrodynamic diameter of the particles in the sample.
In this study, a DLS system (model Nano-S, Malvern) was used to measure the size of
the RM. The system employs a 4 mW He-Ne laser at a wavelength of 632.8 nm as a
light source. All scattered photons were collected at a fixed scattering angle of 173°.
The time dependent scattered intensity were processed using the instrumental software
to obtain the hydrodynamic diameter %�, and the size distribution of the scatterer in
each sample. This experiment was carried out by the collaborators at S.N. Bose
National Centre for Basic Sciences (Kolkata, India).
4.2.2 Hydrodynamic diameters of reverse micelles
Figure 4.3 shows the hydrodynamic diameter %� of DDAB/Cy/water RM systems for
distinct } and temperature values. As observed from the figure, %� of all RM systems
decreases with increasing temperature. For } � 10, %� decreases from about 37-57
nm at 20°C to about 8-15 nm at 50°C. For } � 10, %� is smaller at 20°C (about 14-31
nm) and decreases at higher temperature (about 6-11 nm at 50°C). For DLS
measurements, the conventional determination of the particle size by the fitting of
autocorrelation data assumes that the dispersed particles are spherical. For cylindrical
dispersions, the fitting will yield larger sizes.

4. Water in reverse micelles
50
Figure 4.3: Hydrodynamic diameters of DDAB/Cy/water RM systems at
different temperatures and different w0 measured with DLS. With increasing
temperature, the hydrodynamic diameter of all the RM systems decreases.
This experiment was carried out by the collaborators at S.N. Bose National
Centre for Basic Sciences in India.
4.3 THz-TDS measurements
The frequency dependent absorption coefficients in the frequency range from 0.4 to 1.4
THz (13-45 cm-1) were obtained using a THz-TDS. The detailed descriptions of the
spectrometer and the data analysis are presented in Chapter 2. The samples were placed
in a liquid cell (model A145, Bruker Optics) with z-cut quartz windows and a thickness
of 1 mm. To avoid water vapor absorption, the THz setup is enclosed in a box which is
purged with dry air. All THz-TDS measurements were carried out under thermal
equilibration with humidity at �5 � 0.1� % and temperature at �0.2°C accuracy.
Figure 4.4A shows the absorption coefficient spectra L�� of DDAB/Cy/water RM
systems with different } at 20°C. L�� increases with increasing frequency. With
increasing } , a significant increase of L�� is observed. The integrated absorption
coefficients (� L Z) of the RM systems in the frequency range from 0.4 to 1.4 THz as a
function of temperature are shown in Figure 4.4B. For comparison, � L Z of water in

4. Water in reverse micelles
51
an adjusted scale and � L Z of Cy are also plotted. In this frequency range, � L Z of
water increases with increasing temperature. For Cy, � L Z has negligible small values
(0-0.5 cm-1) and remains almost constant with increasing temperature. For the RM
systems, � L Z increases with increasing temperature for all systems. This indicates the
dominant contribution of the absorption of water for all samples, although the volume
fraction of water is very small. With increasing } , � L Z approaches that of water.
Figure 4.4: THz-TDS spectra of DDAB/Cy/water RM systems at 20°C in
the frequency range from 0.4 to 1.4 THz: (A) absorption coefficient, (B)
integrated absorption coefficient in the frequency range from 0.4 to 1.4 THz
as a function of temperature. The integrated absorption coefficient of pure
water in an adjusted scale and Cy are plotted for comparison.
4.4 FTIR measurements
FTIR spectra were recorded using a VERTEX 80v FTIR spectrometer (Bruker Optics)
at different temperatures under nitrogen gas flow in the sample compartment. The
details of this system are described in Chapter 2. For spectra acquisition in the MIR
region (600-7000 cm-1), the MIR source of the spectrometer and MCT detector were
used. For data analysis, the frequency range from 3000 to 3700 cm-1 was chosen to
investigate the OH stretching modes of water. In the FIR region (20-700 cm-1), a
mercury lamp was used as an FIR source, and a liquid-helium-cooled silicon bolometer
was used for detection. The frequency range from 50 to 650 cm-1 was chosen for data

4. Water in reverse micelles
52
analysis because of its high signal to noise ratio. All samples were measured using a
liquid cell (model A145, Bruker Optics) with a thickness of 52.6 µm (exception: 12.0
µm for pure water). Diamond windows were used for FTIR measurements in FIR region
while z-cut quartz windows were used for MIR measurements. Thermal equilibration at
�0.2°C around the required temperature had to be obtained before experimental data
collection.
Figure 4.5: FTIR spectra of the stock solution (DDAB/Cy/water mixture at
w0=1) in the FIR region (A) and MIR region (B). In the analyzed frequency
regions (marked in orange), the stock solution has negligible absorption.
The strong absorption in the frequency range 2800-3000 cm-1 results from
the CH stretching modes of Cy.
The FTIR spectra of the samples correspond to the difference absorbance spectra
between the measured absorbance of the samples and the measured absorbance of the
stock solution (DDAB/Cy/water system at } � 1). The FTIR spectra in the FIR and
MIR regions of the stock solution are shown in Figure 4.5. In the FIR region, the
absorption of the stock solution is almost negligible. In the MIR region, The CH
stretching modes of Cy are clearly found in the frequency range 2800-3000 cm-1. In the
analyzed MIR region (3000-3700 cm-1), the absorption of the stock solution is
negligible. For the sample at highest water content (} � 12.5), the added volume of
water is only 2% compared to the volume of the stock solution, indicating that the
reduced volume fraction of the stock solution in all investigated RM systems is
negligible. Therefore, the presented FIR and MIR difference absorbance spectra of the

4. Water in reverse micelles
53
RM systems are attributed solely to the partial contribution of water added to the stock
solution.
4.4.1 FIR spectra
Figure 4.6: Difference absorbance spectra of DDAB/Cy/water RM systems
in the FIR region measured with FTIR spectroscopy: (A) spectra of different
w0 values at 20°C, (B) spectra at different temperatures of three
representative RM systems and spectrum of water at 20°C in an adjusted
scale. The inset of (A) shows the relative absorbance intensity between the
libration peak and the intermolecular H-bond stretching peak.
Figure 4.6A shows the FIR difference absorbance spectra of DDAB/Cy/water RM
systems at 20°C. The absorbance significantly increases with increasing } in the entire
investigated frequency range. For all RM systems, there are an absorbance band around
180 cm-1 and a high absorption region above 500 cm-1. This is similar to the absorption
spectrum of water (Figure 4.6B). However, the band around 180 cm-1 is red shifted
compared to that of water which appears at around 200 cm-1. The relative absorbance
intensity between the libration peak (at 600 cm-1) and the intermolecular H-bond
stretching peak (at 180 cm-1) at 20°C is shown in the inset of Figure 4.6A. In water, the
absorbance intensity of the libration peak is 2.4 times higher than that of the
intermolecular H-bond stretching peak. The ratio is relatively higher for the RM
systems. It is 2.9 for } � 10 and increases to 3.4 for } � 2. Figure 4.6B shows the

4. Water in reverse micelles
54
temperature dependent FIR spectra for three representative RM systems. For
comparison, a spectrum of water at 20°C in an adjusted scale was plotted. With
increasing temperature, the absorbance slightly increases in the frequency range below
400 cm-1. In the region of the libration band, the absorbance slightly decreases with
temperature, especially at high } .
4.4.2 MIR spectra
Figure 4.7: Difference absorbance spectra of DDAB/Cy/water RM systems
in the MIR region: (A) spectra of different w0 values at 20°C, (B) spectra at
different temperatures of three representative RM systems. The absorbance
of the RM systems increases with increasing w0 and decreases with
increasing temperature.
Figure 4.7A shows the difference absorbance spectra of DDAB/Cy/water RM systems
at 20°C in the MIR frequency range from 3000 to 3700 cm-1. The difference absorbance
spectra correspond to the absorbance due to the water molecules present in the RM
systems. It is observed that the absorbance strongly increases with increasing } . Figure
4.7B shows the temperature dependent MIR spectra for three representative RM
systems. The absorbance decreases with increasing temperature for all RM systems and
the change is more significant at higher } .
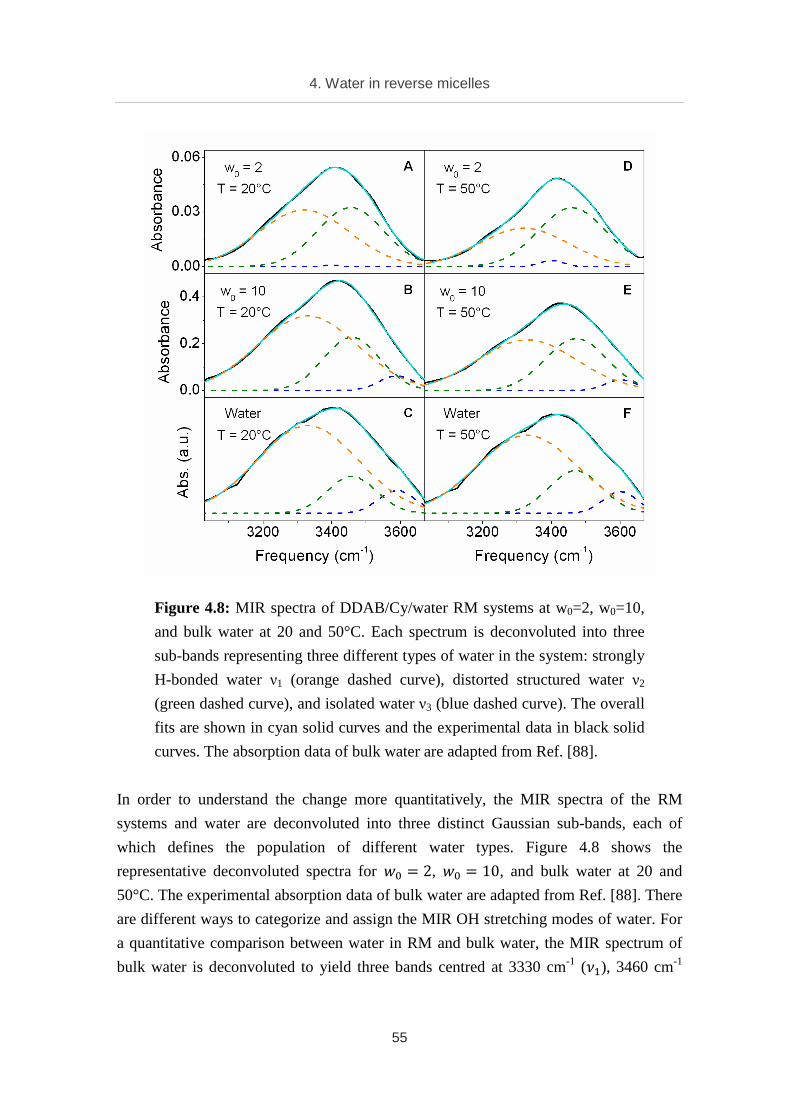
4. Water in reverse micelles
55
Figure 4.8: MIR spectra of DDAB/Cy/water RM systems at w0=2, w0=10,
and bulk water at 20 and 50°C. Each spectrum is deconvoluted into three
sub-bands representing three different types of water in the system: strongly
H-bonded water ν1 (orange dashed curve), distorted structured water ν2
(green dashed curve), and isolated water ν3 (blue dashed curve). The overall
fits are shown in cyan solid curves and the experimental data in black solid
curves. The absorption data of bulk water are adapted from Ref. [88].
In order to understand the change more quantitatively, the MIR spectra of the RM
systems and water are deconvoluted into three distinct Gaussian sub-bands, each of
which defines the population of different water types. Figure 4.8 shows the
representative deconvoluted spectra for } � 2, } � 10, and bulk water at 20 and
50°C. The experimental absorption data of bulk water are adapted from Ref. [88]. There
are different ways to categorize and assign the MIR OH stretching modes of water. For
a quantitative comparison between water in RM and bulk water, the MIR spectrum of
bulk water is deconvoluted to yield three bands centred at 3330 cm-1 (A), 3460 cm-1

4. Water in reverse micelles
56
(�) and 3590 cm-1 (�). These bands correspond to strongly H-bonded, distorted
structured and isolated water molecules, respectively [88, 89]. The spectra of the RM
systems are also deconvoluted into three sub-bands with three fixed peak positions
similar to those of bulk water. With this way, the information on the relative change in
contribution of each sub-bands compared to those of water is obtained. For the RM
system at } � 2, no peak can be found in the region around 3590 cm-1, instead a weak
peak centred at 3400 cm-1 is observed. For the other RM systems, the absorbance
spectra can be fitted well using the peak positions of bulk water.
Figure 4.9: Fraction of area under the curve for the deconvoluted sub-bands
as described in Figure 4.8 as a function of w0 at four temperatures (the
colors blue, green, yellow, orange respectively represent the data at 20, 30,
40, 50°C). ν1 and ν2 represent the sub-bands centred at 3330 and 3460 cm-1.
ν3 represents the sub-band centred at 3400 cm-1 for w0=2 and at 3590 cm-1
for other RM systems. The corresponding values for water at 20 and 50°C
are shown in hollow symbols for comparison.
Figure 4.9 shows the integrated area of each band relative to the total area as a function
of } at four different temperatures. This relative contribution is assumed to be
proportional to the relative abundance of that particular type of water molecules (A, �
or �) present in the systems. For all RM systems and water, the population of isolated

4. Water in reverse micelles
57
water molecules (�) is low (less than 10%) and does not change considerably with
temperature and } . The population of strongly H-bonded water (A) is the most
abundant (about 60%). With increasing temperature, the population of � (distorted
structured water) increases while that of A decreases. A reverse behavior is observed
with increasing } : the population of � decreases while that of A increases. For the
RM systems at low } , A is less abundant and � is more abundant compared to those
of bulk water. The population distribution resembles those of bulk water at } � 7.5.
4.5 Discussion and conclusion
The observed decrease in the hydrodynamic diameter %� with increasing temperature
(Figure 4.3) of DDAB/Cy/water RM systems is markedly different from the observation
in AOT/hydrocarbon/water RM systems in which %� either remains unchanged or
increases gradually with increasing hydration } and temperature [90, 91]. With
increasing temperature, the droplet size decreases, indicating a transition towards
smaller aggregates. This change in the aggregate size is associated with a corresponding
modification of the elastic property of the surfactant interfacial layer. Using DLS
technique to determine %� of DDAB RM systems is not straightforward as the shapes of
the droplets are not spherical at lower hydration. A previous study of these RM systems
using SANS technique revealed that the system exhibits a cylindrical structure at low
hydration (2 � } � 8) with a length varying from 14 to 20 nm and a radius varying
from 1.5 to 1.6 nm [78]. At increased hydration (} � 10), spherical aggregates with
diameter of about 6 nm are formed. The conventional determination of the size by the
fitting of autocorrelation data assumes that the dispersed particles are spherical. For
cylindrical dispersions the fitting will yield larger sizes. This explains the decrease of
%� of DDAB RM systems with } � 10 compared to that with } � 10 at 20°C.
The investigated frequency range from 0.4 to 1.4 THz of the THz-TDS probes the
intermolecular water network vibrations [30, 92]. In this frequency range, the absorption
coefficient L�� of Cy is negligible (0-0.5 cm-1), while L�� of water is very high (150-
300 cm-1) [93, 94]. This explains the observed increase of L�� with increasing }
(Figure 4.4). These results are in good agreement with the studies of confined water in
water-1,4-dioxane mixtures and water-methanol mixtures [69, 95]. Previous studies of
AOT/heptane/water RM systems using THz-TDS found a large THz absorption
resonance of water confined within the RM which is absent in bulk water [96, 97]. An

4. Water in reverse micelles
58
increase in L�� with increasing } was also observed in these studies. The plots of the
integrated absorption coefficient � L Z in the frequency range from 0.4 to 1.4 THz
show that � L Z increases with increasing temperature for all RM systems. This
behavior is similar to that of water. The absorption contribution of Cy in the RM
systems is negligible as � L Z of Cy is negligible and unchanged with temperature. The
temperature dependent behavior of � L Z of the RM systems is dominated by the THz
absorption of water. With increasing } , � L Z approaches that of water, resulting
from the increasing contribution of water.
In the investigated FIR frequency range, water has two characteristic bands around 200
cm-1 and 600 cm-1 (Figure 4.6B). The band around 200 cm-1 is assigned to the
intermolecular H-bond stretching vibrations, and the one around 600 cm-1 is assigned to
the librational motions [9, 68]. For all studied RM systems, both bands are present
(Figure 4.6A), confirming the presence of an intermolecular water network even at low
} . This agrees well with the anticipated cylindrical structure of the RM at low
hydration. The band arising from the intermolecular H-bond stretching vibrations of
water in RM systems (around 180 cm-1) is significantly red shifted compared to that of
bulk water (around 200 cm-1), especially at low } . This is attributed to a perturbation
of the water H-bonded network by the inhomogeneous H-bonding of water molecules
with the interface. A similar red shift was also observed in AOT RM systems and was
attributed to the weakening of H-bond in the bound water region due to significant
interfacial interaction and high degree of orientation relative to the surface head group
[98, 99]. With increasing hydration, both peak positions show only a very small shift,
indicating the weak dependence of the H-bond network on the surface geometry. In
contrast, a stronger shift of the libration peak was found with increasing hydration in
AOT RM systems, and at } � 40, the peak approaches that of bulk water [99]. In the
present study, the ratio between the absorbance intensity of the libration peak and the
intermolecular H-bond stretching peak of the RM systems at low } is significantly
higher than that of bulk water (inset of Figure 4.6A), showing a modification of the
collective H-bond network. With increasing temperature, the peaks undergo a
progressive red shift (Figure 4.6B). This is due to the weakening of H-bonding resulting
from the large thermal fluctuation upon increasing the temperature [100].
The measurement results of DDAB/Cy/water RM systems in the MIR (Figure 4.9) show
a low fraction of isolated water (�) and a high fraction of strongly H-bonded water
(A). This observation is comparable to the results obtained for anionic AOT RM [101,

4. Water in reverse micelles
59
102], and nonionic RM [103, 104]. The difference in the abundance of different water
types in DDAB RM compared to those of bulk water indicates the inhomogeneity in
bonding of water molecules with the RM interface. At low hydration, water molecules
in contact with the surface are dominating. This can be correlated with the observed
higher abundance of distorted H-bond network water (higher population of �). With
increasing hydration, stronger H-bonds between water molecules start building and the
population of A reaches that of bulk water. Similar structural evaluation of water has
previously been observed in conventional RM systems with increasing } [102, 104].
With increasing temperature, the population of � increases gradually, which is
compensated by the decrease of the population of A. This observation is rather intuitive
as increased thermal energy disrupts a fraction of H-bond water network. The
interconversion of different water types can be correlated with the temperature
dependence of solvent relaxation dynamics.
The experimental results obtained from time resolved fluorescence spectroscopy for the
same RM systems showed that the average solvation time constants of the fluorophore
Coumarin-500 in the RM systems are in the order of a few hundred ps [71]. These
values are about an order of magnitude slower than those of bulk water [105], showing
a retardation of water dynamics in the RM. The slow relaxation dynamics is attributed
to a confinement effect on water dynamics in the RM, similar to what has been
observed in conventional RM systems [90]. In all studied RM systems, the average
solvation time constants decrease with increasing } and temperature, irrespective of
the transition from cylindrical structure (large radius of curvature) to discrete droplet
structure (small radius of curvature). The results also indicated that the bound water
layer at the DDAB interface decreases with increasing water concentration, similar to
the observed behaviors in conventional spherical AOT RM systems [90]. This explains
the accelerated solvation dynamics with increasing } in spite of the decreasing size.
These observations indicate that it is the load of water rather than the surface geometry
determines the water structure and dynamics.
The DDAB/Cy/water RM systems undergo a transition from connected cylindrical
structures at low } to discrete spherical droplets at high } . The structural change
directly results in modifications of the elastic properties and curvature of the surfactant
monolayer [106]. These RM systems offer a wide range of surface geometries at
different } and temperatures. Both THz-TDS and FIR-FTIR studies showed that the
collective H-bond network in water adopts a bulk like configuration with increasing }

4. Water in reverse micelles
60
and temperature. MIR-FTIR measurements found that the population of strongly H-
bonded water molecules (A) increases, while that of the distorted structured water
molecules (�) decreases with increasing } to reach a value comparable to those of
bulk water. In summary, this study reveals a significant change of the water dynamics
with changes in hydration and temperature. However, these changes are independent of
the topological curvature.
61
5 Water in organic solvents
In this chapter, the structure, dynamics and activity of water in the mixtures of water
and 1,4-dioxane (Dx) were investigated using FTIR spectroscopy, THz-TDS, and
kinetics of the solvolysis reactions of benzoyl chloride (BzCl). Dx can expose non-
interacting hydrophobic sites to water molecules as well as form H-bonds with water. In
water-Dx mixtures with low water content, the water-water H-bond network is
disrupted, which resembles the conditions of isolated or confined water molecules with
fewer interactions to other water molecules. The evolution of water H-bond collective
network was studied as the mole fraction of water increased. The presented results are
partially published in Ref. [69].
5.1 Water confined in 1,4-dioxane
The attractive H-bond interactions in water lead to its unique properties, which makes
water an essential partner in a wide range of chemical and biological processes [7, 107].
In hydrophobic environments, water forms clathrate clusters of 2-10 water molecules, in
which entropy and van der Waals forces are thought to play a crucial role [108, 109].
The interaction of polar water molecules with a hydrophobic surface influences the
dynamics of water molecules. H-bond dynamics in bulk water and in water near
hydrophobic molecules have been intensively studied with different techniques, such as
vibrational spectroscopy [110], Raman spectroscopy [111], and MD simulations [112].
However, very little is known about the cooperativity and microheterogeneity in mixed
solvents on a molecular level.
Dx (C4H8O2) is a colorless heterocyclic organic compound. In addition to the most
popular isomer Dx, there are two further rare isomers: 1,2-dioxane and 1,3-dioxane. Dx
is centrosymmetric and has a chair conformation (Figure 5.1), which is similar to the
structure of cyclohexane [113]. The oxygen atoms of Dx are Lewis basic, which makes
it capable to dissolve several inorganic compounds. Dx is a liquid at ambient condition
and can be used as a solvent. Dx is nonionic and relatively nonpolar, but can solubilize
water from highly diluted to highly concentrated mixtures and can expose a substantial

5. Water in organic solvents
62
number of non-interacting sites (hydrophobic segments) to water molecules.
Furthermore, Dx molecules are capable of forming H-bonds with water, which are
weaker than the corresponding water-water H-bonds [114]. This water-Dx bond
formation competitively replaces the water-water H-bonds. In water-Dx mixtures with
highly diluted concentration of water, the three-dimensional water-water H-bond
network is disrupted. This condition resembles that of isolated water molecules with
fewer interactions to other water molecules (Figure 5.1). Therefore, water-Dx mixtures
provide an opportunity to study properties of nearly isolated water molecules which
hardly interact with other water molecules.
Figure 5.1: Structure of Dx (left) and schematic of water molecules
confined in Dx solvent (right). Dx is centrosymmetric, has a chair
conformation, and can form H-bonds with water. In water-Dx mixtures with
highly diluted concentration of water, water-Dx H-bonds partially replace
water-water H-bonds, disrupting the three-dimensional water-water H-bond
network and stimulating the formation of isolated water molecules.
Different techniques have been used to study water-Dx mixtures, such as IR
spectroscopy [115, 116], NMR [117], time resolved fluorescence spectroscopy [118],
and dielectric relaxation [119, 120]. A dielectric relaxation study in the frequency range
of 0.1-10 GHz showed that the formation of cyclic water structures was found at high
water concentrations (mole fraction of water X� Z 0.83) [120]. However, a more recent
study using a wider range of frequencies reported the cooperative network relaxation at
very low water concentrations [119]. A near infrared study identified three different
species of water molecules in Dx and suggested that these form 0, 1 and 2 H-bonds

5. Water in organic solvents
63
[116]. A recent femtosecond resolved fluorescence spectroscopic study reported very
fast dynamics of water molecules in small water clusters at low X� and slower water
dynamics for higher water concentrations (X� � 0.2) [118]. Using dynamic light
scattering technique, this study also observed a gradual increase of the water cluster size
with increasing X�. The structure and H-bonds of water molecules have been studied
using IR spectroscopy. Symmetric and asymmetric OH stretching bands of water
molecules are found in the frequency range from 3000 to 3700 cm-1 [121]. Coupled
bending and librational motions are characterized around 2100 cm-1, and bending modes
around 1650 cm-1 [9]. Further bands of water in the FIR region are found around 600
cm-1 (libration) and 200 cm-1 (intermolecular hydrogen bond stretching vibrations) [9,
122]. Recently, a combined THz spectroscopy and MD simulation study reported the
collective nature and delocalized character of these low frequency modes of water
which involve correlated particle motions extending several hydration shells [123].
In this study, different concentrations of water in water-Dx mixtures were measured.
The formation of water network upon increasing of water contents in water-Dx mixtures
was studied using FTIR spectroscopy in the FIR and MIR regions. The slow and fast
water dynamics were investigated by using dielectric relaxation data obtained from
THz-TDS measurements. The activity of water is determined by measuring the kinetics
of the solvolysis reactions of BzCl. By investigating the evolution from weakly to
strongly bonded water cluster in Dx, this study aimed to find explanations to three
different aspects: how the water structure changes with X�, how this change in the
structure is related to the water dynamics, and how these changes in dynamics affect the
activity of water. Dx and BzCl were purchased from Sigma Aldrich at 99% or higher
purity and were used as received. Water-Dx mixtures were prepared by dissolving water
in Dx. Water concentration is expressed in terms of mole fraction of water (X�).
5.2 FTIR spectra
FTIR spectra were measured using a VERTEX 80v FTIR spectrometer (Bruker Optics).
The details of this system are described in Chapter 2. All measurements were carried
out at �20 � 0.2�°C under nitrogen gas flow in the sample compartment. The liquid
samples were placed in a liquid cell (model A145 of Bruker Optics). Diamond windows
were used for FTIR measurements in the FIR region while z-cut quartz windows were
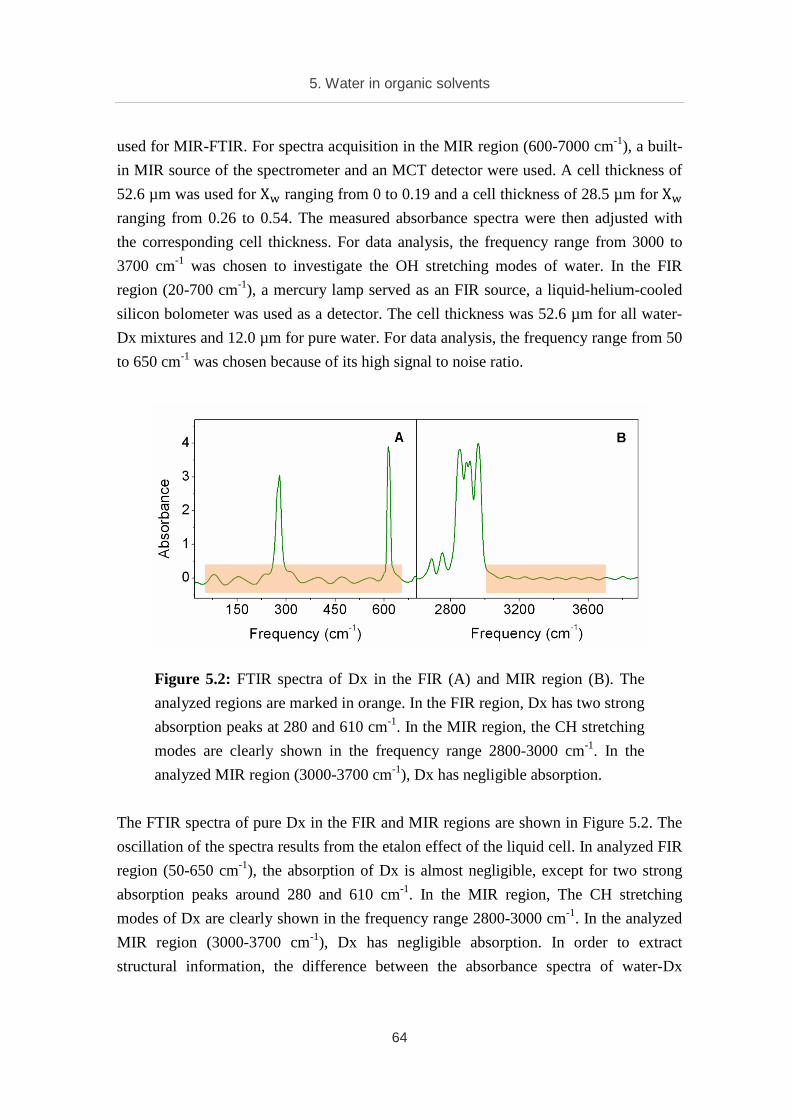
5. Water in organic solvents
64
used for MIR-FTIR. For spectra acquisition in the MIR region (600-7000 cm-1), a built-
in MIR source of the spectrometer and an MCT detector were used. A cell thickness of
52.6 µm was used for X� ranging from 0 to 0.19 and a cell thickness of 28.5 µm for X�
ranging from 0.26 to 0.54. The measured absorbance spectra were then adjusted with
the corresponding cell thickness. For data analysis, the frequency range from 3000 to
3700 cm-1 was chosen to investigate the OH stretching modes of water. In the FIR
region (20-700 cm-1), a mercury lamp served as an FIR source, a liquid-helium-cooled
silicon bolometer was used as a detector. The cell thickness was 52.6 µm for all water-
Dx mixtures and 12.0 µm for pure water. For data analysis, the frequency range from 50
to 650 cm-1 was chosen because of its high signal to noise ratio.
Figure 5.2: FTIR spectra of Dx in the FIR (A) and MIR region (B). The
analyzed regions are marked in orange. In the FIR region, Dx has two strong
absorption peaks at 280 and 610 cm-1. In the MIR region, the CH stretching
modes are clearly shown in the frequency range 2800-3000 cm-1. In the
analyzed MIR region (3000-3700 cm-1), Dx has negligible absorption.
The FTIR spectra of pure Dx in the FIR and MIR regions are shown in Figure 5.2. The
oscillation of the spectra results from the etalon effect of the liquid cell. In analyzed FIR
region (50-650 cm-1), the absorption of Dx is almost negligible, except for two strong
absorption peaks around 280 and 610 cm-1. In the MIR region, The CH stretching
modes of Dx are clearly shown in the frequency range 2800-3000 cm-1. In the analyzed
MIR region (3000-3700 cm-1), Dx has negligible absorption. In order to extract
structural information, the difference between the absorbance spectra of water-Dx

5. Water in organic solvents
65
mixtures and the absorption spectrum of pure Dx were calculated. This helps to remove
the etalon effect of the spectra. At the regions around 280 and 610 cm-1 where Dx has
strong absorption peaks, the resulting difference absorbance spectra were smoothed to
ensure that they follow a continuous trend of the spectra before and after these regions.
The obtained difference absorbance spectra are attributed solely to the partial
contribution of water in water-Dx mixtures. In the following parts, all presented spectra
of water-Dx mixtures are the difference absorbance spectra.
Figure 5.3: Difference absorbance spectra of water-Dx mixtures in the FIR
region with Xw of 0.005, 0.02, 0.05, 0.11, 0.19, 0.32, 0.42, 0.49 and 0.54
(from bottom to top). The spectrum of water (dashed line) in an adjusted
scale is shown for comparison. The dotted lines are the deconvoluted
spectra of the water spectrum with two peaks centred at 200 and 600 cm-1.
The arrow marks the progressive blue shift of the libration peak with
increasing water content. The inset shows relative absorbance compared to
water for the intermolecular H-bond stretching peak and the libration peak.
Figure 5.3 shows the FIR difference absorbance spectra of water-Dx mixtures and the
spectrum of bulk water in an adjusted scale. The spectrum of bulk water was
deconvoluted into two separate peaks centred at 200 and 600 cm-1, representing two
characteristic peaks around these regions. The peak around 200 cm-1 is assigned to the

5. Water in organic solvents
66
intermolecular H-bond stretching vibrations, while the one around 600 cm-1 is assigned
to the librational motions [9, 68]. For water-Dx mixtures at low water concentrations
(X� � 0.1), an absorption peak centred at 450 cm-1 (libration peak) is found while
almost no peak can be seen around 200 cm-1. With increasing X�, the libration peak
shows a progressive blue shift, and for X� � 0.54, the spectrum has the libration peak
near 600 cm-1, similar to that of bulk water. The inset of Figure 5.3 shows the relative
absorbances of water-Dx mixtures (measured at the peak) compared to that of bulk
water (measured at the peak) in the region of the intermolecular stretching and libration
peaks. Both of the relative absorbances increase with increasing X� and the change is
more significant when X� exceeds 0.1. The relative absorbance of the libration peak is
always higher than that of the intermolecular H-bond stretching peak.
Figure 5.4: (A) MIR difference absorbance spectra of water-Dx mixtures
and water. The data of water are adapted from Ref. [9] and plotted in an
adjusted scale. The spectra of water-Dx mixtures are blue shifted compared
to the spectrum of water. (B) Deconvoluted spectra of water in MIR region
with two Gaussian sub-bands centred at 3470 cm-1 and 3280 cm-1.
The MIR difference absorption spectra of the water-Dx mixtures in the frequency range
of 3000-3700 cm-1 are shown in Figure 5.4A. The spectrum of bulk water in an adjusted
scale is also plotted for comparison. The absorbance data of bulk water is adapted from
a previous study [9]. This region probes the intramolecular OH stretching modes of
water in the samples. Therefore, the absorbance intensity is roughly proportional to
water content. At low X�, the MIR spectra are clearly blue shifted compared to the

5. Water in organic solvents
67
spectrum of water. With increasing X�, the MIR spectra get higher and also closer to
the water spectrum. There are different ways to categorize and assign the MIR OH
stretching modes of water. In water-Dx mixtures, water molecules also participate in H-
bonds with Dx, giving rise to several OH stretching modes in the MIR region. As a
result, the partial contribution of bulk-like OH stretches decreases. For a quantitative
comparison between water in water-Dx mixtures and bulk water, the MIR spectrum of
bulk water is deconvoluted into two Gaussian sub-bands centred at 3470 and 3280 cm-1
with comparable intensity as shown in Figure 5.4B. These bands are respectively
assigned to the OH stretch of water arising from weak and strong H-bond
conformations.
Figure 5.5: MIR difference absorbance spectra of four representative water-
DX mixtures and their deconvoluted Gaussian sub-bands. The spectra with
Xw of 0.005 (A) and Xw of 0.05 (B) are deconvoluted into three different
bands centred at 3585, 3505 and 3470 cm-1. For Xw of 0.19 (C) and 0.49
(D), the spectra are deconvoluted into four different bands with one more
band centred at 3280 cm-1.

5. Water in organic solvents
68
In order to achieve a more quantitative understanding, the spectra of water-Dx mixtures
are deconvoluted into Gaussian sub-bands. At low water concentration (X� � 0.1), the
MIR spectra are properly decomposed into three bands centred at 3585, 3505 and 3470
cm-1 (Figure 5.5A, B). At higher water concentrations (X� � 0.1), the spectra can only
be fitted with an additional band centred at 3280 cm-1 which arises from bulk-like water
having strong H-bonds with the nearby water molecules (Figure 5.5C, D). The band at
3470 cm-1 is assigned to an OH stretch of water molecules which have weak H-bond to
the nearby water molecules. The bands at 3585 and 3505 cm-1 are attributed to
vibrational bands of water molecules that share H-bonds with Dx.
Figure 5.6: Fraction of area under the curve for the deconvoluted bands
centred at 3585, 3505, 3470 and 3280 cm-1 as described in Figure 5.5. A
significant change is observed when Xw exceeds 0.1.
Figure 5.6 shows the partial contributions of the deconvoluted bands centred at 3585,
3505, 3470 and 3280 cm-1 as a function of X�. The contributions are represented by the
respective areas of each curve. This plot correlates the relative population of different
water species present in water-Dx mixtures. The contribution of the band at 3585 cm-1
decreases first slowly and then rapidly with increasing X� while a reverse behavior is
observed for the band at 3470 cm-1. For X� � 0.1, the band at 3280 cm-1 appears and its
contribution grows gradually with X�. The contribution of the band at 3505 cm-1 starts
to decrease at X� � 0.1 and is very low at higher X�.

5. Water in organic solvents
69
5.3 THz-TDS spectra
The dynamics of water in water-Dx mixtures was investigated with THz-TDS in the
frequency range from 0.4 to 1.4 THz (13-45 cm-1). The details of this system are
described in Chapter 2. All THz measurements were carried out under thermal
equilibration with humidity at �5 � 0.1�% and temperature at �20 � 0.2�°C. The liquid
samples were placed in a liquid cell (model A145 of Bruker Optics). Because of high
water absorption in the THz frequency range, the cell thicknesses were varied
depending on water contents in water-Dx mixtures to guarantee the penetration of the
THz pulse. The cell thickness of 1.54 mm was used for X� ranging from 0 to 0.05, 1.03
mm for X� from 0.023 to 0.26, and 0.21 mm for X� from 0.11 to 0.54. The overlaps of
X� range in different cell thicknesses serve as a calibration tool to ensure correct
spectral comparison for the entire concentration range.
Figure 5.7: Spectra of water and Dx measured with THz-TDS: (A) index of
refraction, (B) absorption coefficient, (C) real dielectric constant, (D)
imaginary dielectric constant. The values of all these parameters of Dx are
significantly lower than those of water in the entire frequency range.

5. Water in organic solvents
70
From a measurement with THz-TDS, the electric field of the THz beam as a function of
time ������� is recorded. A fast Fourier transformation of ������� yields the frequency
dependent power and phase of the transmitted pulse. Subsequently, the frequency
dependent index of refraction (�), absorption coefficient (L), real dielectric constant (��) and imaginary dielectric constant (���) can be deduced [28]. Figure 5.7 shows the THz
spectra of these four values of pure water and pure Dx in the representative frequency
range from 0.5 to 1.1 THz. All spectra of Dx are significantly below the corresponding
ones of water. The absorption coefficient L (Figure 5.7B) and the imaginary dielectric
constant ��� of Dx (Figure 5.7D) are almost negligible.
Figure 5.8: Frequency and concentration dependent index of refraction n
(A) and absorption coefficient α (B) of water-Dx mixtures. Both n and α
increase with increasing water contents. (C) and (D) show the measured and
calculated (for ideal mixtures) n and α for water-Dx mixtures as a function
of Xw at the frequency of 1 THz. A deviation between the measured and
calculated data is observed.
5. Water in organic solvents
71
Figure 5.8A shows the frequency dependent index of refraction ��� and Figure 5.8B
shows the frequency dependent absorption coefficient L�� of water-Dx mixtures in the
frequency range from 0.4 to 1.4 THz. As observed from the figure, ��� decreases
while L�� increases with increasing frequency. Both ��� and L�� increases with
increasing water content. In order to check if the change of ��� and L�� is only by the
difference in water contents or also by other effects, it is necessary to compare the
measured data with the calculated data when assuming that the mixtures are ideal ones
(no enthalpy or volume change upon mixing). For an ideal mixture of two components,
the index of refraction and the absorption coefficient can be calculated using the
following relation [95]:
�)K����� � ������)K��� ~�A�A�� � ������� (5.1)
where � is the index of refraction or the absorption coefficient, � is the volume fraction,
the indices 1 and 2 represent the components 1 and 2 in the mixture, ����� is the density
of the real mixture, �)K��� is the density of mixture with assumption that the components
behave ideally when being mixed to form the mixture. The ratio �����/�)K��� is included
to account for small non-idealities in the mixture volume upon mixing. Figure 5.8C
shows the measured and calculated ��� and Figure 5.8D shows the measured and
calculated L�� of water-Dx mixtures at different X� values at the frequency of 1 THz.
A considerable deviation between the measured and calculated data is observed.
Further to the obtained ��� and L��, dynamic properties of a liquid can be deduced
by analyzing its dielectric relaxation. One of the most commonly used models to
describe dielectric relaxation is the Debye model. This model describes the dynamics in
terms of collective, diffusive, re-orientational motions and has extensively been used for
pure liquids and liquid mixtures [28, 124]. The Debye model describes the dielectric
relaxation as follows:
�̂�� � �- � < �� $ ��,A1 � R2��:�BA (5.2)
where, is the frequency, �̂�� is the frequency dependent complex dielectric constant, �A � �! is the static dielectric constant, �� is dielectric constant for the �-th relaxation

5. Water in organic solvents
72
process, �:,A � �- is the extrapolated value for high frequency, �� is the relaxation time
of the �-th process, and � describes the number of relaxation processes which are taken
into account. The Debye model with � � 1 is the simplest case which assumes that a
single relaxation time provides an adequate description. The magnitudes of the induced polarizations are given by the dispersion amplitudes S� � �� $ ��,A. In most of the
cases, the dielectric spectra can be adequately fitted by two independent relaxation
processes (double Debye relaxation fitting with � � 2) with the equation:
�̂�� � �- � �! $ ��1 � R2�A � �� $ �-1 � R2�� (5.3)
Table 5.1: Double Debye relaxation fitting parameters for water-Dx
mixtures at different water contents.
X� �- �! �� �A �ps� �� �ps� SA S�
0.005 2.12 2.24 2.20 0.573 0.086 0.04 0.08
0.009 2.12 2.27 2.21 0.793 0.090 0.06 0.09
0.014 2.12 2.30 2.21 1.01 0.090 0.09 0.10
0.019 2.12 2.34 2.22 1.42 0.10 0.12 0.10
0.023 2.12 2.37 2.22 1.72 0.10 0.15 0.10
0.034 2.13 2.46 2.24 1.83 0.11 0.22 0.11
0.05 2.13 2.54 2.24 1.95 0.11 0.29 0.11
0.07 2.13 2.67 2.26 2.19 0.11 0.41 0.13
0.11 2.13 2.98 2.30 2.59 0.12 0.68 0.17
0.19 2.13 3.85 2.38 4.05 0.12 1.47 0.25
0.26 2.14 4.45 2.49 5.74 0.12 1.96 0.35
0.32 2.18 5.57 2.58 6.56 0.13 2.99 0.40
0.42 2.21 7.73 2.71 7.39 0.12 5.02 0.50
0.49 2.25 9.71 2.82 7.90 0.13 6.89 0.57
0.54 2.29 11.7 2.92 8.13 0.13 8.78 0.63

5. Water in organic solvents
73
This double Debye model was used to fit the dielectric constants of water-Dx mixtures
measured with THz-TDS. The fitted parameters are summarized in Table 5.1. With
increasing X�, the high frequency dielectric constant �- is almost constant while the
dielectric constant of the second relaxation process �� increases slightly. The static
dielectric constant �! increases considerably from 2.24 at X� � 0.005 to 11.7 at
X� � 0.54. With increasing water content, the slow relaxation time constant �A exhibits
significant increase while the fast relaxation time constant �� undergoes marginal
change.
Figure 5.9: Frequency dependent dielectric constant spectra of water-Dx
mixtures with the real part (A) and the imaginary part (B). The solid lines
represent the double Debye relaxation fitting. The fitted spectra match well
with the experimental spectra. On the right are the fitted Debye relaxation
time constant (C) and the related relaxation strength (D) as a function of
water contents. An onset occurs when Xw exceeds 0.1.

5. Water in organic solvents
74
The measured and fitted data of the dielectric constants at different frequencies are
shown in Figure 5.9A for the real part �� and Figure 5.9B for the imaginary part ���. The
fitted spectra match rather well with the experimental spectra, confirming that the
double Debye model is suitable to fit the measured dielectric constants of water-Dx
mixtures. Similar to the index of refraction and the absorption coefficient, �� and ��� increase with increasing water contents, which results from the lower �� and ��� of Dx
compared to those of water as shown in Figure 5.7. Figure 5.9C shows the change of �A
as a function of X�. At low water contents in water-Dx mixtures (X� � 0.1), �A values
are very small compared to that of bulk water. The values increase from 0.6 to 2.5 ps
when X� increases from 0.005 to 0.1. At higher water contents (X� � 0.1), �A increases
very rapidly and at high concentration of water (X� � 0.54), �A reaches 8.13 ps, which
is comparable to the value of water [28]. Figure 5.9D shows the strength parameter SA
(SA � �! $ ��) which represents the strength of the cooperative relaxation process of the
H-bond network (the process with the time constant �A). Similar to the plot of �A in
Figure 5.9C, the plot of SA also shows an onset of the intensity when X� exceeds 0.1.
5.4 Kinetics of solvolysis reactions of benzoyl chloride
The activity of water in water-Dx mixtures was investigated by measuring the kinetics
of BzCl solvolysis reaction in each mixture. The kinetics of BzCl solvolysis reaction
was determined by the temporal change in the absorbance of BzCl monitored at 288 nm
using a Shimadzu UV-2450 spectrophotometer. The rate of the reaction was calculated
using a first order exponential fit of the absorbance data. The initial BzCl concentration
was kept constant at 10 µM. Kinetic measurements were carried out in a quartz cuvette
of 1 cm path length. The change of the structure and dynamics of water in water-Dx
mixtures possibly influences its reactivity. A solvolysis reaction is a nucleophilic
substitution where the nucleophile is a solvent molecule. The nucleophilic substitutions
proceed by either S 1 or S 2 mechanism. S 1 reaction involves slow bond breaking to
give an intermediate carbocation or an ion pair which can react rapidly with the
nucleophile. S 2 reaction involves concerted bond making and breaking [125]. In this
study, the solvolysis reaction of BzCl with water was used to investigate the water
activity in the mixtures. This experiment was carried out by the collaborators at S.N.
Bose National Centre for Basic Sciences (Kolkata, India).

5. Water in organic solvents
75
Figure 5.10: Schematic of the solvolysis reaction of BzCl in water-Dx
mixtures. The mechanism of the nucleophilic substitutions is either SN1
(upper path) or SN2 (lower path).
Figure 5.10 shows a schematic of the solvolysis reaction of BzCl in water-Dx mixtures.
The solvolysis reaction of BzCl is an essentially nucleophilic solvent assisted reaction,
in which there is possibly a complicated competition between S 1 and S 2
mechanisms. Depending upon the environment, C-Cl bond breakage and formation of
acylium cation serves as the rate determining step (S 1 mechanism), or nucleophilic
attack of water acts as the rate determining step (S 2 mechanism) [126]. In confined or
microheterogeneous environment the solvolysis reaction of BzCl exhibits an
intermediate mechanism and either of the two mechanisms or both can play important
roles depending upon the environmental condition. A clear separation between SN1 and
SN2 mechanisms of the solvolysis reaction is difficult because of the gradual nature of
the transition when the ionic character of the transition state changes [125].
Figure 5.11 shows the concentration dependent kinetic results of BzCl solvolysis
reaction in water-Dx mixtures. The inset shows the normalized time dependent
absorbance decay of six representative mixtures. As observed from the figure, the
reaction rate is very slow at the low X� region. For X� � 0.1, the rate constant 0 is
about 10'¡ s'A. For X� � 0.1, the reaction rate increases significantly with increasing
water content, and at X� � 0.54, 0 reaches 4.3 · 10'¢ s'A.

5. Water in organic solvents
76
Figure 5.11: Concentration dependent rate constant of the solvolysis
reaction of BzCl in water-Dx mixtures. The normalized time dependent
absorbance decay is shown in the inset at six different Xw of 0.02 (1), 0.05
(2), 0.11 (3), 0.19 (4), 0.32 (5) and 0.54 (6). This experiment was carried out
by the collaborators at S.N. Bose National Centre for Basic Sciences in
India.
5.5 Discussion and conclusion
The FIR spectra of water-Dx mixtures show a progressive blue shift of the water
libration peak with increasing water content X� (Figure 5.3). Similar behavior was
previously observed in water-acetone and water-acetonitrile spectra [95]. In this study,
the most pronounced effect for both mixed systems was observed in the samples with
low content of water. For mixtures with X� � 0.47 (about 10% volume of water), the
maximum peak position was found around 500 cm-1. The H-bond character also
influences the shape and position of the spectrum. In a binary aqueous mixture, the
number of water molecules that act as H-bond donors is nearly independent of the
concentration while the number of water molecules that serve as H-bond acceptors
decreases rapidly with decreasing the water content [127]. In the water diluted region,
more and more water molecules become H-bond donors to solvent molecules [95]. For

5. Water in organic solvents
77
X� � 0.2, only a small fraction of water molecules have H-bonds to more than two
water molecules because water molecules bind preferentially weaker H-bonds with
solvent molecules. An increase in the number of weak H-bonds results in a shift of the
libration peak to lower frequency. A recent simulation study revealed that the low
frequency modes correspond to collective particle motions with a correlation on the
range longer than 7 Å [123]. The absence of the intermolecular collective vibration
mode at 200 cm-1 in the highly water diluted region can be explained by the absence of
water H-bond network. With increasing water concentration to X� � 0.1, a shoulder
starts to appear around 200 cm-1 and the relative absorbance of the intermolecular H-
bond stretching peak starts to increase (inset of Figure 5.3). This indicates an onset of
the H-bond network dynamics.
In the MIR region, the absorbance spectra of water-Dx mixtures are blue shifted
compared to the spectrum of water (Figure 5.4). This behavior agrees well with the
previous studies for water-Dx and water-acetonitrile mixtures which showed a
progressive blue shift of the OH stretching band with decreasing water content for both
mixtures [115]. When the spectra were deconvoluted to investigate the relative
population of different water species present in water-Dx mixtures, the band centred at
3280 cm-1 arising from bulk-like water having strong H-bonds with the nearby water
molecules is not found for mixtures at X� � 0.1 (Figure 5.5). This indicates that weaker
water-Dx H-bonds dominate in these mixtures, which disrupts the three-dimensional
water-water H-bond network. The band at 3470 cm-1 is assigned to an OH stretch of
water molecules which have weak H-bond to the nearby water molecules. A similar
peak was previously found in water-acetonitrile mixtures [128]. The bands at 3585 and
3505 cm-1 are attributed to OH stretching bands of water molecules that share H-bonds
with Dx. H-bonds between water and Dx are weaker than water-water H-bond, which
results in a strengthening of the OH oscillator or a blue shift of the OH stretch [129].
The relatively high intensity of the band at 3585 cm-1 at low X� indicates a high portion
of such weakly bonded water molecules (Figure 5.6). As X� increases from 0.005 to
0.05, the contribution of the 3470 cm-1 band increases with a consequent decrease in the
contribution of the 3585 cm-1 band. At higher water concentrations (X� � 0.1), the
band centred at 3280 cm-1 appears. This shows an onset of the formation of bulk water
clusters. Upon increasing the water content (X� � 0.49), the absorbance spectrum
resembles that of pure water in which the major contribution results from the bands at
3470 and 3280 cm-1.

5. Water in organic solvents
78
In the frequency range from 0.4 to 1.4 THz measured with THz-TDS, both the index of
refraction ��� and the absorption coefficient L�� of Dx is significantly smaller than
the values of water (Figure 5.7). A previous study in the frequency range from 200 MHz
to 3 THz using a combination of frequency domain reflectometry, travelling wave
interferometry, and THz-TDS also yielded the same results [130]. Because of the big
spectral differences between water and Dx, the spectra of their mixtures are expected to
change significantly with changing water contents. This explains the observation that
both ��� and L�� of water-Dx mixtures increase with increasing water content
(Figure 5.8). Previous studies with water-acetonitrile mixtures showed an increase in
��� and a decrease in L�� with increasing water content [131] . For water-acetone
and water-methanol mixtures, both ��� and L�� were found to increase with water
content [95], which is similar to the behavior of water-Dx mixtures. The calculated data
when assuming the mixtures are ideal are smaller than the measured data for both ���
and L�� in the entire concentration range. This indicates a significant change in the
network by addition of water. Similar results obtained with FTIR spectroscopy and MD
simulations for water-acetonitrile and water-acetone mixtures also yielded a deviation in
absorption between the real and ideal mixtures [95].
The fit with double Debye model for water resulted in two characteristic relaxation
processes, one slow (�A~ 8 ps) arising from the cooperative relaxation of the H-bond
network, and another faster one (��~ 0.1 $ 0.4 ps) resulting possibly from the non-
separable contribution of the few free water molecules [28, 131]. A previous study
showed that pure Dx has no significant contribution at that timescale [130], so the
probed dynamic processes of water-Dx mixtures are mainly from water. In the
investigated THz frequency range, the slower process (�A) is preferentially probed. At
low X�, �A values are very small compared to that of bulk water (Figure 5.9). As this
mode of relaxation is mostly assigned to the cooperative relaxation of H-bond network,
the low �A value indicates a lack of cooperative network in the mixtures. When X�
exceeds 0.1, �A increases very rapidly. This change shows a rapid onset of the collective
H-bond network motions similar to what was observed in a previous study of solvated
model peptides [132]. The behavior of the parameter SA is similar to that of �A. SA
relatively reflects the number of water molecules that participate in the corresponding
Debye process. With increasing X�, more water molecules participate in the H-bond
network. This leads to an increase in the relaxation strength SA or an increase of the
dipole intensity. The observation agrees well with the results of a previous study using

5. Water in organic solvents
79
time resolved fluorescence [118]. In this study, a fast solvent relaxation was found at
low water content. Furthermore, the water cluster size measured by dynamic light
scattering was found to increase with increasing X�. The static dielectric constant �!,
which is attributed to water cluster formation and the polarity of clustered water, also
has the same behaviors as �A (Table 5.1). The results of FTIR measurements at low
water contents (X� � 0.1) indicated a negligible bulk water contribution in the mixture.
This correlates with a low polarity or low �! values. With increasing X�, the size of
water clusters increases due to the formation of collective H-bond network of water.
This explains the observed increase in the polarity of clustered water which is
represented by an increase in �! with increasing X�. From these results, it can be
concluded that with the growth in the cluster size, the cooperative relaxation dynamics
of water in the mixtures represented by �A increases gradually and reaches the value of
water at high water content (X� � 0.54).
The measurement results of the kinetics of BzCl solvolysis reaction in water-Dx
mixtures (Figure 5.11) show that the observed rate constants at high X� agree well with
the previously reported rate constants observed in similar systems [133]. The observed
rate constant for water-Dx mixture at X� � 0.54 (0 � 4.3 · 10'¢ s'A) is still considerably slower than that for water (0�g¥ � 1.4 s'A at 25°C) [126]. This behavior
indicates a poor reactivity of water in the mixtures. At low water concentrations
(X� � 0.1), bulk water contribution in water-Dx mixtures is negligible as shown in the
FTIR study. This is coupled with the low polarity of water in the clusters as indicated by
low static dielectric constant in the THz-TDS study. The lower polarity due to cluster
formation destabilizes both the nucleofuge (Cl') and the intermediately formed acylium
cation (Bz,), thereby disabling the SN1 mechanism. As evidenced from earlier dynamic
light scattering measurements, the size of water clusters in Dx increases with increasing
X� due to the formation of collective H-bond network of water [118]. This results in an
increase in the polarity of clustered water, which supports the SN1 reaction pathway as it
stabilizes the acylium cation intermediate as well as the nucleofuge. Therefore, the
reaction rate increases considerably as X� increases, especially with X� � 0.1. A
previous study of similar BzCl solvolysis reaction in AOT reverse micelles also put
forward similar arguments [125, 134]. At low water content, the reaction rate was found
to be low and SN1 mechanism was disfavoured while S 2 mechanism was favoured. At
higher water content, the bonding between the hydrogen atoms of interfacial water
molecules and AOT head groups increased, which resulted in an increased

5. Water in organic solvents
80
nucleophilicity of water inside AOT RM droplets. As a result, SN1 mechanism was
followed and the reaction rate increased. Therefore, the reaction rate of BzCl solvolysis
reaction is defined by the competition between the two reaction mechanisms. Any
change in the structure and dynamics of the water network in the mixtures can induce a
change in the reaction rate. The observed rapid changes in the water network dynamics
at X� � 0.1 correlate directly with the observed significant increase of the reaction rate
of BzCl solvolysis reaction in water-Dx mixtures. A change in the water network, such
as formation of more rigid water-water H-bonds or change in polarity of water clusters
due to cluster formation, will lead to a corresponding change in solvolysis reaction rate.
This study combines three different experimental techniques with the objective to
understand the evolution of water network structure in water-Dx mixtures. FTIR studies
were aimed to unravel the evolution of the H-bond formation by the shift of
intramolecular OH stretching modes and librational modes of water. The results show a
gradual increase of the collective H-bond network with increasing X�. The hetero-
molecular water-Dx H-bonds dominate in the water diluted region of water-Dx
mixtures. With progressive addition of water, intermolecular three-dimensional H-
bonded water network dynamics appear beyond X� � 0.1 and approach those of water
at X� � 0.54. THz-TDS studies explored the dielectric relaxation of water and
indicated changes in the H-bond relaxation dynamics. A fit of a double Debye model to
the measured data revealed the lack of cooperative water network dynamics for low
water contents and a rapid onset of collective network motions was observed when X�
exceeds 0.1. The kinetic study of BzCl solvolysis reaction showed that the rate constant
is very slow at water diluted region, and it increases rapidly at X� � 0.1, indicating a
change in the reaction pathway as the nucleophilic character of water changes in water-
Dx mixtures. In summary, the study shows a direct correlation between the change in
the structure and dynamics of water with the change in the reaction rate upon increasing
water content in water-Dx mixtures. The investigation of water-Dx system serves as a
model system which shows the influence of hydration on the activity and demonstrates
the importance of the solvent for chemical reactivity.

81
6 Water in hydration shells
Water molecules in the immediate vicinity of a protein form a dynamical hydration shell
around it. Water dynamics in the hydration shells is slowed down by the protein. In
some aspects, these hydration water molecules are more confined than bulk water and
their properties are sensitive to the details of the interactions with the protein surface.
This chapter presents the study of thermal unfolding and refolding of human serum
albumin (HSA) in aqueous solutions using circular dichroism (CD) spectroscopy,
fluorescence spectroscopy, THz-TDS, and p-Ge laser THz spectroscopy to investigate
the correlation between structural changes and changes in the hydration dynamics. The
presented results are published as a cover article in Ref. [94].
6.1 Biological water
Water is considered as a lubricant of life, participating in several functions in living
systems. Water molecules can control the shape, function and dynamics of biomolecules
like DNA and proteins [7]. Water molecules in the immediate vicinity of a biomolecule
form a dynamical hydration shell around it. Water properties in this layer are sensitive
to the details of the interactions with the adjacent surface. Water in hydration shells is
called biological water because its dynamics is determined by the structural
organization and perturbation of the biomolecule, and vice versa, the structural integrity
of the biomolecule is governed by the dynamics and H-bonding network of the
biological water [92, 135]. The flexible H-bond network of water enables it to adapt its
structure and dynamics to biomolecules. Water can interact with biomolecules by
donating and accepting H-bonds, by van der Waals interactions, or via electrostatic
steering. This makes water not only a passive solvent, but also an active partner with
vital functions in most biological processes.
The interaction between proteins and their biological water during protein folding
shows a typical example of the interplay between biomolecules and water. Biological
water makes significant contributions to the structure and energy of proteins and
provides a responsive surrounding for conformational changes. Self-assembly of
proteins is controlled by a delicate interplay between hydrophobic and hydrophilic

6. Water in hydration shells
82
interactions [3]. The hydrophobic effect, which results from the unfavourable
interaction between water and the hydrophobic moiety of amino acids of the protein,
plays an essential role in protein folding. Water at protein interfaces can
thermodynamically stabilize the native structure of proteins, affect protein flexibility,
and contribute to molecular recognition in enzyme catalysis. On the other hand, proteins
also influence the structure and dynamics of surrounding water molecules. The
dynamics of biological water is slowed down to match the much slower protein
dynamics [136]. In the hydration shells around proteins, the H- bonds between water
molecules and proteins have longer lifetimes than bulk water.
Figure 6.1: Schematic of a protein (derived from the PDB file 1UBQ) and
surrounding water molecules. Water molecules near the protein surface
form a dynamical hydration shell (darker area). Water in this shell is called
biological water and has different dynamics compared to bulk water.
Figure 6.1 shows a schematic of a protein and water molecules around it. The structure
of the protein is derived from the PDB file 1UBQ [137]. Water molecules within a
certain distance from the protein form a dynamical hydration shell around the protein.
The hydration shells of proteins contains one to some layers of water. The biological
water within the hydration shell can dynamically exchange with bulk water. The
dynamics of protein surface hydration uniquely bridges fast bulk water motions and
slaved protein fluctuations. This function performs important biological roles in

6. Water in hydration shells
83
maintaining the intact structure as well as the flexibility of proteins and in mediating
enzymatic reactions [138, 139].
The essential role of biological water has been studied using several techniques, such as
X-ray and neutron diffraction [140], NMR spectroscopy [141], IR spectroscopy [92],
fluorescence spectroscopy [10], Mössbauer spectroscopy [142], and molecular
dynamics simulations [143]. Recently, THz spectroscopy has been introduced as an
innovative and highly sensitive method to measure the rapid change in collective water
network motions [144, 145, 146]. THz spectroscopy detects the collective water
network motions on the sub-ps to ps timescale while other techniques probe longer
processes on the ns to µs timescale like NMR spectroscopy, or measure static properties
like X-ray diffraction. THz spectroscopy probes directly the collective intermolecular
vibrations of the H-bond network of water. Therefore, it is able to detect sensitively any
solute induced changes in solvation dynamics of biological water in the hydration
shells.
Previous studies showed that dynamical hydration shells around proteins extend to
several water layers and reach up to 20 Å from the protein surface [147, 148].
Biological water has a retarded dynamics and they oscillate more in phase compared to
bulk water. As a result, the absorption of biological water in THz frequency range
differs significantly from that of bulk water. A recent combined experimental and MD
simulation study showed that the observed changes in the THz absorption of the
solvated protein can be explained by a blue shift of the THz absorption modes of
biological water [68]. This is directly related to a significant retardation of water
dynamics. The study predicted a decrease of the THz absorption of biological water
compared to that of bulk water at frequencies below 1.7 THz, while an increase in
absorption is predicted for frequencies above 1.7 THz. Both predictions were confirmed
by experimental measurements. These results confirm that THz spectroscopy can probe
the structural change of biomolecules during a kinetic process through the change in the
THz absorption of their biological water. Any structural change of biomolecules will
affect the dynamics of their biological water and any change in water dynamics will be
reflected by a change in the THz absorption. The following sections present the results
from the measurements of HSA in aqueous solutions. The thermal unfolding and
refolding HSA was investigated using combined techniques of CD spectroscopy,
fluorescence spectroscopy, THz-TDS, and p-Ge laser THz spectroscopy.

6. Water in hydration shells
84
6.2 Structure and function of human serum albumin
HSA is the most abundant protein in blood plasma. It is synthesized and secreted in
liver cells. HSA consists of a single polypeptide chain containing 585 amino acids and
has a molecular mass of 66.5 kDa [149, 150]. Under physiological condition the
polypeptide chain of HSA forms a heart shaped three-dimensional structure with 80 Å
on the side, an average thickness of 30 Å, and a volume of 88,250 Å3 [151]. The
structure, which has approximately 67% α-helix and no β-sheet, is stabilized by 17 pairs
of disulfide bonds performed by 34 cysteine residues. Figure 6.2 shows the X-ray
crystallographic structure of HSA which is derived from the PDB file 1AO6 [150]. The
protein has three homologous domains I-III, each consists of two sub-domains A and B.
The sub-domains A and B are connected by flexible loops and contain six and four α-
helices, respectively.
Figure 6.2: Crystal structure of HSA derived from the PDB file 1AO6. The
protein consists of a single polypeptide chain of 585 amino acids. It has a
heart shaped structure with three domains I-III. Each domain has two sub-
domains A and B.
Previous studies revealed that HSA has a high affinity to a great variety of metabolites,
metals, amino acids, fatty acids, drugs and organic compounds in the circulatory system
[149, 150]. The flexible structure of HSA allows substances to bind from a variety of
binding sites and to be buried within the protein. HSA can bind with various compounds

6. Water in hydration shells
85
and transport them in the bloodstream to their target organs. HSA also binds, transports
drugs and affects drug distributions in the blood plasma. It can control the active
concentration of drugs [152].
HSA represents the major and predominant antioxidant in plasma. The antioxidant
activities of HSA result from its ligand-binding capacities. It can bind with free
transition metal ions, such as Cu2+ and Fe2+ to prevent them from reacting with oxygen
to form reactive oxygen species [153]. Another antioxidant property of HSA results
from the presence of a free sulphydryl group on the reduced cysteine residue (Cys34),
which acts as an important redox regulator in extracellular compartments and can
scavenge hydroxyl radicals. Furthermore, HSA also regulates the pH, osmotic pressure
of plasma, and distribution of fluid between different compartments.
6.3 Thermal unfolding and refolding of human serum albumin
HSA is one of the most popular model proteins used in biological research. Thermal
denaturation of HSA has been studied using different techniques, such as fluorescence
spectroscopy [154], two-dimensional IR spectroscopy [155], dynamic light scattering
(DLS) and CD spectroscopy [156], and Förster resonance energy transfer (FRET) [157].
A study concluded that thermal denaturation of HSA follows multiple steps: from native
to extended and then to unfolded state (N ¨ E ¨ U) [154]. When being heated to 55°C,
the protein changes from native state to extended state, in which domains II and I move
apart while the native conformation is kept almost intact. At 70°C, the protein turns to
unfolded state, which is accompanied by a disruption of secondary and tertiary
structure.
In this section, the change in the coupled protein hydration dynamics of HSA upon
thermal denaturation is presented. Two processes of HSA thermal denaturation are
studied. Process 1: the temperature of the native protein was increased stepwise from
20°C to 55°C, and the system was subsequently cooled to 20°C (N « E transition).
Process 2: the protein is heated to 70°C and then allowed to cool to 20°C (N « U
transition). Both processes were monitored by far- and near-ultraviolet (UV) CD
spectroscopy, and time resolved fluorescence spectroscopy of the intrinsic fluorescence
of the tryptophan (Trp) moiety of HSA. The change in the hydration dynamics upon
thermal denaturation were determined by the change in THz absorption of the protein

6. Water in hydration shells
86
solutions compared to that of buffer. THz measurements were carried out using both p-
Ge laser in the frequency range of 2.1-2.8 THz and THz-TDS in the frequency range of
0.1-1.2 THz. This study is the first one to investigate the effect of thermal denaturation
of a protein using THz spectroscopy. For all measurements, HSA purchased from
Sigma Aldrich at 99% or higher purity was used. Protein solutions at different
concentrations were prepared by dissolving the protein in phosphate buffered saline
(PBS) at pH 7.4. The temperatures of the samples were controlled by a thermostat.
Thermal equilibration (temperature at � 2°C around the temperature set value) had to be
established before the data were collected.
6.3.1 CD spectroscopy
6.3.1.1 Principle of CD
A plane polarized light, or linearly polarized light, can be considered as a superposition
of opposite circular polarized light of equal amplitude and phase. Figure 6.3A shows
that the summary of the left circularly polarized light (�¬) and the right circularly
polarized light (�) is linearly polarized light (�¬ � �).
Figure 6.3: (A) Linear polarized light viewed as a superposition of opposite
circular polarized light of equal amplitude and phase. (B) Ellipticity and
optical rotation resulted from different absorption of the left and right
polarized components.

6. Water in hydration shells
87
In an optically active medium the absorbance of left circularly polarized light (�¬) is
different from the absorbance of right circularly polarized light (�). After propagating
through the sample, each component of light is still circularly polarized and the
polarization direction keeps unchanged. However, the radii of the circles traced out by
the electric vector of each component are different. The combination of these two
circularly polarized light waves provides elliptically polarized light because each wave
has a different amplitude. The occurrence of ellipticity is called CD. At the same time,
optical rotation (OR) also occurs. A difference in the index of refraction of the two
circular components causes a rotation of the polarization plane by a small angle L
(Figure 6.3B).
CD is measured as the difference in absorbance between the left circularly polarized
light and the right circularly polarized light [158]:
CD � ∆� � �¬ $ � (6.1)
Most CD measurements are reported in degrees of ellipticity (θ) which can be
calculated with the approximation:
θ � ∆� \p�104 ] \180 ] (6.2)
Biological molecules, such as proteins and nucleic acids, are chiral and show CD in
their UV absorption bands. CD spectra of proteins are usually used to predict
characteristics of their secondary structure. This is based on the fact that isolated α-
helices, β-sheets, and random coils have distinctly different signatures. The CD spectra
of α-helices are characterized by three peaks: a negative peak at 222 nm, a negative
peak of similar intensity at 208 nm, and a stronger positive peak at 192 nm. CD spectra
of β-sheets are characterized by a negative peak near 217 nm and a positive peak near
195 nm. CD spectra of random coils are characterized by a strong negative peak around
200 nm [158].
The CD spectrum of a complex protein can be determined as a sum of its secondary
structures. For huge globular proteins, it is difficult to get relative contents of the
particular secondary structure element. Therefore, the accurate protein conformation

6. Water in hydration shells
88
cannot be obtained from the CD spectrum. However, CD spectroscopy provides a
powerful tool to qualitatively follow conformational transitions, such as the structural
transition from α-helix or β-sheet to random coil and vice versa. When a protein
solution is heated above a critical temperature, it undergoes a transition from the native
state to the denatured state. In this transition, H-bonds and hydrophobic interactions are
broken, resulting in a modification of secondary structure, which can be observed in a
CD spectrum. The temperature dependent CD signals at 222 nm (CD222), which is a
characteristic wavelength of α-helices, is usually used to check if the protein structure
changes within the temperature range.
6.3.1.2 CD spectrometer
Figure 6.4: Schematic of the CD spectrometer. The linear polarized light is
modulated to left and right circularly polarized light by the modulator. After
transmitted through the sample, the CD spectrum is detected and analyzed.
In this study, CD measurements were performed with a JASCO-815 spectrometer.
Figure 6.4 shows a schematic of the CD spectrometer. The light source is generated by a
xenon lamp. A monochromator and linear polarizer provide monochromatic linear
polarized light by using two crystal prisms with different axial orientation. The linear
polarized light is modulated to left and right circularly polarized light by a modulator.
The modulated light transmits through a sample and is detected by the detector
(photomultiplier). Finally, the data are processed and analyzed by a computer to yield a
CD spectrum. Far-UV CD spectra were measured in the wavelength range from 200 and
255 nm with a protein concentration of 0.05 mg/ml and scan speed of 50 nm/min. The

6. Water in hydration shells
89
secondary structural data of the CD spectra are analyzed using CDNN software [159].
Near-UV CD measurements were carried out in the wavelength range from 255 to 300
nm with a protein concentration of 2 mg/ml and scan speed of 20 nm/min. Cell
thickness of 1.0 cm was used for all CD measurements. This experiment was carried out
by the collaborators at S.N. Bose National Centre for Basic Sciences (Kolkata, India).
6.3.1.3 CD spectra of HSA
Figure 6.5: CD spectra of HSA in aqueous PBS buffer at different
temperatures: (A) Far-UV spectra at HSA concentration of 0.05 mg/ml, (B)
near-UV at HSA concentration of 2 mg/ml. The thermal unfolding/refolding
process starts with stepwise forward heating from 20 to 70°C for thermal
unfolding (solid lines), and then continues with backward cooling from
70°C to 20°C for refolding (dashed lines). Upon cooling, both far-UV and
near-UV CD spectra are not reversible. This experiment was carried out by
the collaborators at S.N. Bose National Centre for Basic Sciences in India.
The temperature dependent far-UV CD measurements of HSA were carried out to probe
changes in the secondary structure. The protein solution was heated stepwise from 20°C
to 55°C, then it was cooled to 20°C to observe changes in N « E transition from native
to extended state (Process 1). The CD spectra of HSA in this temperature range stay
nearly unchanged as observed from Figure 6.5A for the CD spectra at 20, 40 and 55°C
of the heating stage. This indicates that there is very little change in the secondary

6. Water in hydration shells
90
structure in the extended state compared to that of the native state. Upon recooling, the
CD spectra are reversible.
Furthermore, N « U transition from native to unfolded state (Process 2) is investigated,
in which the protein solution is heated from 20°C to 70°C and then cooled back to
20°C. The CD spectra for Process 2 are shown in Figure 6.5A. The CD spectra of HSA
have two characteristic α-helix peaks at 208 and 222 nm. As the temperature is
increased, the CD signals at 208 and 222 nm decrease, indicating a decrease of α-helix
content. A drastic change is only observed when the temperature increase from 55 to
70°C at which the protein changes to unfolded state. When the system is cooled down,
the CD spectra stay closer to the one at 70°C compared to the spectra at the same
temperature in the heating stage. The structure of the refolded protein upon cooling is
therefore irreversible and stays similar to the structure of the unfolded state.
Figure 6.6: Temperature dependent change in the CD signal of HSA at the
wavelength of 222 nm (A), and corresponding change in the α-helix content
of the protein (B). The solid lines are guide to the eyes. Thermal unfolding
was induced by heating from 20 to 70°C and then the system was cooled
back to 20°C to allow refolding. The CD signal and the α-helix content are
both irreversible. This experiment was carried out by the collaborators at
S.N. Bose National Centre for Basic Sciences in India.
Figure 6.6A shows the temperature dependent ellipticity at 222 nm. The change in the
ellipticity at this wavelength serves as a probe for the α-helix content which is shown in
Figure 6.6B. For the native state at 20°C, 63.4% of α-helix, 12.6% of β-sheet and 24%

6. Water in hydration shells
91
of other structural elements (random coils) are obtained from the CD spectrum. With
increasing temperature, the CD signal at 222 nm decreases, indicating a loss of α-helix
content. At 40 and 55°C, α-helix content decreases slightly to 61.5% and 57.8%
respectively with a corresponding increase in content of random coils while β-sheet
content is stable. Upon increasing the temperature to 70°C, a significant change in the
CD signal is observed. The α-helix content decreases to 41.4% (16% β-sheet and 42.6%
of random coils). When being cooled from 70 to 20°C, the protein structure contains
46% α-helix, 15% β-sheet and 39% of random coils. This indicates the irreversibility of
the unfolding/refolding process.
The structural change of HSA for Process 1 and 2 is further studied with near-UV CD
measurements in the wavelength range from 255 to 300 nm. Figure 6.5B shows the
near-UV CD spectra of HSA at different temperatures. The CD spectrum at 20°C has
two distinct peaks at 262 and 268 nm along with a shoulder at 280 nm. Similar to the
results of far-UV measurements, there is very small change in the tertiary structure for
N « E transition (Process 1). The near-UV CD spectra at 20, 40 and 55°C of the
heating stage in Figure 6.5B are nearly the same. Upon cooling from 55°C, the CD
spectra return to the original ones. For the N « U transition (Process 2), the near-UV
CD spectrum at 70°C is significantly changed in the frequency regions around 262 and
268 nm. Upon cooling 20°C, the CD spectrum is not recovered, which shows an
irreversible structural perturbation during the N « U transition.
6.3.2 Fluorescence spectroscopy
6.3.2.1 Principle of fluorescence spectroscopy
The emission of light is divided into two categories: incandescence and luminescence.
Incandescence is the emission of light from a hot body solely because of its
temperature. Luminescence is the emission of light which does not result from heat. It is
called cold body radiation. Fluorescence is a form of luminescence in which a substance
emits light after having absorbed light or other electromagnetic radiation [160].
Molecules have various states which are referred to as energy levels. In general,
molecules have a ground electronic state of low energy (S0) and an excited electronic
state of higher energy (S1). Each of these electronic states has several vibrational states.
At room temperature most molecules occupy the lowest vibrational state of the ground

6. Water in hydration shells
92
electronic state. Figure 6.7 shows a schematic of a fluorescence process. A molecule
first absorbs a photon, gains more energy and is excited to one of the vibrational states
in the excited electronic state S1. Then the excited molecule collides with other
molecules, loses its vibrational energy until it reaches the lowest vibrational state of the
excited electronic state. After that, the molecule drops to one of the vibrational state of
the ground electronic state S0 and emits a photon. The emitted photons can have
different energies because the molecule can drop to any level of the vibrational states in
the ground electronic state. At the end, the molecule collides with other molecules and
returns to the lowest vibrational state.
Figure 6.7: Schematic of a fluorescence process. The molecule absorbs a
photon and is excited from the ground electronic state S0 to the excited
electronic state S1. When the molecules release energy through collisions
and comes to lowest vibration state of S1, it emits a photon and return to S0.
The fluorescent photon has lower energy than that of the excitation photon.
Fluorophores, which are molecules with fluorescent characteristics, are used in
fluorescence spectroscopy. Several factors influence the fluorescent characteristics of a
fluorophore, such as structure, concentration, temperature, pH of the solution,
environment around the fluorophore. Molecules with aromatic functional groups and
rigid structures fluoresce better than others [160]. Fluorescence spectroscopy is thus
best utilized for compounds with an aromatic structure. The efficiency of the
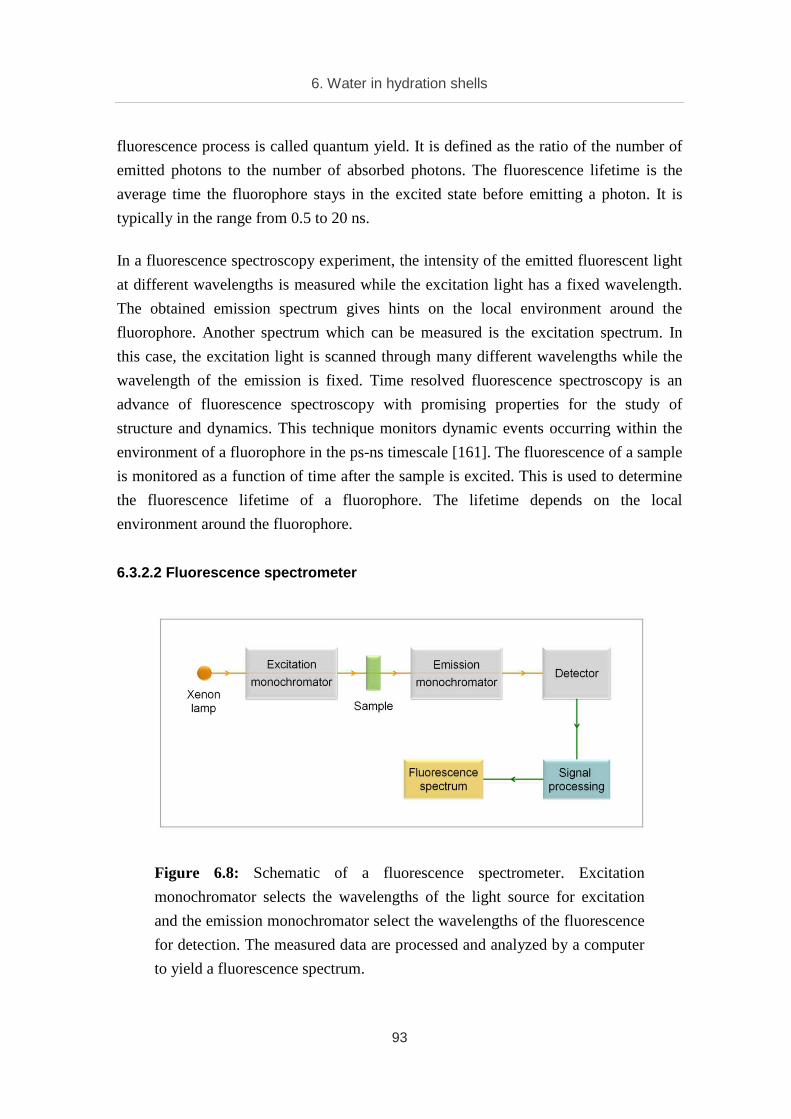
6. Water in hydration shells
93
fluorescence process is called quantum yield. It is defined as the ratio of the number of
emitted photons to the number of absorbed photons. The fluorescence lifetime is the
average time the fluorophore stays in the excited state before emitting a photon. It is
typically in the range from 0.5 to 20 ns.
In a fluorescence spectroscopy experiment, the intensity of the emitted fluorescent light
at different wavelengths is measured while the excitation light has a fixed wavelength.
The obtained emission spectrum gives hints on the local environment around the
fluorophore. Another spectrum which can be measured is the excitation spectrum. In
this case, the excitation light is scanned through many different wavelengths while the
wavelength of the emission is fixed. Time resolved fluorescence spectroscopy is an
advance of fluorescence spectroscopy with promising properties for the study of
structure and dynamics. This technique monitors dynamic events occurring within the
environment of a fluorophore in the ps-ns timescale [161]. The fluorescence of a sample
is monitored as a function of time after the sample is excited. This is used to determine
the fluorescence lifetime of a fluorophore. The lifetime depends on the local
environment around the fluorophore.
6.3.2.2 Fluorescence spectrometer
Figure 6.8: Schematic of a fluorescence spectrometer. Excitation
monochromator selects the wavelengths of the light source for excitation
and the emission monochromator select the wavelengths of the fluorescence
for detection. The measured data are processed and analyzed by a computer
to yield a fluorescence spectrum.

6. Water in hydration shells
94
Figure 6.8 shows a schematic of a fluorescence spectrometer. The excitation source
emits light in the UV frequency range. The excitation wavelength is selected by the
excitation monochromator. The wavelengths of the fluorescence are scanned by the
emission monochromator to detect signals at different wavelengths and yield a
fluorescence spectrum.
In this study, steady state fluorescence emissions were measured using a Horiba Jobin
Yvon Fluorolog spectrometer. For the time resolved measurements, an fs-coupled
TCSPC (time correlated single photon counting) is combined with the spectrometer.
The excitation source has a wavelength of 300 nm. The details of time resolved
measurements can be found elsewhere [162]. This experiment was carried out by the
collaborators at S.N. Bose National Centre for Basic Sciences (Kolkata, India).
6.3.2.3 Fluorescence spectra of HSA
Figure 6.9: Frequency dependent fluorescence spectra of the Trp in HSA at
different temperatures for two thermal transitions: (A) native to extended
state and reverse to refolded state (Process 1), (B) native to unfolded state
and reverse to refolded state (Process 2). Process 1 is reversible while
Process 2 is irreversible. This experiment was carried out by the
collaborators at S.N. Bose National Centre for Basic Sciences in India.
Fluorescence measurements of HSA were measured intrinsic without modification as
HSA has a single Trp moiety in domain IIA at the 214 position. Trp has an absorption

6. Water in hydration shells
95
peak around 280 nm. The excitation wavelength at 300 nm was chosen in order to avoid
fluorescence from other amino acids. The emission fluorescence spectra of HSA for
Process 1 (N « E transition) and Process 2 (N « U transition) were shown in Figure
6.9. The protein shows a single emission maximum at about 335 nm at 20°C and the
intensity decreases with increasing temperature. The observed quenching of the
fluorescence intensity is attributed to a decreased quantum yield of Trp in its immediate
environment. For Process 1, the emission maximum position stays almost unchanged
when the protein is heated from native state at 20°C to extended state at 55°C as shown
in Figure 6.9A. Upon cooling to 20°C, the fluorescence spectrum becomes almost the
same as the spectrum of the native state. For Process 2, a different behavior is observed
as shown in Figure 6.9B. When the temperature is increased to 70°C (unfolded state), a
slight blue shift of the emission maximum position is found. Upon subsequent cooling
to 20°C, the obtained fluorescence spectrum of the refolded state is significantly
different from the spectrum of the native state.
Figure 6.10: (A) Time dependent fluorescence spectra of the Trp in HSA of
the native state (20°C), unfolded state (70°C), and refolded state (20°C) of
Process 2. The solid lines represent triexponential fits of the curves. (B)
Average lifetime of Trp in HSA at different temperatures during thermal
unfolding and refolding for Process 1 and 2. The results show a reversible
behavior for Process 1 and an irreversible behavior for Process 2. This
experiment was carried out by the collaborators at S.N. Bose National
Centre for Basic Sciences in India.

6. Water in hydration shells
96
Further to the frequency dependent spectra, the time resolved fluorescence spectra of
HSA were measured. Figure 6.10A shows three representative time dependent
fluorescence spectra of Trp in HSA for the native state at 20°C, unfolded state at 70°C,
and refolded state at 20°C for Process 2. The significant difference between the
spectrum of the refolded state and that of the native state marks the irreversibility of this
N « U transition. The similar measured results for Process 1 show a reversible N « E
transition. These observations match with those found in the frequency dependent
fluorescence measurements.
For the time resolved fluorescence transients of Trp in HSA, a triexponential fit is a
suitable model which has been frequently applied to the data to yield three lifetimes of
the fluorescence [156, 163]. The fluorescence transients u��� are fitted by using a
nonlinear least square fitting procedure with following triexponential equation:
u��� � u¯ � < �)�' +°±�
)BA
(6.3)
where u¯ is the background, �) is the pre-exponential factors, and �) is the characteristic
lifetimes. The relative concentrations v) of the corresponding lifetimes �) in a
triexponential decay are given as:
v) � �)�A � �� � �� (6.4)
The average lifetime of a fluorescence transient � � Z is defined as:
� � Z� < v)�)�
)BA
(6.5)
The fitted parameters of Process 1 and 2 are given in Table 6.1. For the native state at
20°C, the three fitted lifetimes are 0.5, 3.3 and 7.0 ns. The longest component has the
most contribution, which deduces an average lifetime � � Z of 5.2 ns. This average
lifetime represents the decay dynamics of Trp in HSA. Figure 6.10B shows the
temperature dependent average lifetimes for both Process 1 and 2. With increasing

6. Water in hydration shells
97
temperature, � � Z decreases continuously, indicating a thermal perturbation of the
secondary and tertiary structure of the protein. The N « E transition is reversible as
� � Z of the refolding protein has similar value as that of the native protein. However,
the N « U transition is irreversible. For the unfolded state at 70°C, � � Z decreases
about 3 times compared to the value at 20°C. Upon cooling, � � Z of the refolded
protein is still faster than � � Z of the native protein, which means that only a part of
the native structure is recovered.
Table 6.1: Fitting parameters of the fluorescence transients of Trp in HSA
for Process 1 and 2. The unit for all lifetimes τ is ns. This experiment was
carried out by the collaborators at S.N. Bose National Centre for Basic
Sciences in India.
o �°C� vA �A v� �� v� �� � � Z
Process 1: 20°C ¨ 55°C ¨ 20°C
20 0.15 0.50 0.21 3.31 0.64 7.00 5.23
40 0.22 0.34 0.26 2.34 0.52 5.85 3.76
55 0.21 0.25 0.44 2.30 0.35 5.50 2.99
40 0.19 0.30 0.30 2.40 0.51 5.99 3.82
20 0.12 0.45 0.28 3.21 0.60 7.22 5.26
Process 2: 20°C ¨ 70°C ¨ 20°C
20 0.15 0.50 0.21 3.31 0.64 7.00 5.23
40 0.22 0.34 0.26 2.34 0.52 5.85 3.76
55 0.21 0.25 0.44 2.30 0.35 5.50 2.99
70 0.24 0.15 0.48 1.18 0.28 3.76 1.66
55 0.35 0.14 0.38 1.57 0.27 4.52 1.88
40 0.37 0.14 0.31 1.59 0.32 4.90 2.12
20 0.38 0.12 0.26 1.58 0.36 5.30 2.35

6. Water in hydration shells
98
6.3.3 THz-TDS measurements
THz-TDS was used to probe the frequency dependent index of refraction and absorption
coefficient in the frequency range from 0.1 to 1.2 THz (3-40 cm-1). The detailed
descriptions of the spectrometers and the data analysis are presented in Chapter 2. For
all THz measurements, a standard liquid sample cell (model A145 of Bruker Optics)
with z-cut quartz windows and a Teflon spacer was used. The layer thickness of the
samples, which was placed between the two parallel quartz windows, was fixed at
�52.6 � 0.3� �m. The whole THz setup is enclosed in a chamber purged with dry air,
keeping the humidity at �5 � 0.1� % to reduce water vapor absorption.
Figure 6.11: THz-TDS spectra of PBS buffer (pH 7.4) and 1 mM HSA in
PBS buffer at 20°C and 70°C in the frequency range from 0.1 to 1.2 THz:
(A) index of refraction, (B) absorption coefficient. The inset plots the
change in average absorption coefficient over the entire studied frequency
range of 1 mM HSA solution compared to that of the buffer for Process 2.
THz-TDS measurements of 1mM HSA in PBS buffer were carried out for Process 1 and
2 to deduce the frequency dependent index of refraction ��� and the frequency
dependent absorption coefficient L��. Similar to the observations of CD and
fluorescence measurements, the unfolding and refolding process is found to be
reversible for the N « E transition in Process 1 and irreversible for the N « U transition
in Process 2. Figure 6.11 shows the representative spectra of Process 2 for the buffer at
20°C and 70°C, and for protein solution at the native state (20°C), unfolded state (70°C)

6. Water in hydration shells
99
and refolded state (20°C). At 20°C, L�� of the buffer increases from 80 cm-1 to 240
cm-1 in the investigated frequency range while ��� decreases with increasing
frequency and reaches about 2.0 at 1 THz. When the temperature is increased to 70°C,
both ��� and L�� of the buffer increase. The absorption coefficient L�� changes
from 90 to 350 cm-1 in the frequency range. The spectra of HSA solution are slightly
different from those of buffer. At the same temperature, ��� of HSA is higher while
L�� of HSA is lower than the corresponding values of buffer. Both ��� and L�� of
the refolded state do not resemble the spectra of the native state.
The inset of Figure 6.11 shows ∆L, which is the change in average absorption
coefficient over the studied frequency range from 0.1 to 1.2 THz of 1 mM HSA solution
compared to that of the buffer for Process 2. ∆L is calculated as:
∆L � ∑ L!�)�.)BA 0 $ ∑ L �)�.)BA 0 (6.6)
where 0 is the number of the measured data points ) of a absorption coefficient
spectrum in the studied frequency range, L! and L are the absorption coefficient of the
protein solution and buffer, respectively. Upon heating, ∆L decreases nearly linearly
with increasing temperature. It is also observed that the refolding process (cooling) is
not reversible as ∆L of the refolded protein is lower than ∆L of the native protein.
6.3.4 p-Ge laser measurements
In addition to the frequency dependent spectra in the frequency range from 0.1 to 1.2
THz probed by THz-TDS, the integrated absorption of protein solutions relative to
buffer in the frequency range from 2.1 to 2.8 THz (70-93 cm-1) was recorded using a p-
Ge laser spectrometer [20]. Different HSA concentrations from 0 to 1.4 mM at four
temperatures (20, 40, 55 and 70°C) were studied. Furthermore, the thermal unfolding
and refolding of 1mM HSA solution in Process 1 and 2 were investigated. Two liquid
cells similar to the one used in THz-TDS were used for all measurements. A schematic
of the p-Ge laser spectrometer is shown in Figure 6.12. The THz radiation emitted from
the p-Ge laser is split by a chopper into two beams. Both are transmitted through two
measurement cells with the same path length (sample cell and reference cell). The
beams are recombined by a second chopper and focused on the detector by a
polyethylene lens. The temperature of the cells is monitored by an external temperature

6. Water in hydration shells
100
controller. The whole setup is enclosed in a chamber which is continuously purged with
dry air to keep the humidity at �5 � 0.1� % during the measurements.
Figure 6.12: Schematic of the p-Ge laser spectrometer. The THz beam
emitted from the p-Ge laser is split by a chopper. One part probes the
sample absorption and the other probes the reference absorption. Both
beams are recombined by a second chopper and focused on the detector.
The p-Ge measures the integrated THz absorption coefficient averaged over the
frequency range from 2.1 to 2.8 THz where the laser has highest intensity. For each
measurement, 30000 waveforms for each channel are recorded and averaged, which
results in a high accuracy of the measured data. The integrated absorption coefficient L
of a measured sample is obtained by the Lambert‐Beer’s law with following equation:
L � ln� $ ln�!% (6.7)
where % is the thickness of the liquid cell, � is the laser intensity after passing the
empty cell, �! is the laser intensity after passing the filled sample cell.

6. Water in hydration shells
101
The integrated THz absorption of HSA solutions were measured for different HSA
concentrations (0-1.4 mM) at four temperatures (20, 40, 55 and 70°C). The absorption
coefficient of the protein solution can be calculated according to a two component
model, in which it is assumed that there are only buffer and protein in the solution:
L! � L � �! � L" �"�! (6.8)
where L!, L , L" are the absorption coefficient of the protein solution, the buffer, the
protein, respectively, and �!, � , �", are the total volume of the protein solution, the
volume of the buffer, the volume of the protein, respectively. The water displacement or
change in the absorption coefficient of the protein solution relative to buffer (L����+)¸�)
can be calculated with following equation:
L����+)¸� � L! $ L L � � �! � L"L · �"�! $ 1 (6.9)
Figure 6.13: Concentration dependent THz absorption relative to buffer of
HSA solutions at four different temperatures measured with p-Ge laser in
the frequency range from 2.1 to 2.8 THz. The dashed line indicates the two
component water displacement model. The inset shows temperature
dependent absorption coefficient of water measured with the same system.

6. Water in hydration shells
102
HSA in aqueous solution can be assumed as a sphere with a radius of gyration of
approximately 3 nm [151, 164]. In the studied frequency range from 2.1 to 2.8 THz, the
absorption of proteins and other biomolecules in solution is much less than the
absorption of buffer, which is similar to that of water [14, 144]. The absorption
coefficient of proteins is less than 40 cm'A while that of water is about 420 cm'A at
20°C and increases nearly linearly with increasing temperature as shown in the inset of
Figure 6.13. For simplicity, L" is assumed to be 20 cm'A. From these assumptions,
L����+)¸� values of each protein concentration can be deduced using Equation (6.9).
With increasing protein concentration, the volume fraction of protein in the solution
increases linearly, resulting in a linear decrease of L����+)¸� as shown in Figure 6.13
(dashed line). The experimental results of HSA solutions are also plotted in Figure
6.13. For all temperatures, the measured L����+)¸� of the solvated protein decreases with
increasing protein concentration. With increasing temperature, a decrease in the
measured L����+)¸� is observed. For all temperatures, the concentration dependent
L����+)¸� of HSA is clearly different from the predicted L����+)¸� (water displacement).
Figure 6.14: Temperature dependent THz absorption relative to buffer of 1
mM HSA solution for Process 1 (A) and Process 2 (B). For Process 1, the
absorption of the refolded protein is similar to that of the native protein. In
contrast, the absorption of the refolded protein is significantly higher than
that of the native protein for Process 2.
Figure 6.14 shows the change in L����+)¸� of 1 mM HSA solution for Process 1 and 2.
The N « E transition in Process 1 (Figure 6.14A) is reversible as L����+)¸� of the

6. Water in hydration shells
103
refolded protein is almost the same as L����+)¸� of the native protein. However, the
N « U transition in Process 2 (Figure 6.14B) shows a different behavior. It is observed
that L����+)¸� of the refolded protein is significantly higher than that of the native one.
6.4 Discussion and conclusion
The structural contents of the native HSA at 20°C obtained from far-UV CD
measurements (Figure 6.6B), including 63.4% of α-helix (12.6% of β-sheet and 24% of
random coils), are in good agreement with previously studies [165, 166]. With
increasing temperature, α-helix content decreases slightly up to 55°C and significantly
at 70°C. At 70°C, the α-helix content is 41.4%, which agrees well with the result of
33.6% α-helix content of HSA at 75°C reported earlier [167]. The drastic change in the
α-helix content indicates the N « U transition from native to unfolded state. By
subsequent cooling, a part of the secondary structure is recovered, however, not to the
full extent. When cooled to 20°C, the protein structure contains only 46% α-helix,
indicating the irreversibility of the unfolding/refolding process. The β -sheet content of
the protein does not change much upon unfolding and refolding. The change in the
structure results mainly from the change from α-helix to random coils. Similar results
were previously observed in the case of pH induced denaturation [166].
Near-UV CD spectra of HSA (Figure 6.5B), which is sensitive to the tertiary structure
of the protein, show two distinct peaks at 262 and 268 nm along with a shoulder at 280
nm for the native HSA at 20°C. The results agree well with those observed in previous
studies [165, 166]. The spectra at 20, 40 and 55°C of the heating stage are almost the
same. A slight decrease of the signals at 262 and 268 nm indicates a slight perturbation
of the disulfide bridges [168]. Upon cooling from 55°C, the CD spectra return to the
original ones. The thermal N « E transition is thus reversible. A significant change is
found for the spectra at 70°C, indicating a rupture of several disulfide bonds. Upon
cooling to 20°C, the CD spectrum is not recovered, which shows an irreversible
structural perturbation during the N « U transition. CD experiments clearly suggest a
moderate and considerable modification of the protein secondary and tertiary structure
for N « E transition (Process 1) and N « U transition (Process 2), respectively. Such
changes in HSA structure were also confirmed by a previous dynamic light scattering
study, which probed hydration on the µs-ms timescale [156]. It was found that the
change in the hydrodynamic diameter of HSA (%¹) is negligible for Process 1 while a

6. Water in hydration shells
104
twofold increase in %¹ at 70°C is observed for Process 2. The considerable increase in
%¹ is attributed to the equilibrium volume expansion of the protein upon thermal
denaturation.
The steady state fluorescence measurements show reversible behavior of the wavelength
dependent fluorescence spectra for Process 1 and an irreversible behavior for Process 2
(Figure 6.9). The fluorescence spectrum of the refolded state of Process 2 upon cooling
from 70 to 20°C is blue shifted and has lower intensity compared to the spectrum of the
native state. This indicates an irreversible rupture of the secondary and tertiary structure
of the protein upon refolding by cooling. The blue shift of HSA fluorescence spectrum
at unfolded temperatures was also observed in a previous report [169]. In the transition
to the unfolded state, domain II of the protein unfolds, which moves Trp214 residue
located at the bottom of a deep crevice to a more hydrophobic environment [170]. This
blue shift indicates an increased exposure of hydrophobic moiety to the protein surface.
The observed average lifetime � � Z of the native HSA at 20°C in the time resolved
fluorescence spectra (Figure 6.10) is in good agreement with previous reports [163,
171]. It is however slower than the observed decay dynamics of aqueous Trp [172]. The
fluorescence transient of aqueous Trp could be fitted to a biexponential curve with fitted
lifetimes of 0.5 and 2.8 ns, of which the latter component dominates. These two
components were also found in most of the Trp containing proteins [173]. In the present
study of HSA, an additional component with a lifetime of 7 ns was found, which is
characteristic for the hydrophobic environment surrounding the buried Trp. At normal
physiological conditions, the heart shaped HSA adopts a globular structure and Trp
residue sits in a 12Å deep water filled crevice in domain IIA [170]. This additional
constrain on the Trp moiety may give rise to the additional 7 ns component. Upon
increasing temperature, the protein starts to melt and Trp is more flexible, results in
faster average lifetime � � Z. For the N « U transition (Process 2), � � Z for the
refolding protein at 20°C is much faster than that of the native protein at the same
temperature, showing that the protein structure is irreversible and Trp is still in a
flexible surrounding.
The spectra at 20°C of ��� and L�� of the buffer measured with THz-TDS
measurements (Figure 6.11) are in good agreement with the previously reported results
for water [93, 174]. Both ��� and L�� of the buffer increase with increasing
temperature. A previous temperature dependent absorption study of water also showed

6. Water in hydration shells
105
similar behavior [67]. Compared to the corresponding spectra of buffer, ��� of HSA is
higher while L�� of HSA is lower. The absorption coefficient L�� of the unfolded
protein at 70°C is significantly higher than that of the protein at 20°C. However, L��
of the buffer also increases with increasing temperature, which makes the relative
absorption difference between the unfolded protein at 70°C and the buffer at 70°C still
decreased compared to the relative absorption difference between the native protein at
20°C and the buffer at 20°C.
There are three processes which contribute to the observed changes of the unfolded
protein as probed by THz spectroscopy. First, the increase in temperature yields an
overall increased THz absorption in the whole studied frequency range. Second, the
change in protein structure due to the exposure of side chains to the solvent results in a
change in the THz absorption of water in the dynamical hydration shell of the protein.
Third, the increase in volume of the protein causes a decrease in THz absorption as a
volume fraction of highly absorbing water in the solution is replaced by that of less
absorbing protein. The contributions in different directions of these processes make it
difficult to get a direct comparison. For a general comparison, the change in average
absorption coefficient over the entire investigated frequency range from 0.1 to 1.2 THz
of 1 mM HSA solution compared to that of the buffer (∆L) for Process 2 was calculated
(inset of Figure 6.11). With increasing temperature, ∆L decreases nearly linearly. When
being cooled from 70°C, ∆L of the refolded protein is lower than ∆L of the native
protein, indicating a significant change in the hydration dynamics of the refolded
protein.
The absorption of HSA solutions relative to buffer obtained from p-Ge measurements
decreases with increasing protein concentration (Figure 6.13). A decrease in THz
absorption, a "THz defect", is expected when highly absorbing water molecules in the
buffer are replaced by less absorbing protein molecules [144]. However, the measured
L����+)¸� of the solvated protein are clearly different from the predicted L����+)¸� (water
displacement). Similar deviations from the linear two component model measured with
the same system were also found for other proteins such as λ-repressor [147, 175],
ubiquitin [148], and anti-freeze proteins [176]. The observed non-linear behavior is
attributed to the contribution of a third component: water in the dynamical hydration
shell around the protein. Water within this shell is found to have an increased THz
absorption coefficient compared to that of bulk water. This contributes to an increased
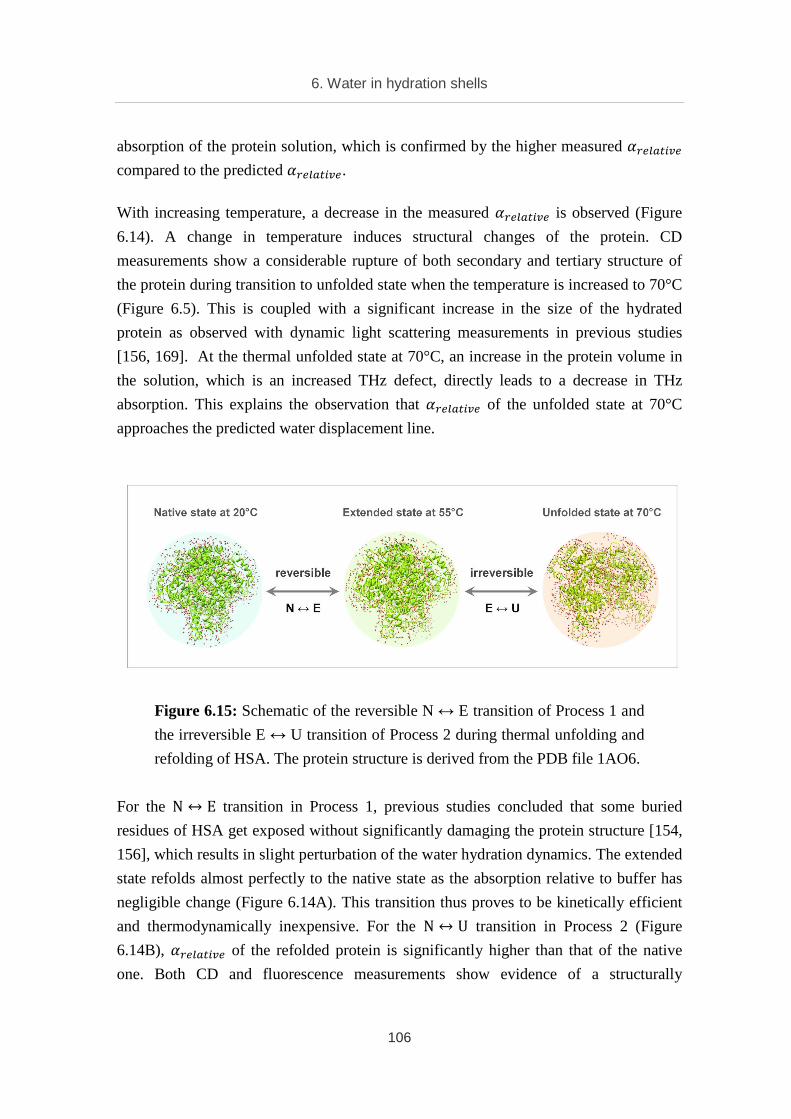
6. Water in hydration shells
106
absorption of the protein solution, which is confirmed by the higher measured L����+)¸�
compared to the predicted L����+)¸�.
With increasing temperature, a decrease in the measured L����+)¸� is observed (Figure
6.14). A change in temperature induces structural changes of the protein. CD
measurements show a considerable rupture of both secondary and tertiary structure of
the protein during transition to unfolded state when the temperature is increased to 70°C
(Figure 6.5). This is coupled with a significant increase in the size of the hydrated
protein as observed with dynamic light scattering measurements in previous studies
[156, 169]. At the thermal unfolded state at 70°C, an increase in the protein volume in
the solution, which is an increased THz defect, directly leads to a decrease in THz
absorption. This explains the observation that L����+)¸� of the unfolded state at 70°C
approaches the predicted water displacement line.
Figure 6.15: Schematic of the reversible N ↔ E transition of Process 1 and
the irreversible E ↔ U transition of Process 2 during thermal unfolding and
refolding of HSA. The protein structure is derived from the PDB file 1AO6.
For the N « E transition in Process 1, previous studies concluded that some buried
residues of HSA get exposed without significantly damaging the protein structure [154,
156], which results in slight perturbation of the water hydration dynamics. The extended
state refolds almost perfectly to the native state as the absorption relative to buffer has
negligible change (Figure 6.14A). This transition thus proves to be kinetically efficient
and thermodynamically inexpensive. For the N « U transition in Process 2 (Figure
6.14B), L����+)¸� of the refolded protein is significantly higher than that of the native
one. Both CD and fluorescence measurements show evidence of a structurally

6. Water in hydration shells
107
disordered unfolded state in which some of the sub-domains melt to expose their
hydrophobic core to the outer surface. The irreversible structural change induces a
corresponding change in water network dynamics which directly influences the THz
absorption of protein solutions. A schematic of the reversible (Process 1) and
irreversible transitions (Process 2) during thermal unfolding and refolding of HSA is
illustrated in Figure 6.15. The structure of the protein is derived from the PDB file
1AO6 [150].
A recent combined study of MD simulations and THz spectroscopy found that the
vibrational density of states of oxygens in water molecules in the hydration shell of a
protein is blue shifted compared to that of bulk water [68]. The blue shift results in an
increase in THz absorption of water in hydration shells for frequency above 1.7 THz
and a decrease for frequency below 1.7 THz compared to the absorption of bulk water.
This behavior is attributed to a significant retardation of H-bond dynamics on the ps
timescale. The retardation also goes along with a retardation of the rotational motions
and diffusion of water molecules. The blue shift is observed for hydration water around
both hydrophilic and hydrophobic residues. Hydrophilic residues can form H-bonds to
the nearby water molecules, which consequently retards the water dynamics. For water
in the vicinity of hydrophobic residues, the retardation results from sterical hinderance
effects as hydrophobic residues of protein are usually buried in pockets, grooves and
clefts. Any retardation of water network dynamics is found to induce a blue shift of the
vibrational density of states.
THz measurements of HSA show that the THz absorption of the irreversible refolded
protein in Process 2 is lower than the absorption of the native protein in the frequency
range from 0.1 to 1.2 THz measured with THz-TDS (inset of Figure 6.11B) while a
higher absorption is observed in the frequency range from 2.1 to 2.8 THz measured with
the p-Ge laser (Figure 6.14B). The different absorption behaviors in the frequency
ranges show a blue shift of the THz absorption spectrum of the refolded protein
compared to that of the native one with a turning point between 1.2 and 2.1 THz. This
result is in good agreement with the prediction of the MD simulation study on
vibrational density of states which suggests a turning point at 1.7 THz [68]. The
observation indicates a retardation of H-bond dynamics in the hydration shell of the
refolded protein compared to that of the native one. This can be explained by the
exposure of hydrophobic residues to protein surface upon unfolding, which results in
sterical constraints on hydration water.

6. Water in hydration shells
108
In summary, the thermal unfolding and refolding of HSA was studied with CD,
fluorescence, and THz spectroscopy. Far and near-UV CD spectroscopy indicate a
marginal change in the secondary and tertiary structure of the protein during N « E
transition (20°C « 55°C) and a dramatic change in the structure during N « U
transition (20°C « 70°C). Steady state and ps time resolved fluorescence spectroscopy
show reversible fluorescence spectra and reversible fluorescence average lifetime of
Trp214 moiety in HSA for N « E transition, while the behavior is irreversible for
N « U transition because of the irreversible exposure of Trp to a more flexible
surrounding upon unfolding. The associated change in the solvation of HSA was studied
using THz spectroscopy. Precise p-Ge laser measurements of the THz absorption of
HSA solutions show significant deviation from a two component model. This can be
explained by an increase in THz absorption of water in the dynamical hydration shell,
which results from the retardation of H-bond network dynamics. When the protein
unfolds at 70°C, hydrophobic residues expose to the protein surface. As this process is
irreversible, a part of the structural changes still remain when the protein is cooled down
to 20°C. These structural changes are accompanied by changes in the hydration
dynamics. Further sterical constraints on water molecules in hydrophobic pockets,
grooves, clefts result in retardation of water dynamics and a blue shift in the THz
absorption spectrum. This explains the experimental observations showing that THz
absorption of the irreversible refolded protein from unfolded state is lower than the
absorption of the native protein in the frequency range from 0.1 to 1.2 THz while it is
higher in the frequency range from 2.1 to 2.8 THz. This combined study using CD,
fluorescence, and THz spectroscopy show a clear correlation between structural changes
and changes in the hydration dynamics for HSA protein.

109
7 Kinetic THz absorption upon T-jump
The kinetics of biomolecules like proteins is critical for biological functions. One of the
most important subjects which attract scientists from different disciplines is protein
folding. This fundamental biochemical process is still a challenge in science [177]. To
study a rapid kinetic process experimentally, a technique to change the equilibrium of
the sample within a short time is required. After being disturbed, the sample relaxes to
its original equilibrium. The induced kinetic changes are monitored with a spectroscopic
method. In order to do this, the surrounding conditions of the studied molecules have to
be changed. A wide range of techniques have been employed for kinetic studies, such as
stopped-flow and continuous-flow techniques to change the solution condition by
rapidly mixing [178, 179], pressure jump technique to change the pressure applied to
the sample [180], temperature jump (T-jump) technique to change the temperature of
the sample [181], as well as theoretical MD simulations [182].
T-jump is the most widely used technique because of its sufficient jump size, high
speed, and minor disturbance to the sample environment. For the kinetic study of
protein folding, T-jump can be used to initiate both the unfolding to heat denatured
states [183], and the folding from cold denatured states [10]. There are three main
techniques to initiate a T-jump. The first technique was developed in the 1960s, using
electrical current pulses to obtain rapid heating of high conductive solutions. This
technique was used for kinetic studies in the ms times cale [184]. Later, when pulsed
lasers were developed, laser pulses were used for T-jump. This technique offered better
timescales, but a special dye which has high absorption at the laser frequency had to be
added to the solution [185]. Recently, Raman shifted laser pulses at wavelengths
between 1300 and 2100 nm were used to directly heat the water in the aqueous solution
by exiting the OH overtone of water molecules [186]. This approach has a number of
advantages, such as no high conductive solution or dye is required and the timescales
can reach ns and sub-ns.
A number of spectroscopic methods have been combined with T-jump to probe the
generated kinetic processes. Fluorescence technique was used to measure the rapid
refolding dynamics of apomyoglobin by recording the fluorescent signals of tryptophan
[187]. Time resolved IR spectroscopy was used to probe the relaxation kinetics induced

7. Kinetic THz absorption upon T-jump
110
by T-jump of cyclic β-hairpin peptides by measuring the IR absorption of the amide I´
band [188]. Time resolved Raman measurements investigated the thermal unfolding of
ribonuclease A [189]. Nanosecond time resolved optical rotatory dispersion techniques
with high specificity to secondary structure were used for sub-ms unfolding studies of
ribonuclease A and cytochrome c [190]. All these methods probed the kinetics directly
from structural changes of the studied biomolecules. Kinetic THz absorption
spectroscopy (KITA) using the THz-TDS is a high sensitive detection method to
observe changes of water dynamics in the hydration shells around biomolecules [11].
The combination between KITA and T-jump offers a new opportunity to observe the
kinetics of biomolecules like proteins through the kinetics of water molecules in the
coupled hydration shells.
A part of this thesis is to setup a new T-jump apparatus and improve the existing THz-
TDS to enable a feasible combination between T-jump and KITA. The main
improvements of the THz-TDS include the better focus of THz beam at the sample
position and the data acquisition process to reproducibly record THz signal upon T-
jump. In order to probe the kinetics induced by T-jump, the size of the THz beam must
be smaller than that of the heating beam at the sample position. For a significant T-jump
(∆T ≈ 5-10°C), the diameter of the heating beam must be smaller than 2 mm [186].
Therefore, the THz beam size has to be focused as small as possible, at least smaller
than 2 mm. Following sections will give an overview of the setup and experimental
results of the measurements with water and proteins.
7.1 Focusing of THz beam
The propagation of the THz beam is illustrated in Figure 7.1. After being emitted from
the THz emitter, the THz beam is focused on the sample position by two off-axis
parabolic mirrors. Then, two other parabolic mirrors focus the beam on a ZnTe crystal
for detection. The focal lengths of the parabolic mirrors will define the size of the beam
at the sample position. As mentioned previously, an important requirement of T-jump
experiments is that the THz beam must be focused as small as possible at the sample
position. The THz beam pattern from the emitter is approximately a Gaussian beam and
the parabolic mirror with focal length f can be considered as a thin lens with the same
focal length [191]. Therefore, matrix optics for Gaussian beams can be used to calculate
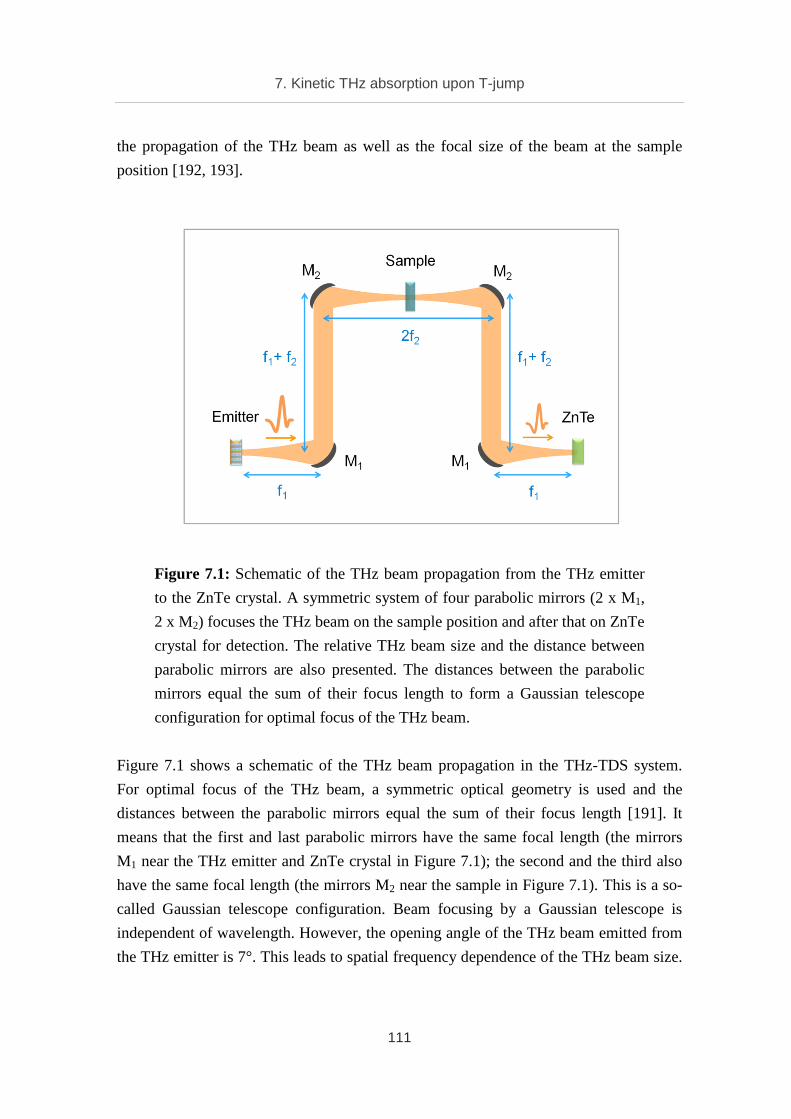
7. Kinetic THz absorption upon T-jump
111
the propagation of the THz beam as well as the focal size of the beam at the sample
position [192, 193].
Figure 7.1: Schematic of the THz beam propagation from the THz emitter
to the ZnTe crystal. A symmetric system of four parabolic mirrors (2 x M1,
2 x M2) focuses the THz beam on the sample position and after that on ZnTe
crystal for detection. The relative THz beam size and the distance between
parabolic mirrors are also presented. The distances between the parabolic
mirrors equal the sum of their focus length to form a Gaussian telescope
configuration for optimal focus of the THz beam.
Figure 7.1 shows a schematic of the THz beam propagation in the THz-TDS system.
For optimal focus of the THz beam, a symmetric optical geometry is used and the
distances between the parabolic mirrors equal the sum of their focus length [191]. It
means that the first and last parabolic mirrors have the same focal length (the mirrors
M1 near the THz emitter and ZnTe crystal in Figure 7.1); the second and the third also
have the same focal length (the mirrors M2 near the sample in Figure 7.1). This is a so-
called Gaussian telescope configuration. Beam focusing by a Gaussian telescope is
independent of wavelength. However, the opening angle of the THz beam emitted from
the THz emitter is 7°. This leads to spatial frequency dependence of the THz beam size.

7. Kinetic THz absorption upon T-jump
112
Using matrix optics, the beam radius of the THz beam can be calculated at every
position of its propagation way [192, 193]. Figure 7.1 also presents the relative THz
beam size in the THz-TDS system. The system of four parabolic mirrors focuses the
THz beam emitted from the THz emitter on the sample position and after that on ZnTe
crystal for detection.
Figure 7.2: Frequency dependent THz beam radius at the sample position
for three representative mirror systems calculated with matrix optics. The
combination of the new setup (f1 = f2 = 10 cm) is the best solution with
smallest beam radius.
THz beam radius at the sample position is the most important parameter to design the
set up. It depends on the focal length f1, f2, and the frequency. In order to have enough
room for the sample and for the guiding of heating pulses for T-jump, the distance
between two M2 parabolic mirrors near the sample must be at least 20 cm. Based on the
calculation, the optimal solution with four parabolic mirrors of the same focal length of
10 cm (50.8 x 50.8mm, 90 degree off-axis parabolic aluminum mirrors, Edmunds
Optics) was chosen for the new setup. The focus of the THz beam at the sample position
is significantly improved compared to the previous setup where the THz system had f1 =
5 cm and f2 = 15 cm. Figure 7.2 shows the calculated frequency dependent THz beam
radius at the sample position for three representative cases. It is clear that the
combination f1 = f2 = 10 cm (new setup) has the smallest beam radius which is about
twice smaller than the combination f1 = 5 cm, f2 = 10 cm and is about three times

7. Kinetic THz absorption upon T-jump
113
smaller than the combination of the old setup (f1 = 5 cm, f2 = 15 cm). The beam radius
is frequency dependent, the higher the frequency, the smaller the beam radius. For the
new setup, the beam radius is below 1.5 mm for the frequency range above 0.5 THz,
and it is smaller than 1.0 mm for the frequency higher than 0.7 THz. This focusing of
the THz beam is sufficient for T-jump experiments.
7.2 T-jump apparatus
7.2.1 Overview
Figure 7.3: Schematic of the T-jump apparatus (TFP: thin-film polarizer,
λ/4: quarter wave plate, L: lens, R: 1.06 µm high reflector, P: prism). The
Nd:YAG laser generates 5 ns laser pulses at 1.06 µm wavelength. The
Raman shifter converts the wavelength of the laser pulses to 1.54 µm which
can directly heat water in an aqueous sample to induce T-jump.
Figure 7.3 shows a schematic of the T-jump apparatus. The main components of the T-
jump setup are a Q-switched Nd:YAG laser (model Surelite III-10, Continuum), and a
one-meter long Raman shifter (model 101 PAL, Light Age). The Nd:YAG laser
generates high power short laser pulses (800 mJ/pulse, 5 ns FWHM) at 1.06 µm
wavelength and serves as a pump source. All optical components used in the T-jump
apparatus are specially designed and have high damage thresholds in order to transmit

7. Kinetic THz absorption upon T-jump
114
or reflect the high power laser pulses. Mirrors used to reflect the Nd:YAG laser beam
are special laser line mirrors (model NB1-K13, Thorlabs). An optical isolator consisting
of a thin film polarizer (model 11B00HP.6, Newport) and an achromatic quarter wave
plate (model AQWP05M-950, Thorlabs) are used to prevent the back reflection of the
laser beam. After propagating the optical isolator, the laser beam is collimated to the
Raman shifter by a lens (model LB4374, Thorlabs).
The Raman shifter, containing 25 bar methane gas, converts the laser wavelength from
1.06 µm to 1.54 µm (first order Stokes light) thanks to the effective stimulated Raman
scattering [186]. The conversion efficiency is about 11%, from 400 mJ/pulse at 1.06 µm
wavelength to 45 mJ/pulse at 1.54 µm wavelength. After the Raman shifter, the
remaining radiation at 1.06 µm wavelength is separated from the Raman shifted pulses
by a 1.06 µm high reflector (specially designed by CVI Melles Griot to reflect
wavelength of 1.06 µm and transmit wavelength of 1.54 µm). The Raman shifted pulses
consist not only of first order Stokes light, but also higher order Stokes light as well as
anti-Stokes light [194]. A dispersing prism (model PS853, Thorlabs) is used to separate
the first order Stokes light. Then the heating pulse is focused to the sample position.
With the wavelength of 1.54 µm, the heating pulse directly excites the OH stretching
overtone of water in aqueous samples. The absorption coefficient of water at 1.54 µm
wavelength is about 12 cm-1 at room temperature, which allows smooth and sufficient
T-jumps for kinetic studies [195].
7.2.2 Physical background
When a high power laser pulse is focused on a solution, the temperature change ∆o of
the solution in the absence of thermal diffusion is given by [195]:
∆o�º, �, �� � 0��¸ & ��º, �, �W�%��+
(7.1)
where º is the distance from the center axis, � is the axial position, � is the time, 0 is the
absorption cross section, � is the solution density, �¸ is the heat capacity of the solution,
��º� is the intensity profile of the laser pulse, and ��º, �, �� is the instantaneous laser
fluence at axial position � and time �. The laser intensity changes along the spatial

7. Kinetic THz absorption upon T-jump
115
coordinate � because of the absorption of the solution. The dependence of the intensity
on � can be calculated by the Lambert-Beer law:
��º, �� � � �º��'J� (7.2)
where L is the absorption coefficient of the solution. For aqueous solutions, the Raman
shifted laser pulse at a wavelength of 1.54 µm is usually used to induce T-jump. The
absorption coefficient L of water at this wavelength is about 12 cm-1 at 293 K. The
calculated temperature increase ∆o at the surface of the cell window is approximately
1°C for the integrated pulse energy of 1 mJ/mm2. As the absorption of water at a
wavelength of 1.54 µm decreases with increasing temperature, ∆o also decreases with
increasing temperature [195].
7.2.3 Q-switched Nd:YAG laser
Nd:YAG lasers are solid state lasers using neodymium doped yttrium aluminium garnet
(Nd:Y3Al 5O12 or Nd:YAG) as a lasing medium. The first Nd:YAG laser was
demonstrated in 1964 [196]. Since then, Nd:YAG crystal has been one of the most
widely used laser media for solid state lasers because of its stability, high gain
efficiency and low threshold pump power. Nd:YAG crystal is a four level gain medium
and has a strong absorption band around 800 nm wavelength. A flashlamp is usually
used to optically pump the crystal. The most common emission wavelength is 1.06 µm.
There are also other emission wavelengths around 0.94, 1.12, 1.32, and 1.44 µm.
Figure 7.4 shows a schematic of the laser process in Nd:YAG crystal. Being pumped by
a flashlamp, Nd3+ ions in the crystal are excited from the ground state (4I9/2) to the
excited state (4F5/2) [197]. Then, the excited ions quickly decay to the metastable laser
state (4F3/2) through nonradiative transitions. The laser state is a relatively long lived
state which allows the ions to build up a large population until population inversion is
achieved. Laser emission at 1.06 µm wavelength occurs through stimulated emission
when the ions decay from the laser state to the lower energy state (4I11/2). If the ions
decay to other energy states (such as 4I9/2, 4I13/2,
4I15/2) laser radiation at other
wavelengths will be emitted. Finally, the ions quickly return to the ground state through
nonradiative transitions.

7. Kinetic THz absorption upon T-jump
116
Figure 7.4: Schematic of the laser process of Nd:YAG crystal. The crystal
is a four level gain medium, can be optically pumped by a flashlamp and
commonly emits laser radiation at a wavelength of 1.06 µm.
Nd:YAG lasers operate in both continuous and pulsed mode. Q-switched Nd:YAG
lasers utilizing Q-switching is one of the most common used pulsed lasers with high
power pulse output. In Q-switching, the cavity feedback is blocked or the cavity loss is
increases, which allows the pumping process to build up a much larger than usual
population inversion. The attenuation inside the cavity corresponds to a decrease in the
quality factor (Q factor) of the optical cavity. When the cavity feedback is restored, or
the cavity Q is switched back to its usual high value, the accumulated population
inversion is depleted in a very short time, which results in a short laser pulse of a few ns
with high peak power [198].
Several methods have been developed to achieve Q-switching, such as electro-optical
shutters, rotating prisms, saturable absorbers, acousto-optical switches [199]. In the Q-
switched Nd:YAG laser Surelite III-10 of the T-jump apparatus, a Pockels cell having
Pockels electro-optical effect is used to induce the Q-switching. Figure 7.5 shows a
schematic of the laser cavity. The Pockels cell consists of a nonlinear crystal. With
applied bias voltage, the index of refraction of the nonlinear crystal changes and the
birefringence is proportional to the applied voltage.

7. Kinetic THz absorption upon T-jump
117
Figure 7.5: Schematic of the laser cavity of a Q-switched Nd:YAG laser
using a Pockels cell to electro-optically induce Q-switching.
A laser beam propagating from the active medium Nd:YAG crystal is linear polarized
by the polarizer. Then it is incident on the Pockels cell. The electric field of the
incoming light is at 45° to the birefringence axes ^ and _ of the Pockels cell and can be split into �a and �c components. When passing through the Pockels cell, �a and �c
have different phase shifts. With suitable bias voltage applied to the Pockels cell, these
two field components differ in phase by 90° when leaving the Pockels cell, and the light
becomes circularly polarized. It is then reflected by the rear mirror and passes through the Pockels cell once more. The phase difference between �a and �c now becomes
180°, which makes the light linear polarized again but the polarization is rotated 90°
compared to the original polarization. Consequently, the beam is reflected out of the
cavity by the polarizer and cannot reach the threshold for laser oscillation. This
condition indicates that the Q-switch is closed. When the bias voltage applied to the
Pockels cell is removed, the induced birefringence disappears. The light passing through
the Pockels cell experiences no change in polarization and can pass the polarizer on its
way back to initiate laser emission. In this case, the Q-switch is opened. The large
population inversion, achieved when the Q-switch is closed, results in a high peak
power for the emitted laser pulse.
The Q-switched Nd:YAG laser used in the current T-jump apparatus (model Surelite
III-10, Continuum) generates high power short laser pulses at 1.06 µm wavelength. The
power of a single pulse is about 800 mJ and its FWHM is about 5 ns. The maximum
repetition rate is 10 Hz (10 pulses per second). This rate can be varied from 0.1 to 10

7. Kinetic THz absorption upon T-jump
118
Hz. Furthermore, the laser can operate in single shot mode, in which a single pulse is
generated when the single shot button is pressed.
7.2.4 Raman shifter
Raman shifters utilize the effective stimulated Raman scattering to convert the
wavelength of a laser [186]. Raman scattering is the inelastic scattering of a photon. The
effect occurs when a photon is inelastically scattered from a molecule leaving the
molecule in an excited state and the wavelength of the photon shifted. Raman effect was
discovered in 1928 by the Indian physicist C. V. Raman who was awarded the Nobel
Prize in Physics in 1930 for this finding [200].
Figure 7.6: The possibilities of light scattering. Elastic scattering (Rayleigh
scattering) occurs when the incident and scattered photons have the same
frequency and kinetic energy. Inelastic scattering (Raman scattering) occurs
where the photon is scattered by an excitation and the scattered photons
have higher (anti-Stokes scattering) or lower (Stokes scattering) frequency
and kinetic energy than those of the incident photons.

7. Kinetic THz absorption upon T-jump
119
Figure 7.6 shows a schematic of the different possibilities of light scattering. Rayleigh
scattering is elastic scattering in which the incident and scattered photons have the same
frequency and kinetic energy. A part of the scattering is inelastic (Raman scattering) in
which the photon is scattered by an excitation and the scattered photons have a
frequency higher (anti-Stokes scattering) or lower (Stokes scattering) than that of the
incident photons. Stokes scattering occurs when the molecule absorbs energy of an
incident photon and is excited from the ground vibrational state to the virtual excited
stated, then it relaxes from the virtual excited stated to an excited vibrational state. The
scattered photon has less energy (lower frequency) than the incident photon. The 1st
order Stokes scattering occurs when the molecule relaxes to the 1st excited vibrational
state. Higher order Stokes scattering also occurs when the molecule relaxes to the higher
(2nd, 3rd,…) excited vibrational states.
Apart from being in the ground vibrational state, a small amount of molecules are at the
excited vibrational states before absorbing photons. The excited molecule relaxes from
the virtual excited stated to the ground vibrational state and loses energy compared to its
original state. As a consequence, the scattered photon has more energy (higher
frequency) than the incident photon. This is called anti-Stokes scattering. In general, the
intensity of anti-Stokes scattering is lower than that of Stokes scattering because only a
very small amount of molecules are at the excited vibrational states at ambient
condition. The first-order Stokes scattering has the highest intensity among all Raman
scatterings. The possibility for inelastic scattering is very low, about 10000 times less
likely than elastic scattering. However, with high power incident laser pulses, the
initially scattered photons can further enhance the process, which leads to stimulated
Raman scattering. An effective stimulated Raman scattering can reach conversion
efficiency of up to 40% for first-order Stokes scattering [201].
In the current T-jump apparatus, a one-meter long Raman shifter (model 101 PAL,
Light Age) containing 25 bar methane gas is used. This Raman shifter with two stable
blank windows at two ends can operate at a highest possible pressure of 100 bar. Gas in
the Raman shifter is circulated by a built-in motor. The conversion efficiency from the
wavelength of 1.06 µm (400 mJ/pulse) to the first-order Stokes wavelength of 1.54 µm
(45 mJ/pulse) is about 11%. This energy of the heating pulse is sufficient for a T-jump
of 5-7°C at a heating pulse diameter of about 2 mm.
7. Kinetic THz absorption upon T-jump
120
7.2.5 Experimental parameters
Different from normal THz-TDS experiments where a whole THz pulse is probed for
each measurement, in a T-jump experiment, only the signal of one point of the THz
pulse is probed for each measurement. This is the time dependent intensity before and
after T-jump, which shows the kinetic change of THz absorption upon T-jump. In order
to probe the kinetic change of the whole THz pulse, T-jump experiments for each single
point of the THz pulse have to be carried out.
The repetition rate of the heating pulses of the Q-switched Nd:YAG laser is chosen at 2
Hz. This is an optimal rate to ensure both the reproducibility of the aqueous samples
and short measurement time. For better time resolution, the integration time of the lock-
in amplifier is kept as short as possible (100 µs or shorter) because shorter integration
time will results in better (shorter) time resolution for the kinetic change upon T-jump.
However, shorter integration time also requires longer measurement time (average of
more data acquisitions) to reach an acceptable signal to noise ratio. For example, about
1000 data acquisitions (one data acquisition per one heating pulse) need to be collected
and averaged for a lock-in amplifier integration time of 100 µs, and 10000 data
acquisitions are required for an integration time of 10 µs in order to get the same signal
to noise ratio. With the heating pulse repetition rate of 2 Hz, approximately 9 and 90
minutes are required for one measurement with integration times of 100 µs and 10 µs,
respectively. A measurement lasting longer than 90 minutes can lead to instability of the
THz laser and systematic errors. Therefore, integration time of the THz-TDS was
chosen at 10 µs or longer. This spectrometer is designed to probe kinetic events
occurring in the µs to ms timescales.
The parameters of the THz-TDS for T-jump experiments are similar to those described
in Chapter 2. The THz emitter is modulated at a frequency of 200 kHz in square wave
form with an amplitude of 20 V. This modulated frequency serves as the reference
frequency in a lock-in amplifier. For T-jump measurements with integration time of 100
µs or longer, SR844 RF lock-in amplifier (Stanford Research Systems) at an input gain
of 24 dB and a sensitivity of 10 mV is used. For integration time shorter than 100 µs, a
computer controlled 50 MHz lock-in amplifier (model HF2LI, Zurich Instruments) at an
input gain of 48 dB and a sensitivity of 200 mV is used. Data acquisition is at a rate of
200 kHz, which gives a time resolution of 5 µs. For a typical T-jump measurement,
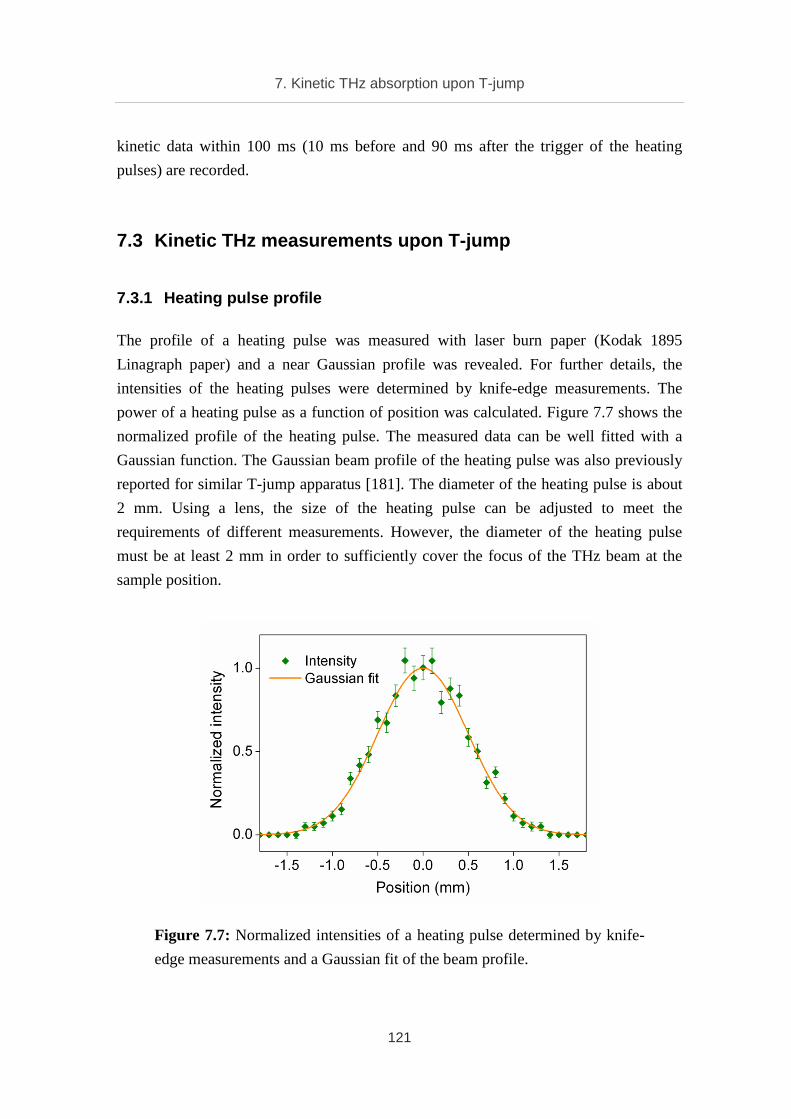
7. Kinetic THz absorption upon T-jump
121
kinetic data within 100 ms (10 ms before and 90 ms after the trigger of the heating
pulses) are recorded.
7.3 Kinetic THz measurements upon T-jump
7.3.1 Heating pulse profile
The profile of a heating pulse was measured with laser burn paper (Kodak 1895
Linagraph paper) and a near Gaussian profile was revealed. For further details, the
intensities of the heating pulses were determined by knife-edge measurements. The
power of a heating pulse as a function of position was calculated. Figure 7.7 shows the
normalized profile of the heating pulse. The measured data can be well fitted with a
Gaussian function. The Gaussian beam profile of the heating pulse was also previously
reported for similar T-jump apparatus [181]. The diameter of the heating pulse is about
2 mm. Using a lens, the size of the heating pulse can be adjusted to meet the
requirements of different measurements. However, the diameter of the heating pulse
must be at least 2 mm in order to sufficiently cover the focus of the THz beam at the
sample position.
Figure 7.7: Normalized intensities of a heating pulse determined by knife-
edge measurements and a Gaussian fit of the beam profile.

7. Kinetic THz absorption upon T-jump
122
7.3.2 Static temperature dependent THz absorption of water
Figure 7.8: Experimental results of static temperature dependent THz
measurements of water in the temperature range from 20 to 34°C for a cell
path length of 90 µm: (A) temporal THz pulses, (B) normalized THz peak
intensity for heating and cooling processes, (C) temperature dependent
absorption coefficient, (D) temperature dependent index of refraction.
In the THz frequency range, the absorption of water increases with increasing
temperature [67, 94]. Therefore, change in water absorption can be used as a
thermometer to measure the temperature increase upon T-jump. In order to set up a
calibration scale, the static temperature dependent THz absorption of water was
measured. Figure 7.8 shows the experimental results of water in the temperature range
from 20 to 34°C for a cell path length of 90 µm. Figure 7.8A displayed the temporal
THz pulses. With increasing temperature, the THz amplitude decreases, which indicates

7. Kinetic THz absorption upon T-jump
123
an increase in absorption of water as shown in Figure 7.8C. Furthermore, the whole
THz pulse shifts to the right with increasing temperature, which corresponds to an
increase of index of refraction as observed in Figure 7.8D. These results agree well with
a previous report in similar frequency and temperature range [202].
In a T-jump experiment, the time dependent intensity before and after T-jump of a
certain point of the THz pulse is measured. As observed in Figure 7.8A, the peak of the
THz pulse has the most significant change with temperature. Thus, this is the most
suitable position to carry out T-jump experiments as well as to build a calibration scale
for temperature dependent change in THz signal. Figure 7.8B shows the change of the
normalized THz peak intensity with temperature. Upon heating and cooling, the change
in intensity is reversible. With increasing temperature, the intensity decreases nearly
linearly. A linear fit of the data yields a slope of 0.01/°C, which means that the THz
peak intensity decreases by approximately 1% per 1°C. This behavior can be used as a
calibration scale to measure the increase in temperature upon T-jump.
7.3.3 KITA upon T-jump of water
7.3.3.1 Change in intensity at different positions of THz pulses upon T-jump
Figure 7.9A shows THz pulses from static measurements of water at different
temperatures. Different positions of the THz pulse have different changes upon increase
in temperature. At position 3, the THz intensity is nearly unchanged. THz intensity
decreases with increasing temperature at position 1 while a reverse behavior is observed
at position 2. The KITA measurement results of water upon T-jump at position 1, 2, and
3 of the THz pulse are presented in Figure 7.9B in an adjusted scale for comparison
with the temperature dependent static measurements. For all measurements, T-jump was
initiated at time 0. At the THz peak position (position 1), the THz intensity decreases
after the heating pulse meets the sample and it comes back to the original level after
some milliseconds. When compared to the same position of the static measurements in
Figure 7.9A, it is clear that the temperature of water does increase at the heating time,
then the heat is distributed to the surrounding and water is cooled to the original
equilibrium. At position 2, a reverse change upon T-jump is found. This also agrees
with the static measurements where an increase in THz intensity with increasing
temperature at position 2 is observed. Similar to the observations at position 1 and 2, the

7. Kinetic THz absorption upon T-jump
124
unchanged THz intensity upon T-jump at position 3 is the same as the behavior at the
corresponding position of the static measurements with increasing temperature. These
results confirm that the increase in temperature upon T-jump is observable by KITA.
Figure 7.9: (A) THz pulses obtained from static measurements of water at
different temperatures. Upon increasing temperature, different positions of
the THz pulse have different behaviors, such as decreased intensity at
position 1, increased intensity at position 2, or unchanged intensity at
position 3. (B) KITA upon T-jump of water measured at position 1, 2, and 3
of the THz pulse (in an adjusted scale). After T-jump (initiated at time 0),
the change in the THz intensity at each position is similar to the behavior at
the corresponding position of the static THz measurements with increasing
temperature.
The change in the frequency dependent absorption coefficient of water upon T-jump can
be obtained when the T-jump measurements of all points of the THz pulse are carried
out. Figure 7.10A shows the THz pulses of water before T-jump and at T-jump peak (at
highest water temperature) for a cell path length of 90 µm. Using the calculated
calibration scale, the temperature increase of 5°C is observed upon T-jump. Figure
7.10B shows the corresponding absorption coefficients and a clear increase in THz
absorption of water at T-jump peak is observed. The change of the THz pulse and
absorption with temperature is similar to the change observed by static measurements as

7. Kinetic THz absorption upon T-jump
125
presented in Figure 7.8A. Along the THz pulse, the THz peak position shows the most
significant change in intensity upon T-jump. A T-jump of 5°C results in negligible shift
of the THz peak position as observed in Figure 7.8A. Therefore, the THz peak is the
most suitable position for kinetic measurements, enabling the observation of kinetic
events with highest effectiveness. In the following parts, T-jump measurements were
carried out at the fixed THz peak position. The measured THz peak intensity was
normalized, in which it was divided by the average intensity before T-jump. The
presented KITA upon T-jump is the kinetic changes in normalized THz peak intensity.
The time � � 0 was defined as the time when the heating pulses were triggered.
Figure 7.10: Experimental results of KITA measurements of water at the
time before T-jump and at T-jump peak (maximum increased temperature):
(A) THz intensity at different positions of the THz pulses, (B) absorption
coefficients calculated from the THz pulses. The error bars of the data are
smaller than the dot size. The temperature of water increases by
approximately 5°C upon T-jump. Both THz pulses and absorption
coefficient show similar behaviors to those observed with static temperature
dependent measurements.
7.3.3.2 Distinct behaviors of water and other solvents
Figure 7.11 shows the KITA upon T-jump at THz peak position of H2O, D2O and
ethanol (C2H5OH) at 20°C. The heating pulse at a wavelength of 1.5 µm directly excites
the OH stretching overtone of H2O water to generate a sudden temperature increase,
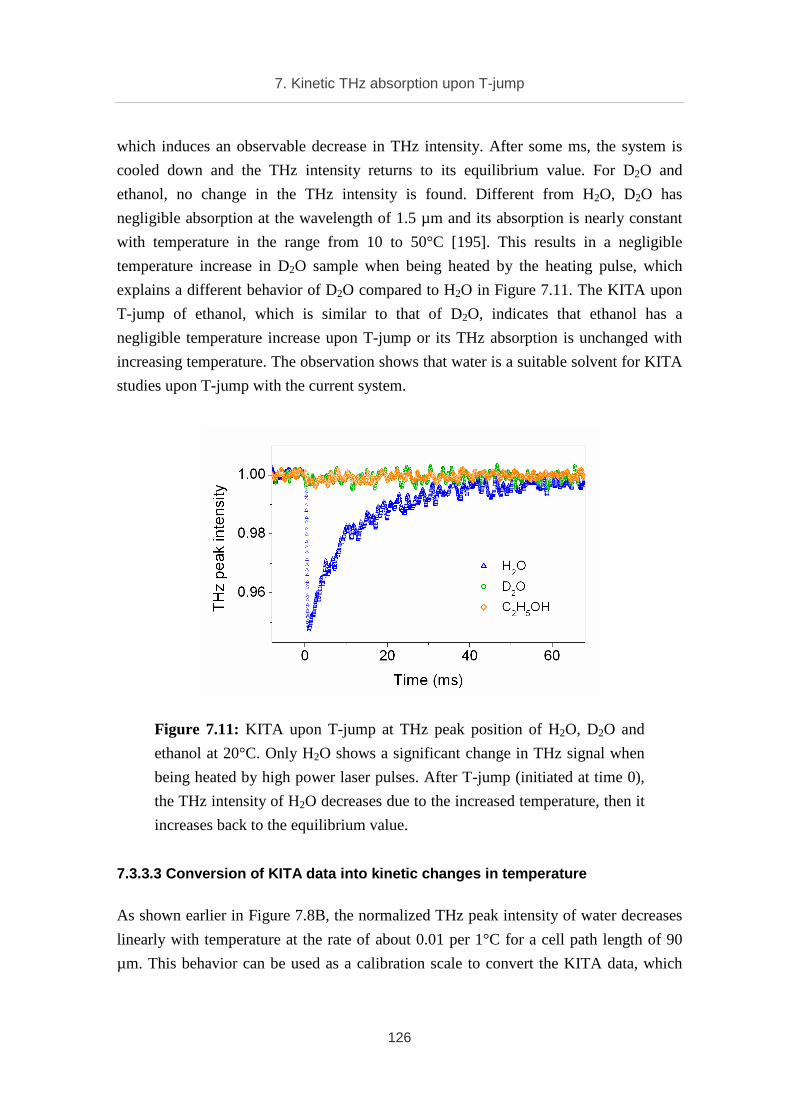
7. Kinetic THz absorption upon T-jump
126
which induces an observable decrease in THz intensity. After some ms, the system is
cooled down and the THz intensity returns to its equilibrium value. For D2O and
ethanol, no change in the THz intensity is found. Different from H2O, D2O has
negligible absorption at the wavelength of 1.5 µm and its absorption is nearly constant
with temperature in the range from 10 to 50°C [195]. This results in a negligible
temperature increase in D2O sample when being heated by the heating pulse, which
explains a different behavior of D2O compared to H2O in Figure 7.11. The KITA upon
T-jump of ethanol, which is similar to that of D2O, indicates that ethanol has a
negligible temperature increase upon T-jump or its THz absorption is unchanged with
increasing temperature. The observation shows that water is a suitable solvent for KITA
studies upon T-jump with the current system.
Figure 7.11: KITA upon T-jump at THz peak position of H2O, D2O and
ethanol at 20°C. Only H2O shows a significant change in THz signal when
being heated by high power laser pulses. After T-jump (initiated at time 0),
the THz intensity of H2O decreases due to the increased temperature, then it
increases back to the equilibrium value.
7.3.3.3 Conversion of KITA data into kinetic changes in temperature
As shown earlier in Figure 7.8B, the normalized THz peak intensity of water decreases
linearly with temperature at the rate of about 0.01 per 1°C for a cell path length of 90
µm. This behavior can be used as a calibration scale to convert the KITA data, which

7. Kinetic THz absorption upon T-jump
127
are the kinetic changes in normalized THz peak intensity (���� "��.), into kinetic
changes in temperature (∆o) using following approximation equation:
∆o � 100O1 $ ���� "��.P (7.3)
Figure 7.12: KITA upon T-jump of water at THz peak position for a cell
path length of 90 µm: (A) measured change in THz peak intensity, (B)
calculated change in temperature. Upon T-jump, water is heated up by about
5°C, then it is cooled down to the equilibrium temperature.
Figure 7.12 shows an example of the conversion of the KITA data of water into kinetic
changes in temperature. At the lowest position, the THz intensity decreases by about 5%
compared to the equilibrium intensity, which means that the maximum increased
temperature is about 5°C. Upon T-jump, water temperature increases to the maximum
temperature very quickly while the subsequent cooling to the equilibrium, resulted from
the heat transfer to the surrounding, occurs much longer. This behavior is in good
agreement with a previous study, in which the change in temperature was measured
with IR spectroscopy [186].
7.3.3.4 Influence of integration time
Previous studies by IR spectroscopy showed that when laser pulses at 1.54 µm
wavelength is used to pump the OH overtone of water, temperature increase in water
occurs within about 100 ps [10]. As mentioned before, the time resolution of a KITA

7. Kinetic THz absorption upon T-jump
128
measurement is limited to the order of some µs because the available lock-in amplifier
has a minimum integration time of 1 µs. Furthermore, instability of the THz laser and
systematic errors may occur for long measurements which are required for short time
resolution (e.g. 90 minutes are required for a T-jump measurement with an integration
time of 10 µs). Figure 7.13 shows the KITA upon T-jump of water at 20°C for a cell
path length of 90 µm with three different integration times of the lock-in amplifier (100,
20, and 10 µs). The shorter integration time, which results in better time resolution,
requires longer measurement time (average of more data acquisitions) to reach an
acceptable signal to noise ratio.
Figure 7.13: KITA upon T-jump of water with three integration times of
100, 20, and 10 µs: (A) fast heating and slow cooling processes, (B) zoomed
region of the temperature increase in the heating process. The solid lines are
single exponential fits and τ values are the fitted time constants. The fitted
cooling times in (A) are almost the same while the fitted heating times in
(B) are significantly different with different integration times.
Figure 7.13A shows the KITA upon T-jump of water with three different integration
times. When the heating pulse meets the sample at time 0, water is heated by about 5°C.
After that, water temperature slowly decreases to the equilibrium value. As observed
from the figure, the cooling curves of all measurements are similar and have an
exponential relaxation form. Single exponential fits of the experimental data yield the
average relaxation time for water cooling of about �10.7 � 0.8� ms, which agrees well
with a previous IR spectroscopy study for a similar path length [181]. Figure 7.13B

7. Kinetic THz absorption upon T-jump
129
zooms the area of the heating process. At this shorter timescale, the different integration
times result in different fitted time constants. The heating times probed by KITA, which
are obtained from single exponential fits of the experimental data, are nearly
proportional to the integration times. The heating time upon T-jump represents the
temperature rise time from the equilibrium to the highest temperature. The integration
times of 100, 20, 10 µs result in heating times of �270 � 6�, �54 � 3�, �21 � 2� µs,
respectively. The heating time probed by IR spectroscopy is much shorter, about 100 ps,
as reported in a previous study [10]. With the shortest integration time of 10 µs, the
combination between T-jump and KITA is suitable to detect kinetic events in the µs and
ms timescales. Long integration time should be used for measurements of long kinetic
events to reduce measurement time.
7.3.3.5 Influence of temperature
Figure 7.14: KITA upon T-jump of water at 5°C, 20°C and 50°C for a cell
path length of 90 µm. The solid lines are single exponential fits and τ values
are the fitted time constants. With increasing starting temperature, the
maximum decrease in THz peak intensity, corresponding to the maximum
increased temperatures, decreases while the fitted cooling time increases
slightly.
At the wavelength of the heating pulse (1.54 µm), the absorption coefficient of water
decreases by approximately 0.5% per degree, from about 13.5 cm–1 at 5°C to 12.0 cm-1

7. Kinetic THz absorption upon T-jump
130
at 20°C and 10.2 cm–1 at 50°C [195]. Therefore, T-jump of water is expected to
decrease when the starting temperature increases. Figure 7.14 shows the KITA upon T-
jump of water at 5, 20 and 50°C for a cell path length of 90 µm. The cooling time
obtained from the single exponential fit of the measured water cooling curve after T-
jump increases slightly with temperature, from �10.5 � 0.3� ms at 5°C to �11.5 � 0.6�
ms at 50°C. The calculated maximum increased temperatures are approximately 5.2, 5.1
and 4.5°C for T-jump at 5, 20 and 50°C, respectively. The decrease in T-jump with
increasing starting temperature is in good correlation with the decrease in absorption
coefficient of water with increasing temperature. At low temperature, the fluctuation of
the measured signals (noise level) is lower than that at high temperature. This
observation can be explained by a significant increase of water absorption with
temperature as shown in Figure 7.8C. Higher absorption of water in the samples allows
less THz signal to reach the detector, and consequently reduces the signal to noise ratio.
Therefore, T-jump measurements at low temperature are preferable.
7.3.3.6 Influence of cell path length
Figure 7.15: KITA upon T-jump at 20°C with three different path lengths.
Water was used for the path lengths of 50 and 90 µm while a mixture of
60% water and 40% ethylene glycol was used for the path length of 210 µm.
The solid lines are single exponential fits and τ values are the fitted time
constants. The fitted cooling time significantly increases with increasing
path length.
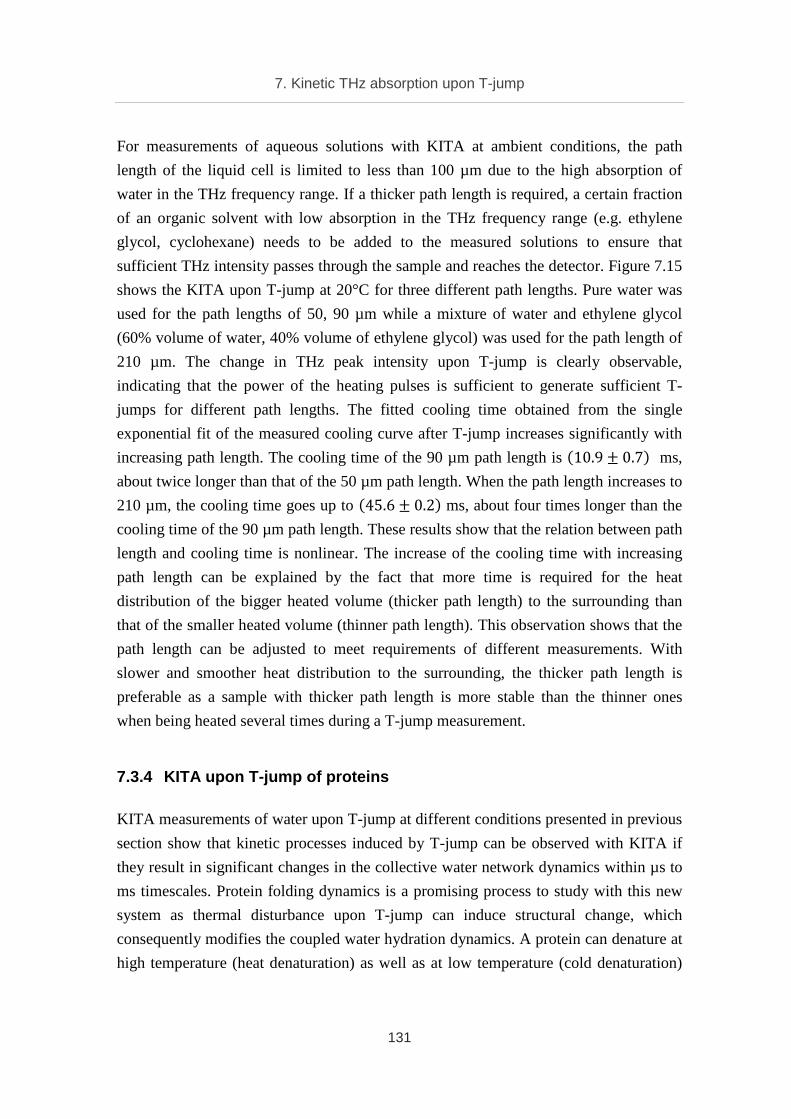
7. Kinetic THz absorption upon T-jump
131
For measurements of aqueous solutions with KITA at ambient conditions, the path
length of the liquid cell is limited to less than 100 µm due to the high absorption of
water in the THz frequency range. If a thicker path length is required, a certain fraction
of an organic solvent with low absorption in the THz frequency range (e.g. ethylene
glycol, cyclohexane) needs to be added to the measured solutions to ensure that
sufficient THz intensity passes through the sample and reaches the detector. Figure 7.15
shows the KITA upon T-jump at 20°C for three different path lengths. Pure water was
used for the path lengths of 50, 90 µm while a mixture of water and ethylene glycol
(60% volume of water, 40% volume of ethylene glycol) was used for the path length of
210 µm. The change in THz peak intensity upon T-jump is clearly observable,
indicating that the power of the heating pulses is sufficient to generate sufficient T-
jumps for different path lengths. The fitted cooling time obtained from the single
exponential fit of the measured cooling curve after T-jump increases significantly with
increasing path length. The cooling time of the 90 µm path length is �10.9 � 0.7� ms,
about twice longer than that of the 50 µm path length. When the path length increases to
210 µm, the cooling time goes up to �45.6 � 0.2� ms, about four times longer than the
cooling time of the 90 µm path length. These results show that the relation between path
length and cooling time is nonlinear. The increase of the cooling time with increasing
path length can be explained by the fact that more time is required for the heat
distribution of the bigger heated volume (thicker path length) to the surrounding than
that of the smaller heated volume (thinner path length). This observation shows that the
path length can be adjusted to meet requirements of different measurements. With
slower and smoother heat distribution to the surrounding, the thicker path length is
preferable as a sample with thicker path length is more stable than the thinner ones
when being heated several times during a T-jump measurement.
7.3.4 KITA upon T-jump of proteins
KITA measurements of water upon T-jump at different conditions presented in previous
section show that kinetic processes induced by T-jump can be observed with KITA if
they result in significant changes in the collective water network dynamics within µs to
ms timescales. Protein folding dynamics is a promising process to study with this new
system as thermal disturbance upon T-jump can induce structural change, which
consequently modifies the coupled water hydration dynamics. A protein can denature at
high temperature (heat denaturation) as well as at low temperature (cold denaturation)

7. Kinetic THz absorption upon T-jump
132
[203, 204]. For the kinetic study of protein folding, an upward temperature increase
upon T-jump can be used to initiate both rapid unfolding to heat denatured states, and
rapid refolding from cold denatured states [10].
Figure 7.16: Structures of the investigated proteins and surrounding water
molecules. The protein structures are derived from the PDB files: 3KZ3 (λ-
repressor), 1AO6 (human serum albumin), and 1UBQ (ubiquitin).
Figure 7.16 shows the structures of three investigated proteins and surrounding water
molecules. The wild type λ-repressor (λ-WT) is a five helix bundle protein λ6-85, which
is the N-terminal residue 6-85 fragment of the λ-repressor [205, 206]. λ-WT consists of
80 residues and has a molecular mass of 9.2 kDa. The λ-repressor is a member of a
large family of prokaryotic DNA-binding proteins [207]. The repressor monitors the
growing of lysogens, controls gene expression, stimulating transcription of its own
gene. Human serum albumin (HSA) is the most abundant protein in blood plasma,
containing 585 amino acids and having a molecular mass of 66.5 kDa [149, 150]. In the
native state, HSA adopts a heart-shaped three-dimensional structure with three domains.
HSA transports metabolites, metals, amino acids, fatty acids, drugs, and other
compounds in the bloodstream to their target organs. It also buffers pH and maintains
osmotic pressure in blood plasma. Ubiquitin (UBQ) consists of a single polypeptide
chain of 76 amino acid residues with a molecular mass of 8.6 kDa [137, 208]. It exists
in all eukaryotic cells and performs its main function as an annihilator of unneeded
proteins. UBQ can be covalently attached to target proteins to signal their subsequent
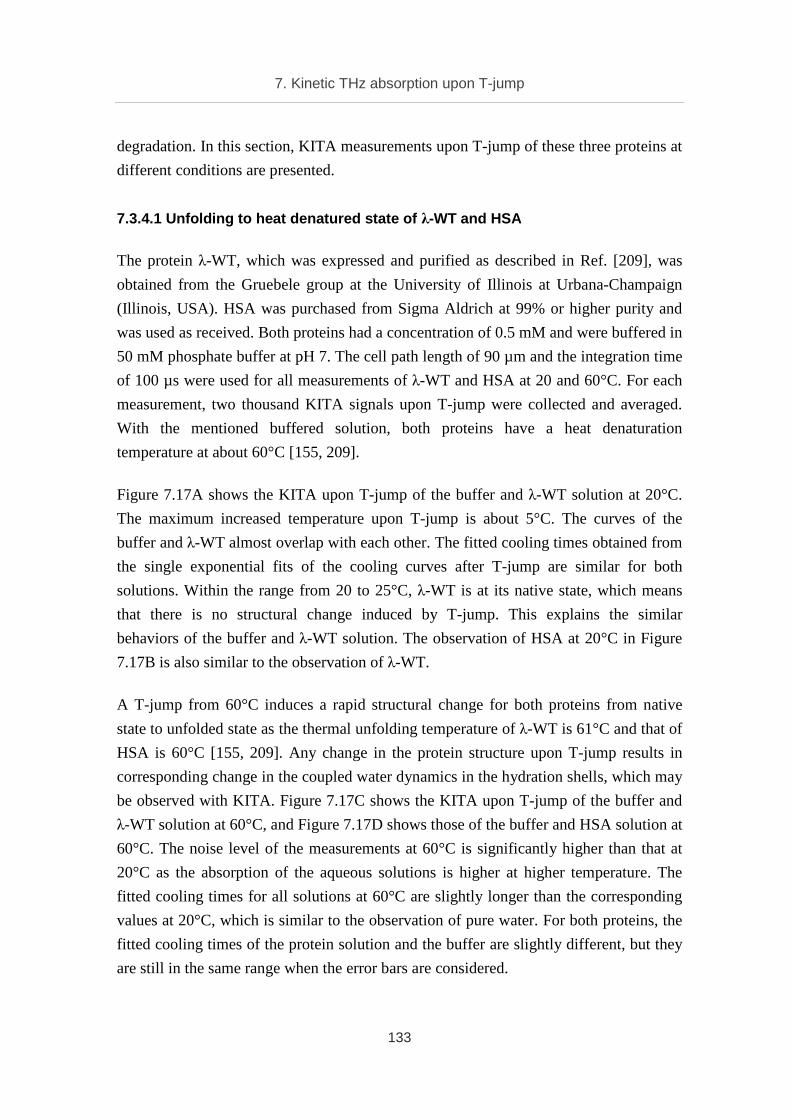
7. Kinetic THz absorption upon T-jump
133
degradation. In this section, KITA measurements upon T-jump of these three proteins at
different conditions are presented.
7.3.4.1 Unfolding to heat denatured state of λ-WT and HSA
The protein λ-WT, which was expressed and purified as described in Ref. [209], was
obtained from the Gruebele group at the University of Illinois at Urbana-Champaign
(Illinois, USA). HSA was purchased from Sigma Aldrich at 99% or higher purity and
was used as received. Both proteins had a concentration of 0.5 mM and were buffered in
50 mM phosphate buffer at pH 7. The cell path length of 90 µm and the integration time
of 100 µs were used for all measurements of λ-WT and HSA at 20 and 60°C. For each
measurement, two thousand KITA signals upon T-jump were collected and averaged.
With the mentioned buffered solution, both proteins have a heat denaturation
temperature at about 60°C [155, 209].
Figure 7.17A shows the KITA upon T-jump of the buffer and λ-WT solution at 20°C.
The maximum increased temperature upon T-jump is about 5°C. The curves of the
buffer and λ-WT almost overlap with each other. The fitted cooling times obtained from
the single exponential fits of the cooling curves after T-jump are similar for both
solutions. Within the range from 20 to 25°C, λ-WT is at its native state, which means
that there is no structural change induced by T-jump. This explains the similar
behaviors of the buffer and λ-WT solution. The observation of HSA at 20°C in Figure
7.17B is also similar to the observation of λ-WT.
A T-jump from 60°C induces a rapid structural change for both proteins from native
state to unfolded state as the thermal unfolding temperature of λ-WT is 61°C and that of
HSA is 60°C [155, 209]. Any change in the protein structure upon T-jump results in
corresponding change in the coupled water dynamics in the hydration shells, which may
be observed with KITA. Figure 7.17C shows the KITA upon T-jump of the buffer and
λ-WT solution at 60°C, and Figure 7.17D shows those of the buffer and HSA solution at
60°C. The noise level of the measurements at 60°C is significantly higher than that at
20°C as the absorption of the aqueous solutions is higher at higher temperature. The
fitted cooling times for all solutions at 60°C are slightly longer than the corresponding
values at 20°C, which is similar to the observation of pure water. For both proteins, the
fitted cooling times of the protein solution and the buffer are slightly different, but they
are still in the same range when the error bars are considered.

7. Kinetic THz absorption upon T-jump
134
Figure 7.17: KITA upon T-jump of: (A) buffer and λ-WT solution at 20°C,
(B) buffer and HSA solution at 20°C, (C) buffer and λ-WT solution at 60°C,
(D) buffer and HSA solution at 60°C. The solid lines show single
exponential fits of the cooling curves after T-jump and the fitted cooling
times τ are indicated for each solution.
The results indicate that the unobservable change in KITA upon T-jump of thermal
protein denaturation probably results from the high absorption or the high noise level at
the heat denatured temperature of the proteins. Furthermore, the observed unfolding
rates of λ-WT is in the order of a few µs [209], which is closed to the time resolution of
the KITA system. Therefore, studies of slower kinetic refolding processes of cold
denatured proteins may minimize these problems.
7.3.4.2 Refolding from cold denatured state of UBQ
UBQ was purchased from Sigma Aldrich at 98% or higher purity and was used as
received. UBQ with the concentration of 2 mM was measured at 0°C with the cell path
length of 210 µm. To avoid crystallization of water at 0°C and reduce the absorption of
the protein solution, a mixture of water and ethylene glycol (60% volume of water and

7. Kinetic THz absorption upon T-jump
135
40% volume of ethylene glycol, freezing point at about -20°C) with 50 mM magnesium
acetate and 3.5 M guanidinium hydrochloride (GdmCl) at pH 4.0 was used as a buffer.
With this buffered solution, the protein refolds from its cold denaturation state at about
0°C as observed in a previous study [204]. A T-jump from 0°C induces a refolding
process of UBQ from its cold denatured state.
Figure 7.18: KITA upon T-jump of buffer and 2 mM UBQ solution for: (A)
fast heating process in the µs timescale, (B) slow cooling processes in the
ms timescale. The solid lines are single exponential fits and τ values are the
fitted time constants.
Figure 7.18A shows the KITA upon T-jump of the buffer and 2 mM UBQ solution
during the fast heating process in the µs timescale. The integration time of 10 µs was
chosen to probe the fast kinetic change. For each measurement, 10000 KITA signals
upon T-jump were collected and averaged. The fitted heating times obtained from the
single exponential fits of the heating curves are �51.9 � 3.1� µs and �42.8 � 2.8� µs for
the buffer and UBQ solution, respectively. The heating time of UBQ solution is faster
than that of buffer. Figure 7.18B shows the KITA upon T-jump of the buffer and 2 mM
UBQ in a longer timescale. The integration time was fixed at 100 µs as these
measurements focused on the slow cooling process in the ms timescale. For each
measurement, 2000 KITA signals upon T-jump were collected and averaged. Single
exponential fits of the cooling curves yield cooling times of �44.4 � 0.5� ms and
�39.9 � 0.5� ms for the buffer and UBQ solution, respectively. Similar to the behavior

7. Kinetic THz absorption upon T-jump
136
in the heating process, the cooling time of the protein solution is typically faster than
that of the buffer.
The KITA upon T-jump shown in Figure 7.18 are the averaged data of several single
measurements. In order to check the reproducibility of the observed results, single
exponential fits of the KITA experimental data upon T-jump in both heating and
cooling processes were carried out for all measurements. The yielded time constants are
shown in Figure 7.19. For both processes, the time constants of the protein solution are
distinctly smaller than those of the buffer.
Figure 7.19: Fitted time constants of different measurements of the buffer
and 2 mM UBQ solution obtained from the single exponential fits of the
KITA experimental data upon T-jump for: (A) fast heating process in the µs
timescale, (B) slow cooling processes in the ms timescale. The averaged
time constants are plotted in hollow symbols at measurement 0. Both the
heating and cooling processes of the protein solution are typically faster
than that of the buffer.
The observed different behaviors between the buffer and the protein solution upon T-
jump probed by KITA indicate that the structural perturbation during
refolding/unfolding process does induce changes in dynamics of hydration water and
these changes are reflected by observable changes in KITA data. However, the
separation of the influence only from protein folding dynamics when comparing the
kinetic change of protein solution to that of the buffer is still difficult because their
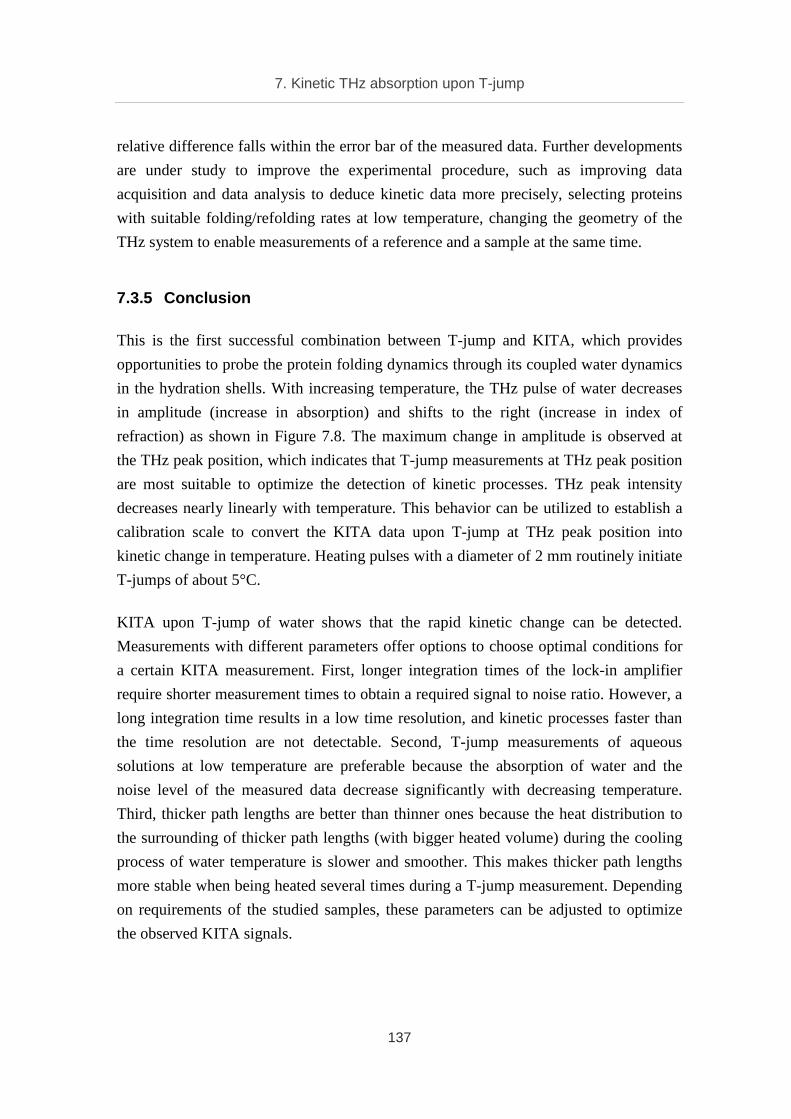
7. Kinetic THz absorption upon T-jump
137
relative difference falls within the error bar of the measured data. Further developments
are under study to improve the experimental procedure, such as improving data
acquisition and data analysis to deduce kinetic data more precisely, selecting proteins
with suitable folding/refolding rates at low temperature, changing the geometry of the
THz system to enable measurements of a reference and a sample at the same time.
7.3.5 Conclusion
This is the first successful combination between T-jump and KITA, which provides
opportunities to probe the protein folding dynamics through its coupled water dynamics
in the hydration shells. With increasing temperature, the THz pulse of water decreases
in amplitude (increase in absorption) and shifts to the right (increase in index of
refraction) as shown in Figure 7.8. The maximum change in amplitude is observed at
the THz peak position, which indicates that T-jump measurements at THz peak position
are most suitable to optimize the detection of kinetic processes. THz peak intensity
decreases nearly linearly with temperature. This behavior can be utilized to establish a
calibration scale to convert the KITA data upon T-jump at THz peak position into
kinetic change in temperature. Heating pulses with a diameter of 2 mm routinely initiate
T-jumps of about 5°C.
KITA upon T-jump of water shows that the rapid kinetic change can be detected.
Measurements with different parameters offer options to choose optimal conditions for
a certain KITA measurement. First, longer integration times of the lock-in amplifier
require shorter measurement times to obtain a required signal to noise ratio. However, a
long integration time results in a low time resolution, and kinetic processes faster than
the time resolution are not detectable. Second, T-jump measurements of aqueous
solutions at low temperature are preferable because the absorption of water and the
noise level of the measured data decrease significantly with decreasing temperature.
Third, thicker path lengths are better than thinner ones because the heat distribution to
the surrounding of thicker path lengths (with bigger heated volume) during the cooling
process of water temperature is slower and smoother. This makes thicker path lengths
more stable when being heated several times during a T-jump measurement. Depending
on requirements of the studied samples, these parameters can be adjusted to optimize
the observed KITA signals.
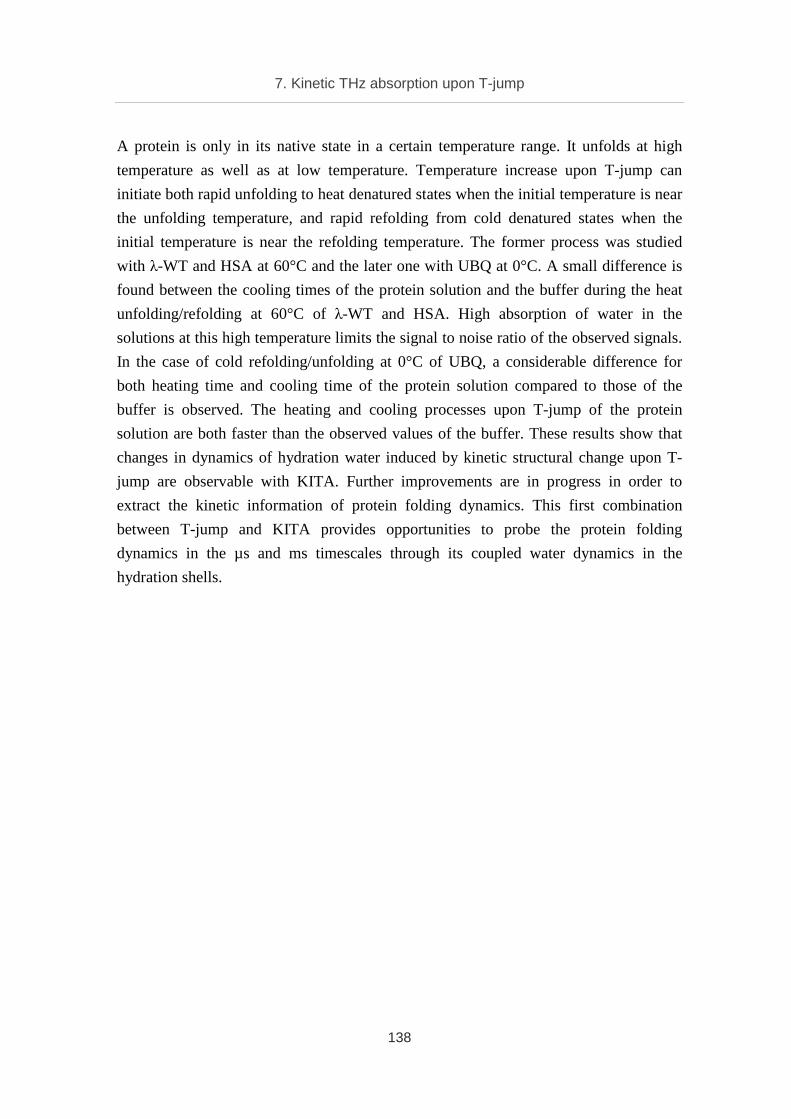
7. Kinetic THz absorption upon T-jump
138
A protein is only in its native state in a certain temperature range. It unfolds at high
temperature as well as at low temperature. Temperature increase upon T-jump can
initiate both rapid unfolding to heat denatured states when the initial temperature is near
the unfolding temperature, and rapid refolding from cold denatured states when the
initial temperature is near the refolding temperature. The former process was studied
with λ-WT and HSA at 60°C and the later one with UBQ at 0°C. A small difference is
found between the cooling times of the protein solution and the buffer during the heat
unfolding/refolding at 60°C of λ-WT and HSA. High absorption of water in the
solutions at this high temperature limits the signal to noise ratio of the observed signals.
In the case of cold refolding/unfolding at 0°C of UBQ, a considerable difference for
both heating time and cooling time of the protein solution compared to those of the
buffer is observed. The heating and cooling processes upon T-jump of the protein
solution are both faster than the observed values of the buffer. These results show that
changes in dynamics of hydration water induced by kinetic structural change upon T-
jump are observable with KITA. Further improvements are in progress in order to
extract the kinetic information of protein folding dynamics. This first combination
between T-jump and KITA provides opportunities to probe the protein folding
dynamics in the µs and ms timescales through its coupled water dynamics in the
hydration shells.
139
8 Summary and outlook
THz-TDS and FTIR spectroscopy were used as the main experimental techniques to
study confined water. THz-TDS (investigated frequency range 3-45 cm-1) is sensitive to
intermolecular water network vibrations. FIR-FTIR spectroscopy (50-650 cm-1) probes
the intermolecular network vibrations and librational motions of water. The
intramolecular OH stretching modes of water were measured with MIR-FTIR
spectroscopy (3000-3700 cm-1). Four models of confined water with different levels of
confinement were investigated: water in nanopores of tubular crystals formed by water
mediated assembly of hydroxyl acids, water in RM of DDAB/Cy/water system, water in
water-Dx mixtures, and water in hydration shells around HSA. Furthermore, a new T-
jump apparatus was setup and the combination between T-jump and KITA was
optimized to probe the coupled protein-water dynamics in the µs and ms timescales.
In the first model of confined water, temperature dependent measurements of water in
nanopores using ATR-FTIR spectroscopy in the FIR frequency range show that the
frequency range from 400 to 570 cm-1 is sensitive to probe the water dynamics inside
hydrated nanopores. The absorption in this frequency range of the compounds with
water inside the pores is significantly more than that of the nonporous compounds. The
temperature dependent absorbance of water in nanopores considerably depends on the
size of the pores. Less confined and thus more mobile water molecules inside wide
pores show a large increased absorbance upon increase of temperature. In contrast,
water confined in narrow pores show a smaller increase in absorbance with increasing
temperature. The thermal stability and reversibility of water dynamics in nanopores
were studied by a series of measurements in which the samples were first heated up and
then cooled down. The results show that water molecules can permanently occupy
nonpolar nanopores at ambient condition. The release of mobile water in nanopores
occurs at high temperature, changing the inner pore surface from hydrophilic to
hydrophobic. The differences in the temperature dependent dehydration of the hydrated
nanopores indicate that the behavior of water in nanopores depends on the details of the
intermolecular interactions between water molecules and the inner pore surface. The
observations confirm that the synthesized nanopores can serve as model systems for
biological channels. ATR-FTIR study of the OH stretching band of water confined in

8. Summary and outlook
140
the nanopores will be carried out, aiming to extract further information about the
structure of the water arrangement in each pore. Further studies of the hydrated
nanopores with other experimental techniques and MD simulations of the confined
water are planned in order to investigate the water properties at molecular level.
In the second model, the structure and dynamics of water confined in DDAB/Cy/water
RM were investigated using DLS, THz-TDS, and FTIR spectroscopy. The results of
DLS measurements showed that the hydrodynamic diameter of all RM systems
decreases with increasing temperature, indicating a transition towards smaller
aggregates. With increasing degree of hydration (} ), the RM change from connected
cylindrical structures to discrete spherical droplets. The THz spectra measured with
THz-TDS showed that the absorption coefficient of DDAB/Cy/water RM systems
increases with increasing } to approach the values of water. The temperature
dependent THz absorption of the RM systems was found to be similar to the behavior of
water. FIR spectra measured with FTIR spectroscopy showed that the ratio between the
absorbance intensity of the libration peak and the intermolecular H-bond stretching peak
of the RM system is significantly higher than that of water. The peak arising from the
intermolecular H-bond stretching vibrations of water in RM systems is red shifted
compared to that of water, especially at low } . This shows a significant perturbation of
the water H-bond network resulting from the inhomogeneous H-bonding at the
interface. With increasing temperature the peaks undergo progressive red shift due to
the weakening of H-bonding. With increasing hydration, both peak positions show only
a very small shift, indicating the weak dependence of the H-bond network on the
surface geometry. MIR-FTIR measurements found that the relative population of
strongly H-bonded water molecules (bulk-like water) increases, while that of the
distorted structured water molecules (bound water) decreases with increasing } to
reach a value comparable to those of bulk water. This indicates the inhomogeneity in
bonding of water molecules with the RM interface. At low hydration, water molecules
in contact with the surface are dominating. This can be correlated with the observed
higher abundance of distorted H-bond network. With increasing } , the relative
population of bulk-like water increases, irrespective of the decrease in the RM size.
These observations indicate that it is the load of water rather than the surface geometry
determines the water structure and dynamics. This study reveals a significant change of
the water dynamics with changes in hydration and temperature. However, these changes
are independent of the topological curvature. In the next steps, study of hydration water

8. Summary and outlook
141
in RM by adding proteins into the water nanopools will be carried out to explore water
properties in a more complex confinement. Previous NMR studies of similar systems
have found a significant reduced motion of the hydration water of proteins in RM [75,
76]. Further to the RM with the cationic DDAB surfactant, other RM systems with
anionic and nonionic surfactants will be investigated with similar experimental
techniques.
In the third model, the evolution of water network structure in water-Dx mixtures was
studied with three experimental techniques. First, FTIR spectroscopy unraveled the
water-water H-bond formation by the shift of intramolecular OH stretching modes and
libration modes of water. FTIR spectra show a gradual increase of the collective water-
water H-bond network with increasing mole fraction of water (X�) in the mixture. The
water-Dx H-bonds dominate in the low X� region. With progressive addition of water,
intermolecular three-dimensional H-bonded water network dynamics appear at X� �0.1 and approach those of water at X� � 0.54. Second, THz-TDS probed the dielectric
relaxation of water and indicated changes in the H-bond relaxation dynamics. The
relaxation time constant arising from the cooperative relaxation of the water H-bond
network is found to be small for X� � 0.1 and increases rapidly for X� � 0.1. The
static dielectric constant �!, which is attributed to water cluster formation and the
polarity of clustered water, is found to be low at X� � 0.1, showing a negligible bulk
water contribution in the mixture. With increasing X�, �! increases because the size of
water clusters increases due to the formation of collective H-bond network of water.
Third, the kinetic study of BzCl solvolysis reaction showed that the rate constant is very
slow at water diluted region and increases rapidly at X� � 0.1, indicating a change in
the reaction pathway as the nucleophilic character of water changes in water-Dx
mixtures. The lower polarity due to cluster formation at low water contents (X� � 0.1)
destabilizes both the nucleofuge (Cl') and the acylium cation (Bz,). As a consequence,
S 1 pathway is disabled while S 2 mechanism is favoured. With increasing water
contents (X� � 0.1), more rigid water-water H-bonds are formed, the size of water
clusters increases, and the intermediate cation and anion are stabilized. As a result, S 1
reaction pathway is followed, which increases the reaction rate rapidly. In summary, the
study shows a direct correlation between the change in the structure and dynamics of
water with the change in the reaction rate upon increasing X� in water-Dx mixtures.
The investigation of confined water in water-Dx mixtures serves as a model system
which shows the influence of hydration on the activity and demonstrates the importance
8. Summary and outlook
142
of the solvent for chemical reactivity. For a deeper understanding of the evolution of
water network structure, similar studies with water in organic solvents of different
hydrophilic/hydrophobic properties will be carried out.
In the fourth model, the thermal unfolding and refolding of HSA was studied with CD,
fluorescence, and THz spectroscopy. Far and near-UV CD spectroscopy indicate a
marginal change in the secondary and tertiary structure of the protein during the
transition from native to extended state in the temperature range from 20 to 55°C
(N « E transition), and a dramatic change in the structure during the transition from
native to unfolded state in the temperature range from 20 to 70°C (N « U transition).
Steady state and time resolved fluorescence spectroscopy show reversible fluorescence
spectra and reversible fluorescence average lifetime of Trp214 moiety in HSA for
N « E transition, while the behavior is irreversible for N « U transition. The associated
change of the collective water H-bond network dynamics in the dynamical hydration
shells of HSA was studied using THz-TDS and p-Ge laser THz spectroscopy. The
measurement results of both systems show that the absorption of HSA solution relative
to buffer (L����+)¸�) decreases with increasing temperature. For N « E transition, the
extended state refolds almost perfectly to the native state upon cooling as L����+)¸� has
negligible change. For N « U transition, there is a deviation of L����+)¸� for the final
refolded state compared to the initial native state. In the frequency range from 0.1 to 1.2
THz measured with THz-TDS, the THz absorption of the irreversible refolded protein in
N « U transition is lower than the absorption of the native protein, while a reverse
behavior is observed in the frequency range from 2.1 to 2.8 THz measured with p-Ge
laser. The different absorption behaviors show a blue shift of the THz absorption
spectrum of the refolded protein compared to that of the native one. When the protein
unfolds at 70°C, hydrophobic residues expose to the protein surface. As this process is
irreversible, a part of the structural changes still remain in the refolded protein when the
protein is cooled down to 20°C. These structural changes are accompanied by changes
in the hydration dynamics. Further sterical constraints on water molecules in
hydrophobic pockets, grooves, clefts result in retardation of water dynamics and a blue
shift in the THz absorption spectrum [68]. This combined study using CD, fluorescence,
and THz spectroscopy showed a clear correlation between structural changes and
changes in the hydration dynamics for HSA protein. Investigations of chemical and pH
induced unfolding of HSA using THz-TDS and p-Ge laser THz spectroscopy are in
progress to compare with the thermal unfolding. A suitable fit of the dielectric

8. Summary and outlook
143
relaxation measured with THz-TDS using the Debye model is under study to yield the
change in the dynamics of hydration water upon structural changes of HSA. These
further studies will help to obtain a detailed overview of the protein folding process.
The last part of this study describes the setup of a new T-jump apparatus and discusses
KITA studies upon T-jump to measure the kinetic processes of water and proteins. The
T-jump apparatus, consisting of a Q-switched Nd:YAG laser and a Raman shifter, was
successfully setup. It generates high power short laser pulses (45 mJ/pulse, 5 ns
pulsewidth) at a wavelength of 1.54 µm. The heating pulses with a diameter of 2 mm
routinely initiate rapid temperature increase by 5-7°C in aqueous solution. The focal
size of the THz beam at the sample position was improved, ensuring that the probed
area of the THz beam is within the heated area of the solution. A data acquisition
process was optimized to reproducibly record KITA signals upon T-jump. The
temperature dependent THz absorption of water is used as a thermometer to measure the
temperature increase upon T-jump. The intensity of the THz pulse at the peak position
has the most significant change with temperature. It decreases nearly linearly with
increasing temperature. Therefore, the THz peak position is the most suitable position to
carry out T-jump experiments. KITA upon T-jump of water shows that the rapid kinetic
change can be detected. Different measurement conditions, such as integration time of
the lock-in amplifier, temperature and path length of the samples, have influences on the
measured results. Depending on requirements of the studied samples, these parameters
can be adjusted to optimize the observed KITA signals. For the kinetic study of
proteins, a rapid temperature increase upon T-jump initiates both rapid unfolding to heat
denatured states when the initial temperature is near the unfolding temperature, and
rapid refolding from cold denatured states when the initial temperature is near the
refolding temperature [10]. The former process was studied with λ-WT and HSA at
60°C and the later one with UBQ at 0°C. During the heat unfolding/refolding at 60°C of
λ-WT and HSA, a small difference is found between the cooling times of the protein
solution and buffer. High absorption of water in the aqueous solutions at high
temperature limits the observable difference. In the cold refolding/unfolding process of
UBQ at 0°C, a considerable difference for both heating time and cooling time of the
protein solution compared to those of the buffer is observed. The rates of heating and
recooling upon T-jump of the protein solution are both faster than those of buffer. The
observed different behaviors between the buffer and the protein solution upon T-jump
probed by KITA indicate that the structural perturbation during refolding/unfolding
8. Summary and outlook
144
process induces significant and measurable changes in dynamics of water in the
hydration shells. This is the first study using the combination between T-jump and
KITA to probe the coupled protein-water dynamics in the µs and ms timescales.
In the next steps, further developments on the experimental procedure are in progress to
improve the data acquisition and the signal analysis. The improvement aims to extract
the precise kinetic information of the protein folding dynamics. The KITA study upon
T-jump of the refolding process from cold denatured state of UBQ will be carried out at
different conditions, such as different denaturants, concentrations, and temperatures.
This will help to obtain a detailed overview of the folding kinetics. A mutant of λ-
repressor protein (λ6-85 Y22W/A37G/A49G), which has a cold denaturation temperature
at 2°C and a folding rate of a few ms as observed in Ref. [210], will be synthesized for
KITA study. A change in temperature from 2 to 6°C yields minimum change in the
density of the aqueous solution as liquid water has the highest density at 4°C. Therefore,
a T-jump of 4°C with the initial temperature at 2°C for a KITA study of this λ-repressor
will minimize the unexpected effects resulted from the density change of the protein
solution.
In summary, the studied results confirm that THz-TDS and FTIR spectroscopy in
combination with the complementary experimental techniques (dynamic light
scattering, kinetics of solvolysis reactions, CD spectroscopy, time resolved fluorescence
spectroscopy, and p-Ge laser THz spectroscopy) successfully explored the structure,
dynamics and activity of confined water in different models. The properties of confined
water strongly depend on the size, structure, surface, hydrophobicity/hydrophilicity of
the confinement models. These models partially mimic the versatile levels of water
confinement in living cells which are crowded with several biomolecules and
transmembrane pores. KITA study upon T-jump of the protein folding/unfolding
process observed the different behaviors between the protein solution and the buffer.
The first combination between KITA and T-jump provides new opportunities to explore
the complicated protein folding process. These studied results contribute to a better
comprehension of a small member of our living systems: water, which is "more than a
bystander", "a matrix of life".

145
Bibliography
[1] M. Chaplin. A proposal for the structuring of water. Biophys. Chem. 83, 211-221 (1999).
[2] R. Ludwig. Water: From clusters to the bulk. Angew. Chem. Int. Ed. 40, 1808-1827 (2001).
[3] S. K. Pal, A. H. Zewail. Dynamics of water in biological recognition. Chem. Rev. 104, 2099-2123 (2004).
[4] M. Chaplin. Do we underestimate the importance of water in cell biology? Nat. Rev. Mol. Cell Biol. 7, 861-866 (2006).
[5] F. Franks. Water: A matrix of life (Springer, 2000).
[6] P. Ball. More than a bystander. Nature 478, 467-468 (2011).
[7] P. Ball. Water as an active constituent in cell biology. Chem. Rev. 108, 74-108 (2008).
[8] R. J. Ellis, A. P. Minton. Join the crowd. Nature 425, 27-28 (2003).
[9] J. E. Bertie, Z. Lan. Infrared intensities of liquids XX: The intensity of the OH stretching band of liquid water revisited, and the best current values of the optical constants of H20(I) at 25°C between 15,000 and 1 cm-1. Appl. Spectrosc. 50, 1047-1057 (1996 ).
[10] M. Gruebele, J. Sabelko, R. Ballew, J. Ervin. Laser temperature jump induced protein refolding. Acc. Chem. Res. 31, 699-707 (1998).
[11] S. J. Kim, B. Born, M. Havenith, M. Gruebele. Real-time detection of protein-water dynamics upon protein folding by terahertz absorption spectroscopy. Angew. Chem. Int. Ed. 47, 6486-6489 (2008).
[12] C. Sirtori. Bridge for the terahertz gap. Nature 417, 132-133 (2002).
[13] A. G. Markelz, A. Roitberg, E. J. Heilweil. Pulsed terahertz spectroscopy of DNA, bovine serum albumin and collagen between 0.1 and 2.0 THz. Chem. Phys. Lett. 320, 42-48 (2000).
[14] U. Heugen, G. Schwaab, E. Bründermann, M. Heyden, X. Yu, D. M. Leitner, M. Havenith. Solute-induced retardation of water dynamics probed directly by terahertz spectroscopy. Proc. Natl. Acad. Sci. USA 103, 12301-12306 (2006).
[15] A. Tkach, P. Vilarinho, A. Kholkin, A. Pashkin, P. Samoukhina, J. Pokorny, S. Veljko, J. Petzelt. Lattice dynamics and dielectric response of Mg-doped SrTiO3 ceramics in a wide frequency range. J. Appl. Phys. 97, 044104 (2005).

Bibliography
146
[16] Y. C. Shen, P. F. Taday. Development and application of terahertz pulsed imaging for nondestructive inspection of pharmaceutical tablet. IEEE J. Quantum Electron. 14, 407-415 (2008).
[17] J. F. Federici, B. Schulkin, F. Huang, D. Gary, R. Barat, F. Oliveira, D. Zimdars. THz imaging and sensing for security applications - explosives, weapons and drugs. Semicond. Sci. Technol. 20, 266-280 (2005).
[18] T. Löffler, T. Bauer, K. Siebert, H. G. Roskos, A. Fitzgerald, S. Czasch. Terahertz dark-field imaging of biomedical tissue. Opt. Express 9, 616-621 (2001).
[19] B. Ferguson, X.-C. Zhang. Materials for terahertz science and technology. Nature Materials 1, 26-33 (2002).
[20] A. Bergner, U. Heugen, E. Bründermann, G. Schwaab, M. Havenith, D. R. Chamberlin, E. E. Haller. New p-Ge THz laser spectrometer for the study of solutions: THz absorption spectroscopy of water. Rev. Sci. Instr. 76, 063110 (2005).
[21] D. H. Auston, K. P. Cheung, J. A. Valdmanis, D. A. Kleinman. Cherenkov radiation from femtosecond optical pulses in electro-optic media. Phys. Rev. Lett. 53, 1555-1558 (1984).
[22] C. Fattinger, D. Grischkowsky. Point source terahertz optics. Appl. Phys. Lett. 53, 1480-1482 (1988).
[23] P. R. Smith, D. H. Auston, M. C. Nuss. Subpicosecond photoconducting dipole antennas. IEEE J. Quantum Electron. 24, 255-260 (1988).
[24] B. B. Hu, M. C. Nuss. Imaging with terahertz waves. Org. Lett. 20, 1716-1718 (1995).
[25] Q. Wu, M. Litz, X.-C. Zhang. Broadband detection capability of ZnTe electro-optic field detectors. Appl. Phys. Lett. 68, 2924-2926 (1996).
[26] B. Ferguson, D. Abbott. De-noising techniques for terahertz responses of biological samples. Microelectron. J. 32, 943-953 (2001).
[27] A. Dreyhaupt, S. Winnerl, T. Dekorsy, M. Helm. High-intensity terahertz radiation from a microstructured large-area photoconductor. Appl. Phys. Lett. 86, 121114 (2005).
[28] J. T. Kindt, C. A. Schmuttenmaer. Far-infrared dielectric properties of polar liquids probed by femtosecond terahertz pulse spectroscopy. J. Phys. Chem. 100, 10373-10379 (1996).
[29] T. I. Jeon, D. Grischkowsky. Characterization of optically dense, doped semiconductors by reflection THz time domain spectroscopy. Appl. Phys. Lett. 72, 3032-3034 (1998).
[30] C. A. Schmuttenmaer. Exploring dynamics in the far-infrared with terahertz spectroscopy. Chem. Rev. 104, 1759-1779 (2004).
Bibliography
147
[31] M. Hangyo, T. Nagashima, S. Nashima. Spectroscopy by pulsed terahertz radiation. Meas. Sci. Technol. 13, 1727-1738 (2002).
[32] C. Rulliere. Femtosecond laser pulses: Principles and experiments (Springer, 2005).
[33] P. F. Moulton. Spectroscopic and laser characteristics of Ti:Al2O3. J. Opt. Soc. Am. B 3, 125-133 (1986).
[34] X. C. Zhang, J. Xu. Introduction to THz wave photonics (Springer, 2009).
[35] Q. Wu, X. C. Zhang. Free space electro-optic sampling of terahertz beams. Appl. Phys. Lett. 67, 3523-3525 (1995).
[36] W. H. Press. Numerical recipes: The art of scientific computing (Cambridge University Press, 1992).
[37] B. Stuart. Infrared spectroscopy: Fundamentals and applications (Wiley, 2004).
[38] M. Milosevic. Internal reflection and ATR spectroscopy. Appl. Spectrosc. Rev. 39, 365-384 (2004).
[39] N. J. Harrick. Internal Reflection Spectroscopy (Wiley, 1967).
[40] OPUS user manual (Bruker Optics, 2006).
[41] F. M. Mirabella. Internal reflection spectroscopy: Theory and applications (Marcel Dekker, 1992).
[42] N. Pérez-Hernández, T. Q. Luong, C. Pérez, J. D. Martín, M. Havenith. Pore size dependent dynamics of confined water probed by FIR spectroscopy. Phys. Chem. Chem. Phys. 12, 6928-6932 (2010).
[43] N. Pérez-Hernández, T. Q. Luong, M. Febles, C. Marco, H. H. Limbach, M. Havenith, C. Pérez, M. V. Roux, R. Pérez, J. D. Martín. The mobility of water molecules through hydrated pores. J. Phys. Chem. C 116, 9616-9630 (2012).
[44] P. Agre. Aquaporin water channels (Nobel lecture). Angew. Chem. Int. Ed. Engl. 43, 4278-4290 (2004).
[45] K. Murata, K. Mitsuoka, T. Hirai, T. Walz, P. Agre, J. B. Heymann, A. Engel, Y. Fujiyoshi. Structural determinants of water permeation through aquaporin-1. Nature 407, 599-605 (2000).
[46] G. Ren, V. S. Reddy, A. Cheng, P. Melnyk, A. K. Mitra. Visualization of a water-selective pore by electron crystallography in vitreous ice. Proc. Natl. Acad. Sci. USA 98, 1398-1403 (2001).
[47] B. L. de Groot, H. Grubmüller. Water permeation across biological membranes: Mechanism and dynamics of aquaporin-1 and GlpF. Science 294, 2353-2357 (2001).
[48] A. I. Kolesnikov, J. M. Zanotti, C. K. Loong, P. Thiyagarajan, A. P. Moravsky, R. O. Loutfy, C. J. Burnham. Anomalously soft dynamics of water in a nanotube: A revelation of nanoscale confinement. Phys. Rev. Lett. 93, 35503 (2004).

Bibliography
148
[49] J. C. Rasaiah, S. Garde, G. Hummer. Water in nonpolar confinement: From nanotubes to proteins and beyond. Annu. Rev. Phys. Chem. 59, 713-740 (2008).
[50] A. Alexiadis, S. Kassinos. Molecular simulation of water in carbon nanotubes. Chem. Rev. 108, 5014-5034 (2008).
[51] T. Nanok, N. Artrith, P. Pantu, P. A. Bopp, J. Limtrakul. Structure and dynamics of water confined in single-wall nanotubes. J. Phys. Chem. A 113, 2103-2108 (2009).
[52] Y. Liu, Q. Wang. Transport behavior of water confined in carbon nanotubes. Phys. Rev. B 72, 085420 (2005).
[53] S. Joseph, N. Aluru. Why are carbon nanotubes fast transporters of water? Nano letters 8, 452-458 (2008).
[54] G. Cicero, J. C. Grossman, E. Schwegler, F. Gygi, G. Galli. Water confined in nanotubes and between graphene sheets: A first principle study. J. Am. Chem. Soc. 130, 1871-1878 (2008).
[55] S. Andreev, D. Reichman, G. Hummer. Effect of flexibility on hydrophobic behavior of nanotube water channels. J. Chem. Phys. 123, 194502 (2005).
[56] R. Hoffmann, P. R. Schleyer, H. F. Schaefer III. Predicting molecules—More realism, please! Angew. Chem. Int. Ed. 47, 7164-7167 (2008).
[57] N. Pérez-Hernández, M. Febles, C. Pérez, R. Pérez, M. L. Rodríguez, C. Foces-Foces, J. D. Martín. Synthesis and structure of hydroxyl acids of general structure 7, 7-Alkenyl/alkynyl-5-hydroxymethyl-6-oxabicyclo [3.2.1] octane-1-carboxylic acid. J. Org. Chem. 71, 1139-1151 (2006).
[58] H. Carrasco, C. Foces-Foces, C. Pérez, M. L. Rodríguez, J. D. Martín. Tubular hydrogen-bonded networks sustained by water molecules. J. Am. Chem. Soc. 123, 11970-11981 (2001).
[59] M. Febles, N. Pérez-Hernández, C. Pérez, M. L. Rodríguez, C. Foces-Foces, M. V. Roux, E. Q. Morales, G. Buntkowsky, H. H. Limbach, J. D. Martín. Distinct dynamic behaviors of water molecules in hydrated pores. J. Am. Chem. Soc. 128, 10008-10009 (2006).
[60] N. Pérez-Hernández, E. H. L. Falcao, C. Pérez, D. Fort, J. D. Martín, J. Eckert. Temperature-induced water release and uptake in organic porous networks. J. Phys. Chem. B 114, 5694-5699 (2010).
[61] N. Pérez-Hernández, D. Fort, C. Pérez, J. D. Martín. Water-induced molecular self-assembly of hollow tubular crystals. Cryst. Growth Des. 11, 1054-1061 (2011).
[62] C. Pérez, C. G. Espínola, C. Foces-Foces, P. Núñez-Coello, H. Carrasco, J. D. Martín. A synthetic hydroxy acid that shows tubular-shaped structure in solid-state and ionophoric activity in phospholipid bilayers. Org. Lett. 2, 1185-1188 (2000).
[63] J. E. Bertie, H. J. Labbe, E. J. Whalley. Absorptivity of ice I in the range 4000-30 cm-1. J. Chem. Phys. 50, 4501-4520 (1969).

Bibliography
149
[64] W. Chen, M. Sharma, R. Resta, G. Galli, R. Car. Role of dipolar correlations in the infrared spectra of water and ice. Phys. Rev. B 77, 245114 (2008).
[65] V. I. Gaĭduk. Relations between the association of liquid water molecules and the dielectric and raman spectra of H2O. Opt. Spec. 106, 24-42 (2009).
[66] J. T. Kindt, C. A. Schmuttenmaer. Far-infrared absorption spectra of water, ammonia, and chloroform calculated from instantaneous normal mode theory. J. Chem. Phys. 106, 4389-4400 (1997).
[67] H. R. Zelsmann. Temperature dependence of the optical constants for liquid H2O and D2O in the far IR region. J. Mol. Struct. 350, 95-114 (1995).
[68] M. Heyden, M. Havenith. Combining THz spectroscopy and MD simulations to study protein-hydration coupling. Methods 52, 74-83 (2010).
[69] T. Q. Luong, P. K. Verma, R. K. Mitra, M. Havenith. Onset of hydrogen bonded collective network of water in 1,4-dioxane. J. Phys. Chem. A 115, 14462-14469 (2011).
[70] I. Ohmine, S. Saito. Water dynamics: Fluctuation, relaxation, and chemical reactions in hydrogen bond network rearrangement. Acc. Chem. Res. 32, 741-749 (1999).
[71] A. Patra, T. Q. Luong, R. K. Mitra, M. Havenith. Solvent dynamics in reverse micellar water-pool: A spectroscopic investigation of DDAB/cyclohexane/water systems. In preparation.
[72] N. E. Levinger. Water in confinement. Science 298, 1722-1723 (2002).
[73] M. D. Fayer, N. E. Levinger. Analysis of water in confined geometries and at interfaces. Annu. Rev. Anal. Chem. 3, 89-107 (2010).
[74] A. M. Dokter, S. Woutersen, H. J. Bakker. Inhomogeneous dynamics in confined water nanodroplets. Proc. Natl. Acad. Sci. USA 103, 15355-15358 (2006).
[75] N. V. Nucci, M. S. Pometun, A. J. Wand. Mapping the hydration dynamics of ubiquitin. J. Am. Chem. Soc. 133, 12326-12329 (2011).
[76] N. V. Nucci, M. S. Pometun, A. J. Wand. Site-resolved measurement of water-protein interactions by solution NMR. Nat. Struct. Mol. Biol. 18, 245-249 (2011).
[77] B. K. Paul, R. K. Mitra. Water solubilization capacity of mixed reverse micelles: Effect of surfactant component, the nature of the oil, and electrolyte concentration. J. Colloid Interface Sci. 288, 261-279 (2005).
[78] J. Eastoe, R. K. Heenan. Water-induced structural changes within the L2 phase of didodecyldimethylammonium bromide-cyclohexane-water systems. J. Chem. Soc. Faraday Trans. 90, 487-492 (1994).
[79] M. Olla, M. Monduzzi. DDAB microemulsions: Influence of an aromatic oil on microstructure. Langmuir 16, 6141-6147 (2000).
Bibliography
150
[80] T. N. Zemb, S. T. Hyde, P. J. Derian, I. S. Barnes, B. W. Ninham. Microstructure from X-ray scattering: The disordered open connected model of microemulsions. J. Phys. Chem. 91, 3814-3820 (1987).
[81] M. Jonströmer, U. Olsson, W. O. Parker, Jr. A self-diffusion study of microemulsion structure using a polar solvent mixture. Langmuir 11, 61-69 (1995).
[82] A. Shioi, M. Harada, M. Obika, M. Adachi. Structure and properties of fluids composed of polyelectrolyte and ionic surfactant in organic phase: Poly(acrylic acid) and didodecyldimethylammonium bromide. Langmuir 14, 4737-4743 (1998).
[83] R. Skurtveit, U. Olsson. Microstructure near the oil corner of a ternary microemulsion. J. Phys. Chem. 96, 8640-8646 (1992).
[84] R. K. Mitra, B. K. Paul. Investigation on percolation in conductance of mixed reverse micelles. Colloids Surf. A 252, 243-259 (2005).
[85] J. M. Tingey, J. F. Fulton, D. W. Matson, R. D. Smith. Micellar and bicontinuous microemulsions formed in both near-critical and supercritical propane with didodecyldimethylammonium bromide and water. J. Phys. Chem. 95, 1445-1448 (1991).
[86] G. G. Warr, R. Sen, D. F. Evans, J. E. Trend. Microemulsion formation and phase behavior of dialkydimethylammonium bromide surfactants. J. Phys. Chem. 92, 774-783 (1988).
[87] B. J. Berne, R. Pecora. Dynamic light scattering (Dover Publications, 2000).
[88] A. J. Lock, H. J. Bakker. Temperature dependence of vibrational relaxation in liquid H2O. J. Chem. Phys. 117, 1708-1713 (2002).
[89] F. O. Libnau, J. Toft, A. A. Christy, O. M. Kvalheim. Structure of liquid water determined from infrared temperature profiling and evolutionary curve resolution. J. Am. Chem. Soc. 116, 8311-8316 (1994).
[90] R. K. Mitra, S. S. Sinha, S. K. Pal. Temperature-dependent solvation dynamics of water in sodium bis(2-ethylhexyl)sulfosuccinate/isooctane reverse micelles. Langmuir 24, 49-56 (2008).
[91] S. P. Moulik, G. C. De, B. B. Bhowmik, A. K. Panda. Physicochemical studies on microemulsions. 6. Phase behavior, dynamics of percolation, and energetics of droplet clustering in water/AOT/n-heptane system influenced by additives (sodium cholate and sodium salicylate). J. Phys. Chem. B 103, 7122-7129 (1999).
[92] D. M. Leitner, H. Havenith, M. Gruebele. Biomolecule large-amplitude motion and solvation dynamics: modelling and probes from THz to X-rays. int. Rev. Phys. Chem. 25, 553 - 582 (2006).
[93] L. Thrane, R. H. Jacobsen, P. U. Jepsen, S. R. Keiding. THz reflection spectroscopy of liquid water. Chem. Phys. Lett. 240, 330-333 (1995).
Bibliography
151
[94] T. Q. Luong, P. K. Verma, R. K. Mitra, M. Havenith. Do hydration dynamics follow the structural perturbation during thermal denaturation of a protein: A terahertz absorption study. Biophys. J. 101, 925-933 (2011).
[95] D. S. Venables, C. A. Schmuttenmaer. Spectroscopy and dynamics of mixtures of water with acetone, acetonitrile, and methanol. J. Chem. Phys. 113, 11222-11236 (2000).
[96] J. E. Boyd, A. Briskman, V. L. Colvin, D. M. Mittleman. Direct observation of terahertz surface modes in nanometer-sized liquid water pools. Phys. Rev. Lett. 87, 147401 (2001).
[97] J. E. Boyd, A. Briskman, C. M. Sayes, D. Mittleman, V. Colvin. Terahertz vibrational modes of inverse micelles. J. Phys. Chem. B 106, 6346-6353 (2002).
[98] D. M. Mittleman, M. C. Nuss, V. L. Colvin. Terahertz spectroscopy of water in inverse micelles. Chem. Phys. Lett. 275, 332-338 (1997).
[99] D. S. Venables, K. Huang, C. A. Schmuttenmaer. Effect of reverse micelle size on the librational band of confined water and methanol. J. Phys. Chem. B 105, 9132-9138 (2001).
[100] T. Yagasaki, J. Ono, S. Saito. Ultrafast energy relaxation and anisotropy decay of the librational motion in liquid water: A molecular dynamics study. J. Chem. Phys. 131, 164511 (2009).
[101] M. B. Temsamani, M. Maeck, I. E. Hassani, H. D. Hurwitz. Fourier transform infrared investigation of water states in aerosol-OT reverse micelles as a function of counterionic nature. J. Phys. Chem. B 102, 3335-3340 (1998).
[102] G. W. Zhou, G. Z. Li, W. J. Chen. Fourier transform infrared investigation on water states and the conformations of aerosol-OT in reverse microemulsions. Langmuir 18, 4566-4571 (2002).
[103] J. B. Brubach, A. Mermet, A. Filabozzi, A. Gerschel, D. Lairez, M. P. Krafft, P. Roy. Dependence of water dynamics upon confinement size. J. Phys. Chem. B 105, 430-435 (2001).
[104] Q. Zhong, D. A. Steinhurst, E. E. Carpenter, J. C. Owrutsky. Fourier transform infrared spectroscopy of azide ion in reverse micelles. Langmuir 18, 7401-7408 (2002).
[105] R. Jimenez, G. R. Fleming, P. V. Kumar, M. Maroncelli. Femtosecond solvation dynamics of water. Nature 369, 471-473 (1994).
[106] D. F. Evans, H. Wennerstrom. Colloidal domain: Where physics, chemistry and biology meet (Wiley, 1999).
[107] S. T. Roberts, K. Ramasesha, A. Tokmakoff. Structural rearrangements in water viewed through two-dimensional infrared spectroscopy. Acc. Chem. Res. 42, 1239-1249 (2009).

Bibliography
152
[108] S. Vaitheeswaran, H. Yin, J. C. Rasaiah, G. Hummer. Water clusters in nonpolar cavities. Proc. Natl. Acad. Sci. USA 101, 17002-17005 (2004).
[109] W. S. Price, H. Ide, Y. Arata. Translational and rotational motion of isolated water molecules in nitromethane studied using 17O NMR. J. Chem. Phys. 113, 3686-3689 (2000).
[110] E. T. J. Nibbering, T. Elsaesser. Ultrafast vibrational dynamics of hydrogen bonds in the condensed phase. Chem. Rev. 104, 1887-1914 (2004).
[111] T. Fukasawa, T. Sato, J. Watanabe, Y. Hama, W. Kunz, R. Buchner. Relation between dielectric and low-frequency Raman spectra of hydrogen-bond liquids. Phys. Rev. Lett. 95, 197802 (2005).
[112] F. W. Starr, J. K. Nielsen, H. E. Stanley. Fast and slow dynamics of hydrogen bonds in liquid water. Phys. Rev. Lett. 82, 2294 - 2297 (1999).
[113] D. M. Chapman, R. E. Hester. Ab initio conformational analysis of 1,4-dioxane. J. Phys. Chem. A 101, 3382-3387 (1997).
[114] H. Nakayama, K. Shinoda. Enthalpies of mixing of water with some cyclic and linear ethers. J. Chem. Thermodyn. 3, 401-405 (1971).
[115] V. A. Sirotkin, B. N. Solomonov, D. A. Faizullin, V. D. Fedotov. IR spectroscopic study of the state of water in dioxane and acetonitrile: Relationship with the thermodynamic activity of water at 278-318 K. J. Struct. Chem. 41, 997-1003 (2000).
[116] G. R. Choppin, M. R. Violante. Near-infrared studies of the structure of water. III. Mixed solvent systems. J. Chem. Phys. 56, 5890-5898 (1972).
[117] K. Mizuno, S. Imafuji, T. Fujiwara, T. Ohta, Y. Tamiya. Hydration of the CH groups in 1,4-dioxane probed by NMR and IR: Contribution of blue-shifting CH···OH2 hydrogen bonds. J. Phys. Chem. B 107, 3972-3978 (2003).
[118] R. K. Mitra, P. K. Verma, S. K. Pal. Exploration of the dynamical evolution and the associated energetics of water nanoclusters formed in a hydrophobic solvent. J. Phys. Chem. B 113, 4744-4750 (2009).
[119] S. Schrödle, G. Hefter, R. Buchner. Dielectric spectroscopy of hydrogen bond dynamics and microheterogenity of water + dioxane mixtures. J. Phys. Chem. B. 111, 5946-5955 (2007).
[120] S. Mashimo, N. Miura, T. Umehara, S. Yagihara, K. Higasi. The structure of water and methanol in p-dioxane as determined by microwave dielectric spectroscopy. J. Chem. Phys. 96, 6358-6361 (1992).
[121] M. P. Conrad, H. L. Strauss. Nearly free rotation of water and ammonia in alkanes and other weakly interacting solvents. J. Phys. Chem. 91 1668-1673 (1987).
[122] Y. Raichlin, A. Millo, A. Katzir. Investigations of the structure of water using mid-IR fiberoptic evanescent wave spectroscopy. Phys. Rev. Lett. 93, 185703 (2004).

Bibliography
153
[123] M. Heyden, J. Sun, S. Funkner, G. Mathias, H. Forbert, M. Havenith, D. Marx. Dissecting the THz spectrum of liquid water from first principles via correlations in time and space. Proc. Natl. Acad. Sci. USA 107, 12068-12073 (2010).
[124] M. Koeberg, C.-C. Wu, D. Kim, M. Bonn. THz dielectric relaxation of ionic liquid:water mixtures. Chem. Phys. Lett. 439, 60-64 (2007 ).
[125] L. García-Río, J. R. Leis, E. Iglesias. Influence of water structure on solvolysis in water-in-oil microemulsions. J. Phys. Chem. 99, 12318-12326 (1995).
[126] T. W. Bentley, G. E. Carter, H. C. Harris. SN2 character of hydrolysis of benzoyl chloride. J. Chem. Soc., Chem. Commun., 387-389 (1984).
[127] M. Ferrario, M. Haughney, I. R. McDonald, M. L. Klein. Molecular-dynamics simulation of aqueous mixtures: Methanol, acetone, and ammonia. J. Chem. Phys. 93, 5156-5166 (1990).
[128] D. Cringus, S. Yeremenko, M. S. Pshenichnikov, D. A. Wiersma. Hydrogen bonding and vibrational energy relaxation in water-acetonitrile mixtures. J. Phys. Chem. B 108, 10376-10387 (2004).
[129] L. F. Scatena, M. G. Brown, G. L. Richmond. Water at hydrophobic surfaces: Weak hydrogen bonding and strong orientation effects. Science 292, 908-912 (2001).
[130] S. Schrödle, B. Fischer, H. Helm, R. Buchner. Picosecond dynamics and microheterogenity of water + dioxane mixtures. J. Phys. Chem. A. 111, 2043-2046 (2007).
[131] D. S. Venables, C. A. Schmuttenmaer. Far-infrared spectra and associated dynamics in acetonitrile-water mixtures measured with femtosecond THz pulse spectroscopy. J. Chem. Phys. 108, 4935-4943 (1998).
[132] B. Born, H. Weingärtner, E. Bründermann, M. Havenith. Solvation dynamics of model peptides probed by terahertz spectroscopy. Observation of the onset of collective network motions. J. Am. Chem. Soc. 131, 3752-3755 (2009).
[133] T. W. Bentley, I. S. Koo, S. J. Norman. Distinguishing between solvation effects and mechanistic changes. Effects due to differences in solvation of aromatic rings and alkyl groups. J. Org. Chem. 56, 1604-1609 (1991).
[134] M.-F. Ruasse, I. B. Blagoeva, S. Krys, M.-A. Sebastian-Gambaro. Solvation and steric effects on electrophilic reactivity of ethylenic compounds. Part 4. Bromination of oct-1-ene in anionic microemulsions. J. Chem. Soc. Perkin Trans. 2, 1283-1289 (1993).
[135] S. K. Pal, J. Peon, B. Bagchi, A. H. Zewail. Biological water: Femtosecond dynamics of macromolecular hydration. J. Phys. Chem. B 106, 12376-12395 (2002).
[136] S. Bandyopadhyay, S. Chakraborty, B. Bagchi. Secondary structure sensitivity of hydrogen bond lifetime dynamics in the protein hydration layer. J. Am. Chem. Soc. 127, 16660-16667 (2005).

Bibliography
154
[137] S. Vijay-Kumar, C. E. Bugg, W. J. Cook. Structure of ubiquitin refined at 1.8 Å resolution. J. Mol. Biol. 194, 531-544 (1987).
[138] L. Zhang, L. Wang, Y. T. Kao, W. Qiu, Y. Yang, O. Okobiah, D. Zhong. Mapping hydration dynamics around a protein surface. Proc. Natl. Acad. Sci. USA 104, 18461-18466 (2007).
[139] M. Grossman, B. Born, M. Heyden, D. Tworowski, G. B. Fields, I. Sagi, M. Havenith. Correlated structural kinetics and retarded solvent dynamics at the metalloprotease active site. Nat. Struct. Mol. Biol. 18, 1102-1108 (2011).
[140] D. Russo, G. Hura, T. Head-Gordon. Hydration dynamics near a model protein surface. Biophys. J. 86, 1852-1862 (2004).
[141] V. P. Denisov, B. Halle. Thermal denaturation of ribonuclease A characterized by water 17O and 2H magnetic relaxation dispersion. Biochemistry 37, 9595-9604 (1998).
[142] P. Fenimore, H. Frauenfelder, B. McMahon, R. Young. Bulk-solvent and hydration-shell fluctuations, similar to α- and β-fluctuations in glasses, control protein motions and functions. Proc. Natl. Acad. Sci. USA 101, 14408-14413 (2004).
[143] A. Bakk, J. S. Hoye, A. Hansen. Apolar and polar solvation thermodynamics related to the protein unfolding process. Biophys. J. 82, 713-719 (2002).
[144] M. Heyden, E. Bründermann, U. Heugen, G. Niehues, D. M. Leitner, M. Havenith. Long-range influence of carbohydrates on the solvation dynamics of water answers from terahertz absorption measurements and molecular modeling simulations. J. Am. Chem. Soc. 130, 5773-5779 (2008).
[145] D. M. Leitner, M. Gruebele, M. Havenith. Solvation dynamics of biomolecules: Modeling and terahertz experiments. HFSP J. 2, 314-323 (2008).
[146] A. Arora, T. Q. Luong, M. Krüger, Y. J. Kim, C. H. Nam, A. Manz, M. Havenith. Terahertz time domain spectroscopy for the detection of PCR amplified DNA in aqueous solution. Analyst 137, 575-579 (2012).
[147] S. Ebbinghaus, S. J. Kim, M. Heyden, X. Yu, U. Heugen, M. Gruebele, D. M. Leitner, M. Havenith. An extended dynamical hydration shell around proteins. Proc. Natl. Acad. Sci. USA 104, 20749-20752 (2007).
[148] B. Born, S. J. Kim, S. Ebbinghaus, M. Gruebele, M. Havenith. The terahertz dance of water with the proteins: The effect of protein flexibility on the dynamical hydration shell of ubiquitin. Faraday Discuss. 141, 161-173 (2009).
[149] U. Kragh-Hansen, V. T. G. Chuang, M. Otagiri. Practical aspects of the ligand-binding and enzymatic properties of human serum albumin. Biol. Pharm. Bull. 25, 695-704 (2002).
[150] S. Sugio, A. Kashima, S. Mochizuki, M. Noda, K. Kobayashi. Crystal structure of human serum albumin at 2.5 Å resolution. Protein Eng. 12, 439-446 (1999).

Bibliography
155
[151] L. Galantini, C. Leggio, N. V. Pavel. Human serum albumin unfolding: A small-angle X-ray scattering and light scattering study. J. Phys. Chem. B 112, 15460-15469 (2008).
[152] J. L. Vincent. Relevance of albumin in modern critical care medicine. Best Practice & Research Clinical Anaesthesiology 23, 183-191 (2009).
[153] M. Roche, P. Rondeau, N. R. Singh, E. Tarnus, E. Bourdon. The antioxidant properties of serum albumin. FEBS letters 582, 1783-1787 (2008).
[154] K. Flora, J. D. Brennan, G. A. Baker, M. A. Doody, F. V. Bright. Unfolding of acrylodan-labeled human serum albumin probed by steady-state and time-resolved fluorescence methods. Biophys. J. 75, 1084-1096 (1998).
[155] Y. Wu, B. Czarnik-Matusewicz, K. Murayama, Y. Ozaki. Two-dimensional near-infrared spectroscopy study of human serum albumin in aqueous solutions. J. Phys. Chem. B 104, 5840-5847 (2000).
[156] R. K. Mitra, S. S. Sinha, S. K. Pal. Hydration in protein folding: Thermal unfolding/refolding of human serum albumin. Langmuir 23, 10224-10229 (2007).
[157] S. S. Sinha, R. K. Mitra, S. K. Pal. Temperature-dependent simultaneous ligand binding in human serum albumin. J. Phys. Chem. B 112, 4884-4891 (2008).
[158] A. J. Miles, B. Wallace. Synchrotron radiation circular dichroism spectroscopy of proteins and applications in structural and functional genomics. Chem. Soc. Rev. 35, 39-51 (2006).
[159] G. Böhm, R. Muhr, R. Jaenicke. Quantitative analysis of protein far UV circular dichroism spectra by neural networks. Protein Eng. 5, 191-195 (1992).
[160] J. R. Lakowicz. Principles of fluorescence spectroscopy (Springer, 2006).
[161] D. P. Millar. Time-resolved fluorescence spectroscopy. Curr. Opin. Struct. Biol. 6, 637-642 (1996).
[162] R. K. Mitra, S. S. Sinha, S. K. Pal. Temperature dependent hydration at micellar surface: Activation energy barrier crossing model revisited. J. Phys. Chem. B. 111, 7577-7583 (2007).
[163] K. Vos, A. van Hoek, A. J. W. G. Visser. Application of a reference convolution method to tryptophan fluorescence in proteins : A refined description of rotational dynamics. Eur. J. Biochem. 165, 55-63 (1987).
[164] J. R. Olivieril, A. F. Craievich. The subdomain structure of human serum albumin in solution under different pH conditions studied by small angle X-ray scattering. Eur. Biophys. J. 24, 77-84 (1995).
[165] M. Dockal, D. C. Carter, F. Rüker. The three recombinant domains of human serum albumin. J. Biol. Chem. 274, 29303-29310 (1999).
[166] M. Dockal, D. C. Carter, F. Rüker. Conformational transitions of the three recombinant domains of human serum albumin depending on pH. J. Biol. Chem. 275, 3042-3050 (2000).

Bibliography
156
[167] R. Wetzel, M. Becker, J. Behlke, H. Billwitz, S. Böhm, B. Ebert, H. Hamann, J. Krumbiegel, G. Lassmann. Temperature behaviour of human serum albumin. Eur. J. Biochem. 104, 469-478 (1980).
[168] V. N. Uversky, N. V. Narizhneva, T. V. Ivanova, A. Y. Tomashevski. Rigidity of human α-fetoprotein tertiary structure is under ligand control. Biochemistry 36, 13638-13645 (1997).
[169] A. K. Shaw, S. K. Pal. Spectroscopic studies on the effect of temperature on pH-induced folded states of human serum albumin. J. Photochem. Photobiol. B: Biol. 90, 69-77 (2008).
[170] W. Qiu, L. Zhang, O. Okobiah, Y. Yang, L. Wang, D. Zhong, A. H. Zewail. Ultrafast solvation dynamics of human serum albumin: Correlations with conformational transitions and site-selected recognition. J. Phys. Chem. B 110, 10540-10549 (2006).
[171] A. Siemiarczuk, C. E. Petersen, C. E. Ha, J. Yang, N. V. Bhagavan. Analysis of tryptophan fluorescence lifetimes in a series of human serum albumin mutants with substitutions in subdomain 2A. Cell Biochem. Biophys. 40, 115-122 (2004).
[172] J. R. Albani. Fluorescence lifetimes of tryptophan: Structural origin and relation with So → 1Lb and So → 1La transitions. J. Fluoresc. 19, 1061-1071 (2009).
[173] J. R. Albani. New insights in the interpretation of tryptophan fluorescence. Origin of the fluorescence lifetime and characterization of a new fluorescence parameter in proteins: The emission to excitation ratio. J. Fluoresc. 17, 406-417 (2007).
[174] C. Zhang, S. M. Durbin. Hydration-induced far-infrared absorption increase in myoglobin. J. Phys. Chem. B 110, 23607-23613 (2006).
[175] S. Ebbinghaus, S. J. Kim, M. Heyden, X. Yu, M. Gruebele, D. M. Leitner, M. Havenith. Protein sequence- and pH-dependent hydration probed by terahertz spectroscopy. J. Am. Chem. Soc. 130, 2374-2375 (2008).
[176] S. Ebbinghaus, K. Meister, B. Born, A. L. DeVries, M. Gruebele, H. Havenith. Antifreeze glycoprotein activity correlates with long-range protein-water dynamics. J. Am. Chem. Soc. 132, 12210-12211 (2010).
[177] K. A. Dill, S. B. Ozkan, T. R. Weikl, J. D. Chodera, V. A. Voelz. The protein folding problem: when will it be solved? Curr. Opin. Struct. Biol. 17, 342-346 (2007).
[178] S. J. Kim, B. Born, M. Havenith, M. Gruebele. Real-time detection of protein-water dynamics upon protein folding by Terahertz absorption. Angew. Chem. Int. Ed. 47, 6486-6489 (2008).
[179] M. C. R. Shastry, H. Roder. Evidence for barrier-limited protein folding kinetics on the microsecond time scale. Nature Struc. Biol. 5, 385-392 (1998).
[180] C. Dumont, T. Emilsson, M. Gruebele. Reaching the protein folding speed limit with large, sub-microsecond pressure jumps. Nature Methods 6, 515-519 (2009).
Bibliography
157
[181] H. Ma, J. Ervin, M. Gruebele. Single-sweep detection of relaxation kinetics by submicrosecond midinfrared spectroscopy. Rev. Sci. Instr. 75, 486-491 (2004).
[182] U. Mayor, C. M. Johnson, V. Daggett, A. R. Fersht. Protein folding and unfolding in microseconds to nanoseconds by experiment and simulation. Proc. Natl. Acad. Sci. USA 97, 13518-13522 (2000).
[183] S. H. Brewer, D. M. Vu, Y. Tang, Y. Li, S. Franzen, D. P. Raleigh, R. B. Dyer. Effect of modulating unfolded state structure on the folding kinetics of the villin headpiece subdomain. Proc. Natl. Acad. Sci. USA 102, 16662-16667 (2005).
[184] G. Czerlinski. Versatile temperature jump apparatus for following chemical relaxations. Rev. Sci. Instr. 33, 1184-1189 (1962).
[185] H. Staerk, G. Czerlinski. Nanosecond heating of aqueous systems by giant laser pulses. Nature 205, 63-64 (1965).
[186] R. M. Ballew, J. Sabelko, C. Reiner, M. Gruebele. A single-sweep, nanosecond time resolution laser temperature-jump apparatus. Rev. Sci. Instr. 67, 3694-3699 (1996).
[187] R. M. Ballew, J. Sabelko, M. Gruebele. Direct observation of fast protein folding: the initial collapse of apomyoglobin. Proc. Natl. Acad. Sci. USA 93, 5759-5764 (1996).
[188] S. J. Maness, S. Franzen, A. C. Gibbs, T. P. Causgrove, R. B. Dyer. Nanosecond temperature jump relaxation dynamics of cyclic β-Hairpin peptides. Biophys. J. 84, 3874-3882 (2003).
[189] K. Yamamoto, Y. Mizutani, T. Kitagawa. Nanosecond temperature jump and time-resolved Raman study of thermal unfolding of ribonuclease A. Biophys. J. 79, 485-495 (2000).
[190] E. Chen, Y. Wen, J. W. Lewis, R. A. Goldbeck, D. S. Kliger, C. E. M. Strauss. Nanosecond laser temperature-jump optical rotatory dispersion: Application to early events in protein folding/unfolding. Rev. Sci. Instr. 76, 083120 (2005).
[191] P. U. Jepsen, R. H. Jacobsen, S. R. Keiding. Generation and detection of terahertz pulses from biased semiconductor antennas. J. Opt. Soc. Am. B 13, 2424-2436 (1996).
[192] A. Gerrard, J. M. Burch. Introduction to matrix methods in optics (Dover Publications, 1994).
[193] P. W. Milonni, J. H. Eberly. Lasers (John Wiley & Sons 1988).
[194] Y. Uesugi, Y. Mizutani, S. G. Kruglik, A. G. Shvedko, V. A. Orlovich, T. Kitagawa. Characterization of stimulated Raman scattering of hydrogen and methane gases as a light source for picosecond time-resolved Raman spectroscopy. J. Raman Spectrosc. 31, 339-348 (2000).
[195] J. Hofrichter. Laser temperature-jump methods for studying folding dynamics. Methods Mol. Biol. 168, 159-191 (2001).

Bibliography
158
[196] J. E. Geusic, H. M. Marcos, L. G. Van Uitert. Laser oscillations in Nd-doped yttrium aluminum, yttrium gallium and gadolinium garnets. Appl. Phys. Lett. 4, 182-184 (1964).
[197] W. Koechner. Solid-state laser engineering (Springer, 2006).
[198] A. E. Siegman. Lasers (University Science Books, 1986).
[199] O. Svelto. Principles of lasers (Springer, 2010).
[200] R. Singh. C. V. Raman and the discovery of the Raman effect. Phys. Perspect. 4, 399-420 (2002).
[201] S. M. Spuler, S. D. Mayor. Raman shifter optimized for lidar at a 1.5 µm wavelength. Appl. Opt. 46, 2990-2995 (2007).
[202] C. Rønne, L. Thrane, P. O. Åstrand, A. Wallqvist, K. V. Mikkelsen, S. R. Keiding. Investigation of the temperature dependence of dielectric relaxation in liquid water by THz reflection spectroscopy and molecular dynamics simulation. J. Chem. Phys. 107, 5319-5331 (1997).
[203] J. Sabelko, J. Ervin, M. Gruebele. Cold-denatured ensemble of apomyoglobin: Implications for the early steps of folding. J. Phys. Chem. B 102, 1806-1819 (1998).
[204] B. Ibarra-Molero, G. I. Makhatadze, J. M. Sanchez-Ruiz. Cold denaturation of ubiquitin. Biochim. Biophys. Acta 1429, 384-390 (1999).
[205] W. Y. Yang, M. Gruebele. Folding λ-repressor at its speed limit. Biophys. J. 87, 596-608 (2004).
[206] F. Liu, Y. G. Gao, M. Gruebele. A survey of lambda repressor fragments from two-state to downhill folding. J. Mol. Biol. 397, 789-798 (2010).
[207] L. J. Beamer, C. O. Pabo. Refined 1.8 Å crystal structure of the λ repressor-operator complex. J. Mol. Biol. 227, 177-196 (1992).
[208] R. L. Welchman, C. Gordon, R. J. Mayer. Ubiquitin and ubiquitin-like proteins as multifunctional signals. Nat. Rev. Mol. Cell Biol. 6, 599-609 (2005).
[209] W. Y. Yang, M. Gruebele. Rate-temperature relationships in λ-repressor fragment λ6-85 folding. Biochemistry 43, 13018-13025 (2004).
[210] W. Y. Yang, M. Gruebele. Kinetic equivalence of the heat and cold structural transitions of λ6-85. Phil. Trans. R. Soc. A 363, 565-573 (2005).

159
List of figures and tables
Figure 1.1: Frequency dependent absorption coefficient of liquid water. ........................ 2
Figure 1.2: Schematic of water confinement in four studied systems .............................. 4
Figure 2.1: Schematic of the THz-TDS. ........................................................................... 9
Figure 2.2: Schematic of the large area THz emitter ...................................................... 12
Figure 2.3: Schematic of the electro-optic sampling ...................................................... 14
Figure 2.4: Schematic of the data acquisition in THz-TDS ........................................... 15
Figure 2.5: THz pulses of a reference and a sample ....................................................... 17
Figure 2.6: Schematic of the FTIR spectrometer. .......................................................... 21
Figure 2.7: Schematic of the propagation of an electromagnetic wave .......................... 23
Figure 2.8: Schematic of the ATR unit ........................................................................... 25
Figure 2.9: Measured data of a reference and a sample ................................................. 26
Figure 3.1: Chemical structures of the twelve studied monomers ................................. 30
Figure 3.2: Crystal structures of: (A) wide porous compound. ...................................... 32
Figure 3.3: Schematic pore profile with typical average diameters ............................... 33
Figure 3.4: Absorbance spectrum of ice and spectra of bulk water ............................... 35
Figure 3.5: Absorbance spectra at 20°C in the FIR region ............................................. 36
Figure 3.6: Temperature dependent spectra in the range from -5 to 20°C ..................... 37
Figure 3.7: Change in absorbance compared with absorbance at -5°C .......................... 38
Figure 3.8: Temperature dependent FIR absorbance ...................................................... 39
Figure 3.9: Decrease in FIR absorbance resulted from the release of water .................. 40
List of figures and tables
160
Figure 3.10: Temperature dependent change in the integrated absorbance.................... 42
Figure 4.1: Structure of DDAB ...................................................................................... 46
Figure 4.2: Schematic of a DLS system ......................................................................... 49
Figure 4.3: Hydrodynamic diameters of DDAB/Cy/water RM systems ........................ 50
Figure 4.4: THz-TDS spectra of DDAB/Cy/water RM systems at 20°C ....................... 51
Figure 4.5: FTIR spectra of the stock solution ............................................................... 52
Figure 4.6: Difference absorbance spectra of DDAB/Cy/water RM systems ................ 53
Figure 4.7: Difference absorbance spectra of DDAB/Cy/water RM systems ................ 54
Figure 4.8: MIR spectra of DDAB/Cy/water RM systems ............................................ 55
Figure 4.9: Fraction of area under the curve for the deconvoluted sub-bands ............... 56
Figure 5.1: Structure of Dx (left) and schematic of water molecules ............................. 62
Figure 5.2: FTIR spectra of Dx in the FIR (A) and MIR region (B) .............................. 64
Figure 5.3: Difference absorbance spectra of water-Dx mixtures .................................. 65
Figure 5.4: (A) MIR difference absorbance spectra of water-Dx mixtures .................... 66
Figure 5.5: MIR difference absorbance spectra .............................................................. 67
Figure 5.6: Fraction of area under the curve for the deconvoluted bands ...................... 68
Figure 5.7: Spectra of water and Dx measured with THz-TDS ..................................... 69
Figure 5.8: Frequency and concentration dependent index of refraction ....................... 70
Table 5.1: Double Debye relaxation fitting parameters for water-Dx mixtures ............. 72
Figure 5.9: Frequency dependent dielectric constant spectra ......................................... 73
Figure 5.10: Schematic of the solvolysis reaction of BzCl ............................................ 75
Figure 5.11: Concentration dependent rate constant of the solvolysis reaction ............. 76
Figure 6.1: Schematic of a protein .................................................................................. 82

List of figures and tables
161
Figure 6.2: Crystal structure of HSA .............................................................................. 84
Figure 6.3: (A) Linear polarized light viewed as a superposition .................................. 86
Figure 6.4: Schematic of the CD spectrometer ............................................................... 88
Figure 6.5: CD spectra of HSA in aqueous PBS buffer ................................................. 89
Figure 6.6: Temperature dependent change in the CD signal of HSA ........................... 90
Figure 6.7: Schematic of a fluorescence process ............................................................ 92
Figure 6.8: Schematic of a fluorescence spectrometer ................................................... 93
Figure 6.9: Frequency dependent fluorescence spectra .................................................. 94
Figure 6.10: (A) Time dependent fluorescence spectra .................................................. 95
Table 6.1: Fitting parameters of the fluorescence transients .......................................... 97
Figure 6.11: THz-TDS spectra of PBS buffer (pH 7.4) and 1 mM HSA ....................... 98
Figure 6.12: Schematic of the p-Ge laser spectrometer ................................................ 100
Figure 6.13: Concentration dependent THz absorption ................................................ 101
Figure 6.14: Temperature dependent THz absorption .................................................. 102
Figure 6.15: Schematic of the reversible N ↔ E transition .......................................... 106
Figure 7.1: Schematic of the THz beam propagation ................................................... 111
Figure 7.2: Frequency dependent THz beam radius ..................................................... 112
Figure 7.3: Schematic of the T-jump apparatus ........................................................... 113
Figure 7.4: Schematic of the laser process of Nd:YAG crystal .................................... 116
Figure 7.5: Schematic of the laser cavity of a Q-switched Nd:YAG laser ................... 117
Figure 7.6: The possibilities of light scattering ............................................................ 118
Figure 7.7: Normalized intensities of a heating pulse .................................................. 121
Figure 7.8: Experimental results of static temperature dependent ............................... 122

List of figures and tables
162
Figure 7.9: (A) THz pulses obtained from static measurements of water .................... 124
Figure 7.10: Experimental results of KITA measurements of water ............................ 125
Figure 7.11: KITA upon T-jump at THz peak position ................................................ 126
Figure 7.12: KITA upon T-jump of water at THz peak position ................................. 127
Figure 7.13: KITA upon T-jump of water with three integration times ....................... 128
Figure 7.14: KITA upon T-jump of water at 5°C, 20°C and 50°C .............................. 129
Figure 7.15: KITA upon T-jump at 20°C with three different path lengths ................. 130
Figure 7.16: Structures of the investigated proteins ..................................................... 132
Figure 7.17: KITA upon T-jump of: (A) buffer and λ-WT solution ............................ 134
Figure 7.18: KITA upon T-jump of buffer and 2 mM UBQ solution .......................... 135
Figure 7.19: Fitted time constants of different measurements ..................................... 136
163
List of abbreviations
λ-WT wild type λ-repressor
AOT sodium bis(2-ethylhexyl) sulfosuccinate
ATR attenuated total reflection
BzCl benzoyl chloride
C-500 Coumarin-500
CD circular dichroism
Cy cyclohexane
DDAB didodecyldimethylammonium bromide
DLS dynamic light scattering
DNA deoxyribonucleic acid
DOC disordered open connected
DTGS deuterium tryglycine sulfate
Dx 1,4-dioxane
e.g. exempli gratia (for example)
EOS electro-optic sampling
FFT fast Fourier transform
FIR far-infrared
FRES Förster resonance energy transfer
FTIR Fourier transform infrared
FT-PGSE Fourier transform pulsed-gradient spin-echo
FWHM full width at half maximum
GaAs gallium arsenide
H-bond hydrogen bond
HSA human serum albumin
IR infrared
KBr potassium bromide

List of abbreviations
164
KITA kinetic terahertz absorption spectroscopy
MCT mercury cadmium telluride
MD molecular dynamics
MIR mid-infrared
MSM metal-semiconductor-metal
Nd:YAG neodymium doped yttrium aluminium garnet
NIR near-infrared
NMR nuclear magnetic resonance
OR optical rotation
PBS phosphate buffered saline
p-Ge p-germanium
Ref. reference (references)
RM reverse micelle (micelles)
SANS small angle neutron scattering
SAXS small angle X-ray scattering
SWCNT single-walled carbon nanotube (nanotubes)
TCSPC time correlated single photon counting
THz terahertz
THz-TDS terahertz time domain spectroscopy (spectrometer)
Ti:Sa titanium doped sapphire
T-jump temperature jump
TRES time resolved emission spectra
Trp tryptophan
UBQ ubiquitin
UV ultraviolet
} degree of hydration (} � [water]/[surfactant])
X� mole fraction of water
ZnTe zinc telluride

165
Acknowledgements
There are many people whose support and advice made a significant contribution to the
completion of this work.
First of all, I would like to thank Prof. Dr. Martina Havenith for giving me the
opportunity to work on interesting research projects at Department of Physical
Chemistry II. Her strong support and encouragement always inspire me with great
motivation.
I am grateful to Prof. Dr. Hermann Weingärtner (Department of Physical Chemistry II)
as the second examiner. I am also grateful for his helpful advice and fruitful
discussions.
I am thankful for the advice and help of Prof. Dr. Christian Herrmann (Department of
Physical Chemistry I) as my second supervisor within the Individual Training and
Supervision Plan of the Ruhr University Research School.
Prof. Dr. Martin Hofmann (Department of Photonics and Terahertz Technology) is
gratefully acknowledged for his useful subsidiary lectures Photonics and Optoelectronic
Devices.
Special thanks goes to Prof. Dr. Martin Gruebele (Center for Biophysics and
Computational Biology, University of Illinois at Urbana-Champaign, USA) for
supporting me to work with the T-jump system in his group.
I would like to thank Dr. Natalia Pérez-Hernández and the collaborators (Institute for
Chemical Research, Seville, Spain) for the cooperation to measure confined water in
organic nanopores.
I am grateful to Dr. Rajib Kumar Mitra and the collaborators (S.N. Bose National
Centre for Basic Sciences, Kolkata, India) for the cooperation to measure confined
water in reverse micelles, in organic solvents, and in dynamical hydration shells around
proteins.

Acknowledgements
166
I would like to thank Dr. Erik Bründermann for his helpful guidance and
encouragement. Without his great support, the KITA experiments upon T-jump would
not have been possible.
I am grateful to Dr. Gerhard Schwaab for his nice support and valuable discussions. I
am indebted to him as the first person to link me with the Physical Chemistry II group.
I am thankful for the cooperation and support of Dr. Arun Arora (Korea Institute of
Science and Technology in Europe, Saarbrücken, Germany), Dr. Stefan Hoffmann
(Department of Photonics and Terahertz Technology), and Dr. Jens Soetebier (Applied
Competence Cluster Terahertz).
I would like to thank Dr. Benjamin Born, Jessica Dielmann, Prof. Dr. Simon
Ebbinghaus, Dr. Stefan Funkner, Dr. Matthias Heyden, Dr. Matthias Krüger, Konrad
Meister, Dr. Gudrun Niehues, Prof. Dr. Diedrich Schmidt, Dr. Konstanze Schröck, and
Vinay Sharma from the terahertz team for the interesting and memorable time working
together.
It’s great to work in the friendly and enjoyable Physical Chemistry II group. I want to
thank all members of the group for their ongoing help and support.
I am grateful to Dr. Erik Bründermann, Konrad Meister, and Dr. Gerhard Schwaab for
the careful proofreading and helpful comments on the manuscript.
Financial support by the Ruhr University Research School and the Heinrich Böll
Foundation is gratefully acknowledged.
Finally, I wish to express my deepest gratitude to my parents and my brothers for their
constant support and continuous encouragement. I dedicate this work to my wife
Phuong who always gives me inspiration and shares my dreams.