Embed Size (px)
Citation preview

Comprehensive Annual Financial Report
For Fiscal Year Ended June 30, 2020
Eric J. Holcomb, Governor
Prepared by the Office of
Indiana Auditor of State
Tera Klutz, CPA
Room 240 State House
200 West Washington St.
Indianapolis, IN 46204


STATE OF INDIANA
Comprehensive Annual Financial Report For the Fiscal Year Ended June 30, 2020
Eric J. Holcomb, Governor
Prepared by:
The Office of Indiana Auditor of State Tera Klutz, CPA Auditor of State
Room 240 State House
Indianapolis, Indiana 46204

Acknowledgments
This Comprehensive Annual Financial Report was prepared by:
The Office of Indiana Auditor of State Room 240, State House 200 West Washington Street Indianapolis, Indiana 46204 (317) 232-3300
Auditor of State Staff:
Staci Schneider, Chief of Staff Courtney Everett, Deputy Auditor Brent Plunkett, Deputy Auditor Matt Beck, CPA, Assistant Deputy Auditor Clay Jackson, CPA, Accounting and Reporting Director Kelson Moran, CPA, CAFR Accountant Kim Diller, Local Government Division Director Paula Hart, Payroll Director Zach Brown, Information Technology Director Jared Bond, Communications Manager/Public Information Officer Mark Hawkins, Legislative Affairs Director Tonya Armstrong, Accounting and Reporting Staff Accountant Liam Duncan, Accounting and Reporting Staff Accountant Christopher Gunter, Accounting and Reporting Staff Accountant
We acknowledge the cooperation and assistance of the State Budget Agency and all other state agencies in the preparation of this report.
Please visit our web site at www.in.gov/auditor/
ii - State of Indiana - Comprehensive Annual Financial Report

Tera K. Klutz is the 57th Indiana Auditor of State and the first Certified Public Accountant to serve as the state’s Chief Financial Officer. Appointed by Governor Eric J. Holcomb in January 2017 and elected to a four-year term in November 2019, Klutz is focused on providing accurate financial information, maintaining and enhancing government transparency, and delivering great customer service to ALL Hoosiers.
Prior to becoming the Auditor of State, Klutz served as the County Auditor in Allen County, the third largest county in the state by population and the largest geographically. First elected in 2010 and again in 2014, Klutz streamlined local government processes, reduced debt, and maintained a balanced budget with responsible reserves. As County Auditor, Klutz was very active in the Association of Indiana Counties’ Legislative Committee serving as the Chairwoman where she oversaw and directed the Association’s legislative priorities.
Before serving in the public sector, Klutz served as a Senior Accountant at both Crowe and PwC.
During her second year as State Auditor, Klutz released an update to the Indiana Transparency Portal which uses the latest in data delivery technology to provide a more accessible and in-depth look at Indiana’s finances and assets using easy-to-understand dashboards to give a snapshot of the data, while still offering the raw data in searchable fields.
Auditor Klutz also created an Internal Controls Department to review and document the processes within the office in order to reduce the risk of misstatement or opportunities for fraud within the state’s financial system.
Klutz holds a Bachelor’s Degree in Accounting from Indiana University-Purdue University Ft Wayne. She is married to Zach and they have 2 daughters; Alyx and Julian and two Goldendoodles; Margo and Leo.
Auditor Klutz is a member of the Indiana CPA Society and the American Institute of CPAs.
Comprehensive Annual Financial Report - State of Indiana - iii
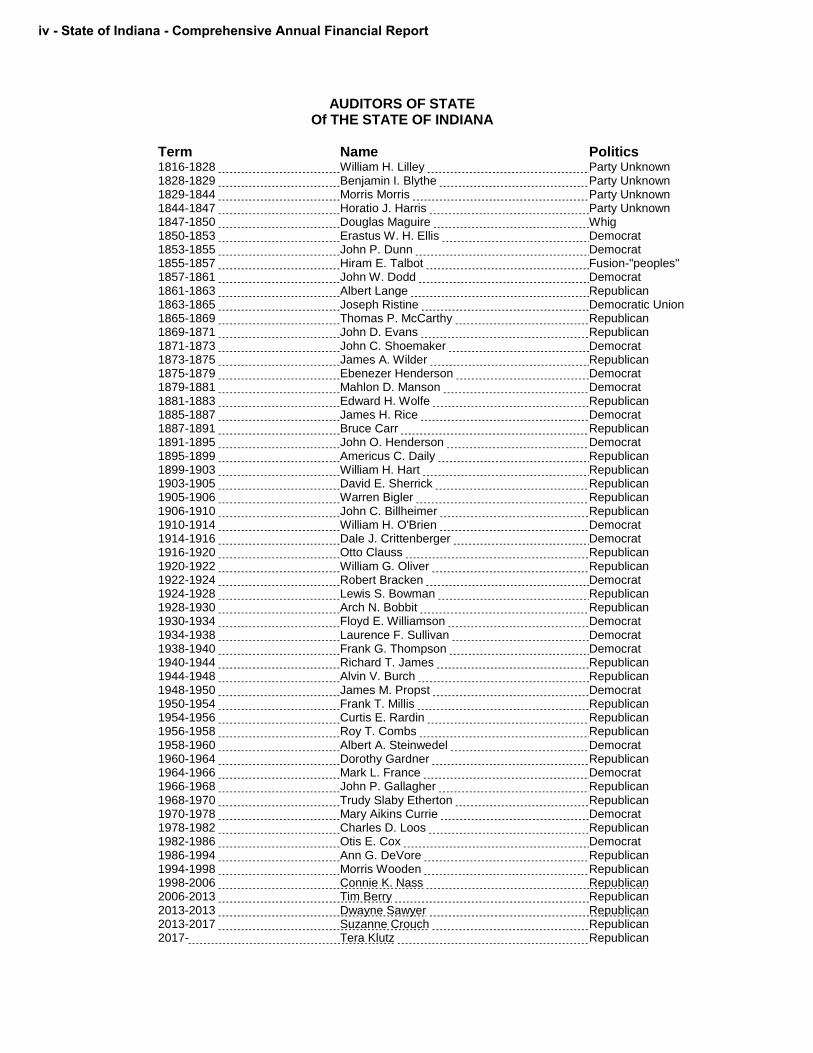
AUDITORS OF STATE Of THE STATE OF INDIANA
Term Name Politics 1816-1828 William H. Lilley Party Unknown 1828-1829 Benjamin I. Blythe Party Unknown 1829-1844 Morris Morris Party Unknown 1844-1847 Horatio J. Harris Party Unknown 1847-1850 Douglas Maguire Whig 1850-1853 Erastus W. H. Ellis Democrat 1853-1855 John P. Dunn Democrat 1855-1857 Hiram E. Talbot Fusion-"peoples" 1857-1861 John W. Dodd Democrat 1861-1863 Albert Lange Republican 1863-1865 Joseph Ristine Democratic Union 1865-1869 Thomas P. McCarthy Republican 1869-1871 John D. Evans Republican 1871-1873 John C. Shoemaker Democrat 1873-1875 James A. Wilder Republican 1875-1879 Ebenezer Henderson Democrat 1879-1881 Mahlon D. Manson Democrat 1881-1883 Edward H. Wolfe Republican 1885-1887 James H. Rice Democrat 1887-1891 Bruce Carr Republican 1891-1895 John O. Henderson Democrat 1895-1899 Americus C. Daily Republican 1899-1903 William H. Hart Republican 1903-1905 David E. Sherrick Republican 1905-1906 Warren Bigler Republican 1906-1910 John C. Billheimer Republican 1910-1914 William H. O'Brien Democrat 1914-1916 Dale J. Crittenberger Democrat 1916-1920 Otto Clauss Republican 1920-1922 William G. Oliver Republican 1922-1924 Robert Bracken Democrat 1924-1928 Lewis S. Bowman Republican 1928-1930 Arch N. Bobbit Republican 1930-1934 Floyd E. Williamson Democrat 1934-1938 Laurence F. Sullivan Democrat 1938-1940 Frank G. Thompson Democrat 1940-1944 Richard T. James Republican 1944-1948 Alvin V. Burch Republican 1948-1950 James M. Propst Democrat 1950-1954 Frank T. Millis Republican 1954-1956 Curtis E. Rardin Republican 1956-1958 Roy T. Combs Republican 1958-1960 Albert A. Steinwedel Democrat 1960-1964 Dorothy Gardner Republican 1964-1966 Mark L. France Democrat 1966-1968 John P. Gallagher Republican 1968-1970 Trudy Slaby Etherton Republican 1970-1978 Mary Aikins Currie Democrat 1978-1982 Charles D. Loos Republican 1982-1986 Otis E. Cox Democrat 1986-1994 Ann G. DeVore Republican 1994-1998 Morris Wooden Republican 1998-2006 Connie K. Nass Republican 2006-2013 Tim Berry Republican 2013-2013 Dwayne Sawyer Republican 2013-2017 Suzanne Crouch Republican 2017- Tera Klutz Republican
iv - State of Indiana - Comprehensive Annual Financial Report

STATE OF INDIANA
Comprehensive Annual Financial Report For the Year Ended
June 30, 2020
TABLE OF CONTENTS
Title Page i Acknowledgments ii Auditor of State Biography iii Auditors of State iv Table of Contents v Letter of Transmittal ix Certificate of Achievement for Excellence in Financial Reporting xvi State Organization Chart and Selected State Officials xvii
Independent Auditor’s Report 2
Management’s Discussion and Analysis 5
Basic Financial Statements: 17
Government-Wide Financial Statements: 18 Statement of Net Position 19 Statement of Activities 20
Fund Financial Statements: 21 Balance Sheet – Governmental Funds 22 Reconciliation of the Governmental Funds Balance Sheet
to the Statement of Net Position 23 Statement of Revenues, Expenditures, and Changes in
Fund Balances – Governmental Funds 24 Reconciliation of the Statement of Revenues, Expenditures, and Changes
in Fund Balances of Governmental Funds to the Statement of Activities 25 Statement of Fund Net Position – Proprietary Funds 27 Statement of Revenues, Expenses and Changes in
Fund Net Position – Proprietary Funds 28 Statement of Cash Flows – Proprietary Funds 29 Statement of Fiduciary Net Position – Fiduciary Funds 31 Statement of Changes in Fiduciary Net Position – Fiduciary Funds 32 Combining Statement of Net Position – Discretely Presented Component Units 33 Combining Statement of Activities – Discretely Presented Component Units 35 Combining Statement of Net Position
Discretely Presented Component Units – Proprietary Funds 37 Combining Statement of Activities
Discretely Presented Component Units – Proprietary Funds 39 Combining Statement of Net Position
INTRODUCTORY SECTION
FINANCIAL SECTION
Comprehensive Annual Financial Report - State of Indiana - v
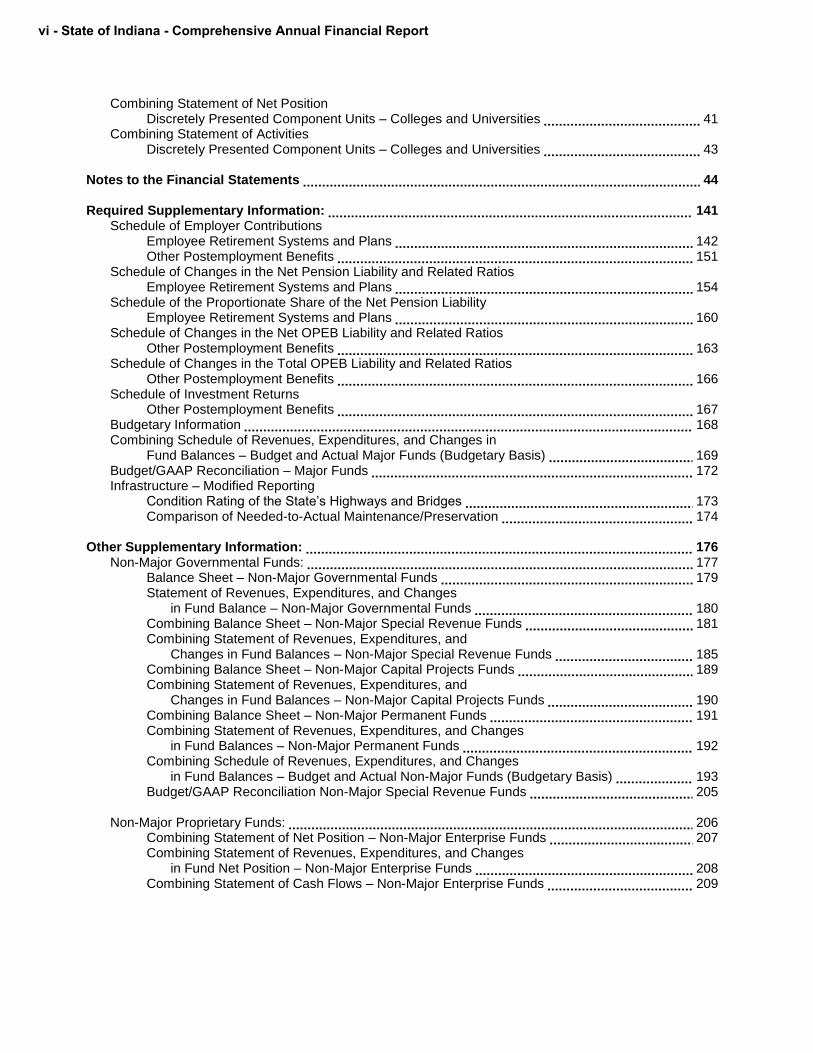
Combining Statement of Net Position Discretely Presented Component Units – Colleges and Universities 41
Combining Statement of Activities Discretely Presented Component Units – Colleges and Universities 43
Notes to the Financial Statements 44
Required Supplementary Information: 141 Schedule of Employer Contributions
Employee Retirement Systems and Plans 142 Other Postemployment Benefits 151
Schedule of Changes in the Net Pension Liability and Related Ratios Employee Retirement Systems and Plans 154
Schedule of the Proportionate Share of the Net Pension Liability Employee Retirement Systems and Plans 160
Schedule of Changes in the Net OPEB Liability and Related Ratios Other Postemployment Benefits 163
Schedule of Changes in the Total OPEB Liability and Related Ratios Other Postemployment Benefits 166
Schedule of Investment Returns Other Postemployment Benefits 167
Budgetary Information 168 Combining Schedule of Revenues, Expenditures, and Changes in
Fund Balances – Budget and Actual Major Funds (Budgetary Basis) 169 Budget/GAAP Reconciliation – Major Funds 172 Infrastructure – Modified Reporting
Condition Rating of the State’s Highways and Bridges 173 Comparison of Needed-to-Actual Maintenance/Preservation 174
Other Supplementary Information: 176 Non-Major Governmental Funds: 177
Balance Sheet – Non-Major Governmental Funds 179 Statement of Revenues, Expenditures, and Changes
in Fund Balance – Non-Major Governmental Funds 180 Combining Balance Sheet – Non-Major Special Revenue Funds 181 Combining Statement of Revenues, Expenditures, and
Changes in Fund Balances – Non-Major Special Revenue Funds 185 Combining Balance Sheet – Non-Major Capital Projects Funds 189 Combining Statement of Revenues, Expenditures, and
Changes in Fund Balances – Non-Major Capital Projects Funds 190 Combining Balance Sheet – Non-Major Permanent Funds 191 Combining Statement of Revenues, Expenditures, and Changes
in Fund Balances – Non-Major Permanent Funds 192 Combining Schedule of Revenues, Expenditures, and Changes
in Fund Balances – Budget and Actual Non-Major Funds (Budgetary Basis) 193 Budget/GAAP Reconciliation Non-Major Special Revenue Funds 205
Non-Major Proprietary Funds: 206 Combining Statement of Net Position – Non-Major Enterprise Funds 207 Combining Statement of Revenues, Expenditures, and Changes
in Fund Net Position – Non-Major Enterprise Funds 208 Combining Statement of Cash Flows – Non-Major Enterprise Funds 209
vi - State of Indiana - Comprehensive Annual Financial Report

Internal Service Funds: 212 Combining Statement of Net Position – Internal Service Funds 213 Combining Statement of Revenues, Expenses, and Changes
in Fund Net Position – Internal Service Funds 214 Combining Statement of Cash Flows – Internal Service Funds 215
Fiduciary Funds: 217 Combining Statement of Fiduciary Net Position – Pension and Other Employee
Benefit Trust Funds 219 Combining Statement of Changes in Fiduciary Net Position – Pension and Other Employee
Benefit Trust Funds 220 Combining Statement of Net Position – Private Purpose Trust Funds 221 Combining Statement of Changes in Net Position – Private Purpose Trust Funds 222 Combining Statement of Net Position – Agency Funds 223 Combining Statement of Changes in Assets and Liabilities – Agency Funds 224
Non-Major Discretely Presented Component Units: 225 Combining Statement of Net Position
Non-Major Discretely Presented Component Units – Governmental Funds 227 Combining Statement of Activities
Non-Major Discretely Presented Component Units – Governmental Funds 228 Combining Statement of Net Position
Non-Major Discretely Presented Component Units – Proprietary Funds 229 Combining Statement of Activities
Non-Major Discretely Presented Component Units – Proprietary Funds 231 Combining Statement of Net Position
Non-Major Discretely Presented Component Units – Colleges and Universities 233 Combining Statement of Activities
Non-Major Discretely Presented Component Units – Colleges and Universities 234
Net Position by Component 238 Changes in Net Position 239 Fund Balances – Governmental Funds 241 Changes in Fund Balances – Governmental Funds 243 Taxable Sales by Industry 244 Sales Tax Revenue Payers by Industry 245 Personal Income by Tax Filers and Liability by Income Level 246 Personal Income by Industry 247 Personal Income by Tax Rates 248 Ratio of Outstanding Debt by Type 249 State Facts 250 County Facts 251 Demographics and Economic Statistics 252 Twenty Largest Indiana Public Companies 253 Twenty Largest Indiana Private Companies 254 Principal Employers 255 School Enrollment 256 Largest Indiana Private Colleges & Universities 257 Operating Indicators by Function of Government 258 Capital Assets Statistics by Function of Government 259 Full Time State Employees Paid through the Auditor of State’s Office 260 Employees Other Than Full Time Paid through the Auditor of State’s Office 261 Pension, Death Benefits, and Former Governors –
Number of People Paid through the Auditor of State’s Office 262
STATISTICAL SECTION
Comprehensive Annual Financial Report - State of Indiana - vii

INTRODUCTORY SECTION
viii - State of Indiana - Comprehensive Annual Financial Report

January 6, 2021
The Honorable Eric J. Holcomb, Governor, Honorable Members of the General Assembly, Citizens of the State of Indiana:
We are proud to present the Comprehensive Annual Financial Report (CAFR) for the State of Indiana’s fiscal year ended June 30, 2020.
This Comprehensive Annual Financial Report has been prepared in conformity with Generally Accepted Accounting Principles (GAAP) as prescribed in pronouncements by the Governmental Accounting Standards Board. While management remains primarily and ultimately responsible for the contents and presentation of this report, responsibility for both the accuracy of the data presented and completeness and fairness of the presentation rests with the State agencies that provide the data and which are obligated to verify postings. We believe the information in this report is accurate in all aspects and presents the financial position and results of operations of the State as measured by the financial activity of its various funds.
State statute requires an annual audit by the Indiana State Board of Accounts. The Board is considered by both the federal and state government to be independent auditors. The Independent Auditor’s Report on the financial statements is included in the financial section of this report and in the Statewide Single Audit Report of the State of Indiana.
The State is responsible for ensuring that an adequate internal control structure is in place to provide reasonable, but not absolute, assurance regarding: (1) the safeguarding of assets against loss from unauthorized user disposition and (2) the reliability of financial records for preparing financial statements and maintaining accountability for assets. The concept of reasonable assurance recognizes that the cost of internal control should not exceed the benefits likely to be derived and that the evaluation of costs and benefits requires management to make estimates and judgments.
This internal control structure is subject to periodic evaluation by management and internal audit staff of the various State agencies. As part of the Single Audit, tests are conducted to determine the adequacy of the internal control structure related to federal financial assistance programs, as well as to determine that the State of Indiana has complied with applicable laws and regulations.
Generally Accepted Accounting Principles provides for two types of statements, government-wide and fund statements. The government-wide statements are very similar to the private sector’s statements, using the full accrual basis of accounting and the economic resources measurement focus. The governmental funds financial statements use the modified accrual basis of accounting
Comprehensive Annual Financial Report - State of Indiana - ix

and the current financial resources measurement focus. In the government-wide statements, infrastructure (roads, bridges, dams) is capitalized. Capital assets, except for infrastructure using the modified approach, are depreciated like the private sector.
Management’s Discussion and Analysis (MD&A) in the Financial Section introduces the basic financial statements and provides an analytical overview of the government’s financial activities. It is presented before the basic financial statements and provides an in-depth analysis of the State of Indiana’s finances.
Profile of the Government
Located in America’s heartland in the Midwest, Indiana is a leading manufacturing state and a major agricultural producer. The latest U.S. Census Bureau estimate places Indiana's population of approximately 6.7 million, which makes Indiana the nation's 18th largest State. The State is 72.4% urban and 27.6% rural. The five largest cities are Indianapolis (the capital), Fort Wayne, Evansville, South Bend, and Carmel.
Indiana became the 19th State of the Union on December 11, 1816. The State Constitution establishes the government in three separate departments: legislative, executive including administrative, and judicial. The legislative power of the State is vested in the Indiana General Assembly, which consists of a 100-member House of Representatives and a 50-member Senate. The Indiana General Assembly has the power to enact laws which are authorized and not prohibited by the State Constitution and not in conflict with the U.S. Constitution and laws made in pursuance thereof. The executive power of the State is vested with the Governor. The State Constitution and legislation establish the following Statewide elected administrative officials: Lieutenant Governor, Auditor of State, Secretary of State, Treasurer of State, Attorney General, and the Superintendent of Public Instruction. The judicial power of the State is vested in one Supreme Court consisting of five justices, one Court of Appeals consisting of 15 judges, 313 Trial Courts (including Circuit Courts), and one Tax Court.
The State government provides a wide range of services to the citizens of Indiana, including education, transportation, public health, public safety, welfare, conservation, and economic development.
This report includes the financial activities and balances of the State of Indiana and its component units. The component units are legally separate entities for which the State of Indiana has financial responsibility and include State funded colleges and universities, and other legally separate entities that provide services and benefits to local governments and the citizens of the State of Indiana. More information on the financial reporting entity can be found in Note I(A) in the notes to the financial statements.
The Indiana General Assembly meets every year. In odd years, it adopts a biennial budget which has been submitted by the Governor. The General Assembly enacts the budget through passage of specific appropriations, the sum of which may not exceed estimated funding sources. Budgetary control is exercised in that agencies of the State may only expend appropriations as allotted by the Budget Agency or other statutory authority. The State Board of Finance, which consists of the Governor, Auditor of State, and Treasurer of State, is empowered to transfer appropriations from one agency of the State to another, with the exception of trust funds. The State Budget Agency may transfer, assign, and reassign appropriations made for one specific purpose to another use or purpose within the same agency.
x - State of Indiana - Comprehensive Annual Financial Report
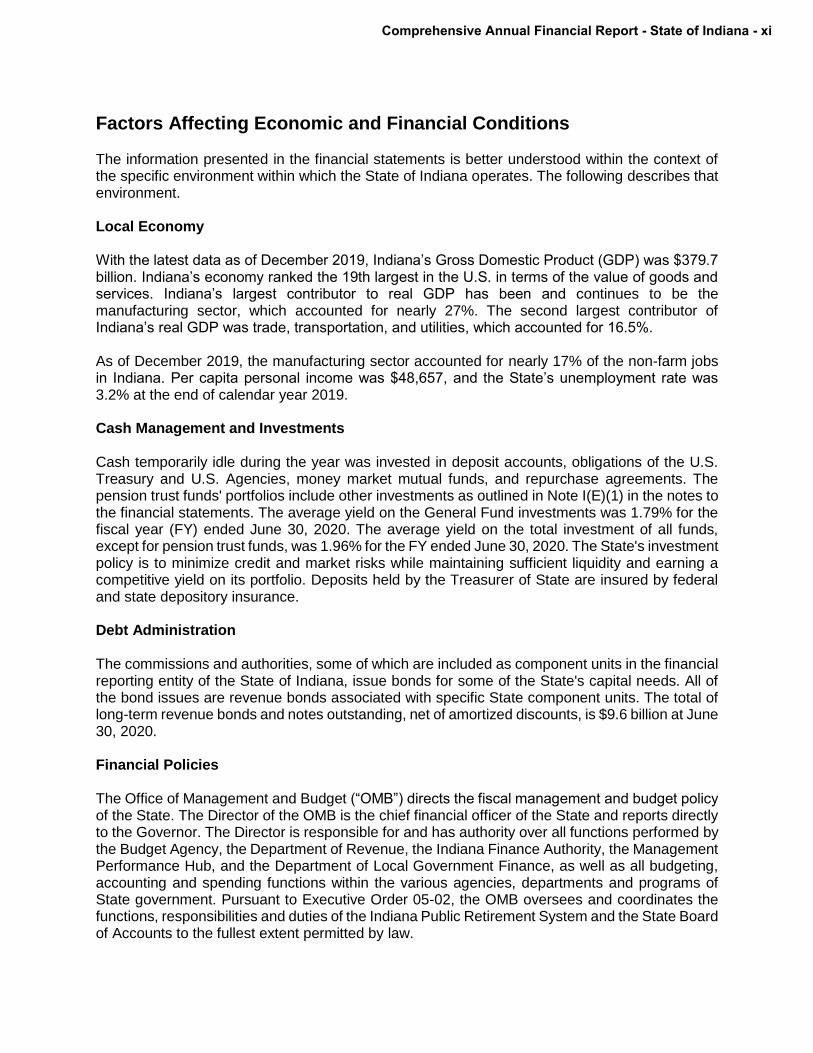
Factors Affecting Economic and Financial Conditions
The information presented in the financial statements is better understood within the context of the specific environment within which the State of Indiana operates. The following describes that environment.
Local Economy
With the latest data as of December 2019, Indiana’s Gross Domestic Product (GDP) was $379.7 billion. Indiana’s economy ranked the 19th largest in the U.S. in terms of the value of goods and services. Indiana’s largest contributor to real GDP has been and continues to be the manufacturing sector, which accounted for nearly 27%. The second largest contributor of Indiana’s real GDP was trade, transportation, and utilities, which accounted for 16.5%.
As of December 2019, the manufacturing sector accounted for nearly 17% of the non-farm jobs in Indiana. Per capita personal income was $48,657, and the State’s unemployment rate was 3.2% at the end of calendar year 2019.
Cash Management and Investments
Cash temporarily idle during the year was invested in deposit accounts, obligations of the U.S. Treasury and U.S. Agencies, money market mutual funds, and repurchase agreements. The pension trust funds' portfolios include other investments as outlined in Note I(E)(1) in the notes to the financial statements. The average yield on the General Fund investments was 1.79% for the fiscal year (FY) ended June 30, 2020. The average yield on the total investment of all funds, except for pension trust funds, was 1.96% for the FY ended June 30, 2020. The State's investment policy is to minimize credit and market risks while maintaining sufficient liquidity and earning a competitive yield on its portfolio. Deposits held by the Treasurer of State are insured by federal and state depository insurance.
Debt Administration
The commissions and authorities, some of which are included as component units in the financial reporting entity of the State of Indiana, issue bonds for some of the State's capital needs. All of the bond issues are revenue bonds associated with specific State component units. The total of long-term revenue bonds and notes outstanding, net of amortized discounts, is $9.6 billion at June 30, 2020.
Financial Policies
The Office of Management and Budget (“OMB”) directs the fiscal management and budget policy of the State. The Director of the OMB is the chief financial officer of the State and reports directly to the Governor. The Director is responsible for and has authority over all functions performed by the Budget Agency, the Department of Revenue, the Indiana Finance Authority, the Management Performance Hub, and the Department of Local Government Finance, as well as all budgeting, accounting and spending functions within the various agencies, departments and programs of State government. Pursuant to Executive Order 05-02, the OMB oversees and coordinates the functions, responsibilities and duties of the Indiana Public Retirement System and the State Board of Accounts to the fullest extent permitted by law.
Comprehensive Annual Financial Report - State of Indiana - xi

At 2020 fiscal year-end, Indiana closed the books with $1,418.9 million in reserves. This is down from the previous year balance of $2,270.1 million. General Fund forecasted revenues for Fiscal Year 2020 totaled $15,374.5 million which is $1,416.3 million (8.4%) below estimates from December 2019. As anticipated, the Fiscal Year 2020 revenue report shows the initial economic impact of the public health emergency and the impact from deferring the income tax filing and payment due date from April 15, 2020 to July 15, 2020. An estimated $900 million of income tax payments and $50 million in individual income tax attributable to federal stimulus and unemployment benefits due in the last quarter of Fiscal Year 2020 were deferred to Fiscal Year 2021.
The duration of the adverse economic impact from the public health emergency is difficult to predict and will present a challenge for the State to fund essential services at the same levels adopted in the current 2020/2021 budget. Future spending levels will be influenced by the actual revenues collected from these future and uncertain economic conditions, the prioritization of spending decisions, and the flexibility afforded with any federal assistance. General liquidity is not a concern at this time, as the entire cash investment balance of the State was just over $10.8 billion as of June 30, 2020. This balance includes reserve accounts and a deposit of $2.4 billion from the U.S. Treasury for CARES Act Coronavirus Relief Fund.
Long-Term Financial Planning
The Indiana Finance Authority is charged with developing, implementing, maintaining and monitoring a debt management plan for all non-conduit debt or debt-related obligations issued by the State. This plan is intended to provide guidance in the structuring, sale, monitoring, and post-issuance compliance for all State-related debt.
Indiana continues to position itself as one of the lowest debt-level states in the country. Net tax supported debt (NTSD) represents just $251 per capita, the 6th lowest in the country (Moody’s Debt Median Report, 5/12/2020).
Indiana is one of thirteen states that has the highest credit rating assigned by all three independent credit rating agencies: Fitch, Moody’s, and Standard & Poor’s Ratings Service (S&P). From the July 2020 report, S&P cited four areas in issuing the AAA credit rating: modest economic growth across all sectors, maintenance of strong budgetary reserves, active budget management, and low overall debt levels. Fitch’s April 2020 rating report issued AAA due to “the state’s low long-term liability burden and exceptionally strong operating profile, including prudent budget management during the long economic expansion that further strengthened the state’s robust financial resilience as it enters the current coronavirus-driven downturn.”
Major Initiatives
K-12 Education – Funding for elementary and secondary education is the State’s largestoperating expense. Prior to January 1, 2003, the State provided approximately 66% of schoolcorporations’ general fund budgets. As a result of the tax restructuring legislation enacted in 2002,the State provided approximately 85% of the school corporations’ general fund budgets. As partof the property tax reform legislation enacted by P.L. 146-2008, the State assumed responsibilityfor the local share of tuition support and provides 100% of the tuition support for schoolcorporation general funds since January 2009.
xii - State of Indiana - Comprehensive Annual Financial Report
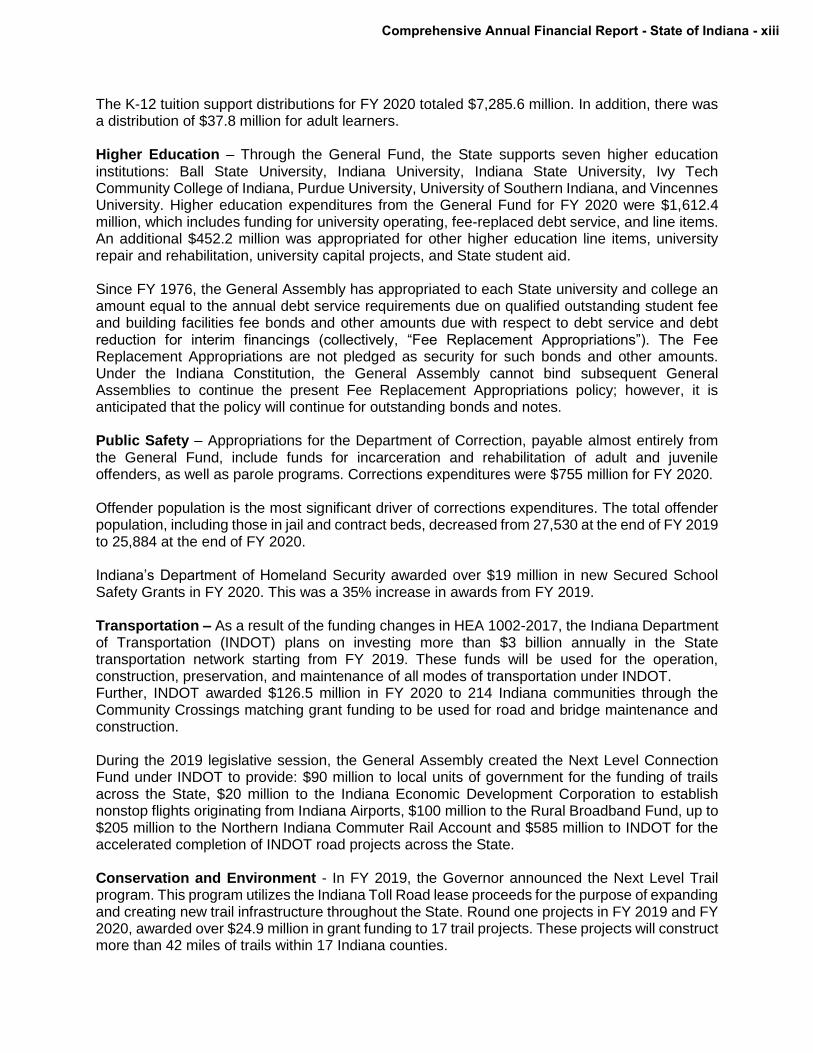
The K-12 tuition support distributions for FY 2020 totaled $7,285.6 million. In addition, there was a distribution of $37.8 million for adult learners.
Higher Education – Through the General Fund, the State supports seven higher education institutions: Ball State University, Indiana University, Indiana State University, Ivy Tech Community College of Indiana, Purdue University, University of Southern Indiana, and Vincennes University. Higher education expenditures from the General Fund for FY 2020 were $1,612.4 million, which includes funding for university operating, fee-replaced debt service, and line items. An additional $452.2 million was appropriated for other higher education line items, university repair and rehabilitation, university capital projects, and State student aid.
Since FY 1976, the General Assembly has appropriated to each State university and college an amount equal to the annual debt service requirements due on qualified outstanding student fee and building facilities fee bonds and other amounts due with respect to debt service and debt reduction for interim financings (collectively, “Fee Replacement Appropriations”). The Fee Replacement Appropriations are not pledged as security for such bonds and other amounts. Under the Indiana Constitution, the General Assembly cannot bind subsequent General Assemblies to continue the present Fee Replacement Appropriations policy; however, it is anticipated that the policy will continue for outstanding bonds and notes.
Public Safety – Appropriations for the Department of Correction, payable almost entirely from the General Fund, include funds for incarceration and rehabilitation of adult and juvenile offenders, as well as parole programs. Corrections expenditures were $755 million for FY 2020.
Offender population is the most significant driver of corrections expenditures. The total offender population, including those in jail and contract beds, decreased from 27,530 at the end of FY 2019 to 25,884 at the end of FY 2020.
Indiana’s Department of Homeland Security awarded over $19 million in new Secured School Safety Grants in FY 2020. This was a 35% increase in awards from FY 2019.
Transportation – As a result of the funding changes in HEA 1002-2017, the Indiana Department of Transportation (INDOT) plans on investing more than $3 billion annually in the State transportation network starting from FY 2019. These funds will be used for the operation, construction, preservation, and maintenance of all modes of transportation under INDOT. Further, INDOT awarded $126.5 million in FY 2020 to 214 Indiana communities through the Community Crossings matching grant funding to be used for road and bridge maintenance and construction.
During the 2019 legislative session, the General Assembly created the Next Level Connection Fund under INDOT to provide: $90 million to local units of government for the funding of trails across the State, $20 million to the Indiana Economic Development Corporation to establish nonstop flights originating from Indiana Airports, $100 million to the Rural Broadband Fund, up to $205 million to the Northern Indiana Commuter Rail Account and $585 million to INDOT for the accelerated completion of INDOT road projects across the State.
Conservation and Environment - In FY 2019, the Governor announced the Next Level Trail program. This program utilizes the Indiana Toll Road lease proceeds for the purpose of expanding and creating new trail infrastructure throughout the State. Round one projects in FY 2019 and FY 2020, awarded over $24.9 million in grant funding to 17 trail projects. These projects will construct more than 42 miles of trails within 17 Indiana counties.
Comprehensive Annual Financial Report - State of Indiana - xiii

The Bicentennial Nature Trust (BNT) was launched in FY 2012 as a statewide land conservation initiative to celebrate Indiana's 200th anniversary in much the same way as the first 100 years of statehood were marked in 1916 with establishment of the state park system. The state committed $20 million to help fund BNT and added an additional $10 million in contributions from individuals, businesses and communities around the state. Through FY 2020, 198 BNT projects had been approved of which 173 have been closed protecting over 14,400 acres. DNR expects this program to be completed by the end of 2021.
Health and Human Services – Medicaid is a state/federal shared fiscal responsibility with the State supporting roughly one-third of the total program through a combination of State General Fund and dedicated funds over the biennium. Federal funding accounts for the remaining two-thirds. Total Medicaid recipients increased from 1,456,325 in FY 2019 to 1,517,114 in FY 2020. Medicaid expenses grew from $12.4 billion in FY 2019 to $14.1 billion in FY 2020. The federal share of FY 2020 expenses was $10.2 billion. Indiana’s base federal medical assistance percentage (FMAP) equaled 65.96% for Federal Fiscal Year 2019 and 65.84% for Federal Fiscal Year 2020. The federal Families First Coronavirus Response Act provided a temporary 6.2 percentage point increase to Indiana’s base FMAP effective January 1, 2020. This increase will continue through the last day of the calendar quarter in which the public health emergency declared by the Secretary of Health and Human Services for COVID-19 terminates.
Beginning in 2015, Indiana replaced the traditional Medicaid program for non-disabled adults by expanding the Healthy Indiana Plan (HIP). HIP has been designed to improve healthcare utilization and promote personal responsibility and is funded by a combination of enhanced federal funding, hospital assessment fees, and cigarette tax revenues. Indiana became the first state to receive a 10-year extension for the program following approval in October 2020 by the federal government.
The Department of Child Services (DCS) continued the implementation of its practice to place children in the least restrictive, most family-like setting. This trending is important because research among child-advocate experts has shown that placing children in the least restrictive, most family-like setting produces the best outcomes for children and families and, consequently, is more cost effective.
FY 2020 reflected a continued downward trend in the number of cases handled by DCS. At the end of the year, DCS had a total of 21,200 open cases (figure includes informal adjustments and collaborative care for older youth), compared to 22,700 open cases at the close of FY 2019. FY 2020 was the first year DCS operated under new caseload standards for family case managers.
On March 6, 2020, Governor Holcomb declared a public health emergency for the Coronavirus outbreak. As a result of federal legislation, the Indiana Department of Health (IDOH) received $174 million in grants from the U.S. Department of Health and Human Services, $1.9 million from the U.S. Department of Agriculture, and an additional $100 million sub-state grant from the Coronavirus Relief Fund administered by State Budget Agency. These grants to IDOH will cover public health emergency response activities, including: testing and lab supplies, personal protective equipment (PPE), sanitation, phone bank and contact tracing, grants to hospitals, additional staffing, and other direct response activities.
Economic Development – The Indiana Economic Development Corporation (IEDC) is the State of Indiana’s chief economic development agency. The IEDC seeks to bring new job creation and capital investment opportunities to Indiana through competitive company attractions, expansions and consolidations. In 2020, Indiana received several accolades for its business environment.
xiv - State of Indiana - Comprehensive Annual Financial Report

This includes favorable rankings of 5th in the nation in Chief Executive Magazine's annual "Best States for Business" survey (June 2020), 3rd overall in Site Selection Magazine's list of Top 10 Competitive States (May 2020), and 6th in Business Facilities ranking of Best Business Climate (July 2020).
Awards and Acknowledgements
Certificate of Achievement Award
The Government Finance Officers Association of the United States and Canada (GFOA) awarded a Certificate of Achievement for Excellence in Financial Reporting to the State of Indiana for its comprehensive annual financial report for the fiscal year ended June 30, 2019. This was the twenty-seventh consecutive year that the State of Indiana has achieved this prestigious award.
In order to be awarded a Certificate of Achievement, a government must publish an easily readable and efficiently organized comprehensive annual financial report. This report must satisfy both generally accepted accounting principles and applicable legal requirements.
A Certificate of Achievement is valid for a period of one year only. We believe that our current comprehensive annual financial report continues to meet the Certificate of Achievement Program's requirements and we are submitting it to the GFOA to determine its eligibility for another certificate.
Acknowledgments
We acknowledge the cooperation and assistance of all State agencies in the preparation of this report.
Sincerely,
j.. V /(),, I .. Q)\fl,\,J-- � K{/ti,f::,/ Tera Klutz ,,Y Auditor of State (J State of Indiana
Cristopher Johnsto Director Office of Management and Budget
Comprehensive Annual Financial Report - State of Indiana - xv

Government Finance Officers Association
Certificate of Achievementfor Excellence
in Financial Reporting
Presented to
State of Indiana
For its Comprehensive AnnualFinancial Report
For the Fiscal Year Ended
June 30, 2019
Executive Director/CEO
xvi - State of Indiana - Comprehensive Annual Financial Report

Citizens of Indiana
Legislature Executive Judicial
Senate President Pro-Tempore
Rodric Bray
House of Representatives Speaker of the House
Brian C. Bosma
Supreme Court Chief Justice Loretta H. Rush
Court of Appeals Chief Judge Cale J. Bradford
Tax Court Judge Martha B.
Wentworth
Superintendent of Public Instruction Jennifer McCormick
Department of Education
Secretary of State Connie Lawson
Treasurer of State Kelly Mitchell
Auditor of State Tera Klutz
Attorney General Curtis T. Hill, Jr.
Lieutenant Governor Suzanne Crouch
Office of Management and Budget Department of Local Government Finance Department of Revenue Finance Authority Public Retirement System Office of Technology Board of Tax Review State Budget Agency Management and Performance Hub Office of State Based Initiatives State Board of Accounts
Bureau of Motor Vehicles Department of Child Services Department of Correction Department of Health Department of Transportation Department of Workforce Development Family and Social Services Administration State Gaming Commission State Police Department of Natural Resources Department of Environmental Management Other Agencies, Departments, Boards, Commissions, and quasi-governmental bodies corporate and politic
Governor Eric J. Holcomb
Colleges and Universities: Ball State University Indiana State University Indiana University Ivy Tech Community College of Indiana Purdue University University of Southern Indiana Vincennes University
Clerk of the Courts Greg R, Pachmayr
Comprehensive Annual Financial Report - State of Indiana - xvii

FINANCIAL SECTION
1 - State of Indiana - Comprehensive Annual Financial Report

STATE OF INDIANAAN EQUAL OPPORTUNITY EMPLOYER STATE BOARD OF ACCOUNTS
302 WEST WASHINGTON STREET ROOM E418
INDIANAPOLIS, INDIANA 46204-2769
Telephone: (317) 232-2513 Fax: (317) 232-4711
Web Site: www.in.gov/sboa
INDEPENDENT AUDITOR'S REPORT
TO: THE HONORABLE ERIC J. HOLCOMB, THE MEMBERS OF THE GENERAL ASSEMBLY, AND THE CITIZENS OF THE STATE OF INDIANA
Report on the Financial Statements
We have audited the accompanying financial statements of the governmental activities, the business-type activities, the aggregate discretely presented component units, each major fund, and the aggregate remaining fund information of the State of Indiana (State), as of and for the year ended June 30, 2020, and the related notes to the financial statements, which collectively comprise the State's basic financial statements as listed in the Table of Contents.
Management's Responsibility for the Financial Statements
Management is responsible for the preparation and fair presentation of these financial statements in accordance with accounting principles generally accepted in the United States of America; this includes the design, implementation, and maintenance of internal control relevant to the preparation and fair pre-sentation of financial statements that are free from material misstatement, whether due to fraud or error.
Auditor's Responsibility
Our responsibility is to express opinions on these financial statements based on our audit. We did not audit the financial statements of the Indiana Economic Development Corporation, Indiana Finance Authority, State Lottery Commission, Indiana Bond Bank, Indiana Housing and Community Development Authority, Indiana Board for Depositories, Indiana Secondary Market for Educational Loans Inc., Indiana Stadium and Convention Building Authority, White River State Park Development Commission, Ports of Indiana, Indiana State Fair Commission, Indiana Comprehensive Health Insurance Association, Indiana Political Subdivision Risk Management Commission, Indiana State Museum and Historic Sites Corporation, and Indiana Motorsports Commission, which represent 33.5 percent, 3.2 percent, and 23.6 percent of the assets, net position, and revenues, respectively, of the aggregate discretely presented component units. We also did not audit the Indiana Public Retirement System, Investment Trust Fund, and State Police Pension Fund which represent 86.5 percent, 87.1 percent, and 40.0 percent, respectively, of the assets, net position, and revenues and additions of the aggregate remaining fund information. Those statements were audited by other auditors whose reports have been furnished to us, and our opinions, insofar as they relate to the amounts included for those discretely presented component units and fiduciary activities, are based solely on the reports of the other auditors. We conducted our audit in accordance with auditing standards generally accepted in the United States of America and the standards applicable to financial audits contained in Government Auditing Standards, issued by the Comptroller General of the United States. Those standards require that we plan and perform the audit to obtain reasonable assurance about whether the financial statements are free from material misstatement. The financial statements of the fol-lowing were audited in accordance with auditing standards generally accepted in the United States of America, but were not audited in accordance with Government Auditing Standards: Ports of Indiana, Indiana State Fair Commission, and Indiana Political Subdivision Risk Management Commission, reported as discretely presented component units, and the State Police Pension Fund and Indiana Public Retirement System, reported within the aggregate remaining fund information.
Comprehensive Annual Financial Report - State of Indiana - 2
INDEPENDENT AUDITOR'S REPORT (Continued)
An audit involves performing procedures to obtain audit evidence about the amounts and dis-closures in the financial statements. The procedures selected depend on the auditor's judgment, including the assessment of the risks of material misstatement of the financial statements, whether due to fraud or error. In making those risk assessments, the auditor considers internal control relevant to the State's prep-aration and fair presentation of the financial statements in order to design audit procedures that are appro-priate in the circumstances, but not for the purpose of expressing an opinion on the effectiveness of the State's internal control. Accordingly, we express no such opinion. An audit also includes evaluating the appropriateness of accounting policies used and the reasonableness of significant accounting estimates made by management, as well as evaluating the overall presentation of the financial statements.
We believe that the audit evidence we have obtained is sufficient and appropriate to provide a basis for our audit opinions.
Opinion
In our opinion, based on our audit and the reports of other auditors, the financial statements referred to above present fairly, in all material respects, the respective financial position of the governmental activi-ties, the business-type activities, the aggregate discretely presented component units, each major fund, and the aggregate remaining fund information of the State, as of June 30, 2020, and the respective changes in financial position and, where applicable, cash flows thereof for the year then ended in accordance with accounting principles generally accepted in the United States of America.
Other Matters
Required Supplementary Information
Accounting principles generally accepted in the United States of America require that the Management's Discussion and Analysis, Schedules of Employer Contributions for Employee Retirement Systems and Plans and Other Postemployment Benefits, Schedules of Changes in the Net Pension Liability and Related Ratios for Employee Retirement Systems and Plans, Schedules of the State's Proportionate Share of the Net Pension Liability for Employee Retirement Systems and Plans, Schedules of Changes in the Net OPEB Liability and Related Ratios for Other Postemployment Benefits, Schedule of Changes in the Total OPEB Liability and Related Ratios for Other Postemployment Benefits, Schedule of Investment Returns for Other Postemployment Benefits, Budgetary Information, Combining Schedule of Revenues, Expenditures, and Changes in Fund Balances – Budget and Actual Major Funds (Budgetary Basis), Budget/GAAP Reconciliation – Major Funds, and the Infrastructure – Modified Reporting for Condition Rating of the State's Highways and Bridges and Comparison of Needed-to-Actual Maintenance/ Preservation, as listed in the Table of Contents, be presented to supplement the basic financial statements. Such information, although not a part of the basic financial statements, is required by the Governmental Accounting Standards Board who considers it to be an essential part of financial reporting for placing the basic financial statements in an appropriate operational, economic, or historical context. We and other auditors have applied certain limited procedures to the required supplementary information in accordance with auditing standards generally accepted in the United States of America, which consisted of inquiries of management about the methods of preparing the information and comparing the information for consistency with management's responses to our inquiries, the basic financial statements, and other knowledge we obtained during our audit of the basic financial statements. We do not express an opinion or provide any assurance on the information because the limited procedures do not provide us with sufficient evidence to express an opinion or provide any assurance.
3 - State of Indiana - Comprehensive Annual Financial Report
INDEPENDENT AUDITOR'S REPORT (Continued)
Other Information
Our audit was conducted for the purpose of forming opinions on the financial statements that col-lectively comprise the State's basic financial statements. The accompanying combining and individual statements for the Non-Major Governmental and Proprietary Funds, Internal Service Funds, Fiduciary Funds, Non-Major Discretely Presented Component Units, Budget/GAAP Reconciliation Non-Major Special Revenue Funds, and the Introductory and Statistical Sections are presented for purposes of additional analysis and are not a required part of the basic financial statements.
The combining and individual statements for the Non-Major Governmental and Proprietary Funds, Internal Service Funds, Fiduciary Funds, Non-Major Discretely Presented Component Units, and the Budget/GAAP Reconciliation Non-Major Special Revenue Funds are the responsibility of management and were derived from and relate directly to the underlying accounting and other records used to prepare the basic financial statements. Such information has been subjected to the auditing procedures applied in the audit of the basic financial statements and certain additional procedures, including comparing and recon-ciling such information directly to the underlying accounting and other records used to prepare the basic financial statements or to the basic financial statements themselves, and other additional procedures in accordance with auditing standards generally accepted in the United States of America by us and other auditors. In our opinion, the procedures performed as described above, and the reports of the other auditors, the combining and individual statements for the Non-Major Governmental and Proprietary Funds, Internal Service Funds, Fiduciary Funds, and Non-Major Discretely Presented Component Units, and the Budget/GAAP Reconciliation Non-Major Special Revenue Funds are fairly stated, in all material respects, in relation to the basic financial statements as a whole.
The Introductory and Statistical Sections have not been subjected to the auditing procedures applied in the audit of the basic financial statements, and, accordingly, we do not express an opinion or provide any assurance on them.
Other Reporting Required by Government Auditing Standards
In accordance with Government Auditing Standards, we have also issued our report dated January 6, 2021, on our consideration of the State's internal control over financial reporting and on our tests of its compliance with certain provisions of laws, regulations, contracts, and grant agreements and other matters. The purpose of that report is solely to describe the scope of our testing of internal control over financial reporting and compliance and the results of that testing, and not to provide an opinion on the effectiveness of the State's internal control over financial reporting or on compliance. That report is an integral part of an audit performed in accordance with Government Auditing Standards in considering the State's internal control over financial reporting and compliance.
Paul D. Joyce, CPA State Examiner
January 6, 2021
Comprehensive Annual Financial Report - State of Indiana - 4

MANAGEMENT’S DISCUSSION AND ANALYSIS
5 - State of Indiana - Comprehensive Annual Financial Report

STATE OF INDIANA Management’s Discussion and Analysis
June 30, 2020 The following discussion and analysis of the State of Indiana’s financial performance provides an overview of the state’s financial activities for the fiscal year (FY) ended June 30, 2020. Please read it in conjunction with the transmittal letter at the front of this report and the state’s financial statements, which follow this section. Because of prior period adjustments and reclassifications as described in Note IV(G) of the Notes to the Financial Statements, FY 2019 numbers have been restated.
Financial Highlights
For FY 2020, on a government-wide basis, the assets and deferred outflows of the State of Indiana exceeded its liabilities and deferred inflows by $16.5 billion. This compares with $15.6 billion for FY 2019, as restated.
At the end of the current FY, unassigned fund balance for the General Fund was $2.1 billion, or 15.1% of the total General Fund expenditures.
On a government-wide basis for the primary government, the state incurred expenses net of program revenue of $17.6 billion, which are offset by general revenues totaling $18.5 billion, giving an increase in net position of $0.9 billion.
General revenue for the primary government decreased by $37.4 million, or 0.2%, from FY 2019. Income tax filing and due date shifts were made from FY 2020 into FY 2021 to align with federal income tax date shifts. In spite of slowing economic activity from the national public health emergency, sales tax revenue increased year over year by 2.9%.
Combined budget balances for FY 2020 were $1.4 billion. Those balances consisted of $541.8 million in the General Fund, $347.7 million in the Tuition Reserve Fund, and $529.4 million in the Rainy
Day Fund (which has grown from a $0 balance at the end of FY 2010).
Due in large part to maintaining a healthy reserve balance, Indiana was in a position to weather a $1.4 billion revenue shortfall in the final months of FY 2020.
Indiana is one of thirteen states that has the highest credit rating assigned by all three independent credit rating agencies: Fitch, Moody’s, and Standard & Poor’s Ratings Service (S&P). From the July 2020 report, S&P cited four areas in issuing the AAA credit rating: modest economic growth across all sectors, maintenance of strong budgetary reserves, active budget management, and low overall debt levels. Fitch’s April 2020 rating report issued AAA due to “the state’s low long-term liability burden and exceptionally strong operating profile, including prudent budgetary budget management during the long economic expansion that further strengthened the state’s robust financial resilience as it enters the current coronavirus-driven downturn.”
Indiana continues to position itself as one of the lowest debt-level states in the country. Net tax supported debt (NTSD) represents just $251 per capita, the 6th lowest in the country (Moody’s Debt Median Report, 5/12/2020).
In 2020, Indiana received several accolades for its business environment. This includes favorable rankings of 5th in the nation in Chief Executive Magazine’s annual “Best States for Business” survey (June 2020), 3rd overall in Site Selection Magazine’s list of Top 10 Competitive States (May 2020), and 6th in Business Facilities ranking of Best Business Climate (July 2020).
Dec. 31, 2019 Dec. 31, 2018 % Change
Total Labor Force 3,359,406 3,375,397 -0.5%
Total Employed Labor Force 3,259,595 3,258,269 0.0%
Total Goods and Service Employment 3,184,300 3,187,600 -0.1%
Service-Providing Employment 2,491,200 2,494,200 -0.1%
Goods-Producing Employment 693,100 693,400 0.0%
Unemployment Rate 3.0% 3.4% -11.8%
Median Household Income 57,603 55,746 3.3%
Key Economic Indicators
Sources: Indiana Department of Workforce Development, Bureau of Labor Statistics, and U.S. Census
Bureau.
Comprehensive Annual Financial Report - State of Indiana - 6

Salaries and benefits for state employees represent approximately 6.4% of governmental fund expenditures. The following table shows a ten year history of the count of full time state employees.
Year
Governor's
Authority Judiciary
Other
Elected
Officials
On
Disability
Leave - In
Pay Status
On
Disability
Leave - Not in
Pay Status Total
2020 29,607 950 1,147 395 181 32,280
2019 28,868 922 1,124 363 193 31,470
2018 28,634 908 1,095 370 220 31,227
2017 28,286 894 1,062 425 221 30,888
2016 28,315 886 1,107 419 250 30,977
2015 28,157 865 1,083 455 289 30,849
2014 28,279 845 1,065 471 312 30,972
2013 28,398 831 1,049 511 345 31,134
2012 28,485 835 1,049 545 349 31,263
2011 28,472 830 1,067 610 351 31,330
Through The Auditor of State's Office
Full Time State Employees Paid
For more information on personnel paid through the Auditor of State, please read the Statistical Section
Overview of the Financial Statements
This Financial Section consists of four parts: management’s discussion and analysis (this part), the basic financial statements, required supplementary information, and other supplementary information. The basic financial statements include two kinds of statements that present different views of the state. The first two statements are government-wide financial statements that provide both long-term and short-term information about the state’s overall financial status. The remaining statements are fund financial statements that focus on individual parts of the state government, reporting the state’s operations in more detail than the government-wide statements.
The governmental fund statements tell how general government services such as public safety, education, and welfare were financed in the short term as well as what remains for future spending.
Proprietary fund statements offer short and long-term financial information about the activities the government operates like businesses, such as the Unemployment Compensation Fund.
Fiduciary fund statements provide information about the financial relationships in which the state acts solely as a trustee or agent for the benefit of others, to whom the resources in question belong, such as the retirement plan for the state’s employees.
The financial statements also include notes that explain some of the information in the financial
statements and provide more detailed data. The statements are followed by a section of required supplementary information and other supplementary information that further explain and support the information in the financial statements.
Government-wide Financial Statements
The government-wide financial statements report information about the state as a whole using accounting methods similar to those used by private-sector companies. The statement of net position includes all the government’s assets, deferred outflows of resources, liabilities, and deferred inflows of resources. All of the current year revenues and expenses are accounted for in the statement of activities regardless of when cash is received or paid. The two government-wide statements report the state’s net position and how they have changed. Net position, which equals the state’s assets, plus deferred outflows of resources, less liabilities, less deferred inflows of resources, is one way to measure the state’s financial health, or position. Over time, increases or decreases in net position may serve as a useful indicator of whether the financial position of the State of Indiana is improving or deteriorating. To assess the overall health of the state, additional non-financial factors should be considered, such as changes in the state’s tax base, the condition of the state’s roads and the state’s student population. The government-wide financial statements of the state are divided into three categories:
7 - State of Indiana - Comprehensive Annual Financial Report

Governmental activities. Most of the state’s basic services are included here, such as the state’s roads and bridges, and health and environmental programs. State sales and income taxes and federal grants finance most of these activities.
Business-type activities. The state provides goods and services through these activities that are financed or recovered primarily through fees and user charges. The Unemployment Compensation Fund, the Inns and Concessions Fund, and the Indiana Residual Malpractice Insurance Authority are included here.
Discretely Presented Component Units. These are legally separate discretely presented entities for which the state is financially accountable. These include, among others, the Indiana Finance Authority, the State Lottery Commission of Indiana, the Indiana Bond Bank, the Indiana Housing and Community Development Authority, and colleges and universities that receive state funding.
Fund Financial Statements
The fund financial statements provide more detailed information about the state’s most significant funds, not the state as a whole. Funds are accounting devices that the state uses to keep track of specific sources of funding and spending for particular purposes. The State of Indiana uses fund accounting to ensure and demonstrate compliance with finance-related legal requirements. The state has three kinds of funds: governmental funds, proprietary funds, and fiduciary funds. 1. Governmental funds. Most of the state’s basic
services are included in governmental funds, which focus on (1) cash and other financial assets that can readily be converted to cash flow in and out and (2) the balances left at year-end that are available for spending. Consequently, the governmental funds statements provide a detailed short-term view that helps the reader determine whether there are more or fewer financial resources that can be spent in the near future to finance the state’s programs.
Relationship and Reconciliation. Because the information provided in the governmental funds statements does not encompass the additional long-term focus of the government-wide statements, reconciliation pages are provided. On the page following each governmental fund’s financial statement, these reconciliations explain the differences between the government-wide and the fund financial statement. Government-wide
statements use full accrual accounting. Revenues are recognized when they are earned and expenses are recognized as soon as the liability is incurred, regardless of the timing of related cash inflows and outflows. Governmental fund financial statements use the modified accrual basis of accounting. Revenues are recognized when earned so long as they are collectible within the current period or soon enough afterwards to pay liabilities of the current period. Specific accrued liabilities are recognized as expenditures when payment is due because that is when they are normally liquidated with expendable available financial resources.
Non-current assets such as infrastructure, land, and property, plant and equipment appear on the government-wide statements but not on the governmental fund statements where they are expensed as acquired rather than capitalized. Non-current liabilities such as capital lease payables and net pension liabilities also appear on the government-wide statements but not on the fund statements. Internal service funds are included as part of the governmental activities in the government-wide statements but not the governmental fund financial statements because they provide services to the governmental funds.
2. Proprietary funds. Services for which the state charges customers a fee are generally reported in proprietary funds. These funds use the economic resources measurement focus and the accrual basis of accounting. Proprietary funds, like the government-wide statements, provide both long-term and short-term financial information. In fact, the state’s enterprise funds (one type of proprietary fund) are the same as its business-type activities, but provide more detail and additional information such as cash flows. The state uses internal service funds (the other type of proprietary fund) to report activities that provide supplies and services for the state’s other programs and activities. An example would be the State Employee Health Insurance Fund.
3. Fiduciary funds. The state is the trustee, or
fiduciary, for its employees’ pension plans. It is also responsible for other assets that, because of a trust arrangement, can be used only for the trust beneficiaries. The state is responsible for ensuring that the assets reported in these funds are used for their intended purposes. Fiduciary funds use the economic resources measurement focus and the accrual basis of accounting. All of the state’s fiduciary activities are reported in a separate statement of fiduciary net position and a statement of changes in fiduciary net position. These
Comprehensive Annual Financial Report - State of Indiana - 8

activities are excluded from the state’s government-wide financial statements, because
the state cannot use these assets to finance its operations.
Financial Analysis of the State as a Whole
Net Position
The following is condensed from the Statement of Net Position:
Primary Government
Governmental
Activities
Business-type
Activities
Total Primary
Government
2020 2019 2020 2019 2020 2019
Current and other assets 16,921.2$ 13,250.8$ 676.8$ 1,104.3$ 17,598.0$ 14,355.1$
Capital assets 17,666.4 17,305.0 0.4 0.4 17,666.8 17,305.4
Total assets 34,587.6 30,555.8 677.2 1,104.7 35,264.8 31,660.5
Deferred outflows of resources 1,477.9 1,459.7 - - 1,477.9 1,459.7
Total deferred outflows of resources 1,477.9 1,459.7 - - 1,477.9 1,459.7
Current liabilities 6,542.9 3,689.7 167.2 64.8 6,710.0 3,754.5
Long-term liabilities 13,042.3 13,490.8 23.8 24.2 13,066.2 13,515.0
Total liabilities 19,585.2 17,180.5 191.0 89.0 19,776.2 17,269.5
Deferred inflows of resources 422.3 226.0 - - 422.3 226.0
Total deferred inflows of resources 422.3 226.0 - - 422.3 226.0
Net position:
Net investment in capital assets 16,834.1 16,400.0 0.4 0.4 16,834.5 16,400.4
Restricted 1,105.5 1,102.6 426.9 962.5 1,532.4 2,065.1
Unrestricted (1,881.6) (2,893.6) 58.9 52.8 (1,822.7) (2,840.8)
Total net position 16,058.0$ 14,609.0$ 486.2$ 1,015.7$ 16,544.2$ 15,624.7$
State of Indiana
Condensed Schedule of Net Position
(in millions of dollars)
At the end of the current FY, net position for the primary government increased by $.9 billion. Current and other assets increased by $3.2 billion due primarily to unspent federal grant revenues received through the Federal COVID-19 Fund, which resulted in more cash, cash equivalents, and investments. In addition investments increased $300 million as a result of investment purchases with a trade date of June 30 and a settlement date of July 1. Capital assets increased by $361.4 million. The principal reason for the increase in capital assets were increases in land, infrastructure, and construction in progress at the Indiana Department of Transportation primarily due to the continuation of the Next Level Agenda initiative, which focuses to maintain and build the state’s infrastructure. Another contributor to the increase in capital assets was from new software in development for the Family and Social Services
Administration’s (FSSA) Indiana Eligibility Determination and Services System (IEDSS), an internal system to determine eligibility for benefits including healthcare, and at the Indiana Department of Revenue (IDOR) for Project NextDOR, a modernization of the current tax system. Total liabilities increased $2.5 billion primarily due to the increases in unearned revenue to offset unspent revenues received through the Federal COVID-19 Fund. Liabilities also increased as a result of the aforementioned investment purchases on June 30 and the obligation to settle the purchase on July 1. Deferred inflows of resources increased $196.3 million due to deferrals related to pensions and OPEB from recognition of investment experiences gains in pensions and changes in actuarial assumptions and other inputs of the state’s OPEB plans.
9 - State of Indiana - Comprehensive Annual Financial Report
Changes in Net Position The following is condensed from the Statement of Activities:
Primary Government
Governmental
Activities
Activities
Business-type
Activities
Total Primary
Government
2020 2019 2020 2019 2020 2019
Revenues
Program revenues:
Charges for services 3,317.3$ 3,450.6$ 468.4$ 484.5$ 3,785.7$ 3,935.1$
Operating grants and contributions 16,002.4 13,264.2 3,007.5 - 19,009.9 13,264.2
Capital grants and contributions 1,249.9 1,132.6 - - 1,249.9 1,132.6
General revenues:
Income taxes 6,788.5 6,864.3 - - 6,788.5 6,864.3
Sales taxes 8,320.7 8,085.7 - - 8,320.7 8,085.7
Other 3,355.8 3,557.7 26.1 20.7 3,381.9 3,578.4
Total revenues 39,034.6 36,355.1 3,502.0 505.2 42,536.6 36,860.3
Program Expense
General government 1,671.8 1,574.7 - - 1,671.8 1,574.7
Public safety 1,800.8 1,510.1 - - 1,800.8 1,510.1
Health 463.0 402.1 - - 463.0 402.1
Welfare 18,360.5 16,157.9 - - 18,360.5 16,157.9
Conservation, culture and development 542.7 557.0 - - 542.7 557.0
Education 11,537.9 10,558.7 - - 11,537.9 10,558.7
Transportation 3,167.0 2,711.5 - - 3,167.0 2,711.5
Interest expense 42.3 45.5 - - 42.3 45.5
Unemployment compensation fund - - 4,007.6 243.5 4,007.6 243.5
Other - - 23.5 24.2 23.5 24.2
Total expenses 37,586.0 33,517.5 4,031.1 267.7 41,617.1 33,785.2
Excess (deficiency) before transfers 1,448.6 2,837.6 (529.1) 237.5 919.5 3,075.1
Transfers 0.4 2.0 (0.4) (2.0) - -
Change in net position 1,449.0 2,839.6 (529.5) 235.5 919.5 3,075.1
Beginning net position, as restated 14,609.0 11,769.4 1,015.7 780.2 15,624.7 12,549.6
Ending net position 16,058.0$ 14,609.0$ 486.2$ 1,015.7$ 16,544.2$ 15,624.7$
State of Indiana
Condensed Schedule of Change in Net Position
(in millions of dollars)
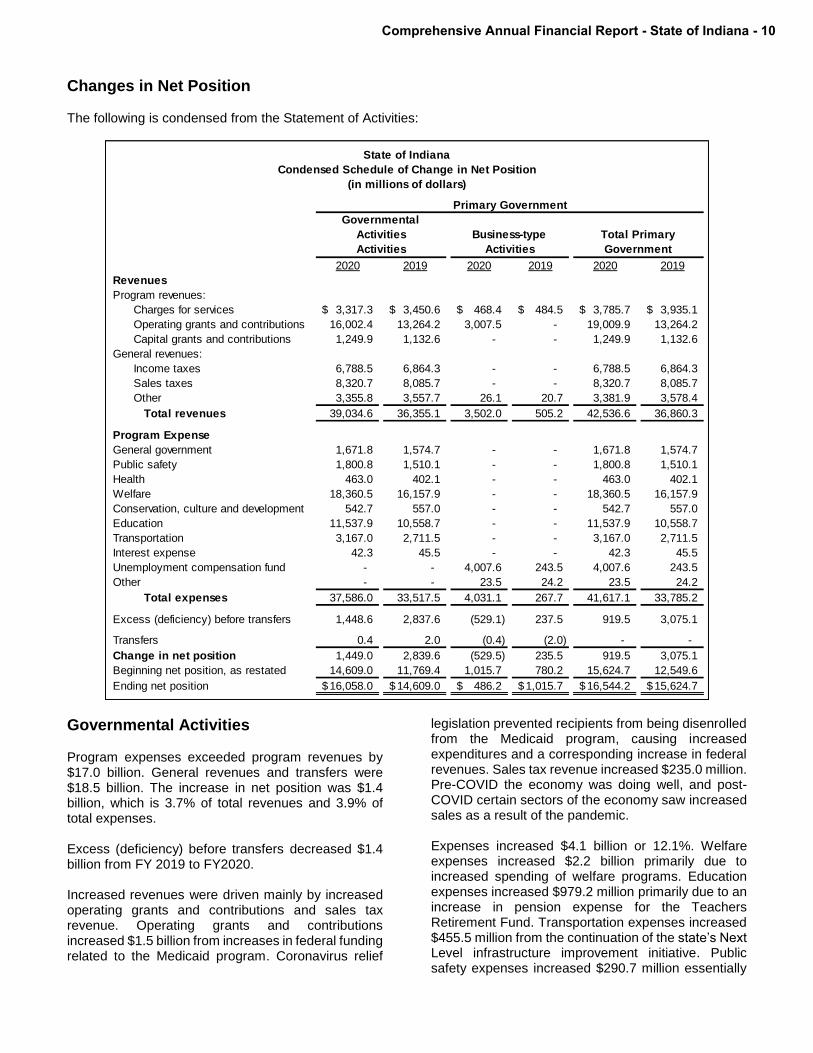
Governmental Activities Program expenses exceeded program revenues by $17.0 billion. General revenues and transfers were $18.5 billion. The increase in net position was $1.4 billion, which is 3.7% of total revenues and 3.9% of total expenses. Excess (deficiency) before transfers decreased $1.4 billion from FY 2019 to FY2020. Increased revenues were driven mainly by increased operating grants and contributions and sales tax revenue. Operating grants and contributions increased $1.5 billion from increases in federal funding related to the Medicaid program. Coronavirus relief
legislation prevented recipients from being disenrolled from the Medicaid program, causing increased expenditures and a corresponding increase in federal revenues. Sales tax revenue increased $235.0 million. Pre-COVID the economy was doing well, and post-COVID certain sectors of the economy saw increased sales as a result of the pandemic. Expenses increased $4.1 billion or 12.1%. Welfare expenses increased $2.2 billion primarily due to increased spending of welfare programs. Education expenses increased $979.2 million primarily due to an increase in pension expense for the Teachers Retirement Fund. Transportation expenses increased $455.5 million from the continuation of the state’s Next Level infrastructure improvement initiative. Public safety expenses increased $290.7 million essentially
Comprehensive Annual Financial Report - State of Indiana - 10

from increases in OPEB and pension expenses of the State Police plans. Tax revenues for governmental activities were broken down as follows:
Income Taxes37.2%
Sales45.6%
Insurance, Alcohol & Tobacco, & Financial Institutions
4.5%
Gaming2.5%
Fuels7.9%
Other2.3%
Tax Revenues - Governmental Activities
Tax revenues of $18.3 billion represent 46.8% of total revenues for governmental activities. This compares to $18.3 billion or 50.3% of total revenues in FY 2019. Program revenues accounted for $20.6 billion or 52.7% of total revenues. In FY 2019, program revenues accounted for $17.8 billion or 49.1% of total revenues. General revenues other than tax revenues
were $213.7 million or 0.5% of total revenues. Of this, $172.4 million were investment earnings. This compares to 2019, when general revenues other than taxes were $232.6 million or 0.6% of total revenues and $190 million was investment earnings. Investment earnings decreased $17.6 million from FY 2019 to FY 2020 or 9.3% due to lower interest rates.
Total revenues for governmental activities were broken down as follows:
GR - Taxes46.8%
PR - Charges f or Serv ices
8.5%
PR - Grants & Contributions
44.2%
GR - Rev enues not restricted to specif ic
programs
0.5%
Revenues to Support Governmental Activities
PR = program revenues GR = general revenues
11 - State of Indiana - Comprehensive Annual Financial Report

Total revenues were 103.9% of expenses which was a decrease from 108.5% in FY 2019. Total revenues increased 7.4% from $36.4 billion in FY 2019 to $39.0 billion in FY 2020. Expenses increased 12.1% from $33.6 billion in FY 2019 to $37.6 billion in FY 2020. The largest portion of the state’s expenses is for welfare, which is $18.4 billion, or 48.8% of total expenses. This compares with $16.2 billion, or 48.2% of total expenses in FY 2019. The change in welfare expenses was an increase of $2.2 billion or 13.6%. $3.8 billion of welfare expenses in FY 2020 were funded from general revenues. Some of the major expenses were Medicaid Assistance, $14.2 billion, the U.S. Department of Health and Human Services Fund, $1.5 billion, and the federal food stamp program in the U.S. Department of Agriculture Fund, $1.1 billion.
Education comprises 30.7%, or $11.5 billion of the state’s expenses. In FY 2019, education accounted for 31.5%, or $10.6 billion, of expenses. The change in education expenses was an increase of $979.2 million, or 9.3%. Some of the major expenses were tuition support of $7.3 billion, General Fund appropriations for state colleges and universities, $1.7 billion, Teachers’ Retirement Pension, $941.1 million, federal grant programs from the U.S. Department of Education Fund, $647.9 million, U.S. Department of Agriculture Fund, $326.8 million, and the Federal COVID-19 Fund, $111.9 million. Transportation spending accounted for $3.2 billion, or 8.4% of expenses. Transportation comprised $2.7 billion or 8.1% of expenses in FY 2019. Transportation includes expenses related to the maintenance and construction of state infrastructure.
Total expenses for governmental activities were broken down as follows:
General Government
4.4%
Public Safety4.8%
Health/ Welfare50.1%
Education30.7%
Transportation8.4%
Other1.6%
Expenses - Governmental Activities
Business-type Activities
Business-type activities represent 8.2% of the Primary Government’s revenues and 9.7% of the expenses. The Unemployment Compensation Fund accounts for 94.9% of business-type activities’ operating revenues and 99.6% of operating expenses. The change in net position for business-type activities was a decrease of $529.5 million. The Unemployment Compensation Fund collects employer taxes and the federal share of unemployment compensation. Benefits are paid to eligible individuals and the fund covers general and
administrative expenses. Expenses in the fund exceeded revenues earned by $535.6 million. This compares to FY 2019 when this fund’s revenues exceeded expenses by $230.1 million. Employer contributions into the fund decreased by $13.2 million, from $457.7 million in FY 2019 to $444.5 million in FY 2020. The decrease in net position of $535.6 million is due to an increase in claims for benefits against the fund because of the COVID-19 pandemic. Federal subsidies of $3.0 billion helped to offset the increase in unemployment benefits paid.
Comprehensive Annual Financial Report - State of Indiana - 12

The following schedule shows the net expense (revenue) attributable to each function of government. Each function of Indiana government is either self-supporting (a negative number) or requires additional general revenues to cover expenses (a positive number).
June 30, 2020 June 30, 2019 % Change
Governmental Activities:
General government 389.6$ 793.9$ -50.9%
Public safety 1,063.0 743.2 43.0%
Health (296.2) (217.6) 36.1%
Welfare 3,816.1 3,718.6 2.6%
Conservation, culture, and development 154.3 165.0 -6.5%
Education 10,448.6 9,476.8 10.3%
Transportation 1,398.5 944.6 48.1%
Interest expense 42.3 45.5 -7.0%
Business-type Activities:
Unemployment Compensation Fund 555.6 (214.2) -359.4%
Malpractice Insurance Authority 0.4 0.4 0.0%
Inns and Concessions (0.7) (2.9) -75.9%
Total 17,571.5$ 15,453.3$ 13.7%
Net Cost of Primary Government
(in millions of dollars)
Financial Analysis of the State’s Funds
The following is an analysis of the state’s major governmental funds. The transfers in and transfers out for these funds are explained in much greater detail in note IV(B) in the Notes to the Financial Statements. General Fund The General Fund is maintained to account for resources obtained and used for those services traditionally provided by state government which are not required to be accounted for in another fund. The fund balance of the General Fund at June 30, 2020 was $4.6 billion, of which 59.1% is comprised of assets. This compares to a fund balance at June 30, 2019 of $4.3 billion, which was 63.3% of assets. This indicates that the state’s financial position in the General Fund increased from the prior year. The fund balance of $4.6 billion is composed of restrictions of $543.3 million, commitments of $34.3 million, and assignments of $1.8 billion, leaving an unassigned balance of $2.1 billion. The restricted amount consists of the Rainy Day Fund, which is accounted for in the General Fund. For more information on the components of fund balance, see the chart in the Notes to the Financial Statements III(B). The General Fund’s revenues increased 0.7%, or $106.7 million, from FY 2019, because of an increase in total sales tax revenue of $229.7 million. This was partially offset by a decrease in income tax revenue. General Fund expenditures remained steady, decreasing only $19.5 million, or 0.1% from FY 2019.
General Fund transfers in decreased $264.6 million or 17.2% from FY 2019. Transfers out were $3.1 billion in FY 2020 as compared to $3.2 billion in FY 2019. More detail on these transfers can be found in the Notes to the Financial Statements IV(B). Overall, the net position of the General Fund increased $289.2 million. Public Welfare-Medicaid Assistance Fund Medicaid is an insurance program for low-income individuals. It is jointly funded by the Federal government and the state. The fund received $10.6 billion in federal revenue as compared to $9.1 billion in FY 2019. State funding comes through transfers from the General Fund. Transfers in were $2.9 billion in FY 2020 as compared to $2.8 billion in FY 2019. Transfers out were $447.2 million compared with $452.0 million in FY 2019. The fund distributed $14.2 billion in Medicaid Assistance during the year, which is an increase of $1.6 billion over FY 2019. The change in fund balance decreased $282.3 million from FY 2019 to FY 2020. U.S. Department of Health and Human Services Fund The U.S. Department of Health and Human Services Fund is a fund to account for federal grants that are used to carry out health and human services programs.
13 - State of Indiana - Comprehensive Annual Financial Report
The fund received $1.5 billion in federal grant revenues and expended $1.8 billion. The US DHHS Fund received transfers in of $302.4 million mostly from the General Fund for various health and human services programs. The change in fund balance from FY 2019 to FY 2020 was an increase of $8.1 million. Federal COVID-19 Fund The Federal COVID-19 Fund provides federal grant dollars to cover costs that are necessary expenditures incurred due to the public health emergency with respect to the Coronavirus Disease 2019. The fund includes the CARES Act, the Coronavirus Relief Fund, and additional funds provided for existing grant programs. The fund received earned federal grant revenues of $639.2 million and unearned revenue of $1.9 billion. The fund expended $616.9 million for pandemic related expenditures. This is a new fund for fiscal year 2020.
General Fund Budgetary Highlights At 2020 fiscal year-end, Indiana closed the books with $1,418.9 million in reserves. This is down from the previous year balance of $2,270.1 million. General Fund forecasted revenues for Fiscal Year 2020 totaled $15,374.5 million which is $1,416.3 million (8.4%) below estimates from December 2019. As anticipated, the Fiscal Year 2020 revenue report shows the initial economic impact of the COVID-19 public health emergency and the impact from deferring the income tax filing and payment due date from April 15, 2020 to July 15, 2020. An estimated $900 million of income tax
payments and $50 million in individual income tax attributable to federal stimulus and unemployment benefits due in the last quarter of Fiscal Year 2020 were deferred to Fiscal Year 2021. After a balance transfer of $577.6 million from the Medicaid Contingency and Reserve Account to the General Fund, the combined balances remaining each account were $541.8 million in the General Fund, $347.7 million in the Tuition Reserve Account, and $529.4 million in the Rainy Day Fund.
Capital Asset and Debt Administration
Capital Assets Capital assets were $17.7 billion, which was 50.1% of total assets for the primary government. Related debt was $.9 billion. Net investment in capital assets for the primary government was $16.8 billion. Related debt was 4.7% of capital assets. Total capital assets increased $361.4 million or 2.1% and is mostly attributable to increases in the Indiana Department of Transportation’s land, infrastructure, and construction in progress. The net increase in capital assets is primarily comprised of increases for infrastructure of $56.4 million, $267.0 million in construction in progress, and $84.4 million in land. INDOT’s $262.4 million increase is comprised of increases in land, $78.0 million, and infrastructure consisting of interstate roads, non-interstate roads, and bridges, $56.4 million, and CIP consisting of right of way and work in progress, $128.0 million. More detailed information about the state’s capital assets is presented in Note IV(D) to the Financial Statements.
The following table shows the percentage change from FY 2019 to FY 2020.
Governmental
Activities
Total
%
Change
2020 2019 2020 2019 2020 2019
Land 2,528.2$ 2,443.7$ -$ -$ 2,528.2$ 2,443.7$ 3.5%
Infrastructure 12,869.0 12,812.6 - - 12,869.0 12,812.6 0.4%
Construction in progress 1,129.8 862.8 - - 1,129.8 862.8 30.9%
Property, plant and equipment 3,108.2 3,046.3 1.1 1.0 3,109.3 3,047.3 2.0%
Computer software 319.4 296.3 - - 319.4 296.3 7.8%
Less accumulated depreciation (2,288.1) (2,156.7) (0.7) (0.6) (2,288.8) (2,157.3) 6.1%
Total 17,666.5$ 17,305.0$ 0.4$ 0.4$ 17,666.9$ 17,305.4$ 2.1%
State of Indiana
Capital Assets
(in millions of dollars)
Business-
type
Activities
Total Primary
Government
Comprehensive Annual Financial Report - State of Indiana - 14

Long-term Obligations Major long-term obligations items are included in the following table. These items comprised 100% of total
long-term liabilities and 66.1% of total liabilities.
The following table shows the percentage change from FY 2019 to FY 2020.
Governmental
Activities
Total %
Change
2020 2019 2020 2019 2020 2019
Accrued liability for
compensated absences 193.4$ 177.8$ 0.8$ 0.8$ 194.2$ 178.6$ 8.7%
Capital lease payable 832.3 904.8 - - 832.3 904.8 -8.0%
Claims payable - - 23.1 23.4 23.1 23.4 -1.3%
Net pension liability 11,792.9 12,037.0 - - 11,792.9 12,037.0 -2.0%
Other postemployment
benefits 190.2 335.8 - - 190.2 335.8 -43.4%
Pollution remediation 33.6 35.4 - - 33.6 35.4 -5.1%
Total 13,042.4$ 13,490.8$ 23.9$ 24.2$ 13,066.3$ 13,515.0$ -3.3%
Business-type
Activities
Total Primary
Government
State of Indiana
Long-term Liabilities
(in millions of dollars)
Total long-term liabilities decreased by 3.3% or $448.7 million. The largest decreases were for the net pension liability of $244.1 million and for other postemployment benefits of $145.6 million. Long-term liabilities related to capital leases also decreased by $72.5 million. These decreases were offset by an increase to accrued liability for compensated absences of $15.6 million. The continued funding of the net liability for the Teachers Pre-96 Fund was the major contributing factor for the decrease to the net pension liability. The decrease for other postemployment benefits was mainly due from actuarial valuation changes in actuarial assumptions for the state’s OPEB plans. The Indiana Finance Authority did not issue any new highway revenue bonds, therefore capital lease payables decreased. Claims payable for business activities decreased by $0.3 million. This was the amount of decrease in claims payable for the Indiana Residual Malpractice Insurance Authority. More detailed information about the state’s long term obligations is presented in Note IV(F) to the Financial Statements.
Infrastructure As required by GASB Statement No. 34, the state has capitalized its infrastructure. This amounts to $12.8 billion in roads and bridges using the modified approach, $2.0 billion in right of way classified as land, and $34.5 million in property (septic, sewer, and water systems; and streets/sidewalks/curbs) and dams being depreciated. In order to utilize the modified approach, the state is required to: Maintain an asset management system that includes an up-to-date inventory of eligible infrastructure assets. Perform condition assessments of eligible assets and summarize the results using a measurement scale. Estimate each year the annual amount to maintain and preserve the assets at the condition level established and disclosed by the state. Document that the assets are being preserved approximately at or above the established condition level. Under the modified approach, the state expenses certain maintenance and preservation costs and does not report depreciation expense. Assets accounted for under the modified approach include approximately 11,158 centerline road miles of pavement along 241 routes and approximately 5,810 bridges that the state
15 - State of Indiana - Comprehensive Annual Financial Report

is responsible to maintain. The state has consistently maintained the assessed conditions of roads over the past three years. It is the state's policy to maintain a network average International Roughness Index based on the right wheel path (IRI RWP) of no more than 101 for Interstate Roads, NHS Non-Interstate and Non-NHS Roads (a good rating is in the range of 80–114). The most recent condition assessment, completed for FY 2020, indicated that the average IRI RWP for roads was in an acceptable range. The state has maintained the assessed conditions of bridges at levels which are above the established benchmarks. It is the state's policy to maintain Interstate bridges at an average sufficiency rating of 87%, NHS Non-Interstate bridges at an average sufficiency rating of 85%, and Non-NHS bridges at an average sufficiency rating of 83% (a good rating is 80% - 90%). The most recent condition assessment, completed in FY 2020, indicated that the average sufficiency rating for bridges exceeded the minimum acceptable standard. Total actual maintenance and preservation costs for interstate roads was higher than planned during fiscal 2020 for interstate roads. Various factors contributing to this included letting additional projects, scope changes and competitive biddings. The total actual maintenance and preservation costs for all other road classifications were lower than planned during FY 2020. Various factors contributed to these costs being less than planned including bids that came in under the original estimates, work volumes, lower fuel costs, and redefining the repairs needed and the methods used. The average IRI RWP for Interstate roads was in the excellent condition rating range and the two other road categories, NHS roads - Non-Interstate and Non-NHS roads, were in the good condition rating range. The state’s standard of having less than 12.5% of all roads rated in poor condition was met. Total actual maintenance and preservation costs were less than planned for Interstate and National Highway
System bridges. This was due to multiple factors including bids that came in under benchmark estimates, change of scope, and reprioritization to meet the agencies goals. Bridge sufficiency ratings were within the state’s policy for the maintenance of bridges in all road classes.
Economic Factors With the latest data as of December 2019, Indiana’s Gross Domestic Product (GDP) was $379.7 billion. Indiana’s economy ranked the 19th largest in the U.S. in terms of the value of goods and services. Indiana’s largest contributor to real GDP has been and continues to be the manufacturing sector, which accounted for nearly 27%. The second largest contributor of Indiana’s real GDP was trade, transportation, and utilities, which accounted for 16.5%. As of December 2019, the manufacturing sector accounted for nearly 17% of the non-farm jobs in Indiana. Per capita personal income was $48,657, and the State’s unemployment rate was 3.2% at the end of calendar year 2019. On March 6, 2020, the Indiana State Department of Health confirmed the first case of COVID-19 in Indiana. As COVID-19 spread in the United States and in Indiana, the Governor issued various steps and issued various Executive Orders, including a stay-at-home order. The duration of the adverse economic impact from the public health emergency is difficult to predict and will present a challenge for the State to fund essential services at the levels adopted in the current 2020/2021 budget. Future spending levels will be influenced by the actual revenues collected from these future and uncertain economic conditions, the prioritization of spending decisions, and the flexibility afforded with any federal assistance. General liquidity is not a concern at this time, as the entire cash investment balance of the State was just over $10.8 billion as of June 30, 2020. This balance includes reserve accounts and a deposit of $2.4 billion from the US Treasury for CARES Act Coronavirus Relief Fund.
Contacting the Auditor of State This financial report is designed to provide our citizens, taxpayers, customers, investors and creditors with a general overview of the state’s finances and to demonstrate the state’s accountability for the money it receives. If you have questions about this report or need additional financial information, contact [email protected] or 317-232-3300.
Comprehensive Annual Financial Report - State of Indiana - 16

BASIC FINANCIAL STATEMENTS
17 - State of Indiana - Comprehensive Annual Financial Report

GOVERNMENT-WIDE
FINANCIAL STATEMENTS
Comprehensive Annual Financial Report - State of Indiana - 18

State of Indiana
Statement of Net Position
June 30, 2020(amounts expressed in thousands)
Primary Government Component Units
Governmental
Activities
Business-type
Activities Total Component Units
ASSETS
Cash, cash equivalents and investments - unrestricted 9,232,943$ 87,408$ 9,320,351$ 6,015,036$
Cash, cash equivalents and investments - restricted 755,682 428,326 1,184,008 10,446,030
Securities lending collateral 2,150,363 - 2,150,363 50,203
Receivables (net) 4,370,838 160,321 4,531,159 2,560,904
Due from primary government - - - 15,000
Due from component unit 23,450 - 23,450 -
Inventory 3,920 625 4,545 4,386
Prepaid expenses 75,825 92 75,917 15,079
Loans 307,023 - 307,023 3,373,805
Investment in direct financing lease - - - 1,889,273
OPEB assets - - - 163,603
Other assets 1,003 31 1,034 177,486
Capital assets:
Capital assets not being depreciated/amortized 16,492,482 - 16,492,482 2,803,882
Capital assets being depreciated/amortized 3,462,029 1,052 3,463,081 16,047,935
less accumulated depreciation/amortization (2,288,066) (670) (2,288,736) (7,565,037)
Total capital assets, net of depreciation/amortization 17,666,445 382 17,666,827 11,286,780
Total assets 34,587,492 677,185 35,264,677 35,997,585
DEFERRED OUTFLOWS OF RESOURCES
Accumulated decrease in fair value of hedging derivatives - - - 149,831
Debt refunding loss - - - 63,599
Related to pensions 1,421,386 - 1,421,386 46,060
Swap termination - - - 55,301
Related to OPEB 56,521 - 56,521 115,893
Asset retirement obligations - - - 2,434
Total deferred outflows of resources 1,477,907 - 1,477,907 433,118
LIABILITIES
Accounts payable 2,158,987 162,328 2,321,315 648,168
Interest payable - - - 114,160
Tax refunds payable 128,841 - 128,841 -
Payables to other governments 174,197 - 174,197 -
Due to component unit 15,000 - 15,000 -
Due to primary government - - - 23,450
Unearned revenue 1,914,447 4,576 1,919,023 678,306
Advances from federal government - - - 47,700
Securities lending collateral 2,150,363 - 2,150,363 50,203
Derivative instrument liability - - - 150,418
Other liabilities 1,010 237 1,247 232,999
Long-term liabilities:
Due within 1 year 143,403 1,561 144,964 1,285,931
Due in more than 1 year 12,898,943 22,282 12,921,225 11,886,287
Total liabilities 19,585,191 190,984 19,776,175 15,117,622
DEFERRED INFLOWS OF RESOURCES
Advanced payment for service concession agreement - - - 3,997,944
Service concession arrangement receipts - - - 269,301
Related to pensions 253,255 - 253,255 50,757
Related to OPEB 168,511 - 168,511 98,552
Related to irrevocable split interest agreements 497 - 497 27,932
Total deferred inflows of resources 422,263 - 422,263 4,444,486
NET POSITION
Net investment in capital assets 16,834,097 382 16,834,479 6,765,300
Restricted - nonexpendable:
Grants/constitutional restrictions 150 - 150 3,068
Permanent funds 502,835 - 502,835 61,707
Instruction and research - - - 1,161,076
Student aid - - - 1,247,352
Other purposes 73,060 - 73,060 540,286
Restricted - expendable:
Grants/constitutional restrictions 529,425 - 529,425 2,205,966
Future debt service - - - 303,342
Instruction and research - - - 707,758
Student aid - - - 755,652
Endowments - - - 515,316
Capital projects - - - 1,229,366
Unemployment compensation - 426,859 426,859 -
Other purposes - - - 557,855
Unrestricted (1,881,622) 58,960 (1,822,662) 814,551
Total net position 16,057,945$ 486,201$ 16,544,146$ 16,868,595$
The notes to the financial statements are an integral part of this statement.
19 - State of Indiana - Comprehensive Annual Financial Report

Sta
te o
f In
dia
na
Sta
tem
en
t o
f A
cti
vit
ies
Fo
r th
e Y
ear
En
ded
Ju
ne 3
0, 2020
(am
ou
nts
exp
ressed
in
th
ou
san
ds)
Net
(Exp
en
se)
Rev
en
ue a
nd
Ch
an
ges in
Net
Po
sit
ion
Pro
gra
m R
ev
en
ues
Pri
mary
Go
vern
men
tC
om
po
nen
t U
nit
s
Fu
ncti
on
s/P
rog
ram
sE
xp
en
ses
Ch
arg
es f
or
Serv
ices
Op
era
tin
g G
ran
ts a
nd
Co
ntr
ibu
tio
ns
Cap
ital G
ran
ts a
nd
Co
ntr
ibu
tio
ns
Go
vern
men
tal
Acti
vit
ies
Bu
sin
ess-t
yp
e
Acti
vit
ies
To
tal
Co
mp
on
en
t U
nit
s
Pri
mary
go
vern
men
t:
Govern
menta
l activitie
s:
Genera
l g
overn
ment
1,6
71,7
54
$
649,6
85
$
630,7
19
$
1,7
04
$
(389,6
46)
$
-
$
(389,6
46)
$
-
$
Public
safe
ty1,8
00,7
76
552,3
78
185,3
23
39
(1,0
63,0
36)
-
(1
,063,0
36)
-
Health
462,9
91
401,4
78
357,7
36
-
296,2
23
-
296,2
23
-
Welfare
18,3
60,5
40
1,0
36,6
56
13,5
07,7
55
-
(3,8
16,1
29)
-
(3
,816,1
29)
-
Conserv
ation,
culture
and d
evelo
pm
ent
542,6
98
192,7
24
195,6
56
-
(1
54,3
18)
-
(154,3
18)
-
Education
11,5
37,8
73
2,3
81
1,0
86,8
45
-
(1
0,4
48,6
47)
-
(10,4
48,6
47)
-
Tra
nsport
ation
3,1
67,0
05
481,9
96
38,3
21
1,2
48,1
56
(1,3
98,5
32)
-
(1
,398,5
32)
-
Inte
rest
expense
42,2
54
-
-
-
(42,2
54)
-
(4
2,2
54)
-
Tota
l g
overn
menta
l activitie
s37,5
85,8
91
3,3
17,2
98
16,0
02,3
55
1,2
49,8
99
(17,0
16,3
39)
-
(17,0
16,3
39)
-
Busin
ess-t
ype a
ctivitie
s
Unem
plo
ym
ent
Com
pensation F
und
4,0
07,5
86
444,5
06
3,0
07,5
18
-
-
(555,5
62)
(5
55,5
62)
-
Malp
ractice I
nsura
nce A
uth
ority
1,0
31
638
-
-
-
(393)
(3
93)
-
Inns a
nd C
oncessio
ns
22,4
88
23,2
19
-
-
-
731
731
-
Tota
l busin
ess-t
ype a
ctivitie
s4,0
31,1
05
468,3
63
3,0
07,5
18
-
-
(555,2
24)
(5
55,2
24)
-
Tota
l prim
ary
govern
ment
41,6
16,9
96
$
3,7
85,6
61
$
19,0
09,8
73
$
1,2
49,8
99
$
(17,0
16,3
39)
(5
55,2
24)
(1
7,5
71,5
63)
-
Co
mp
on
en
t u
nit
s:
Govern
menta
l154,6
45
-
86,2
82
-
-
-
-
(6
8,3
63)
Pro
prieta
ry2,4
90,6
85
1,8
28,8
56
424,3
88
93,1
54
-
-
-
(144,2
87)
Colle
ges a
nd u
niv
ers
itie
s7,9
56,6
66
3,7
26,5
28
2,1
75,2
68
246,9
73
-
-
-
(1
,807,8
97)
Tota
l com
ponent
units
10,6
01,9
96
$
5,5
55,3
84
$
2,6
85,9
38
$
340,1
27
$
-
-
-
(2
,020,5
47)
Genera
l R
evenues:
Incom
e t
ax
6,7
88,4
72
-
6,7
88,4
72
-
Sale
s t
ax
8,3
20,6
82
-
8,3
20,6
82
-
Fuels
tax
1,4
49,9
02
-
1,4
49,9
02
-
Gam
ing
tax
449,7
13
-
449,7
13
1,2
28
Alc
ohol &
Tobacco t
ax
426,4
76
-
426,4
76
-
Insura
nce t
ax
248,4
14
-
248,4
14
-
Fin
ancia
l In
stitu
tions t
ax
149,0
61
-
149,0
61
-
Oth
er
tax
418,4
92
-
418,4
92
-
Tota
l ta
xes
18,2
51,2
12
-
18,2
51,2
12
1,2
28
Revenue n
ot
restr
icte
d t
o s
pecific
pro
gra
ms:
Investm
ent
earn
ing
s172,4
45
25,8
83
198,3
28
323,9
67
Paym
ents
fro
m S
tate
of
India
na
-
-
-
1,7
89,2
88
Oth
er
41,2
72
228
41,5
00
423,7
71
Specia
l item
:
Tra
nsfe
rs w
ithin
prim
ary
govern
ment
394
(3
94)
-
-
Tota
l g
enera
l re
venues a
nd t
ransfe
rs18,4
65,3
23
25,7
17
18,4
91,0
40
2,5
38,2
54
Chang
es in n
et
positio
n1,4
48,9
84
(529,5
07)
919,4
77
517,7
07
Net
positio
n -
beg
innin
g,
as r
esta
ted
14,6
08,9
61
1,0
15,7
08
15,6
24,6
69
16,3
50,8
88
Net
po
sit
ion
- e
nd
ing
16,0
57,9
45
$
486,2
01
$
16,5
44,1
46
$
16,8
68,5
95
$
The n
ote
s t
o t
he f
inancia
l sta
tem
ents
are
an inte
gra
l part
of
this
sta
tem
ent.
Comprehensive Annual Financial Report - State of Indiana - 20

FUND FINANCIAL
STATEMENTS
21 - State of Indiana - Comprehensive Annual Financial Report

State of Indiana
Balance Sheet
Governmental Funds
June 30, 2020(amounts expressed in thousands)
General Fund
Public Welfare-
Medicaid
Assistance Fund
US Department
of Health and
Human Services
Federal COVID-
19
Non-Major
Governmental
Funds Total
ASSETS
Cash, cash equivalents and investments-
unrestricted 1,933,840$ -$ -$ 2,155,989$ 4,907,920$ 8,997,749$
Cash, cash equivalents and investments-
restricted 529,419 - - - 226,263 755,682
Securities lending collateral 2,150,363 - - - - 2,150,363
Receivables: - Taxes (net of allowance for uncollectible 2,474,427 - - - 198,793 2,673,220
Accounts 12,958 184,749 578 - 116,213 314,498
Grants 71 597,398 192,714 22,309 198,550 1,011,042
Interest 2,523 - - 1 1,183 3,707
Interfund loans 486,334 - - - 12,073 498,407
Due from other funds 187,285 - - - 10,584 197,869
Due from component unit - - - - 23,450 23,450
Prepaid expenditures 73,015 - - - 45 73,060
Loans - - - - 307,022 307,022
Other 924 - - - 79 1,003
Total assets 7,851,159 782,147 193,292 2,178,299 6,002,175 17,007,072
Total assets and deferred outflow of
resources 7,851,159$ 782,147$ 193,292$ 2,178,299$ 6,002,175$ 17,007,072$
LIABILITIES
Accounts payable 489,909$ 486,255$ 87,640$ 20,053$ 570,493$ 1,654,350$
Salaries and benefits payable 60,462 - 10,248 - 31,586 102,296
Interfund loans - 27,723 445,210 - 25,474 498,407
Interfund services used 6,180 6 1,810 16 2,880 10,892
Intergovernmental payable 36,978 - - 23,652 113,567 174,197
Due to other funds - - - 197,869 - 197,869
Tax refunds payable 122,542 - - - 6,299 128,841
Unearned revenue - - - 1,914,399 - 1,914,399
Accrued liability for compensated absences-
current 3,441 - 612 - 1,780 5,833
Other payables 924 - - - 354 1,278
Securities lending collateral 2,150,363 - - - - 2,150,363
Total liabilities 2,870,799 513,984 545,520 2,155,989 752,433 6,838,725
DEFERRED INFLOW OF RESOURCES
Unavailable revenue 341,756 - 56,538 - 84,803 483,097
Total deferred inflow of resources 341,756 - 56,538 - 84,803 483,097
FUND BALANCE
Nonspendable 73,015 - - - 502,880 575,895
Restricted 543,348 - - - 3,514 546,862
Committed 34,256 - - - 968,947 1,003,203
Assigned 1,845,538 268,163 - 22,310 3,743,263 5,879,274
Unassigned 2,142,447 - (408,766) - (53,665) 1,680,016
Total fund balance 4,638,604 268,163 (408,766) 22,310 5,164,939 9,685,250
Total liabilities, deferred inflow of
resources, and fund balance 7,851,159$ 782,147$ 193,292$ 2,178,299$ 6,002,175$ 17,007,072$
The notes to the financial statements are an integral part of this statement.
Comprehensive Annual Financial Report - State of Indiana - 22

State of Indiana
Reconciliation of the Governmental Funds Balance Sheet
to the Statement of Net Position
June 30, 2020(amounts expressed in thousands)
Total fund balances-governmental funds 9,685,250$
Amounts reported for governmental activities in the statement of net position are different
because:
Capital assets used in governmental activities are not financial resources and
therefore are not reported in the funds. These assets consist of:
Land 2,528,150$
Infrastructure assets 12,869,025
Construction in progress 1,129,707
Property, plant, and equipment 2,976,209
Computer software 319,354
Accumulated depreciation (2,209,069)
Total capital assets, net of depreciation 17,613,376
Some of the state's receivables will be collected after year-end but are not available soon
enough to pay for the current period's expenditures and therefore are deferred in the funds.
Taxes receivable 360,356
Accounts receivable 451,325
Total receivables 811,681
Some liabilities reported in the statement of net position do not require the use of current
financial resources and therefore are not reported as expenditures in the funds.
Accounts payable (300,430)
Litigation liabilities (46,847)
Pollution remediation (19,597)
Total liabilities (366,874)
Internal service funds are used by management to charge the costs of certain
activities to individual funds. The assets and liabilities of the internal service funds are
included in governmental activities in the statement of net position. 248,611
Some liabilities are not due and payable in the current period and therefore are not reported
in the funds. Those liabilities consist of:
Accrued liability for compensated absences (180,939)
Other postemployment benefits and related deferrals (302,101)
Loan from the Indiana Board for Depositories (15,000)
Capital lease payable (832,348)
Net pension liability and related deferrals (10,603,711)
Total long-term liabilities (11,934,099)
Net position of governmental activities 16,057,945$
The notes to the financial statements are an integral part of this statement.
23 - State of Indiana - Comprehensive Annual Financial Report

State of Indiana
Statement of Revenues, Expenditures,
and Changes in Fund Balances
Governmental Funds
For the Year Ended June 30, 2020(amounts expressed in thousands)
General Fund
Public Welfare-
Medicaid
Assistance Fund
US Department
of Health and
Human Services
Fund
Federal COVID-
19
Non-Major
Governmental
Funds Total
Revenues:
Taxes:
Income 6,686,004$ -$ -$ -$ -$ 6,686,004$
Sales 8,239,440 - - - 73,876 8,313,316
Fuels 1,699 - - - 1,447,661 1,449,360
Gaming 41,386 - - - 408,326 449,712
Alcohol and tobacco 256,887 - - - 168,447 425,334
Insurance 243,330 - - - 5,084 248,414
Financial Institutions - - - - 142,687 142,687
Other 401,111 - - - 16,896 418,007
Total taxes 15,869,857 - - - 2,262,977 18,132,834
Current service charges 320,494 911,445 252 - 2,089,627 3,321,818
Investment income 172,443 - - 3 58,672 231,118
Sales/rents 379 - - - 17,635 18,014
Grants 2,330 10,630,756 1,494,708 639,175 3,938,107 16,705,076
Other 40,893 - 62 - 103,211 144,166
Total revenues 16,406,396 11,542,201 1,495,022 639,178 8,470,229 38,553,026
Expenditures:
Current:
General government 1,006,412 - 29,282 265,716 371,170 1,672,580
Public safety 1,054,644 - 7,329 193,924 551,318 1,807,215
Health 21,351 - 163,271 32,477 230,089 447,188
Welfare 1,210,520 14,243,062 1,548,321 6,146 1,359,298 18,367,347
Conservation, culture and development 121,215 - 6,264 6,688 417,187 551,354
Education 10,598,534 - 9,809 111,917 992,481 11,712,741
Transportation 231,565 - - - 3,257,453 3,489,018
Debt service:
Capital lease principal 3,669 - 27 - 65,920 69,616
Capital lease interest 351 - - - 41,870 42,221
Capital outlay - - - - 22,872 22,872
Total expenditures 14,248,261 14,243,062 1,764,303 616,868 7,309,658 38,182,152
Excess (deficiency) of revenues over (under)
expenditures 2,158,135 (2,700,861) (269,281) 22,310 1,160,571 370,874
Other financing sources (uses):
Transfers in 1,272,873 2,865,764 302,391 - 2,387,366 6,828,394
Transfers (out) (3,141,946) (447,200) (25,044) - (3,209,796) (6,823,986)
Issuance of capital lease 161 - - - - 161
Total other financing sources (uses) (1,868,912) 2,418,564 277,347 - (822,430) 4,569
Net change in fund balances 289,223 (282,297) 8,066 22,310 338,141 375,443
Fund Balance July 1, as restated 4,349,381 550,460 (416,832) - 4,826,798 9,309,807
Fund Balance June 30 4,638,604$ 268,163$ (408,766)$ 22,310$ 5,164,939$ 9,685,250$
The notes to the financial statements are an integral part of this statement.
Comprehensive Annual Financial Report - State of Indiana - 24

State of Indiana
Reconciliation of the Statement of Revenues, Expenditures,
and Changes in Fund Balances of Governmental Funds
to the Statement of Activities
For the Year Ended June 30, 2020(amounts expressed in thousands)
Net change in fund balances-total governmental funds 375,443$
Amounts reported for governmental activities in the statement of activities are
different because:
Governmental funds report net capital outlays for infrastructure as expenditures.
However in the statement of activities these outlays are capitalized and
under the modified approach not depreciated. This is the amount of the net
capital outlays for infrastructure under the modified approach in the current 262,386
period.
Governmental funds report net capital outlays as expenditures. However in the
statement of activities the cost of those assets is allocated over their estimated
useful lives and reported as depreciation expense. This is the amount by which
net capital outlays ($305,275) exceeds depreciation ($133,267) in the
current period. 172,008
Revenues in the statement of activities that do not provide current financial
resources are not reported as revenues in the funds.
Tax revenue 118,468
Non-tax revenue 231,745
Expenses reported in the statement of activities that do not require the use
of current financial resources are not reported as expenditures in the funds.
Operating expenses 41,292
The change in net pension liability does not provide or require the use of
current financial resources:
Increase in net pension liabilities 165,067
The change in other postemployment benefits do not provide or
require the use of current financial resources. 47,209
Internal service funds are used by management to charge the costs of certain
activities, such as insurance, data processing, telecommunications, fleet
management, and printing, to individual funds. The net revenue (expense) of
internal service funds is reported with governmental activities. 35,366
Change in net position of governmental activities. 1,448,984$
The notes to the financial statements are an integral part of this statement.
25 - State of Indiana - Comprehensive Annual Financial Report

Comprehensive Annual Financial Report - State of Indiana - 26
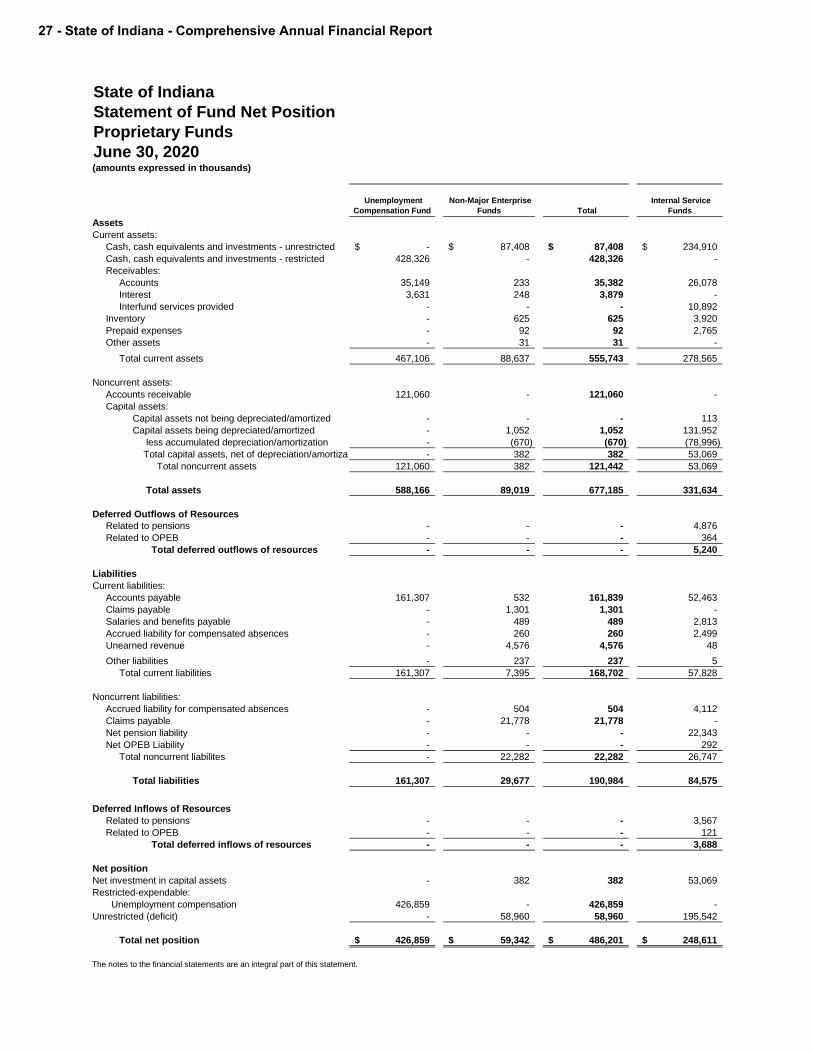
State of Indiana
Statement of Fund Net Position
Proprietary Funds
June 30, 2020(amounts expressed in thousands)
Unemployment
Compensation Fund
Non-Major Enterprise
Funds Total
Internal Service
Funds
Assets
Current assets:
Cash, cash equivalents and investments - unrestricted -$ 87,408$ 87,408$ 234,910$
Cash, cash equivalents and investments - restricted 428,326 - 428,326 -
Receivables:
Accounts 35,149 233 35,382 26,078
Interest 3,631 248 3,879 -
Interfund services provided - - - 10,892
Inventory - 625 625 3,920
Prepaid expenses - 92 92 2,765
Other assets - 31 31 -
Total current assets 467,106 88,637 555,743 278,565
Noncurrent assets:
Accounts receivable 121,060 - 121,060 -
Capital assets:
Capital assets not being depreciated/amortized - - - 113
Capital assets being depreciated/amortized - 1,052 1,052 131,952
less accumulated depreciation/amortization - (670) (670) (78,996)
Total capital assets, net of depreciation/amortization - 382 382 53,069
Total noncurrent assets 121,060 382 121,442 53,069
Total assets 588,166 89,019 677,185 331,634
Deferred Outflows of Resources
Related to pensions - - - 4,876
Related to OPEB - - - 364
Total deferred outflows of resources - - - 5,240
Liabilities
Current liabilities:
Accounts payable 161,307 532 161,839 52,463
Claims payable - 1,301 1,301 -
Salaries and benefits payable - 489 489 2,813
Accrued liability for compensated absences - 260 260 2,499
Unearned revenue - 4,576 4,576 48
Other liabilities - 237 237 5
Total current liabilities 161,307 7,395 168,702 57,828
Noncurrent liabilities:
Accrued liability for compensated absences - 504 504 4,112
Claims payable - 21,778 21,778 -
Net pension liability - - - 22,343
Net OPEB Liability - - - 292
Total noncurrent liabilites - 22,282 22,282 26,747
Total liabilities 161,307 29,677 190,984 84,575
Deferred Inflows of Resources
Related to pensions - - - 3,567
Related to OPEB - - - 121
Total deferred inflows of resources - - - 3,688
Net position
Net investment in capital assets - 382 382 53,069
Restricted-expendable:
Unemployment compensation 426,859 - 426,859 -
Unrestricted (deficit) - 58,960 58,960 195,542
Total net position 426,859$ 59,342$ 486,201$ 248,611$
The notes to the financial statements are an integral part of this statement.
27 - State of Indiana - Comprehensive Annual Financial Report

State of Indiana
Statement of Revenues, Expenses and
Changes in Fund Net Position
Proprietary Funds
For the Fiscal Year Ended June 30, 2020(amounts expressed in thousands)
Unemployment
Compensation Fund
Non-Major Enterprise
Funds Total
Internal Service
Funds
Operating revenues:
Sales/rents/premiums -$ 23,857$ 23,857$ 621,562$
Employer contributions 444,506 - 444,506 -
Charges for services - - - 11,545
Other - 228 228 2,487
Total operating revenues 444,506 24,085 468,591 635,594
Cost of sales - 5,416 5,416 22,186
Gross margin 444,506 18,669 463,175 613,408
Operating expenses:
General and administrative expense 17,007 17,525 34,532 178,112
Claims expense - 463 463 -
Health / disability benefit payments - - - 381,662
Unemployment compensation benefits 3,990,579 - 3,990,579 -
Depreciation and amortization - 83 83 25,380
Other - 32 32 -
Total operating expenses 4,007,586 18,103 4,025,689 585,154
Operating income (loss) (3,563,080) 566 (3,562,514) 28,254
Nonoperating revenues (expenses):
Interest and other investment income 19,945 5,938 25,883 2
Gain (Loss) on disposition of assets - - - 799
Federal financial assistance 3,007,518 - 3,007,518 -
Contributions to other postemployment benefits - - - (10,890)
Total nonoperating revenues (expenses) 3,027,463 5,938 3,033,401 (10,089)
Income before contributions and transfers (535,617) 6,504 (529,113) 18,165
Capital contributions - - - 21,215
Transfers in - - - 324
Transfers (out) - (394) (394) (4,338)
Change in net position (535,617) 6,110 (529,507) 35,366
Net position, July 1, as restated 962,476 53,232 1,015,708 213,245
Net position, June 30 426,859$ 59,342$ 486,201$ 248,611$
The notes to the financial statements are an integral part of this statement.
Comprehensive Annual Financial Report - State of Indiana - 28

State of Indiana
Statement of Cash Flows
Proprietary Funds
For the Fiscal Year Ended June 30, 2020(amounts expressed in thousands)
Unemployment
Compensation
Fund
Non-Major
Enterprise Funds Total
Internal Service
Funds
Cash flows from operating activities:
Cash received from customers 452,203$ 24,208$ 476,411$ 507,553$
Cash received from interfund services provided - - - 120,979
Cash paid for general and administrative (17,007) (17,627) (34,634) (177,538)
Cash paid for salary/health/disability benefit payments (3,888,102) - (3,888,102) (384,999)
Cash paid to suppliers - (5,321) (5,321) (20,464)
Cash paid for claims expense - (762) (762) -
Other operating income - - - 2,487
Net cash provided (used) by operating activities (3,452,906) 498 (3,452,408) 48,018
Cash flows from noncapital financing activities:
Transfers in - - - 324
Transfers out - (394) (394) (4,338)
Federal financial assistance 3,007,518 - 3,007,518 -
Contributions to other postemployment benefits - - - (10,889)
Net cash provided (used) by noncapital financing activities 3,007,518 (394) 3,007,124 (14,903)
Cash flows from capital and related financing activities:
Acquisition/construction of capital assets - (59) (59) (22,099)
Proceeds from sale of assets - - - 882
Capital contributions - - - 21,215
Net cash provided (used) by capital and related financing
activities - (59) (59) (2)
Cash flows from investing activities:
Proceeds from sales of investments - 4,501 4,501 -
Purchase of investments - (4,106) (4,106) -
Interest income (expense) on investments 20,886 1,177 22,063 2
Net cash provided (used) by investing activities 20,886 1,572 22,458 2
Net increase (decrease) in cash and cash equivalents (424,502) 1,617 (422,885) 33,115
Cash and cash equivalents, July 1 852,828 15,268 868,096 201,795
Cash and cash equivalents, June 30 428,326$ 16,885$ 445,211$ 234,910$
Reconciliation of cash , cash equivalents and investments:
Cash and cash equivalents unrestricted at end of year -$ 16,885$ 16,885$ 234,910$
Cash and cash equivalents restricted at end of year 428,326 - 428,326 -
Investments unrestricted - 70,523 70,523 -
Cash, cash equivalents and investments per balance sheet 428,326$ 87,408$ 515,734$ 234,910$
29 - State of Indiana - Comprehensive Annual Financial Report

State of Indiana
Statement of Cash Flows
Proprietary Funds
For the Fiscal Year Ended June 30, 2020(amounts expressed in thousands)
Unemployment
Compensation
Fund
Non-Major
Enterprise Funds Total
Internal Service
Funds
Reconciliation of operating income to net cash provided
(used) by operating activities:
Operating income (loss) (3,563,080)$ 566$ (3,562,514)$ 28,254$
Adjustments to reconcile operating income (loss) to net cash
provided (used) by operating activities:
Depreciation/amortization expense - 83 83 25,380
(Increase) decrease in receivables 7,698 231 7,929 (3,518)
(Increase) decrease in interfund services provided - - - (883)
(Increase) decrease in inventory - 95 95 226
(Increase) decrease in prepaid expenses - (31) (31) 1,235
(Increase) decrease in deferred outflows - - - (204)
Increase (decrease) in claims payable - (299) (299) -
Increase (decrease) in accounts payable 102,476 13 102,489 (4,576)
Increase (decrease) in unearned revenue - (113) (113) (175)
Increase (decrease) in salaries payable - (23) (23) 684
Increase (decrease) in compensated absences - (15) (15) 821
Increase (decrease) in net pension liabilities - - - 623
Increase (decrease) in net OPEB liabilties - - - 241
Increase (decrease) in deferred inflows - - - (92)
Increase (decrease) in other payables - (9) (9) 2
Net cash provided (used) by operating activities (3,452,906)$ 498$ (3,452,408)$ 48,018$
The notes to the financial statements are an integral part of this statement.
Comprehensive Annual Financial Report - State of Indiana - 30
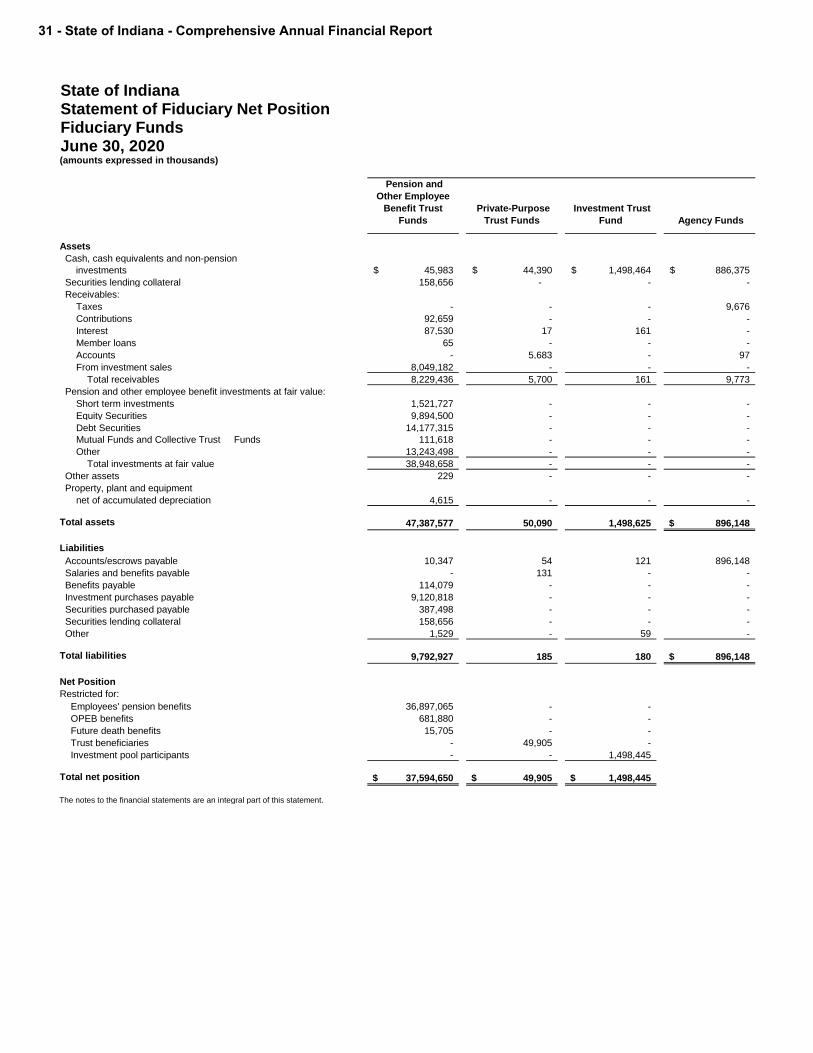
State of IndianaStatement of Fiduciary Net PositionFiduciary FundsJune 30, 2020(amounts expressed in thousands)
Pension and
Other Employee
Benefit Trust
Funds
Private-Purpose
Trust Funds
Investment Trust
Fund Agency Funds
Assets
Cash, cash equivalents and non-pension
investments 45,983$ 44,390$ 1,498,464$ 886,375$
Securities lending collateral 158,656 - - -
Receivables:
Taxes - - - 9,676
Contributions 92,659 - - -
Interest 87,530 17 161 -
Member loans 65 - - -
Accounts - 5,683 - 97
From investment sales 8,049,182 - - -
Total receivables 8,229,436 5,700 161 9,773
Pension and other employee benefit investments at fair value:
Short term investments 1,521,727 - - -
Equity Securities 9,894,500 - - -
Debt Securities 14,177,315 - - -
Mutual Funds and Collective Trust Funds 111,618 - - -
Other 13,243,498 - - -
Total investments at fair value 38,948,658 - - -
Other assets 229 - - -
Property, plant and equipment
net of accumulated depreciation 4,615 - - -
Total assets 47,387,577 50,090 1,498,625 896,148$
Liabilities
Accounts/escrows payable 10,347 54 121 896,148
Salaries and benefits payable - 131 - -
Benefits payable 114,079 - - -
Investment purchases payable 9,120,818 - - -
Securities purchased payable 387,498 - - -
Securities lending collateral 158,656 - - -
Other 1,529 - 59 -
Total liabilities 9,792,927 185 180 896,148$
Net Position
Restricted for:
Employees' pension benefits 36,897,065 - -
OPEB benefits 681,880 - -
Future death benefits 15,705 - -
Trust beneficiaries - 49,905 -
Investment pool participants - - 1,498,445
Total net position 37,594,650$ 49,905$ 1,498,445$
The notes to the financial statements are an integral part of this statement.
31 - State of Indiana - Comprehensive Annual Financial Report

State of Indiana
Statement of Changes in Fiduciary Net Position
Fiduciary Funds
For the Year Ended June 30, 2020(amounts expressed in thousands)
Pension and Other
Employee Benefit
Trust Funds
Private-Purpose
Trust Funds
Investment Trust
Fund
Additions:
Member contributions 379,413$ 305$ 2,131,283$
Employer contributions 1,079,090 - -
Contributions from the State of Indiana 1,172,724 - -
Net investment income (loss) 1,242,198 71 18,639
Less investment expense (225,995) - -
Current service charges - 9,647 -
Federal reimbursements 633 - -
Donations/escheats - 118,079 -
Transfers from other retirement funds 435,947 - -
Reinvestment of distributions - - 17,624
Other 646 - -
Total additions 4,084,656 128,102 2,167,546
Deductions:
Pension and disability benefits 2,532,799 - -
Retiree health benefits 25,848 - -
Retiree health forfeitures 18,969 - -
Death benefits 1,919 - -
Payments to participants/beneficiaries - 126,181 16,772
Refunds of contributions and interest 423,906 - 1,821,983
Administrative 44,048 - 1,180
Pension relief distributions 209,167 - -
Transfers to other retirement funds 435,947 - -
Other 891 - 229
Total deductions 3,693,494 126,181 1,840,164
Net increase (decrease) in net position 391,162 1,921 327,382
Net position restricted, July 1, as restated 37,203,488 47,984 1,171,063
Net position restricted, June 30 37,594,650$ 49,905$ 1,498,445$
The notes to the financial statements are an integral part of this statement.
Comprehensive Annual Financial Report - State of Indiana - 32

State of Indiana
Combining Statement of Net Position
Discretely Presented Component Units
June 30, 2020
(amounts expressed in thousands)
Governmental ProprietaryColleges and
UniversitiesTotal
Assets
Current assets:
Cash, cash equivalents and investments - unrestricted 11,097$ 576,123$ 1,198,799$ 1,786,019$
Cash, cash equivalents and investments - restricted 292,734 1,075,508 1,005,572 2,373,814
Securities lending collateral - - 50,203 50,203
Receivables (net) 1,593 808,911 587,422 1,397,926
Due from primary government - 5,000 - 5,000
Inventory - 238 4,148 4,386
Prepaid expenses - 5,620 9,459 15,079
Loans - 259,640 - 259,640
Investment in direct financing lease - 82,025 254 82,279
Other assets - 732 155,868 156,600
Total current assets 305,424 2,813,797 3,011,725 6,130,946
Noncurrent assets:
Cash, cash equivalents and investments - unrestricted - 370,459 3,858,558 4,229,017
Cash, cash equivalents and investments - restricted - 695,155 7,377,061 8,072,216
Receivables (net) - 523,981 638,997 1,162,978
Due from primary government - 10,000 - 10,000
Loans 86,862 3,027,303 - 3,114,165
Investment in direct financing lease - 1,802,536 4,458 1,806,994
OPEB assets - 97,685 65,918 163,603
Other assets - 10,041 10,845 20,886
Capital assets:
Capital assets not being depreciated/amortized - 1,696,904 1,106,978 2,803,882
Capital assets being depreciated/amortized 507 1,129,657 14,917,771 16,047,935
less accumulated depreciation/amortization (290) (516,965) (7,047,782) (7,565,037)
Total capital assets, net of depreciation/amortization 217 2,309,596 8,976,967 11,286,780
Total noncurrent assets 87,079 8,846,756 20,932,804 29,866,639
Total assets 392,503 11,660,553 23,944,529 35,997,585
Deferred Outflows of Resources
Accumulated decrease in fair value of hedging derivatives - 148,756 1,075 149,831
Debt refunding loss - 31,157 32,442 63,599
Related to pensions 916 3,111 42,033 46,060
Swap termination - 55,301 - 55,301
Related to OPEB - - 115,893 115,893
Asset retirement obligations - - 2,434 2,434
Total deferred outflows of resources 916 238,325 193,877 433,118
Liabilities
Current liabilities:
Accounts payable 42,310 41,044 564,814 648,168
Interest payable - 76,410 37,750 114,160
Due to primary government - 23,450 - 23,450
Unearned revenue 128,824 164,327 327,340 620,491
Advances from federal government - 590 - 590
Securities lending collateral - - 50,203 50,203
Accrued liability for compensated absences 587 231 90,029 90,847
Other liabilities - 37,960 29,319 67,279
Current portion of long-term liabilities - 762,081 433,590 1,195,671
Total current liabilities 171,721 1,106,093 1,533,045 2,810,859
33 - State of Indiana - Comprehensive Annual Financial Report
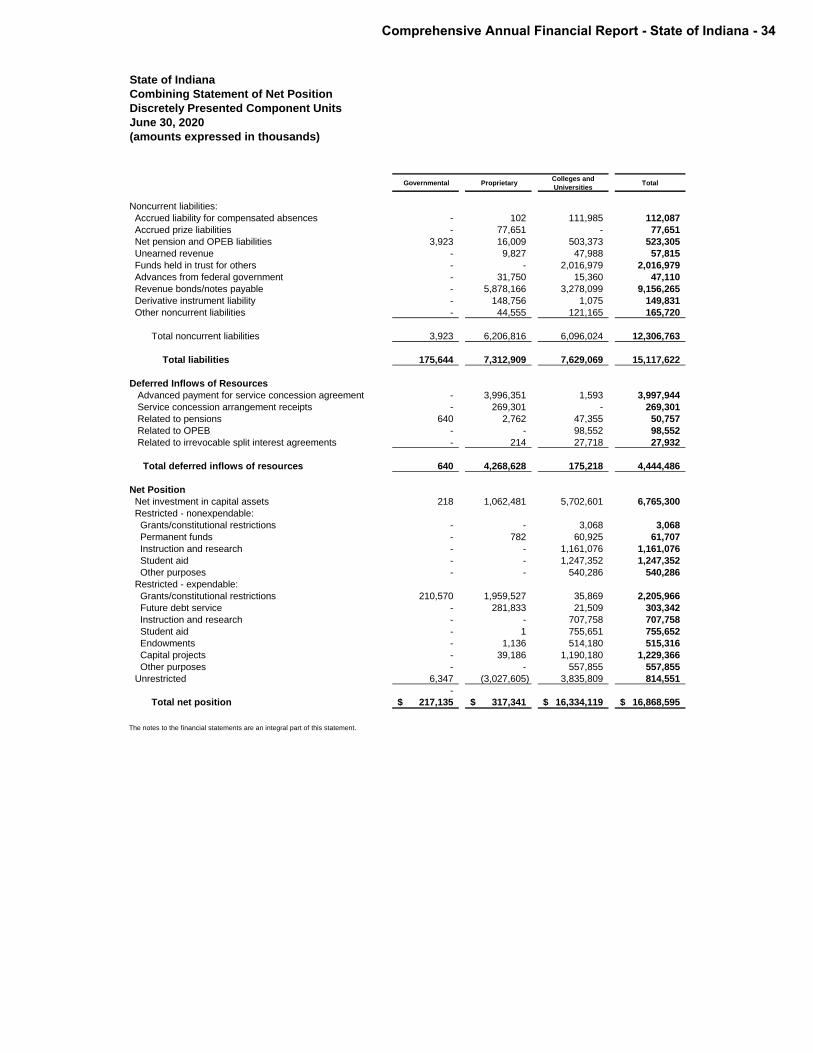
State of Indiana
Combining Statement of Net Position
Discretely Presented Component Units
June 30, 2020
(amounts expressed in thousands)
Governmental ProprietaryColleges and
UniversitiesTotal
Noncurrent liabilities:
Accrued liability for compensated absences - 102 111,985 112,087
Accrued prize liabilities - 77,651 - 77,651
Net pension and OPEB liabilities 3,923 16,009 503,373 523,305
Unearned revenue - 9,827 47,988 57,815
Funds held in trust for others - - 2,016,979 2,016,979
Advances from federal government - 31,750 15,360 47,110
Revenue bonds/notes payable - 5,878,166 3,278,099 9,156,265
Derivative instrument liability - 148,756 1,075 149,831
Other noncurrent liabilities - 44,555 121,165 165,720
Total noncurrent liabilities 3,923 6,206,816 6,096,024 12,306,763
Total liabilities 175,644 7,312,909 7,629,069 15,117,622
Deferred Inflows of Resources
Advanced payment for service concession agreement - 3,996,351 1,593 3,997,944
Service concession arrangement receipts - 269,301 - 269,301
Related to pensions 640 2,762 47,355 50,757
Related to OPEB - - 98,552 98,552
Related to irrevocable split interest agreements - 214 27,718 27,932
Total deferred inflows of resources 640 4,268,628 175,218 4,444,486
Net Position
Net investment in capital assets 218 1,062,481 5,702,601 6,765,300
Restricted - nonexpendable:
Grants/constitutional restrictions - - 3,068 3,068
Permanent funds - 782 60,925 61,707
Instruction and research - - 1,161,076 1,161,076
Student aid - - 1,247,352 1,247,352
Other purposes - - 540,286 540,286
Restricted - expendable:
Grants/constitutional restrictions 210,570 1,959,527 35,869 2,205,966
Future debt service - 281,833 21,509 303,342
Instruction and research - - 707,758 707,758
Student aid - 1 755,651 755,652
Endowments - 1,136 514,180 515,316
Capital projects - 39,186 1,190,180 1,229,366
Other purposes - - 557,855 557,855
Unrestricted 6,347 (3,027,605) 3,835,809 814,551
-
Total net position 217,135$ 317,341$ 16,334,119$ 16,868,595$
The notes to the financial statements are an integral part of this statement.
Comprehensive Annual Financial Report - State of Indiana - 34

Sta
te o
f In
dia
na
Co
mb
inin
g S
tate
men
t o
f A
cti
vit
ies
Dis
cre
tely
Pre
sen
ted
Co
mp
on
en
t U
nit
s
Fo
r th
e F
iscal Y
ear
En
ded
Ju
ne 3
0, 20
20
(am
ou
nts
exp
ress
ed
in
th
ou
san
ds)
Pro
gra
m R
eve
nu
es
Ne
t (E
xp
en
se
) R
eve
nu
e a
nd
Ch
an
ge
s i
n N
et
Po
sit
ion
Ex
pe
ns
es
Ch
arg
es
fo
r
Se
rvic
es
Op
era
tin
g
Gra
nts
an
d
Co
ntr
ibu
tio
ns
Ca
pit
al
Gra
nts
an
d
Co
ntr
ibu
tio
ns
Go
ve
rnm
en
tal
Pro
pri
eta
ry
Co
lle
ge
s a
nd
Un
ive
rsit
ies
Ne
t (E
xp
en
se
)
Re
ve
nu
e
Go
ve
rnm
en
tal
15
4,6
45
$
-
$
8
6,2
82
$
-$
(68
,36
3)
$
-
$
-
$
(6
8,3
63
)$
Pro
prie
tary
2,4
90
,68
5
1,8
28
,85
6
42
4,3
88
9
3,1
54
-
(14
4,2
87
)
-
(1
44
,28
7)
Co
lleg
es a
nd
un
ive
rsitie
s7
,95
6,6
66
3
,72
6,5
28
2
,17
5,2
68
2
46
,97
3
-
-
(1,8
07
,89
7)
(1
,80
7,8
97
)
To
tal co
mp
on
en
t u
nits
10
,60
1,9
96
$
5,5
55
,38
4$
2,6
85
,93
8$
34
0,1
27
$
(6
8,3
63
)
(14
4,2
87
)
(1
,80
7,8
97
)
(2,0
20
,54
7)
Ge
ne
ral R
eve
nu
es:
Ga
min
g t
ax
1,2
28
-
-
1
,22
8
To
tal ta
xe
s1
,22
8
-
-
1,2
28
Re
ve
nu
e n
ot
restr
icte
d t
o s
pe
cific
pro
gra
ms:
Inve
stm
en
t e
arn
ing
s3
99
65
,52
0
2
58
,04
8
32
3,9
67
Pa
ym
en
ts f
rom
Sta
te o
f In
dia
na
95
,56
7
2
6,4
84
1,6
67
,23
7
1,7
89
,28
8
Oth
er
-
1,3
35
4
22
,43
6
42
3,7
71
To
tal g
en
era
l re
ve
nu
es
97
,19
4
9
3,3
39
2,3
47
,72
1
2,5
38
,25
4
Ch
an
ge
in
ne
t p
ositio
n2
8,8
31
(50
,94
8)
5
39
,82
4
51
7,7
07
Ne
t p
ositio
n -
be
gin
nin
g,
as r
esta
ted
18
8,3
04
3
68
,28
9
15
,79
4,2
95
16
,35
0,8
88
Ne
t p
os
itio
n -
en
din
g2
17
,13
5$
31
7,3
41
$
1
6,3
34
,11
9$
1
6,8
68
,59
5$
Th
e n
ote
s t
o t
he
fin
an
cia
l sta
tem
en
ts a
re a
n in
teg
ral p
art
of
this
sta
tem
en
t.
35 - State of Indiana - Comprehensive Annual Financial Report

Comprehensive Annual Financial Report - State of Indiana - 36

State of Indiana
Combining Statement of Net Position
Discretely Presented Component Units -
Proprietary Funds
June 30, 2020(amounts expressed in thousands)
Indiana Finance
Authority
State Lottery
Commission Non-Major
IFA & ISCBA/IMC
Elimination
Total Component
Units
Assets
Current assets:
Cash, cash equivalents and investments - unrestricted 73,045$ 41,816$ 461,262$ -$ 576,123$
Cash, cash equivalents and investments - restricted 819,706 - 255,802 - 1,075,508
Receivables (net) 367,789 132,809 325,243 (16,930) 808,911
Due from primary government - - 5,000 - 5,000
Inventory - - 238 - 238
Prepaid expenses 3,101 1,557 962 - 5,620
Loans 249,885 - 21,610 (11,855) 259,640
Investment in direct financing lease 70,170 - 15,555 (3,700) 82,025
Other assets - - 732 - 732
Total current assets 1,583,696 176,182 1,086,404 (32,485) 2,813,797
Noncurrent assets:
Cash, cash equivalents and investments - unrestricted - 95,633 274,826 - 370,459
Cash, cash equivalents and investments - restricted 65,805 9,452 619,898 - 695,155
Receivables (net) - - 523,981 - 523,981
Due from primary government - - 10,000 - 10,000
Loans 3,790,023 - 182,433 (945,153) 3,027,303
Investment in direct financing lease 882,534 - 994,822 (74,820) 1,802,536
Net pension and OPEB assets 97,685 - - - 97,685
Other assets - 9,827 214 - 10,041
Capital assets:
Capital assets not being depreciated/amortized 1,558,557 - 138,347 - 1,696,904
Capital assets being depreciated/amortized 744,717 2,607 382,333 - 1,129,657
less accumulated depreciation/amortization (296,614) (2,387) (217,964) - (516,965)
Total capital assets, net of depreciation/amortization 2,006,660 220 302,716 - 2,309,596
Total noncurrent assets 6,842,707 115,132 2,908,890 (1,019,973) 8,846,756
Total assets 8,426,403 291,314 3,995,294 (1,052,458) 11,660,553
Deferred Outflows of Resources
Accumulated decrease in fair value of hedging derivatives 144,364 - 148,756 (144,364) 148,756
Debt refunding loss 22,746 - 9,126 (715) 31,157
Related to pensions 386 415 2,310 - 3,111
Swap termination 55,301 - 55,301 (55,301) 55,301
Total deferred outflows of resources 222,797 415 215,493 (200,380) 238,325
Liabilities
Current liabilities:
Accounts payable 9,102 9,373 22,569 - 41,044
Interest payable 61,620 - 31,720 (16,930) 76,410
Due to primary government - 23,450 - - 23,450
Unearned revenue 126,617 2,175 35,535 - 164,327
Advances from federal government - - 590 - 590
Accrued liability for compensated absences - - 231 - 231
Other liabilities 378 922 36,660 - 37,960
Current portion of long-term liabilities 277,044 142,834 357,758 (15,555) 762,081
Total current liabilities 474,761 178,754 485,063 (32,485) 1,106,093
37 - State of Indiana - Comprehensive Annual Financial Report

State of Indiana
Combining Statement of Net Position
Discretely Presented Component Units -
Proprietary Funds
June 30, 2020(amounts expressed in thousands)
Indiana Finance
Authority
State Lottery
Commission Non-Major
IFA & ISCBA/IMC
Elimination
Total Component
Units
Noncurrent liabilities:
Accrued liability for compensated absences - - 102 - 102
Accrued prize liabilities - 77,651 - - 77,651
Net pension and OPEB liabilities 1,618 2,112 12,279 - 16,009
Unearned revenue - 9,827 - - 9,827
Advances from federal government 71 - 31,679 - 31,750
Revenue bonds/notes payable 4,769,588 - 2,184,567 (1,075,989) 5,878,166
Derivative instrument liability 144,364 - 148,756 (144,364) 148,756
Other noncurrent liabilities - - 44,555 - 44,555
Total noncurrent liabilities 4,915,641 89,590 2,421,938 (1,220,353) 6,206,816
Total liabilities 5,390,402 268,344 2,907,001 (1,252,838) 7,312,909
Deferred Inflows of Resources
Advanced payment for service concession agreement 3,985,373 - 10,978 - 3,996,351
Service concession arrangement receipts 269,301 - - - 269,301
Related to pensions 259 343 2,160 - 2,762
Related to irrevocable split interest agreements - - 214 - 214
Total deferred inflows of resources 4,254,933 343 13,352 - 4,268,628
NET POSITION
Net investment in capital assets 811,557 220 250,704 - 1,062,481
Restricted - nonexpendable:
Permanent funds - - 782 - 782
Restricted - expendable:
Grants/constitutional restrictions 1,829,636 - 129,891 - 1,959,527
Future debt service 179,509 - 102,324 - 281,833
Student aid - - 1 - 1
Endowments - - 1,136 - 1,136
Capital projects - - 39,186 - 39,186
Unrestricted (3,816,837) 22,822 766,410 - (3,027,605)
Total net position (996,135)$ 23,042$ 1,290,434$ -$ 317,341$
The notes to the financial statements are an integral part of this statement.
Comprehensive Annual Financial Report - State of Indiana - 38
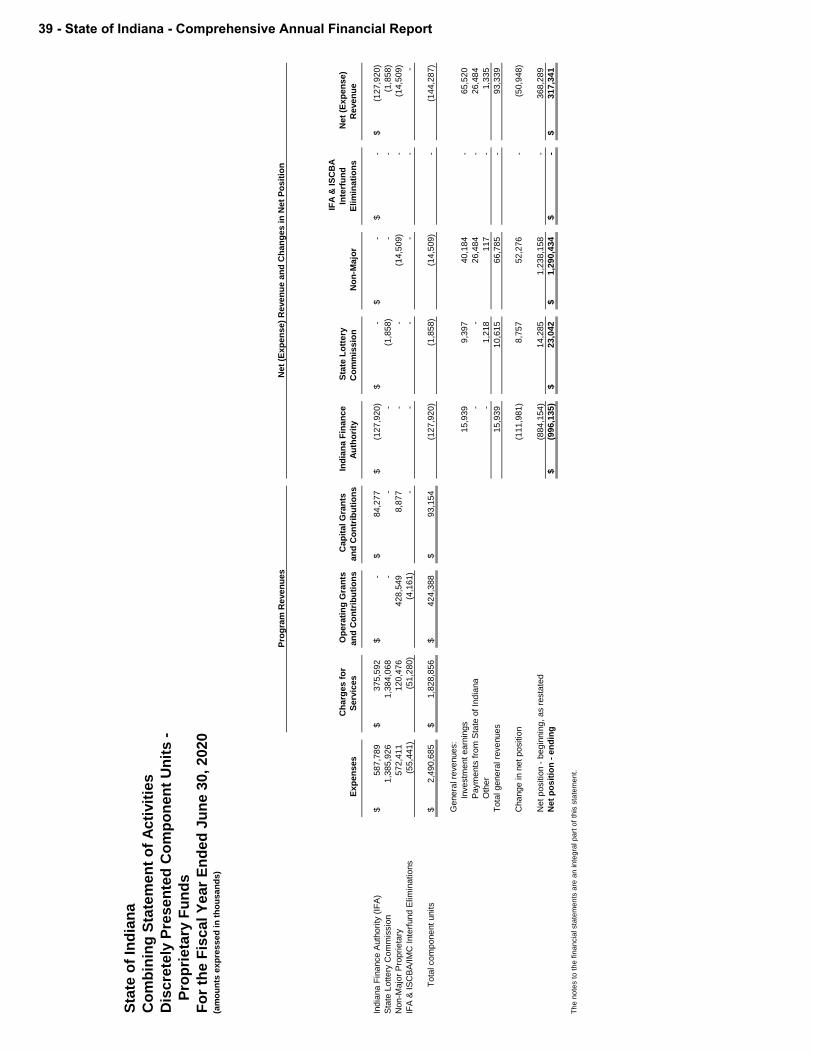
Sta
te o
f In
dia
na
Co
mb
inin
g S
tate
me
nt
of
Ac
tivit
ies
Dis
cre
tely
Pre
se
nte
d C
om
po
nen
t U
nit
s -
P
rop
rie
tary
Fu
nd
s
Fo
r th
e F
isc
al
Ye
ar
En
de
d J
un
e 3
0,
202
0(a
mo
un
ts e
xp
ressed
in
th
ou
san
ds)
Pro
gra
m R
even
ues
Ne
t (E
xp
en
se
) R
eve
nu
e a
nd
Ch
an
ge
s in
Ne
t P
os
itio
n
Exp
en
ses
Ch
arg
es f
or
Serv
ices
Op
era
tin
g G
ran
ts
an
d C
on
trib
uti
on
s
Cap
ital G
ran
ts
an
d C
on
trib
uti
on
s
In
dia
na F
inan
ce
Au
tho
rity
Sta
te L
ott
ery
Co
mm
issio
n
No
n-M
ajo
r
IF
A &
IS
CB
A
Inte
rfu
nd
Elim
inati
on
s
Net
(Exp
en
se)
Reven
ue
India
na F
inance A
uth
ori
ty (
IFA
)587,7
89
$
375,5
92
$
-$
84,2
77
$
(1
27
,92
0)
$
-
$
-$
-$
(12
7,9
20
)$
Sta
te L
ottery
Com
mis
sio
n1,3
85,9
26
1,3
84,0
68
-
-
-
(1,8
58)
-
-
(1,8
58)
Non-M
ajo
r P
ropri
eta
ry572,4
11
120,4
76
428,5
49
8,8
77
-
-
(14
,509
)
-
(14
,509
)
IFA
& IS
CB
A/IM
C Inte
rfund E
lim
inations
(55
,441
)
(51
,280
)
(4,1
61)
-
-
-
-
-
-
Tota
l com
ponent units
2,4
90,6
85
$
1,8
28,8
56
$
424,3
88
$
93,1
54
$
(1
27
,92
0)
(1,8
58)
(14
,509
)
-
(14
4,2
87
)
Genera
l re
venues:
Investm
ent earn
ings
15,9
39
9,3
97
40,1
84
-
65,5
20
Paym
ents
fro
m S
tate
of In
dia
na
-
-
26,4
84
-
26,4
84
Oth
er
-
1,2
18
117
-
1,3
35
Tota
l genera
l re
venues
15,9
39
10,6
15
66,7
85
-
93,3
39
Change in n
et positio
n(1
11
,98
1)
8,7
57
52,2
76
-
(50
,948
)
Ne
t p
ositio
n -
be
gin
nin
g,
as r
esta
ted
(88
4,1
54
)
14,2
85
1,2
38,1
58
-
368,2
89
Ne
t p
os
itio
n -
en
din
g(9
96
,13
5)
$
23,0
42
$
1,2
90,4
34
$
-
$
317,3
41
$
Th
e n
ote
s t
o t
he
fin
an
cia
l sta
tem
en
ts a
re a
n in
teg
ral p
art
of
this
sta
tem
en
t.
39 - State of Indiana - Comprehensive Annual Financial Report

Comprehensive Annual Financial Report - State of Indiana - 40

State of Indiana
Combining Statement of Net Position
Discretely Presented Component Units -
Colleges and Universities
June 30, 2020(amounts expressed in thousands)
Indiana University Purdue University
Non-Major Colleges
and Universities Totals
Assets
Current assets:
Cash, cash equivalents and investments - unrestricted 73,021$ 511,014$ 614,764$ 1,198,799$
Cash, cash equivalents and investments - restricted 563,457 317,189 124,926 1,005,572
Securities lending collateral 50,203 - - 50,203
Receivables (net) 266,409 194,213 126,800 587,422
Inventory - - 4,148 4,148
Prepaid expenses - 2 9,457 9,459
Investment in direct financing lease - - 254 254
Other assets 54,066 37,790 64,012 155,868
Total current assets 1,007,156 1,060,208 944,361 3,011,725
Noncurrent assets:
Cash, cash equivalents and investments - unrestricted 1,624,739 1,412,051 821,768 3,858,558
Cash, cash equivalents and investments - restricted 2,435,868 4,320,779 620,414 7,377,061
Receivables (net) 312,147 300,754 26,096 638,997
Investment in direct financing lease - - 4,458 4,458
OPEB assets - - 65,918 65,918
Other assets - 2 10,843 10,845
Capital assets:
Capital assets not being depreciated/amortized 517,991 253,435 335,552 1,106,978
Capital assets being depreciated/amortized 5,790,460 5,180,502 3,946,809 14,917,771
less accumulated depreciation/amortization (2,718,454) (2,653,471) (1,675,857) (7,047,782)
Total capital assets, net of depreciation/amortization 3,589,997 2,780,466 2,606,504 8,976,967
Total noncurrent assets 7,962,751 8,814,052 4,156,001 20,932,804
Total assets 8,969,907 9,874,260 5,100,362 23,944,529
Deferred Outflows of Resources
Accumulated decrease in fair value of hedging derivatives - - 1,075 1,075
Debt refunding loss 11,553 20,456 433 32,442
Related to pensions 12,650 11,045 18,338 42,033
Related to OPEB 56,022 2,897 56,974 115,893
Related to asset retirement obligations - 2,434 - 2,434
Total deferred outflows of resources 80,225 36,832 76,820 193,877
Liabilities
Current liabilities:
Accounts payable 234,190 200,534 130,090 564,814
Interest payable 6,928 18,462 12,360 37,750
Unearned revenue 120,765 170,217 36,358 327,340
Securities lending collateral 50,203 - - 50,203
Accrued liability for compensated absences 42,605 29,067 18,357 90,029
Other liabilities - 1,451 27,868 29,319
Current portion of long-term liabilities 127,648 169,572 136,370 433,590
Total current liabilities 582,339 589,303 361,403 1,533,045
Noncurrent liabilities:
Accrued liability for compensated absences 48,382 45,580 18,023 111,985
Net pension and OPEB liabilities 266,817 89,136 147,420 503,373
Unearned revenue 27,696 20,292 - 47,988
Funds held in trust for others 90,627 1,861,810 64,542 2,016,979
Advances from federal government - 8,518 6,842 15,360
Revenue bonds/notes payable 1,146,013 1,089,067 1,043,019 3,278,099
Derivative instrument liability - - 1,075 1,075
Other noncurrent liabilities 64,641 34,399 22,125 121,165
Total noncurrent liabilities 1,644,176 3,148,802 1,303,046 6,096,024
Total liabilities 2,226,515 3,738,105 1,664,449 7,629,069
41 - State of Indiana - Comprehensive Annual Financial Report

State of Indiana
Combining Statement of Net Position
Discretely Presented Component Units -
Colleges and Universities
June 30, 2020(amounts expressed in thousands)
Indiana University Purdue University
Non-Major Colleges
and Universities Totals
Deferred Inflows of Resources
Advanced payment for service concession agreement - - 1,593 1,593
Related to pensions 12,316 10,616 24,423 47,355
Related to OPEB 32,159 8,205 58,188 98,552
Related to Irrevocable Split-Interest Agreements - 27,718 - 27,718
Total deferred inflows of resources 44,475 46,539 84,204 175,218
Net Position
Net investment in capital assets 2,487,799 1,710,945 1,503,857 5,702,601
Restricted - nonexpendable:
Grants/constitutional restrictions - - 3,068 3,068
Permanent funds 60,925 - - 60,925
Instruction and research 641,204 497,619 22,253 1,161,076
Student aid 613,312 450,003 184,037 1,247,352
Other purposes 359,242 44,285 136,759 540,286
Restricted - expendable:
Grants/constitutional restrictions - - 35,869 35,869
Future debt service 17,174 - 4,335 21,509
Instruction and research 344,235 332,035 31,488 707,758
Student aid 192,856 451,488 111,307 755,651
Endowments - 464,020 50,160 514,180
Capital projects 392,013 181,916 616,251 1,190,180
Other purposes 452,870 81,392 23,593 557,855
Unrestricted 1,217,512 1,912,745 705,552 3,835,809
Total net position 6,779,142$ 6,126,448$ 3,428,529$ 16,334,119$
The notes to the financial statements are an integral part of this statement.
Comprehensive Annual Financial Report - State of Indiana - 42

Sta
te o
f In
dia
na
Co
mb
inin
g S
tate
me
nt
of
Ac
tivit
ies
Dis
cre
tely
Pre
se
nte
d C
om
po
ne
nt
Un
its
-
C
oll
eg
es
an
d U
niv
ers
itie
s
Fo
r th
e Y
ea
r E
nd
ed
Ju
ne
30
, 2
020
(am
ou
nts
ex
pre
ss
ed
in
th
ou
sa
nd
s)
Pro
gra
m R
eve
nu
es
Ex
pe
ns
es
C
ha
rge
s f
or
Se
rvic
es
Op
era
tin
g
Gra
nts
an
d
Co
ntr
ibu
tio
ns
Ca
pit
al
Gra
nts
an
d
Co
ntr
ibu
tio
ns
In
dia
na
Un
ive
rsit
y
Pu
rdu
e
Un
ive
rsit
y
No
n-M
ajo
r
Co
lle
ge
s a
nd
Un
ive
rsit
ies
Ne
t (E
xp
en
se
)
Re
ve
nu
e
Ind
ian
a U
niv
ers
ity
3,5
92
,71
8$
1
,59
1,5
35
$
93
7,8
77
$
17
4,6
35
$
(88
8,6
71
)$
-$
-
$
(88
8,6
71
)$
Pu
rdu
e U
niv
ers
ity
2,7
10
,81
9
1
,56
1,6
77
76
5,6
21
41
,14
6
-
(3
42
,37
5)
-
(34
2,3
75
)
No
n-M
ajo
r C
olle
ge
s a
nd
Un
ive
rsitie
s1
,65
3,1
29
57
3,3
16
47
1,7
70
31
,19
2
-
-
(57
6,8
51
)
(57
6,8
51
)
To
tal co
mp
on
en
t u
nits
7,9
56
,66
6$
3
,72
6,5
28
$
2,1
75
,26
8$
2
46
,97
3$
(8
88
,67
1)
(3
42
,37
5)
(5
76
,85
1)
(1
,80
7,8
97
)
Ge
ne
ral re
ve
nu
es:
Inve
stm
en
t e
arn
ing
s1
02
,19
9
7
6,3
21
7
9,5
28
2
58
,04
8
Pa
ym
en
ts f
rom
Sta
te o
f In
dia
na
58
9,7
46
40
1,8
86
67
5,6
05
1,6
67
,23
7
Oth
er
37
4,4
50
1,8
86
46
,10
0
42
2,4
36
To
tal g
en
era
l re
ve
nu
es
1,0
66
,39
5
4
80
,09
3
8
01
,23
3
2
,34
7,7
21
Cha
ng
e in
ne
t p
ositio
n1
77
,72
4
1
37
,71
8
2
24
,38
2
5
39
,82
4
Net
po
sitio
n -
be
gin
nin
g6
,60
1,4
18
5,9
88
,73
0
3
,20
4,1
47
15
,79
4,2
95
Net
po
sit
ion
- e
nd
ing
6,7
79
,14
2$
6
,12
6,4
48
$
3,4
28
,52
9$
1
6,3
34
,11
9$
Th
e n
ote
s t
o t
he
fin
an
cia
l sta
tem
en
ts a
re a
n in
teg
ral p
art
of
this
sta
tem
en
t.
Ne
t (E
xp
en
se
) R
eve
nu
e a
nd
Ch
an
ge
s i
n N
et
Po
sit
ion
43 - State of Indiana - Comprehensive Annual Financial Report

NOTES TO THE FINANCIAL STATEMENTS
Comprehensive Annual Financial Report - State of Indiana - 44
STATE OF INDIANA
Notes to the Financial Statements June 30, 2020
I. Summary of Significant Accounting Policies ..................................................................................... 46 A. Reporting Entity ....................................................................................................................... 46 B. Government-Wide and Fund Financial Statements ................................................................ 51 C. Measurement Focus, Basis of Accounting, and Financial Statement Presentation ............... 51 D. Eliminating Internal Activity ..................................................................................................... 53 E. Assets, Liabilities and Equity ................................................................................................... 53
1. Deposits, Investments and Securities Lending .............................................................. 53 2. Receivables and Payables ............................................................................................ 54 3. Interfund Transactions and Balances ............................................................................ 55 4. Inventories and Prepaid Items ....................................................................................... 55 5. Restricted Net Position .................................................................................................. 55 6. Capital Assets ................................................................................................................ 55 7. Compensated Absences ................................................................................................ 56 8. Long-Term Obligations .................................................................................................. 57 9. Fund Balance ................................................................................................................. 57
F. Use of Estimates ..................................................................................................................... 57
II. Reconciliation of Government-Wide and Fund Financial Statements ............................................. 58 A. Reconciliation of the Governmental Funds Balance Sheet to the Statement of Net Position . 58B. Reconciliation of the Statement of Revenues, Expenditures, and Changes in Fund
Balances of Governmental Funds to the Statement of Activities ....................................... 58
III. Stewardship, Compliance and Accountability ................................................................................. 59 A. Deficit Fund Equity .................................................................................................................. 59 B. Fund Balance .......................................................................................................................... 59
IV. Detailed Notes on All Funds ........................................................................................................... 60 A. Deposits, Investments and Securities Lending ....................................................................... 60
1. Primary Government – Other than Major Moves and Next Generation Funds,Investment Trust Funds, and Pension and Other Employee Benefit Trust Funds ........................................................................................................................ 60
2. Pension and Other Employee Benefit Trust Funds – Primary Government .................. 70 3. Pension Trust Funds – Fiduciary in Nature Component Unit ........................................ 77
B. Interfund Transactions ............................................................................................................ 87 C. Receivables ............................................................................................................................. 91 D. Capital Assets ......................................................................................................................... 92 E. Leases ................................................................................................................................... 93 F. Long-Term Obligations ............................................................................................................ 94 G. Prior Period Adjustments and Reclassifications ..................................................................... 94
V. Other Information .............................................................................................................................. 96 A. Risk Management ................................................................................................................... 96 B. Contingencies and Commitments ........................................................................................... 96 C. Other Revenue ........................................................................................................................ 99 D. Economic Stabilization Fund ................................................................................................... 99 E. Employee Retirement Systems and Plans .............................................................................. 99 F. Other Postemployment Benefits – Defined Benefit and Defined Contribution Plans ........... 127 G. Pollution Remediation Obligations ......................................................................................... 136 H. Tax Abatements ..................................................................................................................... 137
45 - State of Indiana - Comprehensive Annual Financial Report

STATE OF INDIANA Notes to the Financial Statements
June 30, 2020 (schedule amounts are expressed in thousands)
I. SUMMARY OF SIGNIFICANT ACCOUNTING POLICIES
A. Reporting Entity
As required by generally accepted accounting principles, these financial statements present the government (State of Indiana) and its component units. Blended component units, although legally separate entities, are in substance part of the government's operations; data from these units are combined with data of the primary government. Discretely presented component units are reported in one column in the government-wide financial statements. This column contains the governmental fund types, proprietary fund types, and colleges and universities. This is to emphasize that, as well as being legally separate from the government; they also provide services to and benefit local governments and/or the citizens of the State of Indiana. Of the component units, the Indiana Housing and Community Development Authority, Ports of Indiana, Indiana State Fair Commission, Indiana Comprehensive Health Insurance Association, and the Indiana Political Subdivision Risk Management Commission have a December 31, 2019, fiscal year-end.
Blended Component Units
The following component units are reported under the blended method as the primary government appoints a voting majority of the board and is able to impose its will. These units, although legally separate from the State, are reported as part of the State because they provide services entirely or almost entirely to the State.
The Bureau of Motor Vehicle Commission (BMVC) was established per Indiana Code 9-14-9 to develop and update Bureau of Motor Vehicles (BMV) policy, establish standards for the operation and maintenance of license branches, and submit budget proposals for the BMVC, BMV, and license branches. The BMVC has significant interrelated operations with the BMV and license branches. The BMV is responsible for the accurate and timely distribution of the fees and taxes (excise and wheel) collected at the license branches for driver licenses, auto and watercraft registrations, and license plates.
The BMVC consists of four individuals appointed by the governor and the chairperson who is the commissioner of the BMV. No more than three of the members may be of the same political party. The BMVC is reported as a non-major governmental fund
The Indiana Homeland Security Foundation was established per Indiana Code 10-15-2-1 to assist the Indiana Department of Homeland Security (IDHS) in developing projects that benefit public safety in local communities. The foundation administers the Indiana Homeland Security fund which funds these IDHS projects. The foundation has significant interrelated operations with the IDHS. Foundation funds are aligned with the Indiana Strategy for Homeland Security of the IDHS. The Indiana Homeland Security Foundation is reported as a non-major governmental fund.
The Indiana Natural Resources Foundation was established per Indiana Code 14-12-1 to promote, support, assist, sustain and encourage charitable, educational and scientific programs, projects and policies of the Indiana Department of Natural Resources. The Indiana Natural Resources Foundation is reported as a non-major governmental fund.
The Healthy Hoosiers Foundation was established per Indiana Code 16-19-3-30 to support the purposes and programs of the Indiana State Department of Health, which may include programs intended to reduce infant mortality, increase childhood immunizations, reduce obesity, and reduce smoking rates. The Healthy Hoosiers Foundation is reported as a non-major governmental fund.
The Indiana War Memorials Foundation was established per Indiana Code 10-18-1 for the benefit of, to perform the functions of, and to carry out the purposes of the Indiana War Memorials Commission. The Foundation provides cultural and recreational services. The Indiana War Memorials Foundation is reported as a non-major governmental fund.
Comprehensive Annual Financial Report - State of Indiana - 46

The Indiana State Library Foundation was established per Indiana Code 4-23-7.1-42 to support the programs of the State Library and libraries in the state. The Indiana State Library Foundation is reported as a non-major governmental fund.
Discretely Presented Component Units
The following are discretely presented component units of the State of Indiana. The component units that are included in the State’s reporting entity because the primary government appoints a voting majority of their governing bodies and is able to impose its will on each organization are: Indiana Economic Development Corporation, Indiana Finance Authority, State Lottery Commission of Indiana, Indiana Stadium Convention and Building Authority, Indiana Bond Bank, Indiana Housing and Community Development Authority, Indiana Secondary Market for Education Loans, Inc., White River State Park Development Commission, Ports of Indiana, Indiana Comprehensive Health Insurance Association, Indiana Political Subdivision Risk Management Commission, Indiana State Museum and Historic Sites Corporation, Indiana Motorsports Commission, and each of the seven colleges and universities. The following component units are included in the State’s reporting entity because the primary government appoints a voting majority of their governing bodies and is financially accountable for each organization: Indiana Board for Depositories, Indiana State Fair Commission, and the Indiana Public Retirement System.
The Indiana Economic Development Corporation (IEDC) was created per Indiana Code 5-28-3 to improve the quality of life for the citizens of Indiana by encouraging the diversification of Indiana’s economy and the orderly economic development and growth of Indiana, the creation of new jobs, the retention of existing jobs, the growth and modernization of existing industry, and the promotion of Indiana. The IEDC leads the state of Indiana’s economic development efforts, helping businesses launch, grow, and locate in the state. The IEDC manages many initiatives, including performance-based tax credits, workforce training grants, innovation and entrepreneurship resources, public infrastructure assistance, and talent attraction and retention efforts. The IEDC Board of Directors is composed of 12 members, consisting of the Governor and 11 individuals appointed by the Governor. At least five members of the board must belong to the same political party as the Governor, and at least three members must belong to another major political party, but none may be members of the general assembly. The IEDC is reported as a
non-major discretely presented governmental component unit. The separately issued audited financial statements may be obtained by writing the Indiana Economic Development Corporation, One North Capital Avenue, Suite 700, Indianapolis, IN 46204.
The Indiana Finance Authority (IFA) was created per Indiana Code 5-1.2-3-1 as a body both corporate and politic, and though separate from the State of Indiana (State); the exercise by the IFA of its powers constitutes an essential governmental function. Indiana’s constitution restricts State incurrence of debt. As a result, the General Assembly created the IFA and authorized it to issue revenue bonds and other obligations to finance projects for lease to the State.
The IFA finances and refinances state hospitals, state office buildings, state garages, correctional facilities, recreational facilities, highways, bridges, airport facilities, and other related facilities for the benefit of the State. The IFA also provides low interest loans to Indiana communities for environmental improvements. It also promotes business and employment opportunities by issuing tax-exempt financing for industrial development projects, rural development projects, childcare financing, and educational facility projects.
The IFA’s revenue bonds and notes are special and limited obligations of the IFA, payable from lease rental revenue, bond or note proceeds and investment income. The IFA’s revenue bonds are not general obligations of the IFA nor are they State debt within the meaning of any constitutional provision or limitation. The IFA cannot compel the General Assembly to make appropriations to pay lease rentals. The authority is composed of five members, consisting of the budget director or their designee, who serves as chairman, the Treasurer of State or their designee, and three members appointed by the governor of which no more than two may be from the same political party. The Authority is reported as a major discretely presented proprietary component unit. IFA’s separately issued audited financial statements may be obtained by writing the Indiana Finance Authority, One North Capital Avenue, Suite 900, Indianapolis, IN 46204.
The State Lottery Commission of Indiana, created per Indiana Code 4-30-3, is composed of five members appointed by the Governor. Net proceeds from the Lottery are distributed to the State to be used to supplement teachers' retirement, local police and firefighters’ pensions, and the Build Indiana Fund. A portion of the Build Indiana Fund is
47 - State of Indiana - Comprehensive Annual Financial Report

then used to supplement the Motor Vehicle Excise Tax Replacement Fund. The Commission is reported as a major discretely presented proprietary component unit. The separately issued audited financial statements may be obtained by writing the State Lottery Commission of Indiana, 1302 North Meridian Street, Indianapolis, IN 46202. The Indiana Stadium and Convention Building Authority was established per Indiana Code 5-1-17, as an entity of the State to finance, design, construct, and own the new Indiana Stadium in Indianapolis and the expansion of the adjacent Indiana Convention Center. The Building Authority is governed by a seven member board, comprised of four appointments by the Governor, two appointments by the Mayor of the City of Indianapolis and one appointment by the Governor following nomination from one of the counties surrounding Marion County. The Authority is reported as a non-major discretely presented proprietary component unit. The separately issued audited financial statements may be obtained by writing the Indiana Stadium and Convention Building Authority, One North Capital Avenue, Suite 900, Indianapolis, IN 46204. The Indiana Bond Bank, created per Indiana Code 5-1.5-2, is controlled by a board composed of the Treasurer of State, Director of Public Finance and five appointees of the Governor. The Bond Bank issues debt obligations and invests the proceeds in various projects of State and local governments. The Bond Bank is reported as a non-major discretely presented proprietary component unit. The separately issued audited financial statements may be obtained by writing the Indiana Bond Bank, 10 West Market Street, Suite 2410, Indianapolis, IN 46204. The Indiana Housing and Community Development Authority was created per Indiana Code 5-20-1-3 for the purpose of financing residential housing for persons and families of low and moderate incomes. The Authority’s board consists of the Public Finance Director of the Indiana Finance Authority, the Lieutenant Governor, the State Treasurer and four persons appointed by the Governor. The Lieutenant Governor chairs the board. The Authority is reported as a non-major discretely presented proprietary component unit. The separately issued audited financial statements may be obtained by writing the Indiana Housing and Community Development Authority, 30 South Meridian Street, Suite 1000, Indianapolis, IN 46204. The Indiana Board for Depositories was established per Indiana Code 5-13-12 to ensure the
safekeeping and prompt payment of all public funds deposited in Indiana banks. The Board, consisting of the Governor, Treasurer of State, Auditor of State, Chairman of the Commission for Financial Institutions, State Examiner of the State Board of Accounts and four members appointed by the Governor, provides insurance on public funds in excess of the Federal Deposit Insurance Corporation limit. The Board is reported as a non-major discretely presented proprietary component unit. The separately issued audited financial statements may be obtained by writing the Indiana Board for Depositories, One North Capitol Avenue, Suite 900, Indianapolis, IN 46204 or at https://www.in.gov/tos/deposit/. The Indiana Secondary Market for Education Loans, Inc. (ISM), d/b/a INvestEd, was created per Indiana Code 21-16-5 to purchase education loans in the secondary market, lend money for the origination of education loans, and originate loans to consolidate education debt. The Governor appointed the original Board of Directors. ISM provides in its articles of incorporation that changes in the composition of its directors or in its bylaws are subject to the approval of the Governor. ISM is reported as a non-major discretely presented proprietary component unit. The separately issued audited financial statements may be obtained by writing the Indiana Secondary Market for Education Loans, Inc., d/b/a INvestEd, 11595 North Meridian Street, Suite 200, Carmel, IN 46032. The White River State Park Development Commission created per Indiana Code 14-13-1-5 has the responsibility to design and implement a plan for the establishment and development of park, exposition, educational, athletic, and recreational projects to be located within one mile from the banks of the Indiana White River in a consolidated first-class city and county, and is authorized to acquire additional land and property. The Commission has 10 voting members which consist of the director or their designee, the executive of the city of Indianapolis or their designee, the president of Indiana University or their designee, and seven members appointed by the governor. The Commission is reported as a non-major discretely presented proprietary component unit. The separately issued audited financial statements may be obtained by writing the Indiana White River State Park Development Commission, 801 West Washington Street, Indianapolis, IN 46204. The Ports of Indiana is a body both corporate and politic created per Indiana Code 8-10-1-3 to construct, maintain, and operate public ports with terminal facilities and traffic exchange points for all
Comprehensive Annual Financial Report - State of Indiana - 48

forms of transportation on Lake Michigan and the Ohio and Wabash Rivers. The Ports of Indiana Commission consists of seven members appointed by the governor. The Commission is reported as a non-major discretely presented proprietary component unit. The separately issued audited financial statements may be obtained by writing the Ports of Indiana, 150 West Market Street, Suite 100, Indianapolis, IN 46204. The State Fair Commission was established per Indiana Code 15-13-2 as the trustee for and on behalf of the people of the State of Indiana to administer the State Fairgrounds as trust property of the State of Indiana. The Commission is responsible for holding the annual Indiana State Fair in August, as well as providing accessible, cost-effective, secure, and modern facilities for the variety of events held at the Fairgrounds and other properties it owns. The Commission consists of eight members; five of which are appointed by the governor, and three are ex officio members. The Commission is reported as a non-major discretely presented proprietary component unit. The separately issued audited financial statements may be obtained by writing the Indiana State Fair Commission, 1202 East 38th Street, Indianapolis, IN 46205. The Indiana Comprehensive Health Insurance Association was created per Indiana Code 27-8-10-2.1 to assure that health insurance is made available throughout the year to each eligible Indiana resident applying to the Association for coverage. The board of directors of the Association consists of nine members whose principal residence is in Indiana. Four members are appointed by the insurance commissioner from the members of the Association, one of which must be a representative of a health maintenance organization. Two members are appointed by the commissioner and shall be consumers representing policyholders. Other members are the state budget director or designee and the commissioner of the department of insurance or designee. One member appointed by the commissioner must be a representative of health care providers. The Association is reported as a non-major discretely presented proprietary component unit. The separately issued audited financial statements may be obtained by writing the Indiana Comprehensive Health Insurance Association, 9465 Counselors Row, Suite 200, Indianapolis, IN 46240. The Indiana Political Subdivision Risk Management Commission was created per Indiana Code 27-1-29 to administer the Political Subdivision Risk Management Fund (Basic fund) and the Political
Subdivision Catastrophic Liability Fund (Catastrophic fund). These funds aid political subdivisions in protecting themselves against liabilities. The Commission consists of eleven members appointed by the governor. The Commission is reported as a non-major discretely presented proprietary component unit. The separately issued audited financial statements may be obtained by writing the Indiana Political Subdivision Risk Management Commission, c/o Indiana Department of Insurance, 311 West Washington Street, Suite 300, Indianapolis, IN 46204. The Indiana State Museum and Historic Sites Corporation was created per Indiana Code 4-37 and is responsible for operating and administering the Indiana State Museum and eleven Historic Sites across the State. The eleven Historic Sites include Angel Mounds, Corydon Capitol, Culbertson Mansion, J.F.D. Lanier Mansion, Levi Coffin, Limberlost, New Harmony, T.C. Steele, Gene Stratton-Porter, Vincennes, and the Whitewater Canal. The Corporation is governed by a thirty member board of trustees of which twenty-five are voting members and five are non-voting members. Of the twenty-five voting members, thirteen persons are appointed by the governor and twelve are appointed by the board. The five non-voting members include the chief executive officer, the governor or governor’s designee, one member of the House of Representatives, one member of the Senate, and the director of the Department of Natural Resources or the director’s designee. The Corporation is reported as a non-major discretely presented proprietary component unit. The separately issued audited financial statements may be obtained by writing the Indiana State Museum and Historic Sites Corporation, 650 West Washington Street, Indianapolis, IN 46204. The Indiana Motorsports Commission was established per Indiana Code 5-1-17.5-15 as a separate body corporate and politic, as an instrumentality of the state, to finance and lease real and personal property improvements for the benefit of an owner of a qualified motorsports facility within a motorsports investment district. The commission is governed by a board of directors composed of five directors of which one is the budget director, or the budget director’s designee, and four directors appointed by the governor. The commission is reported as a non-major discretely presented proprietary component unit. The separately issued audited financial statements may be obtained by writing the Indiana Motorsports Commission, One North Capital Avenue, Suite 900, Indianapolis, IN 46204.
49 - State of Indiana - Comprehensive Annual Financial Report

Each of the seven colleges and universities included in this report was established by individual legislation to provide higher education opportunities to the citizens of Indiana. The authority to administer the operations of each institution is granted to a separate board of trustees for each of the seven institutions. The number and makeup of the board of trustees of each college and university is prescribed by legislation specific for that institution. Four universities have nine member boards; two have ten member boards; and Ivy Tech Community College has a fourteen-member board of trustees. Appointments to the boards of trustees are made by the Governor and by election of the alumni of the respective universities. Indiana University and Purdue University are reported as a major discretely presented component unit. The separately issued audited financial statements for the colleges and universities may be obtained by writing to: Indiana University, Poplars Room 500, 400 E. 7th St., Bloomington, IN 47405-3001; Purdue University, Kurz Purdue Technology Center, 1281 Win Hentschel Blvd., Ste. 1100, West Lafayette, IN 47906-4182; Ball State University, Administration Bldg., 301, 2000 West University Avenue, Muncie, IN 47306; Indiana State University, Office of the Controller, 200 N. 7th Street, Terre Haute, IN 47809; Ivy Tech Community College, Attn: Chief Accounting Operations Officer, 50 West Fall Creek Parkway, North Drive, Indianapolis, IN 46208-5752; University of Southern Indiana, 8600 University Boulevard, Evansville, IN 47712; and Vincennes University, 1002 North 1st Street, Vincennes, IN 47591. Fiduciary in Nature Component Unit The Indiana Public Retirement System (INPRS) was established per Indiana Code 5-10.5-2-1 as an independent body corporate and politic. INPRS is not a department or agency for the State, but is an independent instrumentality exercising essential government functions. The INPRS board is composed of nine trustees appointed by the Governor which includes the director of the budget agency or the director’s designee as an ex officio voting member of the board. The board of trustees administers the following plans: Public Employees’ Retirement Fund, Teachers’ Retirement Fund, Judges’ Retirement System, State Excise Police, Gaming Agent, Gaming Control Officer and Conservation Enforcement Officers’ Retirement Plan, the 1977 Police Officers’ and Firefighters’ Pension and Disability Fund, the Legislators’ Retirement System Defined Benefit Plan, the Legislators’ Retirement System Defined
Contribution Plan, the Prosecuting Attorneys’ Retirement Fund, the Retirement Medical Benefits Account Defined Contribution plan, the Pension Relief Fund, and one death benefit fund. For more information on the plans see Note V(E) Employee Retirement Systems and Plans. All of these funds have been aggregated for presentation from INPRS’ financial statements. INPRS is included as a component unit because the primary government appoints a voting majority of its governing body and has financial accountability. The Indiana Public Retirement System was determined to be significant for note disclosure purposes involving the fiduciary in nature component units. The separately issued audited financial statements may be obtained by writing the Indiana Public Retirement System, One North Capitol Avenue, Suite 001, Indianapolis, IN 46204. Related Organizations The primary government appoints a voting majority of the board of the Indiana Education Savings Authority (IESA) created per Indiana Code 21-9. The IESA serves as the governing board of Indiana’s tax-advantaged CollegeChoice 529 Savings Plans which are CollegeChoice Direct, CollegeChoice Advisor, and CollegeChoice CD. The primary government’s accountability for IESA does not extend beyond making the appointments to the board. The primary government is not able to impose its will on IESA nor is it financially accountable for IESA. The State had no related party transactions with IESA during fiscal year 2020. The primary government appoints a voting majority of the board of the Achieving a Better Life Experience (ABLE) Authority created per Indiana Code 12-11-14-09. The authority serves as the governing board of Indiana’s tax-advantaged ABLE Savings Plan, INvestABLE Indiana. The primary government’s accountability for ABLE does not extend beyond making the appointments to the board. The primary government is not able to impose its will on ABLE nor is it financially accountable for ABLE. ABLE expended $364.3 thousand of state appropriations for operating expenses during fiscal year 2020. The primary government’s officials are also responsible for appointing the members of the boards of other organizations, but the primary government’s accountability for these organizations does not extend beyond making the appointment.
Comprehensive Annual Financial Report - State of Indiana - 50

B. Government-Wide and Fund Financial Statements The government-wide financial statements consist of a statement of net position and a statement of activities. These statements report information about the overall government. They exclude information about fiduciary activities, including component units, which are fiduciary in nature, such as the public employee retirement systems. They distinguish between the primary government and its discretely presented component units as disclosed in Note I.A. They also distinguish between governmental activities and business-type activities of the State. Governmental activities rely on taxes and intergovernmental revenues for their support. Business-type activities, on the other hand, rely on fees and charges for services provided for their support. The statement of activities matches the State’s direct functional expense with the functional program revenue to identify the relative financial burden of each of the State’s functions. This format identifies the extent to which each function of the government draws from the general revenues of the government or is self-financing through fees and intergovernmental aid. Certain indirect costs are included in the program expense reported for individual functions of government. Program revenues derive directly from the program itself or from parties outside the State’s taxpayers, as a whole. They reduce the net cost of the function to be financed from the general revenues. Program revenues include charges for services, program-specific operating grants and contributions, and program-specific capital grants and contributions. Revenues that do not meet the criteria of program revenues are general revenues. These include all taxes; even those levied for a specific purpose and are reported by type of tax. Investment income is considered general revenue in the general fund. Separate financial statements are presented for the State’s governmental, proprietary and fiduciary funds. Governmental fund financial statements are the balance sheet and the statement of revenues, expenditures, and changes in fund balances. Major governmental funds are presented in separate columns and non-major funds are aggregated in a separate column. Proprietary and fiduciary funds are reported using the statement of net position and the statement of changes in net position. In addition proprietary funds include a statement of cash flows.
C. Measurement Focus, Basis of Accounting and Financial Statement Presentation Measurement Focus and Basis of Accounting The government-wide statements and the proprietary and fiduciary fund statements use the economic resources measurement focus and the accrual basis of accounting. Revenues, expenses, gains, losses, assets, liabilities, and deferrals resulting from exchange and exchange-like transactions are recognized when the exchange takes place. Government-mandated nonexchange revenues and voluntary nonexchange revenues, including federal government mandates on the State, certain grants and entitlements, and most donations, are recognized in the period when all applicable eligibility requirements have been met. Governmental funds are used to account for the government's general government activities. Governmental fund types use the flow of current financial resources measurement focus and the modified accrual basis of accounting. Under the modified accrual basis of accounting revenues are recognized when susceptible to accrual (i.e., when they are "measurable and available"). "Measurable" means the amount of the transaction can be determined and "available" means collectible within the current period or soon enough thereafter to pay liabilities of the current period. For the State of Indiana, “available” means collectible within one month of the fiscal year end. Expenditures are recorded when the related fund liability is incurred, except for certain compensated absences and related liabilities, and claims and judgments which are recognized when the obligations are expected to be liquidated with expendable available financial resources. Individual and corporate income tax, sales tax, cigarette tax, alcoholic beverage tax, motor fuel tax, fines, and penalties are accrued using one month’s revenues. Gaming taxes are accrued based on the gaming day. Vehicle licenses are received daily via electronic funds transfer with a one to three working day delay, so revenues for the first several working days in July are reviewed for materiality and accrued accordingly. Financial Statement Presentation A fund is an independent fiscal and accounting entity with a self-balancing set of accounts. Fund accounting segregates funds according to their intended purpose and is used to aid management in
51 - State of Indiana - Comprehensive Annual Financial Report

demonstrating compliance with finance-related legal and contractual provisions. Governmental funds are used to account for the government's general government activities. Governmental funds include the general fund, special revenue funds, capital projects funds, debt service funds and permanent funds. The General Fund is the State’s primary operating fund. It is maintained to account for resources obtained and used for those services traditionally provided by State government, which are not required to be accounted for in another fund. The General Fund is a major fund. The special revenue funds account for specific revenue sources that are legally restricted or committed to expenditure for specific purposes except for major capital projects. The following special revenue funds are presented as major.
The Public Welfare-Medicaid Assistance Fund receives federal grants and State appropriations which are used to administer the Medicaid program. Federal grant revenues, hospital assessment fees, quality assessment fees, Intermediate Care Facility for Individuals with Disabilities fees, and other resources disclosed under interfund transfers in Note IV (B) are reported in this fund.
The U.S. Department of Health and Human Services Fund receives federal grants that are used to carry out health and human services programs. Federal grant revenues, vital record fees, child support annual fees, and other resources disclosed under interfund transfers in Note IV(B) are reported in this fund.
The Federal COVID-19 Fund provides federal grant dollars to cover costs that are necessary expenditures incurred due to the public health emergency with respect to the Coronavirus Disease 2019. The fund includes the CARES Act, the Coronavirus Relief Fund, and additional funds provided for existing grant programs.
The capital projects funds account for financial resources that are restricted, committed, or assigned to expenditures for the acquisition of capital assets or construction of major capital projects not being financed by proprietary or
fiduciary funds. There are no major capital project funds. The permanent funds are used to account for resources that are legally restricted to the extent that only earnings and not principal may be used for the benefit of the government or its citizens. There are no major permanent funds. Proprietary funds focus on the determination of operating income, changes in net position, financial position and cash flows. Operating revenues and expenses are the revenues and expenses that pertain to the fund’s principal operations. Nonoperating revenues and expenses are those revenues and expenses resulting from secondary or auxiliary activities of the fund. Nonoperating items include investment revenue and expense. Proprietary funds include both enterprise funds and internal service funds. Enterprise funds are used to account for those operations that are financed and operated in a manner similar to private business or where it has been decided that the determination of revenues earned, costs incurred and/or net income is necessary for management accountability. The State reports the following major enterprise fund:
The Unemployment Compensation Fund collects employer taxes and the federal share of unemployment compensation. Benefits are paid to eligible individuals.
Internal service funds account for operations that provide goods and services to other departments or agencies of the government, or to other governments, on a cost-reimbursement basis. The goods and services provided include fleet management, information technology and communication, aviation, printing, products of correctional industries, self-insurance, and centralized accounting. Major fund reporting requirements do not apply to internal service funds. Combined totals for all internal service funds are reported as a separate column on the face of the proprietary fund financial statements. Fiduciary funds account for assets held by or on behalf of the government in a trustee capacity or as an agent on behalf of others. They cannot be used to support the State’s own programs. Fiduciary funds include pension (and other employee benefit) trust funds, private-purpose trust funds, investment trust funds, and agency funds.
Comprehensive Annual Financial Report - State of Indiana - 52

Pension (and other employee benefit) trust funds are used to report resources held in trust for the members and beneficiaries of defined benefit pension plans, defined contribution pension plans, and other postemployment benefit plans. Pension and other employee benefits trust funds include the Indiana Public Retirement System, State Police Pension Fund, State Employee Retiree Health Benefit Trust Fund – DB, and the State Employee Retiree Health Benefit Trust Fund – DC. Private-purpose trust funds are used to account for trust arrangements in which both the principal and interest may be spent for the benefit of individuals, private organizations or other governments. Private Purpose funds include the Abandoned Property Fund and the Private Purpose Trust Fund. Investment trust funds are used to report the external portion of investment pools operated by a sponsoring government. The Treasurer of State, local units of government, and quasi-governmental units in Indiana have the opportunity to invest in a common pool of investments that preserves the principal of the public’s funds, remains highly-liquid, and maximizes the return on the investment of public funds. The State’s investment trust fund is TrustINdiana operated by the state treasurer. The amounts reported represent the external portion of the pool. Agency funds are custodial in nature and do not present results of operations or have a measurement focus. These funds are used to account for assets that the government holds for others in an agency capacity. Agency Funds include Employee Payroll Withholding and Benefits, Local Distributions, Child Support and Department of Insurance. D. Eliminating Internal Activity Interfund activity including those from cash overdrafts in funds, interfund services provided or used, interfund loans and prepaid expenditures of internal service funds are eliminated as internal balances in the government-wide statement of net position. This is to minimize the “grossing-up” effect on assets and liabilities within the governmental and business-type activities columns of the primary government. As a result, interfund loans and interfund services provided and/or used reported in the governmental funds balance sheet has been eliminated in the government-wide statement of net position. Eliminations were made in the statement of activities to remove the “doubling-up” effect of internal service fund activity. The effect of similar
internal events that are, in effect, allocations of overhead expenses from one function to another or within the same function have also been eliminated, so that the allocated expenses are reported only by the function to which they were allocated. The effect of interfund services provided and used between functions has not been eliminated in the statement of activities since to do so would misstate both the expenses of the purchasing function and the program revenues of the selling function. E. Assets, Liabilities and Equity 1. Deposits, Investments and Securities
Lending For purposes of reporting cash flows, cash and cash equivalents are defined as short-term, highly liquid investments that are both readily convertible to known amounts of cash and near their maturity (generally three months or less from the date of acquisition). Cash balances of most State funds are commingled in general checking accounts and several special purpose banking accounts. The available cash balance not necessary beyond immediate need is pooled and invested. Interest earned from investments purchased with pooled cash is deposited in the general fund, except as otherwise provided by statute. Investments and secured lending transactions are stated at fair value. Money market investments and participating interest-earning investment contracts that mature within one year of purchase are reported at cost, which approximates fair value. Fair value is determined by quoted market prices which approximates fair value. Investments that do not have an established market are reported at estimated fair value. Indiana Code 5-13-9 and 5-13-10.5 authorizes the Treasurer to invest in deposit accounts issued or offered by a designated depository; securities backed by the full faith and credit of the United States Treasury; securities issued by any U.S. government agency; AAA money market mutual funds with a portfolio limited to direct obligations of the U.S., obligations of any federal agency, and/or repurchase agreements fully collateralized with U.S. government obligations or U.S. agency obligations; highest rated commercial paper, highest rated supranational issues, and repurchase agreements that are fully collateralized, as determined by the current market value computed on the day the agreement is effective, by interest-bearing obligations that are issued, fully insured or
53 - State of Indiana - Comprehensive Annual Financial Report

guaranteed by the United States or any U.S. government agency. The Treasurer of State is authorized by statute to accept as collateral safekeeping receipts for securities from: (1) a duly designated depository or (2) a financial institution located either in or out of Indiana, having physical custody of securities, with a combined capital and surplus of at least $10 million, according to the last statement of condition filed by the financial institution with its governmental supervisory body. The Treasurer may not deposit aggregate funds in deposit accounts in any one designated depository in an amount aggregating at any one time more than 50% of the combined capital, surplus and undivided profits of that depository as determined by the last published statement. The Indiana Public Retirement System (INPRS) Board of Trustees administers sixteen pension trust funds including eight Defined Benefit retirement plans and five Defined Contribution retirement plans, two other employment benefit funds, and one custodial fund. Indiana law requires the Board to establish investment guidelines and limits on all types of investments and take other actions necessary to fulfill its duty as fiduciary for all assets under its control. The INPRS Board of Trustees is required to diversify investments in accordance with the prudent investor standards. At June 30, 2020, cash and investments of the funds were held by banks or trust companies under custodial agreements with INPRS. The INPRS Board of Trustees contracts with investment counsel, trust companies or banks to assist INPRS in its invest-ment program. The Investment Policy Statement adopted by the INPRS Board of Trustees and the asset allocation approved by the Board of Trustees contains target allocations and allowable ranges that are expected to meet target rates of return over a long period of time while minimizing risk. The investments of INPRS are subject to the provisions of IC 5-10.3-5-3(a) and IC 5-10.4-3-10(a). See Note IV(A)(3) for more information. Investments which are authorized for the State Police Retirement fund include: U.S. Treasury and Agency obligations, State and municipal obligations, domestic corporate bonds/notes, common stock and equity securities, foreign stocks and bonds, mortgage pool investments, and repurchase agreements. The investments of the State Police Retirement fund are subject to the provisions of IC 10-12-2-2. See Note IV(A)(2) for more information.
2. Receivables and Payables In the government-wide and proprietary fund financial statements, revenues are recognized on the flow of economic resources measurement focus. Material receivables are recognized as follows. Uncollected taxes due in the following periods are subject to accrual:
Individual income tax – Individual withholding tax is due from employers by the 20th day after the end of the month collected. Estimated payments are due from individuals by the 15th of the month immediately following each quarter or the calendar year.
Corporate income tax - Due quarterly on the 20th day of April, June, September, and December with the last payment due on April 15th for a calendar year taxpayer.
Sales tax – Due by the 20th day after the end of the month collected.
Fuel tax – Gasoline tax is due the 20th day after the end of the month collected. Special fuel tax, depending on the status of the taxpayer, is due by the 15th day after the end of the month collected or the 15th day after the end of the quarter collected. Motor carrier surtax is due at the end of the month following the end of the quarter.
Financial institutions tax – same laws as corporate income taxes (see above) for making payments.
Alcohol and tobacco taxes – Cigarette distributors must purchase tax stamps within 6 days after they accept delivery of the cigarettes. Cigarette tax is due within 30 days of the issuance of the tax stamp. Alcoholic beverage tax is due by the 20th day after the end of the month collected.
In the governmental fund financial statements, revenue is recognized on the flow of current financial resources. Material receivables are subject to accrual for receipts collected in the month of July. The State of Indiana does not collect property tax, which is collected by local units of government. Unavailable revenue is the liability for the full accrual income taxes receivable net of the allowance for doubtful accounts and the portion of federal grants receivable not available in the current reporting period and is reported under deferred inflows of resources.
Comprehensive Annual Financial Report - State of Indiana - 54

3. Interfund Transactions and Balances The State has the following types of interfund transactions in the governmental fund and proprietary financial statements:
Interfund services provided and used (reciprocal interfund activity) – Charges for goods or services rendered by one fund to another are treated as revenues of the recipient fund and expenditures/expenses of the disbursing fund.
Interfund Transfers (non-reciprocal interfund activity) – Legally authorized transfers whereby the two parties do not receive equivalent cash, goods or services are reported as transfers.
The types of assets and liabilities resulting from these transactions are:
Interfund loans – These are balances arising from the short-term and long-term portion of interfund transactions.
Interfund services provided/used – These are balances arising in connection with reciprocal interfund activity or reimbursements. Balances relating to discretely presented component units are presented as ‘Due from/to component units’.
Interfund services provided and interfund loans are eliminated in the government-wide statements because they are provided by one governmental activity on behalf of another or by one business-type activity on behalf of another.
4. Inventories and Prepaid Items Inventories for the Inns & Concessions, Institutional Industries and Administrative Services Revolving funds are valued at cost. The costs of governmental fund-type inventories are recorded as expenditures when purchased. The first in/first out (FIFO) method is used for valuation of inventories. Certain payments to vendors reflect costs applicable to future accounting periods and are recorded as prepaid items. The consumption rather than the purchases method is used for prepaids as expenditures or expenses are recorded for the cost of prepaid items when consumed rather than when purchased.
5. Restricted Net Position Certain net positions are classified as restricted net position because their use is completely restricted by bond indentures, contracts, grantors, contributors, laws or regulations of other governments, or through constitutional provisions or enabling legislation. Net position restricted by enabling legislation for governmental activities totals $1.1 billion, of which $0.5 billion is permanent funds principal, $0.5 billion is for the Economic Stabilization Fund as discussed in Note V (D), and $0.1 billion is prepaid expenses. 6. Capital Assets Capital outlays are reported as expenditures in the governmental funds and as assets in the government-wide statements to the extent the State’s $20,000 capitalization threshold for external financial reporting is met. The Indiana Department of Transportation (INDOT) uses the modified approach for reporting its infrastructure. The Department of Natural Resources (DNR) uses the depreciation approach for reporting its infrastructure. Under the modified approach, the State has determined that the condition level for INDOT infrastructure assets to be maintained is:
a network average International Roughness Index based on the right wheel path (IRI RWP) of no more than 101 and no more than 12.5% of all pavements in the unacceptable range for Interstates, National Highway System (NHS) Non-Interstate roads, and Non-NHS roads,
an average sufficiency rating of 87% for interstate bridges,
an average sufficiency rating of 85% for NHS Non-Interstate bridges, and
an average sufficiency rating of 83% for Non-NHS bridges.
The Bridge Division, Program Engineering, and Road Inventory Division of INDOT are responsible for determining the appropriate condition level of the infrastructure assets. No amounts are capitalized in connection with improvements that lengthen the lives of such assets, unless the improvements also increase their service potential.
55 - State of Indiana - Comprehensive Annual Financial Report

INDOT projects are capitalized based on capitalization and preservation percentages assigned to three hundred eighty-six (386) work types. For example, the cost for constructing a new bridge would likely be 100% capitalized; whereas, the cost for adding travel lanes to a road would likely be assigned a work type code resulting in capitalization at 50% and preservation at 50%. The State maintains an inventory of these infrastructure assets and performs periodic condition assessments to establish that the predetermined condition level is being maintained. Road pavement condition assessments are performed annually on all INDOT state routes, including interstates. Condition assessments of all bridges are determined on a bi-annual basis. Sufficiency ratings of all bridges are determined on an annual basis by the Federal Highway Administration based on annual submittal of bridge condition data. The State makes annual estimates of the amounts that must be expended to preserve and maintain these infrastructure assets at the predetermined condition levels. Capital assets are recorded at historical cost or estimated historical cost if purchased or constructed. Donated capital assets are recorded at their acquisition value at the date of donation. Capital assets are depreciated in the proprietary and similar trust funds using the straight-line method on both the fund basis and the government-wide basis. Both the government-wide statements and proprietary and similar trust funds use the following estimated useful lives:
Assets Months
Buildings and other structures including improvements to buildings and other structures
240-480
Computer software 36
Infrastructure (not using modified approach) 240-720
Furniture, machinery and equipment 12-168
Motor pool vehicles 96-168
The State of Indiana maintains several collections of works of art, historical treasures, and similar assets that are not capitalized. While the collections are maintained by different agencies, each collection is:
Held for public exhibition, education, or research in furtherance of public service, rather than financial gain.
Protected, kept unencumbered, cared for, and
preserved.
Subject to an organizational policy that either prohibits sale or requires the proceeds from sales of collection items to be used to acquire other items for collections.
The State’s major collections are:
The Commission on Public Records, State Archives Collection consists of historical and legal documents that are generated on: paper or paper substitutes; photographic or chemically based media; magnetic or machine readable media; or any other materials, regardless of form or characteristics.
The State Library has two collections, the Manuscript Collection and the Indiana History Collection. These collections include historical documents and works of art, most of it of Indiana origin.
Other collections include the Historical Bureau’s Indiana Governors’ Portrait Collection, the Department of Administration’s Statehouse Collection, and the Indiana Arts Commission’s Collection. These collections consist primarily of art objects. 7. Compensated Absences Full-time employees of the State of Indiana are permitted to accumulate earned but unused vacation and sick pay benefits. Vacation leave accumulates at the rate of one day per month and sick leave at the rate of one day every two months plus an extra day every four months. Bonus vacation days are awarded upon completion of five, ten and twenty years of employment. Personal leave days are earned at the rate of one day every four months; any personal leave accumulated in excess of three days automatically becomes part of the sick leave balance. Upon separation of service, in good standing, employees will be paid for a maximum of thirty (30) unused vacation leave days. In addition, qualifying retiring employees are paid an additional payment up to a maximum of $5,000, which is made up of unused vacation leave over 30 days, unused personal leave, and unused sick leave. The legislative and judicial branches may elect to participate in a leave conversion program which allows their employees to convert a portion of accrued but unused vacation and sick leave into the deferred compensation plan. An employee must have at least 300 hours of vacation or sick leave accrued in order to participate in this plan. There is
Comprehensive Annual Financial Report - State of Indiana - 56

a sliding scale which determines how many hours are converted from those hours the employee has accrued. The hours converted are deposited into the deferred compensation program’s 401(a) plan at 60% of the employee’s hourly rate. The legislative branch participated in this program in FY 2020 for their employees and the legislative branch has elected to participate in this program for FY 2021 for their employees. Matured vacation and personal leave and salary-related payments that are expected to be liquidated with expendable available financial resources are reported as an expenditure and a fund liability of the governmental fund that will pay it. Amounts not expected to be liquidated with expendable available financial resources are reported as long term liabilities in the government-wide, proprietary, and fiduciary fund financial statements. 8. Long-Term Obligations Long-term debt and other obligations are reported in the government-wide statements and the proprietary funds statements as liabilities in the applicable governmental activities, business-type activities, or proprietary fund. 9. Fund Balance In the fund financial statements, fund balances are categorized as nonspendable, restricted, committed, assigned, or unassigned. A brief description of each category is as follows: Nonspendable – represents amounts that are either not in spendable form, such as prepaid expenditures, and activity that is legally or contractually required to be maintained intact, such as a principal balance in a permanent fund. Restricted – represents amounts restricted to specific purposes because of constraints placed on their use that are either externally imposed such as by grantors or imposed by law through constitutional provisions or enabling legislation. Committed – represents amounts that can only be used for a specific purpose pursuant to constraints imposed by the government’s highest level of decision making authority. The State of Indiana’s highest level of decision making authority is the General Assembly. The formal action necessary would be the enactment of a State law that specifically establishes, modifies, or rescinds a fund balance commitment. Assigned – represents amounts that are constrained by the government’s intent to be used
for specific purposes as expressed by the governing body itself or the official to which the governing body has delegated the authority to assign amounts to be used for specific purposes. The State Budget Agency has the authority per the biennial budget bill to make assignments of fund balances for specific purposes except for those restricted by law. The State Board of Finance comprised of the Governor, Auditor of State and Treasurer of State is empowered to make assignments of funds except for trust funds per I.C. 4-9.1-1-7. Unassigned – represents fund balance that has not been assigned to other funds and that has not been restricted, committed, or assigned to specific purposes within the general fund. Only the general fund may report a positive unassigned fund balance; whereas, other governmental funds may need to report a negative unassigned fund balance if expenditures incurred for specific purposes exceeded the amounts restricted, committed, or assigned to those purposes. Funds on the State’s accounting system are assigned one of the five fund balance classifications. If a fund has resources that are both restricted and unrestricted, then expenditures are applied first to restricted fund balance and then unrestricted amounts. A fund’s unrestricted fund balance would have committed amounts reduced first, assigned amounts second, and unassigned amounts third when expenditures are incurred for purposes for which amounts in any of these unrestricted fund balance classifications could be used. F. Use of Estimates The preparation of financial statements in conformity with accounting principles generally accepted in the United States of America requires management to make estimates and assumptions that affect the reported amounts of assets, deferred outflows of resources, liabilities, and deferred inflows of resources, and disclosure of contingent assets and liabilities at the date of the financial statements and the reported amounts of revenues and expenses during the reporting period. Actual results could differ from those estimates. The allowance for doubtful accounts for taxes receivable, the estimate of claims payable for the Medicaid fund, the estimate of additions for the Local Distributions fund, and the estimated useful lives of capital assets are among the most sensitive accounting estimates affecting the financial statements.
57 - State of Indiana - Comprehensive Annual Financial Report

The additions for the Local Distributions fund, an agency fund, are estimated using the most recent actual known local option income tax collections which are for the calendar year two years prior to the current fiscal year. Adjustments to the estimate are made for units of local government that have changed their local income tax rates during the following two calendar years, for actual collections
during the six months prior to the end of the current fiscal year, and for interest earned. The economy, any rate changes that are made in the current calendar year after preparation of the financial statements, and any unknown errors can impact the estimation process and cause actual results to differ.
II. RECONCILIATION OF GOVERNMENT-WIDE AND FUND FINANCIAL STATEMENTS As described in Note I, Summary of Significant Accounting Policies, differences exist between the government-wide and the governmental fund financial statements. These differences are summarized in the reconciliations that follow the governmental fund financial statements.
A. Reconciliation of the Governmental Funds
Balance Sheet to the Statement of Net Position
In the government-wide financial statements, capital assets are considered economic resources and are capitalized at cost or estimated historical cost at time of acquisition. Where applicable these costs are offset by accumulated depreciation or amortization. The government-wide statements use the flow of economic resources and accrue receivables that are not available soon enough in the subsequent period to pay for the current period’s expenditures. Also under the flow of economic resources, expenses reported in the statement of activities do not require the use of current financial resources. Both these receivables and payables are accrued in the government-wide statements, but not in the fund financial statements. Internal service funds are used by management to charge the costs of certain activities to individual funds. In the government-wide financial statements, the assets and liabilities of internal service funds are included in governmental activities in the statement of net position. In the proprietary fund financial statements, internal service fund balances are segregated and reported as their own fund type.
B. Reconciliation of the Statement of
Revenues, Expenditures, and Changes in Fund Balances of Governmental Funds to the Statement of Activities
In the government-wide financial statements, the cost for capital outlays, except for governmental infrastructure, is allocated over the assets’ useful lives and is reported as depreciation or amortization expense. The government-wide statements use the flow of economic resources and therefore do not report revenues and expenses dependent on the availability of financial resources, as is reported in the fund financial statements. Revenues in the statement of activities that do not provide current financial resources are not reported as revenues in the fund financial statements. Expenses reported in the statement of activities that do not require the use of current financial resources are not reported as expenditures in the fund financial statements. Net pension liabilities and other postemployment benefits do not require the use of current financial resources and are not reported as expenditures in the fund financial statements. Internal service funds are used by management to charge the costs of certain activities to individual funds. In the government-wide financial statements, the expenses of internal service funds are included in governmental activities in the statement of activities. In the proprietary fund financial statements, internal service fund balances are segregated and reported as their own fund type.
Comprehensive Annual Financial Report - State of Indiana - 58
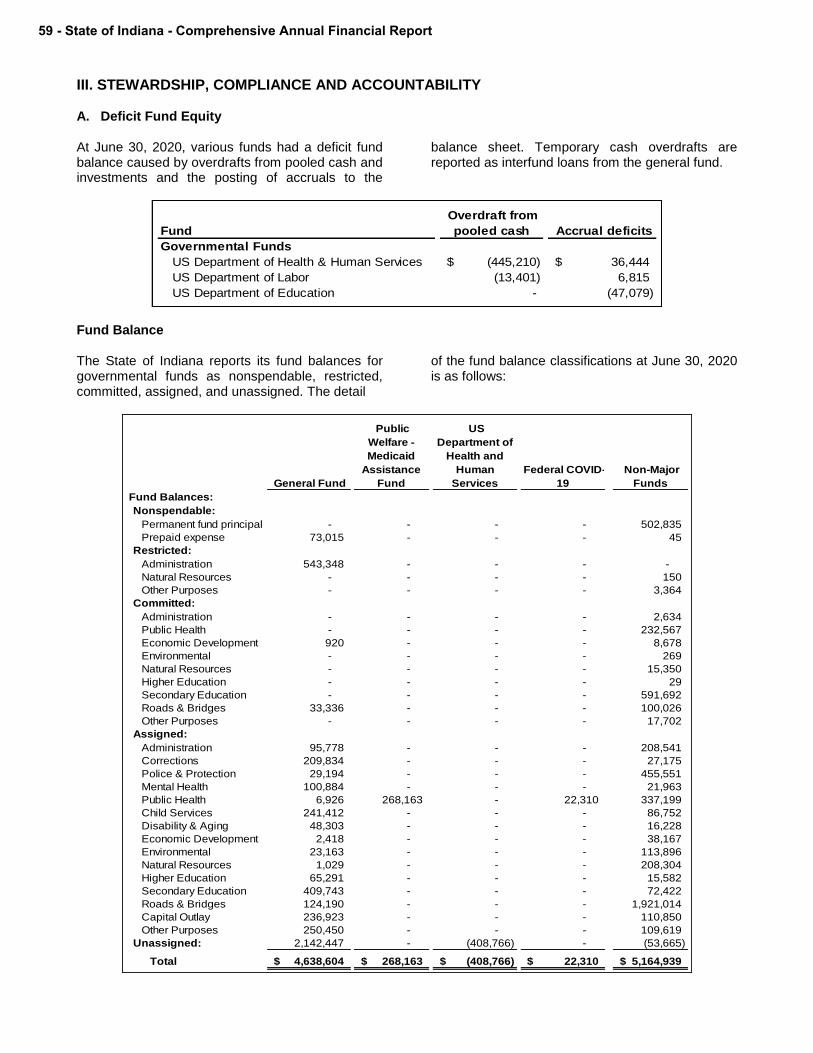
III. STEWARDSHIP, COMPLIANCE AND ACCOUNTABILITY A. Deficit Fund Equity At June 30, 2020, various funds had a deficit fund balance caused by overdrafts from pooled cash and investments and the posting of accruals to the
balance sheet. Temporary cash overdrafts are reported as interfund loans from the general fund.
Fund
Overdraft from
pooled cash Accrual deficits
Governmental Funds
US Department of Health & Human Services (445,210)$ 36,444$
US Department of Labor (13,401) 6,815
US Department of Education - (47,079)
Fund Balance The State of Indiana reports its fund balances for governmental funds as nonspendable, restricted, committed, assigned, and unassigned. The detail
of the fund balance classifications at June 30, 2020 is as follows:
General Fund
Public
Welfare -
Medicaid
Assistance
Fund
US
Department of
Health and
Human
Services
Federal COVID-
19
Non-Major
Funds
Fund Balances:
Nonspendable:
Permanent fund principal - - - - 502,835
Prepaid expense 73,015 - - - 45
Restricted:
Administration 543,348 - - - -
Natural Resources - - - - 150
Other Purposes - - - - 3,364
Committed:
Administration - - - - 2,634
Public Health - - - - 232,567
Economic Development 920 - - - 8,678
Environmental - - - - 269
Natural Resources - - - - 15,350
Higher Education - - - - 29
Secondary Education - - - - 591,692
Roads & Bridges 33,336 - - - 100,026
Other Purposes - - - - 17,702
Assigned:
Administration 95,778 - - - 208,541
Corrections 209,834 - - - 27,175
Police & Protection 29,194 - - - 455,551
Mental Health 100,884 - - - 21,963
Public Health 6,926 268,163 - 22,310 337,199
Child Services 241,412 - - - 86,752
Disability & Aging 48,303 - - - 16,228
Economic Development 2,418 - - - 38,167
Environmental 23,163 - - - 113,896
Natural Resources 1,029 - - - 208,304
Higher Education 65,291 - - - 15,582
Secondary Education 409,743 - - - 72,422
Roads & Bridges 124,190 - - - 1,921,014
Capital Outlay 236,923 - - - 110,850
Other Purposes 250,450 - - - 109,619
Unassigned: 2,142,447 - (408,766) - (53,665)
Total 4,638,604$ 268,163$ (408,766)$ 22,310$ 5,164,939$
59 - State of Indiana - Comprehensive Annual Financial Report

IV. DETAILED NOTES ON ALL FUNDS A. Deposits, Investments and Securities
Lending 1. Primary Government – Other than Major
Moves Construction Fund and Next Level Indiana Trust Fund, Investment Trust Funds, and Pension and Other Employee Benefit Trust Funds.
Investment Policy Indiana Code, Title 5, Article13, Chapters 9, 10, and 10.5, establishes the investment powers and guidelines regarding the State of Indiana investments. However, the Major Moves Construction Fund and the Next Level Indiana Trust Fund have separate investment authority as established under Indiana Code 8-14-14 and Indiana Code 8-14-15, respectively. The Treasurer of State shall invest these funds in the same manner as the public employees’ retirement fund under Indiana Code 5-10.3-5 with the exception that monies may not be invested in equity securities. For more information, please see the PERF policy in note IV (A) 3. There are no formal deposit investment policies for the investment of these funds other than compliance to State statute. State statute does not establish any parameters or guidelines related to the concentration of investment risk, investment credit risk, nor interest rate risk. Indiana Code 5-13-9 and Indiana Code 5-13-10.5 authorizes the Treasurer to invest in deposit accounts issued or offered by a designated depository; municipal securities issued by an Indiana
local governmental entity if the issuer has not defaulted on any obligation within the twenty years preceding the date of the purchase; AAA rated money market mutual funds with a portfolio made up of direct obligations of the United States, obligations issued by any federal agency, instrumentality, or federal government sponsored enterprise or repurchase agreements fully collateralized by the same obligations allowed to be owned within the money market mutual fund; commercial paper rated in the highest rating category by one nationally recognized rating service with a stated final maturity of 270 days; securities backed by the full faith and credit of the United States Treasury or fully guaranteed by the United States; obligations issued by United States agencies and instrumentalities, or federal government sponsored enterprises; supranational issuers having the highest investment credit rating by at least two nationally recognized credit rating agencies; repurchase agreements that are fully collateralized, as determined by the current market value computed on the day the agreement is effective, by interest bearing obligations that are issued, fully insured or guaranteed by the United States or any U.S. government agency; and the State’s local government investment pool. Interest Rate Risk Interest rate risk is the risk that changes in interest rates will adversely affect the fair value of an investment. State statute does not establish any parameters or guidelines related to interest rate risk.
The following is a summary of the Interest Rate Risk Disclosure as of June 30, 2020:
Fair Investment Maturities (in Years)
Investment Type Value Totals Less than 1 1 - 5 6 - 10
U.S. Treasuries* 4,006,569$ 3,457,266$ 549,303$ -$ -
U.S. Agencies 1,106,628 498,571 608,057 - -
Supranationals 748,060 729,905 18,155 -
Municipal Bonds 136,006 124,162 11,699 145 -
Local Govt Investment Pool 373,000 373,000 - - -
Non-U.S. Fixed Income 70,000 30,000 40,000 - -
Certificate of Deposits 299,507 299,507 - - -
Money Market Mutual Funds 1,028,000 1,028,000 - -
Total 7,767,770$ 6,540,411$ 1,227,214$ 145$
* Treasuries include $299,931 of investments with a trade-date
of 6/30/20 but a settlement of 7/1/2020.
Comprehensive Annual Financial Report - State of Indiana - 60

Custodial Credit Risk Deposits – The custodial credit risk for deposits is the risk that, in the event of the failure of a depository financial institution, a government will not be able to recover deposits or will not be able to recover collateral securities that are in the possession of an outside party. At June 30, 2020, the balance of the State of Indiana’s deposits was covered in full by federal depository insurance or by the Public Deposit Insurance Fund, which covers all public funds held in approved depositories. Investment Custodial Credit Risk – The custodial credit risk for investments is the risk that, in the event of the failure of the counterparty to a transaction, a government will not be able to recover the value of investment or collateral securities that are in the possession of an outside party. Investments are exposed to custodial credit risk if the securities are uninsured and unregistered and are either held by the counterparty’s trust department or agent, but not in the name of the State of Indiana. The Treasurer of State is authorized by statute (IC 5-13-10.5-5) to accept safekeeping receipts or other reporting for securities from: (1) a duly designated depository as prescribed in this article; or (2) a financial institution located either in or out of Indiana having physical custody of securities with a combined capital and surplus of at least ten million dollars ($10,000,000) according to the last statement of condition filed by the financial institution with its governmental supervisory body. None of the State’s investments are exposed to custodial credit risk because they are held in the name of the State of Indiana. Additionally, the Treasurer of State requires all custodians to indemnify the State against all out-of-pocket expenses or losses incurred as a result of (i) the custodian’s operational failure, (ii) custodians failure to carry out the credit analysis, (iii) custodian’s failure to maintain proper collateral for each loan, or (iv) failure of an approved counterparty to comply with its obligations under the applicable securities lending agreement. Credit Risk Credit risk is the risk that an issuer or other counterparty to an investment will not fulfill its obligations. Indiana Code 5-13-9, IC 5-13-10, and IC 5-13-10.5 authorizes the State Treasurer to invest or reinvest in securities fully guaranteed and issued by (1) the United States Treasury, (2) a federal agency, (3) a federal instrumentality, or (4) a federal government sponsored enterprise, as well as, other securities that are AAA rated or insured through the
Public Deposit Insurance Fund or the FDIC. The allowable investments are noted above under the Investment Policy Statement section in more detail. The State Treasurer recognizes credit (quality) risk as a market and strategic risk factor in all investments. The following table provides information on the credit quality ratings for investments in debt securities as well as investments in external investment pools, and money market funds, as of June 30, 2020. Obligations of the U.S. government or obligations explicitly guaranteed by the U.S. government are not considered to have credit risk and do not require disclosure of credit quality. The table reflects the greatest risk rating (the credit rating reflecting the greatest degree of risk) as set by three nationally recognized rating organizations (S&P, Moody, and Fitch) for each type of investment, not exempt from disclosure:
Greatest Risk
Investment Type Rating Fair Value
U.S. Agencies AAA 105,634$
AA 1,000,994
Supranationals AAA 748,060
Certificate of Deposits NR 299,507
Municipal Bonds NR 136,006
Non-US Fixed Income Bonds A 70,000
Local Govt Investment Pool NR 373,000
Money Market Mutual Funds AAA 1,028,000
Total 3,761,201$
Concentration of Credit Risk Concentration of credit risk is the risk of loss attributed to the magnitude of a government’s investment in a single issuer. Indiana Code 5-13-10-3 states that the State Treasurer may not deposit aggregate funds in deposit accounts in any one designated depository in an amount aggregating at any one time more than fifty percent (50%) of the combined capital, surplus, and undivided profits of that depository as determined by its last published statement of condition filed with the State Board for Depositories. At June 30, 2020, investments in any one issuer, not exempt from disclosure, that represent 5% or more of the total investments (in thousands) were:
FHLB 5.42% $531,903 Foreign Currency Risk Foreign currency risk is the risk that changes in exchange rates will adversely affect the fair value of an investment or a deposit. As of June 30, 2020, there were no deposits or investments denominated
61 - State of Indiana - Comprehensive Annual Financial Report

in foreign currencies, thus there was no foreign currency risk. Securities Lending The Treasurer of State is authorized by Indiana Code 5-13-10.5-13 to lend securities, to broker-dealers and other entities (borrowers), for collateral with a simultaneous agreement to return the collateral for the same securities in the future. Securities may be lent under this section only if the agreement under which the securities are lent is collateralized by: (1) cash; or (2) non-cash collateral; in excess of the total market value of the loaned securities. The State’s custodial banks manage the securities lending programs and receive cash or securities as collateral. The types of securities lent during the year may include U.S. Treasury and agency obligations, corporate bonds/notes, and foreign bonds. Collateral securities and cash are initially pledged at 102% of the market value of the securities lent. Cash received as collateral is reported as an asset and a liability on the balance sheet. Securities received as non-cash collateral are not reported on the balance sheet, because the State does not have the ability to pledge or sell them without a borrower default. Generally, there are no restrictions on the amount of assets that can be lent at one time, except for the Public Employees’ Retirement Fund and the State Teachers’ Retirement Fund (discretely presented component units), which allow no more than 40% to be lent at one time. Cash collateral received is invested by the custodian banks. Cash collateral is generally invested in securities of a longer term with the mismatch of maturities generally 0-35 days. The weighted average maturity gap at June 30, 2020, was 5.97 days. At year end, the State had no credit risk exposure to any borrowers because the amount the State owes the borrowers exceeds the amounts the borrowers owe the State. The contracts with the State’s custodian requires them to indemnify the funds if the borrowers fail to return the securities (and if the collateral is inadequate to replace the securities lent) or fail to pay the funds for income distributions by the securities’ issuers while the securities are on loan. As of June 30, 2020, the fair values of the underlying securities on loan were:
Security Type Fair Value
U.S. Governments 2,133,083$
U.S. Agencies 3,527
Total 2,136,610$
The fair values of the collateral received for each investment type were:
Security Type Fair Value
U.S. Governments 2,167,896$
U.S. Agencies 3,616
Total 2,171,512$
The percentage of collateral received for underlying securities on loan was 101.6%. The fair values of the cash and non-cash collateral received were:
Collateral Type Fair Value
Non-cash collateral 21,149$
Cash collateral (liability
to borrowers) 2,150,363
Total 2,171,512$
Events of the market crisis of late 2008 negatively impacted the value of the State’s securities lending cash collateral reinvestment pool. Since that time, the State, with the agreement of its’ custodial bank, has been injecting capital into the pool using securities lending revenues to restore the value of the cash collateral reinvestment pool. As of June 30, 2020, the fair value of the cash collateral reinvestment pool was 98.40% of the fair value of the cash collateral received from the borrowers. Fair Value of reinvested cash collateral by type:
Collateral Type Fair Value
Commercial paper 484,884$
Certificates of deposit 268,998
Repurchase agreements 13,058
Asset backed securities 239,273
Floating rate notes 924,059
MMMF's 185,042
Receivable 542
Total 2,115,856$
Comprehensive Annual Financial Report - State of Indiana - 62

The quality rating of the reinvested cash collateral investments as described by Standard and Poor’s at June 30, 2020, is as follows:
S&P Rating
Fair Value
of Cash
Collateral
% of
Portfolio
AAA 235,592$ 11.1
AA 262,177 12.4
A 1,336,489 63.2
CC 3,681 0.2
NR 277,917 13.1
Total 2,115,856$ 100.0
Fair Value Measurement – Primary Government The Primary Government categorizes investments measured at fair value within the fair value hierarchy established by generally accepted accounting principles. The hierarchy prioritizes valuation inputs used to measure the fair value of the asset or liability into three broad categories. The inputs or methodology used for valuing securities are not necessarily an indication of the risk associated with investing in those securities. Levels 1, 2, and 3 (lowest priority level) of the fair value hierarchy are defined as follows: Level 1 Inputs using unadjusted quoted prices in active markets or exchanges for identical assets or liabilities. Level 2 Significant other observable inputs, which
may include, quoted prices for similar assets or liabilities in active markets, quoted prices for identical or similar assets or liabilities in non-active markets; and inputs other than quoted prices that are observable for the assets or liabilities, either directly or indirectly. Level 3 Valuations for which one or more significant inputs are unobservable and may include situations where there is minimal, if any, market activity for the asset or liability. US Treasury securities classified in Level 1 of the fair value hierarchy are valued using prices quoted in active markets for those securities. The U.S. Agencies’ securities, Supranationals’ securities, and municipal bonds classified in Level 2 of the fair value hierarchy are valued using other observable inputs other than quoted prices in an active market. The certificate of deposits are valued at cost-based measures and are classified as Level 2. The Non-US Government Bonds and municipal bonds classified in Level 3 have no observable inputs and there is no market activity regarding those investments, so they have been valued using cost-based measures. The local government investment pool is valued using the fair value valuation methodology and is marked to market daily using the most recent market bid price as obtained from one or more market makers and is thus classified in Level 2 of the fair value hierarchy. The money market mutual funds are valued at the daily closing price as reported by the funds and are deemed to be actively traded and are classified in Level 1 of the fair value hierarchy.
The following table summarizes the valuation of the investments by the fair value hierarchy levels as of June 30, 2020:
Fair Value Measurements Using
Investment Type June 30, 2020
Quoted Prices
in Active
Markets for
Identical Assets
(Level 1)
Significant
Other
Observable
Inputs (Level 2)
Significant
Unobservable
Inputs (Level 3)
U.S. Treasuries 4,006,569$ 4,006,569$ -$ -$
U.S. Agencies 1,106,628 - 1,106,628 -
Supranationals 748,060 - 748,060 -
Municipal Bonds 136,006 - - 136,006
Non-US Govt Bonds 70,000 - - 70,000
Corporate Asset Backed - - - -
Local Govt Investment Pool 373,000 - 373,000 -
Certificate of Deposits 299,507 - 299,507 - Money Market Mutual Funds 1,028,000 1,028,000 - -
Total Fixed Income Securities 7,767,770$ 5,034,569$ 2,527,195$ 206,006$
* Treasuries include $299,931 of investments with a trade-date
of 6/30/20 but a settlement of 7/1/2020.
63 - State of Indiana - Comprehensive Annual Financial Report

Major Moves Construction Fund/Next Level Indiana Trust Fund Investment Policy Indiana Code, Title 5, Article13, Chapters 9, 10, and 10.5, establishes the investment powers and guidelines regarding the State of Indiana investments. However, the Major Moves Construction Fund and the Next Level Indiana Trust Fund have separate investment authority as established under Indiana Code 8-14-14 and Indiana Code 8-14-15.1, respectively. The Treasurer of State shall invest the funds in the Major Moves Construction Fund in the same manner as the public employees’ retirement fund under Indiana Code 5-10.3-5, except the funds may not be invested in equity securities. The Next Level Indiana Trust Fund allows for investment of not more than 50% of the money in the trust, $250.0 million, to be invested in investments that: (a) maximize risk appropriate returns, which may include the purchase of equity or debt securities; and (b) make significant investments in Indiana funds and companies. At least 50% of the money in the trust, $250.0 million or greater, may be invested by the Treasurer of State in the same manner as the public employees’ retirement fund, excluding investment in equity securities. An Investment Policy Statement for the Major Moves Construction Fund for the investment of this fund has been adopted by the Treasurer of State. An Investment Policy Statement for the Next Level Indiana Trust Fund for the investment of these funds
has been adopted by the Next Level Indiana Trust Fund Investment Board. The Investment Policy Statements are written in conformity with the applicable investment statutes and in accordance with prudent investor standards. There is no formal deposit policy other than compliance to State Statute. State statute does not establish any parameters or guidelines related to the concentration of investment risk, investment credit risk, nor interest rate risk. The Investment Policy Statements establish asset allocations and investment structures for both funds. These asset allocations and investment structures were established with consideration given to each Fund’s objectives, time horizons, risk tolerances, performance expectations, and liquidity requirements. Interest Rate Risk Interest rate risk is the risk that changes in interest rates will adversely affect the fair value of the investments. The fund’s policy for controlling its exposure to interest rate fluctuations should be viewed with the appropriate perspective. The MMCF manager’s long-term strategy was employed to achieve the fund’s objectives, but there was consideration given to the short-term liquidity needs to meet disbursements required by the fund. The asset allocation and investment manager structure was designed to tolerate some interim fluctuations in market value while maintaining a long-term return objective of 5.25%.
The following table provides the interest rate risk disclosure for the Major Moves/Next Level Indiana Trust Fund as of June 30, 2020:
Investment Maturities (in Years)
Investment Type Fair Value Less than 1 1 - 5 6- 10 More than 10
U.S Treasuries 555,718$ 421,666$ 121,880$ 5,789$ 6,383$
U.S. Agencies 26,863 26,863 - - -
Government Asset and Mortgage Backed 77,278 38,922 3,749 6,340 28,267
Collateralized Mortgage Obligations
Government CMOs 13,969 5,266 1,777 1,787 5,139
Corp CMOs 8,463 5,808 - - 2,655
Corporate Bonds 297,357 109,332 141,028 30,005 16,992
Corporate Asset Backed 56,982 13,785 34,623 1,523 7,051
Private Placements 130,690 32,709 58,014 20,786 19,181
Municipal Bonds 16,630 3,921 10,360 2,121 228
TrustINdiana 2,800 2,800 - - -
Non US Government/Corp Bonds 38,092 1,748 12,279 10,355 13,710
Supernationals 91,480 89,958 1,522 - -
Mutual Funds 110,694 110,694 - - -
Total 1,427,016$ 863,472$ 385,232$ 78,706$ 99,606$
Comprehensive Annual Financial Report - State of Indiana - 64

Custodial Credit Risk Deposits – The custodial credit risk for deposits is the risk that, in the event of the failure of a depository financial institution, a government will not be able to recover deposits or will not be able to recover collateral securities that are in the possession of an outside party. At June 30, 2020, the balance of the State of Indiana’s deposits was covered in full by federal depository insurance or by the Public Deposit Insurance Fund, which covers all public funds held in approved depositories. Investment Custodial Credit Risk – The custodial credit risk for investments is the risk that, in the event of the failure of the counterparty to a transaction, a government will not be able to recover the value of investment or collateral securities that are in the possession of an outside party. Investments are exposed to custodial credit risk if the securities are uninsured and unregistered and are either held by the counterparty’s trust department or agent, but not in the name of the State of Indiana. None of the State’s investments are exposed to custodial credit risk because they are held in the name of the State of Indiana. Additionally, the Treasurer of State requires all custodians to indemnify the State against all out-of-pocket expenses or losses incurred as a result of (i) the custodian’s operational failure, (ii) custodians failure to carry out the credit analysis, (iii) custodian’s failure to maintain proper collateral for each loan, or (iv) failure of an approved counterparty to comply with its obligations under the applicable securities lending agreement. Credit Risk Credit risk is the risk that an issuer or other counterparty to an investment will not fulfill its obligations. Obligations of the U.S. government or obligations explicitly guaranteed by the U.S. government are not considered to have credit risk and do not require disclosure of credit quality. All investment managers must adhere to the following guideline related to the specific limitation on holdings: The purchase of securities in the maximum amount invested in any single issuer of a non-agency mortgage-backed, asset-backed, or corporate security shall be limited to an initial cost of 2.5% of the market value of an Investment Manager’s portfolio. This limit shall not apply to U.S. Government securities, or mortgage-back securities that are issued by an agency of the U.S.
Government. Through capital appreciation, no such holding should exceed 3.5% of the market value of the total holdings of such Investment Manager’s portfolio. The following table provides information on the credit quality ratings for investments in debt securities, short-term money market funds, bond mutual funds and bond commingled funds, municipal securities, asset-backed, and mortgage-backed securities as of June 30, 2020. The table below reflects the “greatest risk” rating (the credit rating reflecting the greatest degree of risk) as set by three nationally recognized rating organizations (S&P, Moody, and Fitch) for each type of investment, not exempt from disclosure, in the Major Moves/Next Level Indiana Trust Fund.
Greatest Risk
Investment Type Ratings Fair Value
U.S. Agencies AA 26,863$
Government Asset And Mortgage Backed AAA 3,009
AA 35,529
NR 38,740
Collateralized Mortgage Obligations
Government CMO's AAA 1,265
AA 11,781
A 167
BB 503
BBB 253
Corporate CMO's AA 180
A 112
BBB 787
BB 180
B 480
CCC&Below 5,423
NR 1,301
Non US Govt/Corp Bonds AA 2,598
A 1,980
BBB 13,088
BB 5,105
B 7,694
CCC&Below 2,040
NR 5,587
Corporate Bonds AAA 143
AA 12,276
A 106,890
BBB 141,203
BB 24,906
B 9,955
CCC&Below 1,223
NR 760
Corporate Asset and Mortgage Backed AAA 31,889
AA 5,940
A 3,073
BBB 2,010
BB 1,346
B 2,183
CCC&Below 10,527
NR 14
Private Placements AAA 28,683
AA 12,662
A 15,592
BBB 30,165
BB 11,204
B 16,470
CCC&Below 10,675
NR 5,240
TrustINdiana NR 2,800
Municipal Bonds AA 10,888
A 4,303
BBB 1,381
CCC&Below 55
NR 3
Supernationals AAA 91,480
Money Market Mutual Funds NR 110,694
Total 871,298$
65 - State of Indiana - Comprehensive Annual Financial Report

Concentration of Credit Risk Concentration of credit risk is the risk of loss attributed to the magnitude of a government's investment in a single issuer representing 5% or more of the total investments. The only exemptions from disclosures are US Government Debt, US Government Guaranteed Investments, Mutual Funds, or External Investment Pools. For Intermediate and Core Fixed Income Managers, securities in any one issuer should be limited to not more than 5% of the investment manager’s portion of the Fund portfolio measured at market value. For Core Plus Fixed Income Managers, the exposure of each manager’s portfolio should be limited to not more than 10% of the manager’s portion of the Fund portfolio measured at market value. As of June 30, 2020, there were no investments in any one issuer that represent 5% or more of the total investments. Foreign Currency Risk Foreign currency risk is the risk that changes in exchange rates will adversely affect the fair value of an investment or a deposit. The Major Moves/Next Level Trust Fund’s foreign currency exposure is focused primarily in fixed income securities. The exposure to foreign currency fluctuation is as follows:
Currency Fair Value
% of Total
Fair Value
Argentina Peso 999$ 0.07%
Australian Dollar 202 0.01%
Brazil Real 1,772 0.12%
Canadian Dollar 3,281 0.23%
Chinese R Yuan HK (420) -0.03%
Chinese Yuan Renminbi 419 0.03%
Colombian Peso 858 0.06%
Czech Koruna 430 0.03%
Dominican Republic Peso 441 0.03%
Egyptian Pound 171 0.01%
Euro Currency (2,454) -0.17%
Indian Rupee 328 0.02%
Indonesian Rupiah 2,662 0.19%
Japanese Yen 22 0.00%
Malaysian Ringgit 825 0.06%
Mexican Peso 5,638 0.39%
Peruvian Sol 2,052 0.14%
Polish Zloty 1,524 0.11%
Pound Sterling 1,545 0.11%
Russian Ruble 4,498 0.31%
Singapore Dollar 2 0.00%
South African Rand 1,441 0.10%
Ukraine Hryvana 940 0.07%
Uruguayan Peso 268 0.02%
Subtotal 27,444 1.92%
U.S. Dollar 1,405,557 98.08%
Total Fair Value 1,433,001$ 100.00%
Securities Lending The Treasurer of State is authorized by Indiana Code 5-13-10.5-13 to lend securities. Securities may be lent only if the agreement under which the securities are lent is collateralized by (1) cash or (2) interest bearing obligations that are issued by, fully insured by, or guaranteed by the United States, an agency of the United States, a federal instrumentality, or a federal government sponsored enterprise, in excess of the total market value of the loaned securities. At year end, there were no securities on loan and therefore, no credit risk exposure. Fair Value Measurement The Major Moves Construction Fund and Next Level Indiana Trust Fund categorizes investments measured at fair value within the fair value hierarchy established by generally accepted accounting principles. The hierarchy prioritizes valuation inputs used to measure the fair value of the asset or liability into three broad categories. The inputs or methodology used for valuing securities are not necessarily an indication of the risk associated with investing in those securities. Levels 1, 2, and 3 (lowest priority level) of the fair value hierarchy are defined as follows: Level 1 Inputs using unadjusted quoted prices in active markets or exchanges for identical assets or liabilities. Level 2 Significant other observable inputs, which may include, quoted prices for similar assets or liabilities in active markets, quoted prices for identical or similar assets or liabilities in non-active markets; and inputs other than quoted prices that are observable for the assets or liabilities, either directly or indirectly. Level 3 Valuations for which one or more significant inputs are unobservable and may include situations where there is minimal, if any, market activity for the asset or liability. US Treasury securities classified in Level 1 of the fair value hierarchy are valued using prices quoted in active markets for those securities. The U.S. agencies’ securities, supranationals’ securities, and municipal bonds, corporate bonds, and other debt securities classified in Level 2 of the fair value hierarchy are valued using other observable inputs other than quoted prices in an active market. The local government investment pool is valued using the fair value valuation methodology and is marked to market daily using the most recent market bid price
Comprehensive Annual Financial Report - State of Indiana - 66

as obtained from one or more market makers and is thus classified in Level 2 of the fair value hierarchy. Those money market mutual funds that are valued at the daily closing price as reported by the funds and are deemed to be actively traded and are classified
in Level 1 of the fair value hierarchy. The international commingled mutual fund was not priced in an active market and had no observable inputs thus was classified in Level 3.
The following table summarizes the valuation of the investments by the fair value hierarchy levels as of June 30, 2020:
Fair Value Measurements Using
Investment Type June 30, 2020
Quoted Prices
in Active
Markets for
Identical Assets
(Level 1)
Significant
Other
Observable
Inputs (Level 2)
Significant
Unobservable
Inputs (Level 3)
U.S. Treasuries 555,718$ 555,718$ -$ -$
U.S. Agencies 26,863 - 26,863 -
Govt Asset and Mortgage Backed 77,278 - 77,278 -
Supranationals 91,480 - 91,480 -
Collateralized Mortgage Obligations
Govt CMO's 13,969 - 13,969 -
Corporate CMO's 8,463 - 8,463 -
Corporate Bonds 297,356 - 295,973 1,383
Corporate Asset Backed 56,982 - 56,982 -
Private Placements 130,690 - 130,690 -
Local Government Investment Pool 2,800 - 2,800 -
Non US Govt/Corp Bonds 38,092 - 38,092 -
Municipal Bonds 16,630 - 16,630 -
Mutual/Commingled Funds 110,695 17,807 (1,097) 93,985
Total Fixed Income Securities 1,427,016$ 573,525$ 758,123$ 95,368$
67 - State of Indiana - Comprehensive Annual Financial Report

TrustINdiana, Local Government Investment Pool (Investment Trust Funds) Investment Policy Indiana Code 5-13-9-11, established the local government investment pool within the office and custody of the Treasurer of State. The Treasurer of State shall invest the funds in the same manner, in the same type of instruments, and subject to the same limitations provided for the deposit and investment of state funds by the Treasurer of State under Indiana Code 5-13-10.5. State statute does not establish any parameters or guidelines related to the concentration of investment risk, investment credit risk, nor interest rate risk. However, pursuant to IC 5-13-9-11(g)(7), no less than fifty percent of funds available for investment shall be deposited in banks qualified to hold deposits of participating local government entities. Investment criteria have been established to create the principles and procedures by which the funds shall be invested and to comply with state statute relating to the investment and deposit of public funds.
Valuation of Investments Securities, other than repurchase agreements, are valued at the most recent market bid price as obtained from one or more market makers for such securities. Repurchase agreements are recorded at cost, which approximates fair value. The underlying investments of the Pool are marked-to-market on a daily basis. Security transactions are recorded on a settlement-date basis. Realized gains and losses on sales of investments are calculated on an identified cost basis. Interest income, including any amortization of premium or accretion of discount, is recorded on the accrual basis. Interest Rate Risk Interest rate risk is the risk that changes in interest rates will adversely affect the fair value of an investment.
The following is a summary of the Interest Rate Risk Disclosure as of June 30, 2020:
Investment Maturities (in Years)
Investment Type Fair Value Less than 1
Fixed Income Securities
U.S Treasuries 19,824$ 19,824$
Commercial Paper 365,530 365,530
Certificates of Deposit 16,750 16,750
Money Market Mutual Funds 276,726 276,726
Total 678,830$ 678,830$
Custodial Credit Risk Deposits – The custodial credit risk for deposits is the risk that, in the event of the failure of a depository financial institution, a government will not be able to recover deposits or will not be able to recover collateral securities that are in the possession of an outside party. At June 30, 2020, the balance of all bank deposits were covered in full by federal depository insurance or by the Public Deposit Insurance Fund, which covers all public funds held in approved depositories. Investment Custodial Credit Risk – The custodial credit risk for investments is the risk that, in the event of the failure of the counterparty to a transaction, a
government will not be able to recover the value of investment or collateral securities that are in the possession of an outside party. Investments are exposed to custodial credit risk if the securities are uninsured and unregistered and are either held by the counterparty’s trust department or agent, but not in the name of the State of Indiana. None of the State’s investments are exposed to custodial credit risk because they are held in the name of the State of Indiana. Additionally, the Treasurer of State requires all custodians to indemnify the State against all out-of-pocket expenses or losses incurred as a result of (i) the custodian’s operational failure, (ii) custodians failure to carry out the credit analysis, (iii) custodian’s failure to maintain proper collateral for each loan, or (iv) failure of an approved counterparty to comply with its obligations under the
Comprehensive Annual Financial Report - State of Indiana - 68

applicable securities lending agreement. Credit Risk Credit risk is the risk that an issuer or other counterparty to an investment will not fulfill its obligations. TrustINdiana limits its investments in any one issuer to the highest rating category issued by one nationally recognized statistical rating organization. The following table provides information on the credit quality ratings for investments in TrustINdiana as of June 30, 2020. Obligations of the U.S. government or obligations explicitly guaranteed by the U.S. government are not considered to have credit risk and do not require disclosure of credit quality. The table reflects the greatest risk rating (the credit rating reflecting the greatest degree of risk) as set by three nationally recognized rating organizations for each type of investment, not exempt from disclosure, in TrustINdiana.
Greatest Risk
Investment Type Ratings Fair Value
Certificates of Deposits NR 16,750$
Commercial Paper A1 317,981$
A3 19,820$
NR 27,730$
Money Market Mutual Funds AAA 276,726
Total 659,007$
Concentration of Credit Risk Concentration of credit risk is the risk of loss attributed to the magnitude of a government's investment in a single issuer representing 5% or more of the total investments. As noted above, TrustINdiana is required to be comprised of no less than 50% of deposits in banks from an approved list maintained by the State of Indiana. In addition, TrustINdiana limits its investments in any one issuer of commercial paper to a maximum of 5% of assets per commercial paper issuer and 10% of assets per ultimate commercial paper issuer. The only exemptions from disclosures are US Government Debt, US Government Guaranteed Investments, Mutual Funds, or External Investment Pools. At June 30, 2020, there were no investments in any one issuer, not exempt from disclosure that represents 5% or more of the total investments. Securities Lending The Treasurer of State is authorized by Indiana Code 5-13-10.5-13 to lend securities. Securities may be lent
under an agreement which requires the loaned securities to be collateralized in the form of (1) cash or (2) interest bearing obligations that are issued by, fully insured by, or guaranteed by the United States, an agency of the United States, a federal instrumentality, or a federal government sponsored enterprise, in an amount at least equal to 102% of the current market value of the loaned securities. The net income earned through securities lending is recorded as additional income to the Pool. As of June 30, 2020, there were no securities on loan and therefore, no credit risk exposure. Fair Value Measurement TrustINdiana categorizes investments measured at fair value within the fair value hierarchy established by generally accepted accounting principles. Fair value is the price that would be received to sell an asset or paid to transfer a liability in an orderly transaction between market participants at the measurement date. Fair Value measurements must maximize the use of observable inputs and minimize the use of unobservable inputs. The hierarchy prioritizes valuation inputs used to measure the fair value of the asset or liability into three broad categories. The inputs or methodology used for valuing securities are not necessarily an indication of the risk associated with investing in those securities. Levels 1, 2, and 3 (lowest priority level) of the fair value hierarchy are defined as follows: Level 1 Inputs using unadjusted quoted prices in active markets or exchanges for identical assets or liabilities. Level 2 Significant other observable inputs, which may include, quoted prices for similar assets or liabilities in active markets, quoted prices for identical or similar assets or liabilities in non-active markets; and inputs other than quoted prices that are observable for the assets or liabilities, either directly or indirectly. Level 3 Valuations for which one or more significant inputs are unobservable and may include situations where there is minimal, if any, market activity for the asset or liability. The bank deposits are valued on the rates directly negotiated with each financial institution and are quoted in an active market, thus classified as Level 1. The commercial paper classified in Level 2 of the fair value hierarchy are valued using other observable inputs other than quoted prices in an active market.
69 - State of Indiana - Comprehensive Annual Financial Report

The following table summarizes the valuation of the TrustINdiana’s investments by the fair value hierarchy levels as of June 30, 2020:
Fair Value Measurements Using
Investment Type June 30, 2020
Quoted Prices in
Active Markets for
Identical Assets
(Level 1)
Significant Other
Observable
Inputs (Level 2)
Fixed Income Securities
U.S Treasuries 19,824$ 19,824$ -$
Commercial Paper 365,530 - 365,530 - -
Certificates of Deposit 16,750 - 16,750 - -
Money Market Mutual Funds 276,726 276,726 -
Total 678,830$ 296,550$ 382,280$
2. Pension and Other Employee Benefit Trust
Funds – Primary Government State Police Pension Fund Investment Policy The Indiana State Police Pension Trust was established in 1937 to provide pension, death, survivor, and other benefits to present and former employees of the department and their beneficiaries who meet the statutory requirement for such benefits. Indiana Code 10-1-2-2(c), established the prudent investor standard as the primary statutory provision governing the investment of the Trust’s assets. IC 10-1-2-2 (c) reads as follows: The trust fund may not be commingled with any other funds and shall be invested only in accordance with Indiana laws for the investment of trust funds, together with such other investments as are specifically designated in the pension trust. Subject to the terms of the pension trust, the Trustee, with the approval of the Department and the Pension Advisory Board, may establish investment guidelines and limits on all types of investments (including, but not limited to, stocks and bonds) and take other action necessary to fulfill its duty as a fiduciary for the trust fund. However, the Trustee shall invest the trust fund assets with the same care, skill, prudence, and diligence, that a prudent person acting in a like capacity and familiar with such matters would use in the conduct of an enterprise of a like character with like aims. The Trustee shall also diversify such investments in accordance with prudent investment standards. There is no formal deposit policy other than compliance to State statute. The following was the SPPT’s adopted asset allocation policy as of June
30, 2020:
Asset Class
Target
Allocation (%)
Broad domestic equity 31.0
Hedge funds 25.0
Core U.S. fixed 22.0
Global ex U.S. equity 11.0
Core real estate 5.0
Short duration fixed income 4.0
Cash and equivalents 2.0
Total 100.0
Credit Risk Credit risk is the risk that an issuer or other counterparty to an investment will not fulfill its obligations. Obligations of the U.S. government or obligations explicitly guaranteed by the U.S. government are not considered to have credit risk and do not require disclosure of credit quality. The following table provides information on the credit quality ratings for investments in debt securities, short term money market funds, bond mutual/commingled funds, municipal securities, asset-backed, and mortgage backed securities for the State Police Pension Trust. The table reflects the “greatest risk” rating (the credit rating reflecting the greatest degree of risk) as set by three nationally recognized rating organizations (S&P, Moody, and Fitch) for each investment type, not exempt from disclosure, in State Police Pension Trust.
Comprehensive Annual Financial Report - State of Indiana - 70

Greatest Risk
Investment Type Ratings Fair Value
U.S. government mortgage backed AA 562$
Collateralized mortgage obligations NR 223
Corporate bonds AAA 214
AA 1,255
A 1,194
BBB 7,434
BB 1,520
B 753
Private placements AA 88
A 260
Municipal bonds AAA 562
AA 1,850
A 601
BBB 506
Mutual/commingled funds NR 118,877
Total 135,899$
Custodial Credit Risk Deposits – The custodial credit risk for deposits is the risk that, in the event of the failure of a depository financial institution, a government will not be able to recover deposits or will not be able to recover collateral securities that are in the possession of an outside party. At June 30, 2020, the balance of the State Police Pension Trust deposits was covered in full by federal depository insurance or by the Public Deposit Insurance Fund, which covers all public funds held in approved depositories. Investment Custodial Credit Risk – The custodial credit risk for investments is the risk that, in the event of the failure of the counterparty to a transaction, a government will not be able to recover the value of investment or collateral securities that are in the possession of an outside party. Investments are exposed to custodial credit risk if the securities are uninsured and unregistered and are either held by the counterparty’s trust department or agent, but not in the name of the customer. None of the Indiana State Police Pension Trust’s investments are exposed to custodial credit risk because they are held in the name of the Indiana State Police Pension Trust. Additionally, the Treasurer of State requires all custodians to indemnify the State against all out-of-pocket expenses or losses incurred as a result of (i) the custodian’s operational failure, (ii) custodians failure to carry out the credit analysis, (iii) custodian’s failure to maintain proper collateral for each loan, or (iv) failure of an approved counterparty to comply with its obligations under the applicable securities lending agreement.
Method Used to Value Investments Investments are reported at fair value. Short-term investments are reported at cost, which approximates fair value. Securities traded on a national or international exchange are valued at the last reported sales price at current exchange rates. Fair value for the majority of fixed income securities is determined by using quoted market prices by independent pricing services. Investments that do not have an established market are reported at estimated fair value, these include commingled funds, private equity funds and hedge funds. The alternative investments are valued using current estimates of fair value obtained from the general partner or investment manager. Holdings are generally valued by a general partner or investment manager on a quarterly basis. Valuation assumptions are based upon the nature of the investment and the underlying business. Additionally, valuation techniques will vary by investment type and involve a certain degree of judgement. Concentration of Credit Risk Concentration of credit risk is the risk of loss attributed to the magnitude of a government's investment in a single issuer. The Indiana State Police Trust has thirty different investments managers. Each investment manager is retained by the Trust to implement a specific investment style and strategy and shall adhere to the specific limitations on holdings outlined in each investment manager’s securities guidelines. The securities guidelines for each investment manager is negotiated and agreed upon in writing on a case-by-case basis and referenced in Appendix D of the Investment Policy Statement.
At June 30, 2020, there were no investments in any one issuer that represents 5% or more of the total investments. Interest Rate Risk Interest rate risk is the risk that changes in interest rates will adversely affect the fair value of the investments. The Fund’s policy for controlling its exposure to interest rate fluctuations should be viewed with the appropriate perspective. A long-term strategy was employed to achieve the Fund’s objectives, but there was consideration given to the short-term liquidity needs to meet disbursements required by the Fund. The asset allocation and investment manager structure was designed to tolerate some interim fluctuations in market value while maintaining a long-term return objective to exceed the actuarial assumed interest rate of 6.75%.
71 - State of Indiana - Comprehensive Annual Financial Report

The following table provides the interest rate risk disclosure for the Indiana State Police Pension Fund:
Investment Maturities (in Years)
Investment Type Fair Value Less than 1 1 - 5 6- 10 More than 10
U.S. treasuries 4,257$ 658$ 2,596$ 1,003$ -$
U.S. government mortgage backed 562 - 141 72 349
Collateralized mortgage obligations 223 - - 223 -
Corporate bonds 12,370 906 5,603 5,861 -
Municipal bonds 3,520 379 1,332 1,809 -
Private placements 347 - 260 87 -
Commingled fixed income funds 118,877 118,877 - - -
Total 140,156$ 120,820$ 9,932$ 9,055$ 349$
Rate of Return For the year ended June 30, 2020, the annual money-weighted rate of return on pension plan investments, net of pension plan investment expense, was 1.45%. The money weighted rate of return expresses investment performance, net of investment expense, adjusted for the changing amount actually invested. Foreign Currency Risk Foreign currency risk is the risk that changes in exchange rates will adversely affect the fair value of an investment or a deposit. The State Police Pension Trust’s foreign currency exposure is focused primarily in international and global equity holdings. The exposure to foreign currency fluctuation is as follows:
Currency Fair Value % of Total Fair Value
Australian Dollar 1,227$ 0.25%
Danish Krone 2,135 0.43%
Euro Currency 4,273 0.86%
Hong Kong Dollar 2,662 0.54%
Japanese Yen 3,463 0.70%
New Zealand Dollar 306 0.06%
Pound Sterling 1,796 0.36%
Swedish Krona 2,214 0.45%
Swiss Franc 1,683 0.34%
Total Foreign Currency 19,759 3.97%
United States Dollar 477,360 96.03%
Total Fair Value: 497,119$ 100.00%
Securities Lending The Treasurer of State is authorized by Indiana Code 5-13-10.5-13 to lend securities. Securities may be lent only if the agreement under which the securities are lent is collateralized by (1) cash or (2) non-cash collateral if the State is indemnified by the custodian holding the non-cash collateral, in excess of the total market value of the loaned securities. The market
value of the required collateral must be in an amount at least equal to 102% of the current market value of the loaned securities. As of June 30, 2020, the State Police Pension Trust did not have any securities on loan and therefore, no credit risk exposure. Fair Value Measurement The Trust categorizes investments measured at fair value within the fair value hierarchy established by generally accepted accounting principles. The hierarchy prioritizes valuation inputs used to measure the fair value of the asset or liability into three broad categories. The inputs or methodology used for valuing securities are not necessarily an indication of the risk associated with investing in those securities. Levels 1, 2 and 3 (lowest priority level) of the fair value hierarchy are defined as follows: Level 1 Inputs using unadjusted quoted prices in active markets or exchanges for identical assets or liabilities. Level 2 Significant other observable inputs, which may include, quoted prices for similar assets or liabilities in active markets, quoted prices for identical or similar assets or liabilities in non-active markets; and inputs other than quoted prices that are observable for the assets or liabilities, either directly or indirectly. Level 3 Valuations for which one or more significant inputs are unobservable and may include situations where there is minimal, if any, market activity for the asset or liability. If the fair value is measured using inputs from different levels in the fair value hierarchy, the measurement should be categorized based on the
Comprehensive Annual Financial Report - State of Indiana - 72

lowest priority level input that is significant to the valuation. The Trust’s assessment of significance of a particular input to the fair value measurement in its entirety required judgment, and considers factors specific to the investment. Investments measured at fair value using net asset value per share (or equivalent) as a practical expedient to fair value are not classified in the fair value hierarchy; however, separate disclosures for these investments are required. Fixed income and equity investments classified in Level 1 of the fair value hierarchy are valued using prices quoted in active markets for identical investments, to the extent these securities are traded. Fixed income investments classified in Level 2 of the
fair value hierarchy are normally valued based on price data obtained from observed transactions and market price quotations from broker dealers and/or pricing vendors. Valuation estimates from service providers’ internal models use observable inputs such as interest rates, yield curves, credit/risk spreads and default rates. Matrix pricing techniques value securities based on their relationship to benchmark quoted prices. Fixed income investments classified in Level 3 include valuations using significant unobservable inputs, valuations using proprietary information, inputs that cannot be corroborated by observable market data and securities valued with last trade date due to limited trading volume.
The following table summarizes the valuation of the investments in the Trust by the fair value hierarchy levels as of June 30, 2020:
Fair Value Measurements Using
Investment Type June 30, 2020
Quoted Prices
in Active
Markets for
Identical Assets
(Level 1)
Significant
Other
Observable
Inputs (Level 2)
Fixed Income Investments
U.S. Treasuries 4,257$ 4,257$ -$
U.S. Government Mortgage Backed 562 - 562
Collateralized Mortgage Obligations 223 - 223
Corporate Bonds 12,370 - 12,370
Private Placements 347 - 347
Municipal Bonds 3,520 - 3,520
Total Fixed Income Securities 21,279 4,257 17,022
Equity Investments
Domestic Equity 57,840 57,840 -
International Equity 19,756 19,756 -
Mutual Funds 131,478 131,478 -
Totat Equity Funds 209,074 209,074 -
Total Investments by Fair Value 230,353 213,331$ 17,022$
Investment measured at the Net Asset Value (NAV)
Commingled Fixed Income Funds 118,877
Multi-Strategy Hedge Funds 47,873
Private Equity 63,744
Total Investments measured at NAV 230,494
Total Investments measured by Fair Value 460,847$
73 - State of Indiana - Comprehensive Annual Financial Report

The valuation methods for investments measured at the NAV per share (or its equivalent) are described below:
Fair
Value
Unfunded
Commitments
Redemption
Frequency (if
Currently
Eligible)
Redemption
Notice Period
Commingled Fixed Income Funds 118,877$ -$ Daily 1 day
Private Equity 63,744 9,965 N/A N/A
Multi-strategy Hedge Funds 47,873 2,298 Semi-Annually 95 days
Total investments measured at the NAV 230,494$ 12,263$
Commingled Fixed Income – There are 3 fixed income funds considered to be commingled in nature. Each are valued at the net asset value of the units held at the end of the period based upon fair value of the underlying securities. Private Equity - Consisting of 12 private equity funds, this strategy invests across a range of strategies, geographies, and industries. These underlying portfolio company investments cannot be redeemed with the funds, but rather the funds will make distributions of capital to the Trust as the funds sell the underlying portfolio company investments. Multi-Strategy Hedge Funds – Consisting of 12 hedge funds that are comprised of investments across hedge fund strategies. Four broad categories are, equity hedge, event driven, macro, and relative value. “Multi” references the multiple underlying sub-strategies within each category. State Employee Retiree Health Benefit Trust Fund-DB Investment Policy The State Retiree Health Benefit Trust Fund – DB fund is comprised of the State Police Retiree Health Benefit Trust Fund (ISPP), the State Personnel Plan Trust Fund (SPP), and the Conservation and Excise Police Trust Fund (CEPP).
The ISPP consists of sections 401(h) and 115 established pursuant to the Internal Revenue Service that are separate accounts established within the State Police Pension Fund for the purpose of paying benefits for sickness, accident, hospitalization, and medical expenses. The assets in this account may be commingled for investment purposes only with the other accounts of the Indiana State Police Pension Fund. The investment authority for these funds, is established under Indiana Code IC 5-10-8-6(d)(2).and 10-12-2-2(c). There is no formal deposit policy other than compliance to State statute. In compliance to State statute, the asset allocation is 100% in fixed income investments.
IC 10-12-2-2(c) reads as follows: The trust fund shall be invested only in accordance with Indiana laws for the investment of trust funds, together with such other investments as are specifically designated in the pension trust. Subject to the terms of the pension trust, the Trustee, with the approval of the Department and the Pension Advisory Board, may establish investment guidelines and limits on all types of investments (including, but not limited to, stocks and bonds) and take other action necessary to fulfill its duty as a fiduciary for the trust fund. However, the Trustee shall invest the trust fund assets with the same care, skill, prudence, and diligence, that a prudent person acting in a like capacity and familiar with such matters would use in the conduct of an enterprise of a like character with like aims. The Trustee shall also diversify such investments in accordance with prudent investment standards. IC 5-10-8-6(d)(2) reads as follows: The treasurer of state shall invest the money in these trust funds not currently needed to meet the obligations of the trust fund in the same manner as other public money may be invested. Indiana Code, Title 5, Article 13, Chapters 9, 10, 10.5, establishes the investment powers and guidelines regarding the State of Indiana investments. The SPP and CEPP were established pursuant to HEA 1123 of the 2012 Indiana General Assembly. The State Personnel Department administers the SPP. The CEPP is administered by the Indiana Alcohol and Tobacco Commission and the Indiana Department of Natural Resources. These trust funds were created to provide for the prefunding of annual required contributions and for covering the OPEB liability of covered individuals. The investment authority for the CEPP is established under IC 5-10-8-6(d)(2). The investment authority for the SPP is established under IC 5-10-8-7(i)(2). Both of these codes sites state: The Treasurer of State shall invest
Comprehensive Annual Financial Report - State of Indiana - 74

monies in these trust funds not currently needed to meet the obligations of the trust funds in the same manner as other public money may be invested. Indiana Code, Title 5, Article13, Chapters 9, 10, and 10.5, establishes the investment powers and guidelines regarding the State of Indiana investments. There are no formal deposit and investment policies for the investment of these funds other than compliance to State statute. In compliance to State statute, the asset allocation is 100% in fixed income investments. State statute does not establish any parameters or guidelines related to the concentration of investment risk, investment credit risk, nor interest rate risk. Effective July 1, 2017, the statutory investment authority changed for all of the State Retiree Health Benefit Trust Fund – DB funds. The new investment authority, under IC 5-10-8-6(d)(2), for the ISPP and the CEPP, and the new investment authority, under IC 5-10-8-7(i)(2), for the SPP, both state, notwithstanding IC 5-13, the treasurer of state shall invest the money in these trust funds in the same manner as money may be invested by the public employees’ retirement fund under IC 5-10-35-5. However, the trustee may not invest the money in the trust in equity securities. Another change to the investment authority, effective July 1, 2019, will allow for the purchase of equities. The trustee shall also comply with the prudent investor rule set forth in IC 30-4-3.5. Credit Risk Credit risk is the risk that an issuer or other counterparty to an investment will not fulfill its obligations. Obligations of the U.S. government or obligations explicitly guaranteed by the U.S. government are not considered to have credit risk and do not require disclosure of credit quality. The following table provides information on the credit quality ratings for investments, not exempt from disclosure, in the State Retiree Health Benefit Trust Fund - DB:
Greatest Risk
Investment Type Ratings Fair Value
U.S. Agencies AA+ 15,012$
Total 15,012$
Custodial Credit Risk
Deposits – The custodial credit risk for deposits is the risk that, in the event of the failure of a depository financial institution, a government will not be able to
recover deposits or will not be able to recover collateral securities that are in the possession of an outside party. At June 30, 2020, the balance of any bank deposits was covered in full by federal depository insurance or by the Public Deposit Insurance Fund, which covers all public funds held in approved depositories. Investment Custodial Credit Risk – The custodial credit risk for investments is the risk that, in the event of the failure of the counterparty to a transaction, a government will not be able to recover the value of investment or collateral securities that are in the possession of an outside party. Investments are exposed to custodial credit risk if the securities are uninsured and unregistered and are either held by the counterparty’s trust department or agent, but not in the name of the State of Indiana. None of the State’s investments are exposed to custodial credit risk because they are held in the name of the State of Indiana. Additionally, the Treasurer of State requires all custodians to indemnify the State against all out-of-pocket expenses or losses incurred as a result of (i) the custodian’s operational failure, (ii) custodians failure to carry out the credit analysis, (iii) custodian’s failure to maintain proper collateral for each loan, or (iv) failure of an approved counterparty to comply with its obligations under the applicable securities lending agreement. Concentration of Credit Risk – Concentration of credit risk is the risk of loss attributed to the magnitude of a government's investment in a single issuer representing 5% or more of the total investments. The only exemptions from disclosures are US Government Debt, US Government Guaranteed Investments, Mutual Funds, or External Investment Pools. Investments in any one issuer, not exempt from disclosure, that represent 5% or more of the total investments (in thousands) were:
FNMA 6.44% $15,012 Rate of Return - For the year ended June 30, 2020, the annual money-weighted rate of return on investments, net of investment expense, for the three OPEB plans administered through trusts was:
SPP ISPP CEPP
1.7% 1.4% 1.3%
The money-weighted rate of return expresses investment performance, net of investment expense, adjusted for the changing amounts actually invested.
75 - State of Indiana - Comprehensive Annual Financial Report

Foreign Currency Risk
Foreign currency risk is the risk that changes in exchange rates will adversely affect the fair value of an investment or a deposit. There was no foreign currency risk.
Securities Lending
The Treasurer of State is authorized by Indiana Code 5-13-10.5-13 to lend securities. Securities may belent only if the agreement under which the securitiesare lent is collateralized by (1) cash or (2) non-cashcollateral if the State is indemnified by the custodianholding the non-cash collateral, in excess of the totalmarket value of the loaned securities..
At year end, there were no securities on loan and therefore, no credit risk exposure.
Interest Rate Risk
Interest rate risk is the risk that changes in interest rates will adversely affect the fair value of an investment
The following is a summary of the Interest Rate Risk Disclosure as of June 30, 2020:
Investment Maturities
(in Years)
Investment Type Fair Value Less than 1 1 - 5
U.S. Treasuries 212,855$ 212,855$ -$
U.S. Agencies 15,012 - 15,012
Total Fixed Income Securities 227,867$ 212,855$ 15,012$
Fair Value Measurement
The State Retiree Health Benefit Trust – DB funds categorizes investments measured at fair value within the fair value hierarchy established by generally accepted accounting principles. The hierarchy prioritizes valuation inputs used to measure the fair value of the asset or liability into three broad categories. The inputs or methodology used for valuing securities are not necessarily an indication of the risk associated with investing in those securities. Levels 1, 2, and 3 (lowest priority level) of the fair value hierarchy are defined as follows:
Level 1 Inputs using unadjusted quoted prices in active markets or exchanges for identical assets or liabilities.
Level 2 Significant other observable inputs, which may include, quoted prices for similar assets or liabilities in active markets, quoted prices for identical or similar assets or liabilities in non-active markets; and inputs other than quoted prices that are observable for the assets or liabilities, either directly or indirectly.
Level 3 Valuations for which one or more significant inputs are unobservable and may include situations where there is minimal, if any, market activity for the asset or liability.
US Treasury securities classified in Level 1 of the fair value hierarchy are valued using prices quoted in active markets for those securities. The debt securities classified in Level 2 of the fair value hierarchy are valued using other observable inputs other than quoted prices in an active market.
The following table summarizes the valuation of the investments by the fair value hierarchy levels as of June 30, 2020:
Fair Value Measurements Using
Investment Type June 30, 2020
Quoted Prices
in Active
Markets for
Identical Assets
(Level 1)
Significant
Other
Observable
Inputs (Level 2)
U.S. Treasuries 212,855$ 212,855$ -$
U.S. Agencies 15,012 - 15,012
Total Fixed Income Securities 227,867$ 212,855$ 15,012$
Comprehensive Annual Financial Report - State of Indiana - 76

3. Pension Trust Funds – Fiduciary in NatureComponent Unit
Indiana Public Retirement System
Investment Guidelines and Limitations
Oversight of INPRS assets is the fiduciary
responsibility of the INPRS Board. As stated in IC 5-
10.3-5-3 (a) and IC 5-10.4-3-10 (a) “The Board shall
invest its assets with the care, skill, prudence, and
diligence that a prudent person acting in a like
capacity and familiar with such matters would use in
the conduct of an enterprise of a like character with
like aims.” Accordingly, the INPRS Board must
sufficiently diversity the portfolio to minimize the risk
of large losses unless, under the circumstances, it is
clearly prudent not to do so. Primary risk measures
are volatility in the plan’s assets, funded status, and
the contribution rates.
Indiana law permits the INPRS Board to establish
investment guidelines and limits on all types of
investments and take other actions necessary to
fulfill its duty as a fiduciary for all assets under its
control. On June 30, 2020, cash and investments
were held by banks or trust companies under
custodial agreements with INPRS. The Investment
Policy Statement, adopted by the Board, includes
target asset allocations and allowable ranges that
are expected to meet rates of return over a period
while minimizing risk.
The following global asset classes, target
allocations, and target ranges were approved by the
INPRS Board on October 23, 2015 for defined
benefit funds, based on a formal asset-liability study
and shall remain in place until revised by the INPRS
Board. An asset-liability study is conducted every
five years.
Global Asset Classes
Target
Allocation - %
Target
Range - %
Public Equity 22 19.5-24.5
Private Markets 14 10-18
Fixed Income - Ex
Inflation - Linked
20 17-23
Fixed Income - Inflation -
Linked
7 4-10
Commodities 8 6-10
Real Estate 7 3.5-10.5
Absolute Return 10 6-14
Risk Parity 12 7-17
The defined contribution plans are structured to
provide members with a choice of diverse investment
options that offer a range of risk and return
characteristics appropriate for members. Members
can self-direct their investment options or leave their
contributions invested in the default target date
retirement fund. The offered investment options
undergo periodic reviews by the INPRS Board.
The State Death Benefit Fund and Retirement
Medical Benefits Account Plan are 100 percent
invested in intermediate fixed income investments in
a commingled fund. The Local Public Safety Pension
Relief Fund is invested 100 percent in high-quality,
short-term money market instruments.
Rate of Return
The money-weighted rate of return expresses investment performance, net of investment expenses, adjusted for the changing amounts invested. For the year ended June 30, 2020, the annual money-weighted rate of return on defined benefit pension trust fund investments, net of pension plan investment expenses is as follows:
Defined Benefit Pension Trust Funds
Annual Money
Weighted Rate
of Return
Public Employees' Retirement Fund - DB 2.58%
Teachers' Retirement Fund Pre-1996 - DB 2.76%
Teachers' Retirement Fund 1996 - DB 2.58%
1977 Police Officers' and Firefighters'
Pension and Disability Fund 2.57%
Judges' Retirement System 2.57%
State Excise Police, Gaming Agen, Gaming
Control Officer, and Conservation
Enforcement Officers' Retirement Plan 2.57%
Prosecuting Attorneys' Retirement Fund 2.60%
Legislators' Defined Benefit Plan 2.64%
Custodial Credit Risk for Deposits
Custodial credit risk for deposits is the risk that in the
event of a bank failure, INPRS’s deposits may not be
returned. Deposits are exposed to custodial credit
risk if they are not covered by depository insurance,
and the deposits are uncollateralized or
collateralized with securities held by the pledging
financial institution. At June 30, 2020, $460 million of
cash deposits were uninsured and uncollateralized
and therefore exposed to credit risk. The following
table shows cash deposits and short-term
investments as of June 30, 2020
77 - State of Indiana - Comprehensive Annual Financial Report

Cash Deposits Total
Demand Deposit Account – Bank
Balances (Insured by FDIC up to
$250 thousand per financial
institution) 4,067$
Held with Custodian Bank
(Uncollateralized) 456,152
Short-term Investment Funds held
at Bank (Collateralized) 862,407
Total 1,322,626$
Custodial Credit Risk for Investments
Custodial credit risk for investments is a risk if the
securities are uninsured, are not registered in the
name of INPRS, and are held by either the
counterparty or the counterparty’s trust department
or agent, but not in the name of INPRS. INPRS’s
custody agreement with the custodian requires the
custodian to segregate the securities on the
custodian’s books and records from the custodian’s
property. In addition, investment managers are not
allowed, under any circumstances, to take
possession, custody, title, or ownership of any
managed assets.
Method Used to Value Investments Public Equity investments are comprised of domestic and international stocks as well as commingled equity instruments. Equity securities traded on a national or international exchange are valued at the official closing price or last reported sales price of the instrument. International equities are then adjusted to reflect the exchange rate as of June 30, 2020 of the underlying currency. Commingled equities are not traded on a national security exchange and are valued at the net asset value of the units held at June 30, 2020 based on the fair value of the underlying securities. Private Market investments are valued using current estimates of fair value obtained from the general partner or investment manager. Holdings are generally valued by a general partner or investment manager on a quarterly or semi-annual basis. Investments in private markets are generally considered illiquid long-term investments. Due to the inherent uncertainty that exists in the valuation of alternative investments, the realized value upon sale of an asset may differ significantly from the fair value. Fixed income securities are comprised of U.S. government, U.S. government-sponsored agencies, publicly traded debt and commingled investment debt instruments. Securities traded on a national and
international exchanges are valued based on published market prices and quotations. Securities that are not traded on a national security exchange are valued using a matrix pricing approach. Commingled securities are valued at the net asset value of the units held as of June 30, 2020 based on the fair value of the securities.
Commodities including derivative instruments are
reported at fair value and involve, to varying degrees,
elements of market risk to the extent of future market
movements in excess of amounts recognized in the
financial statements. Derivative instruments are
considered investments and not hedges for
accounting purposes. The fair value of all derivative
financial instruments is reported in the Statement of
Fiduciary Net Position. The change in the fair value
is recorded in the Statement of Changes in Fiduciary
Net Position as Net Investment Income/(Loss).
Gains and losses arising from this activity are
recognized in the Statement of Changes in Fiduciary
Net Position as incurred.
Real Estate, Absolute Return, and Risk Parity
investments are valued by the manager or
independent appraiser based on reported net asset
values, cash flow analysis, purchases and sales of
similar investments, new financings, economic
conditions, other practices used with the industry, or
other information provided by the underlying
investment advisors. Due to the inherent uncertainty
in privately held securities, the fair value may differ
from the values that would have been used if a ready
market for such securities existed, and the
differences can be material.
INPRS relies on third party resources to verify the
methodology and calculation used for investment
valuation and performance metric reported by the
custodian.
Interest Rate Risk
Interest rate risk is the risk changes in interest rates
adversely affect the fair value of the investments.
Duration is a measure of interest rate risk. The longer
a fixed-income investment is to maturity, the more
susceptible the value of the fixed-income investment
is to market interest rate changes. The Investment
Policy Statement recognizes interest rate risk as a
market risk factor. While INPRS does not have a
formal stated policy regarding interest rate risk, it is
monitored regularly at the Plan level, and within the
fixed income asset classes, as part of achieving the
long-term actuarial rate of return.
Comprehensive Annual Financial Report - State of Indiana - 78

As of June 30, 2020 the duration of the fixed income portfolio is as follows. The $2.03 billion, for which no duration
was available, is primarily made up of cash and commingled debt funds:
Debt Security Type Fair Vale
% of All
Debt
Securities
Portfolio
Weighted Average
Effective Duration
(Years)
Short Term Investments
Short Term Investments 862,407$ 6.9 0.08
U.S. Treasury Obligations 196,088 1.6 0.19
Total Short-Term Investments 1,058,495 8.5
Fixed Income Investments
U.S. Governments 4,487,842 36.1 15.54
U.S. Agencies 402,207 3.2 4.47
Non-U.S. Government 3,020,863 24.3 9.08
Corporate Bonds 1,250,410 10.1 8.41
Asset-Backed Securities 161,905 1.3 4.33
Duration Not Available 2,034,050 16.4 N/A
Total Fixed Income Investments 11,357,277 91.5
Total Debt Securities 12,415,772$ 100.0
Credit Risk
Credit risk is the risk that an issuer or other
counterparty to an investment will not fulfill its
obligations. In accordance with the Investment
Policy Statement, when building the most diversified
investment portfolio, emphasis is laid on risk
allocation, not capital allocation. As a result, INPRS
regularly monitors success in achieving the targeted
risk diversification that is inherent in the approved
asset allocation.
Credit ratings, obtained from several industry rating
services for Fixed Income Securities and Short-Term
Investments are shown in the table below. The most
conservative rating of Standard and Poor’s,
Moody’s, and Fitch are utilized in the schedule
below.
Short-Term Investments excludes cash with
custodian of approximately $456 million. Unrated
investments primarily consist of money market
sweep vehicles, private placement, term loans and
asset-backed securities, commercial mortgages,
CMO/REMIC's, and commingled debt funds.
Credit Rating
Short-Term
Investments
Fixed
Income
Securities Total
Percentage
of All Debt
Securities
AAA -$ 588,719$ 588,719$ 4.7
U.S. Government Guaranteed - 4,901,909 4,901,909 39.5
AA 196,088 1,179,706 1,375,794 11.1
A - 720,454 720,454 5.8
BBB - 1,026,003 1,026,003 8.3
BB - 309,861 309,861 2.5
B - 242,144 242,144 2.0
Below B - 246,391 246,391 2.0
Unrated 862,407 2,142,090 3,004,497 24.2
Total 1,058,495$ 11,357,277$ 12,415,772$ 100.0
Concentration of credit risk is the risk of loss which
may arise in the event of default by a single issuer.
The INPRS Investment Policy Statement recognizes
issuer risk as a strategic risk factor that is monitored
on an absolute and relative basis. At June 30, 2020,
single issuer exposure in the portfolio did not exceed
79 - State of Indiana - Comprehensive Annual Financial Report

5 percent of the Fiduciary Net Position.
INPRS Investment Policy Statement places
concentration limits on assets placed with an
investment manager. No investment manager will manage more than 10 percent of the INPRS assets in actively managed portfolios at the time of funding. Through capital appreciation and additional purchases, no investment manager will be allowed to manage more than 15 percent of the system’s assets in actively managed portfolios without Board approval. No investment manager will manage more than 15 percent of the INPRS assets in passively managed portfolios at the time of funding. Through capital appreciation and additional purchases, no
investment manager will be allowed to manage more than 20 percent of the system’s assets in passively managed portfolios without Board approval No investment manager will manage more than 25 percent of the INPRS assets in a combination of actively and passively managed portfolios.
Foreign Currency Risk
Foreign currency risk is the risk changes in exchange
rates will adversely affect the fair value of an
investment. INPRS has defined a foreign exchange
risk management policy to effectively manage the
Fund’s performance volatility associated with foreign
currency risk.
INPRS exposure to foreign currency risk at June 30, 2020, is as follows:
Investment Held in Foreign Currency
Currency Short Term
Fixed
Income Equity
Other
Investments Total % of Total 1
Argentina Peso 2,307$ 381$ -$ -$ 2,688$ - %
Australian Dollar 805 83,495 92,902 (81,899) 95,303 0.3
Brazilian Real (201) 15,775 55,911 18,501 89,986 0.3
Canadian Dollar (3,837) 135,426 95,662 (129,772) 97,479 0.3
Chilean Peso 1 1,918 66 6,331 8,316 -
Chinese R Yuan HK - - - 14,770 14,770 -
China Yuan Renminbi 84 374 62,302 (12) 62,748 0.2
Colombian Peso 531 22,333 - (3,760) 19,104 0.1
Czech Koruna 416 11,710 108 9,019 21,253 0.1
Danish Krone 1,657 14,187 46,073 (14,574) 47,343 0.1
Dominican Rep Peso - 3,698 - - 3,698 -
Euro Currency Unit 12,003 1,249,433 607,145 (1,215,932) 652,649 1.8
Hong Kong Dollar 366 - 212,878 699 213,943 0.6
Hungarian Forint (26) 10,592 206 3,006 13,778 -
Indian Rupee 39 34 59,727 (4,655) 55,145 0.2
Indonesian Rupiah 393 40,451 2,404 (1,679) 41,569 0.1
Israeli Shekel 1,236 6,197 2,429 (9,948) (86) -
Japanese Yen 11,927 434,473 471,276 (435,793) 481,883 1.3
Malaysian Ringgit 1,158 20,481 2,441 (7,559) 16,521 -
Mexican Peso (564) 63,672 12,049 (19,428) 55,729 0.2
New Taiwan Dollar 163 - 75,760 (5,989) 69,934 0.2
New Zealand Dollar 102 4,958 1,995 (5,511) 1,544 -
Norwegian Krone 939 3,264 3,634 1,241 9,078 -
Peruvian Sol 259 28,600 - (11,978) 16,881 0.1
Philipines Peso - 377 305 - 682 -
Polish Zloty 1,022 32,332 3,229 301 36,884 0.1
Pound Sterling 4,057 522,584 231,706 (527,148) 231,199 0.6
Qatari Riyal - - 1,427 - 1,427 -
Romania Leu - 2,080 - 6,710 8,790 -
Russian Ruble (New) 53 36,047 - 5,335 41,435 0.1
Singapore Dollar 657 6,965 12,043 (8,148) 11,517 -
South African Rand (40) 43,223 39,428 (10,092) 72,519 0.2
South Korean Won 1,296 - 117,696 1,173 120,165 0.3
Swedish Krona 1,260 68,406 51,537 (68,369) 52,834 0.1
Swiss Franc 4,534 - 189,589 212 194,335 0.5
Thailand Baht 44 20,006 7,479 5,556 33,085 0.1
Turkish Lira 109 8,089 8,673 (4,103) 12,768 -
UAE Dirham - - 877 - 877 -
Uruguayan Peso - 619 - - 619 -
Total 42,750$ 2,892,180$ 2,468,957$ (2,493,495)$ 2,910,392$ 7.9 %
(1) Total of foreign currency risk, as a percentage of all pooled investments.
Comprehensive Annual Financial Report - State of Indiana - 80

Securities Lending
The INPRS Board has authorized the custodian to
enter into a securities lending program agreement
under which securities held by the custodian on
behalf of INPRS may be loaned. The purpose of
such a program is to provide additional revenue. The
policy requires that securities are loaned in
exchange for cash or securities collateral equal to
approximately 102 percent of the market value of
domestic securities on loan and 105 percent of the
market value of international securities on loan, with
a simultaneous agreement to return the collateral for
the same securities in the future. In no event shall
the acceptable collateral be less than the total
market value of loaned securities. Securities shall
not be loaned in excess of 40% of the market value.
The custodian and/or securities lending sub-agent is
required to provide agreed upon indemnification to
INPRS from and against any losses, damages,
costs, and expenses which arise from a borrower
defaulting on a loan or filing for bankruptcy. In
addition, a maximum of 25% of the cash collateral
may be invested with a single counterparty and all
collateral investments have a maturity of the next
business day.
At June 30, 2020, INPRS had no security lending
credit risk exposure as the collateral pledged of $473
million exceeded the fair value of securities on loan,
as shown below. All reinvested cash collateral
investments consist of repurchase agreements
which are not rated by any of the rating agencies.
Security Type
Fair Value of
Securities on
Loan
U.S. Governments 127,245$
Corporate Bonds 19,926
International Bonds 11,303
Domestic Equities 221,440
International Equities 77,175
Total 457,089$
Repurchase Agreements
A repurchase agreement is an agreement in which
cash is transferred to a broker-dealer or financial
institution in return for transfer of security to the
custodian and promise to repay cash plus interest.
An obligation under a reverse repurchase agreement
is the same as a repurchase agreement but from the
perspective of the buyer rather than the seller.
Obligations under reverse repurchase agreements
are liabilities whereby security collateral is held at the
broker dealer or financial institution’s custodian.
INPRS’s Investment Policy Statement allows
prudent use of securities lending, repurchase, and
reverse repurchase agreements. Repurchase
agreements that may create explicit leverage in the
portfolio are prohibited; however, repurchase
transactions (including tri-party repurchase
transactions) collateralized with U.S. government
securities are permitted. Repurchase transactions
are required to be collateralized at 102 percent at
time of purchase and market to market on each
business day.
Investments under Repurchase Agreements
(exclusive of Securities Lending) at June 30, 2020,
are as follows. At June 30, 2020, INPRS had no
reverse repurchase agreement credit risk exposure
since the cash collateral value posted was less than
the fair value of the liability held.
Repurchase Agreements by
Collateral Type
Cash
Collateral
Received Fair Value
U.S. Treasury 7,080$ 7,080$
Obligations Under Reverse
Repurchase Agreements by
Collateral Type
Cash
Collateral
Posted Fair Value
U.S. Treasury $ 387,498 $ 381,665
Fair Value Measurement INPRS investments are measured at fair value with the fair value hierarchy established by GASB Statement No. 72. The categorization of the investments within the hierarchy is based upon the valuation transparency of the instrument and should not be perceived as the risk of the particular investment. The three-tier hierarchy is summarized as follows: Level 1 – Unadjusted quoted prices for identical instruments in active markets. Level 2 – Quoted prices in active markets; quoted prices for identical or similar instruments in markets that are not active, and model-derived valuations in which all significant inputs are observable. Level 3 – Valuations reflect practices where significant inputs are unobservable. U.S. Treasury Obligations generally include investments in money market securities that are reported at either fair value or at cost plus accrued interest, which approximates market or fair value.
81 - State of Indiana - Comprehensive Annual Financial Report

Equity, U.S. corporate obligations, U.S. government and derivative securities classified in Level 1 are valued using prices quoted in active markets for those securities. Debt and derivative securities classified in Level 2 are valued using either a bid evaluation or a matrix based pricing technique. Bid evaluations are typically based on market quotations, yields, maturities, call features, and ratings. Matrix pricing is used to value securities based on the securities’ relationship to benchmark quoted prices. Index linked debt securities are valued by multiplying the external market price by the applicable day’s index ratio. Level 2 debt securities have non-proprietary information that is readily available to market participants, from multiple independent sources, which are known to be actively involved in the market. Equity and equity derivatives classified in
Level 2 are securities whose values are derived daily from associated traded securities. Investments classified as Level 3 are valued using best available sources such as property appraisals, discounted cash flow models, and public market comparisons of similar assets where applicable. The values are supplied by advisors or general partners who hold those or similar assets in investment vehicles they oversee. These pricing sources may or may not be indicative of realizable exit values attainable for the assets. Investments that are measured at fair value using the Net Asset Value (NAV) are not classified in the fair value hierarchy. The NAV for these investments is provided by the investee and may be sold at an amount different than NAV. To manage risk relating to Absolute Return investments, assets are placed in limited liability vehicles to protect INPRS from losing more than its invested capital.
At June 30, 2020, the fair value of investments categorized by Level 1, 2 and 3 is as follows:
Fair Value Measurements Using
Investment Type (1) June 30, 2020
Quoted Prices in
Active Markets
for Identical
Assets (Level 1)
Significant Other
Observable Inputs
(Level 2)
Significant
Unobservable
Inputs (Level 3)
Investments Measured at Amortized Cost
Short Term Investments (2) 806,876$
Cash at Brokers 456,152
Repurchase Agreements 7,080
Securities Lending Collateral 158,656
Pooled Short Term Investments (2) 2,452,016
Total Investments Measured at Amortized Cost 3,880,780
Investments by Fair Value Level
Pooled Short Term Investments (2)
BNY - Mellon Cash Reserves 20,255 -$ 20,255$ -$
U.S. Treasury Obligations 196,088 196,088 - -
Total Pooled Short Term Investments 216,343 196,088 20,255 -
Fixed Income Investments
U.S. Governments 4,481,443 4,481,160 283 -
Non-U.S. Governments 3,439,282 664 3,426,947 11,671
U.S. Agencies 398,559 - 398,559 -
Corporate Bonds 1,051,686 6,682 809,607 235,397
Asset-Backed Securities 224,668 - 224,668 -
Total Fixed Income Investments 9,595,638 4,488,506 4,860,064 247,068
Equity Investments
Domestic Equities 4,624,660 4,619,692 4,968 -
International Equities 3,139,479 3,138,329 1,150 -
Total Equity Investments 7,764,139 7,758,021 6,118 -
Total Investments by Fair Value Level 17,576,120 12,442,615$ 4,886,437$ 247,068$
Investments Measured at the Net Asset Value (NAV)
Commingled Short Term Funds 35,276
Commingled Fixed Income Funds 1,761,639
Commingled Equity Funds 1,921,287
Private Markets 4,045,075
Absolute Return 3,260,111
Real Estate 1,808,708
Risk Parity 4,115,539
Total Investments Measured at the Net
Asset Value (NAV) 16,947,635
Investment Derivatives
Total Futures 45,139 45,139$ -$ -$
Total Options (177) - (177) -
Total Swaps (30,897) - (30,897) -
Total Investment Derivatives 14,065 45,139$ (31,074)$ -$
Total Investments (less Securities Lending
Collateral) 38,418,600$
(2) Short Term Investments include highly liquid assets, both pooled and non-pooled that are an integral part of the pension investments.
(1) The amounts disclosed above will differ from the Asset Allocation Summary. The investment type combines assets according to the
security type assigned to each investment by the Custodian. The Asset Allocation Summary groups assets according to the investment
objective of each investment manager.
Comprehensive Annual Financial Report - State of Indiana - 82

The valuation method for investments measured at the net asset value (NAV) per share or equivalent, at June 30, 2020, is presented as follows:
Fair Value
Unfunded
Commitments
Redemption Frequency (if
Currently Eligible)
Redemption
Notice
Period
Commingled Short Term Funds (1) 35,276$ -$ Daily 1 day
Commingled Fixed Income Funds (1) 1,761,639 - Daily 1 day
Commingled Equity Funds (1) 1,921,287 - Daily 1 day
Private Markets (2) 4,045,075 3,365,752 Not Eligible N/A
Real Estate Funds (3) 1,808,708 866,021 Quarterly 30-90 days
Absolute Return (4) 3,260,111 - Monthly, Quarterly, Semi-Annually 30-120 days
Risk Parity (5) 4,115,539 - Daily, Weekly, Monthly 3-5 days
Total 16,947,635$ 4,231,773$
(1) Commingled Short Term, Fixed Income and Equity Funds - There are three short term funds, fifteen fixed income funds and three equity funds, which are considered to be commingled in nature. These investments are valued at the net asset value of the units held at June 30, 2020, based upon fair value of the underlying securities. (2) Private Markets - There are 277 funds that invest across a range of strategies, geographies, and industries within private equity and private credit. The underlying portfolio investments cannot be redeemed with each fund, but rather the fund will make distributions of capital as the fund liquidates the underlying portfolio investments over the typical 10 year term in the case of private equity, and the typical 7 year term in the case of private credit. (3) Real Estate Funds - There are 42 funds invested primarily in U.S. commercial real estate, of which 36 funds are classified as illiquid, or approximately 57 percent of the value of the real estate fund investments. These funds have underlying portfolio investments that cannot be redeemed with the funds, but rather these funds will make distributions of capital as the funds liquidate their underlying portfolio investments over the average 10 year life of the funds. There are six real estate funds that have been classified as liquid due to the open-end structure of the fund. Open-end funds generally offer periodic distributions of net cash flow, which can be reinvested, as well as quarterly redemption windows. (4) Absolute Return - The portfolio consists of 34 fund holdings that cover a broad spectrum of investment strategies and investment horizons which result in distinct fund redemption terms to prevent asset-liability mismatches. These funds attempt to generate returns in excess of the plan’s target actuarial rate of return over a full market cycle with minimal beta to the plan’s primary long-only market exposures (equities, credit, rates, and
commodities). Fund redemption periods range from weeks (alternative beta) to years (drawdown vehicles), but as a whole, on a weighted-average basis, the portfolio maintains a liquidity profile of less than one year. The valuation process for the funds are comparable to private markets, with quarterly valuations. (5) Risk Parity - This portfolio, which consists of three funds is constructed to accrue various asset class risk premiums, including equity, without long-term reliance on any single asset class. The structure of these investments provides a reasonable level of liquidity and investments may be redeemed in accordance to the terms set forth by each investment management agreement. Investments are considered to be liquid, market-priced instruments, and 100 percent of the NAV is independently calculated by the fund administrators. Fair values are reported as NAV per share. It is probable that illiquid investments will be sold at an amount different from the NAV of the ownership interest in partners’ capital. Therefore, the fair values of the investments in this type have been estimated using recent observable transaction information for similar investments and non-binding bids received from potential buyers of the investments (one quarter in arrears plus current quarter cash flows). Derivative Financial Instruments - Activity
A derivative is a contract between two or more
parties whose value is based on an agreed-upon
underlying financial asset (similar to a security) or set
of assets (similar to an index). Common underlying
instruments include bonds, commodities, currencies,
interest rates, market indexes, and stocks. The
following derivative instruments are included in
Investments:
83 - State of Indiana - Comprehensive Annual Financial Report

Futures A futures contract is an agreement between two parties to buy and sell a financial instrument at a set price on a future date.
Options Options are agreements that give the owner of the option the right, but not obligation, to buy (in the case of a call) or to sell (in the case of a put) a specific amount of an asset for a specific price on or before a specified expiration date.
Swaps Swaps are derivative instruments in which one party exchanges a stream of fixed cash flows for floating cash flows. A notional amount of principal is required to compute the actual cash amounts and is determined at the inception of the contract.
Currency Exchange Forwards A currency exchange forward contract is a commitment to purchase or sell a foreign currency at a future date at a negotiated forward rate. A contract is classified as a forward contract when the settlement date is more than two days after the trade date.
The following table summarizes INPRS’ derivative instruments outstanding as of June 30, 2020:
Investment Derivatives
Change in
Fair Value Fair Value Notional
Futures
Index Futures - Long 355$ 355$ 26,664$
Index Futures - Short (1) (1) (2,085)
Commodity Futures - Long 41,094 41,094 2,158,061
Fixed Income Futures - Long 4,083 4,083 548,661
Fixed Income Futures - Short (392) (392) (293,847)
Total Futures 45,139 45,139 2,437,454
Options
Currency Spot Options Bought (222) 8 23,749
Interest Rate Options Bought (33) 36 1,150
Interest Rate Options Written 44 (24) 3,270
Credit Default Index Swaptions Written (36) (197) 99,200
Total Options (247) (177) 127,369
Swaps
Interest Rate Swaps - Pay Fixed Receive Variable (32,067) (33,725) 302,831
Interest Rate Swaps - Pay Variable Receive Fixed 3,051 3,260 193,595
Inflation Swaps - Pay Fixed Receive Variable 353 326 4,600
Zero Coupon Swaps - Pay Fixed Receive Variable (1,578) (2,795) 91,034
Zero Coupon Swaps - Pay Variable Receive Fixed 997 1,001 43,688
Credit Default Swaps Single Name - Buy Protection (360) (262) 20,420
Credit Default Swaps Single Name - Sell Protection (218) (453) 67,462
Credit Default Swaps Index - Buy Protection (222) 117 61,991
Credit Default Swaps Index - Sell Protection 2,002 1,634 246,809
Total Swaps (28,042) (30,897) 1,032,430
Total Derivatives 16,850$ 14,065$ 3,597,253$
Comprehensive Annual Financial Report - State of Indiana - 84

The table below summarizes the swap maturity profile of derivative instruments as of June 30, 2020.
Swap Maturity Profile at June 30, 2020
Swap Type < 1 yr 1 - 5 yrs 5 -1 0 yrs 10 - 20 yrs 20 + yrs Total
Interest Rate Swaps - Pay Fixed Receive Variable -$ (3,457)$ (9,337)$ (301)$ (20,630)$ (33,725)$
Interest Rate Swaps - Pay Variable Receive Fixed - 1,501 1,693 66 - 3,260
Inflation Swaps - Pay Fixed Receive Variable - - - 326 - 326
Zero Coupon Swaps - Pay Fixed Receive Variable - (992) (1,757) (46) - (2,795)
Zero Coupon Swaps - Pay Variable Receive Fixed - 1,001 - - - 1,001
Credit Default Swaps Single Name - Buy Protection - (262) - - - (262)
Credit Default Swaps Single Name - Sell Protection 34 (487) - - - (453)
Credit Default Swaps Index - Buy Protection - 117 - - - 117
Credit Default Swaps Index - Sell Protection - 2,449 (833) - 18 1,634
Total Swap Fair Value 34$ (130)$ (10,234)$ 45$ (20,612)$ (30,897)$
Derivative Financial Instruments – Risk
Management
INPRS’s Investment Policy Statement allows derivatives transactions by investment managers who possess recognized expertise in derivative overlay strategies to offset, or hedge, unintended market exposures in underlying funds that remain in a lock-up period. Direct purchases of physical commodities is prohibited; however, swaps and instruments that constitute a security or authorized derivatives are permitted. INPRS effectively manages credit risk relating to derivative instruments by following these guidelines: 1) To avoid counterparty risk, derivative transactions are executed through the use of listed options and futures traded on registered exchanges, whenever possible. Non-exchange traded options, forwards, or swaps are executed only if the counterparty is rated “A” or better by at least one of the Nationally Recognized Statistical Rating Organizations (“NSRSOs”), 2) Exchange-traded commodity futures, options, and other instruments are traded on any exchange regulated by the Commodities Futures Trading Commission (“CFTC”) of the United States and/or the Financial Services Authority (“FSA”) of the United Kingdom. 3) For non-exchange traded derivatives, counterparty creditworthiness is at a minimum of “A3” as defined by Moody’s Investor Service, “A-” by Standard & Poor’s, and/or “A-” by Fitch. Unrated counterparties are not selected unless such counterparty is a wholly-owned affiliate of a parent organization that guarantees payment and meets the above counterparty creditworthiness
standards. 4) Derivative instruments are standardized and exchange-traded (e.g., futures) and/or privately-negotiated and over-the counter (e.g., swap agreements). Underlying risk exposures may be to cash commodities and/or commodity derivatives. Risk exposures for exchange-traded instruments shall lie with exchange clearinghouses and with approved counterparties for non-exchange traded transactions. 5) The market value of commodities collateral is maintained at 100 percent or greater of the net option-adjusted notional value of any commodities overlay exposure at the consummation of any new commodities overlay position. If the collateral market value falls below the net option-adjusted value of the overlay, the investment manager(s) adjust their portfolio at the earliest feasible opportunity to bring the collateral value up to the notional value of the overlay.
Derivative Financial Instruments – Counterparty
Credit Risk Counterparty credit risk exists on all open over-the-counter positions. INPRS investment managers seek to control this risk through counterparty credit evaluations and approvals, counterparty credit limits, posting collateral exposure, and monitoring procedures, in addition to adherence to the standard International Swaps and Derivatives Association and Credit Support Annex agreements. As of June 30, 2020, the aggregate fair value of investment derivatives in an asset position subject to counterparty credit risk was approximately $15.3 million, of which $15 million was uncollateralized.
85 - State of Indiana - Comprehensive Annual Financial Report

The table below summarizes the counterparty positions as of June 30, 2020:
Fair Value Collateral
Swaps Counterparty
S&P
Rating
Receivable/
Unrealized
Gain
Payable/
(Unrealized
Loss)
Fair
Value Posted Received
Bank of America A- 24$ (2)$ 104$ -$ (150)$
Banque Nationale De Paris A+ 4 - - 370 (1,410)
Barclays BBB 68 - 45 230 (250)
Chicago Mercantile Exchange AA- 6,537 (29,399) (25,276) - -
Citigroup, Inc. BBB+ 90 (12) 18 740 -
Deutsche Bank BBB+ 143 (283) (69) 60 -
Goldman Sachs BBB+ 178 (174) (163) 346 (2,930)
HSBC Securities Inc A- 18 (18) (18) 1,460 (2,400)
Intercontinental Exchange, Inc. A 4,693 (2,974) (165) 551 -
JPMorgan Chase Bank A- 3 (78) (50) 790 (1,647)
London Clearing House A 3,569 (10,106) (6,914) - -
Morgan Stanley BBB+ 21 (345) 1,591 - (2,800)
Total 15,348$ (43,391)$ (30,897)$ 4,547$ (11,587)$
Derivative Financial Instruments – Foreign Currency
Risk Foreign currency forward contracts and futures contracts are exposed to foreign currency risk. At June 30, 2020, INPRS’s investments included a foreign currency contract receivable balance of $7.2 billion and an offsetting foreign currency contract payable of $7.2 billion. The net gain recognized for the year ended June 30, 2020, due to foreign currency transactions was $18.4 million.
Derivative Financial Instruments – Synthetic
Guaranteed Investment Contracts (GICs) The Defined Contribution Stable Value Fund consists of fully benefit-responsive synthetic
guaranteed investment contracts (GICs). The Stable Value Fund is an investment option that seeks to provide safety of principal and a stable credited rate of interest, while generating competitive returns over time compared to other comparable investments. As of June 30, 2020, the Stable Value Fund portfolio of well diversified high-quality investment grade fixed income securities had a fair value of $2.2 billion, which was $246 million less than the fair value protected by the wrap contract.
Derivative Financial Instruments – Interest Risk
IINPRS has exposure to interest rate risk due to
investments in interest rate swaps, inflation swaps,
and forward mortgage-backed securities (TBAs).
Derivative instruments as of June 30, 2020, subject to interest rate risk are:
Reference Currency Pays Receives Fair Value Notional
Interest Rate Swap - Pay Fixed Receive Variable:
U.S. Dollar 0.40% to 2.75% 3M USD LIBOR (33,102)$ 256,600$
Euro Currency Unit -0.25% to 0.75% 6M EURIBOR REUTERS (666) 24,664
Japanese Yen 0.30% 6M JPY LIBOR BBA (204) 10,845
Mexican Peso 7.35% 28D MXN TIIE BANXICO 577 4,458
Pound Sterling 0.75% to 2.00% 6M FBP LIBOR BBA (116) 3,830
Czech Koruna 2.01% 6M CZK PRIOBOR PRBO (214) 2,433
Thailand Baht 1.25% 6M THB THBFIX REUTERS - 1
Total (33,725)$ 302,831$
Interest Rate Swap - Pay Variable Receive Fixed:
Chinese Yuan Renminbi 7D CHINA FIXING REPO RATES 2.50% 333$ 42,216$
Malaysian Ringgit 3M MYR-KLIBOR-BNM 2.25% 115 34,861
Indian Rupee INR FBIL MIBOR OIS COM 3.75% 33 29,233
Mexican Peso 28D MXN TIIE BANXICO 4.50% to 5.70% 298 24,342
Chilean Peso CLP CLICP BLOOMBERG 1.60% to 2.40% 331 18,268
Canadian Dollar CAD-BA-CDOR 3M 1.22% to 1.50% 466 16,079
U.S. Dollar 3M USD LIBOR BBA 1.66% to 2.70% 1,155 11,000
Brazil Real 1D BRL CDI 4.81% to 6.66% 422 10,701
Japanese Yen 6M JPY LIBOR BBA -0.09% to -0.02% (36) 5,237
Isreali Shekel 3M ILS TELBOR REFERENCE BANKS 1.41% 143 1,658
Total 3,260$ 193,595$
Comprehensive Annual Financial Report - State of Indiana - 86

B. Interfund Transaction Interfund Loans As explained in Note III(A), temporary cash overdrafts in various funds are reported as interfund loans from the General Fund. As of June 30, 2020, the following funds had temporary cash overdrafts covered by loans from the General Fund: U.S. Department of Health and Human Services Fund,
$445.2 million, Medicaid Assistance Fund, $27.7 million, and U.S. Department of Labor, $13.4 million. There is also reported an $8.0 million loan from the Motor Vehicle Highway Fund to the State Highway Fund, which is not expected to be repaid within the next fiscal year. Also, reported is an interfund loan of $4.1 million to the Fish and Wildlife Fund from the Fund 6000 Programs Fund for $3.1 million and from the Deer Research and Management Fund for $1.0 million for game and deer licenses.
The following is a summary of the Interfund Loans as of June 30, 2020:
Loans To
Governmental
Funds
Loans From
Governmental
Funds
Governmental Funds
General Fund 486,334$ -$
Public Welfare - Medicaid Assist 27,723
US Department of Health and
Human Services 445,210
Nonmajor Governmental Funds 12,073 25,474
Total 498,407$ 498,407$
Interfund Services Provided/Used Interfund Services Provided of $10.9 million represents amounts owed by various governmental
funds to the Institutional Industries Fund and the Administrative Services Revolving Funds, both internal service funds, for goods and services rendered.
The following is a schedule of Interfund Services Provided/Used as of June 30, 2020:
Interfund Services Provided/Used
Interfund Services
Provided To
Governmental Funds
Interfund Services
Used By
Governmental
Funds
Governmental Funds
General Fund -$ 6,180$
Public Welfare - Medicaid Assistance - 6
U.S. Department of Health & Human Services - 1,810
Federal COVID-19 16
Nonmajor Governmental Funds - 2,880
Total Governmental Funds - 10,892
Proprietary Funds
Internal Service Funds 10,892 -
Total Proprietary Funds 10,892 -
Total 10,892$ 10,892$
Due From/Due To Component Units The $15.0 million represents funds the General Fund borrowed in June 2004, interest free, from the
Indiana Board for Depositories, a discretely presented component unit. Per Public Law 93-2013, Section 4, repayments to the Indiana Board for Depositories are to be made in annual increments of
87 - State of Indiana - Comprehensive Annual Financial Report

$5.0 million each July beginning July 2013. The interfund balance of $23.4 million represents the
accrued distribution amount from the State Lottery Commission to the Lottery Surplus Fund.
The following is the schedule of Due From/Due To component units, as of June 30, 2020:
Due From
Primary
Government
Due To
Component
Units
Due From
Component
Units
Due To
Primary
Government
Governmental Funds
General Fund -$ 15,000$ -$ -$
Nonmajor Governmental Funds - - 23,450 -
Total Governmental Funds - 15,000 23,450 -
Component Units
Board for Depositories 15,000 - - -
State Lottery Commission - - - 23,450
Total Component Units 15,000 - - 23,450
Total 15,000$ 15,000$ 23,450$ 23,450$
Due From/Due To Other Funds Various governmental funds were owed funds from the Federal COVID19 fund for public safety and health payroll expenditures that were incurred before June 30, 2020 and were allowable expenditures of the COVID 19 fund. The following is the schedule of Due From/Due To other funds, as of June 30, 2020.
Due From
Other Funds
Due To Other
Funds
General Fund 187,285$ -$
Federal COVID-19 Fund 197,869
Nonmajor Governmental Funds 10,584 -
Total 197,869$ 197,869$
Interfund Transfers Major Governmental Funds Transfers constitute the movement of money from the fund that receives the resources to the fund that utilizes them. These numerous transfers generally result from legislation passed by the Indiana General Assembly that directs how the transfers are made. In the case of the General Fund, many appropriations are made in the General Fund and then transferred during the year to the funds where these appropriations are used. Also in the case of the General Fund, various taxes and other revenues are collected in other funds and transferred to the General Fund. Following are the principal purposes of the State’s interfund transfers: General Fund – $374.8 million was transferred in from the Medicaid Assistance Fund of which $172.4
million was the return of unused State match appropriations for Medicaid from prior fiscal years, and $202.4 million was hospital assessment fees. The hospital assessment fees can only be used for the State’s share of Medicaid services under Title XIX of the federal Social Security Act. $292.1 million was transferred in from the State Gaming Fund which was wagering taxes from riverboats and slot machines at horse tracks. $236.4 was transferred in from the Lottery Surplus fund as part of the excise tax cut replacement distribution. $120.1 million was received from the Fund 6000 Programs Fund of which $65.5 million was distribution of financial institutions tax per IC 6-5.5; $28 million was transferred in for Indiana Veterans’ Home administration from the Comfort-Welfare Fund’s and IVH Medicaid Reimbursement Fund’s receipts of resident fees and Medicaid reimbursements; $19.2 million was transferred in from permit fees collected from business that sell alcoholic beverages per IC 7.1-4-9-4; The remaining $7.4 million were transferred in from various other programs. $95 million was transferred in from the Welfare-Work Incentive Fund to support state matching of federal medical assistance funds. $23 million was transferred in from the DCS Local Office Administration fund to support eligibility enforcement programs. $18.4 million was transferred in from the Mental Institutions fund to be support the state’s mental health institutions. $15 million was transferred in from the U.S. Department of Health and Human Services Fund in support of child welfare services training and state grants, case management services, special needs adoption, Social Security Title IV-D services to needy families with children, adoption services, and other family and children services.
Comprehensive Annual Financial Report - State of Indiana - 88

The following were transfers out from the General Fund: The Public Welfare Medicaid Assistance Fund received $2.4 billion in transfers for Medicaid current obligations and for Medicaid administration to enable the Office of Medicaid Policy and Planning to carry out all services under IC 12-8-6. These services include, but may not be limited to the provision of care and treatment for individuals with mental illness, developmental disability, long term care needs, and family and child service needs. $280 million was transferred to the U.S. Department of Health and Human Services Fund in support of: $107.3 million for Department of Child Services programs including child welfare services training and state grants, case management services, special needs adoption, Social Security Title IV-D services to needy families with children, adoption services, family and children services, and Healthy Families Indiana; $151.9 million for local offices, state administration, information systems, temporary assistance for needy families program, child care services, Pre-K education, assisting developmentally disabled clients, child psychiatric services, and mental health and aging services. $95 million was transferred to the Welfare-Work Incentive fund to support the state share of FSSA administration of the Medicaid program. $86 million was transferred to the U.S. Department of Agriculture Fund as the State’s match of which $78.9 million was for the FSSA Division of Family Resources’ local offices, state administration, information systems, TANF, Electronic Benefits Transfer administration, and IMPACT, $5 million was for the National School Lunch program administered by the Indiana Department of Education’s Division of School and Community Nutrition Programs, $2.0 million was for the meat and poultry inspection program and the public health data communication infrastructure system of the Board of Animal Health, $0.1 million was for DNR capital projects. $31.4 million was transferred to the Department of Education fund for the state match of education programs across various state agencies. Medicaid Assistance Fund – The Medicaid Assistance Fund received a transfer of $2.5 billion from the General Fund to support the state Medicaid program administered through the Office of Medicaid Policy and Planning. $336.1 million was transferred in from the Healthy Indiana Plan trust fund to support the Healthy Indiana Plan (or HIP 2.0). $17.1 million was transferred in from the Medicaid Indigent Care Trust Fund which is part of the U.S. Department of Health and Human Services Fund, for reimbursement of hospital care for the indigent supplement payments made from the Medicaid Assistance Fund. Transfers out included $439 million to the General
Fund of which $188.5 million was the return of unused State match appropriations for Medicaid from prior fiscal years, $202.4 million was hospital assessment fees, and $47.7 million was quality assessment fees. The hospital assessment fees and quality assessment fees can only be used for the State’s share of Medicaid services under Title XIX of the federal Social Security Act. $0.3 million was transferred to the General Fund for Medicaid’s share of state fiscal year 2019 indirect costs in accordance with FSSA’s approved public assistance cost allocation plan. U.S. Department of Health and Human Services Fund – $272.7 million was transferred to the U.S. Department of Health and Human Services Fund from the General Fund in support of: $107.99 million for Department of Child Services programs including child welfare services training and state grants, case management services, special needs adoption, Social Security Title IV-D services to needy families with children, adoption services, family and children services, and Healthy Families Indiana; $39.9 million for the Family and Social Services’ Division of Family Resources for local offices, state administration, information systems, and the temporary assistance for needy families program; $118.9 million for the FSSA Early Child Learning division for child care services and the Pre-K education pilot program, State Medicaid program; FSSA Central Office, Mental Health and Addiction, Disability and Rehabilitative Services, and Aging divisions for assisting developmentally disabled clients, child psychiatric services, and mental health and aging services $6 million was transferred in for county prosecutors’ and local judges’ salaries and for Department of Health and Attorney General’s Office Medicaid related services. The U.S. Department of Health and Human Services Fund transferred $17.1 million to the Medicaid Assistance Fund to reimburse indigent supplement payments for hospital care. $7.8 million was transferred to the General Fund to support the state match, indirect costs, and other costs of federal programs. Proprietary Funds Non-Major Enterprise Funds The Inns and Concessions Fund – This fund had transfers out of $.4 million, representing cash contributions to the Department of Natural Resources (DNR) which are to be used for repayments of bonds made by the Indiana Finance Authority.
89 - State of Indiana - Comprehensive Annual Financial Report

Internal Service Funds $.5 million was transferred out of the Administrative Services Revolving Fund, Information Technology Services, to the General Fund for the transition of the Department of Workforce Development’s Indiana Network of Knowledge (INK) to the Management and
Performance Hub, and another $.4 was transferred out for IOT to purchase upgrades to the Professional Licensing Agency’s enterprise licensing system. $3.5 million in excess net income was transferred out of the Institutional Industries fund into the General Fund per statute.
A summary of interfund transfers for the year ended June 30, 2020 is as follows:
Transfers in Transfers out Net transfers
Governmental Funds
General Fund 1,272,873$ (3,141,946)$ (1,869,073)$
Public Welfare-Medicaid Assistance
Fund 2,865,764 (447,200) 2,418,564
US Department of Health and Human
Services Fund 302,391 (25,044) 277,347
Nonmajor Governmental Funds 2,387,366 (3,209,796) (822,430)
Proprietary Funds
Nonmajor Enterprise Funds - (394) (394)
Internal Service Funds 324 (4,338) (4,014)
Total 6,828,718$ (6,828,718)$ -$
Comprehensive Annual Financial Report - State of Indiana - 90

C. Receivables Primary Government – Governmental Activities Taxes Receivable/Tax Refunds Payable as of June 30, 2020, including the applicable allowances for uncollectible accounts, are as follows:
Governmental Activities
General Fund
Special
Revenue
Funds
Capital
Projects
Funds
Total Primary
Government
Income taxes 2,602,254$ -$ - 2,602,254$
Sales taxes 890,707 6,299 - 897,005
Fuel taxes 112 124,333 - 124,445
Gaming taxes 1,056 15,578 - 16,634
Alcohol and tobacco taxes 43,306 24,179 2,181 69,666
Insurance 95 - - 95
Financial institutions taxes - 50,240 - 50,240
Other taxes 14,846 1,190 - 16,036
Total taxes receivable 3,552,376 221,819 2,181 3,776,376
Less allowance for uncollectible accounts (1,077,949) (25,207) - (1,103,156)
Net taxes receivable 2,474,427$ 196,612$ 2,181$ 2,673,220$
Tax refunds payable 122,542$ 6,299$ -$ 128,841$
Primary Government – Business-Type Activities The accounts receivable amount reported on the financial statements of the Unemployment Compensation fund is comprised of funds due from Indiana employers (employer receivables) and from overpayments made to Unemployment Insurance recipients (claimant receivables). Accounts receivable as of June 30, 2020 is as follows:
Business - Type Activities
Unemployment
Compensation
Employer 40,083$
Claimant 116,126
Total receivable 156,209$
A major portion of the accounts receivable, $26.9 million of employer receivables and $94.2 million of claimant receivables for a total of $121.1 million, will not be collected within one year.
91 - State of Indiana - Comprehensive Annual Financial Report

D. Capital Assets Capital asset activity for the year ended June 30, 2020, was as follows:
Primary Government – Governmental Activities
Balance, July 1, Balance,
As restated Increases Decreases June 30
Governmental Activities:
Capital assets, not being depreciated/amortized:
Land 2,443,719$ 87,025$ (2,594)$ 2,528,150$
Infrastructure 12,778,147 57,067 (701) 12,834,513
Construction in progress 862,848 451,841 (184,870) 1,129,819
Total capital assets, not being
depreciated/amortized 16,084,714 595,933 (188,165) 16,492,482
Capital assets, being depreciated/amortized:
Buildings and improvements 2,397,445 15,611 (5,816) 2,407,240
Furniture, machinery, and equipment 648,802 74,789 (22,668) 700,923
Computer software 296,312 27,651 (4,609) 319,354
Infrastructure 34,485 27 - 34,512
Total capital assets, being
depreciated/amortized 3,377,044 118,078 (33,093) 3,462,029
Less accumulated depreciation/amortization for:
Buildings and improvements (1,469,632) (50,825) 1,368 (1,519,089)
Furniture, machinery, and equipment (434,271) (61,719) 21,562 (474,428)
Computer software (224,333) (45,616) 4,363 (265,586)
Infrastructure (28,474) (489) - (28,963)
Total accumulated depreciation/amortization (2,156,710) (158,649) 27,293 (2,288,066)
Total capital assets being
depreciated/amortized, net 1,220,334 (40,571) (5,800) 1,173,963
Governmental activities capital assets, net 17,305,048$ 555,362$ (193,965)$ 17,666,445$
Primary Government – Business-Type Activities
Balance
July 1,
restated Increases Decreases
Balance,
June 30
Business-Type Activities:
Capital assets, being depreciated:
Buildings and improvements 507 59 - 566
Furniture, machinery, and equipment 486 - - 486
Total capital assets, being depreciated 993 59 - 1,052
Less accumulated depreciation for:
Buildings and improvements (258) (38) - (296)
Furniture, machinery, and equipment (330) (44) - (374)
Total accumulated depreciation (588) (82) - (670)
Total capital assets being depreciated, net 405 (23) - 382
Business-type activities capital assets, net 405$ (23)$ -$ 382$
Comprehensive Annual Financial Report - State of Indiana - 92

Depreciation/amortization expense was charged to functions/programs of the primary government as follows:
Governmental activities:
General government 23,671$
Public safety 38,152
Health 2,515
Welfare 43,880
Conservation, culture and development 12,775
Education 4,315
Transportation 33,339
Total depreciation/amortization expense -
governmental activities 158,647$
Business-type activities:
Inns and Concessions 83$
Total depreciation expense - business-type
activities 83$
E. Leases The future minimum lease obligations, the net present value of these minimum lease payments as of June 30, 2020 and the assets acquired through capital leases are as follows:
Future minimum lease payments
Capital Leases
Governmental Activities
Year ending June 30,
Operating
Leases Principal Interest
Future
Minimum
Lease
Payments
2021 29,312$ 66,092$ 38,803$ 104,895$
2022 25,577 70,239 35,413 105,652
2023 22,979 72,967 31,782 104,749
2024 21,213 76,636 28,057 104,693
2025 17,077 78,214 24,189 102,403
2026-2030 31,077 357,919 65,538 423,457
2031-2035 - 56,267 15,289 71,556
2036-2040 - 26,474 2,002 28,476
Total minimum lease payments
(excluding executory costs) 147,235 804,808 241,073 1,045,881
Less:
Remaining premium(discount) - 27,539 - 27,539
Total minimum lease payments 147,235$ 832,347$ 241,073$ 1,073,420$
Assets acquired through capital lease
Building 5,364$
Machinery and equipment 24,070
Infrastructure 813,769
less accumulated depreciation (11,796)
831,407$
93 - State of Indiana - Comprehensive Annual Financial Report

Operating Leases The State leases building and office facilities and other equipment under operating leases. Total payments for such leases with aggregate payments of $20,000 or more were $31 million for the year ended June 30, 2020. A table of future minimum lease payments (excluding executory costs) is presented above.
Capital Leases Liabilities The State has entered into various lease agreements with aggregate payments of $20,000 or more to finance the acquisition of buildings, land and equipment. These lease agreements qualify as capital leases for accounting purposes and, therefore, have been recorded at the present value of the future minimum lease payments as of the inception date in the government-wide statements.
F. Long-Term Obligations Changes in long-term obligations for the primary government for the year ended June 30, 2020 were as follows:
Changes in Long-Term
Obligations
Balance, July 1,
as Restated Increases Decreases
Balance,
June 30
Amounts Due
Within One
Year
Amounts Due
Thereafter
Governmental activities:
Compensated absences 177,850$ 49,281$ (33,746)$ 193,385$ 73,968$ 119,417$
Net pension liability 12,037,000 1,243,335 (1,487,459) 11,792,876 - 11,792,876
Other postemployment benefits 335,757 56,435 (202,033) 190,159 - 190,159
Pollution remediation 35,351 897 (2,669) 33,579 3,343 30,236
Capital leases 904,809 161 (72,623) 832,347 66,092 766,255
13,490,767$ 1,350,109$ (1,798,530)$ 13,042,346$ 143,403$ 12,898,943$
Business-type activities:
Compensated absences 779$ 203$ (218)$ 764$ 260$ 504$
Claims liability 23,378 463 (762) 23,079 1,301 21,778
24,157$ 666$ (980)$ 23,843$ 1,561$ 22,282$
Long term obligations of governmental activities include capital lease obligations of governmental funds as presented in Note IV(E), net pension liabilities as presented in Note V(E) (employee retirement systems and plan), other postemployment benefits, pollution remediation, intergovernmental payables, and compensated absence obligations. The General Fund typically has been used to liquidate any other long-term liabilities. Long-term obligations of the business-type activities consist of claims liability of the Indiana Residual Malpractice Insurance Authority and compensated absences of the Inns and Concessions Fund. G. Prior Period Adjustments and
Reclassification For the fiscal year ended June 30, 2020, certain changes have been made to the financial statements to more appropriately reflect financial activity of the State of Indiana. These prior period adjustments and restatements are reflected in the beginning net position in the government-wide statement of activities. In the fund financial statements for the General Fund and the government-wide statements, there was an increase in fund balance of $37.7 million due to the
reclassification of certain private purpose trust funds. In the fund statements for the Special Revenue funds, and the government-wide statements, net position increased by $23.4 million due to an overstatement of intergovernmental payables in the prior year. In the fund statements for the Special Revenue funds, and the government-wide statements, net position increased by $3.5 million due to the incorrect reporting of a loan and a cash bond deposit and an error related to the reporting of the Healthy Hoosier Foundation in the prior year. For the government-wide statements, there is an increase of $12.2 million in net position for capital assets. This was the result of not capitalizing capital assets by June 30, 2019 that were acquired prior to this date and for corrections to acquisition cost by state agencies. Net position decreased $22.2 million for software projects and $8.5 million for public works projects that were incorrectly recorded to construction in progress in the prior year. In addition, the government-wide statements had an increase in net position of $65.0 million resulting from costs incurred prior to June 30, 2019 not being capitalized for INDOT infrastructure assets.
Comprehensive Annual Financial Report - State of Indiana - 94

For the discrete proprietary component units, net position decreased by $4.5 million due to an error correction made by Muncie Schools, a component unit of Ball State University and $35.2 million relating to errors in loans reported by the Indiana Housing and Community Development Authority in the prior year.
For the fiduciary funds, net position increased $75.9 million due to the omission of a receivable in the state’s OPEB DC plan and decreased $37.7 million due to the reclassification of certain private purpose trust funds.
The following schedule reconciles June 30, 2019 net position as previously reported, to beginning net position, as restated:
Governmental
Activities
Fiduciary
Funds
Discretely
Presented
Component
Units (Non
Fiduciary)
June 30, 2019, fund balance/retained
earnings/net position as reported 14,497,467$ 38,384,453$ 16,390,863$
Correction of errors 73,790 75,786 (39,975)
Reclassifications of funds 37,704 (37,704) -
Balance July 1, 2019 as restated 14,608,961$ 38,422,535$ 16,350,888$
95 - State of Indiana - Comprehensive Annual Financial Report

V. OTHER INFORMATION
A. Risk Management
The State of Indiana is exposed to various risks of loss. This includes damage to property owned by the agencies, personal injury or property damage liabilities incurred by a State officer, agent or employee, errors, omissions and theft by employees, certain employee health benefits, employee death benefits, and unemployment and worker’s compensation costs for State employees.
The State records an expenditure for any loss as the liability is incurred or replacement items are purchased. The State purchases commercial insurance coverage for certain DNR Inns properties. The State also purchases immaterial amounts of commercial insurance related to errors, omissions, and theft by employees. Settlements related to commercial insurance have not exceeded coverage in the past three fiscal years.
The State does have risk financing activity for the State employees’ disability, certain State employees’ health benefits, Conservation and Excise Officers’ health benefits, and certain health, disability and
death benefits for State Police officers. These are reported in four individual Internal Service Funds.
The State employees’ disability program is financed partially by State employees through payroll withholdings and by the funds from which employees are paid. The employees’ health benefits, the Conservation and Excise health benefits, and the State Police traditional health plan are funded by the employees who have selected certain health care benefit packages and the funds from which those employees are paid. (An insurance carrier does provide claims administration services for the health insurance programs.)
Located below is the table of claim liabilities. The liabilities are not maintained in the accounting records of the State. The claim liabilities for the health insurance programs and the State Disability fund were estimated based on the historical experience rate of claims paid that were for service dates incurred during a prior fiscal year. The unrestricted net position in these funds is reserved for future catastrophic losses.
State Police
Health
Insurance Fund
State Employee
Disability Fund
State Employees'
Health Insurance
Fund
Conservation
and Excise
Officers Health
Insurance Fund Total
2020
Unpaid Claims, July 1 3,634$ 4,018$ 44,051$ 829$ 52,532$
Incurred Claims and Changes in
Estimate 25,137 15,690 337,711 3,125 381,663
Claims Paid (24,837) (15,514) (341,435) (3,214) (385,000)
Unpaid Claims, June 30 3,934$ 4,194$ 40,327$ 740$ 49,195$
2019
Unpaid Claims, July 1 3,520$ 3,183$ 34,975$ 840$ 42,518$
Incurred Claims and Changes in
Estimate 31,234 16,382 341,394 6,089 395,099
Claims Paid (31,120) (15,547) (332,318) (6,100) (385,085)
Unpaid Claims, June 30 3,634$ 4,018$ 44,051$ 829$ 52,532$
B. Contingencies and Commitments
Litigation
The State does not establish reserves for judgments or other legal or equitable claims against the State. Judgments and other such claims must be paid from the State’s unappropriated balances and reserves, if
any.
With respect to tort claims only, the State’s liability is limited to: (A) $300,000 for a cause of action that accrues before January 2006; (B) $500,000 for a cause of action that accrues between 2006 and 2008; or (C) $700,000 for a cause of action that accrues on or after January 2008, for injury to or
Comprehensive Annual Financial Report - State of Indiana - 96

death of one person in any one occurrence and $5 million for injury to or death of all persons in that occurrence. The Indiana Attorney General’s office estimates a total payment for liabilities and litigation expenses of $10.0 million to be made from the Tort Claim Fund during the next fiscal year. During the fiscal year ending June 30, 2020, the State paid $6.7 million for settlements, judgments, claims and litigation expenses from the Tort Claim Fund. The following is a summary of certain significant litigation and claims currently pending against the State involving amounts exceeding $5 million individually or in the aggregate. This summary is not exhaustive, either as to the description of the specific litigation or claims described, or as to all of the litigation or claims currently pending or threatened against the State. The Indiana Attorney General’s office is currently handling the following cases that could result in significant liabilities to the State: In 2014, Plaintiff, a man convicted of murder twice, overturned twice on appeal, and then found not guilty, sued government actors including city police officers, State Police troopers, prosecutors, and Floyd County alleging various civil rights violations and state law tort claims. Plaintiff demanded $30.0 million from the defendants. Defendant Floyd County settled with the plaintiff for $450,000 in August 2016. State Defendants’ Motions for Summary judgment were filed on May 23, 2017. The State’s position is that the claims against the prosecutors are absolutely barred by prosecutorial immunity and the claims against the Indiana State Police defendants fail based on defendants’ qualified immunity and the existence of probable cause that plaintiff committed the underlying crimes. On January 29, 2018, the Court granted the State Defendants’ Motions for Summary Judgment, entered judgment in favor of the State Defendants and against Plaintiff, and dismissed the case with prejudice. On February 2, 2018, State Defendants filed a Bill of Costs to recoup their costs in the amount of $9,077.70. The Plaintiff filed a Notice of Appeal on February 26, 2018. On March 1, 2018, the Court issued an Order staying a ruling on the Bill of Costs pending appeal. Plaintiff-Appellant filed his Appellant Brief on June 7, 2018. State Defendants-Appellees Brief was filed September 13, 2018; Appellant filed a Reply Brief. Oral argument was held at the U.S. Court of Appeals for the Seventh Circuit on October 30, 2018. On September 10, 2019, the Seventh Circuit remanded two of the Plaintiffs claims concerning 4th Amendment and Brady issues to the District Court.
Any petition for rehearing en banc was due by October 8, 2019. No petition for rehearing was filed. Order reopening the case was issued on October 18, 2019. The parties filed their position statements on November 6, 2019. On December 6, 2019, the State Defendants filed a proposed revised case management plan. The parties attended a status conference on December 10, 2019. One of the defendants in this case has since passed away, causing a motion to substitute the estate for the defendant to be filed on January 29, 2020. Mediation was held on April 21, 2020 and was unsuccessful. The motion to substitute the estate for the defendant was granted on June 10, 2020, after a full briefing by the parties. The attorney for the estate has since resigned. A status conference was set for August 4, 2020, and no attorney for the estate appeared. A final pre-trial conference is set for July 7, 2021, and trial is set to commence August 9, 2021. In 2017, Plaintiff filed a complaint against the Indiana Department of Environmental Management, the Indiana State Department of Health, and the State of Indiana. There are over 100 individual plaintiffs alleging negligence and negligent and intentional infliction of emotional distress against the State Defendants and the City of East Chicago, the East Chicago Housing Authority, and the East Chicago Department of Public and Environmental Health, seeking damages for alleged physical and emotional harms caused by their alleged exposure to lead, arsenic, and other contamination while residents at the West Calumet Housing Complex and/or while students at Carrie Gosch Elementary School in East Chicago, Indiana since the late 1990’s. On February 12, 2018, outside counsel entered an appearance on behalf of the State Defendants along with a motion to extend time to respond. On March 5, 2018, an answer on behalf of the State Defendants was filed along with a motion to dismiss the Indiana State Department of Health. This motion was later found to be moot. Outside counsel filed a motion staying discovery pending the outcome of a motion for judgment on the pleadings. That motion was granted. The Motion for Judgment on the Pleadings was filed July 9, 2018. Plaintiff filed a response to the Motion for Judgment on the Pleadings on August 18, 2018. A Reply in Support of the Motion for Judgment was filed and a hearing held. The Motion for Judgment on the Pleadings was denied November 9, 2018. The Order denying the Motion to Dismiss required additional discovery. Initial discovery deadlines were set. The State’s Motion to Certify for Interlocutory Appeal was filed on December 10, 2018. Notice of Appeal was filed April 25, 2019. The parties completed briefing of the matter on appeal. On June 10, 2020, the Indiana Court of Appeals upheld the Trial Court’s denial of the Defendants’
97 - State of Indiana - Comprehensive Annual Financial Report
Motion for Judgment on the Pleadings and remanded the matter for continued proceedings. Parties are conferring about discovery. In 2019, an interstate trucking association and several trucking companies filed a class action lawsuit against the Governor, the Indiana Finance Authority, the INDOT Commissioner, and the Indiana Toll Road operator. The plaintiffs challenge the toll increase for heavy vehicles on the toll road that took effect in October 2018. The plaintiffs seek to invalidate the toll increase, refunds of the tolls paid with interest, and attorneys’ fees. The defendants filed a joint motion to dismiss, which the district court judge referred for recommendation to the magistrate judge. The magistrate judge recommended on August 13, 2019, that the case be dismissed with prejudice. The magistrate judge granted the motion to stay the case pending final determination of the motion to dismiss. The plaintiffs filed an objection to the recommendation and after briefing the objection, the district court judge adopted the magistrate judge’s recommendation. The case was accordingly dismissed with prejudice. On March 18, 2020, the plaintiffs filed their notice of appeal. The parties have briefed the appeal and argued in the Seventh Circuit on October 26, 2020. In 2019, Plaintiffs filed a complaint individually, and on behalf of their two minor children, alleging that three employees of the Indiana Department of Child Services violated their constitutional rights when they removed their minor children from their home in 2017 without a court order. The removals were spurred when a foster child placed with the Plaintiffs was taken to the hospital for medical care. Defendants filed a partial motion to dismiss on October 10, 2019. The motion is fully briefed and under advisement. Discovery has been ongoing. Parties filed dispositive motions on October 15, 2020. Briefing is complete. The court denied Defendants’ partial motion for summary judgment as moot. Defendants answered on December 4, 2020. A status conference is scheduled for January 26, 2021. A jury trial is set for May 17, 2021. On December 16, 2019, the Plaintiff’s estate filed a complaint alleging constitutional violations stemming from the wrongful death of the decedent on December 28, 2018. The complaint names the Indiana State Police and individual members, Montgomery County Sheriff’s department and individual members, and the City of Crawfordsville and individual members. The complaint stems from a traffic stop where the Indiana State Police responded to a disabled vehicle on state highway 231 in Montgomery County, Indiana. During the stop the decedent was shot by an Indiana State Trooper
who observed the decedent reaching for his open-carry firearm. The decedent was then transported to the hospital where he died from his injuries. Discovery and depositions in the case have been ongoing and Plaintiff’s estate filed their second amended complaint on September 23, 2020, to add additional Indiana State Police defendants. The trial is currently set for October of 2021, with no specific date indicated by the court. Other Litigation
The State on behalf of the following state agencies is currently involved in the following cases that could result in significant liability to the State: Indiana Bureau of Motor Vehicles (BMV) In June 2017, plaintiffs and the State of Indiana entered into a settlement agreement for the March and October 2013 class action lawsuits brought against the Bureau of Motor Vehicles (BMV), which alleged amounts were charged to persons for drivers’ licenses that were not authorized by law and overcharges. The court approved this settlement agreement in August 2017. The settlement agreement was amended in August 2018 to place remaining customer claims under the March 2013 case on customer BMV accounts to be claimed as credits. Credits not claimed by August 2021 will be transferred to the Attorney General’s Unclaimed Property Fund. $2.5 million was payable to claimants under the March 2013 case as of June 30, 2020. Under the October 2013 lawsuit, $7.4 million was payable to claimants as of June 30, 2020 related to summer of 2016 claims and another $1.9 million was estimated to be payable for additional claims from 2002 through 2006 and other associated time periods. Any summer of 2016 related claims that were not paid by June 30, 2019 were transferred to the Attorney General’s Unclaimed Property Fund in July 2019. BMV was obligated under the settlement agreement to continue paying claims for the 2002 through 2006 period through September 30, 2019. From July 1 through September 30, 2019, an additional $28,149 was paid out for the 2002 through 2006 period. No additional claims will be paid out or transferred for the 2002 through 2006 period. $9.9 million has been accrued as an expense and payable in the government-wide financial statements for remaining refunds to be paid Other Loss Contingencies The U.S. Office of Inspector General (USOIG) has issued multiple audit reports on Indiana’s Medicaid Assistance Program. The State has worked with the Centers for Medicare and Medicaid Services (CMS)
Comprehensive Annual Financial Report - State of Indiana - 98
to resolve the findings. As of June 30, 2020, there were $37.1 million in findings which the Family and Social Services Administration (FSSA) believes to be probable for having to be repaid and therefore, has been accrued as an expense and payable in the government-wide financial statements. An additional $710 thousand is reasonably possible to need to be repaid. FSSA management is continuing to work with CMS on a settlement of these findings. Construction Commitments As of June 30, 2020, the Indiana Department of Transportation had outstanding construction commitments totaling $1.6 billion for road and bridge projects. It is anticipated that these projects will be financed with approximately 31% traditional state funds, 6% toll road lease amendment proceeds funds, 4% local funds, 58% traditional federal funds, and 1% 2020 construction funds. The Indiana Department of Administration, Public Works Division, had remaining construction commitments totaling $72.8 million for building and improvement projects of the State’s agencies as of June 30, 2020. These projects are to be funded through State appropriations, the State Highway Department Fund, capital projects funds, and federal funds. The State had $424.4 million in total commitments for software in development as of June 30, 2020. These commitments are to be funded through the General Fund, federal funds, and state dedicated funds. Encumbrances Significant encumbrances by major funds and non-major funds in the aggregate as of June 30, 2020 were as follows:
Governmental Funds Encumbrances
General Fund 918,602$
Public Welfare - Medicaid Assistance 11,827
US Department of Health & Human Services 803,604
Federal COVID-19 76,890
Non-Major Governmental Funds 3,195,677
Total 5,006,600$
C. Other Revenue Other revenue represents revenue received which cannot accurately be included with any of the other revenue sources. In most cases, the amount of “other revenue" received by a fund is insignificant in comparison with total revenues received.
D. Economic Stabilization Fund Indiana Code (IC) 4-10-18 establishes the Counter-Cyclical Revenue and Economic Stabilization Fund ("Rainy Day Fund") within the state’s General Fund to assist in stabilizing revenue during periods of economic recession. The fund receives funding through calculated transfers as prescribed by Indiana Code. The State Budget Director is required to annually calculate State of Indiana Adjusted Personal Income (API) and its growth rate over the previous year. API growth rates exceeding 2% trigger an appropriation from the General Fund into the Rainy Day Fund. API growth rates less than 2% trigger an appropriation from the Rainy Day Fund to the General Fund. Additionally, any balance in the Rainy Day Fund at the end of the fiscal year exceeding 7% of total General Fund revenues for the same period is transferred from the Rainy Day Fund to the General Fund. In fiscal year 2020, the API growth rate did not trigger a transfer into or out of the Rainy Day Fund. Also, the Rainy Day Fund did not exceed 7% of total General Fund revenues for fiscal year 2020. Loans can be made from the Rainy Day Fund to local units of government for specific purposes. The Rainy Day Fund cash and investment balance at the end of fiscal year 2020 was $529.4 million. There were no outstanding loans as of fiscal year end. E. Employee Retirement Systems and Plans The State of Indiana sponsors ten public employee retirement systems (PERS) that are included in the State's financial statements. They are reported and administered as described in Note I (A). Summary of Significant Accounting Policies (Pensions) For purposes of measuring the net pension liability, deferred outflows of resources and deferred inflows of resources related to pensions, and pension expense, information about the fiduciary net position and additions to or deductions from fiduciary net position have been determined on the same basis as they are reported for all of the plans by their respective trustees. The Indiana Public Retirement System is the trustee for all of the plans except for the State Police Retirement Fund and the State Police Supplemental Trust Fund which is administered by the Treasurer of the State of Indiana as Trustee under a Pension Trust Agreement with the Indiana Department of State Police. Benefit
99 - State of Indiana - Comprehensive Annual Financial Report
payments (including refunds of employee contributions) are recognized when due and payable in accordance with the benefit terms. Investments are reported at fair value. The State sponsors the following defined benefit single-employer plans: State Police Retirement Fund (Presented as a pension trust fund) Plan description. The State Police Retirement Fund (SPRF) is a defined benefit, single-employer PERS, and is administered by the Treasurer of the State of Indiana as Trustee under a Pension Trust Agreement with the Indiana Department of State Police. Indiana Code 10-12-2-2 grants authority to the Department to establish and operate an actuarially sound pension plan governed by a pension trust. It also authorizes the Department to make annual contributions as necessary to prevent any deterioration in the actuarial status of the trust. The State Police Retirement Fund issues a publicly available financial report that can be obtained by writing the State Police Retirement Fund, c/o Treasurer of State, 200 W. Washington Street, Room 242 State House, Indianapolis, IN 46204. The SPRF includes the Pre-1987 Benefit System and the 1987 Benefit System. The term “Pre-1987 Benefit System” shall refer to the plan and the benefits provided to employee beneficiaries who are first employed as employees by the Department before July 1, 1987, and who did not elect to be covered by the 1987 Benefit System in accordance with the provisions of Section 31 of the Trust Agreement. Any benefits provided to former employees who qualified for such benefits under the terms of the Trust Agreement as in effect prior to July 1, 1987, shall also be deemed part of the Pre-1987 Benefit System. The term “1987 Benefit System” shall refer to the plan and the benefits provided to employee beneficiaries who are first employed as employees by the Department on or after July 1, 1987, and to those employee beneficiaries who were first employed before July 1, 1987, provided they elected to be covered by the 1987 Benefit System in accordance with the provisions of Section 31 of the Trust Agreement. Retirement benefits provided. Pre-1987 Plan The Pre-1987 Plan provides that the basic monthly pension amount may not exceed by more than $20 an amount equal to one-half of the member’s average monthly wages (not including overtime) received during the highest paid consecutive 12 months prior to retirement. However,
this amount may not exceed the monthly salary of a sixth-year trooper. In addition to the basic retirement benefit described above, a plan member with over 20 years of service will receive the following incremental increases:
2% of the basic amount for each of the next 2 years over 20 years;
3% of the basic amount for each of the next 2 years over 22 years;
4% of the basic amount for each of the next 2 years over 24 years;
5% of the basic amount for each of the next 2 years over 26 years;
6% of the basic amount for each of the next 2 years over 28 years;
7% of the basic amount for each of the next 2 years over 30 years;
8% of the basic amount for each of the next 2 years over 32 years.
However, the total of these additional amounts may not exceed 70% of the basic pension amount, according to IC 10-12-3-7 (c). 1987 Plan The 1987 Plan provides that the basic monthly pension amount may not exceed one-half of the member’s average monthly salary received during the member’s highest-paid three years before retirement. Members retiring from July 1, 1987, through June 30, 1988, may not receive a basic monthly benefit greater than 50% of the maximum salary of a first sergeant. Members retiring from July 1, 1988, through June 30, 1989, may not receive a basic monthly benefit greater than 50% of the maximum salary of a captain. In addition to the basic retirement benefit described above, a Plan member with over 25 years of service will receive the following incremental increases:
5% of basic amount for each of the next 3 years over 25 years;
6% of basic amount for each of the next 2 years over 28 years;
7% of basic amount for each of the next 2 years over 30 years;
8% of basic amount for each of the next 2 years over 32 years.
However, the total of these additional amounts may not exceed 70% of the basic pension amount, according to IC 10-12-4-7(e). Disability and survivor benefits provided. The regular disability benefit for a disabled member may not exceed the maximum basic pension amount. If the member’s disability was incurred in the line of duty, the member is entitled to an additional $40 per month for each dependent parent and dependent child under age 18. If a member is permanently and totally disabled by a catastrophic personal injury that: (1) is sustained in the line of duty after January 1, 2001; and (2) permanently prevents the member from performing any gainful work; the member is entitled to a disability benefit equal to the member’s salary at the
Comprehensive Annual Financial Report - State of Indiana - 100

commencement of the disability in lieu of the regular disability benefit. The member is also entitled to increases in the disability benefit equal to the salary increases that the member would have received had the member remained in active service. A member who meets the conditions listed in IC 5-10-13 has a presumption that a total or partial disability or death resulting from a health condition caused by AIDS, anthrax, hepatitis, HIV, meningococcal meningitis, smallpox, or tuberculosis is a disability or death incurred in the line of duty. In addition, a member who meets the conditions listed in IC 5-10-15 has a presumption that a total or partial disability resulting from an exposure-related cancer, or heart or lung disease is a disability incurred in the line of duty. These presumptions may be rebutted by competent evidence. A meeting or hearing held to rebut a presumption may be held as an executive session under IC 5-14-1.5-6.1(b) (1). A presumption affects only the determination as to whether a disability or death was incurred in the line of duty and does not change the requirements for determining eligibility for disability benefits. A member’s survivor is entitled to a supplemental death benefit of not more than $14,500 for employee beneficiaries who die before July 1, 2013. For employee beneficiaries who die after June 30, 2013, the amount of supplemental death benefits may not exceed $20,000. The maximum monthly pension payable to surviving spouses or a dependent mother and father of a member killed in the line of duty may not exceed the current basic monthly pension amount paid to retirees or, upon a retiree’s death, one-half of the deceased officer’s monthly benefit. A dependent child entitled to survivor benefits may receive a maximum of 30% of the basic monthly pension currently being paid to retirees. Total benefits paid to all of a member’s surviving dependent children may not exceed the basic monthly pension currently being paid to retirees. Employees covered by benefit terms. As of June 30, 2020, the following employees were covered by the benefit terms of the SPRF:
Pre-1987
Plan
1987
Plan
Inactive employees or beneficiaries
currently receiving benefits 750 823
Inactive employees entitled to but
not yet receiving benefits 3 174
Active employees 14 1,205
Total 767 2,202
Contributions. Members of the Pre-1987 Plan
contribute 5% of the member’s wages (not including
overtime and limited to sixth-year trooper pay).
Members of the 1987 Plan contribute 6% of the
member’s wages (not including overtime). A member
who receives a disability pension does not make
contributions to the member’s fund. Periodic employer contributions to the pension plan are determined on an actuarial basis using the entry age normal cost actuarial method. Normal cost is funded on a current basis. Under the terms of the Trust Agreement, in the event the Department fails to make the minimum contributions for five successive years, the Trust shall terminate and the fund shall be liquidated. The unfunded actuarial accrued liability is being funded over a thirty-year closed period which commenced July 1, 2010. Periodic contributions for both normal cost and the amortization of the unfunded actuarial accrued liability are based on the level dollar of payroll method. The funding policy for normal cost and unfunded actuarial accrued liability should provide sufficient resources to pay employee pension benefits on a timely basis. For the year ended June 30, 2020, the State’s contribution rate was 26.0 percent of covered payroll. Deferred Retirement Option Program The Deferred Retirement Option (DROP) for the State Police Retirement Fund was established in 2001 pursuant to the Pension Trust Agreement and is governed by the Department of the State Police and the Treasurer of the State of Indiana (Trustee). Members of the Pre-1987 and 1987 plans that are eligible to retire may elect to accumulate a DROP benefit while continuing to work. At the time of their election, the member executes an irrevocable election to retire on a DROP retirement date and remain in active service, but the member does not contribute to the fund during the DROP period. For the Pre-87 Plan, when an employee has completed 20 years of service or more, he/she may irrevocably elect to enter the DROP for a period ending the earlier of (1) 60 consecutive months, (2) completion of 34 years of service, or (3) attainment of age 65. An employee on disability cannot enter the DROP. From the date the employee enters the DROP, he/she will not be credited with any additional years of service. The employees DROP accrual will be equal to the basic monthly retirement benefit. At the end of the DROP period, the employee must separate from employment and retire. Upon separation, the employee will receive their accumulated DROP benefit in the form of a lump sum payment, a rollover to another retirement program, or a combination of both. For the 1987 Plan, all DROP requirements are the same as the Pre-87 plan, except that the
101 - State of Indiana - Comprehensive Annual Financial Report
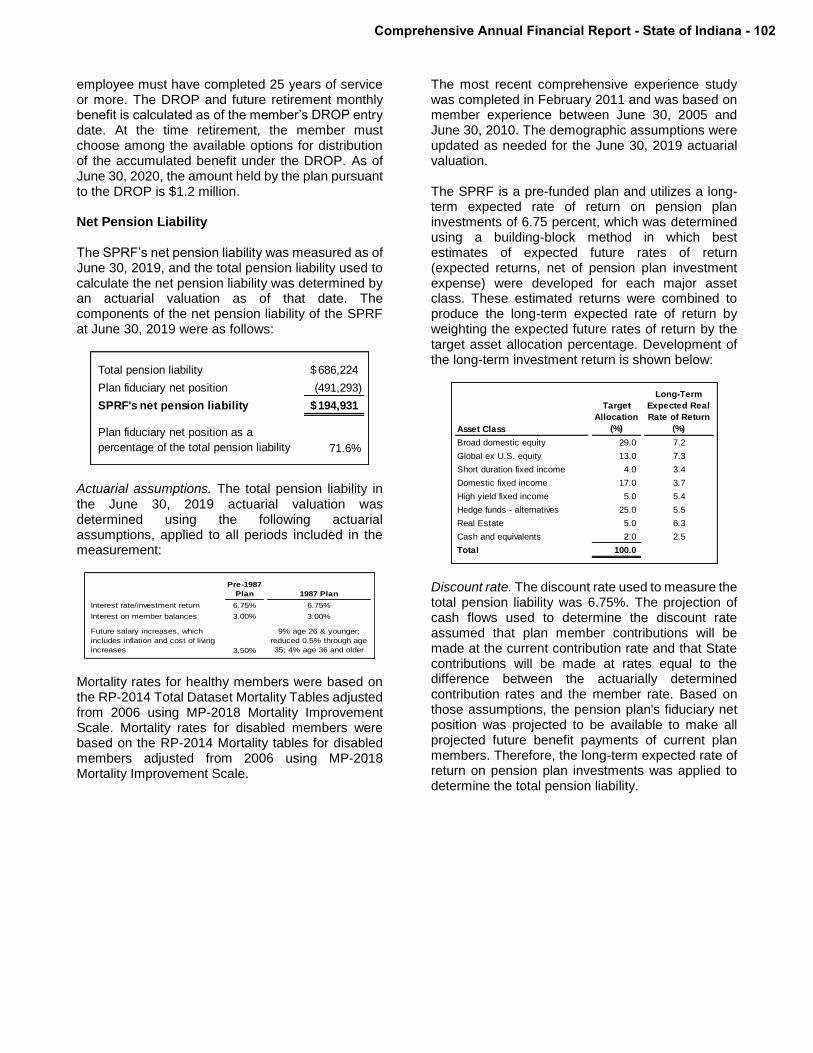
employee must have completed 25 years of service or more. The DROP and future retirement monthly benefit is calculated as of the member’s DROP entry date. At the time retirement, the member must choose among the available options for distribution of the accumulated benefit under the DROP. As of June 30, 2020, the amount held by the plan pursuant to the DROP is $1.2 million. Net Pension Liability The SPRF’s net pension liability was measured as of June 30, 2019, and the total pension liability used to calculate the net pension liability was determined by an actuarial valuation as of that date. The components of the net pension liability of the SPRF at June 30, 2019 were as follows:
Total pension liability 686,224$
Plan fiduciary net position (491,293)
SPRF's net pension liability 194,931$
Plan fiduciary net position as a
percentage of the total pension liability 71.6%
Actuarial assumptions. The total pension liability in the June 30, 2019 actuarial valuation was determined using the following actuarial assumptions, applied to all periods included in the measurement:
Pre-1987
Plan 1987 Plan
Interest rate/investment return 6.75% 6.75%
Interest on member balances 3.00% 3.00%
Future salary increases, which
includes inflation and cost of living
increases 3.50%
9% age 26 & younger;
reduced 0.5% through age
35; 4% age 36 and older Mortality rates for healthy members were based on the RP-2014 Total Dataset Mortality Tables adjusted from 2006 using MP-2018 Mortality Improvement Scale. Mortality rates for disabled members were based on the RP-2014 Mortality tables for disabled members adjusted from 2006 using MP-2018 Mortality Improvement Scale.
The most recent comprehensive experience study was completed in February 2011 and was based on member experience between June 30, 2005 and June 30, 2010. The demographic assumptions were updated as needed for the June 30, 2019 actuarial valuation. The SPRF is a pre-funded plan and utilizes a long-term expected rate of return on pension plan investments of 6.75 percent, which was determined using a building-block method in which best estimates of expected future rates of return (expected returns, net of pension plan investment expense) were developed for each major asset class. These estimated returns were combined to produce the long-term expected rate of return by weighting the expected future rates of return by the target asset allocation percentage. Development of the long-term investment return is shown below:
Asset Class
Target
Allocation
(%)
Long-Term
Expected Real
Rate of Return
(%)
Broad domestic equity 29.0 7.2
Global ex U.S. equity 13.0 7.3
Short duration fixed income 4.0 3.4
Domestic fixed income 17.0 3.7
High yield fixed income 5.0 5.4
Hedge funds - alternatives 25.0 5.5
Real Estate 5.0 6.3
Cash and equivalents 2.0 2.5
Total 100.0
Discount rate. The discount rate used to measure the total pension liability was 6.75%. The projection of cash flows used to determine the discount rate assumed that plan member contributions will be made at the current contribution rate and that State contributions will be made at rates equal to the difference between the actuarially determined contribution rates and the member rate. Based on those assumptions, the pension plan's fiduciary net position was projected to be available to make all projected future benefit payments of current plan members. Therefore, the long-term expected rate of return on pension plan investments was applied to determine the total pension liability.
Comprehensive Annual Financial Report - State of Indiana - 102

Changes in the Net Pension Liability
Increase (Decrease)
Total Pension
Liability (a)
Plan Fiduciary
Net Position (b)
Net Pension
Liability (a) - (b)
Balances at 6/30/18 670,358$ 476,089$ 194,269$
Changes for the year:
Service cost 19,824 - 19,824
Interest 45,018 - 45,018
Differences between expected and
actual experience (9,072) - (9,072)
Changes of assumptions or other
inputs (1,513) - (1,513)
Contributions - employer - 29,901 (29,901)
Contributions - employee - 5,289 (5,289)
Net investment income - 18,794 (18,794)
Benefit payments, including refunds
of employee contributions (38,391) (38,391) -
Administrative expense - (389) 389
Net changes 15,866 15,204 662
Balances at 6/30/19 686,224$ 491,293$ 194,931$
Sensitivity of the net pension liability to changes in the discount rate. The following presents the net pension liability of the SPRF, calculated using the discount rate of 6.75%, as well as what the SPRF’s net pension liability would be if it were calculated using a discount rate that is 1-percentage-point lower (5.75%) or 1-percentage-point higher (7.75%) than the current rate:
1% Decrease (5.75%) Current Rate (6.75%) 1% Increase (7.75%)
Net pension liability 281,596 194,931 122,662
Pension plan fiduciary net position. Detailed information about the pension plan’s fiduciary net position is available in the separately issued stand-alone financial report of the State Police Retirement Fund. This report may be obtained by writing the State Police Retirement Fund, c/o Treasurer of State, 200 W. Washington Street, Room 242 State House, Indianapolis, IN 46204. Pension Expense and Deferred Outflows of Resources and Deferred Inflows of Resources Related to Pensions For the year ended June 30, 2020, the State recognized pension expense of $51.1 million for the SPRF. At June 30, 2020, the State reported deferred outflows of resources and deferred inflows of resources related to pensions from the following sources:
Deferred
Outflows of
Resources
Deferred
Inflows of
Resources
Differences between expected and actual experience 21,178$ 11,571$
Changes of assumptions or other inputs 6,857 4,248
Net difference between projected and actual earnings
on pension plan investments 17,831 -
Employer's contributions to the pension plan
subsequent to the measurement date of the net
pension liability 34,095 -
Total 79,961$ 15,819$
Deferred outflows of resources in the amount of $34.1 million related to pensions resulting from employer contributions subsequent to the measurement date will be recognized as a reduction of the net pension liability in the fiscal year ended June 30, 2021. Other amounts reported as deferred outflows of resources and deferred inflows of resources related to pensions will be recognized in pension expense as follows:
103 - State of Indiana - Comprehensive Annual Financial Report

Fiscal year
ended June
30:
Deferred
Outflows of
Resources/(Defe
rred Inflows of
Resources)
2021 16,510
2022 6,185
2023 7,563
2024 1,071
2025 (1,282)
State Police Supplemental Trust Fund (Presented as a pension trust fund) Plan description. The State Police Supplemental Trust (SPST) is a defined benefit, single-employer pension plan and is administered by the Treasurer of the State of Indiana as Trustee under a Pension Trust Agreement with the Indiana Department of State Police. Indiana Code 10-12-2-4 and 10-12-2-5 grant authority to the Department of the State Police to establish and operate a fund for death and disability benefits. The SPST is funded using annual appropriations on a pay-as-you-go basis. There are no assets accumulated in a trust for these benefits. The amount paid for pensions as the benefits came due during fiscal year 2020 was $4.0 million. The SPST includes the Pre-1987 Benefit System and the 1987 Benefit System. The term “Pre-1987 Benefit System” shall refer to the plan and benefits provided employee beneficiaries who are first employed as employees by the Department before July 1, 1987, and who did not elect to be covered by the 1987 Benefit System in accordance with provision of Section 31 of the State Police Retirement Fund (SPRF). Any benefits provided to former employees who qualified for such benefits under the terms of the Trust Agreement as in effect prior to July 1, 1987, shall also be deemed part of the Pre-1987 Benefit System. The term “1987 Benefit System” shall refer to the plan and the benefits provided to employee beneficiaries who are first employed as employees by the Department on or after July 1, 1987 and to those employee beneficiaries who were first employed before July 1, 1987, provided they elect to be covered by the 1987 Benefit System in accordance with the provision of Section 31 of the SPRF Trust Agreement. In relation to the SPRF, the membership of the SPST is generally made up of active members and disabled members of the SPRF with the following exceptions:
The SPST does not include active SPRF members who elected a DROP
The SPST does not include inactive SPRF members who are currently receiving SPRF retirement benefits.
Retirement benefits provided. Line of Duty Death Benefits. For the Pre-1987 plan, the benefit value is 50 percent of current salary (but in no event greater than the sixth-year trooper rate), plus $20. Benefits are assumed to increase with the sixth-year trooper rate. Dependent children are paid 30 percent of the beneficiary’s benefit until they reach age 18 or 23 if enrolled in school full time. For the 1987 plan, the benefit value is 50 percent of the average of the highest 36 consecutive months of salary. Dependent children are paid 30 percent of the beneficiary’s benefit until they reach age 18 or 23 if enrolled in school full time. Line of Duty Disability Benefits. For the Pre-1987 Plan, the benefit value is 50 percent of current salary (but in no event greater than the sixth-year trooper pay), plus $20. Benefits are assumed to increase with the sixth-year trooper rate and are payable until the participant has earned 34 years of service. The plan also pays medical expenses. Benefits are increased by $40 for each dependent child under 18. For the 1987 Plan, the benefit value is 50 percent of the average of the highest 36 consecutive months of salary. Benefits are assumed to increase with assumed salary increases and are payable for a minimum of two years and until the participant has earned 25 years of service. The plan also pays medical expenses. Benefits are increased by $40 for each dependent child under 18. Non-Line of Duty Disability Benefits. For the Pre-1987 Plan, the benefit value is 50 percent of current salary (but in no event greater than the sixth-year trooper pay), plus $20. Benefits are assumed to increase with the sixth-year trooper rate and are payable until the participant has earned 34 years of service, but not for a period longer than the accrued service at date of disability. For the 1987 Plan, the benefit value is 50 percent of the average of the highest 36 consecutive months of salary. Benefits are assumed to increase with assumed salary increases and are payable for a minimum of two years and until the participant has earned 25 years of service. Catastrophic Injury Disability Benefits. For the Pre-1987 Plan, the benefit value is 100 percent of current salary. Benefits are assumed to increase with salary increases and are payable until the participant has earned 34 years of service. The plan also pays
Comprehensive Annual Financial Report - State of Indiana - 104

medical expenses. Benefits are increased by $40 for each dependent child until they reach the age of 18 or 23 if enrolled in school full time. For the 1987 Plan, the benefit value is 100 percent of current salary. Benefits are assumed to increase with salary increases and are payable until the participant has earned 25 years of service. The Plan also pays medical expenses. Benefits are increased by $40 for each dependent child until they reach the age of 18 or 23 if enrolled in school full time. Employees covered by benefit terms. As of June 30, 2020, the following employees were covered by the benefit terms of the SPST:
Pre-1987
Plan
1987
Plan
Inactive employees or beneficiaries
currently receiving benefits 13 41
Active employees 13 1,185
Total 26 1,226
Total Pension Liability
The SPST Plan’s total pension liability was measured as of June 30, 2019. Actuarial assumptions. The total pension liability in the June 30, 2019 actuarial valuation was determined using the following actuarial assumptions, applied to all periods included in the measurement:
Pre-1987
Plan 1987 Plan
Interest rate/investment return 2.79% 2.79%
Future salary increases, which
includes inflation and cost of living
increases 3.50%
9% age 26 & younger;
reduced 0.5% through age
35; 4% age 36 and older
Inflation 2.25% 2.25% Mortality rates were based on the RP-2014 Total Dataset Mortality Tables adjusted from 2006 using MP-2018 Mortality Improvement Scale. Mortality rates for disabled members were based on the RP-2014 Mortality tables for disabled members adjusted from 2006 using MP-2018 Mortality Improvement Scale. The most recent comprehensive experience study was completed in 2011 and was based on member experience between June 30, 2005 and June 30, 2010. The demographic assumptions were updated as needed for the June 30, 2019 actuarial valuation.
Discount rate. Total pension liability was calculated
using the discount rate of 2.79 percent. This rate was
chosen in accordance with GASB #73, which
requires that the discount rate should be a yield or
index rate for 20-year, tax-exempt general obligation
municipal bonds with an average rating of AA/Aa or
higher (or equivalent quality on another rating scale).
The 2.79% is the June 30, 2019 value of the S&P
Municipal Bond 20 Year High Grade Rate Index.
Changes in the Total Pension Liability
Increase (Decrease)
Total Pension
Liability (a)
Balances at 6/30/18 16,573$
Changes for the year:
Service cost 4,485
Interest 628
Assumption changes 297
Differences between expected and
actual experience (1,753)
Benefit payments, including
refunds
of employee contributions (3,983)
Net changes (326)
Balances at 6/30/19 16,247$
105 - State of Indiana - Comprehensive Annual Financial Report
Sensitivity of the total pension liability to changes in the discount rate. The following presents the total pension liability of the SPST, calculated using the discount rate of 2.79%, as well as what the SPST’s total pension liability would be if it were calculated using a discount rate that is 1-percentage-point lower (1.79%) or 1-percentage-point higher (3.79%) than the current rate:
1% Decrease (1.79%) Current Rate (2.79%) 1% Increase (3.79%)
Total pension liability 17,796 16,247 14,999
Pension Expense and Deferred Outflows of Resources and Deferred Inflows of Resources Related to Pensions For the year ended June 30, 2020, the State recognized pension expense of $5.2 million for the SPST. At June 30, 2020, the State reported deferred outflows of resources and deferred inflows of resources related to pensions from the following sources:
Deferred
Outflows of
Resources
Deferred
Inflows of
Resources
Differences between expected and actual
experience -$ 2,693$
Changes of assumptions or other inputs 3,004 535
Total 3,004$ 3,228$
Amounts reported as deferred outflows of resources and deferred inflows of resources related to pensions will be recognized in pension expense as follows:
Fiscal year ended June 30:
Deferred Outflows of
Resources/(Deferred
Inflows of Resources)
2021 44
2022 44
2023 44
2024 44
2025 44
Thereafter (444)
State Excise Police, Gaming Agent, Gaming Control Officer and Conservation Enforcement Officers' Retirement Plan (Presented as part of INPRS – a fiduciary in nature component unit)
Plan description. The State Excise Police, Gaming
Agent, Gaming Control Officer, and Conservation
Enforcement Officers’ Retirement Plan (EG&C Plan)
is a single-employer (the State of Indiana) defined
benefit plan established to provide retirement,
disability, and survivor benefits to certain employees
of the (1) Indiana Department of Natural Resources,
(2) Indiana Alcohol and Tobacco Commission and
(3) any Indiana State excise police officer, Indiana
State conservation enforcement officer, gaming
agent or any gaming control officer who is engaged
exclusively in the performance of law enforcement
duties. The EG&C Plan was established in 1972 and
is governed by the INPRS Board of Trustees in
accordance with IC 5-10-5.5.
Retirement benefits provided. Generally, participants
are eligible for full retirement benefits 1) at age 65 if
members were employed by age 50 with 15 years of
creditable services. Retirement is mandatory. 2) at
age 65 if employed after age 50 with 10 years of
services. Mandatory retirement occurs on the first
day of the month after age 65 or 15 years of
creditable service 3) at age 55 if age and creditable
service total at least 85 or 4) at age 50 with 25 years
of service. Participants are eligible for early
retirement benefit at age 45 and 15 years of
creditable service but benefit is reduced by .25
percent for each month less than age 60. The annual
benefit is equal to 25 percent times the average
annual salary. The average annual salary equals the
average annual salary of the five highest years in the
10 years immediately preceding an officer’s
retirement dates. Percentage is increased by 1.66
percent for each completed year of creditable service
after 10 years. Total percentage may not exceed 75
percent. Postretirement benefit increases are
granted on an ad hoc basis pursuant to IC 5-10.2-12-
4 and administered by the INPRS board. For the year
ended June 30, 2020, postretirement benefits of $96
thousand were issued to members as a 13th check.
Disability and survivor benefits provided. If a participant becomes disabled in the line of duty, the benefit is the member’s salary times the degree of impairment without a reduction for early commencement. If not in the line of duty, the member’s salary used to calculate the benefit is reduced 50 percent. A minimum benefit may apply.
Eligible survivors of an active member who dies in
the line of duty receives 100 percent of the member’s
benefit. Survivors of active member who die not in
the line of duty or inactive members with more than
15 years of service who dies receive 50 percent of
the member’s benefit. The minimum benefit is
calculated as if the member had at least 25 years of
service and age 50. For inactive members with less
than 15 years of creditable service, the benefit
Comprehensive Annual Financial Report - State of Indiana - 106
consists of contributions plus interest. While
receiving a benefit, a spouse or parent (for their
lifetime), or dependents(s) (until age 18) receives 50
percent of the member’s benefit. If the spouse is
more than five years younger than the member, the
benefit is actuarially adjusted. Deferred Retirement Option Plan. In accordance with IC 5-10-5.5-22, members eligible to retire with an unreduced benefit may elect to earn a DROP benefit while continuing to work. Members execute an irrevocable election to retire on a DROP retirement date and remain in active service while contributing to the fund until that date. The DROP retirement date must be not less than 12 months and not more than 36 months after their DROP entry date, and cannot be after the member reaches mandatory retirement age. The DROP and future retirement monthly benefit are calculated as of the members’ DROP entry date. At retirement, members must choose among the available options for distribution of the accumulated benefit under the DROP. As of June 30, 2020, the amount held by the fund under the DROP is $0.6 million.
Employees covered by benefit terms. As of June 30, 2020, the EG&C plan membership consisted of:
Retired members, beneficiaries, and
disabled members receiving benefits 248
Inactive vested members entitled to
but not yet receiving benefits 4
Inactive non-vested members
entitled to a distribution of
contributions 133
Active members: vested and non-
vested 420
Total 805
Based on census data as of June 30, 2019 used
for the June 30, 2020 actuarial valuation.
Contributions. Contributions are determined by the
INPRS Board based on an actuarial valuation.
Employers contribute 20.75 percent, with 0.73
percent from July 2019 to December 2019 and 0.61
percent from January 2020 to June 2020 funding a
supplemental reserve account for postretirement
benefits administered by the INPRS Board.
Members are required to contribute 4 percent of
annual salary. Employers may pay all or part of the
member contribution for the member.
Financial report. INPRS issues a publicly available stand-alone financial report that includes financial statements and required supplementary information
for the plan as a whole. This report may be obtained by writing the Indiana Public Retirement System, One North Capitol, Suite 001, Indianapolis, IN 46204, by calling (844) 464-6777, by emailing [email protected], or by visiting www.in.gov/inprs. Net Pension Liability The EG&C Plan’s net pension liability was measured as of June 30, 2019, and the total pension liability used to calculate the net pension liability was determined by an actuarial valuation as of that date. Actuarial assumptions. The total pension liability in the June 30, 2019 actuarial valuation was determined using the following actuarial assumptions, applied to all periods included in the measurement:
Interest rate/investment return 6.75%
Interest on member balances 3.50%
Future salary increases 2.50%
Inflation 2.25%
Cost of living increases 2019-2021 - 13th check,
Beginning Jan. 1, 2022 - 0.40%
Beginning Jan. 1, 2034 - 0.50%
Beginning Jan. 1, 2039 - 0.60% Mortality rates for healthy members were based on the RP-2014 (with MP-2014 improvement removed) Blue Collar mortality tables, with future mortality improvement projected generationally using future mortality improvement inherent in the Social Security Administration's 2014 Trustee report. Mortality rates for disabled members were based on the RP-2014 (with MP-2014 improvement removed) Disability mortality tables, with future mortality improvement projected generationally using future mortality improvement inherent in the Social Security Administration's 2014 Trustee report. The most recent comprehensive experience study was completed in April 2015 and was based on member experience between June 30, 2010 and June 30, 2014. The demographic assumptions were updated as needed for the June 30, 2019 actuarial valuation. The long-term return expectation for this INPRS defined benefit retirement plan was determined by using a building-block approach and assumes a time horizon, as defined in the INPRS Investment Policy Statement. A forecasted rate of inflation serves as the baseline for the return expectation. In order to determine the expected long-term nominal rate of return, the asset class geometric real returns are projected for a 30-year time horizon. These returns are combined with a projected covariance matrix and the target asset allocations to create a range of
107 - State of Indiana - Comprehensive Annual Financial Report

expected long-term real rates of return for the portfolio. A range of possible expected long-term rates of return is created by adding the forecasted inflation to the expected long-term real rates of return. This range ultimately supports the long-term expected rate of return assumption of 6.75% selected by the Board as the discount rate. The assumption is a long-term assumption and is not expected to change with small fluctuations in the underlying inputs, but may change with a fundamental shift in the underlying market factors or
significant asset allocation change. The target
allocation and best estimates of geometric real rates of return for each major asset class are summarized in the following table:
Asset Class
Target
Allocation
(%)
Long-Term
Expected Real
Rate of Return
(%)
Public equity 22.0 4.9
Private equity 14.0 7.0
Fixed income - ex inflation - linked 20.0 2.5
Fixed income - inflation - linked 7.0 1.3
Commodities 8.0 2.0
Real estate 7.0 6.7
Absolute return 10.0 2.9
Risk parity 12.0 5.3
Total 100.0
Discount rate. Total pension liability was calculated
using the discount rate of 6.75 percent. The
projection of cash flows used to determine the
discount rate assumed the contributions from
employers and where applicable from the members,
would at the minimum be made at the actuarially
determined required rates computed in accordance
with the current funding policy adopted by the INPRS
Board, and contributions required by the State of
Indiana would be made as stipulated by State
statute. Projected inflows from investment earnings
were calculated using the long-term assumed
investment rate of return (6.75 percent). Based on
these assumptions, the EG&C defined benefit
pension plan’s fiduciary net position was projected to
be available to make all projected future benefit
payments of current plan members. Therefore, the
long-term expected rate of return on pension plan
investments was applied to all periods of projected
benefits to determine the total pension liability for the
plan.
Changes in the Net Pension Liability
Increase (Decrease)
Total Pension
Liability (a)
Plan Fiduciary
Net Position (b)
Net Pension
Liability (a) - (b)
Balances at 6/30/18 140,056$ 131,491$ 8,565$
Changes for the year:
Service cost 3,551 - 3,551
Interest 9,448 - 9,448
Differences between expected and
actual experience 6,427 - 6,427
Contributions - employer - 6,982 (6,982)
Contributions - employee - 1,368 (1,368)
Net investment income - 9,711 (9,711)
Benefit payments, including refunds
of employee contributions (7,325) (7,325) -
Administrative expense - (112) 112
Other changes 50 - 50
Net changes 12,151 10,624 1,527
Balances at 6/30/19 152,207$ 142,115$ 10,092$
Sensitivity of the net pension liability to changes in the discount rate. The following presents the net pension liability of the EG&C Plan, calculated using the discount rate of 6.75%, as well as what the EG&C Plan’s net pension liability would be if it were calculated using a discount rate that is 1-percentage-point lower (5.75%) or 1-percentage-point higher (7.75%) than the current rate:
1% Decrease (5.75%) Current Rate (6.75%) 1% Increase (7.75%)
Net pension liability 30,404 10,092 (6,623)
Comprehensive Annual Financial Report - State of Indiana - 108
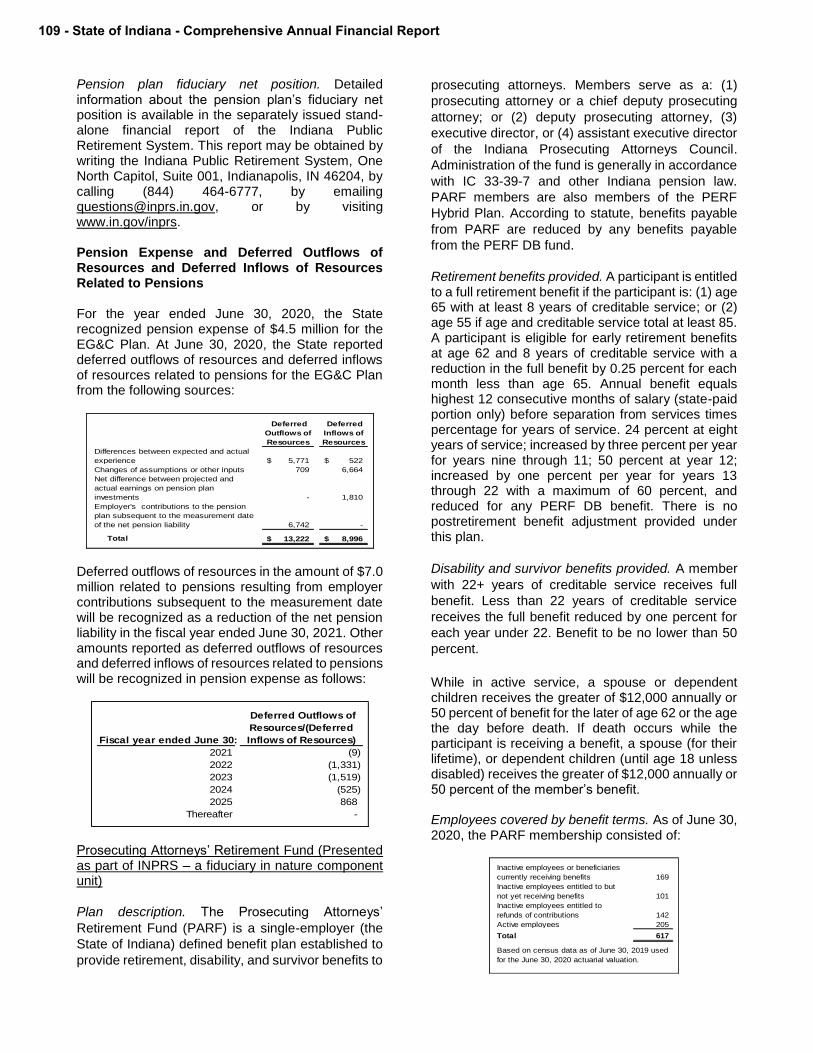
Pension plan fiduciary net position. Detailed information about the pension plan’s fiduciary net position is available in the separately issued stand-alone financial report of the Indiana Public Retirement System. This report may be obtained by writing the Indiana Public Retirement System, One North Capitol, Suite 001, Indianapolis, IN 46204, by calling (844) 464-6777, by emailing [email protected], or by visiting www.in.gov/inprs. Pension Expense and Deferred Outflows of Resources and Deferred Inflows of Resources Related to Pensions For the year ended June 30, 2020, the State recognized pension expense of $4.5 million for the EG&C Plan. At June 30, 2020, the State reported deferred outflows of resources and deferred inflows of resources related to pensions for the EG&C Plan from the following sources:
Deferred
Outflows of
Resources
Deferred
Inflows of
Resources
Differences between expected and actual
experience 5,771$ 522$
Changes of assumptions or other inputs 709 6,664
Net difference between projected and
actual earnings on pension plan
investments - 1,810
Employer's contributions to the pension
plan subsequent to the measurement date
of the net pension liability 6,742 -
Total 13,222$ 8,996$
Deferred outflows of resources in the amount of $7.0 million related to pensions resulting from employer contributions subsequent to the measurement date will be recognized as a reduction of the net pension liability in the fiscal year ended June 30, 2021. Other amounts reported as deferred outflows of resources and deferred inflows of resources related to pensions will be recognized in pension expense as follows:
Fiscal year ended June 30:
Deferred Outflows of
Resources/(Deferred
Inflows of Resources)
2021 (9)
2022 (1,331)
2023 (1,519)
2024 (525)
2025 868
Thereafter -
Prosecuting Attorneys’ Retirement Fund (Presented as part of INPRS – a fiduciary in nature component unit)
Plan description. The Prosecuting Attorneys’
Retirement Fund (PARF) is a single-employer (the
State of Indiana) defined benefit plan established to
provide retirement, disability, and survivor benefits to
prosecuting attorneys. Members serve as a: (1)
prosecuting attorney or a chief deputy prosecuting
attorney; or (2) deputy prosecuting attorney, (3)
executive director, or (4) assistant executive director
of the Indiana Prosecuting Attorneys Council.
Administration of the fund is generally in accordance
with IC 33-39-7 and other Indiana pension law.
PARF members are also members of the PERF
Hybrid Plan. According to statute, benefits payable
from PARF are reduced by any benefits payable
from the PERF DB fund.
Retirement benefits provided. A participant is entitled to a full retirement benefit if the participant is: (1) age 65 with at least 8 years of creditable service; or (2) age 55 if age and creditable service total at least 85. A participant is eligible for early retirement benefits at age 62 and 8 years of creditable service with a reduction in the full benefit by 0.25 percent for each month less than age 65. Annual benefit equals highest 12 consecutive months of salary (state-paid portion only) before separation from services times percentage for years of service. 24 percent at eight years of service; increased by three percent per year for years nine through 11; 50 percent at year 12; increased by one percent per year for years 13 through 22 with a maximum of 60 percent, and reduced for any PERF DB benefit. There is no postretirement benefit adjustment provided under this plan.
Disability and survivor benefits provided. A member
with 22+ years of creditable service receives full
benefit. Less than 22 years of creditable service
receives the full benefit reduced by one percent for
each year under 22. Benefit to be no lower than 50
percent.
While in active service, a spouse or dependent children receives the greater of $12,000 annually or 50 percent of benefit for the later of age 62 or the age the day before death. If death occurs while the participant is receiving a benefit, a spouse (for their lifetime), or dependent children (until age 18 unless disabled) receives the greater of $12,000 annually or 50 percent of the member’s benefit. Employees covered by benefit terms. As of June 30, 2020, the PARF membership consisted of:
Inactive employees or beneficiaries
currently receiving benefits 169
Inactive employees entitled to but
not yet receiving benefits 101
Inactive employees entitled to
refunds of contributions 142
Active employees 205
Total 617
Based on census data as of June 30, 2019 used
for the June 30, 2020 actuarial valuation.
109 - State of Indiana - Comprehensive Annual Financial Report

Contributions. Employer contributions are determined by the INPRS Board based on an actuarial valuation and appropriations are received from the state’s general fund. For fiscal year 2020, the appropriation from the state’s General Fund totaled $4.2 million and the Actuarially Determined Contribution (ADC) was $4.6 million. Members are required to contribute six percent of the state-paid portion of salary for a maximum period of 22 years of creatable service. In addition, members are required to contribute three percent as participants of the PERF DC plan. Employers may pay all or part of the member contributions for the member. Financial report. INPRS issues a publicly available stand-alone financial report that includes financial statements and required supplementary information for the plan as a whole. This report may be obtained by writing the Indiana Public Retirement System, One North Capitol, Suite 001, Indianapolis, IN 46204, by calling (844) 464-6777, by emailing [email protected], or by visiting www.in.gov/inprs. Net Pension Liability
The PARF’s net pension liability was measured as of June 30, 2019, and the total pension liability used to calculate the net pension liability was determined by an actuarial valuation as of that date. Actuarial assumptions. The total pension liability in the June 30, 2019 actuarial valuation was determined using the following actuarial assumptions, applied to all periods included in the measurement:
Interest rate/investment return 6.75%
Future salary increases 4.00%
Inflation 2.25%
Cost of living increases N/A
Mortality rates for healthy members were based on the RP-2014 (with MP-2014 improvement removed) White Collar mortality tables, with future mortality improvement projected generationally using future mortality improvement inherent in the Social Security Administration's 2014 Trustee report. Mortality rates for disabled members were based on the RP-2014 (with MP-2014 improvement removed) Disability mortality tables, with future mortality improvement projected generationally using future mortality
improvement inherent in the Social Security Administration's 2014 Trustee report. The most recent comprehensive experience study was completed in April 2015 and was based on member experience between June 30, 2010 and June 30, 2014. The demographic assumptions were updated as needed for the June 30, 2019 actuarial valuation. The long-term return expectation for this INPRS defined benefit retirement plan was determined by using a building-block approach and assumes a time horizon, as defined in the INPRS Investment Policy Statement. A forecasted rate of inflation serves as the baseline for the return expectation. In order to determine the expected long-term nominal rate of return, the asset class geometric real returns are projected for a 30-year time horizon. These returns are combined with a projected covariance matrix and the target asset allocations to create a range of expected long-term real rates of return for the portfolio. A range of possible expected long-term rates of return is created by adding the forecasted inflation to the expected long-term real rates of return. This range ultimately supports the long-term expected rate of return assumption of 6.75% selected by the Board as the discount rate. The assumption is a long-term assumption and is not expected to change with small fluctuations in the underlying inputs, but may change with a fundamental shift in the underlying market factors or
significant asset allocation change. The target
allocation and best estimates of geometric real rates of return for each major asset class are summarized in the following table:
Asset Class
Target
Allocation
(%)
Long-Term
Expected Real
Rate of Return
(%)
Public equity 22.0 4.9
Private equity 14.0 7.0
Fixed income - ex inflation - linked 20.0 2.5
Fixed income - inflation - linked 7.0 1.3
Commodities 8.0 2.0
Real estate 7.0 6.7
Absolute return 10.0 2.9
Risk parity 12.0 5.3
Total 100.0
Discount rate. Total pension liability was calculated
using the discount rate of 6.75 percent. The
projection of cash flows used to determine the
discount rate assumed the contributions from
employers and where applicable from the members,
would at the minimum be made at the actuarially
determined required rates computed in accordance
with the current funding policy adopted by the INPRS
Board, and contributions required by the State of
Comprehensive Annual Financial Report - State of Indiana - 110

Indiana would be made as stipulated by State
statute. Projected inflows from investment earnings
were calculated using the long-term assumed
investment rate of return (6.75 percent). Based on
these assumptions, the PARF defined benefit
pension plan’s fiduciary net position was projected to
be available to make all projected future benefit
payments of current plan members. Therefore, the
long-term expected rate of return on pension plan
investments was applied to all periods of projected
benefits to determine the total pension liability for the
plan.
Changes in the Net Pension Liability
Increase (Decrease)
Total Pension
Liability (a)
Plan Fiduciary
Net Position (b)
Net Pension
Liability (a) - (b)
Balances at 6/30/18 103,284$ 61,019$ 42,265$
Changes for the year:
Service cost 2,031 - 2,031
Interest 6,959 - 6,959
Differences between expected and
actual experience 2,240 - 2,240
Contributions - employer - 3,216 (3,216)
Contributions - employee - 1,307 (1,307)
Net investment income - 4,489 (4,489)
Benefit payments, including refunds
of employee contributions (4,433) (4,433) -
Administrative expense - (75) 75
Net changes 6,797 4,504 2,293
Balances at 6/30/19 110,081$ 65,523$ 44,558$
Sensitivity of the net pension liability to changes in the discount rate. The following presents the net pension liability of the PARF, calculated using the discount rate of 6.75%, as well as what the PARF’s net pension liability would be if it were calculated using a discount rate that is 1-percentage-point lower (5.75%) or 1-percentage-point higher (7.75%) than the current rate:
1% Decrease (5.75%) Current Rate (6.75%) 1% Increase (7.75%)
Net pension liability 58,441 44,558 33,112
Pension plan fiduciary net position. Detailed information about the pension plan’s fiduciary net position is available in the separately issued stand-alone financial report of the Indiana Public Retirement System. This report may be obtained by writing the Indiana Public Retirement System, One North Capitol, Suite 001, Indianapolis, IN 46204, by calling (844) 464-6777, by emailing [email protected], or by visiting www.in.gov/inprs. Pension Expense and Deferred Outflows of Resources and Deferred Inflows of Resources Related to Pensions For the year ended June 30, 2020, the State recognized pension expense of $6.8 million for the PARF. At June 30, 2020, the State reported deferred outflows of resources and deferred inflows of
resources related to pensions for the PARF from the following sources:
Deferred
Outflows of
Resources
Deferred
Inflows of
Resources
Differences between expected and actual
experience 1,107$ -$
Net difference between projected and
actual earnings on pension plan
investments - 832
Employer's contributions to the pension
plan subsequent to the measurement date
of the net pension liability 4,232 -
Total 5,339$ 832$
Deferred outflows of resources in the amount of $4.2 million related to pensions resulting from employer contributions subsequent to the measurement date will be recognized as a reduction of the net pension liability in the fiscal year ended June 30, 2021. Other
111 - State of Indiana - Comprehensive Annual Financial Report

amounts reported as deferred outflows of resources and deferred inflows of resources related to pensions will be recognized in pension expense as follows:
Fiscal year ended
June 30:
Deferred Outflows of
Resources/(Deferred
Inflows of Resources)
2021 1,209
2022 (495)
2023 (366)
2024 (73)
Legislators' Retirement System – Legislators’ Defined Benefit Plan (Presented as part of INPRS – a fiduciary in nature component unit)
Plan description. The Legislators’ Retirement
System is governed by the INPRS Board of
Trustees. The Legislators’ Defined Benefit Plan (LE
DB) is a single-employer (the State of Indiana)
defined benefit plan, providing retirement, disability,
and survivor benefits to members of the General
Assembly who were serving on April 30, 1989, and
filed an election under IC 2-3.5-3-1(b). The fund is
closed to new entrants. Administration of the fund is
generally in accordance with IC 2-3.5 and other
Indiana pension law.
Retirement benefits provided. A participant is entitled to an unreduced monthly retirement benefit (1) at age 65 with at least 10 years of creditable service; (2) at age 60 with at least 15 years of creditable service, or (3) at age 55 if age and creditable service total at least 85. A participant is entitled to early retirement at age 55 and 10 years of creditable service (reduce full benefit by 0.1 percent per month between ages 60 and 65, and by 5/12 percent per month between ages 55 and 60). Early retirement benefits are applicable when the member is no longer serving in the General Assembly and is not receiving, nor entitled to receive, compensation from the state for work in any capacity The annual retirement benefit equals the lesser of: $40 multiplied by 12 months multiplied by years of service before November 8, 1989, or the highest consecutive three-year average annual salary. Postretirement adjustments are granted by the Indiana General Assembly on an ad hoc basis pursuant ti IC 5-10.2-12-4 and administered by the Board. No postretirement adjustment occurred in the year ended June 30, 2020. Disability and survivor benefits provided. Any active member that qualifies for social security disability with at least five years of creditable service may receive an unreduced benefit for the duration of their
disability. If death occurs while in active service, a spouse or dependent children receives 50 percent of the benefit for the later of age 55 or age the day before the member’s death. If death occurs while receiving a benefit, a spouse (for their lifetime), or dependents (until age 18 unless disabled) receives 50 percent of the member’s benefit. Employees covered by benefit terms. As of June 30, 2020, the LEDB Plan membership consisted of:
Retired members, beneficiaries, and
disabled members receiving benefits 79
Inactive vested members entitled to
but not yet receiving benefits 6
Active members: vested and non-
vested 7
Total 92
Based on census data as of June 30, 2019 used
for the June 30, 2020 actuarial valuation.
Contributions. Employer contributions are actuarially
determined and derive from the state’s General
Fund, a portion of which will be allocated to fund a
supplemental reserve account for postretirement
benefits administered by the Board. For the year
ended June 30, 2020, the State of Indiana
appropriated $0.2 million for employer contributions.
The Actuarially Determined Contribution (ADC) for
LEDB was $0.2 million. Financial report. INPRS issues a publicly available stand-alone financial report that includes financial statements and required supplementary information for the plan as a whole. This report may be obtained by writing the Indiana Public Retirement System, One North Capitol, Suite 001, Indianapolis, IN 46204, by calling (844) 464-6777, by emailing [email protected], or by visiting www.in.gov/inprs.
Net Pension Liability
The LEDB Plan’s net pension liability was measured as of June 30, 2019, and the total pension liability used to calculate the net pension liability was determined by an actuarial valuation as of that date. Actuarial assumptions. The total pension liability in the June 30, 2019 actuarial valuation was determined using the following actuarial assumptions, applied to all periods included in the measurement:
Comprehensive Annual Financial Report - State of Indiana - 112

Interest rate/investment return 6.75%
Future salary increases 2.25%
Inflation 2.25%
Cost of living increases No COLA through FY2022
Beginning Jan. 1, 2022 - 0.40%
Beginning Jan. 1, 2034 - 0.50%
Beginning Jan. 1, 2039 - 0.60%
Mortality rates for healthy members were based on the RP-2014 (with MP-2014 improvement removed) White Collar mortality tables, with future mortality improvement projected generationally using future mortality improvement inherent in the Social Security Administration's 2014 Trustee report. Mortality rates for disabled members were based on the RP-2014 (with MP-2014 improvement removed) Disability mortality tables, with future mortality improvement projected generationally using future mortality improvement inherent in the Social Security Administration's 2014 Trustee report. The most recent comprehensive experience study was completed in 2015 and was based on member experience between June 30, 2010 and June 30, 2014. The demographic assumptions were updated as needed for the June 30, 2019 actuarial valuation. The long-term return expectation for this INPRS defined benefit retirement plan was determined by using a building-block approach and assumes a time horizon, as defined in the INPRS Investment Policy Statement. A forecasted rate of inflation serves as the baseline for the return expectation. In order to determine the expected long-term nominal rate of return, the asset class geometric real returns are projected for a 30-year time horizon. These returns are combined with a projected covariance matrix and the target asset allocations to create a range of expected long-term real rates of return for the portfolio. A range of possible expected long-term rates of return is created by adding the forecasted inflation to the expected long-term real rates of return. This range ultimately supports the long-term expected rate of return assumption of 6.75% selected by the Board as the discount rate. The
assumption is a long-term assumption and is not expected to change with small fluctuations in the underlying inputs, but may change with a fundamental shift in the underlying market factors or
significant asset allocation change. The target
allocation and best estimates of geometric real rates of return for each major asset class are summarized in the following table:
Asset Class
Target
Allocation
(%)
Long-Term
Expected Real
Rate of Return
(%)
Public equity 22.0 4.9
Private equity 14.0 7.0
Fixed income - ex inflation - linked 20.0 2.5
Fixed income - inflation - linked 7.0 1.3
Commodities 8.0 2.0
Real estate 7.0 6.7
Absolute return 10.0 2.9
Risk parity 12.0 5.3
Total 100.0
Discount rate. Total pension liability was calculated
using the discount rate of 6.75 percent. The
projection of cash flows used to determine the
discount rate assumed the contributions from
employers and where applicable from the members,
would at the minimum be made at the actuarially
determined required rates computed in accordance
with the current funding policy adopted by the INPRS
Board, and contributions required by the State of
Indiana would be made as stipulated by State
statute. Projected inflows from investment earnings
were calculated using the long-term assumed
investment rate of return (6.75 percent). Based on
these assumptions, the LEDB defined benefit
pension plan’s fiduciary net position was projected to
be available to make all projected future benefit
payments of current plan members, Therefore, the
long-term expected rate of return on pension plan
investments was applied to all periods of projected
benefits to determine the total pension liability for the
plan.
113 - State of Indiana - Comprehensive Annual Financial Report

Changes in the Net Pension Liability
Increase (Decrease)
Total Pension
Liability (a)
Plan Fiduciary
Net Position (b)
Net Pension
Liability (a) - (b)
Balances at 6/30/18 3,484$ 2,942$ 542$
Changes for the year:
Service cost - - -
Interest 224 - 224
Differences between expected and
actual experience 10 - 10
Contributions - employer - 269 (269)
Net investment income - 209 (209)
Benefit payments, including refunds
of employee contributions (356) (356) -
Administrative expense - (38) 38
Net changes (122) 84 (206)
Balances at 6/30/19 3,362$ 3,026$ 336$
Sensitivity of the net pension liability to changes in the discount rate. The following presents the net pension liability of the LEDB Plan, calculated using the discount rate of 6.75%, as well as what the LEDB Plan’s net pension liability would be if it were calculated using a discount rate that is 1-percentage-point lower (5.75%) or 1-percentage-point higher (7.75%) than the current rate:
1% Decrease (5.75%) Current Rate (6.75%) 1% Increase (7.75%)
Net pension liability 559 336 138
Pension plan fiduciary net position. Detailed information about the pension plan’s fiduciary net position is available in the separately issued stand-alone financial report of the Indiana Public Retirement System. This report may be obtained by writing the Indiana Public Retirement System, One North Capitol, Suite 001, Indianapolis, IN 46204, by calling (844) 464-6777, by emailing [email protected], or by visiting www.in.gov/inprs. Pension Expense and Deferred Outflows of Resources and Deferred Inflows of Resources Related to Pensions For the year ended June 30, 2020, the LEDB Plan recognized pension income of $139.7 thousand. At June 30, 2020, the LEDB Plan reported deferred outflows of resources and deferred inflows of resources related to pensions from the following sources:
Deferred
Outflows of
Resources
Deferred
Inflows of
Resources
Net difference between projected and
actual earnings on pension plan
investments -$ 34$
Employer's contributions to the pension
plan subsequent to the measurement date
of the net pension liability 208 -
Total 208$ 34$
Deferred outflows of resources in the amount of $208 thousand related to pensions resulting from employer contributions subsequent to the measurement date will be recognized as a reduction of the net pension liability in the fiscal year ended June 30, 2021. Other amounts reported as deferred outflows of resources and deferred inflows of resources related to pensions will be recognized in pension expense as follows:
Fiscal year ended
June 30:
Deferred Outflows of
Resources/(Deferred
Inflows of Resources)
2021 12
2022 (24)
2023 (18)
2024 (4)
Comprehensive Annual Financial Report - State of Indiana - 114

Judges' Retirement System (Presented as part of INPRS – a fiduciary in nature component unit)
Plan description. The Judges’ Retirement System
(JRS) is a single-employer (State of Indiana) defined
benefit plan providing retirement, disability, and
survivor benefits to members. Membership consists
of individuals who served, are serving, or shall serve
as a regular judge, magistrate, or justice of the (1)
Supreme Court of the state of Indiana, (2) Court of
Appeals, (3) Indiana Tax Court, (4) Circuit Court of a
Judicial Circuit, or (5) county courts including:
Superior, Criminal, Probate, Juvenile, Municipal, and
County. Administration of the fund is generally in
accordance with IC 33-38 and other Indiana pension
law. JRS is governed through the INPRS Board of
Trustees Retirement benefits provided. A member is entitled to a full benefit 1) at age 65 with at least eight years of creditable service, or 2) at age 55 if age and creditable service total at least 85. A member is entitled to an early retirement benefit at age 62 and at least eight years of creditable service but the full benefit is reduced by 0.1 percent for each month less than age 65. The annual retirement benefit equals individual salary, or salary of office at retirement multiplied by percentage for years of service: 24 percent at eight years of service; increased by three percent per year for years nine through 11; 50 percent at year 12; increased by one percent per year for years 13 through 22 with a maximum of 60 percent. Postretirement benefit increases for members (not survivors or disabled members) are equal to the change in the salary of the office at retirement. For the year ended June 30, 2020, a postretirement benefit adjustment of 2.7 percent occurred and was administered by the INPRS Board.
Disability and survivor benefits provided. A qualified member with 22+ years of creditable services receivables an unreduced disability benefit. Members with less than 22 years of creditable service receive the full benefit reduced by one percent for each year under 22 years of creditable service with the benefit to be no lower than 50 percent. If death occurs while in active service with 8+ years of service, or while receiving a benefit, a spouse or dependent children (for their lifetime) receive the greater of $12,000 annually or 50 percent of benefit entitled at the date of death. Employees covered by benefit terms. As of June 30, 2020, the Judges’ Retirement System membership consisted of:
Retired members, beneficiaries, and
disabled members receiving benefits 396
Inactive vested members entitled to
but not yet receiving benefits 24
Inactive non-vested members
entitled to a distribution of
contributions 33
Active members: vested and non-
vested 458
Total 911
Based on census data as of June 30, 2019 used
for the June 30, 2020 actuarial valuation.
Contributions. Employer contributions are determined by the INPRS Board based on an actuarial valuation and are received from the state general fund and certain court and docket fees. For the year ended June 30, 2020, the State of Indiana paid $18.2 million in employer contributions, with appropriations of $11.0 million and $7.2 million in docket and court fees. The Actuarially Determined Contribution (ADC) was $19.4 million.
Members are required to contribute six percent of the member’s salary for a maximum period of 22 years of creditable service. Employers may pay all or part of the member contribution for the member. Financial report. INPRS issues a publicly available stand-alone financial report that includes financial statements and required supplementary information for the plan as a whole. This report may be obtained by writing the Indiana Public Retirement System, One North Capitol, Suite 001, Indianapolis, IN 46204, by calling (844) 464-6777, by emailing [email protected], or by visiting www.in.gov/inprs. Net Pension Liability The JRS’ net pension liability was measured as of June 30, 2019, and the total pension liability used to calculate the net pension liability was determined by an actuarial valuation as of that date. Actuarial assumptions. The total pension liability in the June 30, 2019 actuarial valuation was determined using the following actuarial assumptions, applied to all periods included in the measurement:
Interest rate/investment return 6.75%
Interest on member balances 3.50%
Future salary increases 2.50%
Inflation 2.25%
Cost of living increases 2.50%
115 - State of Indiana - Comprehensive Annual Financial Report

Mortality rates for healthy members were based on the RP-2014 (with MP-2014 improvement removed) White Collar mortality tables, with future mortality improvement projected generationally using future mortality improvement inherent in the Social Security Administration's 2014 Trustee report. Mortality rates for disabled members were based on the RP-2014 (with MP-2014 improvement removed) Disability mortality tables, with future mortality improvement projected generationally using future mortality improvement inherent in the Social Security Administration's 2014 Trustee report. The most recent comprehensive experience study was completed in April 2015 and was based on member experience between June 30, 2010 and June 30, 2014. The demographic assumptions were updated as needed for the June 30, 2019 actuarial valuation. The long-term return expectation for this INPRS defined benefit retirement plan was determined by using a building-block approach and assumes a time horizon, as defined in the INPRS Investment Policy Statement. A forecasted rate of inflation serves as the baseline for the return expectation. In order to determine the expected long-term nominal rate of return, the asset class geometric real returns are projected for a 30-year time horizon. These returns are combined with a projected covariance matrix and the target asset allocations to create a range of expected long-term real rates of return for the portfolio. A range of possible expected long-term rates of return is created by adding the forecasted inflation to the expected long-term real rates of return. This range ultimately supports the long-term expected rate of return assumption of 6.75% selected by the Board as the discount rate. The assumption is a long-term assumption and is not expected to change with small fluctuations in the
underlying inputs, but may change with a fundamental shift in the underlying market factors or
significant asset allocation change. The target
allocation and best estimates of geometric real rates of return for each major asset class are summarized in the following table:
Asset Class
Target
Allocation
(%)
Long-Term
Expected Real
Rate of Return
(%)
Public equity 22.0 4.9
Private equity 14.0 7.0
Fixed income - ex inflation - linked 20.0 2.5
Fixed income - inflation - linked 7.0 1.3
Commodities 8.0 2.0
Real estate 7.0 6.7
Absolute return 10.0 2.9
Risk parity 12.0 5.3
Total 100.0
Discount rate. Total pension liability was calculated using the discount rate of 6.75 percent. The projection of cash flows used to determine the discount rate assumed the contributions from employers and where applicable from the members, would at the minimum be made at the actuarially determined required rates computed in accordance with the current funding policy adopted by the INPRS Board, and contributions required by the State of Indiana would be made as stipulated by State statute. Projected inflows from investment earnings were calculated using the long-term assumed investment rate of return (6.75 percent). Based on these assumptions, the JRS defined benefit pension plan’s fiduciary net position was projected to be available to make all projected future benefit payments of current plan members. Therefore, the long-term expected rate of return on pension plan investments was applied to all periods of projected benefits to determine the total pension liability for the plan.
Comprehensive Annual Financial Report - State of Indiana - 116
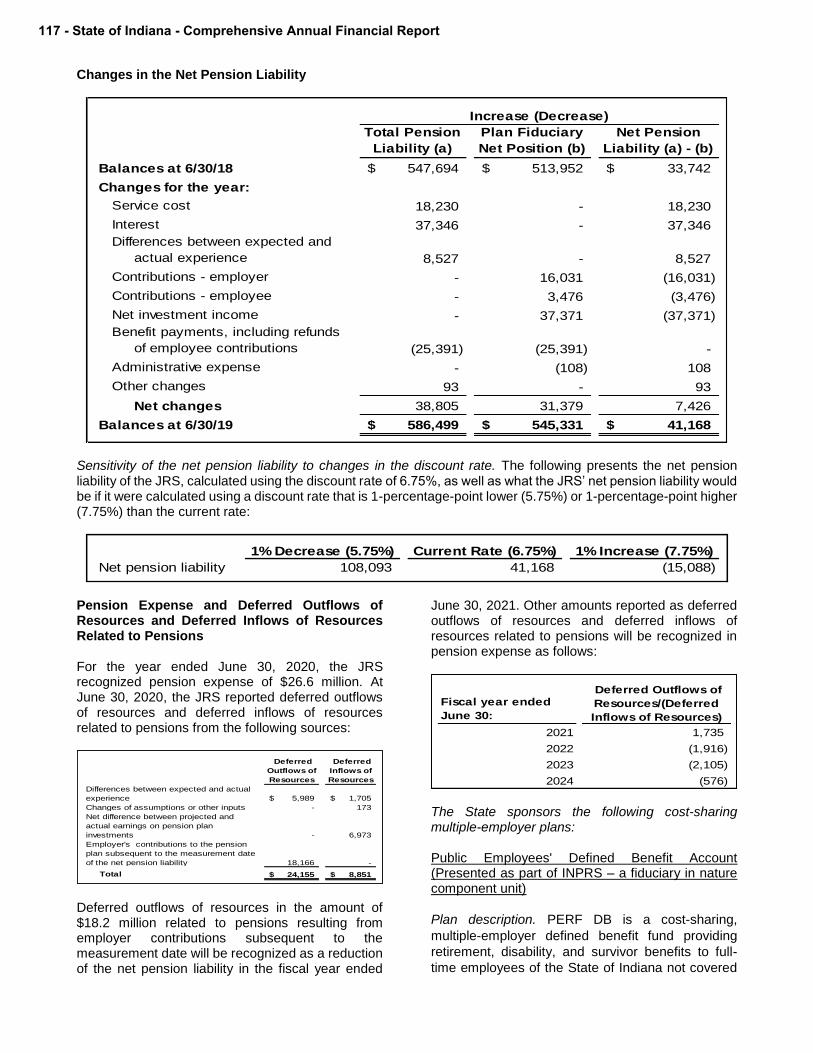
Changes in the Net Pension Liability
Increase (Decrease)
Total Pension
Liability (a)
Plan Fiduciary
Net Position (b)
Net Pension
Liability (a) - (b)
Balances at 6/30/18 547,694$ 513,952$ 33,742$
Changes for the year:
Service cost 18,230 - 18,230
Interest 37,346 - 37,346
Differences between expected and
actual experience 8,527 - 8,527
Contributions - employer - 16,031 (16,031)
Contributions - employee - 3,476 (3,476)
Net investment income - 37,371 (37,371)
Benefit payments, including refunds
of employee contributions (25,391) (25,391) -
Administrative expense - (108) 108
Other changes 93 - 93
Net changes 38,805 31,379 7,426
Balances at 6/30/19 586,499$ 545,331$ 41,168$
Sensitivity of the net pension liability to changes in the discount rate. The following presents the net pension liability of the JRS, calculated using the discount rate of 6.75%, as well as what the JRS’ net pension liability would be if it were calculated using a discount rate that is 1-percentage-point lower (5.75%) or 1-percentage-point higher (7.75%) than the current rate:
1% Decrease (5.75%) Current Rate (6.75%) 1% Increase (7.75%)
Net pension liability 108,093 41,168 (15,088)
Pension Expense and Deferred Outflows of Resources and Deferred Inflows of Resources Related to Pensions For the year ended June 30, 2020, the JRS recognized pension expense of $26.6 million. At June 30, 2020, the JRS reported deferred outflows of resources and deferred inflows of resources related to pensions from the following sources:
Deferred
Outflows of
Resources
Deferred
Inflows of
Resources
Differences between expected and actual
experience 5,989$ 1,705$
Changes of assumptions or other inputs - 173
Net difference between projected and
actual earnings on pension plan
investments - 6,973
Employer's contributions to the pension
plan subsequent to the measurement date
of the net pension liability 18,166 -
Total 24,155$ 8,851$
Deferred outflows of resources in the amount of $18.2 million related to pensions resulting from employer contributions subsequent to the measurement date will be recognized as a reduction of the net pension liability in the fiscal year ended
June 30, 2021. Other amounts reported as deferred outflows of resources and deferred inflows of resources related to pensions will be recognized in pension expense as follows:
Fiscal year ended
June 30:
Deferred Outflows of
Resources/(Deferred
Inflows of Resources)
2021 1,735
2022 (1,916)
2023 (2,105)
2024 (576)
The State sponsors the following cost-sharing multiple-employer plans: Public Employees' Defined Benefit Account (Presented as part of INPRS – a fiduciary in nature component unit)
Plan description. PERF DB is a cost-sharing,
multiple-employer defined benefit fund providing
retirement, disability, and survivor benefits to full-
time employees of the State of Indiana not covered
117 - State of Indiana - Comprehensive Annual Financial Report

by another plan and those political subdivisions
(counties, cities, townships, and other governmental
units) that elect to participate in the retirement fund.
Administration of the fund is generally in accordance
with IC 5-10.2, IC 5-10.3, and 35 IAC 1.2.and other
Indiana pension law. PERF DB is a component of the
Public Employees Hybrid plan (PERF Hybrid).
PERF Hybrid consists of two components: PERF
DB, the monthly employer-funded defined benefit
component, along with the Public Employees Hybrid
Members Defined Contribution Account (PERF DC),
a member-funded account. First time new
employees hired by the State or a participating
political subdivision who offers a choice have a one-
time election to join either the PERF Hybrid plan or
PERF My Choice: Retirement Savings Plan for
Public Employees (PERF MC DC). A new hire that is
an existing member of PERF Hybrid and was not
given the option for the PERF MC DC plan is given
the option to elect PERF MC DC or remain in PERF
Hybrid.
Members who have at least one year of service in
both PERF DB and the Teachers Retirement Fund
(TRF Pre-’96 DB or TRF ’96 DB) have the option of
choosing from which of these funds they would like
to retire. Retirement benefits provided. A member is entitled to a full retirement benefit 1) at age 65 with at least 10 years of creditable service (eight years for certain elected officials), 2) at age 60 with at least 15 years of creditable service, 3) at age 55 if age and creditable service total at least 85, 4) at age 55 with 20 years of creditable service and active as an elected official in the PERF-covered position, or 5) at age 70 with 20 years of creditable service and still active in the PERF-covered position. A member is entitled to an early retirement benefit at age 50 and a minimum of 15 years of creditable service. The benefit is reduced to 44 percent of full benefit at age 50, increasing five percent per year up to 89 percent at age 59. The lifetime annual benefit equals years of creditable service multiplied by the average highest five-year annual salary multiplied by 1.1 percent (minimum of $180 per month). Average annual compensation is outlined in IC 5-10.2-4-3 and includes compensation of not more than $2,000 received from the employer in severance. Postretirement benefit increases are granted on an ad hoc basis pursuant to IC 5-10.2-12-4 and administered by the INPRS Board. For the year ended June 30, 2020, postretirement benefits of
$30.6 million were issued to members as a 13th check. Disability and survivor benefits provided. An active member qualifying for Social Security disability with five years of creditable service may receive an unreduced retirement benefit for the duration of their disability (minimum of $180 per month). If a member dies after June 30, 2018, a spouse or dependent beneficiary of a member with a minimum of 10 years of creditable service receives a benefit as if the member retired the later of age 50 or the age the day before the member’s death. If a member dies while receiving a benefit, a beneficiary receives the benefit associated with the member’s selected form of payment: Five Year Certain & Life, Joint with 100 percent Survivor Benefits, Joint with Two-Thirds Survivor Benefits, or Joint with One-Half
Survivor Benefits.
Employees covered by benefit terms. As of June 30, 2020, there were 1,213 participating political subdivisions in addition to the State. As of June 30, 2020, PERF membership consisted of:
Retired members, beneficiaries, and
disabled members receiving benefits 92,436
Inactive vested members entitled to
but not yet receiving benefits 33,575
Active members: vested and non-
vested 125,780
Total 251,791
Based on census data as of June 30, 2019 used
for the June 30, 2020 actuarial valuation.
Contributions. Contributions are determined by the Board based on an actuarial valuation. Employers contribute 11.2 percent of covered payroll, with 0.43 percent from July 2019 to December 2019 and 0.44 percent from January 2020 to June 2020 funding a supplemental reserve account for postretirement benefits. Contributions from employers with PERF MC DC plan members, who either currently offer or have offered PERF Hybrid, fund PERF DB's unfunded liability at 8.0 percent of covered payroll for the State and 7.3 percent for political subdivisions. No member contributions are required. Financial report. INPRS issues a publicly available stand-alone financial report that includes financial statements and required supplementary information for the plan as a whole. This report may be obtained by writing the Indiana Public Retirement System, One North Capitol, Suite 001, Indianapolis, IN 46204, by calling (844) 464-6777, by emailing
Comprehensive Annual Financial Report - State of Indiana - 118

[email protected], or by visiting www.in.gov/inprs.
Actuarial assumptions. The total pension liability in the June 30, 2019 actuarial valuation was determined using the following actuarial assumptions, applied to all periods included in the measurement:
Interest rate/investment return 6.75%
Future salary increases 2.50% - 4.25%
Inflation 2.25%
Cost of living increases 2019-2021 - 13th check,
Beginning Jan. 1, 2022 - 0.40%
Beginning Jan. 1, 2034 - 0.50%
Beginning Jan. 1, 2039 - 0.60%
Mortality rates for healthy members were based on the RP-2014 (with MP-2014 improvement removed) Total Data Set Mortality Table, with future mortality improvement projected generationally using future mortality improvement inherent in the Social Security Administration's 2014 Trustee report. Mortality rates for disabled members were based on the RP-2014 (with MP-2014 improvement removed) Disability Mortality Table, with future mortality improvement projected generationally using future mortality improvement inherent in the Social Security Administration's 2014 Trustee report. The most recent comprehensive experience study was completed in April 2015 and was based on member experience between June 30, 2010 and June 30, 2014. The demographic assumptions were updated as needed for the June 30, 2019 actuarial valuation. The long-term return expectation for this INPRS defined benefit retirement plan was determined by using a building-block approach and assumes a time horizon, as defined in the INPRS Investment Policy Statement. A forecasted rate of inflation serves as the baseline for the return expectation. In order to determine the expected long-term nominal rate of return, the asset class geometric real returns are projected for a 30-year time horizon. These returns are combined with a projected covariance matrix and the target asset allocations to create a range of expected long-term real rates of return for the
portfolio. A range of possible expected long-term rates of return is created by adding the forecasted inflation to the expected long-term real rates of return. This range ultimately supports the long-term expected rate of return assumption of 6.75% selected by the Board as the discount rate. The assumption is a long-term assumption and is not expected to change with small fluctuations in the underlying inputs, but may change with a fundamental shift in the underlying market factors or
significant asset allocation change. The target
allocation and best estimates of geometric real rates of return for each major asset class are summarized in the following table:
Asset Class
Target
Allocation
(%)
Long-Term
Expected Real
Rate of Return
(%)
Public equity 22.0 4.9
Private equity 14.0 7.0
Fixed income - ex inflation - linked 20.0 2.5
Fixed income - inflation - linked 7.0 1.3
Commodities 8.0 2.0
Real estate 7.0 6.7
Absolute return 10.0 2.9
Risk parity 12.0 5.3
Total 100.0
Discount rate. Total pension liability was calculated using the discount rate of 6.75 percent. The projection of cash flows used to determine the discount rate assumed the contributions from employers and where applicable from the members, would at the minimum be made at the actuarially determined required rates computed in accordance with the current funding policy adopted by the INPRS Board, and contributions required by the State of Indiana would be made as stipulated by State statute. Projected inflows from investment earnings were calculated using the long-term assumed investment rate of return (6.75 percent). Based on these assumptions, the PERF defined benefit pension plan’s fiduciary net position was projected to be available to make all projected future benefit payments of current plan members, Therefore, the long-term expected rate of return on pension plan investments was applied to all periods of projected benefits to determine the total pension liability for the plan.
119 - State of Indiana - Comprehensive Annual Financial Report

Sensitivity of the State’s proportionate share of the net pension liability to changes in the discount rate. The following presents the State’s proportionate share of the net pension liability calculated using the discount rate of 6.75%, as well as what the State’s proportionate share of the net pension liability would be if it were calculated using a discount rate that is 1-percentage-point lower (5.75%) or 1-percentage-point higher (7.75%) than the current rate:
1% Decrease (5.75%) Current Rate (6.75%) 1% Increase (7.75%)
State's proportionate
share of the net pension
liability 1,374,779 856,020 423,335
Pension plan fiduciary net position. Pension plan fiduciary net position. Detailed information about the pension plan’s fiduciary net position is available in the separately issued stand-alone financial report of the Indiana Public Retirement System. This report may be obtained by writing the Indiana Public Retirement System, One North Capitol, Suite 001, Indianapolis, IN 46204, by calling (844) 464-6777, by emailing [email protected], or by visiting www.in.gov/inprs. Pension Liabilities, Pension Expense, and Deferred Outflows of Resources and Deferred Inflows of Resources Related to Pensions At June 30, 2020, the State reported a liability of $856.0 million for its proportionate share of the net pension liability. The PERF net pension liability was measured as of June 30, 2019, and the total pension liability used to calculate the net pension liability was determined by an actuarial valuation as of that date. The State’s proportion of the net pension liability was based on a projection of the State’s long-term share of contributions to the pension plan relative to the projected contributions of all participating employers, actuarially determined. At June 30, 2019, the State’s proportion was 25.90 percent, which was a increase of 0.32 percentage points from its proportion measured as of June 30, 2018. For the year ended June 30, 2020, the State recognized pension expense of $146.1 million. At June 30, 2020, the State reported deferred outflows of resources and deferred inflows of resources related to pensions from the following sources:
Deferred
Outflows of
Resources
Deferred
Inflows of
Resources
Differences between expected and actual
experience 22,667$ -$
Changes of assumptions or other inputs 191 93,056
Net difference between projected and
actual earnings on pension plan
investments - 40,462
Changes in the employer proportion and
differences between the employer's
contributions and the employer's
proportionate share of contributions 12,943 3,122
Employer's contributions to the pension
plan subsequent to the measurement date
of the net pension liability 151,017 -
Total 186,818$ 136,640$
Deferred outflows of resources in the amount of $151.0 million related to pensions resulting from employer contributions subsequent to the measurement date will be recognized as a reduction of the net pension liability in the fiscal year ended June 30, 2021. Other amounts reported as deferred outflows of resources and deferred inflows of resources related to pensions will be recognized in pension expense as follows:
Fiscal year ended
June 30:
Deferred Outflows of
Resources/(Deferred
Inflows of Resources)
2021 (29,232)
2022 (58,764)
2023 (9,701)
2024 (3,142)
Teachers’ 1996 Defined Benefit Account (Presented as part of INPRS – a fiduciary in nature component unit) Plan description. TRF ’96 DB is a cost-sharing, multiple-employer defined benefit fund providing retirement, disability, and survivor benefits. Membership in TRF ’96 DB is required for all legally qualified and regularly employed licensed teachers who serve in the public schools of Indiana, teachers employed by the State at state institutions, and certain INPRS employees. Faculty members and professional employees at Ball State University and Vincennes University have the option of selecting membership in the Fund or an alternate university plan not administered by INPRS. Membership in TRF ’96 DB is optional for teachers employed by charter schools, employees and officials of the Indiana State Board of Education who were Indiana licensed teachers before their employment with the Board, and teachers employed by special management teams as defined under IC 20-31. Administration of the fund is generally in accordance with IC 5-10.2, IC 5-10.4, and 35 IAC 14, and other Indiana pension law. TRF ’96 DB is a component of the Teachers’ Hybrid Plan. The Teachers Hybrid Plan consists of two components: TRF ’96 DB: the monthly employer-funded defined benefit component, along with TRF DC, a member-funded account.
Comprehensive Annual Financial Report - State of Indiana - 120

Retirement benefits provided. A member is entitled to a full retirement benefit 1) at age 65 with at least 10 years of creditable service, 2) at age 60 with at least 15 years of creditable service, 3) at age 55 if age and creditable service total at least 85, 4) at age 55 with 20 years of creditable service and active as an elected official in the TRF-covered position, or 5) at age 70 with 20 years of creditable service and still active in the TRF-covered position. A member is entitled to an early retirement benefit at age 50 and minimum of 15 years of creditable service. The benefit is 44 percent of full benefit at age 50, increasing five percent per year up to 89 percent at age 59. The lifetime annual benefit equals the years of creditable service multiplied by the average highest five-year annual salary multiplied by 1.1 percent (minimum of $185 per month). Average annual compensation is outlined in IC 5-10.2-4-3 and includes compensation of not more than $2,000 received from the employer in severance. Postretirement benefit increases are granted on an ad hoc basis pursuant to IC 5-10.2-12-4 and administered by the INPRS Board. For the year ended June 30, 2020, postretirement benefits of $2.6 million were issued to members as a 13th check. Disability and survivor benefits provided. An active member qualifying for Social Security disability with five years of creditable service may receive an unreduced retirement benefit for the duration of their disability (minimum of $185 per month). Under certain conditions, active TRF members may qualify for a classroom disability benefit of at least $125 per month. If a member dies after June 30, 2018, a spouse or dependent beneficiary of a member with a minimum of 10 years of creditable service receives a benefit as if the member retired the later of age 50 or the age the day before the member’s death. If a member dies while receiving a benefit, a beneficiary receives the benefit associated with the member’s selected form of payment: Five Year Certain & Life, Joint with 100% Survivor Benefits, Joint with Two-Thirds Survivor Benefits, or Joint with One-Half Survivor Benefits. Employees covered by benefit terms. As of June 30, 2020, the number of participating employers was 375 in addition to the State. As of June 30, 2020, TRF 1996 Account membership consisted of:
Retired members, beneficiaries, and
disabled members receiving benefits 7,596
Inactive vested members entitled to
but not yet receiving benefits 6,609
Active members: vested and non-
vested 58,450
Total 72,655
Based on census data as of June 30, 2019 used
for the June 30, 2020 actuarial valuation.
Contributions. Contributions are determined by the INPRS Board based on an actuarial valuation. Employers contribute 5.5 percent of covered payroll, with 0.14 percent funding a supplemental reserve account for future postretirement benefit increases. No member contributions are required. Financial report. INPRS issues a publicly available stand-alone financial report that includes financial statements and required supplementary information for the plan as a whole. This report may be obtained by writing the Indiana Public Retirement System, One North Capitol, Suite 001, Indianapolis, IN 46204, by calling (844) 464-6777, by emailing [email protected], or by visiting www.in.gov/inprs.
Actuarial assumptions. The total pension liability in the June 30, 2019 actuarial valuation was determined using the following actuarial assumptions, applied to all periods included in the measurement:
Interest rate/investment return 6.75%
Future salary increases 2.5% - 12.5%
Inflation 2.25%
Cost of living increases 2019-2021 - 13th check,
Beginning Jan. 1, 2022 - 0.40%
Beginning Jan. 1, 2034 - 0.50%
Beginning Jan. 1, 2039 - 0.60%
Mortality rates for healthy members were based on the RP-2014 (with MP-2014 improvement removed) White Collar mortality tables, with future mortality improvement projected generationally using future mortality improvement inherent in the Social Security Administration's 2014 Trustee report. Mortality rates for disabled members were based on the RP-2014 (with MP-2014 improvement removed) Disability mortality tables, with future mortality improvement projected generationally using future mortality improvement inherent in the Social Security Administration's 2014 Trustee report. The most recent comprehensive experience study was completed in April 2015 and was based on member experience between June 30, 2011 and June 30, 2014. The demographic assumptions were updated as needed for the June 30, 2019 actuarial valuation.
121 - State of Indiana - Comprehensive Annual Financial Report

The long-term return expectation for this INPRS defined benefit retirement plan was determined by using a building-block approach and assumes a time horizon, as defined in the INPRS Investment Policy Statement. A forecasted rate of inflation serves as the baseline for the return expectation. In order to determine the expected long-term nominal rate of return, the asset class geometric real returns are projected for a 30-year time horizon. These returns are combined with a projected covariance matrix and the target asset allocations to create a range of expected long-term real rates of return for the portfolio. A range of possible expected long-term rates of return is created by adding the forecasted inflation to the expected long-term real rates of return. This range ultimately supports the long-term expected rate of return assumption of 6.75% selected by the Board as the discount rate. The assumption is a long-term assumption and is not expected to change with small fluctuations in the underlying inputs, but may change with a fundamental shift in the underlying market factors or
significant asset allocation change. The target
allocation and best estimates of geometric real rates of return for each major asset class are summarized in the following table:
Asset Class
Target
Allocation
(%)
Long-Term
Expected Real
Rate of Return
(%)
Public equity 22.0 4.9
Private equity 14.0 7.0
Fixed income - ex inflation - linked 20.0 2.5
Fixed income - inflation - linked 7.0 1.3
Commodities 8.0 2.0
Real estate 7.0 6.7
Absolute return 10.0 2.9
Risk parity 12.0 5.3
Total 100.0
Discount rate. Total pension liability was calculated using the discount rate of 6.75 percent. The projection of cash flows used to determine the discount rate assumed the contributions from employers and where applicable from the members, would at the minimum be made at the actuarially determined required rates computed in accordance with the current funding policy adopted by the INPRS Board, and contributions required by the State of Indiana would be made as stipulated by State statute. Projected inflows from investment earnings were calculated using the long-term assumed investment rate of return (6.75 percent). Based on these assumptions, the TRF ‘96 defined benefit pension plan’s fiduciary net position was projected to be available to make all projected future benefit payments of current plan members. Therefore, the long-term expected rate of return on pension plan investments was applied to all periods of projected benefits to determine the total pension liability for the plan.
Sensitivity of the State’s proportionate share of the net pension liability to changes in the discount rate. The following presents the State’s proportionate share of the net pension liability calculated using the discount rate of 6.75%, as well as what the State’s proportionate share of the net pension liability would be if it were calculated using a discount rate that is 1-percentage-point lower (5.75%) or 1-percentage-point higher (7.75%) than the current rate:
1% Decrease (5.75%) Current Rate (6.75%) 1% Increase (7.75%)
State's proportionate
share of the net pension
liability 3,028 (495) (3,348)
Pension plan fiduciary net position. Pension plan fiduciary net position. Detailed information about the pension plan’s fiduciary net position is available in the separately issued stand-alone financial report of the Indiana Public Retirement System. This report may be obtained by writing the Indiana Public Retirement System, One North Capitol, Suite 001, Indianapolis, IN 46204, by calling (844) 464-6777, by emailing [email protected], or by visiting www.in.gov/inprs.
Pension Liabilties, Pension Expense, and Deferred Outflows of Resources and Deferred Inflows of Resources Related to Pensions At June 30, 2019, the State reported an asset of $495 thousand for its proportionate share of the net pension liability. The TRF 1996 Account net pension liability was measured as of June 30, 2019, and the total pension liability used to calculate the net pension liability was determined by an actuarial valuation as of that date. The State’s proportion of the net pension liability was based on a projection of
Comprehensive Annual Financial Report - State of Indiana - 122

the State’s long-term share of contributions to the pension plan relative to the projected contributions of all participating employers, actuarially determined. At June 30, 2019, the State’s proportion was 0.34 percent, which was a decrease of 0.01 percentage points from its proportion measured as of June 30, 2018. For the year ended June 30, 2020, the State recognized pension expense of $14.3 million. At June 30, 2020, the State reported deferred outflows of resources and deferred inflows of resources related to pensions from the following sources:
Deferred
Outflows of
Resources
Deferred
Inflows of
Resources
Differences between expected and actual
experience 200$ 562$
Changes of assumptions or other inputs 584 1,124
Net difference between projected and
actual earnings on pension plan
investments - 271
Changes in the employer proportion and
differences between the employer's
contributions and the employer's
proportionate share of contributions 136,071 285
Employer's contributions to the pension
plan subsequent to the measurement date
of the net pension liability 605 -
Total 137,460$ 2,242$
Deferred outflows of resources in the amount of $605.0 thousand related to pensions resulting from employer contributions subsequent to the measurement date will be recognized as a reduction of the net pension liability in the fiscal year ended June 30, 2021. Other amounts reported as deferred outflows of resources and deferred inflows of resources related to pensions will be recognized in pension expense as follows:
Fiscal year ended
June 30:
Deferred Outflows of
Resources/(Deferred
Inflows of Resources)
2021 13,399
2022 13,243
2023 13,281
2024 13,367
2025 13,390
Thereafter 67,933
The State is a non-employer contributing entity in a special funding situation for the following pension plan: State Teachers' Retirement Fund Pre-1996 Account (Presented as part of INPRS – a fiduciary in nature component unit)
Plan description. The Indiana State Teachers'
Retirement Fund Pre-1996 Account (TRF Pre-1996)
is a pay-as-you-go cost-sharing, multiple-employer
defined benefit plan providing retirement, disability,
and survivor benefits for teachers, administrators,
and certain INPRS personnel hired before July 1,
1996. Membership in TRF Pre-’96 DB is closed to
new entrants. Administration of the fund is generally
in accordance with IC 5-10.2, IC 5-10.4, 35 IAC 14,
and other Indiana pension law. TRF Pre-’96 DB is a
component of the Teachers’ Hybrid Plan. The
Teachers’ Hybrid Plan consists of two components:
TRF Pre-’96 DB: the monthly employer-funded
defined benefit component, along with TRF DC, a
member-funded account.
Retirement benefits provided. A member is entitled
to a full retirement benefit 1) at age 65 with at least
10 years of creditable service, 2) at age 60 with at
least 15 years of creditable service, 3) at age 55 if
age and creditable service total at least 85, 4) at age
55 with 20 years of creditable service and active as
an elected official in the TRF-covered position, or 5)
at age 70 with 20 years of creditable service and still
active in the TRF-covered position. A member is
entitled to an early retirement benefit at age 50 and
minimum of 15 years of creditable service. The
benefit is 44 percent of full benefit at age 50,
increasing five percent per year up to 89 percent at
age 59.
The lifetime annual benefit equals the years of
creditable service multiplied by the average highest
five-year annual salary multiplied by 1.1 percent
(minimum of $185 per month). The average annual
compensation is outlined in IC 5-10.2-4-3 and
includes compensation of not more than $2,000
received from the employer in severance.
Postretirement benefit increases are granted on an
ad hoc basis pursuant to IC 5-10.2-12-4 and
administered by the INPRS Board. For the year
ended June 30, 2020, postretirement benefits of
$21.8 million were issued to members as a 13th
check.
Disability and survivor benefits provided. An active
member qualifying for Social Security disability with
five years of creditable service may receive an
unreduced retirement benefit for the duration of their
disability (minimum of $185 per month). Under
certain conditions, active TRF members may qualify
for a classroom disability benefit of at least $125 per
month. If death occurs while in active service, a
spouse or dependent beneficiary of a member with a
minimum of 15 years of creditable service receives a
benefit as if the member retired the later of age 50 or
the age the day before the member’s death. If death
occurs while receiving a benefit, a spouse or
dependent receives the benefit associated with the
123 - State of Indiana - Comprehensive Annual Financial Report

member’s selected form of payment: Five Year
Certain & Life, Joint with 100% Survivor Benefits,
Joint with Two-Thirds Survivor Benefits, or Joint with
One-Half Survivor Benefits. Employees covered by benefit terms. As of June 30, 2020, the number of participating employers was 335 in addition to the State. The State of Indiana makes contributions as the sole nonemployer contributing entity. As of June 30, 2020, TRF Pre-1996 Account membership consisted of:
Retired members, beneficiaries, and
disabled members receiving benefits 53,415
Inactive vested members entitled to
but not yet receiving benefits 2,272
Active members: vested and non-
vested 9,338
Total 65,025
Based on census data as of June 30, 2019 used
for the June 30, 2020 actuarial valuation.
Contributions. According to statute, the TRF Pre-’96
DB fund is funded primarily by appropriations from
the state general fund and lottery proceeds. The
Actuarially Determined Contribution (ADC) for TRF
Pre-’96 DB was $973.5 million. This includes a base
appropriation of $919.0 million, a special
appropriation of $22.1 million for 13th checks, $30.0
million of lottery proceeds to fund the supplemental
reserve account for postretirement benefits, and
$2.4 million of employer contributions from grant
monies. No member contributions are required. Financial report. INPRS issues a publicly available stand-alone financial report that includes financial statements and required supplementary information for the plan as a whole. This report may be obtained by writing the Indiana Public Retirement System, One North Capitol, Suite 001, Indianapolis, IN 46204, by calling (844) 464-6777, by emailing [email protected], or by visiting www.in.gov/inprs. Pension Liabilities, Pension Expense, and Deferred Outflows of Resources and Deferred Inflows of Resources Related to Pensions At June 30, 2020, the State reported a liability of $10,630.0 million for its proportionate share of the net pension liability. The net pension liability was measured as of June 30, 2019, and the total pension liability used to calculate the net pension liability was determined by an actuarial valuation as of that date.
The State’s proportion of the net pension liability was based on a projection of the State’s long-term share of contributions to the pension plan relative to the projected contributions of all participating employers, actuarially determined. At June 30, 2019, the State’s proportion was 100.00 percent, which was the same as its proportion measured as of June 30, 2018. For the year ended June 30, 2020, the State recognized pension expense of $780.9 million. At June 30, 2020, the State reported deferred outflows of resources and deferred inflows of resources related to pensions from the following sources:
Deferred
Outflows of
Resources
Deferred
Inflows of
Resources
Net difference between projected and
actual earnings on pension plan
investments - 76,613
Employer's contributions to the pension
plan subsequent to the measurement date
of the net pension liability 971,219 -
Total 971,219$ 76,613$
$971.2 million reported as deferred outflows of resources resulting from employer contributions subsequent to the measurement date will be recognized as a reduction of the net pension liability in the year ended June 30, 2021. Other amounts reported as deferred outflows of resources and deferred inflows of resources related to pensions will be recognized in pension expense as follows:
Fiscal year ended June 30:
Deferred Outflows of
Resources/(Deferred
Inflows of Resources)
2021 (835)
2022 (41,258)
2023 (29,328)
2024 (5,192)
Actuarial assumptions. The total pension liability in the June 30, 2019 actuarial valuation was determined using the following actuarial assumptions, applied to all periods included in the measurement:
Interest rate/investment return 6.75%
Future salary increases 2.5% - 12.5%
Inflation 2.25%
Cost of living increases 2019-2021 - 13th check,
Beginning Jan. 1, 2022 - 0.40%
Beginning Jan. 1, 2034 - 0.50%
Beginning Jan. 1, 2039 - 0.60%
Mortality rates for healthy members were based on the RP-2014 (with MP-2014 improvement removed) White Collar mortality tables, with future mortality improvement projected generationally using future mortality improvement inherent in the Social Security Administration's 2014 Trustee report. Mortality rates
Comprehensive Annual Financial Report - State of Indiana - 124

for disabled members were based on the RP-2014 (with MP-2014 improvement removed) Disability mortality tables, with future mortality improvement projected generationally using future mortality improvement inherent in the Social Security Administration's 2014 Trustee report. The most recent comprehensive experience study was completed in April 2015 and was based on member experience between June 30, 2011 and June 30, 2014. The demographic assumptions were updated as needed for the June 30, 2019 actuarial valuation. The long-term return expectation for this INPRS defined benefit retirement plan was determined by using a building-block approach and assumes a time horizon, as defined in the INPRS Investment Policy Statement. A forecasted rate of inflation serves as the baseline for the return expectation. In order to determine the expected long-term nominal rate of return, the asset class geometric real returns are projected for a 30-year time horizon. These returns are combined with a projected covariance matrix and the target asset allocations to create a range of expected long-term real rates of return for the portfolio. A range of possible expected long-term rates of return is created by adding the forecasted inflation to the expected long-term real rates of return. This range ultimately supports the long-term expected rate of return assumption of 6.75% selected by the Board as the discount rate. The assumption is a long-term assumption and is not expected to change with small fluctuations in the underlying inputs, but may change with a fundamental shift in the underlying market factors or
significant asset allocation change. The target
allocation and best estimates of geometric real rates of return for each major asset class are summarized in the following table:
Asset Class
Target
Allocation
(%)
Long-Term
Expected Real
Rate of Return
(%)
Public equity 22.0 4.9
Private equity 14.0 7.0
Fixed income - ex inflation - linked 20.0 2.5
Fixed income - inflation - linked 7.0 1.3
Commodities 8.0 2.0
Real estate 7.0 6.7
Absolute return 10.0 2.9
Risk parity 12.0 5.3
Total 100.0
Discount rate. Total pension liability was calculated using the discount rate of 6.75 percent. The projection of cash flows used to determine the discount rate assumed the contributions from employers and where applicable from the members, would at the minimum be made at the actuarially determined required rates computed in accordance with the current funding policy adopted by the INPRS Board, and contributions required by the State of Indiana would be made as stipulated by State statute. Projected inflows from investment earnings were calculated using the long-term assumed investment rate of return (6.75 percent). Based on these assumptions, the TRF Pre-‘96 defined benefit pension plan’s fiduciary net position was projected to be available to make all projected future benefit payments of current plan members, Therefore, the long-term expected rate of return on pension plan investments was applied to all periods of projected benefits to determine the total pension liability for the plan.
Sensitivity of the State’s proportionate share of the net pension liability to changes in the discount rate. The following presents the State’s proportionate share of the net pension liability calculated using the discount rate of 6.75%, as well as what the State’s proportionate share of the net pension liability would be if it were calculated using a discount rate that is 1-percentage-point lower (5.75%) or 1-percentage-point higher (7.75%) than the current rate:
1% Decrease (5.75%) Current Rate (6.75%) 1% Increase (7.75%)
State's proportionate
share of the net pension
liability 11,949,033 10,630,019 9,494,757
Pension plan fiduciary net position. Detailed information about the pension plan’s fiduciary net position is available in the separately issued stand-alone financial report of the Indiana Public Retirement System. This report may be obtained by
writing the Indiana Public Retirement System, One North Capitol, Suite 001, Indianapolis, IN 46204, by calling (844) 464-6777, by emailing [email protected], or by visiting www.in.gov/inprs.
125 - State of Indiana - Comprehensive Annual Financial Report

Pension Amounts Summary – Defined Benefit Plans A summary of the pension amounts disclosed in the notes for the defined benefit plans is provided in the following table.
Plan
Total
Pension
Liability
Fiduciary
Net Position
Net Pension
Liability
Deferred
Outflows of
Resources
Deferred
Inflows of
Resources
Pension
Expense
SPRF 686,224$ 491,293$ 194,931$ 79,961$ 15,819$ 51,074$
SPST 16,247 - 16,247 3,004 3,228 5,157
EG&C 152,207 142,115 10,092 13,222 8,996 4,546
PARF 110,081 65,523 44,558 5,339 832 6,797
LE DB 3,362 3,026 336 208 34 140
JRS 586,499 545,331 41,168 24,155 8,851 26,569
PERF 4,293,241 3,437,221 856,020 186,818 136,640 146,118
TRF 1996 20,590 21,085 (495) 137,460 2,242 14,259
TRF Pre-1996 14,389,164 3,759,145 10,630,019 971,219 76,613 780,897
Total 20,257,615$ 8,464,739$ 11,792,876$ 1,421,386$ 253,255$ 1,035,557$
The State contributes to the following defined contribution plans: My Choice (PERF MC DC) – State Employees’ Defined Contribution Plan (Presented as part of INPRS – a fiduciary in nature component unit)
PERF MC DC is a multiple employer defined
contribution fund providing retirement benefits to full-
time employees of the State of Indiana not covered
by another plan and those political subdivisions
(counties, cities, townships, and other governmental
units) that elected to participate in the retirement
fund. PERF MC DC is the primary defined
contribution benefit plan for members making this
election. Administration of the account is generally in
accordance with other Indiana pension law.
First time new employees hired by the State of Indiana or a political subdivision who offer a choice have a one-time election to join either PERF Hybrid or PERF My Choice. A state hire that is an existing member of PERF Hybrid plan and was not given the option for PERF My Choice is given the option to elect PERF My Choice or remain in PERF Hybrid. The PERF MC DC plan may be funded with an employer variable rate contribution. The variable rate contribution is three percent for state employees and up to 3.9 percent for political subdivision members. Political subdivisions may match 50 percent of a member’s voluntary contributions. Member contributions under the PERF MC DC are set by statute and the INPRS Board at three percent
of covered payroll. The employer may choose to make these contributions on behalf of the member. Under certain limitations, voluntary member contributions up to 10 percent can be made solely by the member. The state contributed 3.0% to My Choice members’ accounts during the fiscal year ended June 30, 2020. My Choice members totaled 6,237 as of June 30, 2020. Members are entitled to the total of vested contributions plus earnings 30 days after separation from employment (retirement, termination, disability, or death). The amount may be paid in a lump sum, partial lump sum, direct rollover to another eligible retirement plan, or a monthly annuity (in accordance with INPRS requirements). PERF MC DC members are 100 percent vested in their member contributions. PERF MC DC members vest in employer contributions in increments of 20 percent for each full year of service until 100 percent is reached at 5 years. Upon providing proof of the member’s qualification for social security disability benefits, the member is entitled to the sum total of vested contributions plus earnings. The amount may be paid in a lump sum, direct rollover to another eligible retirement plan, or a monthly annuity (in accordance with INPRS requirements). The survivor benefit is that the beneficiary is entitled to the sum total of vested contributions plus earnings. The amount may be paid in a lump sum,
Comprehensive Annual Financial Report - State of Indiana - 126

direct rollover to another eligible retirement plan, or a monthly annuity (in accordance with INPRS requirements). Legislators' Retirement System – Legislators’ Defined Contribution Plan (Presented as part of INPRS – a fiduciary in nature component unit)
The Legislators’ Defined Contribution plan is a
single-employer (State of Indiana) defined
contribution fund that provides retirement benefits to
members of the General Assembly. Administration of
the fund is generally in accordance with IC 2-3.5 and
other Indiana pension law. Effective January 1, 2019,
members of the fund can no longer invest in the
Consolidated Defined Benefit Assets.
Members are entitled to the total of vested
contributions plus earnings. The amount may be paid
in a lump sum, partial lump sum, direct rollover to
another eligible retirement plan, monthly annuity, or
installment options (in accordance with INPRS
requirements).
If a participant dies their beneficiary is entitled to the
total of contributions plus earnings. The amount can
be paid in a lump sum, direct rollover to another
eligible retirement plan, or a monthly annuity (in
accordance with INPRS requirements.
Contributions are determined by the INPRS Board and confirmed by the State Budget Agency. The employer contribution rate is 14.2 percent of covered payroll. This rate may not exceed the sum contribution rates for State of Indiana employer and member PERF Hybrid plans. The member contribution is five percent of member’s salary. The employer may choose to make contributions on behalf of the member. F. Other Postemployment Benefits Defined Benefit Plans Plan Descriptions. The State of Indiana sponsors and contributes to four single-employer defined benefit healthcare plans: State Personnel Plan (SPP); Legislature Plan (LP); Indiana State Police Plan (ISPP); and the Conservation and Excise Police Plan (CEPP). The SPP and LP are administered by the State Personnel Department. The Indiana State Police administer the ISPP. The CEPP is administered by the Indiana State Excise Police and Indiana Conservation Officers Health Insurance
Committee. The SPP, ISPP, and CEPP are administered through trusts that meet the criteria in GASB 74. The LP is not administered through a trust that meets the requirements of GASB 74 and is not accumulating assets. Benefits Provided. All four plans provide medical plan health care benefits to eligible State employee retirees and beneficiaries. The medical benefits provided to retirees are the same benefit options afforded active employees. Benefit provisions for each plan are established and may be amended by Indiana Code 5-10-8 et seq. Separate financial reports are not issued for these plans. Employees covered by benefit terms. As of June 30, 2019, and June 30, 2020, membership in the plans consisted of:
SPP ISPP CEPP LP
Inactive employees or beneficiaries currently
receiving benefit payments552 1,076 198 34
Active employees 25,659 1,688 244 113
Total 26,211 2,764 442 147
Based on census data as of June 30, 2018 used for the June 30, 2019 actuarial valuation.
Contributions. Actuarially determined contributions (ADC) are determined for these plans by the actuary. The state determines the contributions to make for these plans after considering its other needs and the OPEB participants’ needs. For the SPP, the state contributes at least the ADC annually. The ISPP has established a 401(h) and section 115 trust for the purpose of funding retiree OPEB. Contributions to the 401(h) and section 115 trust are made from the following sources: 1) Medicare Part D retiree drug subsidy reimbursement; 2) excess long-term disability fund; 3) retiree premiums 4) state contributions for ISP active employees in accordance with the OPEB DC plan (501 plan); and 5) discretionary contributions from the ISP healthcare fund up to $1 million. Additionally, active ISP employees contribute $20 per paycheck towards the 401(h) trust account. This ISP funding policy is expected to continue for the foreseeable future. The annual cost of the CEPP is financed on a pay-as-you-go basis from state subsidies, active/retiree contributions, and a discretionary contribution from the CEPP reserve fund. Retiree participants pay the full premium rate as determined by the administrators of these plans.
127 - State of Indiana - Comprehensive Annual Financial Report
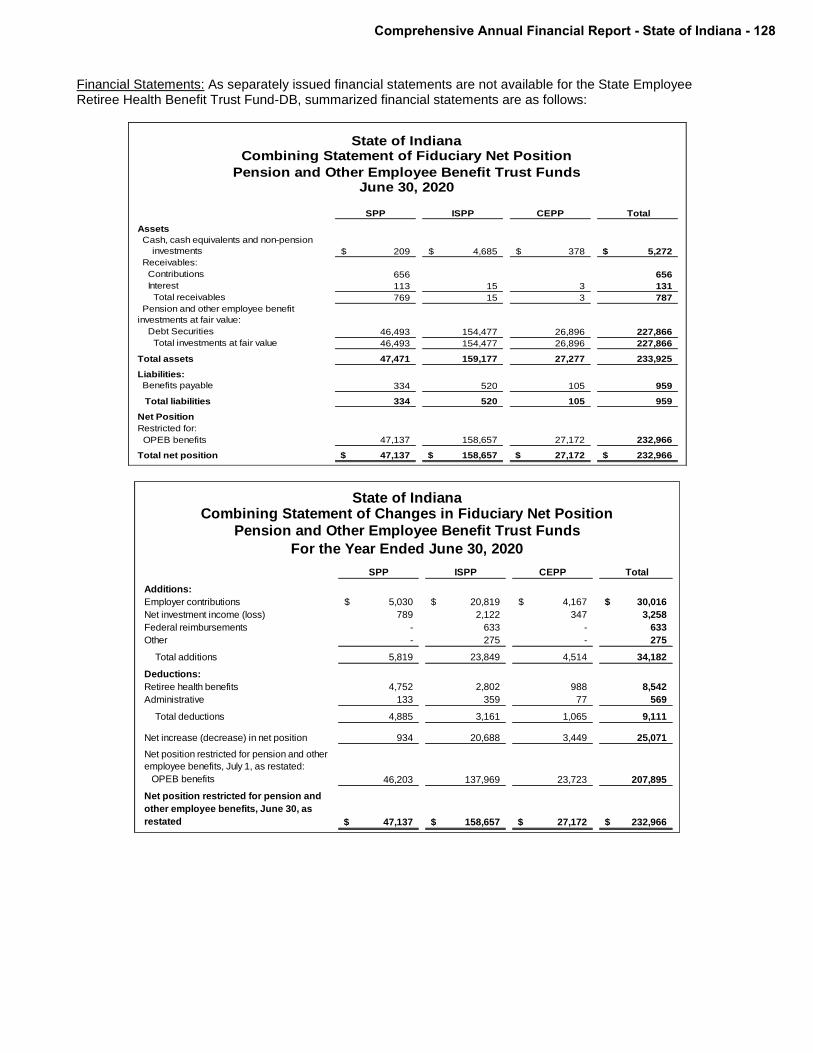
Financial Statements: As separately issued financial statements are not available for the State Employee Retiree Health Benefit Trust Fund-DB, summarized financial statements are as follows:
State of IndianaCombining Statement of Fiduciary Net Position
Pension and Other Employee Benefit Trust FundsJune 30, 2020
SPP ISPP CEPP Total
Assets
Cash, cash equivalents and non-pension
investments 209$ 4,685$ 378$ 5,272$
Receivables:
Contributions 656 656
Interest 113 15 3 131
Total receivables 769 15 3 787
Pension and other employee benefit
investments at fair value:
Debt Securities 46,493 154,477 26,896 227,866
Total investments at fair value 46,493 154,477 26,896 227,866
Total assets 47,471 159,177 27,277 233,925
Liabilities:
Benefits payable 334 520 105 959
Total liabilities 334 520 105 959
Net Position
Restricted for:
OPEB benefits 47,137 158,657 27,172 232,966
Total net position 47,137$ 158,657$ 27,172$ 232,966$
State of IndianaCombining Statement of Changes in Fiduciary Net Position
Pension and Other Employee Benefit Trust Funds
For the Year Ended June 30, 2020
SPP ISPP CEPP Total
Additions:
Employer contributions 5,030$ 20,819$ 4,167$ 30,016$
Net investment income (loss) 789 2,122 347 3,258
Federal reimbursements - 633 - 633
Other - 275 - 275
Total additions 5,819 23,849 4,514 34,182
Deductions:
Retiree health benefits 4,752 2,802 988 8,542
Administrative 133 359 77 569
Total deductions 4,885 3,161 1,065 9,111
Net increase (decrease) in net position 934 20,688 3,449 25,071
Net position restricted for pension and other
employee benefits, July 1, as restated:
OPEB benefits 46,203 137,969 23,723 207,895
Net position restricted for pension and
other employee benefits, June 30, as
restated 47,137$ 158,657$ 27,172$ 232,966$
Comprehensive Annual Financial Report - State of Indiana - 128

Net OPEB Liability The net OPEB liability was measured as of June 30, 2019, and the total OPEB liability used to calculate the net OPEB liability was determined by an actuarial valuation as of that date. The components of the net OPEB liability of the three plans administered through trusts at June 30, 2019 were as follows:
SPP ISPP CEPP
Total OPEB liability $57,424 $198,445 $76,899
Plan fiduciary net position 46,203 137,969 23,723
Net OPEB liability $11,221 $ 60,476 $53,176
Plan fiduciary net position as
a percentage of the total
OPEB liability
80.5% 69.5% 30.8%
The components of the net OPEB liability for the three OPEB plans administered through trusts at June 30, 2020 was:
SPP ISPP CEPP
Total OPEB liability $52,311 $177,448 $49,275
Plan fiduciary net position 47,137 158,657 27,172
Net OPEB liability $ 5,174 $ 18,791 $22,103
Plan fiduciary net position as
a percentage of the total
OPEB liability
90.1% 89.4% 55.1%
Actuarial assumptions. The total OPEB liability in the June 30, 2019 actuarial valuation was determined using the following actuarial assumptions, applied to all periods included in the measurement.
Description SPP ISPP CEPP LP
Inflation 2.25% 2.25% 2.25% 2.25%
Salary increases 2.25% for general
wage inflation plus
merit and
productivity
increases as
follows: Ages 20
and 30, 2.0%; age
40, 1.5%, and age
50, 1.0%
2.25% for general
wage inflation plus
0.25% for merit
and productivity
increases
2.25% for general
wage inflation plus
0.25% for merit
and productivity
increases
2.25% for general
wage inflation plus
merit and
productivity
increases as
follows: Ages 20
and 30, 2.0%; age
40, 1.5%, and age
50, 1.0%
Investment rate of return 3.26% 6.20% 3.36% 3.51%
Healthcare cost trend rates 8.0% decreasing
0.5% per year to
an ultimate rate of
4.5%
8.0% decreasing
0.5% per year to
an ultimate rate of
4.5%
8.0% decreasing
0.5% per year to
an ultimate rate of
4.5%
8.0% decreasing
0.5% per year to
an ultimate rate of
4.5%
For SPP and LP, mortality rates were based on the SS-2012 Employee and Annuitant Mortality Table fully generational using SSA scale. For ISPP and CEPP, mortality rates were based on the SS-2012 Total Dataset Mortality Table with blue collar adjustment fully generational using SSA scale. For SPP and CEPP, the most recent comprehensive experience study was based on member experience between June 30, 2010 and June 30, 2014. For ISPP, the most recent comprehensive experience study was based on member experience between July 1, 2005 through June 20, 2010. For LP, the most recent comprehensive experience study was based on professional judgement and limited experience through 2008. Discount Rate. For SPP for the June 30, 2019 valuation, the long-term expected rate of return on OPEB plan
investment is 3.25%. This was determined using a building block method in which expected future real rates of return (expected returns, net of OPEB plan investment expense and inflation) are developed for each major asset class. These expected future real rates of return are then combined to produce the long-term expected rate of return by weighting them based on the target asset allocation percentage and adding in expected inflation (2.25%). The best estimates of arithmetic real rates of return for each major asset class included in the SPP OPEB Plan’s target asset allocation as of June 30, 2019 are summarized in the following table:
State Personnel Plan
Asset Class
Target
Allocation
(%)
Long-Term
Expected Real
Rate of Return
(%)
U.S. Bond 100.0 1.0
129 - State of Indiana - Comprehensive Annual Financial Report

The discount rate used to measure the total OPEB liability for SPP was 3.26 percent as of June 30, 2019 and applied to all periods of projected benefit payments to determine the total OPEB liability. The change in the discount rate from the 2018 to the 2019 actuarial valuations was .61%, lowering the rate to 3.26%. The projection of cash flows used to determine the discount rate assumed that the State’s contributions to this plan will be made at a rate equal to the actuarially determined rate. The discount rate of 3.25% was used in calculating the actuarially determined contribution for this plan. For ISPP for the June 30, 2019 valuation, the long-term expected rate of return on OPEB plan investments is 6.20%. The expected future real rates of return are shown below. Inflation is expected to be 2.25% the best estimate of arithmetic real rates of return for each major asset class included in the ISPP OPEB Plan’s target asset allocation as of June 20, 2019 are summarized in the following table.
State Police Plan
Asset Class
Target
Allocation
(%)
Long-Term
Expected Real
Rate of Return
(%)
Broad US Equity 29.0 6.9
Global ex-US Equity 13.0 7.1
Domestic Fixed 17.0 2.6
High Yield 5.0 3.0
Short Duration 4.0 4.8
Cash Equivalents 2.0 5.1
Hedge Funds 25.0 5.8
Real Estate 5.0 2.3
Total 100.0
The discount rate used to measure the total OPEB liability for ISPP was 6.20 percent as of June 30, 2019 and applied to all periods of projected benefit payments to determine the total OPEB liability. The change in the discount rate from the 2018 to the 2019 actuarial valuations was 2.33%, raising the rate to 6.20%. The projection of cash flows used to determine the discount rate assumed that the State will continue to make contributions equal to the benefit payments each year plus additional prefunding contributions of $17.5 million per year (based on actual pre-funding contributions over the past four years) until the trust is sufficient to pay all future benefits. The discount rate of 6.20% was used in calculating the actuarially determined contribution
for this plan. For CEPP for the June 30, 2019 valuation, the long-term expected rate of return on OPEB plan investment is 3.25%. This was determined using a building block method in which expected future real rates of return (expected returns, net of OPEB plan investment expense and inflation) are developed for each major asset class. These expected future real rates of return are then combined to produce the long-term expected rate of return by weighting them based on the target asset allocation percentage and adding in expected inflation (2.25%). The best estimates of arithmetic real rates of return for each major asset class included in the CEPP OPEB Plan’s target asset allocation as of June 30, 2019 are summarized in the following table:
Conservation & Excise Officers Plan
Asset Class
Target
Allocation
(%)
Long-Term
Expected Real
Rate of Return
(%)
U.S. Bond 100.0 1.0
The discount rate used to measure the total OPEB liability for CEPP was 3.36 percent as of June 30, 2019 and applied to all periods of projected benefit payments to determine the total OPEB liability. The change in the discount rate from the 2018 to the 2019 actuarial valuations was 0.51%, lowering the rate to 3.36%. The projection of cash flows used to determine the discount rate assumed that the State will continue to make contributions equal to the benefit payments each year plus additional pre-funding contributions of $2.8 million per year (based on actual pre-funding contributions over the past four years). The discount rate of 3.25 was used in calculating the actuarially determined contribution for this plan. For LP for the June 20, 2019 valuation, the discount rate used to measure the total OPEB liability was 3.51% and applied to all periods of projected benefit payments to determine the total OPEB liability. The change in the discount rate from the 2018 to the 2019 actuarial valuations was 0.36%, lowering the rate to 3.51%.
Comprehensive Annual Financial Report - State of Indiana - 130

Actuarial assumptions. The total OPEB liability in the June 30, 2020 actuarial valuation was determined using the following actuarial assumptions, applied to all periods included in the measurement.
Description SPP ISPP CEPP LP
Inflation 2.25% 2.25% 2.25% 2.25%
Salary increases 2.75% for general
wage inflation plus
merit and
productivity
increases based on
the assumptions
approved from the
INPRS 2020
Experience Study.
Pre-1987 Plan,
3.5%. 1987 Plan
as follows: Age
26, 9.0%; age 31,
6.5%, and age
36+, 4.0%
2.75% for general
wage inflation plus
merit and productivity
increases based on
the assumptions
approved from the
INPRS 2020
Experience Study.
2.25% for general
wage inflation plus
0.50% for merit
and productivity
increases
Investment rate of return 3.23% 6.20% 6.20% 2.66%
Healthcare cost trend rates 7.5% decreasing
0.5% per year to an
ultimate rate of
4.5%
7.5% decreasing
0.5% per year to
an ultimate rate of
4.5%
7.5% decreasing
0.5% per year to an
ultimate rate of 4.5%
7.5% decreasing
0.5% per year to
an ultimate rate of
4.5%
For SPP and LP, mortality rates were based on the following: For Healthy Judges/PARF employees and retirees: SOA Pub-2010 General Headcount Weighted Mortality Table fully generational using Scale MP-2019 with a 1 year setback for males and a 1 year setback for females. For all other healthy employees and retirees: SOA Pub-2010 General Headcount Weighted Mortality Table fully generational using Scale MP-2019 with a 3 year set forward for males and a 1 year set forward for females. For disabled retirees: SOA Pub-2010 General Disabled Retiree Headcount Weighted Mortality Table fully generational using Scale MP-2019 with a 140% load. For surviving spouses: SOA Pub-2010 Continuing Survivor Headcount Weighted Mortality Table fully generational using Scale MP-2019 with no set forward for males and a 2 year set forward for females. For ISPP and CEPP, mortality rates were based on the following: For Healthy employees and retirees: SOA Pub-2010 Public Safety Headcount Weighted Mortality Table fully generational using Scale MP-2019 with a 3 year set forward for males no set forward for females. For disabled retirees: SOA Pub-2010 General Disabled Retiree Headcount Weighted Mortality Table fully generational using Scale MP-2019. For surviving spouses: SOA Pub-2010 Continuing Survivor Headcount Weighted Mortality Table fully generational using Scale MP-2019 with no set forward for males and a 2 year set forward for females. For SPP and CEPP, the most recent comprehensive experience study was completed in February 2020 and was based on member experience between June 30, 2014 and June 30, 2019. For ISPP, the most recent comprehensive experience study was completed in July 2020 and was based on member experience between June 30, 2011 through June 30, 2019. For LP, the most recent comprehensive
experience study was based on professional judgement and limited experience through 2008. Discount Rate. For SPP for the June 30, 2020 valuation, the long-term expected rate of return on OPEB plan investment is 3.25%. This was determined using a building block method in which expected future real rates of return (expected returns, net of OPEB plan investment expense and inflation) are developed for each major asset class. These expected future real rates of return are then combined to produce the long-term expected rate of return by weighting them based on the target asset allocation percentage and adding in expected inflation (2.25%). The best estimates of arithmetic real rates of return for each major asset class included in the SPP OPEB Plan’s target asset allocation as of June 30, 2020 are summarized in the following table:
State Personnel Plan
Asset Class
Target
Allocation
(%)
Long-Term
Expected Real
Rate of Return
(%)
U.S. Bond 100.0 1.0
The discount rate used to measure the total OPEB liability for SPP was 3.23 percent as of June 30, 2020 and applied to all periods of projected benefit payments to determine the total OPEB liability. The change in the discount rate from the 2019 to the 2020 actuarial valuations was .03%, lowering the rate to 3.23%. The projection of cash flows used to determine the discount rate assumed that the State’s contributions to this plan will be made at a rate equal to the actuarially determined rate. The discount rate of 3.25% was used in calculating the actuarially determined contribution for this plan
131 - State of Indiana - Comprehensive Annual Financial Report

For ISPP for the June 30, 2020 valuation, the long-term expected rate of return on OPEB plan investments is 6.20%. The expected future real rates of return are shown below. Inflation is expected to be 2.25% the best estimate of arithmetic real rates of return for each major asset class included in the ISPP OPEB Plan’s target asset allocation as of June 20, 2020 are summarized in the following table.
State Police Plan
Asset Class
Target
Allocation
(%)
Long-Term
Expected Real
Rate of Return
(%)
Broad US Equity 29.0 6.9
Global ex-US Equity 13.0 7.1
Domestic Fixed 17.0 3.0
High Yield 5.0 4.8
Short Duration 4.0 2.6
Cash Equivalents 2.0 2.3
Hedge Funds 25.0 5.1
Real Estate 5.0 5.8
Total 100.0
The discount rate used to measure the total OPEB liability for SPP was 6.20 percent as of June 30, 2020 and applied to all periods of projected benefit payments to determine the total OPEB liability. There was no change in the discount rate from the 2019 to the 2020 actuarial valuations. The projection of cash flows used to determine the discount rate assumed that the State will continue to make contributions equal to the benefit payments each year plus additional prefunding contributions of $17.5 million per year (based on actual pre-funding contributions over the past four years) until the trust is sufficient to pay all future benefits. The discount rate of 6.20 was used in calculating the actuarially determined contribution for this plan. For CEPP for the June 30, 2020 valuation, the long-term expected rate of return on OPEB plan investment is 6.20% which is based on the asset allocation being similar to the investment of the ISP OPEB Trust. Inflation is expected to be 2.25%. The best estimates of arithmetic real rates of return for each major asset class included in the CEPP OPEB Plan’s target asset allocation as of June 30, 2020 are summarized in the following table:
Conservation & Excise Officers Plan
Asset Class
Target
Allocation
(%)
Long-Term
Expected Real
Rate of Return
(%)
Broad US Equity 29.0 6.9
Global ex-US Equity 13.0 7.1
Domestic Fixed 17.0 3.0
High Yield 5.0 4.8
Short Duration 4.0 2.6
Cash Equivalents 2.0 2.3
Hedge Funds 25.0 5.1
Real Estate 5.0 5.8
Total 100.0
The discount rate used to measure the total OPEB liability for CEPP was 6.20 percent as of June 30, 2020 and applied to all periods of projected benefit payments to determine the total OPEB liability. The change in the discount rate from the 2019 to the 2020 actuarial valuations was 2.84%, raising the rate to 6.20%. The projection of cash flows used to determine the discount rate assumed that the State will continue to make contributions equal to the benefit payments each year plus additional pre-funding contributions of $2.9 million per year (based on actual pre-funding contributions over the past four years). The discount rate of 6.20% was used in calculating the actuarially determined contribution for this plan. For LP for the June 20, 2020 valuation, the discount rate used to measure the total OPEB liability was 2.66% and applied to all periods of projected benefit payments to determine the total OPEB liability. The change in the discount rate from the 2019 to the 2020 actuarial valuations was 0.85%, lowering the rate to 2.66%. Changes in the Net/Total OPEB Liability
State Personnel Plan Increase (Decrease)
Total OPEB
Liability (a)
Plan Fiduciary
Net Position (b)
Net OPEB
Liability (a) - (b)
Balances at 6/30/18 47,525$ 45,489$ 2,036$
Changes for the year:
Service cost 1,934 - 1,934
Interest 1,851 - 1,851
Differences between expected and
actual experience 6,587 - 6,587
Changes of assumptions or other
inputs 2,803 - 2,803
Contributions - employer - 3,337 (3,337)
Net investment income - 1,007 (1,007)
Benefit payments, including refunds
of employee contributions (3,276) (3,276) -
Administrative expense - (354) 354
Net changes 9,899 714 9,185
Balances at 6/30/19 57,424$ 46,203$ 11,221$
Indiana State Police Increase (Decrease)
Total OPEB
Liability (a)
Plan Fiduciary
Net Position (b)
Net OPEB
Liability (a) - (b)
Balances at 6/30/18 324,517$ 117,363$ 207,154$
Changes for the year:
Service cost 8,530 - 8,530
Interest 12,778 - 12,778
Changes in benefit terms 3,254 - 3,254
Differences between expected and
actual experience (78,675) - (78,675)
Changes of assumptions or other
inputs (66,154) - (66,154)
Contributions - employer - 23,937 (23,937)
Contributions - employee - 857 (857)
Net investment income - 2,109 (2,109)
Benefit payments, including refunds
of employee contributions (5,805) (5,805) -
Administrative expense - (492) 492
Net changes (126,072) 20,606 (146,678)
Balances at 6/30/19 198,445$ 137,969$ 60,476$
Comprehensive Annual Financial Report - State of Indiana - 132

Conservation & Excise Police Plan Increase (Decrease)
Total OPEB
Liability (a)
Plan Fiduciary
Net Position (b)
Net OPEB
Liability (a) - (b)
Balances at 6/30/18 60,903$ 20,236$ 40,667$
Changes for the year:
Service cost 1,840 - 1,840
Interest 2,410 - 2,410
Changes in benefit terms 2,113 - 2,113
Differences between expected and
actual experience 4,353 - 4,353
Changes of assumptions or other
inputs 6,223 - 6,223
Contributions - employer - 4,021 (4,021)
Net investment income - 493 (493)
Benefit payments, including refunds
of employee contributions (943) (943) -
Administrative expense - (84) 84
Net changes 15,996 3,487 12,509
Balances at 6/30/19 76,899$ 23,723$ 53,176$
Legislature Plan Increase (Decrease)
Total OPEB
Liability (a)
Balances at 6/30/18 9,995$
Changes for the year:
Service cost 114
Interest 381
Changes in benefit terms (1,063)
Differences between expected and
actual experience (1,137)
Changes of assumptions or other
inputs 335
Benefit payments, including refunds
of employee contributions (535)
Net changes (1,905)
Balances at 6/30/19 8,090$
Changes since last year’s valuation, which was for the fiscal year ending June 30, 2018 are as follows: For ISP: Effective July 1, 2019, the life insurance benefit for retirees was modified such that all retirees (regardless of date of retirement) will receive a $20,000 benefit. This change led to a slight increase in liabilities. For CEPP: Effective on January 1, 2020, all post-65 Medicare eligible retirees will be removed from the CEP’s traditional health plan. They will be covered under a self-insured Medicare Advantage Plan through Anthem and a Medicare Part D plan. Since the premiums charged to retirees are lower than the full cost of coverage, there is still a GASB liability for this benefit. This change led to an increase in liabilities. For SPP: The termination assumption for those earning less than $20,000 per year was updated to follow the follow the PERF termination rates as of June 30, 2018 for this group. This change led to a slight decrease in liabilities. For LP: Effective on January 1, 2019, all ISP post-65 Medicare eligible retirees were removed from the ISP’s traditional health plan. They will be covered under a Medicare Advantage Plan through Anthem and a Medicare Part D plan with premiums paid fully by the retiree. These members will also be given a flat HRA contribution of $74.92 per eligible person for life while participating in the Medicare Advantage plan. This will continue to be available to surviving spouses of deceased retirees. This change is now being reflected for Legislature actives and retirees covered under the ISP’s plan. This led to a significant
decrease in liabilities. For all plans as applicable, dental and vision trend rates have been reset to a flat 3.00%. This change caused a slight increase in all entities total OPEB liability. Sensitivity of the Net OPEB Liability to Changes in the Discount Rate. The following presents the net OPEB liability for the three OPEB plans administered through trusts calculated using a discount rate that is 1 percentage point lower or 1 percentage point higher than the current discount rate: June 30, 2019 valuation:
State Personnel Plan
Net OPEB Liability
1% Decrease (2.26%) Current Rate (3.26%) 1% Increase (4.26%)
16,137 11,221 6,746
State Police Plan
Net OPEB Liability
1% Decrease (5.20%) Current Rate (6.20%) 1% Increase (7.20%)
85,664 60,476 39,138
Conservation & Excise Officers Plan
Net OPEB Liability
1% Decrease (2.36%) Current Rate (3.36%) 1% Increase (4.36%)
67,927 53,176 41,641
June 30, 2020 valuation:
State Personnel Plan
Net OPEB Liability
1% Decrease (2.23%) Current Rate (3.23%) 1% Increase (4.23%)
9,584 5,174 1,128
State Police Plan
Net OPEB Liability
1% Decrease (5.20%) Current Rate (6.20%) 1% Increase (7.2%)
38,456 18,791 1,819
Conservation & Excise Officers Plan
Net OPEB Liability
1% Decrease (5.20%) Current Rate (6.20%) 1% Increase (7.20%)
29,255 22,103 16,261
Sensitivity of the Total OPEB Liability to Changes in the Discount Rate. The following presents the total OPEB liability for the LP OPEB plan that is not administered through a trust calculated using a discount rate that is 1 percentage point lower (2.51%) or 1 percentage point higher (4.51%) than the current discount rate:
133 - State of Indiana - Comprehensive Annual Financial Report

Legislature Plan
Total OPEB Liability
1% Decrease (2.51%) Current Rate (3.51%) 1% Increase (4.51%)
9,162 8,090 7,219
Sensitivity of the Net OPEB Liability to Changes in the Healthcare Cost Trend Rates. The following presents the net OPEB liability for the three OPEB plans administered through trusts calculated using healthcare cost trend rates that are 1 percentage point lower or 1 percentage point higher than the current healthcare cost trend rates: June 30, 2019 valuation:
Net OPEB Liability
1% Decrease (7.0%
decreasing to 3.5%)
Current Rate (8.0%
decreasing to 4.5%)
1% Increase (9.0%
decreasing to 5.5%)
SPP 5,606 11,221 17,832
ISP 37,992 60,476 87,375
CEPP 40,366 53,176 70,114
June 30, 2020 valuation:
Net OPEB Liability
1% Decrease (6.5%
decreasing to 3.5%)
Current Rate (7.5%
decreasing to 4.5%)
1% Increase (8.5%
decreasing to 5.5%)
SPP (625) 5,174 12,107
ISP (1,029) 18,791 42,369
CEPP 15,228 22,103 30,772
Sensitivity of the Total OPEB Liability to Changes in the Healthcare Cost Trend Rates. The following presents the total OPEB liability for the LP OPEB plan that is not administered through a trust calculated using healthcare cost trend rates that are 1 percentage point lower or 1 percentage point higher than the current healthcare cost trend rates:
Legislature Plan
Total OPEB Liability
1% Decrease (7.0%
decreasing to 3.5%)
Current Rate (8.0%
decreasing to 4.5%)
1% Increase (9.0%
decreasing to 5.5%)
7,246 8,090 9,106
OPEB Expense and Deferred Outflows of Resources and Deferred Inflows of Resources Related to OEPB State Personnel Plan - For the year ended June 20, 2020 the State recognized OPEB expense of $3.4 million. At June 30, 2020, the State reported deferred outflows of resources and deferred inflows of resources related to OPEB from the following sources:
Deferred
Outflows of
Resources
Deferred
Inflows of
Resources
Differences between expected and actual
experience 5,646$ 3,809$
Changes of assumptions or other inputs 2,402 831
Net difference between projected and
actual earnings on OPEB plan
investments 922 -
Employer's contributions to the OPEB
plan subsequent to the measurement date
of the net OPEB liability 5,031 -
Total 14,001$ 4,640$
Deferred outflows of resources in the amount of $5.0 million related to pensions resulting from employer contributions subsequent to the measurement date will be recognized as a reduction of the net pension liability in the fiscal year ended June 30, 2021. Other amounts reported as deferred outflows of resources and deferred inflows of resources related to pensions will be recognized in pension expense as follows:
Fiscal year ended June 30:
Deferred Outflows of
Resources/(Deferred
Inflows of Resources)
2021 690
2022 690
2023 690
2024 507
2025 413
Thereafter 1,341
Indiana State Police Plan - For the year ended June 20, 2020 the State recognized OPEB income of $6.8 million. At June 30, 2020, the State reported deferred outflows of resources and deferred inflows of resources related to OPEB from the following sources:
Deferred
Outflows of
Resources
Deferred
Inflows of
Resources
Differences between expected and actual
experience -$ 82,609$
Changes of assumptions or other inputs - 76,665
Net difference between projected and
actual earnings on OPEB plan
investments 2,827 -
Employer's contributions to the OPEB
plan subsequent to the measurement date
of the net OPEB liability 20,820 -
Total 23,647$ 159,274$
Deferred outflows of resources in the amount of $21.7 million related to pensions resulting from employer contributions subsequent to the measurement date will be recognized as a reduction of the net pension liability in the fiscal year ended June 30, 2021. Other amounts reported as deferred outflows of resources and deferred inflows of resources related to pensions will be recognized in pension expense as follows:
Comprehensive Annual Financial Report - State of Indiana - 134
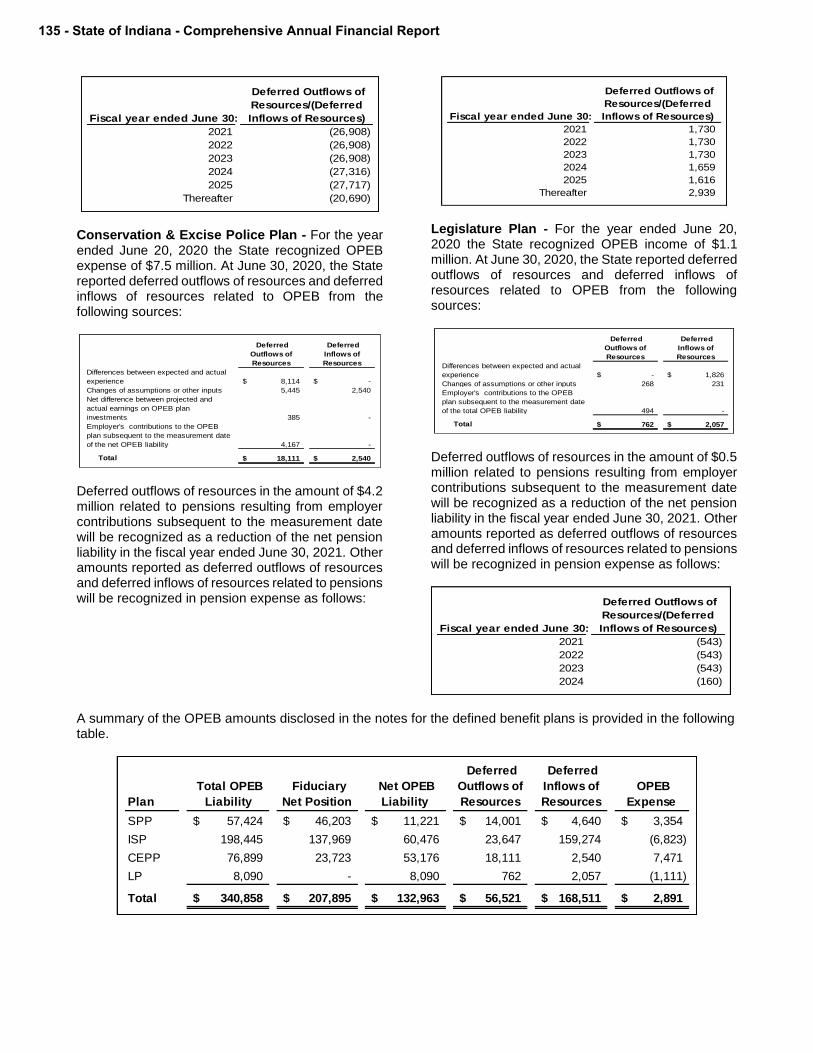
Fiscal year ended June 30:
Deferred Outflows of
Resources/(Deferred
Inflows of Resources)
2021 (26,908)
2022 (26,908)
2023 (26,908)
2024 (27,316)
2025 (27,717)
Thereafter (20,690)
Conservation & Excise Police Plan - For the year ended June 20, 2020 the State recognized OPEB expense of $7.5 million. At June 30, 2020, the State reported deferred outflows of resources and deferred inflows of resources related to OPEB from the following sources:
Deferred
Outflows of
Resources
Deferred
Inflows of
Resources
Differences between expected and actual
experience 8,114$ -$
Changes of assumptions or other inputs 5,445 2,540
Net difference between projected and
actual earnings on OPEB plan
investments 385 -
Employer's contributions to the OPEB
plan subsequent to the measurement date
of the net OPEB liability 4,167 -
Total 18,111$ 2,540$
Deferred outflows of resources in the amount of $4.2 million related to pensions resulting from employer contributions subsequent to the measurement date will be recognized as a reduction of the net pension liability in the fiscal year ended June 30, 2021. Other amounts reported as deferred outflows of resources and deferred inflows of resources related to pensions will be recognized in pension expense as follows:
Fiscal year ended June 30:
Deferred Outflows of
Resources/(Deferred
Inflows of Resources)
2021 1,730
2022 1,730
2023 1,730
2024 1,659
2025 1,616
Thereafter 2,939
Legislature Plan - For the year ended June 20, 2020 the State recognized OPEB income of $1.1 million. At June 30, 2020, the State reported deferred outflows of resources and deferred inflows of resources related to OPEB from the following sources:
Deferred
Outflows of
Resources
Deferred
Inflows of
Resources
Differences between expected and actual
experience -$ 1,826$
Changes of assumptions or other inputs 268 231
Employer's contributions to the OPEB
plan subsequent to the measurement date
of the total OPEB liability 494 -
Total 762$ 2,057$
Deferred outflows of resources in the amount of $0.5 million related to pensions resulting from employer contributions subsequent to the measurement date will be recognized as a reduction of the net pension liability in the fiscal year ended June 30, 2021. Other amounts reported as deferred outflows of resources and deferred inflows of resources related to pensions will be recognized in pension expense as follows:
Fiscal year ended June 30:
Deferred Outflows of
Resources/(Deferred
Inflows of Resources)
2021 (543)
2022 (543)
2023 (543)
2024 (160)
A summary of the OPEB amounts disclosed in the notes for the defined benefit plans is provided in the following table.
Plan
Total OPEB
Liability
Fiduciary
Net Position
Net OPEB
Liability
Deferred
Outflows of
Resources
Deferred
Inflows of
Resources
OPEB
Expense
SPP 57,424$ 46,203$ 11,221$ 14,001$ 4,640$ 3,354$
ISP 198,445 137,969 60,476 23,647 159,274 (6,823)
CEPP 76,899 23,723 53,176 18,111 2,540 7,471
LP 8,090 - 8,090 762 2,057 (1,111)
Total 340,858$ 207,895$ 132,963$ 56,521$ 168,511$ 2,891$
135 - State of Indiana - Comprehensive Annual Financial Report

Defined Contribution Plan Plan Description. The State of Indiana sponsors one single employer defined contribution OPEB plan, the Retirement Medical Benefits Account Plan (RMBA). The plan is generally administered in accordance with IC 5-10-8.5. RMBA allows for certain medical care expense premiums to be reimbursed from individual accounts established for retired participants under IC 5-10-8.5-9. RMBA became effective for participants who retired on or after July 1, 2007. The plan was administered by the State of Indiana until June 30, 2019. Effective July 1, 2019, the administration of the plan was transferred to INPRS. The state reported an other deduction of $435.9 million for this transfer and INPRS reported an other addition for the same amount. Retired participants include: (a) participants who have applied to receive a normal, unreduced or disability retirement benefit. (b) participants who have completed at least ten years of service as an elected or appointed officer on their last day of service. Individual account balances are comprised of annual contributions and earnings on investments after deduction of costs to manage the plan. Annual contributions range between $500 and $1,400, based on the participant’s age while in service. IC 5-10-8.5-16 provides a one-time credit for an additional contribution to a participant’s account, if, by June 30, 2017, the participant was eligible for an unreduced pension benefit and had completed at least 15 years of service or had completed 10 years of service as an elected or appointed officer. The one-time additional contribution is credited to a participant’s account no later than 60 days after the participant’s last day of service. Participants lose their right to one-time additional contributions if there is a break in service after July 1, 2007 and before June 30, 2017 for more than 30 days. Contributions for self-funded agencies and employees not funded by the state budget is recovered by an annual charge per employee determined each year. The annual charge for FY 2020 was $1,076, which was due by June 30. The remaining funding is through appropriation of cigarette taxes (IC 6-7-1-28.1(7)) received throughout the year. Upon application, the Plan administrator reimburses premiums for medical, dental, vision and long-term care for retired participants and their spouses and dependents. The reimbursements are deducted from the participant’s individual account balance. When the participant’s individual account balance is
exhausted, any deductions from the participant’s individual account end. If a retired participant dies without a surviving spouse or dependents, unused amounts credited to the retired participant’s account is forfeited. Any forfeiture amount is used to reduce the contributions required from the employer. The amount of reimbursed retiree medical expenses during the fiscal year ending June 30, 2020 was $17.3 million. As of June 30, 2020, the state owes contributions of $57.2 million to the plan to fulfill its obligation towards additional contributions per IC 5-10-8.5-16. Forfeitures of retiree medical benefits for the fiscal year ending June 30, 2020 totaled $19.0 million. As of June 30, 2020 participation in the plan was as follows:
Inactive employees or beneficiaries currently
receiving benefit payments7,473
Active employees 29,086
Total 36,559
Financial report. INPRS issues a publicly available stand-alone financial report that includes financial statements and required supplementary information for the plan as a whole. This report may be obtained by writing the Indiana Public Retirement System, One North Capitol, Suite 001, Indianapolis, IN 46204, by calling (844) 464-6777, by emailing [email protected], or by visiting www.in.gov/inprs.
G. Pollution Remediation Obligations
Nature and source of pollution remediation obligations: Five state agencies have identified themselves as responsible or potentially responsible parties to remediate fifty-two pollution sites. Obligating events for the cleanup of these sites include being compelled to take action because the pollution creates an imminent danger to public health or welfare or the environment, being named by a regulator to remediate hazardous wastes and contamination, and voluntarily assuming responsibility because of imminent threats to human health and the environment. Amount of the estimated liability, methods and assumptions used for the estimate, and the potential for changes: The State’s total estimated liability is $33.6 million of which $3.4 million is estimated to be payable within one year and $30.2 million estimated to be payable
Comprehensive Annual Financial Report - State of Indiana - 136

in more than one year. State agencies calculated their estimated liabilities using various approaches including existing agreements, contractor bids/surveys, records of decisions from regulators, matching requirements under the Superfund law, previous actual costs to cleanup similar sites, investigation activities, well known and recognized estimation methods, and through the sampling and knowing the size and volume of existing contamination at a site. Superfund site estimated liabilities also applied a rolling thirty year liability as this was the number of years determined to be reasonably estimable. The estimated liabilities of state agencies are subject to annual review and adjustment for changes in agreements, laws, regulations, court decisions, price increases or decreases for goods and services used in cleanup, and other relevant changes that come to light. Estimated recoveries reducing the liability: The estimated recoveries total $13.9 million. Of this total, $0.2 million is unrealizable or has not yet been realized and has been applied to reduce the State’s total estimated liability. Estimated recoveries include the proceeds from the sale of stock, bankruptcy court settlements, coverage of allowable costs by the State’s Excess Liability Trust Fund (ELTF), credits received for work performed on Superfund sites, and federal funds. The ELTF state law states that if insufficient funds exist to pay claims neither the State nor the Fund are liable for unpaid claims. The State recognized $3.5 million of program revenue for two sites whose realized recoveries exceeded the pollution remediation liability. H. Tax Abatements The State provides tax abatements through eight programs which are the (1) Coal Gasification Technology Investment Credit, (2) Economic Development for a Growing Economy (EDGE) Credit, (3) Hoosier Business Investment Credit, (4) Industrial Recovery Credit, (5) Research Expense Credit, (6) Venture Capital Investment Credit, and (7) Neighborhood Assistance Program Credit. The Indiana Economic Development Corporation (IEDC) approves the tax credits for programs (1) through (6). The Indiana Housing and Community Development Authority (IHCDA) approves the tax credits for the Neighborhood Assistance Program Credit. The following is a summary of these programs where the taxes abated exceeded $1 million individually or in the aggregate. Coal Gasification Technology Investment Credit The Coal Gasification Technology Investment Credit
is created by IC 6-3.1-29. This program was created to foster job creation and higher wages, reduce air pollution as a result of the generation of electricity through fossil fuels, and promote investment in integrated coal gasification power plants and fluidized bed combustion technology. This program provides a credit against a taxpayer’s adjusted gross income tax, financial institutions tax, insurance premiums tax liability, or utility receipts tax. The credit must be claimed on the taxpayer’s annual state income tax return or returns filed with the Indiana Department of Revenue. The credit is administered by the Indiana Economic Development Corporation (IEDC) and is for a qualified investment in an integrated coal gasification power plant equal to the sum of 10% of the taxpayer’s qualified investment for the first $500,000,000 invested; 5% of the taxpayer’s qualified investment that exceeds $500,000,000, only if the facility is dedicated primarily to serving Indiana retail electric or gas utility consumers. For qualified investment in fluidized bed combustion technology, the credit is equal to the sum of 7% of the taxpayer’s qualified investment for the first $500,000,000 invested; 3% of the taxpayer’s qualified investment that exceeds $500,000,000. Qualified investment is defined as a taxpayer’s expenditures for all real and tangible personal property incorporated in and used as part of an integrated coal gasification power plant or a fluidized bed combustion technology and transmission equipment and other real and personal property located at the site of an integrated coal gasification power plant or a fluidized bed combustion technology that is employed specifically to serve the integrated coal gasification power plant or fluidized bed combustion technology. In order to award a tax credit under this program, the IEDC must determine the taxpayer’s proposed investment satisfies the requirements of IC 6-3.1-29. The tax credit will be recaptured if the IEDC determines the taxpayer is noncompliant with the requirements of the tax credit agreement or all of the provisions of IC 6-3.1-29. The State has made no other commitments other than to reduce the applicable taxes as part of this program. Economic Development for a Growing Economy (EDGE) Credit The Economic Development for a Growing Economy Credit is created by IC 6-3.1-13. This program was created to foster job creation in Indiana, job retention in Indiana, and to foster employment in Indiana of students who participate in a course of study that includes a cooperative arrangement between an educational institution and an employer for the training of students in high wage, high demand jobs that require an industry certification. This program provides a credit against a taxpayer’s adjusted gross
137 - State of Indiana - Comprehensive Annual Financial Report

income tax, financial institutions tax, or insurance premiums tax liability. The credit must be claimed on the taxpayer’s annual state income tax return filed with the Indiana Department of Revenue. The credit is administered by the Indiana Economic Development Corporation (IEDC). The amount and duration of this tax credit shall be determined by the IEDC. The credit may be stated as a percentage of the incremental income tax withholdings attributable to the applicant’s project and may include a fixed dollar limitation. In the case of a credit awarded for a project to create new jobs in Indiana, the credit amount may not exceed the incremental income tax withholdings. However, the credit amount claimed for a taxable year may exceed the taxpayer’s state tax liability for the taxable year, in which the excess may, at the discretion of the IEDC, be refunded to the taxpayer. The tax credit will be recaptured if the IEDC determines the taxpayer is noncompliant with the requirements of the tax credit agreement or all of the provisions of IC 6-3.1-13. The State has made no other commitments other than to reduce the applicable taxes as part of this program. In order to receive a tax credit, the taxpayer must commit to the creation or retention of full-time, permanent jobs for Indiana residents at the project location and new capital investment in Indiana. Hoosier Business Investment Credit The Hoosier Business Investment Credit is created by IC 6-3.1-26. This program was created to foster job creation and create higher wages in Indiana. This program provides a credit against a taxpayer’s adjusted gross income tax, financial institutions tax, or insurance premiums tax liability. The credit must be claimed on the taxpayer’s annual state income tax return filed with the Indiana Department of Revenue. The credit is administered by the Indiana Economic Development Corporation (IEDC) and may not exceed 10% of the taxpayer’s qualified investment in a taxable year for qualified investment that is not a logistics investment and 25% of the qualified investment made in a taxable year if the qualified investment is a logistics investment. Qualified investment is defined as the amount of the taxpayer’s expenditures in Indiana for the purchase of new telecommunications, production, manufacturing, fabrication, assembly, extraction, mining, processing, refining, finishing, distribution, transportation, or logistical distribution equipment; the purchase of new computers and related equipment; costs associated with the modernization of existing telecommunications, production, manufacturing, fabrication, assembly, extraction, mining, processing, refining, finishing, distribution, transportation, or logistical distribution facilities; onsite infrastructure improvements; the construction
of new telecommunications, production, manufacturing, fabrication, assembly, extraction, mining, processing, refining, finishing, distribution, transportation, or logistical distribution facilities; costs associated with retooling existing machinery and equipment; costs associated with the construction of special purpose building and foundations for use in the computer, software, biological sciences, or telecommunications industry; costs associated with the purchase of machinery, equipment or special purpose buildings used to make motion pictures or audio productions; and a logistics investment as further described in IC 6-3.1-26-8.5 that are certified by the IEDC under this chapter as being eligible for the credit. The term does not include property that can be readily moved outside Indiana. In order to award a tax credit under this program, the IEDC must determine the following conditions exist, the applicant’s project will raise the total earnings of employees of the applicant in Indiana or substantially enhance the logistics industry by creating new jobs, preserving existing jobs that otherwise would be lost, increasing wages in Indiana, or improving the overall Indiana economy, in the case of a logistics investment being claimed by the applicant; the applicant’s project is economically sound and will benefit the people of Indiana by increasing opportunities for employment and strengthening the economy of Indiana; receiving the tax credit is a major factor in the applicant’s decision to go forward with the project and not receiving the tax credit will result in the applicant not raising the total earnings of the applicant’s employees in Indiana, or other employees in Indiana in the case of a logistics investment being claimed by the applicant; awarding the tax credit will result in an overall positive fiscal impact to the state, as certified by the budget agency using the best available data; the credit is not prohibited by the relocation of jobs from one location in Indiana to another location in Indiana; in the case of a qualified investment that is not being claimed as a logistics investment by the applicant, the average wage that will be paid by the taxpayer to its employees (excluding highly compensated employees) at the location after the credit is given will be at least equal to one hundred fifty percent (150%) of the hourly minimum wage under IC 22-2-2-4 or its equivalent. The tax credit will be recaptured if the IEDC determines the taxpayer is noncompliant with the requirements of the tax credit agreement or all of the provisions of IC 6-3.1-26. The State has made no other commitments other than to reduce the applicable taxes as part of this program. In order to receive a tax credit, the taxpayer must commit to the creation or retention of full-time, permanent jobs for Indiana residents at the project location and new capital investment in Indiana.
Comprehensive Annual Financial Report - State of Indiana - 138

Industrial Recovery Credit The Industrial Recovery Credit is created by IC 6-3.1-11. This program was created to foster the rehabilitation of property located within an industrial recovery site. This program provides a credit against a taxpayer’s adjusted gross income tax, financial institutions tax, or insurance premiums tax liability. The credit must be claimed on the taxpayer’s annual state income tax return filed with the Indiana Department of Revenue. The credit is administered by the Indiana Economic Development Corporation (IEDC) and may not exceed 15% for a plant that was in service at least fifteen years ago but less than thirty years ago, 20% for a plant that was placed in service at least thirty years ago but less than forty years ago, and 25% if a plant was placed in service at least forty years ago. Qualified investment is defined as the amount of the taxpayer’s expenditures for rehabilitation of property located within an industrial recovery site. Rehabilitation is defined as the remodeling repair, or betterment of real property in any manner or enlargement or extension of real property. Plant is defined as a building or complex of buildings used, or designed and constructed for use, in production, manufacturing, fabrication, assembly, processing, refining, finishing, or warehousing of tangible personal property, whether the tangible personal property is or was for sale to third parties or for use by the owner in the owner’s business. In order to award a tax credit under this program, the IEDC must consider the following factors; the level of distress in the surrounding community caused by the loss of jobs at the vacant industrial facility; evidence of support for the designation by residents, businesses, and private organizations in the surrounding community; evidence of a commitment by private or governmental entities to assist in the financing of improvements or redevelopment activities benefiting the vacant industrial facility; whether the industrial recovery site is within an economic revitalization area designated under IC 6-1.1-12.1. The tax credit will be recaptured if the IEDC determines the taxpayer is noncompliant with the requirements of the tax credit agreement or all of the provisions of IC 6-3.1-11. The State has made no other commitments other than to reduce the applicable taxes as part of this program. In order to receive a tax credit, the taxpayer must commit to new capital investment in Indiana within the statutory parameters. Research Expense Credit The Research Expense Credit is created by IC 6-3.1-4. The program was created to incentivize research investment in Indiana. This program provides a credit against a taxpayer’s adjusted gross income tax
liability. The credit must be claimed on the taxpayer’s annual state income tax return filed with the Indiana Department of Revenue. The program is administered by the Indiana Economic Development Corporation (IEDC), and the credit may be calculated one of two ways, listed below, as elected by the taxpayer. For Indiana qualified research expense incurred after December 31, 2007, the credit is equal to 15% of the Indiana qualified research expense less the taxpayer’s base amount of Indiana qualified research expense, up to $1,000,000. For qualified research expense in excess of $1,000,000, the credit amount is equal to 10%. For Indiana qualified research expense incurred after December 31, 2009, the taxpayer’s research expense tax credit is equal to 10% of the part of the taxpayer’s Indiana qualified research expense for the taxable year that exceeds 50% of the taxpayer’s average Indiana qualified research expense for the 3 taxable years preceding the taxable year for which the credit is being determined. If the taxpayer did not have Indiana qualified research expense in any 1 of the 3 taxable years preceding the taxable year for which the credit is being determined, the amount of the research expense tax credit is equal to 5% of the taxpayer’s Indiana qualified research expense for the taxable year. Indiana qualified research expense is defined as qualified research expense that is incurred for research conducted in Indiana. Qualified research expense means qualified research expense as defined in Section 41(b) of the Internal Revenue Code. The tax credit will be recaptured if the IEDC determines the taxpayer is noncompliant with the requirements of the tax credit agreement or all of the provisions of IC 6-3.1-4. The State has made no other commitments other than to reduce the applicable taxes as part of this program. Venture Capital Investment Credit The Venture Capital Investment Credit is created by IC 6-3.1-24. This credit was created to improve access to capital for fast growing Indiana companies by providing individual and corporate investors an incentive to invest in early-stage firms. This program provides a credit against a taxpayer’s adjusted gross income tax, financial institutions tax, insurance premiums tax, or state gross retail and use tax liability. The credit must be claimed on the taxpayer’s state income tax return or returns filed with the Indiana Department of Revenue. The credit is administered by the Indiana Economic Development Corporation (IEDC) and is equal to 20% of the taxpayer’s qualified investment capital provided to the qualified Indiana business or $1,000,000, whichever is less. Qualified Indiana business is defined as an independently owned and operated business that is certified as a qualified Indiana
139 - State of Indiana - Comprehensive Annual Financial Report

business by the IEDC. Qualified investment capital is defined as debt or equity capital that is provided to a qualified Indiana business. However, the term does not include debt that is provided by a financial institution (as defined in IC 5-13-4-10) after May 15, 2005 and is secured by a valid mortgage, security agreement, or other agreement or document that establishes a collateral or security position for the financial institution that is senior to all collateral or security interests of other taxpayers that provide debt or equity capital to the qualified Indiana business. In order to award a tax credit under this program, the IEDC must certify the taxpayer’s proposed investment plan. The proposed investment plan must include the name and address of the taxpayer, the name and address of each proposed recipient of the taxpayer’s proposed investment; the amount of the proposed investment; a copy of the certification issued by the IEDC stating the business being invested in is a qualified Indiana business, and any other information required by the IEDC. The IEDC must determine that the proposed investment would qualify for the taxpayer credit under this program, and the amount of proposed investment would not result in the total amount of tax credits certified for the calendar year exceeding $12,500,000. The total amount of credits that may be approved by the IEDC for a calendar year may not exceed $12,500,000. The tax credit will be recaptured if the IEDC
determines the taxpayer is noncompliant with the requirements of the tax credit agreement or all of the provisions of IC 6-3.1-24. The State has made no other commitments other than to reduce the applicable taxes as part of this program. Neighborhood Assistance Program Credit The Neighborhood Assistance Program (NAP) Credit is created by IC 6-3.1-9. The IHCDA distributes state tax credits to eligible non-profit organizations through an application approval process that they use to raise funds for their activities of community services, crime prevention, education, job training, and neighborhood assistance in economically disadvantaged areas or households. Each fiscal year, NAP State tax credits are capped at $2.5 million and the maximum credit per donor is $25,000. NAP tax credits are distributed to donors at 50% of the contribution amount and are subtracted from a donor’s adjusted gross income or financial institutions tax liability on their annual state income tax returns. Unused portions of the credit may not be carried forward or carried back and the credit is nonrefundable. The State has made no other commitments other than to reduce the applicable taxes as part of this program.
The state tax abatements for the fiscal year ended June 30, 2020 are:
Tax Abatement Program
Amount of
Taxes
Abated
Coal Gasification Technology Investment Credit
Corporate Income Tax 15,000
Economic Development for a Growing Economy
(EDGE) Credit
Individual Income Tax 8,034
Corporate Income Tax 49,167
Hoosier Business Investment Credit
Individual Income Tax 1,253
Corporate Income Tax (D)
Industrial Recovery Credit
Individual Income Tax 2,977,475
Corporate Income Tax 5,797,023
Neighborhood Assistance Credit
Individual Income Tax 1,619
Corporate Income Tax (D)
Research Expense Credit
Individual Income Tax 22,379
Corporate Income Tax 71,698
Venture Capital Investment Credit
Individual Income Tax 4,492
Corporate Income Tax 2,359
(D) - Non-disclosable per Indiana Code 6-8.1-7-2.
Comprehensive Annual Financial Report - State of Indiana - 140

REQUIRED SUPPLEMENTARY INFORMATION
141 - State of Indiana - Comprehensive Annual Financial Report

Sc
he
du
le o
f C
on
trib
uti
on
s
Em
plo
ye
e R
eti
rem
en
t S
ys
tem
s a
nd
Pla
ns
Sta
te P
oli
ce
Re
tire
me
nt
Fu
nd
(am
ou
nts
ex
pre
ss
ed
in
th
ou
sa
nd
s)
6/3
0/2
02
06/3
0/2
01
96/3
0/2
01
86/3
0/2
01
76/3
0/2
01
66/3
0/2
01
56/3
0/2
01
46/3
0/2
01
36/3
0/2
01
26/3
0/2
01
1
Actu
ari
ally
dete
rmin
ed c
on
trib
ution
30
,947
$
30
,860
$
25
,857
$
20
,556
$
19
,455
$
17
,119
$
17
,271
$
18
,058
$
18
,210
$
16
,046
$
Con
trib
ution
s in r
ela
tion
to
th
e a
ctu
ari
ally
dete
rmin
ed
con
trib
ution
34
,095
29
,901
25
,002
20
,556
18
,073
13
,451
14
,005
47
,588
16
,059
13
,240
Con
trib
ution
deficie
ncy (
excess)
(3,1
48)
9
59
8
55
-
1,3
82
3,6
68
3,2
66
(2
9,5
30
)
2,1
51
2,8
06
Covere
d p
ayro
ll88
,652
88
,103
87
,972
75
,731
68
,786
68
,219
68
,490
63
,347
66
,083
64
,948
Con
trib
ution
s a
s a
perc
en
tage
of co
vere
d p
ayro
ll38
.5%
33
.9%
28
.4%
27
.1%
26
.3%
19
.7%
20
.4%
75
.1%
24
.3%
20
.4%
No
tes
to
Sch
ed
ule
:
Actu
ari
ally
dete
rmin
ed c
on
trib
ution
rate
s a
re c
alc
ula
ted a
s o
f Ju
ly 1
, o
ne
yea
r p
rior
to th
e e
nd o
f th
e f
iscal yea
r in
whic
h c
ontr
ibu
tion
s a
re r
ep
ort
ed.
Dis
able
d -
SO
A P
ub
-20
10
Ge
ne
ral D
isab
led
Retire
es w
ith m
ort
alit
y im
pro
vem
en
t sca
le M
P-2
019
(w
ith a
nnu
al u
pd
ate
s)
Mort
alit
y
Em
plo
yee
s -
SO
A P
ub
-20
10
Safe
ty E
mplo
yee
s w
ith m
ort
alit
y im
pro
vem
en
t sca
le M
P-2
019
(w
ith a
nnu
al u
pd
ate
s)
Retire
es -
SO
A P
ub
-20
10
Safe
ty R
etire
es w
ith m
ort
alit
y im
pro
vem
en
t sca
le M
P-2
019
(w
ith a
nnu
al u
pd
ate
s)
Ben
eficia
ries -
SO
A P
ub
-20
10
Safe
ty C
on
ting
en
t S
urv
ivors
with m
ort
alit
y im
pro
vem
en
t sca
le M
P-2
019
(w
ith a
nnu
al u
pd
ate
s)
Oth
er
info
rmation
19
87
Pla
n -
Retire
men
t ra
tes a
re b
ased
on y
ea
rs o
f se
rvic
e w
ith 1
5%
assum
ed
to
retire
at
25 y
ea
rs o
f se
rvic
e,
12
.5%
at 2
6 y
ea
rs, 1
0%
at 2
7 y
ea
rs, 7
.5%
at yea
rs 2
8 a
nd 2
9, 1
0%
at 3
0
yea
rs, 1
2.5
% a
t 3
1 y
ea
rs, 1
5%
at 3
2 y
ea
rs, 4
0%
at 3
3 y
ea
rs, a
nd
27.5
% a
t 3
4 o
r m
ore
yea
rs, e
xcep
t 1
00
% a
t a
ge
65 (
with a
t le
ast 2
5 y
ea
rs o
f se
rvic
e).
B
ase
d o
n e
xpe
rien
ce s
tudy
thro
ugh
Ju
ne
30,
201
9.
Pre
-19
87
Pla
n -
Retire
men
t ra
tes a
re b
ased
on a
ge w
ith 1
0%
assum
ed
to
retire
at
age
s 4
2-4
5, 7
.5%
at a
ge
s 4
6-5
4, 1
0%
at 5
5,
12.5
% a
t 5
6,
15%
at 5
7,
20%
at 5
8,
40%
at a
ge
s 5
9 a
nd
old
er,
excep
t 1
00
% a
t 6
5 (
with a
t le
ast 2
0 y
ea
rs o
f se
rvic
e).
B
ase
d o
n e
xpe
rien
ce s
tudy th
rou
gh
Ju
ne
30,
201
9.
Inflation
2.2
5%
Sala
ry incre
ases
3.5
% fo
r th
e p
re-1
987
pla
n; F
or
the 1
987
pla
n, 9
% a
t a
ge
s 2
6 a
nd y
ou
ng
er,
ann
ua
l in
cre
ase r
ed
uce
d 0
.5%
per
yea
r re
achin
g 4
% a
t a
ge
36,
ann
ua
l in
cre
ases o
f 4
% a
t a
ge
s 3
6 a
nd o
lder.
New
sa
lary
matr
ix e
ffe
ctive J
uly
1, 2
01
8 is r
eflecte
d.
Investm
en
t ra
te o
f re
turn
6.7
5%
net
of p
en
sio
n p
lan
investm
en
t e
xpe
nse
, in
clu
din
g inflatio
n.
Retire
men
t a
ge
Le
vel p
erc
en
tage
of p
ayro
ll, c
losed
Rem
ain
ing
am
ort
ization
peri
od
21
yea
rs w
he
n t
he A
ctu
ari
ally
Dete
rmin
ed C
on
trib
ution
fo
r p
lan
yea
r e
nd
ing
Ju
ne
30,
Asset
va
lua
tion
meth
od
4 y
ea
r sm
oo
thed
valu
e
Valu
ation
date
Jun
e 3
0, 2
02
0
Actu
ari
al co
st m
eth
od
Entr
y a
ge
norm
al co
st
Am
ort
ization
meth
od
Comprehensive Annual Financial Report - State of Indiana - 142

Sc
he
du
le o
f C
on
trib
uti
on
s
Em
plo
ye
e R
eti
rem
en
t S
ys
tem
s a
nd
Pla
ns
Sta
te P
oli
ce
Su
pp
lem
en
tal
Tru
st
(am
ou
nts
ex
pre
ss
ed
in
th
ou
sa
nd
s)
6/3
0/2
02
06/3
0/2
01
96/3
0/2
01
86/3
0/2
01
76/3
0/2
01
66/3
0/2
01
56/3
0/2
01
46/3
0/2
01
36/3
0/2
01
26/3
0/2
01
1
Actu
ari
ally
dete
rmin
ed c
on
trib
ution
5,0
85
$
5,3
83
$
5,0
49
$
5,3
08
$
4,9
04
$
5,1
95
$
4,0
29
$
4,5
25
$
4,1
67
$
4,3
43
$
Con
trib
ution
s in r
ela
tion
to
th
e a
ctu
ari
ally
dete
rmin
ed
con
trib
ution
3,9
97
3,9
83
4,3
43
4,2
59
4,6
77
4,3
42
4,5
45
3,7
46
4,1
99
3,5
73
Con
trib
ution
deficie
ncy (
excess)
1,0
88
1,4
00
7
06
1,0
49
2
27
8
53
(5
16)
77
9
(32
)
77
0
Covere
d p
ayro
ll88
,652
88
,103
87
,972
75
,731
68
,786
68
,219
68
,490
63
,347
66
,083
64
,948
Con
trib
ution
s a
s a
perc
en
tage
of co
vere
d p
ayro
ll4.5
%4.5
%4.9
%5.6
%6.8
%6.4
%6.6
%5.9
%6.4
%5.5
%
No
tes
to
Sch
ed
ule
:
Valu
ation
date
Actu
ari
al co
st m
eth
od
Am
ort
ization
meth
od
Rem
ain
ing
am
ort
ization
peri
od
Asset
va
lua
tion
meth
od
Inflation
Sala
ry incre
ases
Investm
en
t ra
te o
f re
turn
Retire
men
t a
ge
Mort
alit
y
Oth
er
info
rmation
Retire
es -
SO
A P
ub
-20
10
Safe
ty R
etire
es w
ith m
ort
alit
y im
pro
vem
en
t sca
le M
P-2
019
(w
ith a
nnu
al u
pd
ate
s)
Ben
eficia
ries -
SO
A P
ub
-20
10
Safe
ty C
on
ting
en
t S
urv
ivors
with m
ort
alit
y im
pro
vem
en
t sca
le M
P-2
019
(w
ith a
nnu
al u
pd
ate
s)
Dis
able
d -
SO
A P
ub
-20
10
Ge
ne
ral D
isab
led
Retire
es w
ith m
ort
alit
y im
pro
vem
en
t sca
le M
P-2
019
(w
ith a
nnu
al u
pd
ate
s)
Actu
ari
ally
dete
rmin
ed c
on
trib
ution
rate
s a
re c
alc
ula
ted a
s o
f Ju
ly 1
, o
ne
yea
r p
rior
to th
e e
nd o
f th
e f
iscal yea
r in
whic
h c
ontr
ibu
tion
s a
re r
ep
ort
ed.
Jun
e 3
0, 2
02
0
Entr
y a
ge
norm
al co
st
Over
the a
vera
ge r
em
ain
ing
se
rvic
e o
f a
ll pla
n p
art
icip
ants
As o
f Ju
ne
30,
201
9 t
he a
mort
ization
peri
od
is 1
1.6
26 y
ea
rs
Not
ap
plic
ab
le
2.2
5%
3.5
% fo
r th
e p
re-1
987
pla
n; F
or
the 1
987
pla
n, 9
% a
t a
ge
s 2
6 a
nd y
ou
ng
er,
ann
ua
l in
cre
ase r
ed
uce
d 0
.5%
per
yea
r re
achin
g 4
% a
t a
ge
36,
ann
ua
l in
cre
ases o
f 4
% a
t a
ge
s 3
6 a
nd o
lder.
New
sa
lary
matr
ix e
ffe
ctive J
uly
1, 2
01
8 is r
eflecte
d.
2.6
6%
net
of p
en
sio
n p
lan
investm
en
t e
xpe
nse
, in
clu
din
g inflatio
n.
2.7
9%
as o
f Ju
ne
30,
201
9.
Ra
te is S
&P
Mun
icip
al B
on
d 2
0 y
ea
r h
igh
gra
de r
ate
ind
ex.
Pre
-19
87
Pla
n -
Retire
men
t ra
tes a
re b
ased
on a
ge w
ith 1
0%
assum
ed
to
retire
at
age
s 4
2-4
5, 7
.5%
at a
ge
s 4
6-5
4, 1
0%
at 5
5,
12.5
% a
t 5
6,
15%
at 5
7,
20%
at 5
8,
40%
at a
ge
s 5
9 a
nd
old
er,
excep
t 1
00
% a
t 6
5 (
with a
t le
ast 2
0 y
ea
rs o
f se
rvic
e).
B
ase
d o
n e
xpe
rien
ce s
tudy th
rou
gh
Ju
ne
30,
201
9.
19
87
Pla
n -
Retire
men
t ra
tes a
re b
ased
on y
ea
rs o
f se
rvic
e w
ith 1
5%
assum
ed
to
retire
at
25 y
ea
rs o
f se
rvic
e,
12
.5%
at 2
6 y
ea
rs, 1
0%
at 2
7 y
ea
rs, 7
.5%
at yea
rs 2
8 a
nd 2
9, 1
0%
at 3
0
yea
rs, 1
2.5
% a
t 3
1 y
ea
rs, 1
5%
at 3
2 y
ea
rs, 4
0%
at 3
3 y
ea
rs, a
nd
27.5
% a
t 3
4 o
r m
ore
yea
rs, e
xcep
t 1
00
% a
t a
ge
65 (
with a
t le
ast 2
5 y
ea
rs o
f se
rvic
e).
B
ase
d o
n e
xpe
rien
ce s
tudy
thro
ugh
Ju
ne
30,
201
9.
Em
plo
yee
s -
SO
A P
ub
-20
10
Safe
ty E
mplo
yee
s w
ith m
ort
alit
y im
pro
vem
en
t sca
le M
P-2
019
(w
ith a
nnu
al u
pd
ate
s)
143 - State of Indiana - Comprehensive Annual Financial Report

Sch
ed
ule
of
Co
ntr
ibu
tio
ns
Em
plo
yee R
eti
rem
en
t S
yste
ms a
nd
Pla
ns
(am
ou
nts
ex
pre
ss
ed
in
th
ou
sa
nd
s)
6/3
0/2
02
06
/30
/20
19
6/3
0/2
01
86
/30
/20
17
6/3
0/2
01
66
/30
/20
15
6/3
0/2
01
46
/30
/20
13
Actu
ari
ally
de
term
ine
d c
on
trib
utio
n3
,64
7$
4,8
74
$
4
,39
3$
4,0
33
$
4
,07
8$
4,8
20
$
5
,34
1$
4,7
94
$
Con
trib
utio
ns in
re
latio
n t
o t
he
actu
ari
ally
de
term
ine
d
co
ntr
ibu
tio
n6
,74
2
6,9
82
6
,17
5
5,6
91
5
,29
7
5,2
15
5
,35
9
19
,74
0
Con
trib
utio
n d
eficie
ncy (
exce
ss)
(3,0
95
)
(2,1
08
)
(1,7
82
)
(1,6
58
)
(1,2
19
)
(39
5)
(18
)
(14
,94
6)
Cove
red
pa
yro
ll3
2,4
91
33
,27
2
2
9,3
87
27
,42
8
2
5,5
26
25
,13
3
2
5,8
25
24
,67
5
Con
trib
utio
ns a
s a
pe
rce
nta
ge
of
co
ve
red
pa
yro
ll2
0.8
%2
1.0
%2
1.0
%2
0.7
%2
0.8
%2
0.7
%2
0.8
%8
0.0
%
No
tes
to
Sc
he
du
le:
Va
lua
tio
n d
ate
Actu
ari
ally
de
term
ine
d c
on
trib
utio
n r
ate
s a
re c
alc
ula
ted
as o
f Ju
ne
30
, w
ith
an
eff
ective
da
te o
f Ja
nu
ary
1.
Actu
ari
al co
st
me
tho
d
En
try a
ge
no
rma
l (L
eve
l P
erc
en
t o
f P
ayro
ll)
Am
ort
iza
tio
n m
eth
od
Le
ve
l d
olla
r
Rem
ain
ing
am
ort
iza
tio
n p
eri
od
20
ye
ars
, clo
se
d
Asse
t va
lua
tio
n m
eth
od
5 y
ea
r sm
oo
thin
g o
f g
ain
s a
nd
lo
sse
s o
n t
he
fa
ir v
alu
e o
f a
sse
ts s
ub
ject
to a
20
% c
orr
ido
r.
Infla
tio
n
2.2
5%
Sa
lary
in
cre
ase
s
2.7
5%
to
5.0
0%
, b
ase
d o
n s
erv
ice
Inve
stm
en
t ra
te o
f re
turn
6.7
5%
Mo
rta
lity
Pu
b-2
01
0 P
ub
lic R
etire
me
nt
Pla
ns M
ort
alit
y T
ab
les (
Am
ou
nt-
We
igh
ted
) w
ith
a f
ully
ge
ne
ratio
na
l p
roje
ctio
n
of
mo
rta
lity im
pro
ve
me
nts
usin
g S
OA
Sca
le M
P-2
01
9.
Oth
er
info
rma
tio
n
Th
e a
ctu
ari
ally
de
term
ine
d c
on
trib
utio
n a
mo
un
ts a
re b
ase
d o
n t
he
ave
rag
e o
f th
e a
ctu
ari
ally
de
term
ine
d c
on
trib
utio
n r
ate
s d
eve
lop
ed
in
th
e
actu
ari
al va
lua
tio
ns c
om
ple
ted
on
e y
ea
r a
nd
tw
o y
ea
rs p
rio
r to
th
e b
eg
inn
ing
of
the
fis
ca
l ye
ar,
mu
ltip
lied
by a
ctu
al p
ayro
ll d
uri
ng
th
e f
isca
l ye
ar.
Me
mb
er
ce
nsu
s d
ata
as o
f th
e p
rio
r ye
ar
en
d w
as u
se
d in
th
e v
alu
atio
n a
nd
ad
juste
d,
wh
ere
ap
pro
pri
ate
, to
re
fle
ct
ch
an
ge
s d
uri
ng
th
e c
urr
en
t fisca
l ye
ar.
Sta
nd
ard
actu
ari
al ro
ll fo
rwa
rd t
ech
niq
ue
s w
ere
th
en
use
d t
o p
roje
ct
the
lia
bili
tie
s c
om
pu
ted
as o
f p
rio
r ye
ar
en
d t
o t
he
cu
rre
nt
ye
ar
me
asu
rem
en
t d
ate
.
Th
e e
ffo
rt a
nd
co
st
to r
e-c
rea
te f
ina
ncia
l sta
tem
en
t in
form
atio
n f
or
10
ye
ars
wa
s n
ot
pra
ctica
l.
Info
rma
tio
n w
as p
rep
are
d p
rosp
ective
ly f
rom
Ju
ne
30
, 2
01
3 f
or
GA
SB
-S6
8 p
urp
ose
s.
Sta
te E
xcis
e P
olice, G
am
ing
Ag
en
t, G
am
ing
Co
ntr
ol O
ffic
er,
an
d C
on
serv
ati
on
En
forc
em
en
t O
ffic
ers
' R
eti
rem
en
t P
lan
(E
G&
C
Comprehensive Annual Financial Report - State of Indiana - 144
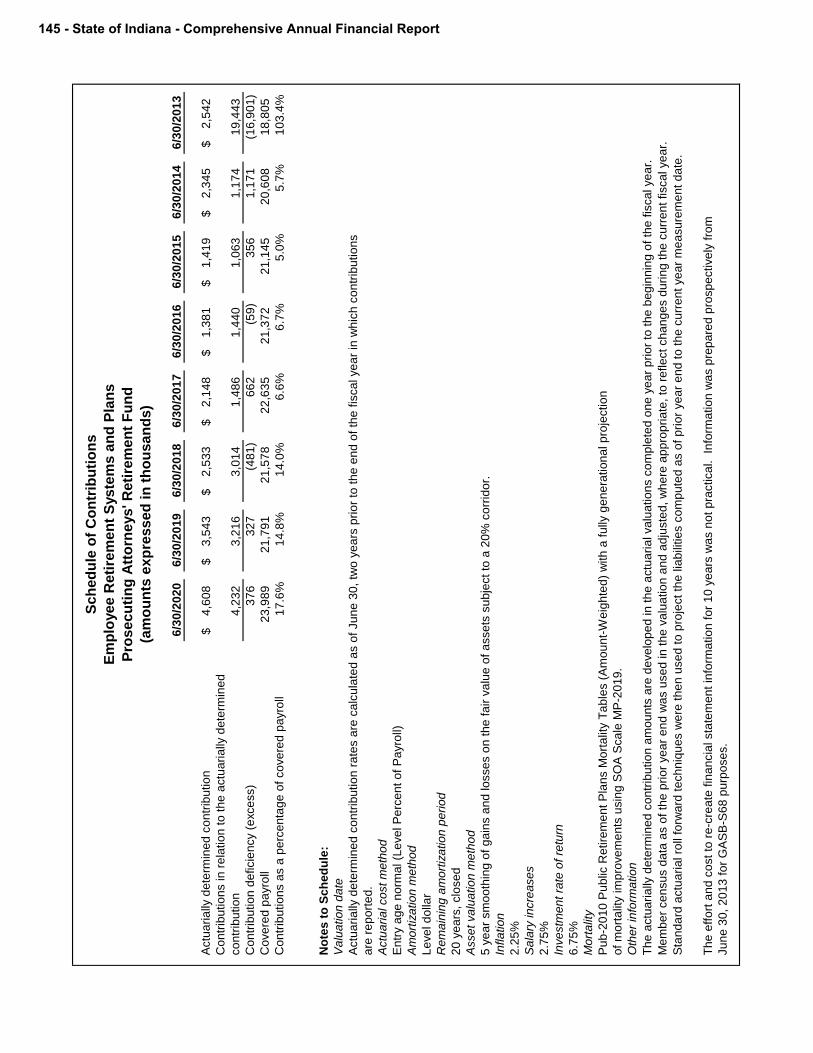
Sch
ed
ule
of
Co
ntr
ibu
tio
ns
Em
plo
yee R
eti
rem
en
t S
yste
ms a
nd
Pla
ns
Pro
secu
tin
g A
tto
rneys' R
eti
rem
en
t F
un
d
(am
ou
nts
ex
pre
ss
ed
in
th
ou
sa
nd
s)
6/3
0/2
02
06
/30
/20
19
6/3
0/2
01
86
/30
/20
17
6/3
0/2
01
66
/30
/20
15
6/3
0/2
01
46
/30
/20
13
Actu
ari
ally
de
term
ine
d c
on
trib
utio
n4
,60
8$
3,5
43
$
2
,53
3$
2,1
48
$
1
,38
1$
1,4
19
$
2
,34
5$
2,5
42
$
Con
trib
utio
ns in
re
latio
n t
o t
he
actu
ari
ally
de
term
ine
d
co
ntr
ibu
tio
n4
,23
2
3,2
16
3
,01
4
1,4
86
1
,44
0
1,0
63
1
,17
4
19
,44
3
Con
trib
utio
n d
eficie
ncy (
exce
ss)
37
6
32
7
(48
1)
66
2
(59
)
35
6
1,1
71
(1
6,9
01
)
Cove
red
pa
yro
ll2
3,9
89
21
,79
1
2
1,5
78
22
,63
5
2
1,3
72
21
,14
5
2
0,6
08
18
,80
5
Con
trib
utio
ns a
s a
pe
rce
nta
ge
of
co
ve
red
pa
yro
ll1
7.6
%1
4.8
%1
4.0
%6
.6%
6.7
%5
.0%
5.7
%1
03
.4%
No
tes
to
Sc
he
du
le:
Va
lua
tio
n d
ate
Actu
ari
ally
de
term
ine
d c
on
trib
utio
n r
ate
s a
re c
alc
ula
ted
as o
f Ju
ne
30
, tw
o y
ea
rs p
rio
r to
th
e e
nd
of
the
fis
ca
l ye
ar
in w
hic
h c
on
trib
utio
ns
are
re
po
rte
d.
Actu
ari
al co
st
me
tho
d
En
try a
ge
no
rma
l (L
eve
l P
erc
en
t o
f P
ayro
ll)
Am
ort
iza
tio
n m
eth
od
Le
ve
l d
olla
r
Rem
ain
ing
am
ort
iza
tio
n p
eri
od
20
ye
ars
, clo
se
d
Asse
t va
lua
tio
n m
eth
od
5 y
ea
r sm
oo
thin
g o
f g
ain
s a
nd
lo
sse
s o
n t
he
fa
ir v
alu
e o
f a
sse
ts s
ub
ject
to a
20
% c
orr
ido
r.
Infla
tio
n
2.2
5%
Sa
lary
in
cre
ase
s
2.7
5%
Inve
stm
en
t ra
te o
f re
turn
6.7
5%
Mo
rta
lity
Pu
b-2
01
0 P
ub
lic R
etire
me
nt
Pla
ns M
ort
alit
y T
ab
les (
Am
ou
nt-
We
igh
ted
) w
ith
a f
ully
ge
ne
ratio
na
l p
roje
ctio
n
of
mo
rta
lity im
pro
ve
me
nts
usin
g S
OA
Sca
le M
P-2
01
9.
Oth
er
info
rma
tio
n
Th
e a
ctu
ari
ally
de
term
ine
d c
on
trib
utio
n a
mo
un
ts a
re d
eve
lop
ed
in
th
e a
ctu
ari
al va
lua
tio
ns c
om
ple
ted
on
e y
ea
r p
rio
r to
th
e b
eg
inn
ing
of
the
fis
ca
l ye
ar.
Me
mb
er
ce
nsu
s d
ata
as o
f th
e p
rio
r ye
ar
en
d w
as u
se
d in
th
e v
alu
atio
n a
nd
ad
juste
d,
wh
ere
ap
pro
pri
ate
, to
re
fle
ct
ch
an
ge
s d
uri
ng
th
e c
urr
en
t fisca
l ye
ar.
Sta
nd
ard
actu
ari
al ro
ll fo
rwa
rd t
ech
niq
ue
s w
ere
th
en
use
d t
o p
roje
ct
the
lia
bili
tie
s c
om
pu
ted
as o
f p
rio
r ye
ar
en
d t
o t
he
cu
rre
nt
ye
ar
me
asu
rem
en
t d
ate
.
Th
e e
ffo
rt a
nd
co
st
to r
e-c
rea
te f
ina
ncia
l sta
tem
en
t in
form
atio
n f
or
10
ye
ars
wa
s n
ot
pra
ctica
l.
Info
rma
tio
n w
as p
rep
are
d p
rosp
ective
ly f
rom
Ju
ne
30
, 2
01
3 f
or
GA
SB
-S6
8 p
urp
ose
s.
145 - State of Indiana - Comprehensive Annual Financial Report

Sc
he
du
le o
f C
on
trib
uti
on
s
Em
plo
ye
e R
eti
rem
en
t S
ys
tem
s a
nd
Pla
ns
Le
gis
lato
rs' D
efi
ne
d B
en
efi
t P
lan
(am
ou
nts
ex
pre
ss
ed
in
th
ou
sa
nd
s)
6/3
0/2
02
06
/30
/20
19
6/3
0/2
01
86
/30
/20
17
6/3
0/2
01
66
/30
/20
15
6/3
0/2
01
46
/30
/20
13
Actu
ari
ally
de
term
ine
d c
on
trib
utio
n2
16
$
24
0$
23
7$
17
0$
13
8$
11
9$
13
8$
14
0$
Co
ntr
ibu
tio
ns in
re
latio
n to
th
e a
ctu
ari
ally
de
term
ine
d
co
ntr
ibu
tio
n2
08
26
9
23
7
13
5
13
8
13
1
13
8
15
0
Co
ntr
ibu
tio
n d
eficie
ncy (
exce
ss)
8
(29
)
-
35
-
(12
)
-
(10
)
Co
ve
red
pa
yro
llN
/AN
/AN
/AN
/AN
/AN
/AN
/AN
/A
Co
ntr
ibu
tio
ns a
s a
pe
rce
nta
ge
of
co
ve
red
pa
yro
llN
/AN
/AN
/AN
/AN
/AN
/AN
/AN
/A
No
tes
to
Sc
he
du
le:
Va
lua
tio
n d
ate
Actu
ari
ally
de
term
ine
d c
on
trib
utio
n r
ate
s a
re c
alc
ula
ted
as o
f Ju
ne
30
, tw
o y
ea
rs p
rio
r to
th
e e
nd
of
the
fis
ca
l ye
ar
in w
hic
h c
on
trib
utio
ns
are
re
po
rte
d.
Actu
ari
al co
st m
eth
od
En
try a
ge
no
rma
l (L
eve
l P
erc
en
t o
f P
ayro
ll) f
or
acco
un
tin
g a
nd
Tra
ditio
na
l U
nit C
red
it f
or
fun
din
g
Am
ort
iza
tio
n m
eth
od
Le
ve
l d
olla
r
Re
ma
inin
g a
mo
rtiz
atio
n p
eri
od
5 y
ea
rs, clo
se
d
Asse
t va
lua
tio
n m
eth
od
5 y
ea
r sm
oo
thin
g o
f g
ain
s a
nd
lo
sse
s o
n th
e f
air
va
lue
of
asse
ts s
ub
ject to
a 2
0%
co
rrid
or.
Infla
tio
n
2.2
5%
Sa
lary
in
cre
ase
s
2.7
5%
Inve
stm
en
t ra
te o
f re
turn
6.7
5%
Re
tire
me
nt a
ge
Mo
rta
lity
Pu
b-2
01
0 P
ub
lic R
etire
me
nt P
lan
s M
ort
alit
y T
ab
les (
Am
ou
nt-
We
igh
ted
) w
ith
a f
ully
ge
ne
ratio
na
l p
roje
ctio
n
of
mo
rta
lity im
pro
ve
me
nts
usin
g S
OA
Sca
le M
P-2
01
9.
Oth
er
info
rma
tio
n
Ba
se
d o
n th
e a
ctu
ari
al a
ssu
mp
tio
ns a
nd
me
tho
ds, a
n a
ctu
ari
ally
de
term
ine
d c
on
trib
utio
n a
mo
un
t is
co
mp
ute
d. T
he
IN
PR
S B
oa
rd o
f
Tru
ste
es c
on
sid
ers
th
is in
form
atio
n w
he
n r
eq
ue
stin
g a
pp
rop
ria
tio
ns f
rom
th
e S
tate
. M
em
be
r ce
nsu
s d
ata
as o
f th
e p
rio
r e
nd
wa
s
use
d in
th
e v
alu
atio
n a
nd
ad
juste
d, w
he
re a
pp
rop
ria
te, to
re
fle
ct ch
an
ge
s d
uri
ng
th
e c
urr
en
t fisca
l ye
ar.
S
tan
da
rd
actu
ari
al ro
ll fo
rwa
rd te
ch
niq
ue
s w
ere
th
en
use
d to
pro
ject lia
bili
tie
s c
om
pu
ted
as o
f p
rio
r ye
ar
en
d to
th
e c
urr
en
t ye
ar
me
asu
rem
en
t d
ate
.
N/A
is n
ot a
pp
lica
ble
as th
is is a
clo
se
d p
lan
with
no
pa
yro
ll.
Th
e e
ffo
rt a
nd
co
ts to
re
-cre
ate
fin
an
cia
l sta
tem
en
t in
form
atio
n f
or
10
ye
ars
wa
s n
ot p
ractica
l. In
form
atio
n w
as p
rep
are
d p
rosp
ective
ly
fro
m J
un
e 3
0, 2
01
3 f
or
GA
SB
-S6
8 p
urp
ose
s.
Comprehensive Annual Financial Report - State of Indiana - 146

Sc
he
du
le o
f C
on
trib
uti
on
s
Em
plo
ye
e R
eti
rem
en
t S
ys
tem
s a
nd
Pla
ns
Ju
dg
es
' R
eti
rem
en
t S
ys
tem
(am
ou
nts
ex
pre
ss
ed
in
th
ou
sa
nd
s)
6/3
0/2
02
06
/30
/20
19
6/3
0/2
01
86
/30
/20
17
6/3
0/2
01
66
/30
/20
15
6/3
0/2
01
46
/30
/20
13
Actu
arially
de
term
ine
d c
on
trib
ution
19
,40
6$
1
4,8
62
$
14
,85
3$
1
4,3
35
$
17
,48
5$
1
8,8
65
$
27
,64
8$
2
5,4
58
$
Co
ntr
ibu
tion
s in r
ela
tio
n to
th
e a
ctu
arially
de
term
ine
d
co
ntr
ibu
tion
18
,16
6
16
,03
1
15
,11
7
16
,82
4
16
,94
6
21
,02
0
20
,89
5
11
1,4
19
Co
ntr
ibu
tion
de
ficie
ncy (
exce
ss)
1,2
40
(1,1
69
)
(26
4)
(2,4
89
)
53
9
(2,1
55
)
6,7
53
(85
,96
1)
Co
ve
red
pa
yro
ll5
8,1
89
56
,38
0
53
,35
0
54
,75
5
51
,38
2
48
,58
2
46
,04
1
47
,59
5
Co
ntr
ibu
tion
s a
s a
pe
rce
nta
ge
of
co
ve
red
pa
yro
ll3
1.2
%2
8.4
%2
8.3
%3
0.7
%3
3.0
%4
3.3
%4
5.4
%2
34
.1%
No
tes
to
Sc
he
du
le:
Va
lua
tion
da
te
Actu
arially
de
term
ine
d c
on
trib
ution
ra
tes a
re c
alc
ula
ted
as o
f Ju
ne
30
, tw
o y
ea
rs p
rior
to th
e e
nd
of
the
fis
ca
l ye
ar
in w
hic
h c
on
trib
ution
s
are
re
po
rte
d.
Actu
arial co
st m
eth
od
En
try a
ge
no
rma
l (L
eve
l P
erc
en
t o
f P
ayro
ll)
Am
ort
iza
tion
me
tho
d
Le
ve
l d
olla
r
Re
ma
inin
g a
mo
rtiz
ation
pe
riod
20
ye
ars
, clo
se
d
Asse
t va
lua
tion
me
tho
d
5 y
ea
r sm
oo
thin
g o
f g
ain
s a
nd
losse
s o
n th
e f
air v
alu
e o
f a
sse
ts s
ub
ject to
a 2
0%
co
rrid
or.
Inflatio
n
2.2
5%
Sa
lary
incre
ase
s
2.7
5%
Inve
stm
en
t ra
te o
f re
turn
6.7
5%
Mo
rta
lity
Pu
b-2
01
0 P
ub
lic R
etire
me
nt P
lan
s M
ort
alit
y T
ab
les (
Am
ou
nt-
We
igh
ted
) w
ith
a f
ully
ge
ne
ration
al p
roje
ction
of
mo
rta
lity im
pro
ve
me
nts
usin
g S
OA
Sca
le M
P-2
01
9.
Oth
er
info
rma
tion
Th
e a
ctu
arially
de
term
ine
d c
on
trib
ution
am
ou
nts
are
de
ve
lop
ed
in th
e a
ctu
arial va
lua
tion
s c
om
ple
ted
on
e y
ea
r p
rior
to th
e b
eg
inn
ing
of
the
fis
ca
l ye
ar.
Me
mb
er
ce
nsu
s d
ata
as o
f th
e p
rior
ye
ar
en
d w
as u
se
d in th
e v
alu
ation
an
d a
dju
ste
d, w
he
re a
pp
rop
riate
, to
re
flect ch
an
ge
s d
uring
th
e c
urr
en
t fisca
l ye
ar.
Sta
nd
ard
actu
arial ro
ll fo
rwa
rd te
ch
niq
ue
s w
ere
th
en
use
d to
pro
ject th
e lia
bili
ties c
om
pu
ted
as o
f p
rior
ye
ar
en
d to
th
e c
urr
en
t ye
ar
me
asu
rem
en
t d
ate
.
Th
e e
ffo
rt a
nd
co
st to
re
-cre
ate
fin
an
cia
l sta
tem
en
t in
form
ation
fo
r 1
0 y
ea
rs w
as n
ot p
ractica
l. In
form
ation
wa
s p
rep
are
d p
rosp
ective
ly f
rom
Ju
ne
30
, 2
01
3 f
or
GA
SB
-S6
8 p
urp
ose
s.
147 - State of Indiana - Comprehensive Annual Financial Report

Sc
he
du
le o
f C
on
trib
uti
on
s
Em
plo
ye
e R
eti
rem
en
t S
ys
tem
s a
nd
Pla
ns
Pu
blic
Em
plo
ye
es
' R
eti
rem
en
t F
un
d
(am
ou
nts
ex
pre
ss
ed
in
th
ou
sa
nd
s)
6/3
0/2
02
06
/30
/20
19
6/3
0/2
01
86
/30
/20
17
6/3
0/2
01
66
/30
/20
15
6/3
0/2
01
46
/30
/20
13
Actu
ari
ally
de
term
ined
contr
ibution
15
8,8
62
$
1
52
,30
7$
14
8,8
71
$
1
40
,63
1$
14
3,4
99
$
1
33
,75
5$
13
4,9
76
$
1
14
,35
3$
Contr
ibutions in r
ela
tion t
o t
he a
ctu
ari
ally
de
term
ined
contr
ibution
15
8,8
62
1
52
,30
7
14
8,8
71
1
40
,63
1
14
3,4
99
1
33
,75
5
13
4,9
76
1
14
,35
3
Contr
ibution d
eficie
ncy (
excess)
- -
- -
- -
- -
Sta
te's
covere
d p
ayro
ll1
,40
6,6
18
1
,34
9,4
23
1
,30
5,0
16
1
,27
6,8
57
1
,19
9,9
21
1
,16
2,6
22
1
,21
3,0
31
1
,17
3,7
16
Contr
ibutions a
s a
perc
enta
ge
of
covere
d p
ayro
ll1
1.3
%1
1.3
%1
1.4
%1
1.0
%1
2.0
%1
1.5
%1
1.1
%9
.7%
No
tes t
o S
ch
ed
ule
:
Valu
ation d
ate
Actu
ari
ally
de
term
ined
contr
ibution r
ate
s a
re c
alc
ula
ted a
s o
f June
30
, tw
o y
ears
pri
or
to t
he
en
d o
f th
e fis
cal year
in w
hic
h c
ontr
ibutions
are
repo
rted
.
Actu
ari
al cost m
eth
od
Entr
y a
ge n
orm
al (L
evel P
erc
ent
of
Payro
ll)
Am
ort
ization m
eth
od
Level do
llar
Rem
ain
ing a
mort
ization p
eri
od
20 y
ears
, clo
sed
Asset valu
ation m
eth
od
5 y
ear
sm
ooth
ing o
f g
ain
s a
nd losses o
n the
fair
valu
e o
f a
ssets
subje
ct to
a 2
0%
corr
idor.
Inflation
2.2
5%
Sala
ry incre
ases
2.7
5%
- 8
.75%
based o
n s
erv
ice
Investm
ent
rate
of
retu
rn
6.7
5%
Mort
alit
y
Pub-2
010
Public
Retire
ment
Pla
ns M
ort
alit
y T
able
s (
Am
oun
t-W
eig
hte
d)
with a
fully
ge
nera
tiona
l pro
jection o
f m
ort
alit
y im
pro
vem
ents
usin
g S
OA
Scale
MP
-201
9.
The e
ffo
rt a
nd c
ost to
re-c
reate
fin
an
cia
l sta
tem
ent
info
rmation f
or
10
years
was n
ot pra
ctical.
Info
rmation w
as p
repa
red p
rospectively
fro
m J
une
30
, 20
13 f
or
GA
SB
-S68 p
urp
oses.
Oth
er
info
rmation
The IN
PR
S B
oard
sets
, at
its d
iscre
tion,
the
Sta
te’s
em
plo
yer
contr
ibution r
ate
up
on c
onsid
eri
ng t
he
results o
f th
e a
ctu
ari
al valu
ation a
nd
oth
er
an
aly
sis
as a
ppro
pri
ate
. T
he
actu
ari
ally
de
term
ined
contr
ibution r
ate
for
the S
tate
for
the f
iscal year
ende
d 6
/30
/14
was 1
1.1
7%
; ho
wever,
th
e IN
PR
S B
oard
app
roved a
Sta
te e
mplo
yer
contr
ibution r
ate
of
11
.20
%.
Th
e a
ctu
aria
lly d
ete
rmin
ed
co
ntr
ibu
tio
n r
ate
fo
r th
e S
tate
fo
r th
e f
isca
l ye
ar
en
de
d 6
/30
/15
wa
s 1
0.5
5%
; h
ow
eve
r, t
he
IN
PR
S B
oa
rd a
pp
rove
d a
Sta
te e
mp
loye
r
contr
ibution r
ate
of
11.2
0%
. T
he a
ctu
ari
ally
de
term
ined
contr
ibution r
ate
for
the S
tate
for
the f
iscal year
ende
d 6
/30
/16
was 9
.80%
; how
ever,
th
e IN
PR
S B
oard
app
roved a
Sta
te e
mplo
yer
contr
ibution r
ate
of
11.2
0%
. T
he a
ctu
ari
ally
de
term
ined
contr
ibution r
ate
for
the S
tate
for
the f
iscal year
ende
d 6
/30
/17
was 1
0.1
1%
; ho
wever,
th
e IN
PR
S
Board
app
roved a
Sta
te e
mplo
yer
contr
ibution r
ate
of
11.2
0%
. T
he a
ctu
ari
ally
de
term
ined
contr
ibution r
ate
for
the S
tate
for
the f
iscal year
ende
d 6
/30
/18
was 9
.89%
;
how
ever,
th
e IN
PR
S B
oard
app
roved a
Sta
te e
mplo
yer
contr
ibution r
ate
of
11.2
0%
. T
he a
ctu
ari
ally
de
term
ined
contr
ibution r
ate
for
the S
tate
for
the f
iscal year
ende
d 6
/30
/19
was 1
0.0
3%
; ho
wever,
th
e IN
PR
S B
oard
app
roved a
Sta
te e
mplo
yer
contr
ibution r
ate
of
11.2
0%
. T
he a
ctu
ari
ally
de
term
ined
contr
ibution r
ate
for
the S
tate
for
the f
isc
al year
en
de
d 6
/30
/20
wa
s 7
.83
%.
In a
dd
itio
n,
SE
A 3
73
-20
18
ma
nd
ate
d t
ha
t th
e c
ost
of
an
y e
xp
ecte
d p
ost
retire
me
nt
be
ne
fit
incre
ase
s a
fte
r 6
/30
/20
18
be
bro
ke
n o
ut
into
se
pa
rate
surc
harg
es. T
he s
urc
harg
es u
sed in th
e fis
cal year
ende
d 6
/30
/20
20 a
re 0
.43
% for
7/1
/2019
- 1
2/3
1/2
019 a
nd
0.4
4%
for
1/1
/20
20 -
6/3
0/2
020
. H
ow
ever,
th
e IN
PR
S B
oard
app
roved a
Sta
te e
mplo
yer
contr
ibution r
ate
of
11.2
0%
, w
hic
h inclu
de
s b
oth
the b
ase b
ene
fit an
d s
urc
harg
e r
ate
s. T
he a
ctu
al do
llar
am
oun
t of
the
Sta
te’s
contr
ibutions
dep
end
s o
n the
actu
al pa
yro
ll fo
r th
e f
iscal year.
Mem
ber
census d
ata
as o
f th
e p
rior
year
end w
as u
sed in th
e v
alu
ation a
nd
ad
juste
d, w
here
app
ropri
ate
, to
reflect chan
ges d
uri
ng t
he
curr
ent
fiscal year.
Sta
ndard
actu
ari
al
roll
forw
ard
te
chniq
ue
s w
ere
th
en u
sed t
o p
roje
ct th
e lia
bili
ties c
om
pute
d a
s o
f pri
or
year
end t
o t
he c
urr
ent
year
mea
sure
ment
da
te.
Comprehensive Annual Financial Report - State of Indiana - 148

Sch
ed
ule
of
Co
ntr
ibu
tio
ns
Em
plo
yee R
eti
rem
en
t S
yste
ms a
nd
Pla
ns
Teach
ers
' R
eti
rem
en
t F
un
d P
re-1
996 A
cco
un
t
(am
ou
nts
exp
ressed
in
th
ou
san
ds)
6/3
0/2
02
06
/30/2
01
96
/30/2
01
86
/30/2
01
76
/30/2
01
66
/30/2
01
56
/30/2
01
46
/30/2
01
3
Sta
tuto
rily
dete
rmin
ed
co
ntr
ibutio
n9
71
,219
$
944
,027
$
918
,021
$
871
,141
$
887
,643
$
845
,774
$
825
,617
$
1,0
03
,847
$
Co
ntr
ibutio
ns in
re
latio
n t
o t
he s
tatu
torily
re
qu
ire
d
co
ntr
ibutio
n9
71
,219
944
,027
918
,021
871
,141
887
,643
845
,774
825
,617
1,0
03
,847
Co
ntr
ibutio
n d
eficie
ncy (
exce
ss)
-
-
-
-
-
-
-
-
No
tes
to
Sch
ed
ule
:
Va
luatio
n d
ate
Actu
aria
lly d
ete
rmin
ed
co
ntr
ibutio
n r
ate
s a
re c
alc
ula
ted a
s o
f Ju
ne
30,
two
ye
ars
prior
to t
he e
nd
of
the f
isca
l ye
ar
in w
hic
h c
ontr
ibutio
ns
are
re
po
rte
d.
Actu
aria
l co
st
me
thod
En
try a
ge
norm
al (L
eve
l P
erc
en
t o
f P
ayro
ll)
Am
ort
iza
tio
n m
eth
od
Leve
l d
olla
r
Re
ma
inin
g a
mo
rtiz
atio
n p
erio
d
5 y
ears
, clo
sed
Asse
t va
luatio
n m
eth
od
5 y
ear
sm
ooth
ing o
f g
ain
s a
nd
lo
sses o
n t
he f
air v
alu
e o
f a
ssets
su
bje
ct
to a
20%
co
rrid
or.
Infla
tio
n
2.2
5%
Sa
lary
in
cre
ase
s
2.7
5%
- 1
2.0
0%
base
d o
n s
erv
ice
Investm
ent
rate
of
retu
rn
6.7
5%
Mo
rta
lity
Pu
b-2
01
0 P
ublic
Re
tire
me
nt
Pla
ns M
ort
alit
y T
ab
les (
Am
oun
t-W
eig
hte
d)
with
a f
ully
gen
era
tio
na
l p
roje
ctio
n o
f m
ort
alit
y im
pro
ve
me
nts
usin
g S
OA
Sca
le M
P-2
01
9.
Oth
er
info
rma
tio
n
Me
mb
er
ce
nsu
s d
ata
as o
f th
e p
rior
ye
ar
end
wa
s u
sed
in
th
e v
alu
atio
n a
nd
adju
ste
d,
wh
ere
app
rop
ria
te,
to r
efle
ct
ch
an
ge
s d
urin
g t
he c
urr
ent
fisca
l ye
ar.
Sta
nd
ard
actu
aria
l ro
ll fo
rward
te
chn
ique
s w
ere
th
en
used
to
pro
ject
the lia
bili
tie
s c
om
pute
d a
s o
f p
rior
ye
ar
end
to
th
e c
urr
ent
ye
ar
me
asu
rem
ent
date
.
The
eff
ort
and
co
st
to r
e-c
reate
fin
an
cia
l sta
tem
ent
info
rma
tio
n f
or
10 y
ears
wa
s n
ot
pra
ctica
l.
Info
rma
tio
n w
as p
rep
are
d p
rosp
ectively
fro
m
Ju
ne
30,
201
3 f
or
GA
SB
-S6
8 p
urp
ose
s.
149 - State of Indiana - Comprehensive Annual Financial Report

Sch
ed
ule
of
Co
ntr
ibu
tio
ns
Em
plo
yee R
eti
rem
en
t S
yste
ms a
nd
Pla
ns
Teach
ers
' R
eti
rem
en
t F
un
d 1
996 A
cco
un
t
(am
ou
nts
ex
pre
ss
ed
in
th
ou
sa
nd
s)
6/3
0/2
02
06
/30
/20
19
6/3
0/2
01
86
/30
/20
17
6/3
0/2
01
66
/30
/20
15
6/3
0/2
01
46
/30
/20
13
Actu
ari
ally
de
term
ine
d c
on
trib
utio
n6
05
$
8
33
$
8
14
$
8
79
$
7
58
$
7
72
$
7
35
$
7
61
$
Con
trib
utio
ns in
re
latio
n t
o t
he
actu
ari
ally
de
term
ine
d
co
ntr
ibu
tio
n6
05
1
50
,83
3
81
4
87
9
75
8
77
2
73
5
76
1
Con
trib
utio
n d
eficie
ncy (
exce
ss)
-
(15
0,0
00
)
-
-
-
-
-
-
Sta
te's
co
ve
red
pa
yro
ll1
1,1
50
11
,22
4
1
1,0
16
11
,72
2
1
0,1
08
10
,28
8
1
0,3
80
10
,15
0
Con
trib
utio
ns a
s a
pe
rce
nta
ge
of
co
ve
red
pa
yro
ll5
.4%
13
43
.8%
7.4
%7
.5%
7.5
%7
.5%
7.1
%7
.5%
No
tes
to
Sc
he
du
le:
Va
lua
tio
n d
ate
Actu
ari
ally
de
term
ine
d c
on
trib
utio
n r
ate
s a
re c
alc
ula
ted
as o
f Ju
ne
30
, tw
o y
ea
rs p
rio
r to
th
e e
nd
of
the
fis
ca
l ye
ar
in w
hic
h c
on
trib
utio
ns
are
re
po
rte
d.
Actu
ari
al co
st
me
tho
d
En
try a
ge
no
rma
l (L
eve
l P
erc
en
t o
f P
ayro
ll)
Am
ort
iza
tio
n m
eth
od
Le
ve
l d
olla
r
Rem
ain
ing
am
ort
iza
tio
n p
eri
od
20
ye
ars
, clo
se
d
Asse
t va
lua
tio
n m
eth
od
5 y
ea
r sm
oo
thin
g o
f g
ain
s a
nd
lo
sse
s o
n t
he
fa
ir v
alu
e o
f a
sse
ts s
ub
ject
to a
20
% c
orr
ido
r.
Infla
tio
n
2.2
5%
Sa
lary
in
cre
ase
s
2.7
5%
- 1
2.0
0%
ba
se
d o
n y
ea
rs o
f se
rvic
e
Inve
stm
en
t ra
te o
f re
turn
6.7
5%
Mo
rta
lity
Pu
b-2
01
0 P
ub
lic R
etire
me
nt
Pla
ns M
ort
alit
y T
ab
les (
Am
ou
nt-
We
igh
ted
) w
ith
a f
ully
ge
ne
ratio
na
l p
roje
ctio
n o
f m
ort
alit
y im
pro
ve
me
nts
usin
g S
OA
Sca
le M
P-2
01
9.
Oth
er
info
rma
tio
n
Me
mb
er
ce
nsu
s d
ata
as o
f th
e p
rio
r ye
ar
en
d w
as u
se
d in
th
e v
alu
atio
n a
nd
ad
juste
d,
wh
ere
ap
pro
pri
ate
, to
re
fle
ct
ch
an
ge
s d
uri
ng
th
e c
urr
en
t fisca
l ye
ar.
Sta
nd
ard
actu
ari
al ro
ll fo
rwa
rd t
ech
niq
ue
s w
ere
th
en
use
d t
o p
roje
ct
the
lia
bili
tie
s c
om
pu
ted
as o
f p
rio
r ye
ar
en
d t
o t
he
cu
rre
nt
ye
ar
me
asu
rem
en
t d
ate
.
Th
e e
ffo
rt a
nd
co
st
to r
e-c
rea
te f
ina
ncia
l sta
tem
en
t in
form
atio
n f
or
10
ye
ars
wa
s n
ot
pra
ctica
l.
Info
rma
tio
n w
as p
rep
are
d p
rosp
ective
ly f
rom
Ju
ne
30
, 2
01
3 f
or
GA
SB
-S6
8 p
urp
ose
s.
Comprehensive Annual Financial Report - State of Indiana - 150
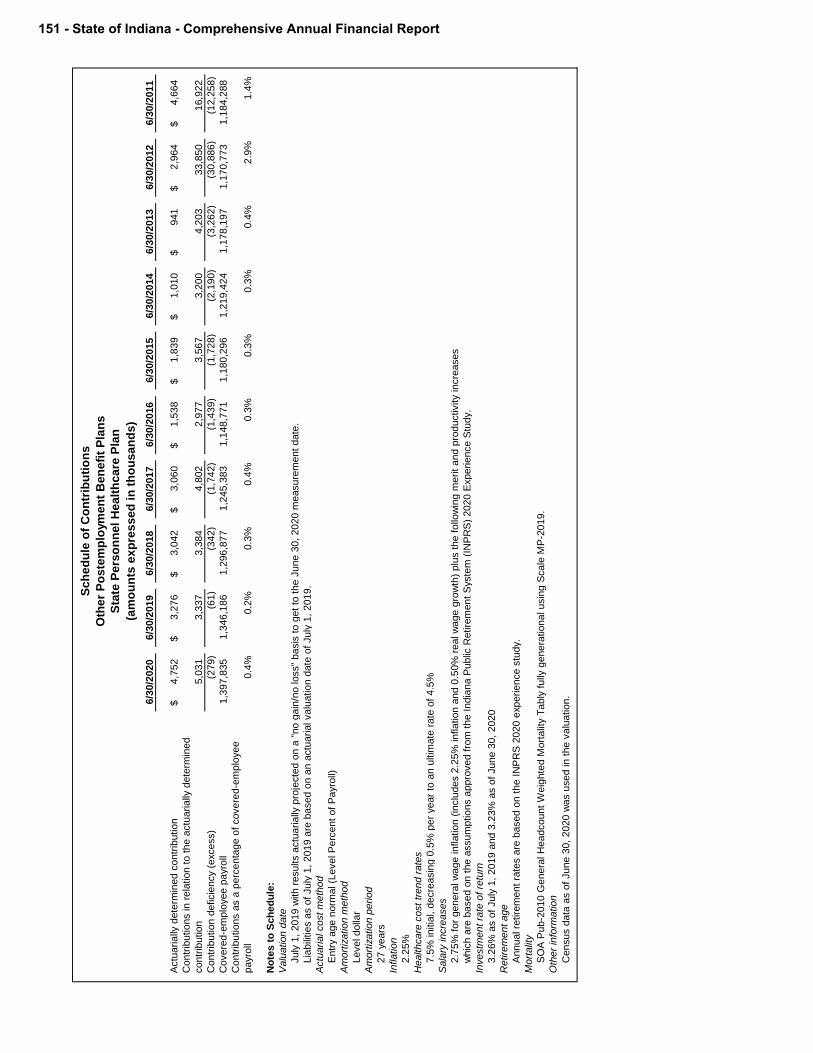
Sc
he
du
le o
f C
on
trib
uti
on
s
Oth
er
Po
ste
mp
loym
en
t B
en
efi
t P
lan
s
Sta
te P
ers
on
ne
l H
ea
lth
ca
re P
lan
(am
ou
nts
ex
pre
ss
ed
in
th
ou
sa
nd
s)
6/3
0/2
02
06
/30
/20
19
6/3
0/2
01
86
/30
/20
17
6/3
0/2
01
66
/30
/20
15
6/3
0/2
01
46
/30
/20
13
6/3
0/2
01
26
/30
/20
11
Actu
aria
lly d
ete
rmin
ed
co
ntr
ibu
tio
n4
,75
2$
3
,27
6$
3
,04
2$
3
,06
0$
1
,53
8$
1
,83
9$
1
,01
0$
941
$
2,9
64
$
4,6
64
$
Co
ntr
ibu
tio
ns in
re
latio
n t
o t
he
actu
aria
lly d
ete
rmin
ed
co
ntr
ibu
tio
n5
,03
1
3
,33
7
3
,38
4
4
,80
2
2
,97
7
3
,56
7
3
,20
0
4
,20
3
3
3,8
50
1
6,9
22
Co
ntr
ibu
tio
n d
eficie
ncy (
exce
ss)
(27
9)
(6
1)
(34
2)
(1
,74
2)
(1,4
39
)
(1
,72
8)
(2,1
90
)
(3
,26
2)
(30
,88
6)
(1
2,2
58
)
Co
ve
red
-em
plo
ye
e p
ayro
ll1
,39
7,8
35
1
,34
6,1
86
1
,29
6,8
77
1
,24
5,3
83
1
,14
8,7
71
1
,18
0,2
96
1
,21
9,4
24
1
,17
8,1
97
1
,17
0,7
73
1
,18
4,2
88
Co
ntr
ibu
tio
ns a
s a
pe
rce
nta
ge
of
co
ve
red
-em
plo
ye
e
pa
yro
ll0
.4%
0.2
%0
.3%
0.4
%0
.3%
0.3
%0
.3%
0.4
%2
.9%
1.4
%
No
tes
to
Sc
he
du
le:
Va
lua
tio
n d
ate
Ju
ly 1
, 2
01
9 w
ith
re
su
lts a
ctu
aria
lly p
roje
cte
d o
n a
"n
o g
ain
/no
lo
ss"
ba
sis
to
ge
t to
th
e J
un
e 3
0,
20
20
me
asu
rem
en
t d
ate
.
Lia
bili
ties a
s o
f July
1,
2019 a
re b
ased o
n a
n a
ctu
arial valu
ation d
ate
of
July
1,
2019.
Actu
aria
l co
st
me
tho
d
En
try a
ge
no
rma
l (L
eve
l P
erc
en
t o
f P
ayro
ll)
Am
ort
iza
tio
n m
eth
od
Le
ve
l d
olla
r
Am
ort
iza
tio
n p
erio
d
27
ye
ars
Infla
tio
n
2.2
5%
He
alth
ca
re c
ost
tre
nd
ra
tes
7.5
% in
itia
l, d
ecre
asin
g 0
.5%
pe
r ye
ar
to a
n u
ltim
ate
ra
te o
f 4
.5%
Sa
lary
in
cre
ase
s
2.7
5%
fo
r g
en
era
l w
ag
e in
fla
tio
n (
inclu
de
s 2
.25
% in
fla
tio
n a
nd
0.5
0%
re
al w
ag
e g
row
th)
plu
s t
he
fo
llow
ing
me
rit
an
d p
rod
uctivity in
cre
ase
s
wh
ich
are
ba
se
d o
n t
he
assu
mp
tio
ns a
pp
rove
d f
rom
th
e I
nd
ian
a P
ub
lic R
etire
me
nt
Syste
m (
INP
RS
) 2
02
0 E
xp
erie
nce
Stu
dy.
Inve
stm
en
t ra
te o
f re
turn
3.2
6%
as o
f Ju
ly 1
, 2
01
9 a
nd
3.2
3%
as o
f Ju
ne
30
, 2
02
0
Re
tire
me
nt
ag
e
An
nu
al re
tire
me
nt
rate
s a
re b
ase
d o
n t
he
IN
PR
S 2
02
0 e
xp
erie
nce
stu
dy.
Mo
rta
lity
SO
A P
ub
-20
10
Ge
ne
ral H
ea
dco
un
t W
eig
hte
d M
ort
alit
y T
ab
ly f
ully
ge
ne
ratio
na
l u
sin
g S
ca
le M
P-2
01
9.
Oth
er
info
rma
tio
n
Ce
nsu
s d
ata
as o
f Ju
ne
30
, 2
02
0 w
as u
se
d in
th
e v
alu
atio
n.
151 - State of Indiana - Comprehensive Annual Financial Report

Sc
he
du
le o
f C
on
trib
uti
on
s
Oth
er
Po
ste
mp
loym
en
t B
en
efi
t P
lan
s
Ind
ian
a S
tate
Po
lic
e H
ea
lth
ca
re P
lan
(am
ou
nts
ex
pre
ss
ed
in
th
ou
sa
nd
s)
6/3
0/2
02
06/3
0/2
01
96/3
0/2
01
86/3
0/2
01
76/3
0/2
01
66/3
0/2
01
56/3
0/2
01
46/3
0/2
01
36/3
0/2
01
26/3
0/2
01
1
Actu
ari
ally
dete
rmin
ed c
on
trib
ution
9,1
16
$
18
,356
$
35
,042
$
34
,980
$
30
,630
$
29
,604
$
26
,030
$
27
,419
$
27
,794
$
30
,155
$
Con
trib
ution
s in r
ela
tion
to
th
e a
ctu
ari
ally
dete
rmin
ed
con
trib
ution
21
,727
23
,937
25
,814
26
,871
34
,862
25
,320
24
,835
11
,684
18
,627
13
,787
Con
trib
ution
deficie
ncy (
excess)
(12
,611
)
(5
,58
1)
9,2
28
8,1
09
(4
,23
2)
4,2
84
1,1
95
15
,735
9,1
67
16
,368
Covere
d-e
mplo
yee
payro
ll12
0,2
55
12
0,4
47
10
7,9
14
98
,693
91
,753
92
,130
93
,630
93
,680
92
,494
92
,845
Con
trib
ution
s a
s a
perc
en
tage
of co
vere
d-e
mplo
yee
pa
yro
ll18
.1%
19
.9%
23
.9%
27
.2%
38
.0%
27
.5%
26
.5%
12
.5%
20
.1%
14
.8%
No
tes
to
Sch
ed
ule
:
Valu
ation
date
July
1, 2
01
9 w
ith r
esu
lts a
ctu
ari
ally
pro
jecte
d o
n a
"no
gain
/no loss"
basis
to g
et to
th
e J
un
e 3
0, 2
02
0 m
ea
sure
men
t d
ate
.
Lia
bili
ties a
s o
f Ju
ly 1
, 2
01
9 a
re b
ased
on a
n a
ctu
ari
al valu
ation
date
of
Ju
ly 1
, 2
01
9.
Actu
ari
al co
st m
eth
od
Entr
y a
ge
norm
al (L
evel P
erc
en
t o
f P
ayro
ll)
Am
ort
ization
meth
od
Le
vel d
olla
r
Am
ort
ization
peri
od
27
yea
rs
Inflation
2.2
5%
Hea
lthca
re c
ost
tren
d r
ate
s
7.5
% initia
l, d
ecre
asin
g 0
.5%
per
yea
r to
an u
ltim
ate
rate
of
4.5
%
Sala
ry incre
ases
2.5
0%
fo
r g
en
era
l w
ag
e infla
tion
(in
clu
des 2
.25
% inflatio
n a
nd 0
.25
% r
ea
l w
ag
e g
row
th)
plu
s t
he
fo
llow
ing
meri
t a
nd
pro
ductivity incre
ases
whic
h a
re b
ased
on t
he a
ssu
mption
s a
pp
roved
fro
m th
e I
ndia
na
Pub
lic R
etire
men
t S
yste
m (
INP
RS
) 2
02
0 E
xpe
rien
ce S
tudy.
Investm
en
t ra
te o
f re
turn
6.2
0%
as o
f Ju
ly 1
, 2
01
9 a
nd 6
.20
% a
s o
f Ju
ne
30,
202
0
Retire
men
t a
ge
Ann
ua
l re
tire
men
t ra
tes a
re b
ased
on t
he I
NP
RS
202
0 e
xpe
rien
ce s
tudy.
Mort
alit
y
Hea
lthy e
mplo
yee
s a
nd
retire
es: S
OA
Pub
-20
10
Pub
lic S
afe
ty H
ea
dco
un
t W
eig
hte
d M
ort
alit
y T
ab
le f
ully
gen
era
tion
al u
sin
g S
cale
MP
-20
19
Dis
able
d r
etire
es: S
OA
Pub
-20
10
Ge
ne
ral D
isab
led
Retire
e H
ea
dco
un
t W
eig
hte
d M
ort
alit
y T
ab
le f
ully
gen
era
tion
al u
sin
g S
cale
MP
-20
19
Surv
ivin
g S
po
use
s: S
OA
Pub
-20
10
Con
tinu
ing
Surv
ivor
Hea
dco
un
t W
eig
hte
d M
ort
alit
y T
ab
le f
ully
gen
era
tion
al u
sin
g S
cale
MP
-20
19
Oth
er
info
rmation
Cen
sus d
ata
as o
f Ju
ne
30,
202
0 w
as u
se
d in t
he
valu
ation
.
Comprehensive Annual Financial Report - State of Indiana - 152

Sc
he
du
le o
f C
on
trib
uti
on
s
Oth
er
Po
ste
mp
loym
en
t B
en
efi
t P
lan
s
Co
ns
erv
ati
on
an
d E
xc
ise
Po
lic
e H
ea
lth
ca
re P
lan
(am
ou
nts
ex
pre
ss
ed
in
th
ou
sa
nd
s)
6/3
0/2
02
06/3
0/2
01
96/3
0/2
01
86/3
0/2
01
76/3
0/2
01
66/3
0/2
01
56/3
0/2
01
46/3
0/2
01
36/3
0/2
01
26/3
0/2
01
1
Actu
ari
ally
dete
rmin
ed c
on
trib
ution
5,6
00
$
3,7
74
$
3,8
31
$
3,3
49
$
3,3
13
$
3,1
24
$
2,8
22
$
3,0
53
$
3,6
75
$
4,4
23
$
Con
trib
ution
s in r
ela
tion
to
th
e a
ctu
ari
ally
dete
rmin
ed
con
trib
ution
4,1
67
4,0
21
6,2
41
3,7
18
3,5
75
2,4
37
2,4
82
2,8
93
6,8
89
1,3
36
Con
trib
ution
deficie
ncy (
excess)
1,4
33
(2
47)
(2,4
10)
(3
69)
(26
2)
68
7
34
0
16
0
(3,2
14)
3,0
87
Covere
d-e
mplo
yee
payro
ll18
,453
18
,883
16
,981
15
,602
14
,497
15
,106
15
,969
16
,038
15
,541
16
,283
Con
trib
ution
s a
s a
perc
en
tage
of co
vere
d-e
mplo
yee
pa
yro
ll22
.6%
21
.3%
36
.8%
23
.8%
24
.7%
16
.1%
15
.5%
18
.0%
44
.3%
8.2
%
No
tes
to
Sch
ed
ule
:
Valu
ation
date
July
1, 2
01
9 w
ith r
esu
lts a
ctu
ari
ally
pro
jecte
d o
n a
"no
gain
/no loss"
basis
to g
et to
th
e J
un
e 3
0, 2
02
0 m
ea
sure
men
t d
ate
.
Lia
bili
ties a
s o
f Ju
ly 1
, 2
01
9 a
re b
ased
on a
n a
ctu
ari
al valu
ation
date
of
Ju
ly 1
, 2
01
9.
Actu
ari
al co
st m
eth
od
Entr
y a
ge
norm
al (L
evel P
erc
en
t o
f P
ayro
ll)
Am
ort
ization
meth
od
Le
vel d
olla
r
Am
ort
ization
peri
od
27
yea
rs
Inflation
2.2
5%
Hea
lthca
re c
ost
tren
d r
ate
s
7.5
% initia
l, d
ecre
asin
g 0
.5%
per
yea
r to
an u
ltim
ate
rate
of
4.5
%
Sala
ry incre
ases
2.7
5%
fo
r g
en
era
l w
ag
e infla
tion
(in
clu
des 2
.25
% inflatio
n a
nd 0
.50
% r
ea
l w
ag
e g
row
th)
plu
s t
he
fo
llow
ing
meri
t a
nd
pro
ductivity incre
ases
whic
h a
re b
ased
on t
he a
ssu
mption
s a
pp
roved
fro
m th
e I
ndia
na
Pub
lic R
etire
men
t S
yste
m (
INP
RS
) 2
02
0 E
xpe
rien
ce S
tudy.
Investm
en
t ra
te o
f re
turn
3.3
6%
as o
f Ju
ly 1
, 2
01
9 a
nd 6
.20
% a
s o
f Ju
ne
30,
202
0
Retire
men
t a
ge
Ann
ua
l re
tire
men
t ra
tes a
re b
ased
on t
he I
NP
RS
202
0 e
xpe
rien
ce s
tudy.
Mort
alit
y
Hea
lthy e
mplo
yee
s a
nd
retire
es: S
OA
Pub
-20
10
Pub
lic S
afe
ty H
ea
dco
un
t W
eig
hte
d M
ort
alit
y T
ab
le f
ully
gen
era
tion
al u
sin
g S
cale
MP
-20
19
Dis
able
d r
etire
es: S
OA
Pub
-20
10
Ge
ne
ral D
isab
led
Retire
e H
ea
dco
un
t W
eig
hte
d M
ort
alit
y T
ab
le f
ully
gen
era
tion
al u
sin
g S
cale
MP
-20
19
Surv
ivin
g S
po
use
s: S
OA
Pub
-20
10
Con
tinu
ing
Surv
ivor
Hea
dco
un
t W
eig
hte
d M
ort
alit
y T
ab
le f
ully
gen
era
tion
al u
sin
g S
cale
MP
-20
19
Oth
er
info
rmation
Cen
sus d
ata
as o
f Ju
ne
30,
202
0 w
as u
se
d in t
he
valu
ation
.
153 - State of Indiana - Comprehensive Annual Financial Report
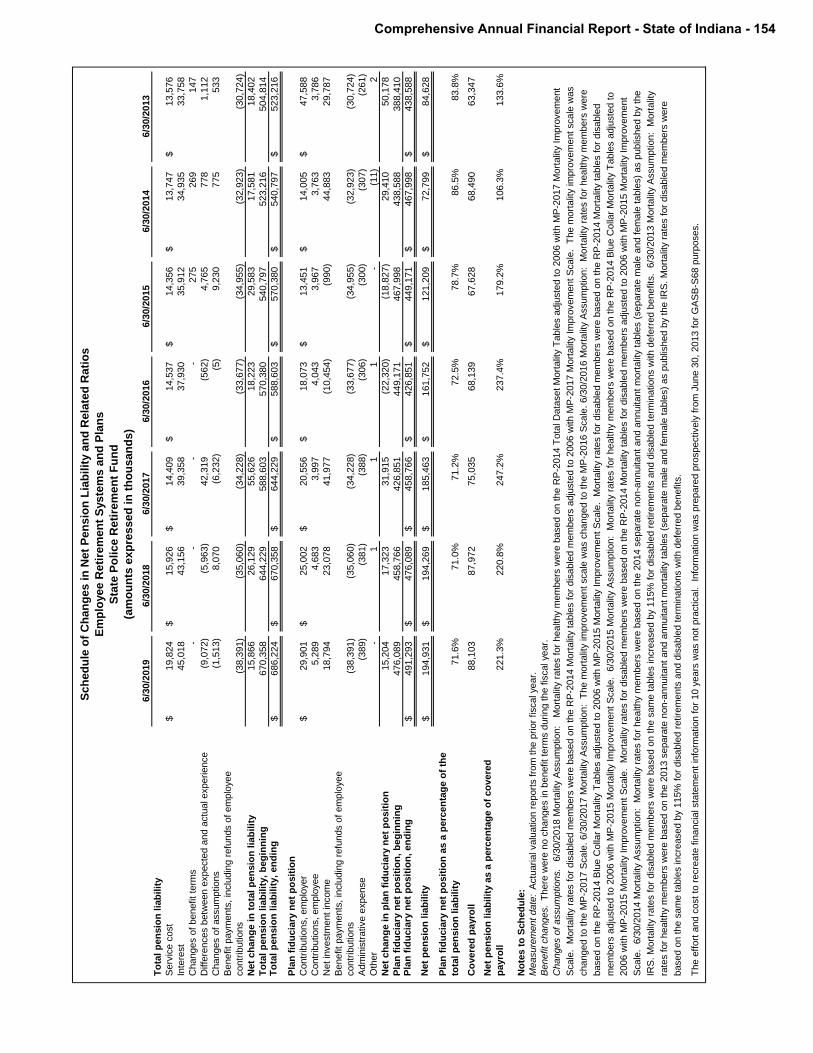
Sch
ed
ule
of
Ch
an
ges in
Net
Pen
sio
n L
iab
ilit
y a
nd
Rela
ted
Rati
os
Em
plo
yee R
eti
rem
en
t S
yste
ms a
nd
Pla
ns
Sta
te P
olice R
eti
rem
en
t F
un
d
(am
ou
nts
ex
pre
ss
ed
in
th
ou
san
ds
)
6/3
0/2
019
6/3
0/2
018
6/3
0/2
017
6/3
0/2
016
6/3
0/2
015
6/3
0/2
014
6/3
0/2
013
To
tal
pen
sio
n l
iab
ilit
y
Serv
ice c
ost
19,8
24
$
15,9
26
$
14,4
09
$
14,5
37
$
14,3
56
$
13,7
47
$
13,5
76
$
Inte
rest
45,0
18
43,1
56
39,3
58
37,9
30
35,9
12
34,9
35
33,7
58
Changes o
f benefit
term
s-
-
-
-
275
269
147
Diffe
rences b
etw
een e
xpecte
d a
nd a
ctu
al experience
(9,0
72)
(5,9
63)
42,3
19
(5
62)
4,7
65
778
1,1
12
Changes o
f assum
ptions
(1,5
13)
8,0
70
(6
,232)
(5
)
9,2
30
775
533
Benefit
paym
ents
, in
clu
din
g r
efu
nds o
f em
plo
yee
contr
ibutions
(38,3
91)
(3
5,0
60)
(3
4,2
28)
(33,6
77)
(3
4,9
55)
(3
2,9
23)
(3
0,7
24)
Net
ch
an
ge i
n t
ota
l p
en
sio
n l
iab
ilit
y15,8
66
26,1
29
55,6
26
18,2
23
29,5
83
17,5
81
18,4
02
To
tal
pen
sio
n l
iab
ilit
y,
beg
inn
ing
670,3
58
644,2
29
588,6
03
570,3
80
540,7
97
523,2
16
504,8
14
T
ota
l p
en
sio
n l
iab
ilit
y,
en
din
g686,2
24
$
670,3
58
$
644,2
29
$
588,6
03
$
570,3
80
$
540,7
97
$
523,2
16
$
Pla
n f
idu
cia
ry n
et
po
sit
ion
Contr
ibutions,
em
plo
yer
29,9
01
$
25,0
02
$
20,5
56
$
18,0
73
$
13,4
51
$
14,0
05
$
47,5
88
$
Contr
ibutions,
em
plo
yee
5,2
89
4,6
83
3,9
97
4,0
43
3,9
67
3,7
63
3,7
86
Net
investm
ent
incom
e18,7
94
23,0
78
41,9
77
(1
0,4
54)
(9
90)
44,8
83
29,7
87
Benefit
paym
ents
, in
clu
din
g r
efu
nds o
f em
plo
yee
contr
ibutions
(38,3
91)
(3
5,0
60)
(3
4,2
28)
(33,6
77)
(3
4,9
55)
(3
2,9
23)
(3
0,7
24)
Adm
inis
trative e
xpense
(389)
(381)
(388)
(3
06)
(300)
(307)
(261)
Oth
er
-
1
1
1
-
(11)
2
Net
ch
an
ge i
n p
lan
fid
ucia
ry n
et
po
sit
ion
15,2
04
17,3
23
31,9
15
(2
2,3
20)
(1
8,8
27)
29,4
10
50,1
78
Pla
n f
idu
cia
ry n
et
po
sit
ion
, b
eg
inn
ing
476,0
89
458,7
66
426,8
51
449,1
71
467,9
98
438,5
88
388,4
10
P
lan
fid
ucia
ry n
et
po
sit
ion
, en
din
g491,2
93
$
476,0
89
$
458,7
66
$
426,8
51
$
449,1
71
$
467,9
98
$
438,5
88
$
Net
pen
sio
n l
iab
ilit
y194,9
31
$
194,2
69
$
185,4
63
$
161,7
52
$
121,2
09
$
72,7
99
$
84,6
28
$
Pla
n f
idu
cia
ry n
et
po
sit
ion
as a
perc
en
tag
e o
f th
e
tota
l p
en
sio
n l
iab
ilit
y71.6
%71.0
%71.2
%72.5
%78.7
%86.5
%83.8
%
Co
vere
d p
ayro
ll88,1
03
87,9
72
75,0
35
68,1
39
67,6
28
68,4
90
63,3
47
Net
pen
sio
n l
iab
ilit
y a
s a
perc
en
tag
e o
f co
vere
d
payro
ll221.3
%220.8
%247.2
%237.4
%179.2
%106.3
%133.6
%
No
tes t
o S
ch
ed
ule
:
Measure
ment
date
: A
ctu
arial valu
ation r
eport
s f
rom
the p
rior
fiscal year.
Benefit
changes.
There
were
no c
hanges in b
enefit
term
s d
uring t
he f
iscal year.
Changes o
f assum
ptions.
6/3
0/2
018 M
ort
alit
y A
ssum
ption:
M
ort
alit
y r
ate
s f
or
healthy m
em
bers
were
based o
n t
he R
P-2
014 T
ota
l D
ata
set
Mort
alit
y T
able
s a
dju
ste
d t
o 2
006 w
ith M
P-2
017 M
ort
alit
y Im
pro
vem
ent
Scale
. M
ort
alit
y r
ate
s f
or
dis
able
d m
em
bers
were
based o
n t
he R
P-2
014 M
ort
alit
y t
able
s f
or
dis
able
d m
em
bers
adju
ste
d t
o 2
006 w
ith M
P-2
017 M
ort
alit
y Im
pro
vem
ent
Scale
. T
he m
ort
alit
y im
pro
vem
ent
scale
was
changed t
o t
he M
P-2
017 S
cale
. 6/3
0/2
017 M
ort
alit
y A
ssum
ption:
The m
ort
alit
y im
pro
vem
ent
scale
was c
hanged t
o t
he M
P-2
016 S
cale
. 6/3
0/2
016 M
ort
alit
y A
ssum
ption:
Mort
alit
y r
ate
s f
or
healthy m
em
bers
were
based o
n t
he R
P-2
014 B
lue C
olla
r M
ort
alit
y T
able
s a
dju
ste
d t
o 2
006 w
ith M
P-2
015 M
ort
alit
y Im
pro
vem
ent
Scale
. M
ort
alit
y r
ate
s f
or
dis
able
d m
em
bers
were
based o
n t
he R
P-2
014 M
ort
alit
y t
able
s f
or
dis
able
d
mem
bers
adju
ste
d t
o 2
006 w
ith M
P-2
015 M
ort
alit
y Im
pro
vem
ent
Scale
. 6
/30/2
015 M
ort
alit
y A
ssum
ption:
Mort
alit
y r
ate
s f
or
healthy m
em
bers
were
based o
n t
he R
P-2
014 B
lue C
olla
r M
ort
alit
y T
able
s a
dju
ste
d t
o
2006 w
ith M
P-2
015 M
ort
alit
y Im
pro
vem
ent
Scale
. M
ort
alit
y r
ate
s f
or
dis
able
d m
em
bers
were
based o
n t
he R
P-2
014 M
ort
alit
y t
able
s f
or
dis
able
d m
em
bers
adju
ste
d t
o 2
006 w
ith M
P-2
015 M
ort
alit
y Im
pro
vem
ent
Scale
. 6
/30/2
014 M
ort
alit
y A
ssum
ption:
Mort
alit
y r
ate
s f
or
healthy m
em
bers
were
based o
n t
he 2
014 s
epara
te n
on-a
nnuitant
and a
nnuitant
mort
alit
y t
able
s (
separa
te m
ale
and f
em
ale
table
s)
as p
ublis
hed b
y t
he
IRS
. M
ort
alit
y r
ate
s f
or
dis
able
d m
em
bers
were
based o
n t
he s
am
e t
able
s incre
ased b
y 1
15%
for
dis
able
d r
etire
ments
and d
isable
d t
erm
inations w
ith d
efe
rred b
enefits
. 6
/30/2
013 M
ort
alit
y A
ssum
ption:
Mort
alit
y
rate
s f
or
healthy m
em
bers
were
based o
n t
he 2
013 s
epara
te n
on-a
nnuitant
and a
nnuitant
mort
alit
y t
able
s (
separa
te m
ale
and f
em
ale
table
s)
as p
ublis
hed b
y t
he IR
S.
Mort
alit
y r
ate
s f
or
dis
able
d m
em
bers
were
based o
n t
he s
am
e t
able
s incre
ased b
y 1
15%
for
dis
able
d r
etire
ments
and d
isable
d t
erm
inations w
ith d
efe
rred b
enefits
.
The e
ffort
and c
ost
to r
ecre
ate
fin
ancia
l sta
tem
ent
info
rmation f
or
10 y
ears
was n
ot
pra
ctical.
Info
rmation w
as p
repare
d p
rospectively
fro
m J
une 3
0,
2013 f
or
GA
SB
-S68 p
urp
oses.
Comprehensive Annual Financial Report - State of Indiana - 154

Sch
ed
ule
of
Ch
an
ges i
n N
et
Pen
sio
n L
iab
ilit
y a
nd
Rela
ted
Rati
os
Em
plo
yee R
eti
rem
en
t S
yste
ms a
nd
Pla
ns
Sta
te P
oli
ce S
up
ple
men
tal
Tru
st
(am
ou
nts
exp
ressed
in
th
ou
san
ds)
6/3
0/2
01
96
/30/2
01
86
/30/2
01
76
/30/2
01
6
To
tal
pen
sio
n l
iab
ilit
y
Se
rvic
e c
ost
4,4
85
$
4
,112
$
4
,422
$
3,7
76
$
Inte
rest
628
663
582
1
,143
Diffe
ren
ce
s b
etw
een
exp
ecte
d a
nd
actu
al e
xp
erie
nce
(1,7
53
)
(8
80
)
(5
9)
(476
)
Ch
an
ge
s o
f a
ssum
ptio
ns
297
(63)
(6
45
)
4,1
25
Be
ne
fit
paym
ents
, in
clu
din
g r
efu
nd
s o
f e
mp
loye
e c
ontr
ibutio
ns,
and
adm
inis
tra
tive
and
oth
er
exp
en
ses
(3,9
83
)
(4
,343
)
(4
,259
)
(4,6
77
)
Ne
t c
ha
ng
e i
n t
ota
l p
en
sio
n l
iab
ilit
y(3
26
)
(5
11
)
41
3,8
91
To
tal
pen
sio
n l
iab
ilit
y,
beg
inn
ing
16,5
73
17,0
84
17,0
43
1
3,1
52
To
tal
pen
sio
n l
iab
ilit
y,
en
din
g1
6,2
47
$
16,5
73
$
17,0
84
$
1
7,0
43
$
Pla
n f
idu
cia
ry n
et
po
sit
ion
as a
perc
en
tag
e o
f th
e t
ota
l p
en
sio
n l
iab
ilit
y0
.0%
0.0
%0
.0%
0.0
%
Co
ve
red
payro
ll8
8,1
03
87,9
72
75,7
31
6
8,7
86
Ne
t p
en
sio
n l
iab
ilit
y a
s a
perc
en
tag
e o
f c
ove
red
payro
ll1
8.4
%1
8.8
%2
2.6
%2
4.8
%
No
tes
to
Sch
ed
ule
:
Be
ne
fit
ch
an
ge
s.
The
re w
ere
no c
han
ge
s in
ben
efit
term
s d
urin
g t
he f
isca
l ye
ar.
Me
asu
rem
ent
date
: A
ctu
aria
l va
luatio
n r
epo
rt f
rom
th
e p
rior
fisca
l ye
ar.
Ch
an
ge
s o
f a
ssum
ptio
ns.
Mo
rta
lity r
ate
s f
or
hea
lth
y m
em
bers
we
re b
ase
d o
n t
he R
P-2
01
4 T
ota
l D
ata
set
Mo
rta
lity T
ab
les a
dju
ste
d f
rom
200
6 u
sin
g M
P-2
01
8 M
ort
alit
y
Imp
rove
me
nt
Sca
le.
Mo
rta
lity r
ate
s f
or
dis
able
d m
em
bers
we
re b
ase
d o
n t
he R
P-2
01
4 M
ort
alit
y t
able
s f
or
dis
able
d m
em
bers
adju
ste
d f
rom
200
6 u
sin
g M
P-2
01
8 M
ort
alit
y
Imp
rove
me
nt
Sca
le.
The
eff
ort
and
co
st
to r
ecre
ate
fin
an
cia
l sta
tem
ent
info
rma
tio
n f
or
10 y
ears
wa
s n
ot
pra
ctica
l.
Info
rma
tio
n w
as p
rep
are
d p
rosp
ectively
fro
m J
une
30,
201
6 f
or
GA
SB
-S7
3
purp
ose
s.
2.7
9%
dis
co
un
t ra
te a
s o
f Ju
ne
30,
201
9.
2.9
8%
dis
co
un
t ra
te,
net
of
pen
sio
n p
lan in
vestm
ent
exp
en
se,
inclu
din
g in
fla
tio
n a
t Ju
ne
30,
201
8.
Dis
co
un
t ra
te o
f 3
.13%
as o
f
Ju
ne
30,
201
7.
Ra
te is S
&P
Mu
nic
ipal B
ond
20 y
ear
hig
h g
rad
e r
ate
in
de
x.
Actu
aria
lly d
ete
rmin
ed
co
ntr
ibutio
n r
ate
s a
re c
alc
ula
ted a
s o
f Ju
ly 1
, o
ne
ye
ar
prior
to t
he e
nd
of
the f
isca
l ye
ar
in w
hic
h c
ontr
ibutio
ns a
re r
epo
rte
d.
For
the J
uly
1,
201
6
actu
aria
l va
luatio
n,
the in
fla
tio
n a
ssum
ptio
n w
as r
edu
ced
fro
m 3
.50%
to
2.2
5%
.
155 - State of Indiana - Comprehensive Annual Financial Report
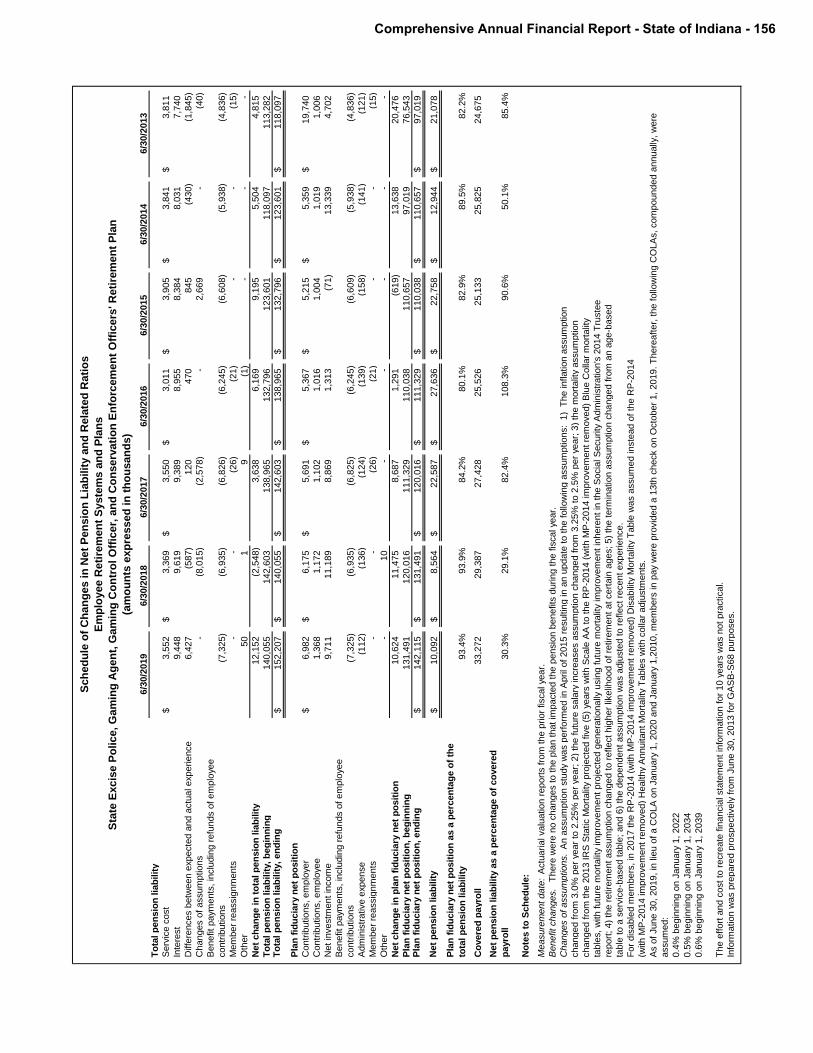
Sch
ed
ule
of
Ch
an
ges in
Net
Pen
sio
n L
iab
ilit
y a
nd
Rela
ted
Rati
os
Em
plo
yee R
eti
rem
en
t S
yste
ms a
nd
Pla
ns
(am
ou
nts
exp
ressed
in
th
ou
san
ds)
6/3
0/2
019
6/3
0/2
018
6/3
0/2
017
6/3
0/2
016
6/3
0/2
015
6/3
0/2
014
6/3
0/2
013
To
tal p
en
sio
n lia
bilit
y
Serv
ice c
ost
3,5
52
$
3,3
69
$
3,5
50
$
3,0
11
$
3,9
05
$
3,8
41
$
3,8
11
$
Inte
rest
9,4
48
9,6
19
9,3
89
8,9
55
8,3
84
8,0
31
7,7
40
Diffe
rences b
etw
een e
xpecte
d a
nd a
ctu
al experience
6,4
27
(587)
120
470
845
(4
30)
(1,8
45)
Changes o
f assum
ptions
-
(8
,015)
(2,5
78)
-
2,6
69
-
(40)
Benefit paym
ents
, in
clu
din
g r
efu
nds o
f em
plo
yee
contr
ibutions
(7,3
25)
(6,9
35)
(6,8
26)
(6,2
45)
(6,6
08)
(5,9
38)
(4,8
36)
Mem
ber
reassig
nm
ents
-
-
(26)
(21)
-
-
(15)
Oth
er
50
1
9
(1)
-
-
-
Net
ch
an
ge in
to
tal p
en
sio
n lia
bilit
y12,1
52
(2,5
48)
3,6
38
6,1
69
9,1
95
5,5
04
4,8
15
To
tal p
en
sio
n lia
bilit
y, b
eg
inn
ing
140,0
55
142,6
03
138,9
65
132,7
96
123,6
01
118,0
97
113,2
82
To
tal p
en
sio
n lia
bilit
y, en
din
g152,2
07
$
140,0
55
$
142,6
03
$
138,9
65
$
132,7
96
$
123,6
01
$
118,0
97
$
Pla
n f
idu
cia
ry n
et
po
sit
ion
Contr
ibutions, em
plo
yer
6,9
82
$
6,1
75
$
5,6
91
$
5,3
67
$
5,2
15
$
5,3
59
$
19,7
40
$
Contr
ibutions, em
plo
yee
1,3
68
1,1
72
1,1
02
1,0
16
1,0
04
1,0
19
1,0
06
Net in
vestm
ent in
com
e9,7
11
11,1
89
8,8
69
1,3
13
(71)
13,3
39
4,7
02
Benefit paym
ents
, in
clu
din
g r
efu
nds o
f em
plo
yee
contr
ibutions
(7,3
25)
(6,9
35)
(6,8
25)
(6,2
45)
(6,6
09)
(5,9
38)
(4,8
36)
Adm
inis
trative e
xpense
(112)
(1
36)
(124)
(139)
(158)
(1
41)
(121)
Mem
ber
reassig
nm
ents
-
-
(26)
(21)
-
-
(15)
Oth
er
-
10
-
-
-
-
-
Net
ch
an
ge in
pla
n f
idu
cia
ry n
et
po
sit
ion
10,6
24
11,4
75
8,6
87
1,2
91
(619)
13,6
38
20,4
76
Pla
n f
idu
cia
ry n
et
po
sit
ion
, b
eg
inn
ing
131,4
91
120,0
16
111,3
29
110,0
38
110,6
57
97,0
19
76,5
43
Pla
n f
idu
cia
ry n
et
po
sit
ion
, en
din
g142,1
15
$
131,4
91
$
120,0
16
$
111,3
29
$
110,0
38
$
110,6
57
$
97,0
19
$
Net
pen
sio
n lia
bilit
y10,0
92
$
8,5
64
$
22,5
87
$
27,6
36
$
22,7
58
$
12,9
44
$
21,0
78
$
Pla
n f
idu
cia
ry n
et
po
sit
ion
as a
perc
en
tag
e o
f th
e
tota
l p
en
sio
n lia
bilit
y93.4
%93.9
%84.2
%80.1
%82.9
%89.5
%82.2
%
Co
vere
d p
ayro
ll33,2
72
29,3
87
27,4
28
25,5
26
25,1
33
25,8
25
24,6
75
Net
pen
sio
n lia
bilit
y a
s a
perc
en
tag
e o
f co
vere
d
payro
ll30.3
%29.1
%82.4
%108.3
%90.6
%50.1
%85.4
%
No
tes t
o S
ch
ed
ule
:
Measure
ment date
: A
ctu
arial valu
ation r
eport
s fro
m the p
rior
fiscal ye
ar.
Benefit changes.
There
were
no c
hanges to the p
lan that im
pacte
d the p
ensio
n b
enefits
during the fis
cal ye
ar.
Changes o
f assum
ptions.
An a
ssum
ption s
tudy
was p
erf
orm
ed in A
pril of 2015 r
esultin
g in a
n u
pdate
to the follo
win
g a
ssum
ptions: 1
) T
he inflation a
ssum
ption
changed fro
m 3
.0%
per
year
to 2
.25%
per
year;
2)
the futu
re s
ala
ry incre
ases a
ssum
ption c
hanged fro
m 3
.25%
to 2
.5%
per
year;
3)
the m
ort
alit
y assum
ption
changed fro
m the 2
013 IR
S S
tatic M
ort
alit
y pro
jecte
d fiv
e (
5)
years
with S
cale
AA
to the R
P-2
014 (
with M
P-2
014 im
pro
vem
ent re
moved)
Blu
e C
olla
r m
ort
alit
y
table
s, w
ith futu
re m
ort
alit
y im
pro
vem
ent pro
jecte
d g
enera
tionally
usin
g futu
re m
ort
alit
y im
pro
vem
ent in
here
nt in
the S
ocia
l S
ecurity
Adm
inis
tration's
2014 T
ruste
e
report
; 4)
the r
etire
ment assum
ption c
hanged to r
eflect hig
her
likelih
ood o
f re
tire
ment at cert
ain
ages; 5)
the term
ination a
ssum
ption c
hanged fro
m a
n a
ge-b
ased
table
to a
serv
ice-b
ased table
; and 6
) th
e d
ependent assum
ption w
as a
dju
ste
d to r
eflect re
cent experience.
For
dis
able
d m
em
bers
, in
2017 the R
P-2
014 (
with M
P-2
014 im
pro
vem
ent re
moved)
Dis
abili
ty M
ort
alit
y T
able
was a
ssum
ed inste
ad o
f th
e R
P-2
014
(with M
P-2
014 im
pro
vem
ent re
moved)
Healthy
Annuitant M
ort
alit
y T
able
s w
ith c
olla
r adju
stm
ents
.
The e
ffort
and c
ost to
recre
ate
fin
ancia
l sta
tem
ent in
form
ation for
10 y
ears
was n
ot pra
ctical.
Info
rmation w
as p
repare
d p
rospectively
fro
m J
une 3
0, 2013 for
GA
SB
-S68 p
urp
oses.
Sta
te E
xcis
e P
olice, G
am
ing
Ag
en
t, G
am
ing
Co
ntr
ol O
ffic
er,
an
d C
on
serv
ati
on
En
forc
em
en
t O
ffic
ers
' R
eti
rem
en
t P
lan
As o
f June 3
0, 2019, in
lie
u o
f a C
OLA
on J
anuary
1, 2020 a
nd J
anuary
1,2
010, m
em
bers
in p
ay
were
pro
vid
ed a
13th
check o
n O
cto
ber
1, 2019. T
here
after,
the follo
win
g C
OLA
s, com
pounded a
nnually
, w
ere
assum
ed:
0.4
% b
egin
nin
g o
n J
anuary
1, 2022
0.5
% b
egin
nin
g o
n J
anuary
1, 2034
0.6
% b
egin
nin
g o
n J
anuary
1, 2039
Comprehensive Annual Financial Report - State of Indiana - 156

Sch
ed
ule
of
Ch
an
ges in
Net
Pen
sio
n L
iab
ilit
y a
nd
Rela
ted
Rati
os
Em
plo
yee R
eti
rem
en
t S
yste
ms a
nd
Pla
ns
Pro
secu
tin
g A
tto
rneys' R
eti
rem
en
t F
un
d
(am
ou
nts
ex
pre
ss
ed
in
th
ou
san
ds
)
6/3
0/2
019
6/3
0/2
018
6/3
0/2
017
6/3
0/2
016
6/3
0/2
015
6/3
0/2
014
6/3
0/2
013
To
tal
pen
sio
n l
iab
ilit
y
Serv
ice c
ost
2,0
31
$
1,9
47
$
1,6
50
$
1,6
26
$
1,6
03
$
1,5
87
$
1,5
68
$
Inte
rest
6,9
59
6,5
21
5,7
14
5,2
39
4,4
09
4,2
07
3,8
16
Changes o
f benefit
term
s-
-
6,5
47
-
-
-
1,3
46
Diffe
rences b
etw
een e
xpecte
d a
nd a
ctu
al experience
2,2
40
2,1
56
1,9
96
4,0
58
4,5
51
-
1,4
74
Changes o
f assum
ptions
-
-
(2
16)
-
5,2
16
-
(1
09)
Benefit
paym
ents
, in
clu
din
g r
efu
nds o
f em
plo
yee
contr
ibutions
(4,4
33)
(3,9
95)
(4
,069)
(3
,747)
(3
,254)
(2
,398)
(2
,235)
Oth
er
-
-
-
(2)
Net
ch
an
ge i
n t
ota
l p
en
sio
n l
iab
ilit
y6,7
97
6,6
29
11,6
22
7,1
74
12,5
25
3,3
96
5,8
60
To
tal
pen
sio
n l
iab
ilit
y,
beg
inn
ing
103,2
84
96,6
55
85,0
33
77,8
61
65,3
36
61,9
40
56,0
80
T
ota
l p
en
sio
n l
iab
ilit
y,
en
din
g110,0
81
$
103,2
84
$
96,6
55
$
85,0
35
$
77,8
61
$
65,3
36
$
61,9
40
$
Pla
n f
idu
cia
ry n
et
po
sit
ion
Contr
ibutions,
em
plo
yer
3,2
16
$
3,0
14
$
1,4
86
$
1,4
40
$
1,0
63
$
1,1
74
$
19,4
43
$
Contr
ibutions,
em
plo
yee
1,3
07
1,2
95
1,3
57
1,2
79
1,2
69
1,3
34
1,2
71
Net
investm
ent
incom
e4,4
89
5,2
18
4,1
67
589
(3
4)
6,5
81
1,8
97
Benefit
paym
ents
, in
clu
din
g r
efu
nds o
f em
plo
yee
contr
ibutions
(4,4
33)
(3,9
95)
(4
,069)
(3
,747)
(3
,254)
(2
,398)
(2
,235)
Adm
inis
trative e
xpense
(75)
(8
8)
(158)
(1
93)
(1
27)
(1
08)
(1
45)
Oth
er
-
-
-
-
-
4
-
Net
ch
an
ge i
n p
lan
fid
ucia
ry n
et
po
sit
ion
4,5
04
5,4
44
2,7
83
(632)
(1
,083)
6,5
87
20,2
31
Pla
n f
idu
cia
ry n
et
po
sit
ion
, b
eg
inn
ing
61,0
19
55,5
75
52,7
92
53,4
24
54,5
07
47,9
20
27,6
89
P
lan
fid
ucia
ry n
et
po
sit
ion
, en
din
g65,5
23
$
61,0
19
$
55,5
75
$
52,7
92
$
53,4
24
$
54,5
07
$
47,9
20
$
Net
pen
sio
n l
iab
ilit
y44,5
58
$
42,2
65
$
41,0
80
$
32,2
43
$
24,4
37
$
10,8
29
$
14,0
20
$
Pla
n f
idu
cia
ry n
et
po
sit
ion
as a
perc
en
tag
e o
f th
e
tota
l p
en
sio
n l
iab
ilit
y59.5
%59.1
%57.5
%62.1
%68.6
%83.4
%77.4
%
Co
vere
d p
ayro
ll21,7
91
21,5
78
22,6
35
21,3
72
21,1
45
20,6
08
18,8
05
Net
pen
sio
n l
iab
ilit
y a
s a
perc
en
tag
e o
f co
vere
d
payro
ll204.5
%195.9
%181.5
%150.9
%115.6
%52.5
%74.6
%
No
tes t
o S
ch
ed
ule
:
Measure
ment
date
: A
ctu
arial valu
ation r
eport
s f
rom
the p
rior
fiscal year.
Benefit
changes.
Per
2016 S
enate
Enro
lled A
ct
No.
265,
the P
ER
F o
ffset
reflecte
d in t
he P
AR
F b
enefit
form
ula
was c
hanged t
o b
e t
he a
ctu
al P
ER
F
benefit
am
ount
the m
em
ber
is r
eceiv
ing f
or
mem
ebers
who c
om
mence t
heir P
ER
F b
enefit
befo
re t
heir P
AR
F b
enefit.
A
s a
result o
f th
is c
hange,
for
curr
ent
active a
nd inactive v
este
d m
em
bers
, th
e P
ER
F b
enefit
com
mencem
ent
tim
ing a
ssum
ption w
as u
pdate
d t
o 7
5%
assum
ed t
o c
om
mence t
heir
PE
RF
benefit
at
the e
arlie
st
PE
RF
elig
ibili
ty a
nd 2
5%
assum
ed t
o c
om
mence t
heir P
ER
F b
enefit
at
PA
RF
com
mencem
ent.
In
2013,
HB
1057 c
hanged
the b
enefits
in t
he P
rosecuting A
ttorn
eys' R
etire
ment
Fund t
o b
e c
om
para
ble
to t
he J
udges' R
etire
ment
Fund.
Changes o
f assum
ptions.
In 2
013,
the inte
rest
cre
ditin
g r
ate
on m
em
ber
contr
ibutions w
as c
hanged t
o 3
.5%
fro
m 5
.5%
. A
n a
ssum
ption s
tudy w
as
perf
orm
ed in A
pril of
2015 r
esultin
g in a
n u
pdate
to t
he f
ollo
win
g a
ssum
ptions:
1)
The inflation a
ssum
ption c
hanged f
rom
3.0
% p
er
year
to 2
.25%
per
year
2)
The m
ort
alit
y a
ssum
ption c
hanged f
rom
the 2
013 IR
S S
tatic M
ort
alit
y p
roje
cte
d f
ive (
5)
years
with S
cale
AA
to t
he R
P-2
014 (
with M
P-2
014 im
pro
vem
ent
rem
oved)
White C
olla
r m
ort
alit
y t
able
s,
with f
utu
re m
ort
alit
y im
pro
vem
ent
pro
jecte
d g
enera
tionally
usin
g f
utu
re m
ort
alit
y im
pro
vem
ent
inhere
nt
in t
he S
ocia
l
Security
Adm
inis
tration's
2014 T
ruste
e r
eport
; and 3
) th
e r
etire
ment
assum
ption c
hanged f
rom
an a
ge a
nd p
oin
ts-b
ased t
able
to a
n a
ge a
nd s
erv
ice-b
ased
table
, re
flecting h
igher
rate
s o
f re
tire
ment
aft
er
22 y
ears
of
serv
ice.
In 2
017,
for
dis
able
d m
em
bers
, th
e m
ort
alit
y a
ssum
ption w
as u
pdate
d f
rom
the R
P-
2014 (
with M
P-2
014 im
pro
vem
ent
rem
oved)
White c
olla
r M
ort
alit
y t
able
s t
o t
he R
P-2
014 (
with M
P-2
014 im
pro
vem
ent
rem
oved)
Dis
abili
ty M
ort
alit
y t
able
s.
The e
ffort
and c
ost
to r
ecre
ate
fin
ancia
l sta
tem
ent
info
rmation f
or
10 y
ears
was n
ot
pra
ctical.
Info
rmation w
as p
repare
d p
rospectively
fro
m J
une 3
0,
2013 f
or
GA
SB
-S68 p
urp
oses.
157 - State of Indiana - Comprehensive Annual Financial Report

Sc
he
du
le o
f C
han
ge
s i
n N
et
Pe
ns
ion
Lia
bil
ity a
nd
Rela
ted
Ra
tio
s
Em
plo
ye
e R
eti
rem
en
t S
ys
tem
s a
nd
Pla
ns
(am
ou
nts
exp
ress
ed
in
th
ou
sa
nd
s)
6/3
0/2
019
6/3
0/2
018
6/3
0/2
017
6/3
0/2
016
6/3
0/2
015
6/3
0/2
014
6/3
0/2
013
To
tal p
en
sio
n lia
bilit
y
Serv
ice c
ost
-$
-$
1$
2$
3$
3
$
2$
Inte
rest
224
245
259
280
269
277
291
Diffe
rences b
etw
een e
xpecte
d a
nd a
ctu
al experi
ence
10
(85)
(113)
(233)
(68)
(36)
(140)
Changes o
f assum
ptions
-
(121)
-
-
325
-
-
Benefit paym
ents
, in
clu
din
g r
efu
nds o
f em
plo
yee
contr
ibutions
(356)
(359)
(358)
(359)
(370)
(363)
(365)
Net
ch
an
ge in
to
tal p
en
sio
n lia
bilit
y(1
22)
(320)
(211)
(310)
159
(119)
(212)
To
tal p
en
sio
n lia
bilit
y, b
eg
inn
ing
3,4
84
3,8
04
4,0
15
4,3
25
4,1
66
4,2
85
4,4
97
To
tal p
en
sio
n lia
bilit
y, en
din
g3,3
62
$
3,4
84
$
3,8
04
$
4,0
15
$
4,3
25
$
4,1
66
$
4,2
85
$
Pla
n f
idu
cia
ry n
et
po
sit
ion
Contr
ibutions, em
plo
yer
269
$
237
$
135
$
138
$
131
$
138
$
150
$
Net in
vestm
ent in
com
e209
263
221
27
(5)
439
201
Benefit paym
ents
, in
clu
din
g r
efu
nds o
f em
plo
yee
contr
ibutions
(356)
(359)
(356)
(359)
(370)
(363)
(365)
Adm
inis
trative e
xpense
(38)
(64)
(53)
(61)
(71)
(62)
(34)
Net
ch
an
ge in
pla
n f
idu
cia
ry n
et
po
sit
ion
84
77
(53)
(255)
(315)
152
(48)
Pla
n f
idu
cia
ry n
et
po
sit
ion
, b
eg
inn
ing
2,9
42
2,8
65
2,9
18
3,1
74
3,4
89
3,3
37
3,3
85
Pla
n f
idu
cia
ry n
et
po
sit
ion
, en
din
g3,0
26
$
2,9
42
$
2,8
65
$
2,9
19
$
3,1
74
$
3,4
89
$
3,3
37
$
Net
pen
sio
n lia
bilit
y336
$
542
$
939
$
1,0
96
$
1,1
51
$
677
$
948
$
Pla
n f
idu
cia
ry n
et
po
sit
ion
as a
perc
en
tag
e o
f th
e
tota
l p
en
sio
n lia
bilit
y90.0
%84.4
%75.3
%72.7
%73.4
%83.7
%77.9
%
Co
vere
d p
ayro
llN
/AN
/AN
/AN
/AN
/AN
/AN
/A
Net
pen
sio
n lia
bilit
y a
s a
perc
en
tag
e o
f co
vere
d
payro
llN
/AN
/AN
/AN
/AN
/AN
/AN
/A
No
tes t
o S
ch
ed
ule
:
Measure
ment date
: A
ctu
ari
al valu
ation r
eport
s f
rom
the p
rior
fiscal ye
ar.
Benefit changes.
There
were
no c
hanges to the p
lan that im
pacte
d the p
ensio
n b
enefits
duri
ng the f
iscal ye
ar.
Changes o
f assum
ptions.
An a
ssum
ption s
tudy
was p
erf
orm
ed in A
pri
l of
2015 r
esultin
g in a
n u
pdate
to the f
ollo
win
g 'a
ssum
ptions: 1
) T
he inflation a
ssum
ption
changed f
rom
3.0
% p
er
year
to 2
.25%
per
year;
and 2
) T
he m
ort
alit
y 'a
ssum
ption c
hanged f
rom
the 2
013 IR
S S
tatic M
ort
alit
y pro
jecte
d f
ive (
5)
years
with S
cale
AA
to the R
P-2
014 (
with M
P-2
014 im
pro
vem
ent re
moved)
White C
olla
r m
ort
alit
y ta
ble
s, w
ith f
utu
re m
ort
alit
y im
pro
vem
ent pro
jecte
d g
enera
tionally
usin
g f
utu
re
mort
alit
y im
pro
vem
ent in
here
nt in
the S
ocia
l S
ecuri
ty A
dm
inis
tration's
2014 T
ruste
e r
eport
. F
or
dis
able
d m
em
bers
, in
2017, th
e R
P-2
014
(with M
P-2
014 im
pro
vem
ent re
moved)
Dis
abili
ty M
ort
alit
y T
able
was a
ssum
ed inste
ad o
f th
e R
P-2
014 (
with M
P-2
014 im
pro
vem
ent re
moved)
Healthy
Annuitant
Mort
alit
y T
able
s w
ith c
olla
r adju
stm
ents
.
N/A
is n
ot applic
able
as this
is a
clo
sed p
lan w
ith n
o p
ayr
oll.
The e
ffort
and c
ost to
recre
ate
fin
ancia
l sta
tem
ent in
form
ation f
or
10 y
ears
was n
ot pra
ctical.
Info
rmation w
as p
repare
d p
rospectively
fro
m J
une 3
0, 2013 f
or
GA
SB
-S68 p
urp
oses.
Leg
isla
tors
' D
efi
ned
Ben
efi
t P
lan
As o
f June 3
0, 2019, in
lie
u o
f a C
OLA
on J
anuary
1, 2020 a
nd J
anuary
1,2
010, m
em
bers
in p
ay
were
pro
vid
ed a
13th
check o
n O
cto
ber
1, 2019. T
here
aft
er,
the f
ollo
win
g C
OLA
s, com
pounded a
nnually
, w
ere
assum
ed:
0.4
% b
egin
nin
g o
n J
anuary
1, 2022
0.5
% b
egin
nin
g o
n J
anuary
1, 2034
0.6
% b
egin
nin
g o
n J
anuary
1, 2039
Comprehensive Annual Financial Report - State of Indiana - 158

Sc
he
du
le o
f C
ha
ng
es
in
Ne
t P
en
sio
n L
iab
ilit
y a
nd
Re
late
d R
ati
os
Em
plo
ye
e R
eti
rem
en
t S
ys
tem
s a
nd
Pla
ns
(am
ou
nts
ex
pre
ss
ed
in
th
ou
sa
nd
s)
6/3
0/2
01
96
/30
/20
18
6/3
0/2
01
76
/30
/20
16
6/3
0/2
01
56
/30
/20
14
6/3
0/2
01
3
To
tal p
en
sio
n lia
bilit
y
Serv
ice c
ost
18
,23
0$
14
,88
6$
14
,76
2$
13
,87
0$
15
,28
3$
15
,30
2$
16
,08
4$
Inte
rest
37
,34
6
3
5,5
65
3
4,0
83
3
1,8
89
3
1,7
53
3
0,9
92
3
0,0
47
Diffe
rences b
etw
een
expecte
d a
nd a
ctu
al experi
ence
8,5
27
(3
,090)
(3
,107)
7
,18
2
8
,41
1
(1
6,0
26
)
(1
3,6
03
)
Chan
ges o
f assum
ptions
-
-
(1
,213)
-
(31,9
26
)
-
18
6
Bene
fit pa
ym
ents
, in
clu
din
g r
efu
nds o
f em
plo
yee
contr
ibutions
(25,3
91
)
(23,6
21
)
(2
2,0
99
)
(2
0,9
22
)
(1
9,4
32
)
(1
8,5
27
)
(1
7,5
79
)
Mem
ber
reassig
nm
ents
-
-
-
-
-
4
12
1
Oth
er
93
21
9
18
3
16
2
-
-
-
Net
ch
an
ge in
to
tal p
en
sio
n lia
bilit
y3
8,8
05
23
,95
9
22
,60
9
32
,18
1
4,0
89
11
,74
5
15
,25
6
To
tal p
en
sio
n lia
bilit
y, b
eg
inn
ing
54
7,6
94
5
23
,73
5
5
01
,12
6
4
68
,94
5
4
64
,85
5
4
53
,11
0
4
37
,85
4
T
ota
l p
en
sio
n lia
bilit
y, en
din
g5
86
,49
9$
54
7,6
94
$
5
23
,73
5$
5
01
,12
6$
4
68
,94
4$
4
64
,85
5$
4
53
,11
0$
Pla
n f
idu
cia
ry n
et
po
sit
ion
Contr
ibutions, em
plo
yer
16
,03
1$
15
,11
7$
16
,82
4$
16
,94
6$
21
,02
0$
20
,89
5$
11
1,4
19
$
Contr
ibutions, em
plo
yee
3,4
76
3
,41
8
3
,46
8
3
,23
9
3
,29
2
2
,85
6
2
,63
1
Net in
vestm
ent
incom
e3
7,3
71
44
,10
4
35
,19
6
5,3
23
(102
)
51
,89
0
16
,95
5
Bene
fit pa
ym
ents
, in
clu
din
g r
efu
nds o
f em
plo
yee
contr
ibutions
(25,3
91
)
(23,6
23
)
(2
2,1
01
)
(2
0,9
22
)
(1
9,4
32
)
(1
8,5
27
)
(1
7,5
79
)
Adm
inis
trative e
xpen
se
(108
)
(1
19
)
(124
)
(148
)
(165
)
(146
)
(126
)
Mem
ber
reassig
nm
ents
-
-
-
-
-
4
12
1
Oth
er
-
-
-
-
9
6
5
Net
ch
an
ge in
pla
n f
idu
cia
ry n
et
po
sit
ion
31
,37
9
3
8,8
97
3
3,2
63
4
,43
8
4
,62
2
5
6,9
78
1
13
,42
6
Pla
n f
idu
cia
ry n
et
po
sit
ion
, b
eg
inn
ing
51
3,9
52
4
75
,05
5
4
41
,79
0
4
37
,35
2
4
32
,73
0
3
75
,75
2
2
62
,32
6
P
lan
fid
ucia
ry n
et
po
sit
ion
, en
din
g5
45
,33
1$
51
3,9
52
$
4
75
,05
3$
4
41
,79
0$
4
37
,35
2$
4
32
,73
0$
3
75
,75
2$
Net
pen
sio
n lia
bilit
y4
1,1
68
$
33
,74
2$
48
,68
2$
59
,33
6$
31
,59
2$
32
,12
5$
77
,35
8$
Pla
n f
idu
cia
ry n
et
po
sit
ion
as
a p
erc
en
tag
e o
f th
e
tota
l p
en
sio
n lia
bilit
y9
3.0
%9
3.8
%9
0.7
%8
8.2
%9
3.3
%9
3.1
%8
2.9
%
Co
vere
d p
ayro
ll5
6,3
80
53
,35
0
54
,75
5
51
,38
2
48
,58
2
46
,04
1
47
,59
5
Net
pen
sio
n lia
bilit
y a
s a
perc
en
tag
e o
f co
vere
d
payro
ll7
3.0
%6
3.2
%8
8.9
%1
15
.5%
65
.0%
69
.8%
16
2.5
%
No
tes t
o S
ch
ed
ule
:
Measure
ment
da
te:
Actu
ari
al valu
ation r
epo
rts fro
m the
pri
or
fiscal year.
Bene
fit chan
ges.
There
were
no c
han
ges to t
he
pla
n t
ha
t im
pacte
d the
pe
nsio
n b
en
efits
du
ring t
he
fis
cal year.
Chan
ges o
f assum
ptions.
An a
ssum
ption s
tud
y w
as p
erf
orm
ed in A
pri
l of
201
5 r
esultin
g in a
n u
pda
te t
o th
e fo
llow
ing a
ssum
ptions: 1)
The inflation a
ssum
ption
chan
ged
fro
m 3
.0%
pe
r year
to 2
.25%
per
year;
2)
the
futu
re s
ala
ry incre
ases a
ssum
ption c
han
ged
fro
m 4
.0%
to 2
.5%
pe
r year;
3)
the
cost-
of-
livin
g
assum
ption d
ecre
ased f
rom
4.0
% to 2
.5%
pe
r year;
4)
the
mort
alit
y a
ssum
ption c
han
ged
fro
m the
20
13 IR
S S
tatic M
ort
alit
y p
roje
cte
d fiv
e (
5)
years
with S
cale
AA
to t
he
RP
-201
4 (
with M
P-2
01
4 im
pro
vem
ent
rem
oved)
White C
olla
r m
ort
alit
y tab
les, w
ith f
utu
re m
ort
alit
y im
pro
vem
ent
pro
jecte
d g
enera
tiona
lly u
sin
g f
utu
re
mort
alit
y im
pro
vem
ent
inhe
rent
in th
e S
ocia
l S
ecuri
ty A
dm
inis
tration's
20
14 T
ruste
e r
epo
rt; 5
) th
e r
etire
ment
assum
ption c
han
ged
fro
m a
n a
ge-b
ased t
ab
le
to a
n a
ge
an
d s
erv
ice
ba
se
d t
ab
le,
refle
ctin
g h
igh
er
rate
s o
f re
tire
me
nt
aft
er
22
ye
ars
of
se
rvic
e;
6)
the
te
rmin
atio
n a
ssu
mp
tio
n c
ha
ng
ed
fro
m a
n a
ge
-ba
se
d
tab
le to
3%
for
all
mem
bers
; an
d 7
) th
e d
epen
den
t assum
ption w
as a
dju
ste
d to r
eflect re
cent
experi
ence. F
or
dis
able
d m
em
bers
, in
2017
the
RP
-201
4
(with M
P-2
01
4 im
pro
vem
ent
rem
oved)
Dis
abili
ty M
ort
alit
y T
able
was a
ssum
ed inste
ad o
f th
e R
P-2
01
4 (
with M
P-2
01
4 im
pro
vem
ent
rem
oved)
Healthy A
nnu
itan
t
Mort
alit
y T
able
s w
ith c
olla
r ad
justm
ents
.
The e
ffo
rt a
nd c
ost to
recre
ate
fin
an
cia
l sta
tem
ent
info
rmation f
or
10
years
was n
ot pra
ctical.
Info
rmation w
as p
repa
red p
rospectively
fro
m J
une
30
, 20
13 f
or
GA
SB
-S68 p
urp
oses.
Ju
dg
es
' R
eti
rem
en
t S
ys
tem
159 - State of Indiana - Comprehensive Annual Financial Report

Sc
he
du
le o
f th
e S
tate
's P
rop
ort
ion
ate
Sh
are
of
the
Ne
t P
en
sio
n L
iab
ilit
y
Em
plo
ye
e R
eti
rem
en
t S
ys
tem
s a
nd
Pla
ns
(am
ou
nts
ex
pre
ss
ed
in
th
ou
sa
nd
s)
6/3
0/2
01
96/3
0/2
01
86/3
0/2
01
76/3
0/2
01
66/3
0/2
01
56/3
0/2
01
46/3
0/2
01
3
Sta
te's
pro
port
ion
of th
e n
et
pen
sio
n lia
bili
ty (
asse
t)25
.90%
25
.58%
25
.74%
25
.04%
24
.27%
24
.85%
24
.45%
Sta
te's
pro
port
ion
ate
sha
re o
f th
e n
et p
en
sio
n lia
bili
ty
(asse
t)85
6,0
20
$
86
8,8
14
$
1,1
48,2
61
$
1,1
36,2
93
$
98
8,6
05
$
65
2,9
20
$
83
7,3
11
$
Sta
te's
co
vere
d p
ayro
ll1,3
49,4
23
1,3
05,0
16
1,2
76,8
57
1,1
99,9
21
1,1
62,6
22
1,2
13,0
31
1,1
73,7
16
Sta
te's
pro
port
ion
ate
sha
re o
f th
e n
et p
en
sio
n lia
bili
ty
(asse
t) a
s a
perc
en
tage
of its c
overe
d p
ayro
ll63
.4%
66
.6%
89
.9%
94
.7%
85
.0%
53
.8%
71
.3%
Pla
n fid
ucia
ry n
et
positio
n a
s a
pe
rcen
tage
of th
e to
tal
pe
nsio
n lia
bili
ty80
.1%
78
.9%
76
.6%
75
.3%
77
.3%
84
.3%
78
.8%
No
tes
to
Sch
ed
ule
:
Mea
sure
men
t d
ate
: A
ctu
ari
al valu
ation
rep
ort
s f
rom
th
e p
rior
fisca
l yea
r.
Ben
efit ch
an
ge
s.
In 2
019
, H
B 1
05
9 e
xpa
nd
ed
th
e c
urr
en
t p
re-r
etire
men
t d
ea
th b
en
efit e
ligib
ility
to
mem
eb
ers
with a
t le
ast 1
0 y
ea
rs o
f se
rvic
e.
Pla
n a
men
dm
en
ts.
In 2
01
4,
HB
107
5 im
pa
cte
d t
he P
ER
F b
y r
ed
ucin
g t
he A
nn
uity S
avin
gs A
ccou
nt
(AS
A)
inte
rest
cre
ditin
g r
ate
on
ann
uitie
s fro
m 7
.5%
to 5
.75%
effe
ctive O
cto
be
r 1
, 2
01
4.
Effe
ctive O
cto
be
r 1
, 2
01
5 t
he r
ate
be
com
es t
he g
rea
ter
of 4
.5%
or
mark
et
rate
. O
n J
an
ua
ry 1
, 2
01
7,
the A
SA
ann
uitie
s
are
allo
wed
to
be o
uts
ourc
ed
to
a th
ird p
art
y p
rovid
er.
B
eg
inn
ing
Ja
nu
ary
1, 2
01
8 A
SA
ann
uitiz
ation
s w
ere
acco
mm
od
ate
d th
rou
gh
a th
ird p
art
y p
rovid
er.
Duri
ng
FY
E 2
01
8,
the A
nn
uity S
avin
gs A
ccou
nts
were
com
ple
tely
se
pa
rate
d fro
m th
e d
efine
d b
ene
fit p
lan
, a
nd
so
are
no
lon
ge
r re
levan
t to
th
e v
alu
ation
pro
ce
ss.
Cha
ng
es o
f a
ssum
ption
s.
An a
ssu
mption
stu
dy w
as p
erf
orm
ed
in A
pri
l of
20
15
resu
ltin
g in a
n u
pd
ate
to
th
e f
ollo
win
g a
ssum
ption
s: 1
) th
e infla
tion
assu
mption
ch
an
ge
d f
rom
3.0
0%
to
2.2
5%
per
yea
r; 2
) th
e f
utu
re s
ala
ry incre
ase a
ssu
mption
ch
an
ge
d f
rom
an a
ge-b
ased
ta
ble
ran
gin
g f
rom
3.2
5%
to 4
.5%
to
an a
ge-b
ased
ta
ble
ran
gin
g f
rom
2.5
0%
to
4.2
5%
; 3
) th
e m
ort
alit
y a
ssum
ption
ch
an
ge
d f
rom
th
e 2
013
IR
S S
tatic M
ort
alit
y p
roje
cte
d f
ive (
5)
yea
rs w
ith S
cale
AA
to
th
e R
P-2
014
(w
ith M
P-2
014
im
pro
vem
en
t re
moved
) T
ota
l D
ata
Set
Mort
alit
y T
ab
le p
roje
cte
d o
n a
fu
lly g
en
era
tion
ally
basis
usin
g
the f
utu
re m
ort
alit
y im
pro
vem
en
t sca
le in
he
ren
t in
th
e m
ort
alit
y p
roje
ction
inclu
de
d in t
he
Socia
l S
ecu
rity
Adm
inis
tration
's 2
01
4 T
ruste
e r
ep
ort
; 4)
the
retire
men
t a
ssum
ption
was u
pda
ted b
ased
on r
ece
nt
expe
rien
ce.
Add
itio
nally
, fo
r a
ctives w
ho
are
elig
ible
for
earl
y r
etire
men
t (r
ed
uce
d b
ene
fit)
, 3
3%
are
assu
med
to
co
mm
en
ce b
ene
fits
im
med
iate
and
67%
are
assu
med
to
co
mm
en
ce b
ene
fits
at u
nre
duce
d r
etire
men
t e
ligib
ility
. I
f elig
ible
for
an u
nre
duce
d
retire
men
t b
en
efit u
po
n t
erm
ina
tion
fro
m e
mplo
ym
en
t, 1
00%
co
mm
en
ce im
med
iate
ly; 5
) th
e t
erm
ina
tion
assum
ption
was u
pda
ted b
ased
on r
ece
nt
expe
rien
ce.
For
mem
be
rs e
arn
ing less t
ha
n $
20,0
00,
the t
able
s w
ere
up
da
ted f
rom
a s
ele
ct
an
d u
ltim
ate
ta
ble
to
just
an u
ltim
ate
ta
ble
as th
ere
is little
corr
ela
tion
with s
erv
ice.
For
mem
be
rs e
arn
ing m
ore
th
an
$20
,000
, th
e ta
ble
were
up
da
ted f
rom
usin
g a
5-y
ea
r se
lect
pe
riod
to
a 1
0-y
ea
r se
lect
pe
riod
to
corr
esp
on
d w
ith t
he v
esting
sch
ed
ule
; 6
) th
e d
isa
bili
ty a
ssum
ption
was u
pda
ted b
ased
on r
ece
nt
expe
rien
ce;
and
7)
the A
SA
ann
uitiz
ation
assum
ption
s
was u
pda
ted f
rom
50%
of m
em
be
rs a
ssum
ed
to
ann
uitiz
e th
eir
AS
A b
ala
nce
to
60%
of m
em
be
rs a
ssum
ed
to
ann
uitiz
e th
eir
AS
A b
ala
nce
pri
or
to
Jan
ua
ry 1
, 2
01
8.
For
dis
ab
led
mem
be
rs, in
201
7,
the R
P-2
014
(w
ith M
P-2
014
im
pro
vem
en
t re
moved
) D
isab
ility
Mort
alit
y T
ab
le w
as a
ssu
med
inste
ad
of
the R
P-2
014
(w
ith M
P-2
014
im
pro
vem
en
t re
moved
) H
ea
lthy A
nn
uita
nt
Mort
alit
y T
ab
les w
ith c
olla
r a
dju
stm
en
ts.
The
effo
rt a
nd
co
st to
recre
ate
fin
an
cia
l sta
tem
en
t in
form
ation
fo
r 1
0 y
ea
rs w
as n
ot p
ractical.
Info
rmation
was p
rep
are
d p
rosp
ectively
fro
m J
une
30,
201
3 f
or
GA
SB
-S68
purp
oses.
Pu
bli
c E
mp
loye
es
' R
eti
rem
en
t F
un
d
As o
f Ju
ne
30,
201
8,
in lie
u o
f a
CO
LA
on J
an
ua
ry 1
, 2
01
9,
mem
be
rs in p
ay w
ere
pro
vid
ed a
13
th c
heck o
n O
cto
ber
1, 2
01
8.
It is a
ssum
ed
a 1
3th
che
ck w
ou
ld c
ontinu
e f
or
the 2
020
and
20
21
fis
ca
l yea
rs. T
he
rea
fte
r, t
he
fo
llow
ing
CO
LA
s, co
mpo
un
de
d a
nnu
ally
, w
ere
assu
med
:
0.4
% b
eg
inn
ing
on J
an
ua
ry 1
, 2
02
2
0.5
% b
eg
inn
ing
on J
an
ua
ry 1
, 2
03
4
0.6
% b
eg
inn
ing
on J
an
ua
ry 1
, 2
03
9
Comprehensive Annual Financial Report - State of Indiana - 160

Sc
he
du
le o
f th
e S
tate
's P
rop
ort
ion
ate
Sh
are
of
the N
et
Pe
ns
ion
Lia
bil
ity
Em
plo
ye
e R
eti
rem
en
t S
ys
tem
s a
nd
Pla
ns
(am
ou
nts
exp
ress
ed
in
th
ou
sa
nd
s)
6/3
0/2
019
6/3
0/2
018
6/3
0/2
017
6/3
0/2
016
6/3
0/2
015
6/3
0/2
014
6/3
0/2
013
Sta
te's
pro
port
ion o
f th
e n
et pensio
n lia
bili
ty (
asset)
100.0
0%
100.0
0%
100.0
0%
100.0
0%
100.0
0%
100.0
0%
100.0
0%
Sta
te's
pro
port
ionate
share
of
the n
et pensio
n lia
bili
ty
(asset)
10,6
30,0
19
$
10,8
71,8
42
$
11,9
19,1
39
$
12,0
52,6
71
$
11,9
17,8
37
$
10,8
53,3
49
$
11,2
48,3
96
$
Pla
n f
iducia
ry n
et positio
n a
s a
perc
enta
ge o
f th
e tota
l
pensio
n lia
bili
ty26.2
%25.5
%28.8
%28.4
%30.0
%33.6
%31.7
%
No
tes t
o S
ch
ed
ule
:
Measure
ment date
: A
ctu
ari
al valu
ation r
eport
s f
rom
the p
rior
fiscal ye
ar.
Benefit changes.
Begin
nin
g J
uly
1, 2017, th
e m
inim
um
pensio
n b
enefit paid
to a
regula
rly
retire
d m
em
ber
receiv
ing a
n u
nre
duced p
ensio
n b
enefit is
$185 p
er
month
. In 2
019, H
B 1
059 e
xpanded
the c
urr
ent pre
-retire
ment death
benefit elig
ibili
ty to m
em
bers
with a
t le
ast 10 y
ears
of
serv
ice.
Pla
n a
mendm
ents
. In 2
014, H
B 1
075 im
pacte
d the T
RF
Pre
-1996 A
ccount by
reducin
g the A
nnuity
Savin
gs A
ccount (A
SA
) in
tere
st cre
ditin
g r
ate
on a
nnuitie
s
from
7.5
% to 5
.75%
eff
ective O
cto
ber
1, 2014. E
ffective O
cto
ber
1, 2015 the r
ate
becom
es the g
reate
r of
4.5
% o
r m
ark
et ra
te.
Begin
nin
g J
anuary
1, 2018 A
SA
annuitiz
ations w
ere
accom
modate
d thro
ugh a
thir
d p
art
y pro
vid
er.
Changes o
f assum
ptions.
An a
ssum
ption s
tudy
was p
erf
orm
ed in A
pri
l of
2015 r
esultin
g in a
n u
pdate
to the f
ollo
win
g a
ssum
ptions: 1
) th
e inflation
assum
ption c
hanged f
rom
3.0
0%
to 2
.25%
per
year;
2)
the f
utu
re s
ala
ry incre
ase a
ssum
ption c
hanged f
rom
a table
rangin
g f
rom
3.0
0%
to 1
2.5
0%
to a
table
rangin
g f
rom
2.5
0%
to 1
2.5
0%
; 3)
the m
ort
alit
y assum
ption c
hanged f
rom
the 2
013 IR
S S
tatic M
ort
alit
y pro
jecte
d f
ive (
5)
years
with S
cale
AA
to
the R
P-2
014 W
hite C
olla
r M
ort
alit
y T
able
with S
ocia
l S
ecuri
ty A
dm
inis
tration g
enera
tional pro
jection s
cale
fro
m 2
006; 4)
the r
etire
ment assum
ption w
as
update
d b
ased o
n r
ecent experi
ence; and 5
) th
e term
ination a
ssum
ption w
as u
pdate
d b
ased o
n r
ecent experi
ence. F
or
dis
able
d m
em
bers
, in
2017 the
mort
alit
y assum
ption w
as c
hanged to the R
P-2
014 D
isable
d M
ort
alit
y T
able
with g
enera
tional im
pro
vem
ents
fro
m 2
006 b
ased o
n the 2
014 S
ocia
l S
ecuri
ty
Adm
inis
tration T
ruste
e's
Report
.
The e
ffort
and c
ost to
recre
ate
fin
ancia
l sta
tem
ent in
form
ation f
or
10 y
ears
was n
ot pra
ctical.
Info
rmation w
as p
repare
d p
rospectively
fro
m J
une 3
0, 2013 f
or
GA
SB
-S68 p
urp
oses.
Te
ac
he
rs' R
eti
rem
en
t F
un
d P
re-1
99
6 A
cco
un
t
As o
f June 3
0, 2018, in
lie
u o
f a C
OLA
on J
anuary
1, 2019, m
em
bers
in p
ay
were
pro
vid
ed a
13th
check o
n O
cto
ber
1, 2018. It is a
ssum
ed a
13th
check w
ould
continue f
or
the 2
020 a
nd 2
021 f
iscal ye
ars
.
There
aft
er,
the f
ollo
win
g C
OLA
s, com
pounded a
nnually
, w
ere
assum
ed:
0.4
% b
egin
nin
g o
n J
anuary
1, 2022
0.5
% b
egin
nin
g o
n J
anuary
1, 2034
0.6
% b
egin
nin
g o
n J
anuary
1, 2039
161 - State of Indiana - Comprehensive Annual Financial Report

Sc
he
du
le o
f th
e S
tate
's P
rop
ort
ion
ate
Sh
are
of
the N
et
Pe
ns
ion
Lia
bil
ity
Em
plo
ye
e R
eti
rem
en
t S
ys
tem
s a
nd
Pla
ns
(am
ou
nts
exp
ress
ed
in
th
ou
sa
nd
s)
6/3
0/2
019
6/3
0/2
018
6/3
0/2
017
6/3
0/2
016
6/3
0/2
015
6/3
0/2
014
6/3
0/2
013
Sta
te's
pro
port
ion o
f th
e n
et pensio
n lia
bili
ty (
asset)
0.3
4%
0.3
5%
0.3
9%
0.3
5%
0.3
8%
0.4
0%
0.4
2%
Sta
te's
pro
port
ionate
share
of
the n
et pensio
n lia
bili
ty
(asset)
(494)
$
389
$
2,5
71
$
2,7
39
$
1,9
77
$
191
$
1,3
10
$
Sta
te's
covere
d p
ayr
oll
11,2
24
11,0
16
11,7
22
10,1
08
10,2
88
10,3
80
10,1
50
Sta
te's
pro
port
ionate
share
of
the n
et pensio
n lia
bili
ty
(asset)
as a
perc
enta
ge o
f its c
overe
d p
ayr
oll
-4.4
%3.5
%21.9
%27.1
%19.2
%1.8
%12.9
%
Pla
n f
iducia
ry n
et positio
n a
s a
perc
enta
ge o
f th
e tota
l
pensio
n lia
bili
ty102.4
%98.0
%90.4
%87.8
%91.1
%99.1
%93.4
%
No
tes t
o S
ch
ed
ule
:
Measure
ment date
: A
ctu
ari
al valu
ation r
eport
s f
rom
the p
rior
fiscal ye
ar.
Benefit changes.
Begin
nin
g J
uly
1, 2017, th
e m
inim
um
pensio
n b
enefit paid
to a
regula
rly
retire
d m
em
ber
receiv
ing a
n u
nre
ducte
d p
ensio
n b
enefit is
$185/m
onth
. In 2
019, H
B 1
059 e
xpanded
the c
urr
ent pre
-retire
ment death
benefit elig
ibili
ty to m
em
bers
with a
t le
ast 10 y
ears
of
serv
ice.
Pla
n a
mendm
ents
: In 2
014, H
B 1
075 im
pacte
d the P
ER
F b
y re
ducin
g the A
nnuity
Savin
gs A
ccount (A
SA
) in
tere
st cre
ditin
g r
ate
on a
nnuitie
s f
rom
7.5
% to 5
.75%
eff
ective O
cto
ber
1, 2014. E
ffective O
cto
ber
1, 2015 the r
ate
becom
es the g
reate
r of
4.5
% o
r m
ark
et ra
te.
Begin
nin
g J
anuary
1, 2018 A
SA
annuitiz
ations w
ere
accom
modate
d thro
ugh a
thir
d p
art
y pro
vid
er.
Changes o
f assum
ptions.
An a
ssum
ption s
tudy
was p
erf
orm
ed in A
pri
l of
2015 r
esultin
g in a
n u
pdate
to the f
ollo
win
g a
ssum
ptions: 1
) T
he inflation a
ssum
ption
changed f
rom
3.0
0%
to 2
.25%
per
year;
2)
the f
utu
re s
ala
ry incre
ases a
ssum
ption c
hanged f
rom
a table
rangin
g f
rom
3.0
0%
to 1
2.5
0%
to a
table
rangin
g f
rom
2.5
0%
to 1
2.5
0%
; 3)
the m
ort
alit
y assum
ption c
hanged f
rom
the 2
013 IR
S S
tatic M
ort
alit
y pro
jecte
d f
ive (
5)
years
with S
cale
AA
to 't
he R
P-2
014 W
hite C
olla
r
Mort
alit
y T
able
with S
ocia
l S
ecuri
ty A
dm
inis
tration g
enera
tional pro
jection s
cale
fro
m 2
006; 4)
the r
etire
ment assum
ption w
as u
pdate
d b
ased o
n r
ecent experi
ence;
and 5
) th
e term
ination a
ssum
ption w
as u
pdate
d b
ased o
n r
ecent experi
ence. F
or
dis
able
d m
em
bers
, in
2017 the m
ort
alit
y assum
ption w
as c
hanged to the
RP
-2014 D
isable
d M
ort
alit
y T
able
with g
enera
tional im
pro
vem
ents
fro
m 2
006 b
ased o
n the 2
014 S
ocia
l S
ecuri
ty A
dm
inis
tration T
ruste
e's
Report
.
The e
ffort
and c
ost to
recre
ate
fin
ancia
l sta
tem
ent in
form
ation f
or
10 y
ears
was n
ot pra
ctical.
Info
rmation w
as p
repare
d p
rospectively
fro
m J
une 3
0, 2013 f
or
GA
SB
-S68 p
urp
oses.
Te
ac
he
rs' R
eti
rem
en
t F
un
d 1
99
6 A
cco
un
t
As o
f June 3
0, 2018, in
lie
u o
f a C
OLA
on J
anuary
1, 2019, m
em
bers
in p
ay
were
pro
vid
ed a
13th
check o
n O
cto
ber
1, 2018. It is a
ssum
ed a
13th
check w
ould
continue f
or
the 2
020 a
nd 2
021 f
iscal ye
ars
.
There
aft
er,
the f
ollo
win
g C
OLA
s, com
pounded a
nnually
, w
ere
assum
ed:
0.4
% b
egin
nin
g o
n J
anuary
1, 2022
0.5
% b
egin
nin
g o
n J
anuary
1, 2034
0.6
% b
egin
nin
g o
n J
anuary
1, 2039
Comprehensive Annual Financial Report - State of Indiana - 162

Schedule of Changes in the Net OPEB Liability and Related Ratios
Other Postemployment Benefit Plans
(amounts expressed in thousands)
6/30/2020 6/30/2019 6/30/2018 6/30/2017
Total OPEB liability
Service cost 2,961$ 1,934$ 2,113$ 2,334$
Interest 1,892 1,851 1,910 1,536
Changes of benefit terms - - - -
Differences between expected and actual experience 1,622 6,587 (5,332) (121)
Changes of assumptions (6,835) 2,803 (1,164) (1,081)
Benefit payments (4,752) (3,276) (3,042) (4,404)
Other - - - -
Net change in total OPEB liability (5,112) 9,899 (5,515) (1,736)
Total OPEB liability, beginning 57,424 47,525 53,040 54,776 Total OPEB liability, ending 52,312$ 57,424$ 47,525$ 53,040$
Plan fiduciary net position
Contributions, employer 5,031$ 3,337$ 3,384$ 4,802$
Contributions, employee - - - -
Net investment income 789 1,007 547 292
Benefit payments (4,752) (3,276) (3,042) (4,404)
Administrative expense (133) (354) (398) (418)
Net change in plan fiduciary net position 935 714 491 272
Plan fiduciary net position, beginning 46,203 45,489 44,998 44,726 Plan fiduciary net position, ending 47,138$ 46,203$ 45,489$ 44,998$
Net OPEB liability 5,174$ 11,221$ 2,036$ 8,042$
Plan fiduciary net position as a percentage of the total OPEB liability 90.1% 80.5% 95.7% 84.8%
Covered-employee payroll 1,397,835 1,346,186 1,296,877 1,245,383
Net OPEB liability as a percentage of covered-employee payroll 0.4% 0.8% 0.2% 0.6%
Notes to Schedule:
Changes of assumptions:
The effort and cost to recreate financial statement information for 10 years was not practical.
Information was prepared prospectively from June 30, 2017 for GASB-S74 purposes.
State Personnel Healthcare Plan
2. Trend rates for medical and prescription drug benefits have an initial rate of 7.5% decreasing by 0.50% annually to an ultimate rate of
4.5%.
3. Discount rate was updated to 3.23% as of June 30, 2020 for accounting disclosure purposes. The rate was 3.26% as of July 1, 2019,
3.87% as of July 1, 2018, and 3.56% as of July 1, 2017.
4. The termination assumption for those earning less than $20,000 per year was updated to follow the PERF termination rates as of June
30, 2020 for this group.
1. For 2020, the mortality, termination, retirement rate, and payroll growth assumptions were updated based on the revised tables
presented in the INPRS 2020 Experience Study. The mortality, retirement rate, and payroll growth updates led to slight decreases in
liabilities, while the termination update led to an increase in liabilities. The health care coverage electrion rate was updated from 40% to
35% for employees that are eligible for a normal, unreduced or disability pension under PERF and from 15% to 10% for employees with
health coverage that are not eligible for a normal, unreduced or disability pension under PERF. The change led to a reduction in liabilities.
The spousal coverage election rate was updated from 70% for male employees and 55% for female employess to 20% for male
employees and 15% for female employees. This change led to a slight decrease in liabilities.
163 - State of Indiana - Comprehensive Annual Financial Report

Schedule of Changes in the Net OPEB Liability and Related Ratios
Other Postemployment Benefit Plans
(amounts expressed in thousands)
6/30/2020 6/30/2019 6/30/2018 6/30/2017
Total OPEB liability
Service cost 5,032$ 8,531$ 17,811$ 24,701$
Interest 12,530 12,778 19,726 16,987
Changes of benefit terms - 3,254 (196,574) (34,808)
Differences between expected and actual experience (20,071) (78,676) (21,242) 3,921
Changes of assumptions (15,687) (66,154) (27,946) (48,451)
Benefit payments (2,802) (5,805) (6,994) (8,656)
Other - - - -
Net change in total OPEB liability (20,998) (126,072) (215,219) (46,306)
Total OPEB liability, beginning 198,445 324,517 539,736 586,042 Total OPEB liability, ending 177,447$ 198,445$ 324,517$ 539,736$
Plan fiduciary net position
Contributions, employer 21,727$ 23,937$ 25,814$ 26,871$
Contributions, employee 846 857 404 473
Net investment income 1,276 2,109 1,422 508
Benefit payments (2,802) (5,805) (6,994) (8,656)
Administrative expense (360) (492) (606) (589)
Net change in plan fiduciary net position 20,687 20,606 20,040 18,607
Plan fiduciary net position, beginning 137,969 117,363 97,323 78,716 Plan fiduciary net position, ending 158,656$ 137,969$ 117,363$ 97,323$
Net OPEB liability 18,791$ 60,476$ 207,154$ 442,413$
Plan fiduciary net position as a percentage of the total OPEB liability 89.4% 69.5% 36.2% 18.0%
Covered-employee payroll 120,255 120,447 107,914 98,693
Net OPEB liability as a percentage of covered-employee payroll 15.6% 50.2% 192.0% 448.3%
Notes to Schedule:
Changes of assumptions:
Changes in benefit terms:
The effort and cost to recreate financial statement information for 10 years was not practical.
Information was prepared prospectively from June 30, 2017 for GASB-S74 purposes.
Indiana State Police Healthcare Plan
2. Trend rates for medical and prescription drug benefits have an initial rate of 7.5% decreasing by 0.50% annually to an ultimate rate of 4.5%.
3. Discount rate was updated to 6.20% as of June 30, 2019 for accounting disclosure purposes. The rate was 6.20% as of July 1, 2019, 3.87% as of July 1,
2018, and 3.56 as of July 1, 2017.
2. Effective July 1, 2019, the life insurance benefit for retirees was modified such that all retirees (regardless of date of retirement) will receive a $20,000 benefit.
1. Effective on January 1, 2019, all post-65 Medicare eligible retirees were removed from the ISP’s traditional health plan. They will be covered under a Medicare
Advantage Plan through Anthem and a Medicare Part D plan with premiums paid fully by the retiree.
1. For 2020, the disability assumption was updated to follow the table presented for the Conservation and Excise Police in the INPRS 2020 Experience Study.
This change led to a slight decrease in liabilities. The mortality assumption was updated to follow the table presented for the '77 Fund in the INPRS 2020
Experience Study. This change led to a decrease in liabilities. The payroll growth assumption was updated to follow the table used in the July 1, 2020 pension
valuation for the Indiana State Police. This change led to a decrease in liabilities.
Comprehensive Annual Financial Report - State of Indiana - 164

Schedule of Changes in the Net OPEB Liability and Related Ratios
Other Postemployment Benefit Plans
(amounts expressed in thousands)
6/30/2020 6/30/2019 6/30/2018 6/30/2017
Total OPEB liability
Service cost 2,367$ 1,840$ 1,795$ 2,327$
Interest 2,647 2,410 2,035 1,956
Changes of benefit terms - 2,113 - (7,023)
Differences between expected and actual experience (7,900) 4,353 5,739 (1,654)
Changes of assumptions (23,751) 6,223 (3,387) (5,925)
Benefit payments (988) (943) (1,303) (1,305)
Other - - - -
Net change in total OPEB liability (27,625) 15,996 4,879 (11,624)
Total OPEB liability, beginning 76,899 60,903 56,024 67,648 Total OPEB liability, ending 49,274$ 76,899$ 60,903$ 56,024$
Plan fiduciary net position
Contributions, employer 4,167$ 4,021$ 6,241$ 3,718$
Net investment income 347 493 213 79
Benefit payments (988) (943) (1,303) (1,305)
Administrative expense (77) (84) (91) (82)
Net change in plan fiduciary net position 3,449 3,487 5,060 2,410
Plan fiduciary net position, beginning 23,723 20,236 15,176 12,766 Plan fiduciary net position, ending 27,172$ 23,723$ 20,236$ 15,176$
Net OPEB liability 22,102$ 53,176$ 40,667$ 40,848$
Plan fiduciary net position as a percentage of the total OPEB liability 55.1% 30.8% 33.2% 27.1%
Covered-employee payroll 18,453 18,883 16,981 15,602
Net OPEB liability as a percentage of covered-employee payroll 119.8% 281.6% 239.5% 261.8%
Notes to Schedule:
Changes of assumptions:
Change in benefit terms:
The effort and cost to recreate financial statement information for 10 years was not practical.
Information was prepared prospectively from June 30, 2017 for GASB-S74 purposes.
Conservation and Excise Police Healthcare Plan
1. Effective on January 1, 2020, all post-65 Medicare eligible retirees will be removed from the CEP’s traditional health plan. They will be
covered under a Medicare Advantage Plan through Anthem and a Medicare Part D plan with premiums assumed to be paid fully by the
retiree. Since the premiums charged to retirees are lower than the full cost of coverage, there is still a GASB liability for this benefit.
3. Discount rate was updated to 6.20% as of June 30, 2020 for accounting disclosure purposes. The rate was 3.36% as of June 30,
2019, 3.87% as of July 1, 2018, and 3.56% as of July 1, 2017.
2. Trend rates for medical and prescription drug benefits have an initial rate of 7.5% decreasing by 0.50% annually to an ultimate rate of
4.5%.
1. For 2020, the mortality, retirement rate, disability, and payroll growth assumptions was updated based on the revised tables
presented in the INPRS 2020 Experience Study. The retirement and disability updates led to an increase in liabilities, while the mortality
and payroll growth updates led to a decrease in liabilities. The spousal coverage election rate was updated from 85% for males
employees and 25% for female employees to 85% for male employees and 15% for female employees. This change led to a slight
decrease in liabilities.
165 - State of Indiana - Comprehensive Annual Financial Report

Schedule of Changes in the Total OPEB Liability and Related Ratios
Other Postemployment Benefit Plans
(amounts expressed in thousands)
6/30/2020 6/30/2019 6/30/2018 6/30/2017
Total OPEB liability
Service cost 43$ 114$ 120$ 165$
Interest 277 381 420 338
Changes of benefit terms - (1,063) - -
Differences between expected and actual experience (270) (1,137) (1,527) 864
Changes of assumptions 464 335 (385) (681)
Benefit payments (494) (535) (620) (555)
Other - - - -
Net change in total OPEB liability 20 (1,905) (1,992) 131
Total OPEB liability, beginning 8,090 9,995 11,987 11,856 Total OPEB liability, ending 8,110$ 8,090$ 9,995$ 11,987$
Covered-employee payroll 6,241 6,184 5,443 5,540
Total OPEB liability as a percentage of covered-employee payroll 129.9% 130.8% 183.6% 216.4%
Notes to Schedule:
Changes of assumptions:
Changes in benefit terms:
The effort and cost to recreate financial statement information for 10 years
was not practical.
Legislators Retiree Healthcare Plan
2. Trend rates for medical and prescription drug benefits have an initial rate of 7.5% decreasing by 0.50% annually to an ultimate
rate of 4.5%.
3. Discount rate was updated to 2.66% as of June 30, 2020 for acounting disclosure purposes. The rate was 3.51% as of July 1,
2019, 3.87% as of July 1, 2018, and 3.56% as of July 1, 2017.
1. Effective on January 1, 2019, all post-65 Medicare eligible retirees were removed from the ISP’s traditional health plan. They will
be covered under a Medicare Advantage Plan through Anthem and a Medicare Part D plan with premiums paid fully by the retiree.
This change is reflected for Legislature actives and retirees covered under the ISP's plan.
1. For 2020, the mortality and payroll growth assumptions have been updated based on the revised tables presented in the INPRS
2020 Experience Study. The mortality update led to a decrease in liabilities, while the payroll growth update led to a slight increase.
The health care coverage election was updated from 40% to 35% for employees that are eligible for a normal, unreduced or
disability pension under PERF and from 15% to 10% for employees with health coverage that are not eligible for a normal,
unreduced or disability pension under PERF. The change led to a slight reduction in liabilities. The spousal coverage election rate
was updated from 100% for all employees to 95% for male employees and 50% for female employees. This change led to a slight
decrease in liabilities.
Comprehensive Annual Financial Report - State of Indiana - 166

Schedule of Investment Returns
Annual Money-Weighted Rate of Return, Net of Investment Expense
Other Postemployment Benefit Plans
6/30/2020 6/30/2019 6/30/2018 6/30/2017
Single-employer defined benefit other postemployment benefit plan:
State Personnel Healthcare Plan (SPP) 1.7% 2.2% 1.2% 0.7%
Indiana State Police Healthcare Plan (ISPP) 1.4% 2.4% 1.3% 0.6%
Conservation and Excise Police Healthcare Plan (CEPP) 1.3% 2.3% 1.2% 0.6%
Note:
The effort and cost to recreate financial statement information for 10 years was not practical.
Information was prepared prospectively from June 30, 2017 for GASB-S74 purposes.
167 - State of Indiana - Comprehensive Annual Financial Report

Budgetary Information The Governor submits a budget biennially to be adopted by the General Assembly for the ensuing two-year period. The budget covers the general fund and most special revenue funds. The General Assembly enacts the budget through passage of specific appropriations. The budget bill is enacted as the Appropriations Act that the Governor may veto, subject to legislative override. Except as specifically provided by statute, appropriations or any part thereof remaining unexpended and unencumbered at the close of any fiscal year will lapse and be returned to the fund from which it was appropriated. The final budget is composed of budgeted amounts as adopted and as amended by supplemental appropriations or appropriation transfers that were necessary during the current year. The State Board of Finance, which consists of the Governor, Auditor of State and Treasurer of State, is empowered to transfer appropriations from one appropriation, fund, or agency of the State to another, with the exception of trust funds. The State Budget Agency may transfer, assign, and reassign almost any appropriation, except those restricted by law, but only when: (1) the uses and purposes to which the funds are transferred are uses and purposes which the agency is permitted or required to perform; and (2) and the transfers are within the same agency of the state to which the appropriation was originally made. Capital appropriations are initially posted to general government. As projects are approved by the State Budget Committee the appropriations are transferred to the function of government from which they are disbursed. In addition, expenditures under many federal grants are required to be spent before they are reimbursed by the federal government. These actions are considered supplemental appropriations; therefore, expenditures do not exceed appropriations for individual funds. The legal level of budgetary control (the level on which expenditures may not legally exceed appropriations) is maintained at the fund level by the State Budget Agency. When budgets are submitted for each fund, certain recurring expenditures are not budgeted (such as tort claims) according to instructions from the State Budget Agency to the various agencies. The Budget Agency monitors all funds regularly in addition to monitoring excess general fund revenue that will be available at the end of the fiscal year to cover the non-budgeted, recurring expenditures.
Comprehensive Annual Financial Report - State of Indiana - 168

State of Indiana
Combining Schedule of Revenues, Expenditures and
Changes in Fund Balances - Budget and Actual
(Budgetary Basis)
For the Year Ended June 30, 2020(amounts expressed in thousands)
General Fund Public Welfare-Medicaid Assistance
Variance to
Budget Actual Final Budget Budget
Original Final
Revenues:
Taxes:
Income 7,024,986$ 7,024,986$ 5,891,252$ (1,133,734)$
Sales 8,075,767 8,075,767 8,157,459 81,692
Fuels - - 1,740 1,740
Gaming 427,148 427,148 41,349 (385,799)
Alcohol and tobacco 248,400 248,400 254,723 6,323
Insurance 242,797 242,797 243,407 610
Other 323,534 323,534 393,997 70,463
Total taxes 16,342,632 16,342,632 14,983,927 (1,358,705)
Current service charges 451,176 451,176 315,912 (135,264)
Investment income 103,000 103,000 132,011 29,011
Sales/rents 423 423 379 (44)
Grants - - 2,330 2,330
Other 20,324 20,324 40,893 20,569
Total revenues 16,917,555 16,917,555 15,475,452 (1,442,103)
Expenditures:
Current:
General government 1,428,291 1,716,996 1,089,267 627,729
Public safety 1,466,515 1,190,409 1,021,783 168,626
Health 36,506 29,536 21,998 7,538
Welfare 4,486,600 1,715,946 1,197,641 518,305
Conservation, culture and development 172,832 154,855 121,459 33,396
Education 10,660,463 10,702,829 10,599,653 103,176
Transportation 64,571 361,331 232,243 129,088
Debt service:
Capital lease principal - - 3,669 (3,669)
Capital lease interest - - 351 (351)
Total expenditures 18,315,778 15,871,902 14,288,064 1,583,838
Excess of revenues over (under) expenditures (1,398,223) 1,045,653 1,187,388 (141,735)
Other financing sources (uses):
Total other financing sources (uses) (1,869,073) (1,869,073) (1,869,073) -
Net change in fund balances (3,267,296)$ (823,420)$ (681,685) 141,735$
Fund balances July 1, as restated 3,288,881
Fund balances June 30 2,607,196$
169 - State of Indiana - Comprehensive Annual Financial Report

Public Welfare-Medicaid Assistance Department of Health and Human Services
Variance to Variance to
Budget Actual Final Budget Budget Actual Final Budget
Original Final Original Final
-$ -$ -$ -$ -$ -$ -$ -$
- - - - - - - -
- - - - - - - -
- - - - - - - -
- - - - - - - -
- - - - - - - -
- - - - - - - -
- - - - - - - -
1,029,599 1,029,599 932,496 (97,103) 1,330 1,330 252 (1,078)
- - - - - - - -
- - - - - - - -
9,056,681 9,056,681 10,543,567 1,486,886 1,473,625 1,473,625 1,533,347 59,722
- - - - 68 68 62 (6)
10,086,280 10,086,280 11,476,063 1,389,783 1,475,023 1,475,023 1,533,661 58,638
2,529 - - - 3,627 54,672 29,336 25,336
- - - - 3,299 25,642 7,773 17,869
- - - - 127,999 230,001 162,825 67,176
11,827 21,314,860 14,116,787 7,198,073 665,422 3,064,539 1,557,349 1,507,190
- - - - 2,639 5,798 6,365 (567)
- - - - 617 11,409 9,884 1,525
- - - - - 6 - 6
- - - - - - 27 (27)
- - - - - - - -
14,356 21,314,860 14,116,787 7,198,073 803,603 3,392,067 1,773,559 1,618,508
10,071,924 (11,228,580) (2,640,724) (8,587,856) 671,420 (1,917,044) (239,898) (1,677,146)
2,418,564 2,418,564 2,418,564 - 277,347 277,347 277,347 -
12,490,488$ (8,810,016)$ (222,160) 8,587,856$ 948,767$ (1,639,697)$ 37,449 1,677,146$
529,485 (300,893)
307,325$ (263,444)$
continued on next page
Comprehensive Annual Financial Report - State of Indiana - 170

State of Indiana
Combining Schedule of Revenues, Expenditures and
Changes in Fund Balances - Budget and Actual
(Budgetary Basis)
For the Year Ended June 30, 2020(amounts expressed in thousands)
FEDERAL COVID-19 NONE
Variance to
Budget Actual Final Budget
Original Final
Revenues:
Taxes:
Income -$ -$ -$ -$
Sales - - - -
Fuels - - - -
Gaming - - - -
Alcohol and tobacco - - - -
Insurance - - - -
Other - - - -
Total taxes - - - -
Current service charges - - - -
Investment income - - 2 2
Sales/rents - - - -
Grants - - 2,553,574 2,553,574
Other - - - -
Total revenues - - 2,553,576 2,553,576
Expenditures:
Current:
General government 6,245 2,114,200 264,116 1,850,084
Public safety 80 18,858 193,924 (175,066)
Health 44,468 274,389 19,574 254,815
Welfare 19,752 118,111 19 118,092
Conservation, culture and development 6,326 21,642 6,382 15,260
Education 17 378,608 89,156 289,452
Transportation - 55,504 - 55,504
Debt service:
Capital lease principal - - - -
Capital lease interest - - - -
Total expenditures 76,888 2,981,312 573,171 2,408,141
Excess of revenues over (under) expenditures (76,888) (2,981,312) 1,980,405 (4,961,717)
Other financing sources (uses):
Total other financing sources (uses) - - - -
Net change in fund balances (76,888)$ (2,981,312)$ 1,980,405 4,961,717$
Fund balances July 1, as restated -
Fund balances June 30 1,980,405$
171 - State of Indiana - Comprehensive Annual Financial Report

Budget/GAAP ReconciliationMajor Funds
The cash basis of accounting (budgetary basis) is applied to each budget. The budgetary basis differs
from GAAP. The major differences between budgetary (non-GAAP) basis and GAAP basis are:
(amounts expressed in thousands)
GENERAL FUND
PUBLIC WELFARE-
MEDICAID
ASSISTANCE
US DEPARTMENT
OF HEALTH &
HUMAN SERVICES
FEDERAL COVID-
19 Total
Net change in fund balances
(budgetary basis) (681,685)$ (222,160)$ 37,449$ 1,980,405$ 1,114,008$
Adjustments necessary to convert
the results of operations on a
budgetary basis to a GAAP basis
are:
Revenues are recorded when
earned (GAAP) as opposed to
when cash is received
(budgetary) 930,945 66,138 (38,640) (1,914,398) (955,953)
Expenditures are recorded
when the liability is incurred
(GAAP) as opposed to when
payment is made (budgetary) 39,963 (126,275) 9,256 (43,697) (120,753)
Net change in fund balances
(GAAP basis) 289,223$ (282,297)$ 8,066$ 22,310$ 37,302$
Comprehensive Annual Financial Report - State of Indiana - 172

Infrastructure - Modified Reporting
Condition Rating of the State's Highways and Bridges
Roads
Average International Roughness Index (IRI),
Right Wheel Path (RWP)
2020 2019 2018
Interstate Roads (excluding Rest Areas and Weigh Stations) 82 87 75
NHS Roads - Non-Interstate (excluding Rest Areas and Weigh Stations) 90 96 96
Non-NHS Roads 110 115 105
The condition of road pavement is based on the International Roughness Index (IRI), which is a measure of the roughness
of the pavement in terms of inches per mile, and applies both to Portland cement concrete (PCC) and hot mix asphalt (HMA)
pavements. IRI's range from zero for a pavement that is perfectly smooth to ratings above 170 for a pavement that warrants
replacement. The condition index is used to classify roads in excellent condition (0-79), good condition (80-114), satisfactory
condition (115-149), fair condition (150-169), and poor condition (170 and above). It is the State's policy to maintain a network
average of no more than 101 IRI (RWP). Condition assessments are determined on an annual basis for all roads maintained
by INDOT. The ratings provided are based on data gathered during the summer (May to October) for each fiscal year.
The data is evaluated and compared to standard criteria by the end of the fiscal year.
Bridges Average Sufficiency Rating
2020 2019 2018
Interstate Bridges 91.2% 91.4% 91.5%
NHS Bridges - Non-Interstate 93.0% 92.8% 91.6%
Non-NHS Bridges 90.6% 90.5% 90.4%
The condition of the State's bridges is measured based on a sufficiency rating, which is based on a weighted average of
four factors indicative of a bridge's sufficiency to remain in service. The sufficiency rating uses a measurement scale that
ranges from zero for an entirely insufficient or deficient bridge to 100 for an entirely sufficient bridge. The sufficiency rating is
used to classify bridges in excellent condition (90-100), good condition (80-89), fair condition (70-79), marginal condition (60-69),
and poor condition (below 60). It is the State's policy to maintain Interstate bridges at a minimum sufficiency rating of
87%, NHS Non-Interstate bridges at 85%, and Non-NHS bridges at 83%. Sufficiency ratings are determined at least on a
biennial basis for all bridges. Sufficiency ratings are determined more frequently for certain bridges depending on their design.
173 - State of Indiana - Comprehensive Annual Financial Report

Infrastructure - Modified Reporting
Comparison of Planned-to-Actual Maintenance/Preservation
(amounts expressed in thousands)
2020 2019 2018 2017 2016
Roads
Interstate Roads (including Rest Areas and Weigh
Stations):
Planned 186,413$ 252,209$ 72,028$ 246,165$ 126,191$
Actual 272,602 219,806 20,210 171,413 125,283
NHS and Non-NHS Roads - Non-Interstate (including
Rest Areas and Weigh Stations)
Planned 499,422 418,752 408,266 393,319 277,605
Actual 446,217 391,955 338,622 344,826 220,215
Roads at State Institutions and Properties
Planned - - 3,934 - 260 Actual - - - 453 241
Total
Planned 685,835 670,961 484,228 639,484 404,056
Actual 718,819 611,761 358,832 516,692 345,739
Bridges
Interstate Bridges
Planned 119,927$ 135,011$ 132,093$ 106,125$ 57,794$
Actual 83,250 99,363 104,728 141,487 82,044
NHS Bridges - Non-Interstate
Planned 88,658 47,383 74,995 46,003 31,892
Actual 64,541 43,850 46,264 42,633 33,116
Non-NHS Bridges
Planned 87,446 73,802 193,724 93,649 82,601
Actual 92,653 64,696 186,513 102,920 77,573
Total
Planned 296,031 256,196 400,812 245,777 172,287
Actual 240,444 207,909 337,505 287,040 192,733
Source: Indiana Department of Transportation
Comprehensive Annual Financial Report - State of Indiana - 174

175 - State of Indiana - Comprehensive Annual Financial Report

OTHER SUPPLEMENTARY INFORMATION
Comprehensive Annual Financial Report - State of Indiana - 176

NON-MAJOR GOVERNMENTAL FUNDS
SPECIAL REVENUE FUNDS Special revenue funds account for the proceeds of specific revenue sources that are legally restricted to expenditure for specified purposes. Funds of material significance are presented separately in these combining statements. All other funds are included under the description “Other Non-Major Special Revenue Funds.” The following funds are used to account for transportation and motor vehicle related programs: Major Moves Construction Fund Motor Vehicle Highway
Motor Vehicle Commission Road & Street, Primary Highway State Highway Fund
The following funds are used to account for health and environmental programs:
Indiana Check-Up Plan Patients Compensation Fund Tobacco Settlement Fund
The following funds are used to receive and distribute certain revenues to the proper sources:
State Gaming Fund Build Indiana Fund
The following fund is used to account for federal and non-federal programs:
Fund 6000 Programs The following fund is used to provide low interest construction and technology loans for qualifying schools:
Common School Fund The following funds are used to account for federal grant programs:
U.S. Department of Agriculture U.S. Department of Labor U.S. Department of Transportation U.S. Department of Education
177 - State of Indiana - Comprehensive Annual Financial Report

NON-MAJOR GOVERNMENTAL FUNDS
CAPITAL PROJECTS FUNDS
Capital project funds account for financial resources to be used by the State for the acquisition or construction of major capital facilities (other than those financed by proprietary and trust funds). Funds of material significance are presented separately in these combining statements. All other funds are included under the description “Other Non-Major Capital Projects Funds.”
State Construction Fund – This fund accounts for excise taxes deposited to the fund to be used for the construction, rehabilitation, repair, purchase, rental, and sale of state properties and institutions (excluding state educational institutions).
PERMANENT FUNDS
Permanent Funds account for resources of the State that are legally restricted to the extent that only earnings, and not principal, may be used for purposes that support State programs. Funds of material significance are presented separately in these combining statements. All other funds are included under the description “Other Non-Major Permanent Funds.”
Next Level Indiana Trust Fund – This fund is created per IC 8-14-15.1-5 and holds title to proceeds transferred to the trust under IC 8-15.5-11, including those held in the Next Generation Trust Fund under IC 8-14-15-5 as previously in effect before July 1, 2017, to be used exclusively for the provision of highways, roads, and bridges for the benefit of the people of Indiana and the users of those facilities.
Comprehensive Annual Financial Report - State of Indiana - 178

State of Indiana
Balance Sheet
Non-Major Governmental Funds
June 30, 2020(amounts expressed in thousands)
Non-Major
Special Revenue
Funds
Non-Major
Capital Projects
Funds
Non-Major
Permanent
Funds Total
ASSETS
Cash, cash equivalents and investments-
unrestricted 4,220,693$ 83,959$ 603,268$ 4,907,920$
Cash, cash equivalents and investments-
restricted 226,263 - - 226,263
Receivables:
Taxes (net of allowance for uncollectible
accounts) 196,612 2,181 - 198,793
Accounts 116,213 - - 116,213
Grants 198,550 - - 198,550
Interest 1,178 - 5 1,183
Interfund loans 12,073 - - 12,073
Due from other funds 10,584 - - 10,584
Due from component unit 23,450 - - 23,450
Prepaid expenditures 45 - - 45
Loans 307,022 - - 307,022
Other 65 - 14 79
Total assets 5,312,748 86,140 603,287 6,002,175
Total assets and deferred outflow of
resources 5,312,748$ 86,140$ 603,287$ 6,002,175$
LIABILITIES
Accounts payable 569,289$ 1,204$ -$ 570,493$
Salaries and benefits payable 31,453 133 - 31,586
Interfund loans 25,474 - - 25,474
Interfunds services used 2,870 10 - 2,880
Intergovernmental payable 113,567 - - 113,567
Tax refunds payable 6,299 - - 6,299
Accrued liability for compensated absences-
current 1,774 6 - 1,780
Other payables 340 - 14 354
Total liabilities 751,066 1,353 14 752,433
DEFERRED INFLOW OF RESOURCES
Unavailable revenue 84,803 - - 84,803
Total deferred inflow of resources 84,803 - - 84,803
FUND BALANCE
Nonspendable 45 - 502,835 502,880
Restricted 3,514 - - 3,514
Committed 868,509 - 100,438 968,947
Assigned 3,658,476 84,787 - 3,743,263
Unassigned (53,665) - - (53,665)
Total fund balance 4,476,879 84,787 603,273 5,164,939
Total liabilities, deferred inflow of
resources, and fund balance 5,312,748$ 86,140$ 603,287$ 6,002,175$
179 - State of Indiana - Comprehensive Annual Financial Report

State of Indiana
Statement of Revenues, Expenditures,
and Changes in Fund Balances
Non-Major Governmental Funds
For the Year Ended June 30, 2020(amounts expressed in thousands)
Non-Major
Special Revenue
Funds
Non-Major
Capital Projects
Funds
Non-Major
Permanent
Funds Total
Revenues:
Taxes:
Sales 73,876$ -$ -$ 73,876$
Fuels 1,447,661 - - 1,447,661
Gaming 408,326 - - 408,326
Alcohol and tobacco 145,134 23,313 - 168,447
Insurance 5,084 - - 5,084
Financial Institutions 142,687 - - 142,687
Other 16,896 - - 16,896
Total taxes 2,239,664 23,313 - 2,262,977
Current service charges 2,085,101 4,526 - 2,089,627
Investment income 33,325 - 25,347 58,672
Sales/rents 17,613 22 - 17,635
Grants 3,936,550 1,557 - 3,938,107
Other 103,194 17 - 103,211
Total revenues 8,415,447 29,435 25,347 8,470,229
Expenditures:
Current:
General government 371,145 - 25 371,170
Public safety 551,318 - - 551,318
Health 230,089 - - 230,089
Welfare 1,359,298 - - 1,359,298
Conservation, culture and development 417,105 - 82 417,187
Education 992,481 - - 992,481
Transportation 3,256,319 - 1,134 3,257,453
Debt service:
Capital lease principal 65,920 - - 65,920
Capital lease interest 41,870 - - 41,870
Capital outlay - 22,872 - 22,872
Total expenditures 7,285,545 22,872 1,241 7,309,658
Excess (deficiency) of revenues over (under)
expenditures 1,129,902 6,563 24,106 1,160,571
Other financing sources (uses):
Transfers in 2,360,694 26,672 - 2,387,366
Transfers (out) (3,186,468) (23,328) - (3,209,796)
Total other financing sources (uses) (825,774) 3,344 - (822,430)
Net change in fund balances 304,128 9,907 24,106 338,141
Fund Balance July 1, as restated 4,172,751 74,880 579,167 4,826,798
Fund Balance June 30 4,476,879$ 84,787$ 603,273$ 5,164,939$
Comprehensive Annual Financial Report - State of Indiana - 180

State of Indiana
Combining Balance Sheet
Non-Major Special Revenue Funds
June 30, 2020(amounts expressed in thousands)
STATE GAMING
FUND
MOTOR
VEHICLE
HIGHWAY
MOTOR VEHICLE
COMMISSION
BUILD INDIANA
FUND
ASSETS
Cash, cash equivalents and investments-
unrestricted 1,199$ 96,332$ 51,192$ 6,525$
Cash, cash equivalents and investments-
restricted - - - -
Receivables:
Taxes (net of allowance for uncollectible
accounts) 20,903 41,518 - -
Accounts 2 13,907 4,409 -
Grants - - - -
Interest - 4 - -
Interfund loans - 8,000 - -
Due from other funds - - - -
Due from component unit - - - -
Prepaid expenditures - - - -
Loans - - - -
Other - - - -
Total assets 22,104 159,761 55,601 6,525
Total assets and deferred outflow of
resources 22,104$ 159,761$ 55,601$ 6,525$
LIABILITIES
Accounts payable 39$ 13$ 2,357$ 114$
Salaries and benefits payable 132 - 2,727 -
Interfund loans - - - -
Interfunds services used 33 6 280 -
Intergovernmental payable 2,892 34,829 - -
Tax refunds payable - 2,873 - -
Accrued liability for compensated
absences-current 6 - 137 -
Other payables - - - -
Total liabilities 3,102 37,721 5,501 114
DEFERRED INFLOW OF RESOURCES
Unavailable revenue - 753 - -
Total deferred inflow of resources - 753 - -
FUND BALANCE
Nonspendable - - - -
Restricted - - - -
Committed 8,678 - - -
Assigned 10,324 121,287 50,100 6,411
Unassigned - - - -
Total fund balance 19,002 121,287 50,100 6,411
Total liabilities, deferred inflow of
resources, and fund balance 22,104$ 159,761$ 55,601$ 6,525$
181 - State of Indiana - Comprehensive Annual Financial Report

STATE
HIGHWAY FUND
MAJOR MOVES
CONSTRUCTION
FUND
INDIANA CHECK-
UP PLAN
FUND 6000
PROGRAMS
PATIENTS
COMPENSATION
FUND
586,079$ 761,625$ 223,113$ 360,915$ 284,419$
- - - - -
3,031 - 18,147 28,522 -
23,688 - - 11,481 3,301
- - - - -
- 13 - 139 871
- - - 3,145 -
- - 33 1,627 -
- - - - -
- - - - -
6,077 - - 49 -
- 26 - 3 17
618,875 761,664 241,293 405,881 288,608
618,875$ 761,664$ 241,293$ 405,881$ 288,608$
17,758$ 13,656$ 1,029$ 87,911$ 6,123$
11,170 - - 1,560 26
8,000 - - - -
712 - - 82 5
- - - 282 -
9 - - 403 -
675 - - 81 1
- 26 - 3 17
38,324 13,682 1,029 90,322 6,172
177 - 7,697 8,001 -
177 - 7,697 8,001 -
- - - - -
- - - - -
- - 232,567 6,137 -
580,374 747,982 - 301,421 282,436
- - - - -
580,374 747,982 232,567 307,558 282,436
618,875$ 761,664$ 241,293$ 405,881$ 288,608$
continued on next page
Comprehensive Annual Financial Report - State of Indiana - 182
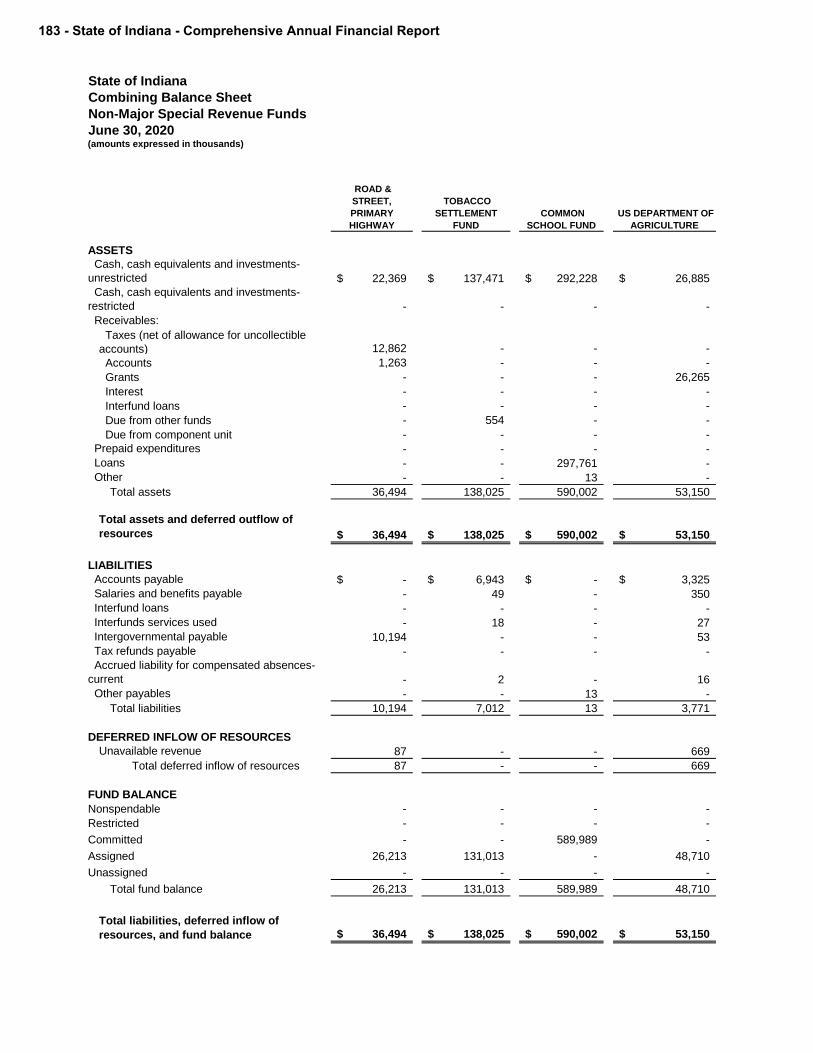
State of Indiana
Combining Balance Sheet
Non-Major Special Revenue Funds
June 30, 2020(amounts expressed in thousands)
ROAD &
STREET,
PRIMARY
HIGHWAY
TOBACCO
SETTLEMENT
FUND
COMMON
SCHOOL FUND
US DEPARTMENT OF
AGRICULTURE
ASSETS
Cash, cash equivalents and investments-
unrestricted 22,369$ 137,471$ 292,228$ 26,885$
Cash, cash equivalents and investments-
restricted - - - -
Receivables:
Taxes (net of allowance for uncollectible
accounts) 12,862 - - -
Accounts 1,263 - - -
Grants - - - 26,265
Interest - - - -
Interfund loans - - - -
Due from other funds - 554 - -
Due from component unit - - - -
Prepaid expenditures - - - -
Loans - - 297,761 -
Other - - 13 -
Total assets 36,494 138,025 590,002 53,150
Total assets and deferred outflow of
resources 36,494$ 138,025$ 590,002$ 53,150$
LIABILITIES
Accounts payable -$ 6,943$ -$ 3,325$
Salaries and benefits payable - 49 - 350
Interfund loans - - - -
Interfunds services used - 18 - 27
Intergovernmental payable 10,194 - - 53
Tax refunds payable - - - -
Accrued liability for compensated absences-
current - 2 - 16
Other payables - - 13 -
Total liabilities 10,194 7,012 13 3,771
DEFERRED INFLOW OF RESOURCES
Unavailable revenue 87 - - 669
Total deferred inflow of resources 87 - - 669
FUND BALANCE
Nonspendable - - - -
Restricted - - - -
Committed - - 589,989 -
Assigned 26,213 131,013 - 48,710
Unassigned - - - -
Total fund balance 26,213 131,013 589,989 48,710
Total liabilities, deferred inflow of
resources, and fund balance 36,494$ 138,025$ 590,002$ 53,150$
183 - State of Indiana - Comprehensive Annual Financial Report

US DEPARTMENT OF
LABOR
US DEPARTMENT OF
TRANSPORTATION
US DEPARTMENT
OF EDUCATION
OTHER NON-
MAJOR SPECIAL
REVENUE
FUNDS TOTAL
-$ 684,131$ 19,326$ 666,884$ 4,220,693$
- - - 226,263 226,263
- - - 71,629 196,612
256 256 - 57,650 116,213
12,758 72,227 6,506 80,794 198,550
- - - 151 1,178
- - - 928 12,073
- - - 8,370 10,584
- - - 23,450 23,450
- 45 - - 45
- - - 3,135 307,022
- - - 6 65
13,014 756,659 25,832 1,139,260 5,312,748
13,014$ 756,659$ 25,832$ 1,139,260$ 5,312,748$
2,451$ 132,256$ 7,819$ 287,495$ 569,289$
3,072 91 1,479 10,797 31,453
13,401 - - 4,073 25,474
391 39 73 1,204 2,870
- - 63,458 1,859 113,567
- - - 3,014 6,299
144 4 82 626 1,774
- - - 281 340
19,459 132,390 72,911 309,349 751,066
141 - - 67,278 84,803
141 - - 67,278 84,803
- 45 - - 45
- - - 3,514 3,514
- - - 31,138 868,509
- 624,224 - 727,981 3,658,476
(6,586) - (47,079) - (53,665)
(6,586) 624,269 (47,079) 762,633 4,476,879
13,014$ 756,659$ 25,832$ 1,139,260$ 5,312,748$
Comprehensive Annual Financial Report - State of Indiana - 184
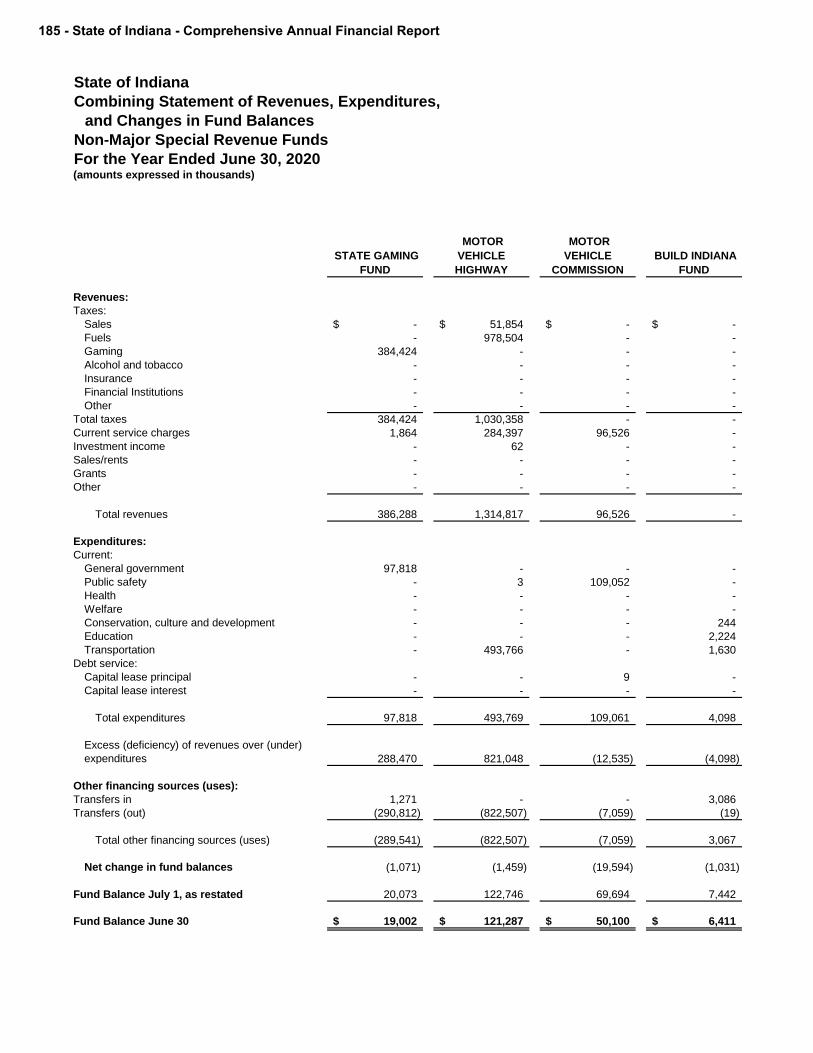
State of Indiana
Combining Statement of Revenues, Expenditures,
and Changes in Fund Balances
Non-Major Special Revenue Funds
For the Year Ended June 30, 2020(amounts expressed in thousands)
STATE GAMING
FUND
MOTOR
VEHICLE
HIGHWAY
MOTOR
VEHICLE
COMMISSION
BUILD INDIANA
FUND
Revenues:
Taxes:
Sales -$ 51,854$ -$ -$
Fuels - 978,504 - -
Gaming 384,424 - - -
Alcohol and tobacco - - - -
Insurance - - - -
Financial Institutions - - - -
Other - - - -
Total taxes 384,424 1,030,358 - -
Current service charges 1,864 284,397 96,526 -
Investment income - 62 - -
Sales/rents - - - -
Grants - - - -
Other - - - -
Total revenues 386,288 1,314,817 96,526 -
Expenditures:
Current:
General government 97,818 - - -
Public safety - 3 109,052 -
Health - - - -
Welfare - - - -
Conservation, culture and development - - - 244
Education - - - 2,224
Transportation - 493,766 - 1,630
Debt service:
Capital lease principal - - 9 -
Capital lease interest - - - -
Total expenditures 97,818 493,769 109,061 4,098
Excess (deficiency) of revenues over (under)
expenditures 288,470 821,048 (12,535) (4,098)
Other financing sources (uses):
Transfers in 1,271 - - 3,086
Transfers (out) (290,812) (822,507) (7,059) (19)
Total other financing sources (uses) (289,541) (822,507) (7,059) 3,067
Net change in fund balances (1,071) (1,459) (19,594) (1,031)
Fund Balance July 1, as restated 20,073 122,746 69,694 7,442
Fund Balance June 30 19,002$ 121,287$ 50,100$ 6,411$
185 - State of Indiana - Comprehensive Annual Financial Report

STATE
HIGHWAY FUND
MAJOR MOVES
CONSTRUCTION
FUND
INDIANA CHECK-
UP PLAN
FUND 6000
PROGRAMS
PATIENTS
COMPENSATION
FUND
9,144$ -$ -$ 2,464$ -$
265,698 - - - -
- - - 211 -
- - 108,847 - -
- - - - -
- - - 142,687 -
- - - 1,367 -
274,842 - 108,847 146,729 -
41,038 300,000 261,691 158,627 133,202
92 19,047 - 1,147 7,553
2,848 - - 5,582 -
130 - - 19,424 -
87,552 - - 12,254 -
406,502 319,047 370,538 343,763 140,755
- - - 142,437 -
- - - 36,621 112,697
- - 3,081 1,829 -
- - - 9,219 -
- 3,282 - 6,621 -
- - - 5,908 -
402,126 260,661 - 2,198 -
65,152 - - 632 -
41,763 - - 103 -
509,041 263,943 3,081 205,568 112,697
(102,539) 55,104 367,457 138,195 28,058
861,757 48,255 8,214 50,192 -
(1,026,115) (54,202) (336,562) (127,976) -
(164,358) (5,947) (328,348) (77,784) -
(266,897) 49,157 39,109 60,411 28,058
847,271 698,825 193,458 247,147 254,378
580,374$ 747,982$ 232,567$ 307,558$ 282,436$
continued on next page
Comprehensive Annual Financial Report - State of Indiana - 186

State of Indiana
Combining Statement of Revenues, Expenditures,
and Changes in Fund Balances
Non-Major Special Revenue Funds
For the Year Ended June 30, 2020(amounts expressed in thousands)
ROAD &
STREET,
PRIMARY
HIGHWAY
TOBACCO
SETTLEMENT
FUND
COMMON
SCHOOL FUND
US
DEPARTMENT
OF
AGRICULTURE
Revenues:
Taxes:
Sales -$ -$ -$ -$
Fuels 123,121 - - -
Gaming - - - -
Alcohol and tobacco - - - -
Insurance - - - -
Financial Institutions - - - -
Other - - - -
Total taxes 123,121 - - -
Current service charges 7,413 130,484 2,180 -
Investment income - 309 987 -
Sales/rents - - - -
Grants - 13 - 1,630,219
Other - - 59 -
Total revenues 130,534 130,806 3,226 1,630,219
Expenditures:
Current:
General government - - 754 633
Public safety - - - 4,414
Health - 72,996 - 145,455
Welfare - 12,487 - 1,190,387
Conservation, culture and development - - - 2,827
Education - 4,883 - 326,844
Transportation 133,873 - - -
Debt service:
Capital lease principal - - - -
Capital lease interest - - - -
Total expenditures 133,873 90,366 754 1,670,560
Excess (deficiency) of revenues over
expenditures (3,339) 40,440 2,472 (40,341)
Other financing sources (uses):
Transfers in - 5,176 - 86,994
Transfers (out) - (39,296) - (695)
Total other financing sources (uses) - (34,120) - 86,299
Net change in fund balances (3,339) 6,320 2,472 45,958
Fund Balance July 1, as restated 29,552 124,693 587,517 2,752
Fund Balance June 30 26,213$ 131,013$ 589,989$ 48,710$
187 - State of Indiana - Comprehensive Annual Financial Report

US DEPARTMENT
OF LABOR
US DEPARTMENT
OF
TRANSPORTATIO
N
US
DEPARTMENT
OF EDUCATION
OTHER NON-
MAJOR SPECIAL
REVENUE
FUNDS Total
-$ -$ -$ 10,414$ 73,876$
- - - 80,338 1,447,661
- - - 23,691 408,326
- - - 36,287 145,134
- - - 5,084 5,084
- - - - 142,687
- - - 15,529 16,896
- - - 171,343 2,239,664
82 - - 667,597 2,085,101
- - - 4,128 33,325
- - - 9,183 17,613
115,396 1,174,299 717,112 279,957 3,936,550
- 1,867 - 1,462 103,194
115,478 1,176,166 717,112 1,133,670 8,415,447
- 2,827 518 126,158 371,145
6,127 22,879 1,454 258,071 551,318
- 22 - 6,706 230,089
1 - 79,862 67,342 1,359,298
112,394 903 26,119 264,715 417,105
- - 647,854 4,768 992,481
- 1,832,629 - 129,436 3,256,319
127 - - - 65,920
4 - - - 41,870
118,653 1,859,260 755,807 857,196 7,285,545
(3,175) (683,094) (38,695) 276,474 1,129,902
4,323 970,348 43,297 277,781 2,360,694
(556) (251) (12,678) (467,740) (3,186,468)
3,767 970,097 30,619 (189,959) (825,774)
592 287,003 (8,076) 86,515 304,128
(7,178) 337,266 (39,003) 676,118 4,172,751
(6,586)$ 624,269$ (47,079)$ 762,633$ 4,476,879$
Comprehensive Annual Financial Report - State of Indiana - 188

State of Indiana
Combining Balance Sheet
Non-Major Capital Project Funds
June 30, 2020(amounts expressed in thousands)
Post War
Construction
State
Construction
Other Non-Major
Capital Projects
Funds Total
ASSETS
Cash, cash equivalents and investments-
unrestricted 25,399$ 44,672$ 13,888$ 83,959$
Receivables:
Taxes (net of allowance for uncollectible
accounts) - 2,181 - 2,181
Total assets 25,399 46,853 13,888 86,140
Total assets and deferred outflow of
resources 25,399$ 46,853$ 13,888$ 86,140$
LIABILITIES
Accounts payable 519$ 660$ 25$ 1,204$
Salaries and benefits payable - - 133 133
Interfunds services used - - 10 10
Accrued liability for compensated absences-
current - - 6 6
Total liabilities 519 660 174 1,353
FUND BALANCE
Assigned 24,880 46,193 13,714 84,787
Total fund balance 24,880 46,193 13,714 84,787
Total liabilities, deferred inflow of resources,
and fund balance 25,399$ 46,853$ 13,888$ 86,140$
189 - State of Indiana - Comprehensive Annual Financial Report

State of Indiana
Combining Statement of Revenues, Expenditures,
and Changes in Fund Balances
Non-Major Capital Projects Funds
For the Year Ended June 30, 2020(amounts expressed in thousands)
Post War
Construction
State
Construction
Other Non-Major
Capital Projects
Funds Total
Revenues:
Taxes:
Alcohol and tobacco -$ 23,313$ -$ 23,313$
Total taxes - 23,313 - 23,313
Current service charges - 1,825 2,701 4,526
Sales/rents - - 22 22
Grants - - 1,557 1,557
Other - - 17 17
Total revenues - 25,138 4,297 29,435
Expenditures:
Capital outlay 13,221 3,613 6,038 22,872
Total expenditures 13,221 3,613 6,038 22,872
Excess (deficiency) of revenues over (under)
expenditures (13,221) 21,525 (1,741) 6,563
Other financing sources (uses):
Transfers in - 24,668 2,004 26,672
Transfers (out) (23,328) - - (23,328)
Total other financing sources (uses) (23,328) 24,668 2,004 3,344
Net change in fund balances (36,549) 46,193 263 9,907
Fund Balance July 1, as restated 61,429 - 13,451 74,880
Fund Balance June 30 24,880$ 46,193$ 13,714$ 84,787$
Comprehensive Annual Financial Report - State of Indiana - 190

State of Indiana
Combining Balance Sheet
Non-Major Permanent Funds
June 30, 2020(amounts expressed in thousands)
Next
Level/Generation
Trust Fund
Other Non-Major
Permanent Funds Total
ASSETS
Cash, cash equivalents and investments-
unrestricted 600,024$ 3,244$ 603,268$
Interest 2 3 5
Other 14 - 14
Total assets 600,040 3,247 603,287
Total assets and deferred outflow of
resources 600,040$ 3,247$ 603,287$
LIABILITIES
Other payables 14$ -$ 14$
Total liabilities 14 - 14
FUND BALANCE
Nonspendable 500,000 2,835 502,835
Committed 100,026 412 100,438
Total fund balance 600,026 3,247 603,273
Total liabilities, deferred inflow of
resources, and fund balance 600,040$ 3,247$ 603,287$
191 - State of Indiana - Comprehensive Annual Financial Report

State of Indiana
Combining Statement of Revenues, Expenditures,
and Changes in Fund Balances
Non-Major Permanent Funds
For the Year Ended June 30, 2020(amounts expressed in thousands)
Next
Level/Generation
Trust Fund
Other Non-Major
Permanent
Funds Total
Revenues:
Investment income 25,250$ 97$ 25,347$
Total revenues 25,250 97 25,347
Expenditures:
Current:
General government - 25 25
Conservation, culture and development - 82 82
Transportation 1,134 - 1,134
Total expenditures 1,134 107 1,241
Excess (deficiency) of revenues over (under)
expenditures 24,116 (10) 24,106
Net change in fund balances 24,116 (10) 24,106
Fund Balance July 1, as restated 575,910 3,257 579,167
Fund Balance June 30 600,026$ 3,247$ 603,273$
Comprehensive Annual Financial Report - State of Indiana - 192

State of Indiana
Combining Schedule of Revenues, Expenditures and
Changes in Fund Balances - Budget and Actual
(Budgetary Basis)
For the Year Ended June 30, 2020(amounts expressed in thousands)
State Gaming Fund Motor Vehicle Highway Fund
Variance to
Budget Actual Final Budget
Original Final
Revenues:
Taxes:
Sales -$ -$ -$ -$
Fuels - - - -
Gaming 546,045 546,045 385,437 (160,608)
Alcohol and tobacco - - - -
Insurance - - - -
Financial institutions - - - -
Other - - - -
Total taxes 546,045 546,045 385,437 (160,608)
Current service charges 3,390 3,390 1,904 (1,486)
Investment income - - - -
Sales/rents - - - -
Grants - - - -
Other - - - -
Total revenues 549,435 549,435 387,341 (162,094)
Expenditures:
Current:
General government 611 423,390 97,857 325,533
Public safety - - - -
Health - - - -
Welfare - - - -
Conservation, culture and development - - - -
Education - - - -
Transportation - - - -
Debt service:
Capital lease principal - - - -
Capital lease interest - - - -
Total expenditures 611 423,390 97,857 325,533
Excess of revenues over (under) expenditures 548,824 126,045 289,484 (163,439)
Other financing sources (uses):
Total other financing sources (uses) (289,541) (289,541) (289,541) -
Net change in fund balances 259,283$ (163,496)$ (57) 163,439$
Fund balances July 1, as restated 1,255
Fund balances June 30 1,198$
193 - State of Indiana - Comprehensive Annual Financial Report
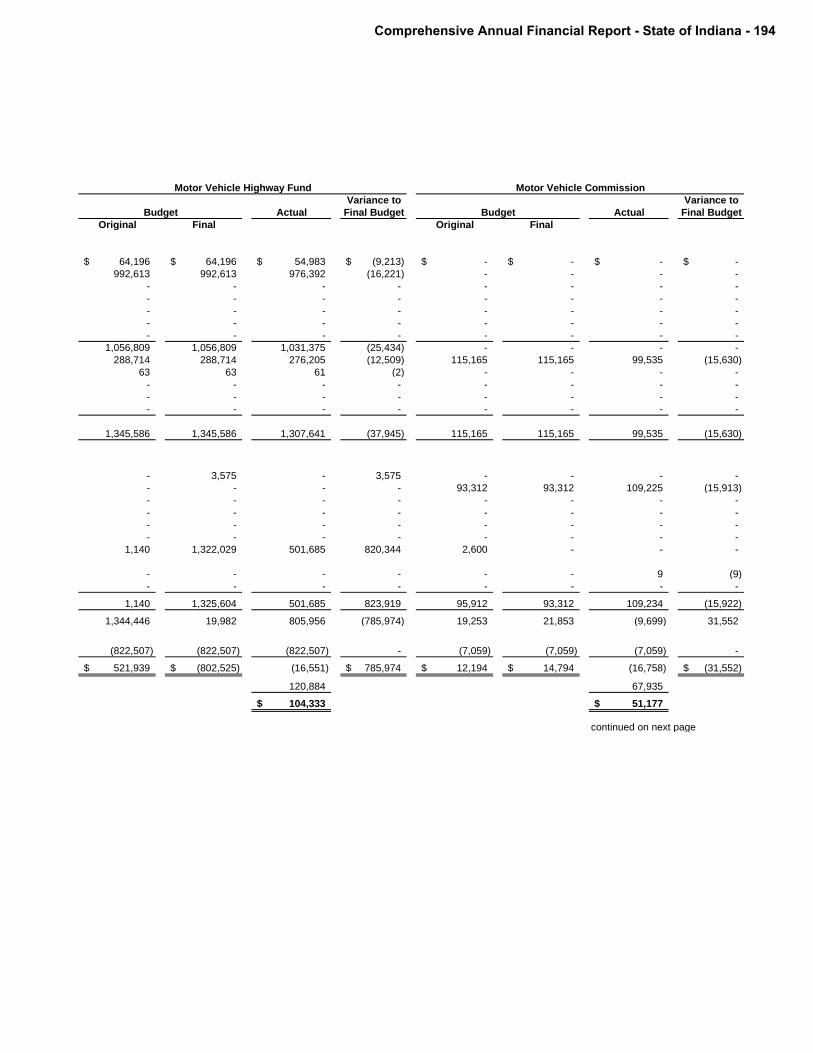
Motor Vehicle Highway Fund Motor Vehicle Commission Build Indiana Fund
Variance to Variance to
Budget Actual Final Budget Budget Actual Final Budget
Original Final Original Final
64,196$ 64,196$ 54,983$ (9,213)$ -$ -$ -$ -$
992,613 992,613 976,392 (16,221) - - - -
- - - - - - - -
- - - - - - - -
- - - - - - - -
- - - - - - - -
- - - - - - - -
1,056,809 1,056,809 1,031,375 (25,434) - - - -
288,714 288,714 276,205 (12,509) 115,165 115,165 99,535 (15,630)
63 63 61 (2) - - - -
- - - - - - - -
- - - - - - - -
- - - - - - - -
1,345,586 1,345,586 1,307,641 (37,945) 115,165 115,165 99,535 (15,630)
- 3,575 - 3,575 - - - -
- - - - 93,312 93,312 109,225 (15,913)
- - - - - - - -
- - - - - - - -
- - - - - - - -
- - - - - - - -
1,140 1,322,029 501,685 820,344 2,600 - - -
- - - - - - 9 (9)
- - - - - - - -
1,140 1,325,604 501,685 823,919 95,912 93,312 109,234 (15,922)
1,344,446 19,982 805,956 (785,974) 19,253 21,853 (9,699) 31,552
(822,507) (822,507) (822,507) - (7,059) (7,059) (7,059) -
521,939$ (802,525)$ (16,551) 785,974$ 12,194$ 14,794$ (16,758) (31,552)$
120,884 67,935
104,333$ 51,177$
continued on next page
Comprehensive Annual Financial Report - State of Indiana - 194
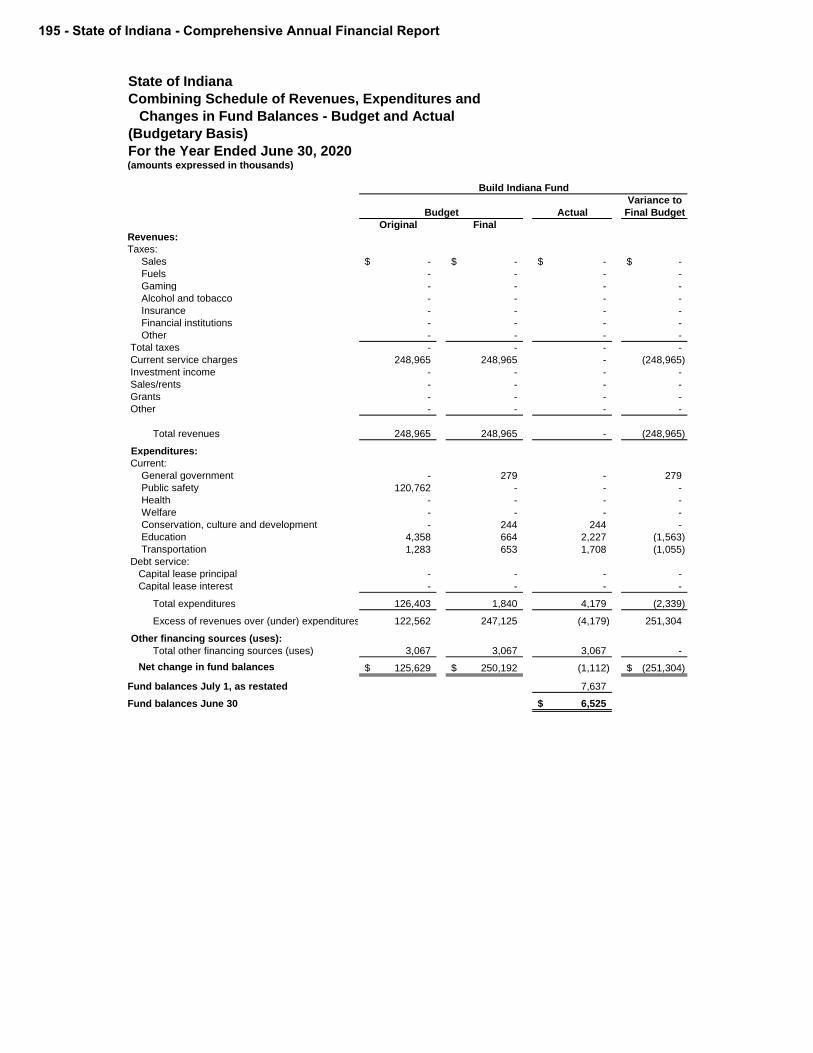
State of Indiana
Combining Schedule of Revenues, Expenditures and
Changes in Fund Balances - Budget and Actual
(Budgetary Basis)
For the Year Ended June 30, 2020(amounts expressed in thousands)
Build Indiana Fund State Highway Fund
Variance to
Budget Actual Final Budget
Original Final
Revenues:
Taxes:
Sales -$ -$ -$ -$
Fuels - - - -
Gaming - - - -
Alcohol and tobacco - - - -
Insurance - - - -
Financial institutions - - - -
Other - - - -
Total taxes - - - -
Current service charges 248,965 248,965 - (248,965)
Investment income - - - -
Sales/rents - - - -
Grants - - - -
Other - - - -
Total revenues 248,965 248,965 - (248,965)
Expenditures:
Current:
General government - 279 - 279
Public safety 120,762 - - -
Health - - - -
Welfare - - - -
Conservation, culture and development - 244 244 -
Education 4,358 664 2,227 (1,563)
Transportation 1,283 653 1,708 (1,055)
Debt service:
Capital lease principal - - - -
Capital lease interest - - - -
Total expenditures 126,403 1,840 4,179 (2,339)
Excess of revenues over (under) expenditures 122,562 247,125 (4,179) 251,304
Other financing sources (uses):
Total other financing sources (uses) 3,067 3,067 3,067 -
Net change in fund balances 125,629$ 250,192$ (1,112) (251,304)$
Fund balances July 1, as restated 7,637
Fund balances June 30 6,525$
195 - State of Indiana - Comprehensive Annual Financial Report

State Highway Fund Major Moves Construction Fund Indiana Check-Up Plan
Variance to Variance to
Budget Actual Final Budget Budget Actual Final Budget
Original Final Original Final
-$ -$ 8,244$ 8,244$ -$ -$ -$ -$
279,661 279,661 266,889 (12,772) - - - -
- - - - - - - -
- - - - - - - -
- - - - - - - -
- - - - - - - -
- - - - - - - -
279,661 279,661 275,133 (4,528) - - - -
41,908 41,908 41,028 (880) 400,000 400,000 300,000 (100,000)
114 114 92 (22) 11,421 11,421 16,522 5,101
2,510 2,510 2,714 204 - - - -
- - 130 130 - - - -
64,584 64,584 87,543 22,959 - - - -
388,777 388,777 406,640 17,863 411,421 411,421 316,522 (94,899)
- 10 - 10 18,922 - - -
- - - - - - - -
- - - - - - - -
- - - - - - - -
- - - - 19,690 32,700 5,024 27,676
- - - - - - - -
126,309 463,492 400,175 63,317 1,316,937 441,905 251,669 190,236
- - 65,152 (65,152) - - - -
- - 41,763 (41,763) - - - -
126,309 463,502 507,090 (43,588) 1,355,549 474,605 256,693 217,912
262,468 (74,725) (100,450) 25,725 (944,128) (63,184) 59,829 (123,013)
(164,358) (164,358) (164,358) - (5,947) (5,947) (5,947) -
98,110$ (239,083)$ (264,808) (25,725)$ (950,075)$ (69,131)$ 53,882 123,013$
872,006 705,242
607,198$ 759,124$
continued on next page
Comprehensive Annual Financial Report - State of Indiana - 196
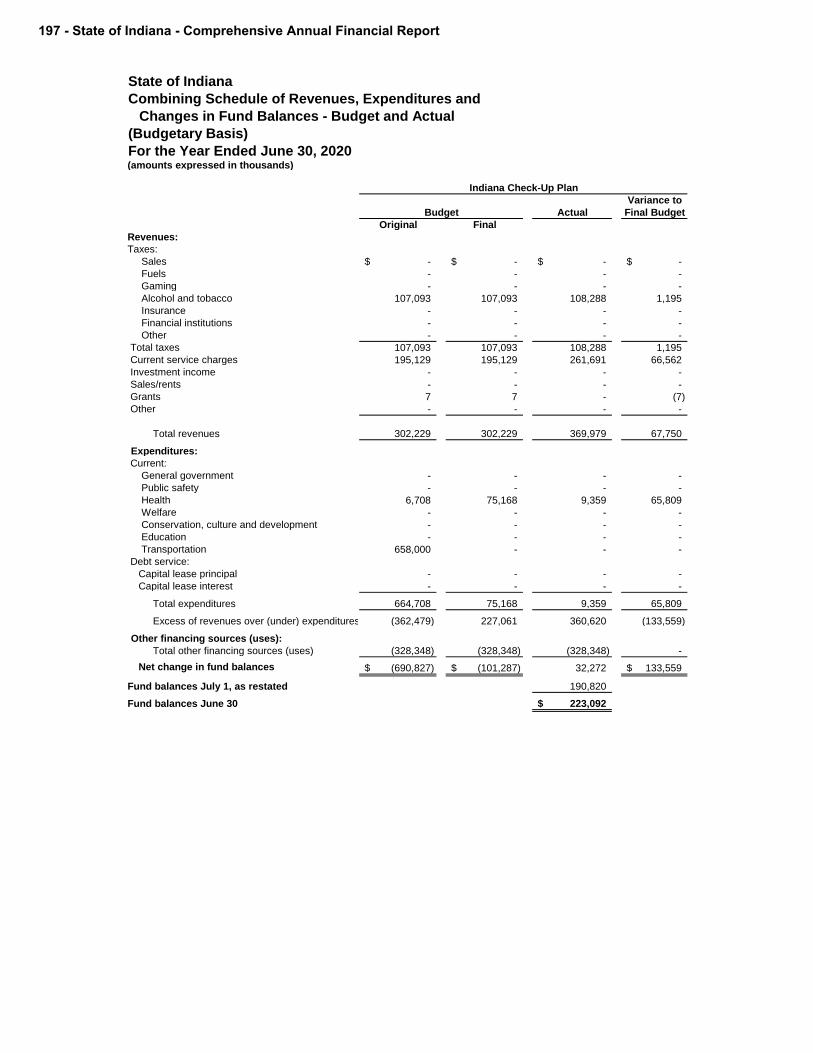
State of Indiana
Combining Schedule of Revenues, Expenditures and
Changes in Fund Balances - Budget and Actual
(Budgetary Basis)
For the Year Ended June 30, 2020(amounts expressed in thousands)
Indiana Check-Up Plan Fund 6000 Programs
Variance to
Budget Actual Final Budget
Original Final
Revenues:
Taxes:
Sales -$ -$ -$ -$
Fuels - - - -
Gaming - - - -
Alcohol and tobacco 107,093 107,093 108,288 1,195
Insurance - - - -
Financial institutions - - - -
Other - - - -
Total taxes 107,093 107,093 108,288 1,195
Current service charges 195,129 195,129 261,691 66,562
Investment income - - - -
Sales/rents - - - -
Grants 7 7 - (7)
Other - - - -
Total revenues 302,229 302,229 369,979 67,750
Expenditures:
Current:
General government - - - -
Public safety - - - -
Health 6,708 75,168 9,359 65,809
Welfare - - - -
Conservation, culture and development - - - -
Education - - - -
Transportation 658,000 - - -
Debt service:
Capital lease principal - - - -
Capital lease interest - - - -
Total expenditures 664,708 75,168 9,359 65,809
Excess of revenues over (under) expenditures (362,479) 227,061 360,620 (133,559)
Other financing sources (uses):
Total other financing sources (uses) (328,348) (328,348) (328,348) -
Net change in fund balances (690,827)$ (101,287)$ 32,272 133,559$
Fund balances July 1, as restated 190,820
Fund balances June 30 223,092$
197 - State of Indiana - Comprehensive Annual Financial Report

Fund 6000 Programs Patients Compensation Fund Road and Street, Primary Highway
Variance to Variance to
Budget Actual Final Budget Budget Actual Final Budget
Original Final Original Final
2,368$ 2,368$ 2,433$ 65$ -$ -$ -$ -$
- - - - - - - -
227 227 211 (16) - - - -
- - - - - - - -
- - - - - - - -
165,087 165,087 131,507 (33,580) - - - -
1,424 1,424 1,289 (135) - - - -
169,106 169,106 135,440 (33,666) - - - -
130,924 130,924 150,376 19,452 160,972 160,972 129,902 (31,070)
1,102 1,102 1,024 (78) 3,071 3,071 5,970 2,899
5,280 5,280 5,425 145 - - - -
17,424 17,424 19,424 2,000 - - - -
5,601 5,601 12,410 6,809 - - - -
329,437 329,437 324,099 (5,338) 164,043 164,043 135,872 (28,171)
3,775 320,037 141,801 178,236 14,588 - - -
33,064 80,367 38,530 41,837 408 389,133 109,546 279,587
115,834 4,427 1,867 2,560 64 - - -
5,456 12,072 8,144 3,928 - - - -
2,584 21,710 6,571 15,139 - - - -
1,442 11,888 5,842 6,046 - - - -
4,088 1,858 2,198 (340) 20 - - -
- - 632 (632) - - - -
- - 103 (103) - - - -
166,243 452,359 205,688 246,671 15,080 389,133 109,546 279,587
163,194 (122,922) 118,411 (241,333) 148,963 (225,090) 26,326 (251,416)
(77,784) (77,784) (77,784) - - - - -
85,410$ (200,706)$ 40,627 241,333$ 148,963$ (225,090)$ 26,326 251,416$
244,820 257,530
285,447$ 283,856$
continued on next page
Comprehensive Annual Financial Report - State of Indiana - 198

State of Indiana
Combining Schedule of Revenues, Expenditures and
Changes in Fund Balances - Budget and Actual
(Budgetary Basis)
For the Year Ended June 30, 2020(amounts expressed in thousands)
Road and Street, Primary Highway Tobacco Settlement Fund
Variance to
Budget Actual Final Budget
Original Final
Revenues:
Taxes:
Sales -$ -$ -$ -$
Fuels 119,225 119,225 123,188 3,963
Gaming - - - -
Alcohol and tobacco - - - -
Insurance - - - -
Financial institutions - - - -
Other - - - -
Total taxes 119,225 119,225 123,188 3,963
Current service charges 7,460 7,460 7,229 (231)
Investment income - - - -
Sales/rents - - - -
Grants - - - -
Other - - - -
Total revenues 126,685 126,685 130,417 3,732
Expenditures:
Current:
General government - - - -
Public safety 2,529 - - -
Health - - - -
Welfare - - - -
Conservation, culture and development - - - -
Education - - - -
Transportation - 525,760 135,891 389,869
Debt service:
Capital lease principal - - - -
Capital lease interest - - - -
Total expenditures 2,529 525,760 135,891 389,869
Excess of revenues over (under) expenditures 124,156 (399,075) (5,474) (393,601)
Other financing sources (uses):
Total other financing sources (uses) - - - -
Net change in fund balances 124,156$ (399,075)$ (5,474) 393,601$
Fund balances July 1, as restated 27,843
Fund balances June 30 22,369$
199 - State of Indiana - Comprehensive Annual Financial Report
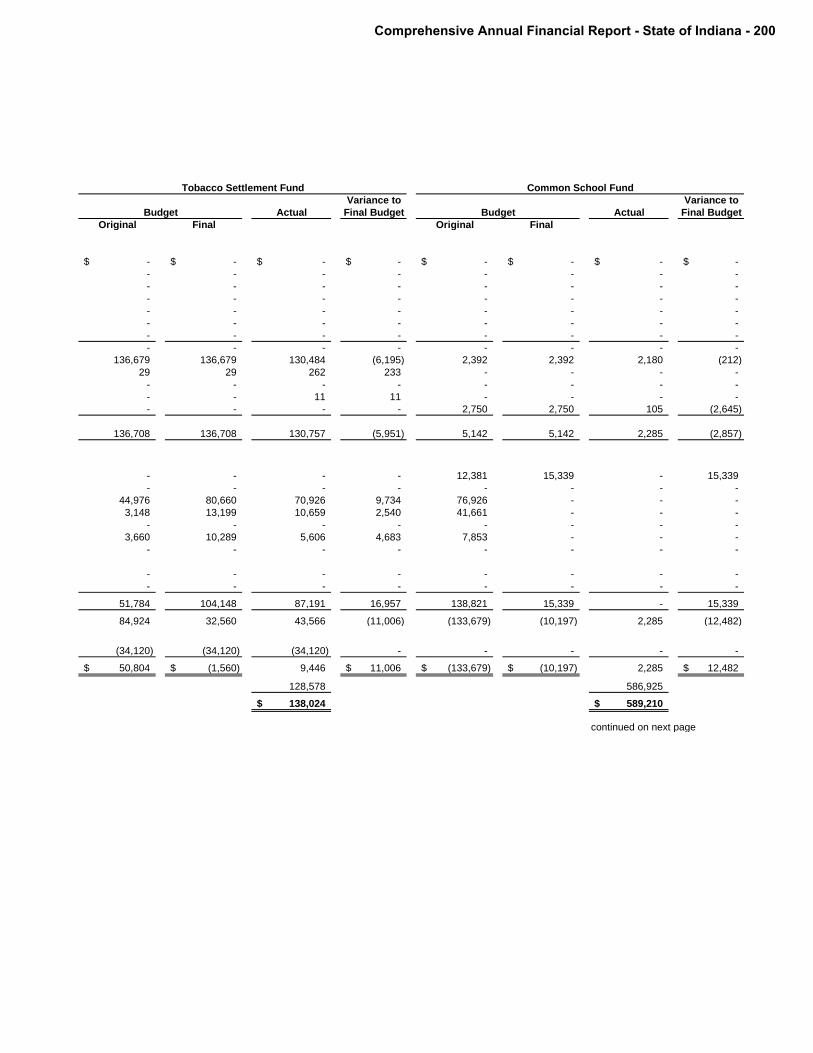
Tobacco Settlement Fund Common School Fund U.S. Department of Agriculture
Variance to Variance to
Budget Actual Final Budget Budget Actual Final Budget
Original Final Original Final
-$ -$ -$ -$ -$ -$ -$ -$
- - - - - - - -
- - - - - - - -
- - - - - - - -
- - - - - - - -
- - - - - - - -
- - - - - - - -
- - - - - - - -
136,679 136,679 130,484 (6,195) 2,392 2,392 2,180 (212)
29 29 262 233 - - - -
- - - - - - - -
- - 11 11 - - - -
- - - - 2,750 2,750 105 (2,645)
136,708 136,708 130,757 (5,951) 5,142 5,142 2,285 (2,857)
- - - - 12,381 15,339 - 15,339
- - - - - - - -
44,976 80,660 70,926 9,734 76,926 - - -
3,148 13,199 10,659 2,540 41,661 - - -
- - - - - - - -
3,660 10,289 5,606 4,683 7,853 - - -
- - - - - - - -
- - - - - - - -
- - - - - - - -
51,784 104,148 87,191 16,957 138,821 15,339 - 15,339
84,924 32,560 43,566 (11,006) (133,679) (10,197) 2,285 (12,482)
(34,120) (34,120) (34,120) - - - - -
50,804$ (1,560)$ 9,446 11,006$ (133,679)$ (10,197)$ 2,285 12,482$
128,578 586,925
138,024$ 589,210$
continued on next page
Comprehensive Annual Financial Report - State of Indiana - 200

State of Indiana
Combining Schedule of Revenues, Expenditures and
Changes in Fund Balances - Budget and Actual
(Budgetary Basis)
For the Year Ended June 30, 2020(amounts expressed in thousands)
U.S. Department of Agriculture U.S. Department of Labor
Variance to
Budget Actual Final Budget
Original Final
Revenues:
Taxes:
Sales -$ -$ -$ -$
Fuels - - - -
Gaming - - - -
Alcohol and tobacco - - - -
Insurance - - - -
Financial institutions - - - -
Other - - - -
Total taxes - - - -
Current service charges 51 51 - (51)
Investment income - - - -
Sales/rents - - - -
Grants 1,451,315 1,451,315 1,629,553 178,238
Other 216 216 - (216)
Total revenues 1,451,582 1,451,582 1,629,553 177,971
Expenditures:
Current:
General government 1,382 10,207 652 9,555
Public safety 8 5,895 4,382 1,513
Health 17,602 267,887 145,917 121,970
Welfare 13,294 3,117,113 1,190,561 1,926,552
Conservation, culture and development 631 10,992 2,845 8,147
Education 1,680 570,928 344,231 226,697
Transportation - - - -
Debt service:
Capital lease principal - - - -
Capital lease interest - - - -
Total expenditures 34,597 3,983,022 1,688,588 2,294,434
Excess of revenues over (under) expenditures 1,416,985 (2,531,440) (59,035) (2,472,405)
Other financing sources (uses):
Total other financing sources (uses) 86,299 86,299 86,299 -
Net change in fund balances 1,503,284$ (2,445,141)$ 27,264 2,472,405$
Fund balances July 1, as restated 25,881
Fund balances June 30 53,145$
201 - State of Indiana - Comprehensive Annual Financial Report

U.S. Department of Agriculture U.S. Department of Labor U.S. Department of Transportation U.S. Department of Education
Variance to Variance to
Budget Actual Final Budget Budget Actual Final Budget
Original Final Original Final
-$ -$ -$ -$ -$ -$ -$ -$
- - - - - - - -
- - - - - - - -
- - - - - - - -
- - - - - - - -
- - - - - - - -
- - - - - - - -
- - - - - - - -
96 96 82 (14) - - - -
- - - - - - - -
- - - - - - - -
119,706 119,706 115,537 (4,169) 1,075,734 1,075,734 1,161,268 85,534
- - - - - - 1,867 1,867
119,802 119,802 115,619 (4,183) 1,075,734 1,075,734 1,163,135 87,401
- - - - - 4,600 2,827 1,773
41 11,544 6,111 5,433 9,035 69,574 23,073 46,501
- - - - - 637 22 615
- 3,933 - 3,933 - 13 - 13
30,408 211,712 111,619 100,093 2,777 4,199 1,088 3,111
- 525 - 525 - - - -
- - - - 2,030,052 2,521,488 1,793,409 728,079
- - 127 (127) - - - -
- - 4 (4) - - - -
30,449 227,714 117,861 109,853 2,041,864 2,600,511 1,820,419 780,092
89,353 (107,912) (2,242) (105,670) (966,130) (1,524,777) (657,284) (867,493)
3,767 3,767 3,767 - 970,097 970,097 970,097 -
93,120$ (104,145)$ 1,525 105,670$ 3,967$ (554,680)$ 312,813 867,493$
(2,060) 422,949
(535)$ 735,762$
continued on next page
Comprehensive Annual Financial Report - State of Indiana - 202
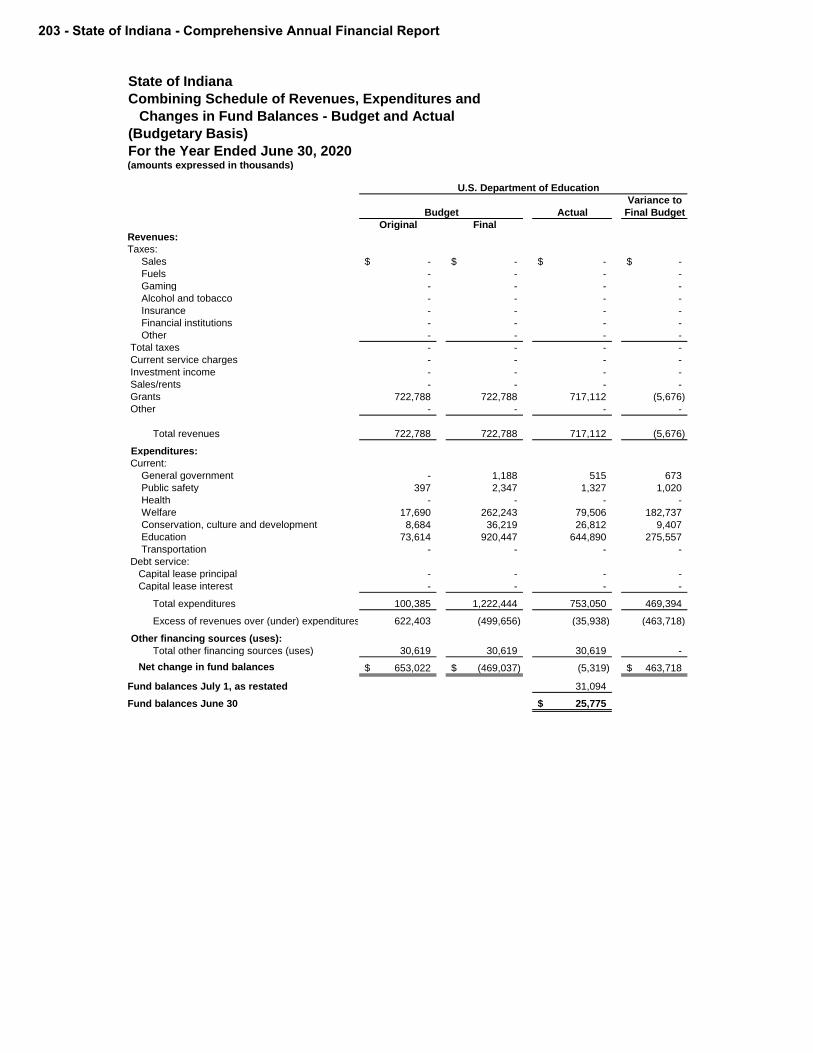
State of Indiana
Combining Schedule of Revenues, Expenditures and
Changes in Fund Balances - Budget and Actual
(Budgetary Basis)
For the Year Ended June 30, 2020(amounts expressed in thousands)
U.S. Department of Education Other Non-Major Special Revenue Funds
Variance to
Budget Actual Final Budget
Original Final
Revenues:
Taxes:
Sales -$ -$ -$ -$
Fuels - - - -
Gaming - - - -
Alcohol and tobacco - - - -
Insurance - - - -
Financial institutions - - - -
Other - - - -
Total taxes - - - -
Current service charges - - - -
Investment income - - - -
Sales/rents - - - -
Grants 722,788 722,788 717,112 (5,676)
Other - - - -
Total revenues 722,788 722,788 717,112 (5,676)
Expenditures:
Current:
General government - 1,188 515 673
Public safety 397 2,347 1,327 1,020
Health - - - -
Welfare 17,690 262,243 79,506 182,737
Conservation, culture and development 8,684 36,219 26,812 9,407
Education 73,614 920,447 644,890 275,557
Transportation - - - -
Debt service:
Capital lease principal - - - -
Capital lease interest - - - -
Total expenditures 100,385 1,222,444 753,050 469,394
Excess of revenues over (under) expenditures 622,403 (499,656) (35,938) (463,718)
Other financing sources (uses):
Total other financing sources (uses) 30,619 30,619 30,619 -
Net change in fund balances 653,022$ (469,037)$ (5,319) 463,718$
Fund balances July 1, as restated 31,094
Fund balances June 30 25,775$
203 - State of Indiana - Comprehensive Annual Financial Report
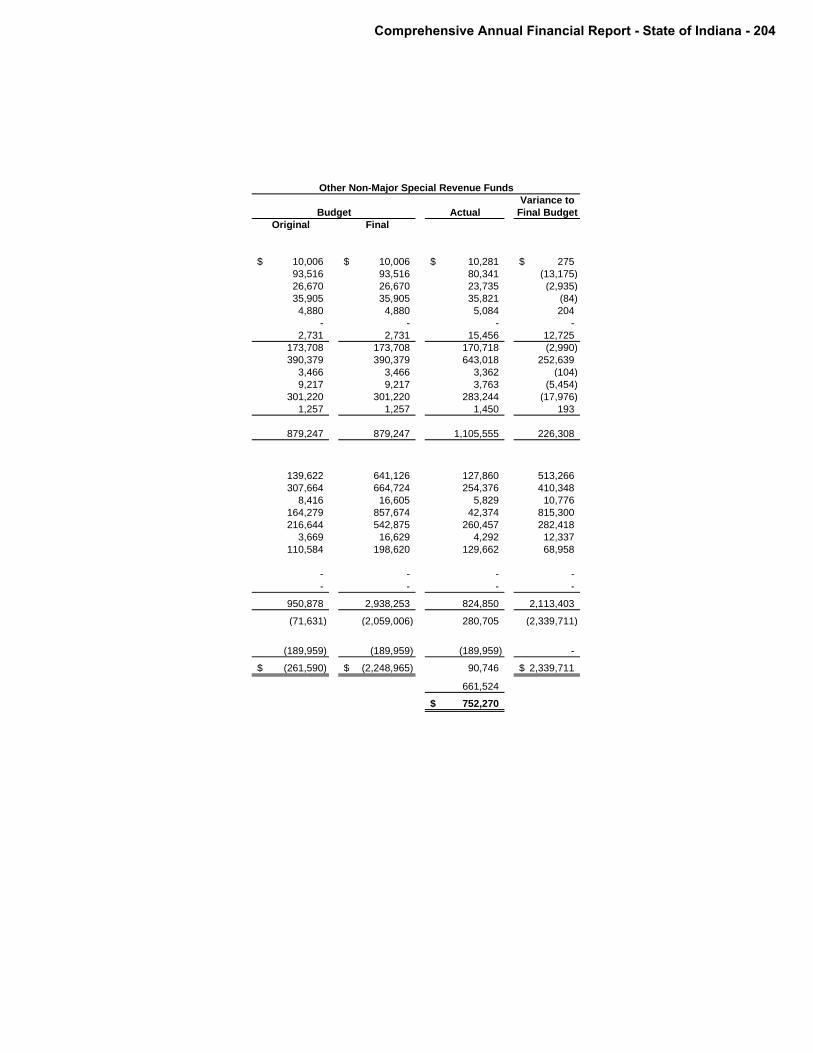
U.S. Department of Education Other Non-Major Special Revenue Funds
Variance to
Budget Actual Final Budget
Original Final
10,006$ 10,006$ 10,281$ 275$
93,516 93,516 80,341 (13,175)
26,670 26,670 23,735 (2,935)
35,905 35,905 35,821 (84)
4,880 4,880 5,084 204
- - - -
2,731 2,731 15,456 12,725
173,708 173,708 170,718 (2,990)
390,379 390,379 643,018 252,639
3,466 3,466 3,362 (104)
9,217 9,217 3,763 (5,454)
301,220 301,220 283,244 (17,976)
1,257 1,257 1,450 193
879,247 879,247 1,105,555 226,308
139,622 641,126 127,860 513,266
307,664 664,724 254,376 410,348
8,416 16,605 5,829 10,776
164,279 857,674 42,374 815,300
216,644 542,875 260,457 282,418
3,669 16,629 4,292 12,337
110,584 198,620 129,662 68,958
- - - -
- - - -
950,878 2,938,253 824,850 2,113,403
(71,631) (2,059,006) 280,705 (2,339,711)
(189,959) (189,959) (189,959) -
(261,590)$ (2,248,965)$ 90,746 2,339,711$
661,524
752,270$
Comprehensive Annual Financial Report - State of Indiana - 204

Budget/GAAP ReconciliationNonmajor Special Revenue Funds
The cash basis of accounting (budgetary basis) is applied to each bud-
get. The budgetary basis differs from GAAP. The major differences
between budgetary (non-GAAP) basis and GAAP basis are:
(amounts expressed in thousands) Nonmajor
Special
Revenue
Funds
Net change in fund balances (budgetary basis) 287,112$
Adjustments necessary to convert the results of operations on
a budgetary basis to a GAAP basis are:
Revenues are recorded when earned (GAAP) as opposed to
when cash is received (budgetary) 48,658
Expenditures are recorded when the liability is incurred
(GAAP) as opposed to when payment is made (budgetary) (42,739)
Funds not subject to legally adopted budget 11,098
Net change in fund balances (GAAP basis) 304,128$
205 - State of Indiana - Comprehensive Annual Financial Report

NON-MAJOR PROPRIETARY FUNDS
ENTERPRISE FUNDS Enterprise Funds account for operations established to provide services to the general public in a manner similar to private business enterprises. Cost of providing the goods or services are financed or recovered primarily through fees and user charges. The non-major enterprise funds are as follows:
Residual Malpractice Insurance Authority – IC 34-18-17 created the Residual Malpractice Insurance Authority to make malpractice liability insurance available to those who cannot obtain this coverage through other insurers. The Indiana Department of Insurance is the designated residual malpractice insurance authority per State law. Revenues are from the premiums collected. Inns and Concessions - This fund accounts for the operations of various State Park Inns which provide lodging throughout the year for park tourists, and for the restaurant and concessions at Fort Benjamin Harrison.
Comprehensive Annual Financial Report - State of Indiana - 206

State of Indiana
Combining Statement of Fund Net Position
Non-Major Enterprise Funds
June 30, 2020(amounts expressed in thousands)
Residual Malpractice
Insurance Authority Inns and Concessions Total
Assets
Current assets:
Cash, cash equivalents and investments - unrestricted 72,729$ 14,679$ 87,408$
Receivables:
Accounts 71 162 233
Interest 248 - 248
Inventory - 625 625
Prepaid expenses - 92 92
Other assets 31 - 31
Total current assets 73,079 15,558 88,637
Noncurrent assets:
Capital assets:
Capital assets being depreciated/amortized - 1,052 1,052
less accumulated depreciation/amortization - (670) (670)
Total capital assets, net of depreciation/amortization - 382 382
Total noncurrent assets - 382 382
Total assets 73,079 15,940 89,019
Liabilities
Current liabilities:
Accounts payable - 532 532
Claims payable 1,301 - 1,301
Salaries and benefits payable - 489 489
Accrued liability for compensated absences - 260 260
Unearned revenue 475 4,101 4,576
Other liabilities 27 210 237
Total current liabilities 1,803 5,592 7,395
Noncurrent liabilities:
Accrued liability for compensated absences - 504 504
Claims payable 21,778 - 21,778
Total noncurrent liabilites 21,778 504 22,282
Total liabilities 23,581 6,096 29,677
Net position
Net investment in capital assets - 382 382
Unrestricted (deficit) 49,498 9,462 58,960
Total net position 49,498$ 9,844$ 59,342$
207 - State of Indiana - Comprehensive Annual Financial Report

State of Indiana
Combining Statement of Revenues, Expenses
and Changes in Fund Net Position
Non-Major Enterprise Funds
For the Fiscal Year Ended June 30, 2020(amounts expressed in thousands)
Residual Malpractice
Insurance Authority
Inns and
Concessions Total
Operating revenues:
Sales/rents/premiums 638$ 23,219$ 23,857$
Other - 228 228
Total operating revenues 638 23,447 24,085
Cost of sales - 5,416 5,416
Gross margin 638 18,031 18,669
Operating expenses:
General and administrative expense 568 16,957 17,525
Claims expense 463 - 463
Depreciation and amortization - 83 83
Other - 32 32
Total operating expenses 1,031 17,072 18,103
Operating income (loss) (393) 959 566
Nonoperating revenues (expenses):
Interest and other investment income 5,873 65 5,938
Total nonoperating revenues (expenses) 5,873 65 5,938
Income before contributions and transfers 5,480 1,024 6,504
Transfers (out) - (394) (394)
Change in net position 5,480 630 6,110
Total net position, July 1, as restated 44,018 9,214 53,232
Total net position, June 30 49,498$ 9,844$ 59,342$
Comprehensive Annual Financial Report - State of Indiana - 208

State of Indiana
Combining Statement of Cash Flows
Non-Major Enterprise Funds
For the Fiscal Year Ended June 30, 2020(amounts expressed in thousands)
Residual
Malpractice
Insurance
Authority
Inns and
Concessions Total
Cash flows from operating activities:
Cash received from customers 754$ 23,454$ 24,208$
Cash paid for general and administrative (549) (17,078) (17,627)
Cash paid to suppliers - (5,321) (5,321)
Cash paid for claims expense (762) - (762)
Net cash provided (used) by operating activities (557) 1,055 498
Cash flows from noncapital financing activities:
Transfers out - (394) (394)
Net cash provided (used) by noncapital financing activities - (394) (394)
Cash flows from capital and related financing activities:
Acquisition/construction of capital assets - (59) (59)
Net cash provided (used) by capital and related financing
activities - (59) (59)
Cash flows from investing activities:
Proceeds from sales of investments 4,501 - 4,501
Purchase of investments (4,106) - (4,106)
Interest income (expense) on investments 1,112 65 1,177
Net cash provided (used) by investing activities 1,507 65 1,572
Net increase (decrease) in cash and cash equivalents 950 667 1,617
Cash and cash equivalents, July 1 2,391 12,877 15,268
Cash and cash equivalents, June 30 3,341$ 13,544$ 16,885$
Reconciliation of cash , cash equivalents and investments:
Cash and cash equivalents unrestricted at end of year 3,341$ 13,544$ 16,885$
Investments unrestricted 69,388 1,135 70,523
Cash, cash equivalents and investments per balance sheet 72,729$ 14,679$ 87,408$
209 - State of Indiana - Comprehensive Annual Financial Report

State of Indiana
Combining Statement of Cash Flows
Non-Major Enterprise Funds
For the Fiscal Year Ended June 30, 2020(amounts expressed in thousands)
Residual
Malpractice
Insurance
Authority
Inns and
Concessions Total
Reconciliation of operating income to net cash provided
(used) by operating activities:
Operating income (loss) (393)$ 959$ 566$
Adjustments to reconcile operating income (loss) to net cash
provided (used) by operating activities:
Depreciation/amortization expense - 83 83
(Increase) decrease in receivables (36) 267 231
(Increase) decrease in inventory - 95 95
(Increase) decrease in prepaid expenses - (31) (31)
Increase (decrease) in claims payable (299) - (299)
Increase (decrease) in accounts payable - 13 13
Increase (decrease) in unearned revenue 146 (259) (113)
Increase (decrease) in salaries payable - (23) (23)
Increase (decrease) in compensated absences - (15) (15)
Increase (decrease) in other payables 25 (34) (9)
Net cash provided (used) by operating activities (557)$ 1,055$ 498$
Comprehensive Annual Financial Report - State of Indiana - 210

211 - State of Indiana - Comprehensive Annual Financial Report
INTERNAL SERVICE FUNDS Internal Service Funds account for the operations of State agencies that supply goods or services to other agencies of governmental units on a cost-reimbursement basis. Institutional Industries - This fund accounts for revenues and expenses incurred from the operation of inmate employment programs. Goods produced or manufactured as a result of such programs are sold to state agencies and political subdivisions of the State as well as to the general public. Administrative Services Revolving – This fund is used to account for the following rotary funds.
Information Technology Services provides telecommunications and data processing services to State agencies. Revenues consist of charges to user agencies.
Motor Pool Rotary Fund accounts for the operation and maintenance of State garages including the servicing and repair of all automotive equipment owned or controlled by the State. Revenues consist of charges to user agencies.
Printing Rotary Fund accounts for the operation of the State Print Shop, which provides printing services to other State agencies. Revenues consist of charges to user agencies. General Services Rotary accounts for postal service charges to agencies. Revenues consist of charges to user agencies. Aviation Rotary Fund accounts for the operation and maintenance of state aircraft. Revenues consist of charges to user agencies.
Self-Insurance Funds - The self-insurance funds consist of the State Police Health Insurance Fund, State Employee Disability Fund, State Employee Health Insurance Fund, and the Conservation and Excise Officers Health Insurance Fund. These funds administer health insurance and disability plans for state employees, state police personnel, and conservation and excise police officers as well as for certain school corporations. State Personnel Department - This fund accounts for revenues and expenses incurred by the Indiana State Personnel Department for providing human resource services to the executive branch of the government. Accounting Centralization - This fund accounts for revenues and expenses incurred by the Indiana State Budget Agency for providing centralized accounting services to some smaller state agencies.
Comprehensive Annual Financial Report - State of Indiana - 212

Sta
te o
f In
dia
na
Co
mb
inin
g S
tate
me
nt
of
Net
Po
sit
ion
Inte
rnal S
erv
ice F
un
ds
Ju
ne 3
0, 2020
(am
ou
nts
exp
ressed
in
th
ou
san
ds)
In
sti
tuti
on
al
Ind
us
trie
s
Ad
min
istr
ati
ve
Se
rvic
es
Re
vo
lvin
g
Sta
te P
olic
e
He
alt
h In
su
ran
ce
Fu
nd
Sta
te E
mp
loy
ee
Dis
ab
ilit
y F
un
d
Sta
te E
mp
loy
ee
He
alt
h In
su
ran
ce
Fu
nd
Co
ns
erv
ati
on
an
d
Ex
cis
e O
ffic
ers
He
alt
h In
su
ran
ce
Fu
nd
Sta
te P
ers
on
ne
l
De
pa
rtm
en
t F
un
d
Ac
co
un
tin
g
Ce
ntr
aliza
tio
n
To
tal
As
se
ts
Cu
rre
nt
asse
ts:
Ca
sh
, ca
sh
eq
uiv
ale
nts
an
d in
ve
stm
en
ts -
un
restr
icte
d2,8
71
$
42,1
62
$
20,9
85
$
17,9
34
$
147,1
88
$
2,8
74
$
895
$
1$
234,9
10
$
Re
ce
iva
ble
s:
Acco
un
ts
3,2
46
1,4
32
1,6
05
1,7
02
17,7
83
260
50
-
26,0
78
Inte
rfu
nd
se
rvic
es p
rovid
ed
532
10,3
60
-
-
-
-
-
-
10,8
92
Inve
nto
ry3,7
86
134
-
-
-
-
-
-
3,9
20
Pre
paid
expenses
-
2,7
65
-
-
-
-
-
-
2,7
65
To
tal cu
rre
nt
asse
ts10,4
35
56,8
53
22,5
90
19,6
36
164,9
71
3,1
34
945
1
278,5
65
No
ncu
rre
nt
asse
ts:
Ca
pita
l a
sse
ts:
Ca
pita
l a
sse
ts n
ot
be
ing
de
pre
cia
ted
/am
ort
ize
d113
-
-
-
-
-
-
-
113
Ca
pita
l a
sse
ts b
ein
g d
ep
recia
ted
/am
ort
ize
d13,4
68
117,2
04
-
-
1,2
80
-
-
-
131,9
52
less a
ccu
mu
late
d d
ep
recia
tio
n/a
mo
rtiz
atio
n(1
0,2
62)
(6
8,4
67)
-
-
(2
67)
-
-
-
(78,9
96)
To
tal ca
pita
l a
sse
ts,
ne
t o
f d
ep
recia
tio
n/a
mo
rtiz
atio
n3,3
19
48,7
37
-
-
1,0
13
-
-
-
53,0
69
To
tal n
on
cu
rre
nt
asse
ts3,3
19
48,7
37
-
-
1,0
13
-
-
-
53,0
69
`
To
tal a
ss
ets
13,7
54
105,5
90
22,5
90
19,6
36
165,9
84
3,1
34
945
1
331,6
34
De
ferr
ed
Ou
tflo
ws
of
Re
so
urc
es
Re
late
d t
o p
en
sio
ns
953
3,1
01
-
-
-
-
803
19
4,8
76
Re
late
d t
o O
PE
B71
232
-
-
-
-
60
1
364
T
ota
l d
efe
rre
d o
utf
low
s o
f re
so
urc
es
1,0
24
3,3
33
-
-
-
-
863
20
5,2
40
Lia
bilit
ies
Cu
rre
nt
liab
ilitie
s:
Acco
un
ts p
aya
ble
3,1
21
-
3,9
34
4,1
94
40,3
98
740
76
-
52,4
63
Sala
ries a
nd b
enefits
paya
ble
402
1,8
45
-
-
66
-
490
10
2,8
13
Accru
ed
lia
bili
ty f
or
co
mp
en
sa
ted
ab
se
nce
s218
1,8
66
-
-
37
-
355
23
2,4
99
Un
ea
rne
d r
eve
nu
e4
44
-
-
-
-
-
-
48
Oth
er
liab
ilitie
s5
-
-
-
-
-
-
-
5
To
tal cu
rre
nt
liab
ilitie
s3,7
50
3,7
55
3,9
34
4,1
94
40,5
01
740
921
33
57,8
28
No
ncu
rre
nt
liab
ilitie
s:
Accru
ed
lia
bili
ty f
or
co
mp
en
sa
ted
ab
se
nce
s352
3,1
08
-
-
59
-
559
34
4,1
12
Ne
t p
en
sio
n lia
bili
ty4,3
66
14,2
10
-
-
-
-
3,6
81
86
22,3
43
OP
EB
Lia
bili
ty57
186
-
-
-
-
48
1
292
To
tal n
on
cu
rre
nt
liab
ilitie
s4,7
75
17,5
04
-
-
59
-
4,2
88
121
26,7
47
To
tal lia
bilit
ies
8,5
25
21,2
59
3,9
34
4,1
94
40,5
60
740
5,2
09
154
84,5
75
De
ferr
ed
In
flo
ws
of
Re
so
urc
es
R
ela
ted
to
pe
nsio
ns
697
2,2
68
-
-
-
-
588
14
3,5
67
R
ela
ted
to
OP
EB
24
77
-
-
-
-
20
-
121
T
ota
l d
efe
rre
d in
flo
ws
of
res
ou
rce
s721
2,3
45
-
-
-
-
608
14
3,6
88
Ne
t p
os
itio
n
Ne
t in
ve
stm
en
t in
ca
pita
l a
sse
ts3,3
19
48,7
37
-
-
1,0
13
-
-
-
53,0
69
Un
restr
icte
d (
de
ficit)
2,2
13
36,5
82
18,6
56
15,4
42
124,4
11
2,3
94
(4,0
09)
(147)
195,5
42
To
tal n
et
po
sitio
n5,5
32
$
85,3
19
$
18,6
56
$
15,4
42
$
125,4
24
$
2,3
94
$
(4,0
09)
$
(147)
$
248,6
11
$
213 - State of Indiana - Comprehensive Annual Financial Report

Sta
te o
f In
dia
na
Co
mb
inin
g S
tate
men
t o
f R
even
ues,
Exp
en
ses
an
d C
han
ges i
n F
un
d N
et
Po
sit
ion
Inte
rnal
Serv
ice F
un
ds
Fo
r th
e F
iscal
Year
En
ded
Ju
ne 3
0,
2020
(am
ou
nts
exp
ress
ed
in
th
ou
san
ds
)
In
sti
tuti
on
al
Ind
us
trie
s
Ad
min
istr
ati
ve
Se
rvic
es
Re
vo
lvin
g
Sta
te P
olic
e
He
alt
h In
su
ran
ce
Fu
nd
Sta
te E
mp
loy
ee
Dis
ab
ilit
y F
un
d
Sta
te E
mp
loy
ee
He
alt
h In
su
ran
ce
Fu
nd
Co
ns
erv
ati
on
an
d
Ex
cis
e O
ffic
ers
He
alt
h In
su
ran
ce
Fu
nd
Sta
te P
ers
on
ne
l
De
pa
rtm
en
t F
un
d
Ac
co
un
tin
g
Ce
ntr
aliza
tio
n
To
tal
Op
era
tin
g r
eve
nu
es:
Sa
les/r
ents
/pre
miu
ms
38,3
18
$
1
31
,994
$
37,9
81
$
2
1,0
17
$
3
86
,710
$
5,5
42
$
-$
-
$
621
,562
$
Ch
arg
es f
or
se
rvic
es
-
75
-
-
-
-
1
1,2
01
269
11,5
45
Oth
er
-
10
-
1,0
58
1,4
19
-
-
-
2
,487
To
tal o
pe
ratin
g r
eve
nu
es
38,3
18
1
32
,079
37,9
81
2
2,0
75
3
88
,129
5,5
42
11,2
01
269
635
,594
Co
st
of
sa
les
20,2
30
1
,956
-
-
-
-
-
-
22,1
86
Gro
ss m
arg
in1
8,0
88
1
30
,123
37,9
81
2
2,0
75
3
88
,129
5,5
42
11,2
01
269
613
,408
Op
era
tin
g e
xp
en
ses
:
Ge
ne
ral a
nd
adm
inis
tra
tive
expe
nse
15,7
49
1
25
,036
2,0
60
735
20,5
54
930
12,8
41
207
178
,112
He
alth
/ d
isa
bili
ty b
en
efit
paym
ents
-
-
25,1
37
1
5,6
90
3
37
,710
3,1
25
-
-
381
,662
De
pre
cia
tio
n a
nd
am
ort
iza
tio
n315
25,0
24
-
-
41
-
-
-
25,3
80
To
tal o
pe
ratin
g e
xpe
nse
s1
6,0
64
1
50
,060
27,1
97
1
6,4
25
3
58
,305
4,0
55
12,8
41
207
585
,154
Op
era
tin
g in
com
e (
loss)
2,0
24
(19,9
37
)
10,7
84
5
,650
29,8
24
1
,487
(1,6
40
)
62
2
8,2
54
No
no
pe
rati
ng
re
ve
nu
es (
exp
en
ses
):
Inte
rest
and
oth
er
inve
stm
ent
incom
e2
-
-
-
-
-
-
-
2
Ga
in (
Loss)
on d
isp
ositio
n o
f a
ssets
1
798
-
-
-
-
-
-
799
Co
ntr
ibutio
ns t
o o
ther
poste
mp
loym
ent
ben
efits
-
-
(6,0
51
)
(3
62
)
(3,4
30
)
(1
,047
)
-
-
(1
0,8
90
)
To
tal n
on
op
era
tin
g r
eve
nu
es (
expe
nse
s)
3
798
(6,0
51
)
(3
62
)
(3,4
30
)
(1
,047
)
-
-
(1
0,0
89
)
Incom
e b
efo
re c
ontr
ibutio
ns a
nd
tra
nsfe
rs2
,027
(19,1
39
)
4,7
33
5,2
88
26,3
94
440
(1,6
40
)
62
1
8,1
65
Ca
pita
l co
ntr
ibutio
ns
-
2
1,2
15
-
-
-
-
-
-
2
1,2
15
Tra
nsfe
rs in
-
324
-
-
-
-
-
-
324
Tra
nsfe
rs (
out)
(3,5
05
)
(8
33
)
-
-
-
-
-
-
(4,3
38
)
Incom
e b
efo
re s
pecia
l ite
m(3
,505
)
2
0,7
06
-
-
-
-
-
-
1
7,2
01
Ch
an
ge
in
ne
t p
os
itio
n(1
,478
)
1
,567
4,7
33
5,2
88
26,3
94
440
(1,6
40
)
62
3
5,3
66
To
tal
ne
t p
os
itio
n,
Ju
ly 1
, a
s r
esta
ted
7,0
10
83,7
52
1
3,9
23
1
0,1
54
9
9,0
30
1
,954
(2,3
69
)
(2
09
)
213
,245
To
tal
ne
t p
os
itio
n,
Ju
ne
30
5,5
32
$
85,3
19
$
1
8,6
56
$
1
5,4
42
$
1
25
,424
$
2,3
94
$
(4,0
09
)$
(1
47
)$
248
,611
$
Comprehensive Annual Financial Report - State of Indiana - 214

Sta
te o
f In
dia
na
Co
mb
inin
g S
tate
me
nt
of
Cas
h F
low
s
Inte
rnal S
erv
ice F
un
ds
Fo
r th
e F
isc
al
Ye
ar
En
de
d J
un
e 3
0,
20
20
(am
ou
nts
exp
ressed
in
th
ou
san
ds)
In
sti
tuti
on
al
Ind
ustr
ies
Ad
min
istr
ati
ve
Serv
ices
Revo
lvin
g
Sta
te P
oli
ce
Healt
h
Insu
ran
ce
Fu
nd
Sta
te
Em
plo
yee
Dis
ab
ilit
y F
un
d
Sta
te
Em
plo
yee
Healt
h
Insu
ran
ce F
un
d
Co
nserv
ati
on
an
d E
xcis
e
Off
icers
Healt
h
Insu
ran
ce F
un
d
Sta
te
Pers
on
nel
Dep
art
men
t
Fu
nd
Acco
un
tin
g
Cen
trali
zati
on
T
ota
l
Cash
flo
ws f
rom
op
era
tin
g a
cti
vit
ies:
Cash r
eceiv
ed f
rom
custo
mers
31,7
84
$
15,7
95
$
37,7
04
$
20,5
11
$
384,7
71
$
5,4
90
$
11,2
28
$
270
$
507,5
53
$
Cash r
eceiv
ed f
rom
inte
rfund s
erv
ices p
rovid
ed
6,0
61
114,9
18
-
-
-
-
-
-
120,9
79
Cash p
aid
for
genera
l and a
dm
inis
trative
(15,5
76)
(1
25,2
14)
(2,0
60)
(735)
(2
0,4
63)
(9
30)
(1
2,2
75)
(2
85)
(1
77,5
38)
Cash p
aid
for
sala
ry/h
ealth/d
isabili
ty b
enefit
paym
ents
-
-
(24,8
37)
(1
5,5
14)
(3
41,4
34)
(3,2
14)
-
-
(384,9
99)
Cash p
aid
to s
upplie
rs(1
8,5
01)
(1
,963)
-
-
-
-
-
-
(20,4
64)
Oth
er
opera
ting
incom
e-
10
-
1,0
58
1,4
19
-
-
-
2,4
87
Net
cash p
rovid
ed (
used)
by o
pera
ting
activitie
s3,7
68
3,5
46
10,8
07
5,3
20
24,2
93
1,3
46
(1,0
47)
(15)
48,0
18
Cash
flo
ws f
rom
no
ncap
ital
fin
an
cin
g a
cti
vit
ies:
Tra
nsfe
rs in
-
324
-
-
-
-
-
-
324
Tra
nsfe
rs o
ut
(3,5
05)
(833)
-
-
-
-
-
-
(4
,338)
Contr
ibutions t
o o
ther
poste
mplo
ym
ent
benefits
-
-
(6,0
51)
(361)
(3
,430)
(1,0
47)
-
-
(10,8
89)
Net
cash p
rovid
ed (
used)
by n
oncapital financin
g
activitie
s(3
,505)
(509)
(6
,051)
(361)
(3
,430)
(1,0
47)
-
-
(14,9
03)
Cash
flo
ws f
rom
cap
ital
an
d r
ela
ted
fin
an
cin
g a
cti
vit
ies:
Acq
uis
itio
n/c
onstr
uction o
f capital assets
(517)
(2
1,5
82)
-
-
-
-
-
-
(2
2,0
99)
Pro
ceeds f
rom
sale
of
assets
1
881
-
-
-
-
-
-
882
Capital contr
ibutions
-
21,2
15
-
-
-
-
-
-
21,2
15
Net
cash p
rovid
ed (
used)
by c
apital and r
ela
ted f
inancin
g
activitie
s(5
16)
514
-
-
-
-
-
-
(2)
Cash
flo
ws f
rom
in
vesti
ng
acti
vit
ies:
Inte
rest
incom
e (
expense)
on investm
ents
2
-
-
-
-
-
-
-
2
Net
cash p
rovid
ed (
used)
by investing
activitie
s2
-
-
-
-
-
-
-
2
Net
incre
ase (
decre
ase)
in c
ash
an
d c
ash
eq
uiv
ale
nts
(251)
3,5
51
4,7
56
4,9
59
20,8
63
299
(1,0
47)
(15)
33,1
15
Cash
an
d c
ash
eq
uiv
ale
nts
, Ju
ly 1
3,1
22
38,6
11
16,2
29
12,9
75
126,3
25
2,5
75
1,9
42
16
201,7
95
Cash
an
d c
ash
eq
uiv
ale
nts
, Ju
ne 3
02,8
71
$
42,1
62
$
20,9
85
$
17,9
34
$
147,1
88
$
2,8
74
$
895
$
1$
234,9
10
$
Reco
ncil
iati
on
of
cash
, c
ash
eq
uiv
ale
nts
an
d
investm
en
ts:
Cash a
nd c
ash e
quiv
ale
nts
unre
str
icte
d a
t end o
f year
2,8
71
$
42,1
62
$
20,9
85
$
17,9
34
$
147,1
88
$
2,8
74
$
895
$
1$
234,9
10
$
Cash
, cash
eq
uiv
ale
nts
an
d i
nvestm
en
ts p
er
bala
nce
sh
eet
2,8
71
$
42,1
62
$
20,9
85
$
17,9
34
$
147,1
88
$
2,8
74
$
895
$
1$
234,9
10
$
215 - State of Indiana - Comprehensive Annual Financial Report
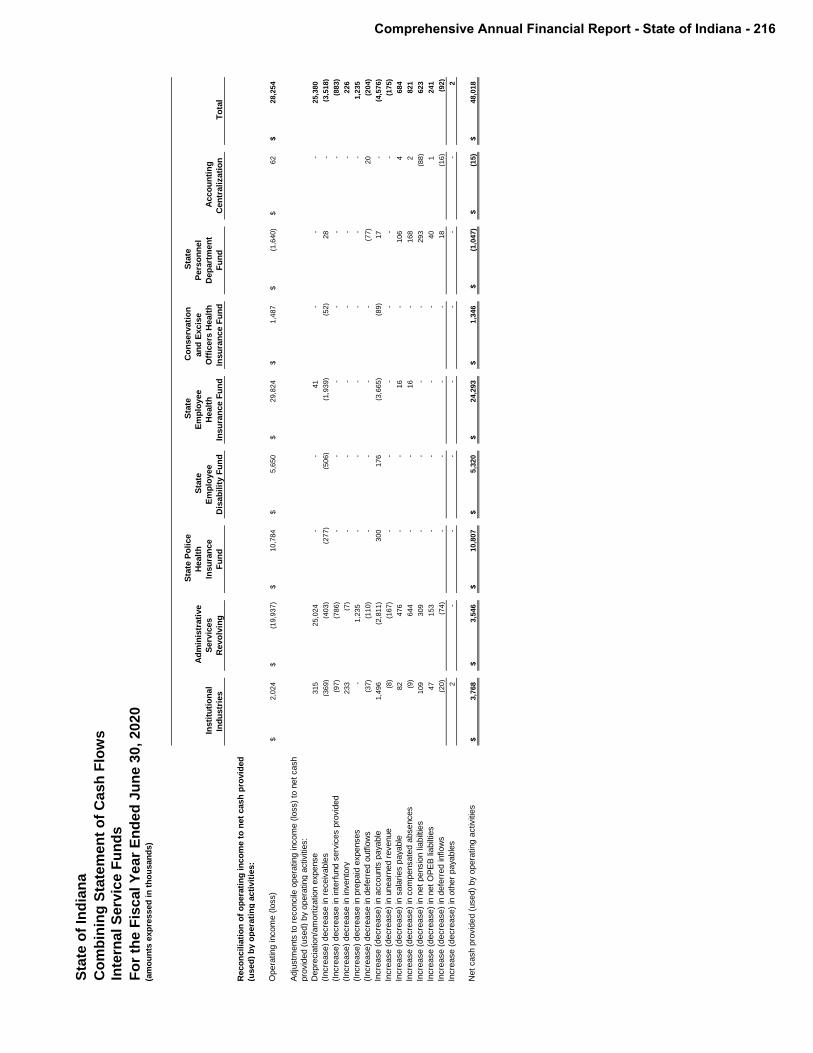
Sta
te o
f In
dia
na
Co
mb
inin
g S
tate
me
nt
of
Cas
h F
low
s
Inte
rnal S
erv
ice F
un
ds
Fo
r th
e F
isc
al
Ye
ar
En
de
d J
un
e 3
0,
20
20
(am
ou
nts
exp
ressed
in
th
ou
san
ds)
In
sti
tuti
on
al
Ind
ustr
ies
Ad
min
istr
ati
ve
Serv
ices
Revo
lvin
g
Sta
te P
oli
ce
Healt
h
Insu
ran
ce
Fu
nd
Sta
te
Em
plo
yee
Dis
ab
ilit
y F
un
d
Sta
te
Em
plo
yee
Healt
h
Insu
ran
ce F
un
d
Co
nserv
ati
on
an
d E
xcis
e
Off
icers
Healt
h
Insu
ran
ce F
un
d
Sta
te
Pers
on
nel
Dep
art
men
t
Fu
nd
Acco
un
tin
g
Cen
trali
zati
on
T
ota
l
Reco
ncil
iati
on
of
op
era
tin
g i
nco
me t
o n
et
cash
pro
vid
ed
(used
) b
y o
pera
tin
g a
cti
vit
ies:
Opera
ting
incom
e (
loss)
2,0
24
$
(1
9,9
37
)$
1
0,7
84
$
5,6
50
$
2
9,8
24
$
1,4
87
$
(1
,64
0)
$
62
$
2
8,2
54
$
Adju
stm
ents
to r
econcile
opera
ting
incom
e (
loss)
to n
et
cash
pro
vid
ed (
used)
by o
pera
ting
activitie
s:
Depre
cia
tion/a
mort
ization e
xpense
315
25
,02
4
-
-
41
-
-
-
25
,38
0
(Incre
ase)
decre
ase in r
eceiv
able
s(3
69
)
(40
3)
(27
7)
(5
06
)
(1,9
39
)
(5
2)
28
-
(3,5
18
)
(Incre
ase)
decre
ase in inte
rfund s
erv
ices p
rovid
ed
(97
)
(7
86
)
-
-
-
-
-
-
(8
83
)
(Incre
ase)
decre
ase in invento
ry233
(7)
-
-
-
-
-
-
226
(Incre
ase)
decre
ase in p
repaid
expenses
-
1
,23
5
-
-
-
-
-
-
1,2
35
(Incre
ase)
decre
ase in d
efe
rred o
utf
low
s(3
7)
(11
0)
-
-
-
-
(77
)
20
(2
04
)
Incre
ase (
decre
ase)
in a
ccounts
payable
1,4
96
(2
,81
1)
300
176
(3,6
65
)
(8
9)
17
-
(4,5
76
)
Incre
ase (
decre
ase)
in u
nearn
ed r
evenue
(8)
(1
67
)
-
-
-
-
-
-
(1
75
)
Incre
ase (
decre
ase)
in s
ala
ries p
ayable
82
476
-
-
16
-
106
4
684
Incre
ase (
decre
ase)
in c
om
pensate
d a
bsences
(9)
644
-
-
16
-
168
2
821
Incre
ase (
decre
ase)
in n
et
pensio
n lia
bilt
ies
109
309
-
-
-
-
293
(88
)
623
Incre
ase (
decre
ase)
in n
et
OP
EB
lia
bilt
ies
47
153
-
-
-
-
40
1
241
Incre
ase (
decre
ase)
in d
efe
rred inflow
s(2
0)
(74
)
-
-
-
-
18
(1
6)
(92
)
Incre
ase (
decre
ase)
in o
ther
payable
s2
-
-
-
-
-
-
-
2
Net
cash p
rovid
ed (
used)
by o
pera
ting
activitie
s3
,76
8$
3,5
46
$
1
0,8
07
$
5,3
20
$
2
4,2
93
$
1,3
46
$
(1
,04
7)
$
(15
)$
4
8,0
18
$
Comprehensive Annual Financial Report - State of Indiana - 216

FIDUCIARY FUNDS Fiduciary funds account for assets held by or on behalf of the government in a trustee capacity or as an agent on behalf of others.
PENSION AND OTHER EMPLOYEE BENEFIT TRUST FUNDS
Pension trust funds are used to report resources that are required to be held in trust for the members and beneficiaries of defined benefit pension plans, defined contribution plans, and other post-employment benefit plans.
State Police Pension Fund - This fund is used to account for assets held for a defined benefit, single-employer public employee retirement system administered by the Indiana State Police. State Police Supplemental Trust - This fund is used to account for a defined benefit, single-employer public employee retirement system that provides additional benefits under the supplemental pension trust agreement administered by the Treasurer of the State of Indiana with the Indiana State Police. State Employee Retiree Health Benefit Trust Fund-DB - This fund is used to account for assets held for the State’s defined benefit, single-employer OPEB plans: the State Personnel Plan (SPP) administered by the State Personnel Department; Indiana State Police Plan (ISPP) administered by the Indiana State Police; and the Conservation and Excise Police Plan (CEPP) administered by the Indiana State Excise Police and Indiana Conservation Officers Health Insurance Committee. State Employee Retiree Health Benefit Trust Fund-DC - This fund is used to account for assets held for a defined contribution, single-employer OPEB plan administered by the State Budget Agency. Indiana Public Retirement System – INPRS administers and manages public pension plans including the Public Employees’ Retirement Fund (PERF), the Teachers’ Retirement Fund (TRF), the Prosecuting Attorney’s Retirement Fund (PARF), the 1977 Police Officers’ and Firefighters’ Pension and Disability Fund (1977 Fund), the Legislators Retirement System (LRS), the Judges Retirement System (JRS), and the State Excise, Gaming Agent, Gaming Control Officers and Conservation Enforcement Officers’ Retirement Plan (EG&C). The PERF, TRF, and 1977 Fund plans are cost-sharing, multiple-employer defined benefit plans. The LRS plan has both a single-employer defined benefit plan and a single-employer defined contribution plan. The PARF, JRS, and EG&C plans are single-employer defined benefit plans. INPRS also oversees three non-retirement funds which are the Pension Relief Fund, the Public Safety Officers’ Special Death Benefit Fund and the State Employees’ Death Benefit Fund.
217 - State of Indiana - Comprehensive Annual Financial Report

FIDUCIARY FUNDS
PRIVATE-PURPOSE TRUST FUNDS Private-Purpose trust funds are used to account for trust arrangements in which both the principal and interest may be spent for the benefit of individuals, private organizations or other governments.
Abandoned Property Fund - This fund is used to administer abandoned property of individuals, private organizations and other governments held by the State. Private-Purpose Trust Fund - This fund is used to account for a group of fund centers under which principal and interest benefit individuals, private organizations, or other governments.
AGENCY FUNDS Agency funds account for resources that are custodial in nature. They generally are amounts held by the State of Indiana on behalf of third parties.
Employee Payroll, Withholding and Benefits Funds - These funds are used for the disposition of various payroll-related deductions and contributions such as social security and insurance contributions. Local Distributions Fund - This fund is composed of accounts used to distribute revenue collections to local units of government based upon statutory formulas. Child Support Fund - This fund is used for the collection and distribution of child support payments. Department of Insurance Fund - This fund includes security deposits of insurance companies, health maintenance organizations and third party administrators as required. Other Agency Funds – This category comprises various escrows, revenue collection, and agency accounts for which the State acts in an agent capacity until proper disposition of the assets can be made.
Comprehensive Annual Financial Report - State of Indiana - 218

State of Indiana
Combining Statement of Fiduciary Net Position
Pension and Other Employee Benefit Trust Funds
June 30, 2020(amounts expressed in thousands)
Primary Government
Fiduciary in Nature
Component Unit
State Police
Pension Fund
State Police
Supplemental
Trust
State Employee
Retiree Health
Benefit Trust
Fund - DB
State Employee
Retiree Health
Benefit Trust
Fund - DC
Indiana Public
Retirement System Total
Assets
Cash, cash equivalents and non-pension
investments 36,644$ -$ 5,272$ -$ 4,067$ 45,983$
Securities lending collateral - - - - 158,656 158,656
Receivables: - - - -
Contributions 447 65 656 - 91,491 92,659
Interest 365 - 131 - 87,034 87,530
Member loans 65 - - - - 65
From investment sales 426 - - - 8,048,756 8,049,182
Total receivables 1,303 65 787 - 8,227,281 8,229,436
Pension and other employee benefit
investments at fair value:
Short term investments - - - - 1,521,727 1,521,727
Equity Securities 209,074 - - - 9,685,426 9,894,500
Debt Securities 140,156 - 227,866 - 13,809,293 14,177,315
Mutual Funds and Collective Trust
Funds 111,618 - - - - 111,618
Other - - - - 13,243,498 13,243,498
Total investments at fair value 460,848 - 227,866 - 38,259,944 38,948,658
Other assets - - - - 229 229
Property, plant and equipment
net of accumulated depreciation 15 - - - 4,600 4,615
Total assets 498,810 65 233,925 - 46,654,777 47,387,577
Liabilities
Accounts/escrows payable 100 - - - 10,247 10,347
Benefits payable - 65 959 - 113,055 114,079
Investment purchases payable - - - - 9,120,818 9,120,818
Securities purchased payable - - - - 387,498 387,498
Securities lending collateral - - - - 158,656 158,656
Other - - - - 1,529 1,529
Total liabilities 100 65 959 - 9,791,803 9,792,927
Net Position
Restricted for:
Employees' pension benefits 498,710 - - - 36,398,355 36,897,065
OPEB benefits - - 232,966 - 448,914 681,880
Future death benefits - - - - 15,705 15,705
Total net position 498,710$ -$ 232,966$ -$ 36,862,974$ 37,594,650$
219 - State of Indiana - Comprehensive Annual Financial Report

State of Indiana
Combining Statement of Changes in Fiduciary Net Position
Pension and Other Employee Benefit Trust Funds
For the Year Ended June 30, 2020(amounts expressed in thousands)
Primary Government
Fiduciary in
Nature Component
Unit
State Police
Pension Fund
State Police
Supplemental
Trust
State Employee
Retiree Health
Benefit Trust Fund
- DB
State Employee
Retiree Health
Benefit Trust Fund
- DC
Indiana Public
Retirement System Total
Additions:
Member contributions 5,338$ -$ -$ -$ 374,075$ 379,413$
Employer contributions 34,096 3,997 30,016 - 1,010,981 1,079,090
Contributions from the State of Indiana - - - - 1,172,724 1,172,724
Net investment income (loss) 8,777 - 3,258 - 1,230,163 1,242,198
Less investment expense (1,668) - - - (224,327) (225,995)
Federal reimbursements - - 633 - - 633
Transfers from other retirement funds - - - - 435,947 435,947
Other - - 275 - 371 646
Total additions 46,543 3,997 34,182 - 3,999,934 4,084,656
Deductions:
Pension and disability benefits 38,713 3,274 - - 2,490,812 2,532,799
Retiree health benefits - - 8,542 - 17,306 25,848
Retiree health forfeitures - - - - 18,969 18,969
Death benefits - - - - 1,919 1,919
Refunds of contributions and interest 21 - - - 423,885 423,906
Administrative 392 69 569 - 43,018 44,048
Pension relief distributions - - - - 209,167 209,167
Transfers to other retirement funds - - - 435,947 - 435,947
Other - 654 - - 237 891
Total deductions 39,126 3,997 9,111 435,947 3,205,313 3,693,494
Net increase (decrease) in net position 7,417 - 25,071 (435,947) 794,621 391,162
Net position restricted for pension and other
employee benefits, July 1, as restated:
Pension benefits 491,293 - - - 36,053,120 36,544,413
OPEB benefits - - 207,895 435,947 - 643,842
Future death benefits - - - - 15,233 15,233
Net position restricted for pension and
other employee benefits, June 30, as
restated 498,710$ -$ 232,966$ -$ 36,862,974$ 37,594,650$
Comprehensive Annual Financial Report - State of Indiana - 220

State of Indiana
Combining Statement of Net Position
Private-Purpose Trust Funds
June 30, 2020(amounts expressed in thousands)
Abandoned
Property Fund
Private Purpose
Trust Fund Total
ASSETS Cash, cash equivalents and non-pension
investments 41,859$ 2,531$ 44,390$
Receivables:
Accounts 5,498 185 5,683
Interest - 17 17
Total receivables 5,498 202 5,700
Total assets 47,357 2,733 50,090
LIABILITIES
Accounts/escrows payable 54 - 54
Salaries and benefits payable 131 - 131
Total liabilities 185 - 185
NET POSITION
Restricted for:
Trust beneficiaries 47,172 2,733 49,905
Total net position 47,172$ 2,733$ 49,905$
221 - State of Indiana - Comprehensive Annual Financial Report

State of Indiana
Combining Statement of Changes in Net Position
Private-Purpose Trust Funds
For the Year Ended June 30, 2020(amounts expressed in thousands)
Abandoned
Property Fund
Private-Purpose
Trust Fund Total
Additions:
Current Service Charge -$ 9,647$ 9,647$
Investment Income 47 24 71
Member Contributions - 305 305
Donations/escheats 118,079 - 118,079
Total additions 118,126 9,976 128,102
Deductions:
Payments to participants/beneficiaries 116,528 9,653 126,181
Total deductions 116,528 9,653 126,181
Net increase (decrease) in net position 1,598 323 1,921
Net position, July 1, as restated 45,574 2,410 47,984
Net position, June 30 47,172$ 2,733$ 49,905$
Comprehensive Annual Financial Report - State of Indiana - 222

State of Indiana
Combining Statement of Net Position
Agency Funds
June 30, 2020(amounts expressed in thousands)
Employee
Payroll,
Withholding and
Benefits
Local
Distributions
Child
Support
Other
Agency
Funds Total
Assets:
Cash, cash equivalents and investments 1,240$ 768,919$ 45,811$ 70,405$ 886,375$
Receivables:
Taxes - 9,552 - 124 9,676
Accounts - - - 97 97
Total assets 1,240$ 778,471$ 45,811$ 70,626$ 896,148$
Liabilities:
Accounts/escrows payable 1,240$ 778,471$ 45,811$ 70,626$ 896,148$
Total liabilities 1,240$ 778,471$ 45,811$ 70,626$ 896,148$
223 - State of Indiana - Comprehensive Annual Financial Report

State of Indiana
Combining Statement of Changes In Assets and Liabilities
Agency Funds
For the Year Ended June 30, 2020
(amounts expressed in thousands)
Balance, July 1 Additions Deductions Balance, June 30
Employee Payroll, Withholding and Benefits
Assets:
Cash, cash equivalents, and investments 1,173$ 2,629,989$ 2,629,922$ 1,240$
Total assets 1,173$ 2,629,989$ 2,629,922$ 1,240$
Liabilities:
Accounts / escrows payable 1,173$ 2,629,989$ 2,629,922$ 1,240$
Total liabilities 1,173$ 2,629,989$ 2,629,922$ 1,240$
Local Distributions
Assets:
Cash, cash equivalents, and investments 803,434$ 3,233,399$ 3,267,914$ 768,919$
Receivables 17,521 9,552 17,521 9,552
Total assets 820,955$ 3,242,951$ 3,285,435$ 778,471$
Liabilities:
Accounts / escrows payable 820,955$ 3,242,951$ 3,285,435$ 778,471$
Total liabilities 820,955$ 3,242,951$ 3,285,435$ 778,471$
Child Support
Assets:
Cash, cash equivalents, and investments 17,788$ 888,872$ 860,849$ 45,811$
Total assets 17,788$ 888,872$ 860,849$ 45,811$
Liabilities:
Accounts / escrows payable 17,788$ 888,872$ 860,849$ 45,811$
Total liabilities 17,788$ 888,872$ 860,849$ 45,811$
Other Agency Funds
Assets:
Cash, cash equivalents, and investments 53,602$ 765,338$ 748,535$ 70,405$
Receivables 871 221 871 221
Total assets 54,473$ 765,559$ 749,406$ 70,626$
Liabilities:
Accounts / escrows payable 54,473$ 765,559$ 749,406$ 70,626$
Total liabilities 54,473$ 765,559$ 749,406$ 70,626$
Total Agency Funds
Assets:
Cash, cash equivalents, and investments 875,997$ 7,517,598$ 7,507,220$ 886,375$
Receivables 18,392 9,773 18,392 9,773
Total assets 894,389$ 7,527,371$ 7,525,612$ 896,148$
Liabilities:
Accounts / escrows payable 894,389$ 7,527,371$ 7,525,612$ 896,148$
Total liabilities 894,389$ 7,527,371$ 7,525,612$ 896,148$
Comprehensive Annual Financial Report - State of Indiana - 224

NON-MAJOR DISCRETELY PRESENTED COMPONENT UNITS
GOVERNMENTAL FUNDS Governmental component units represent funds that are legally separate from the State of Indiana, but provide valuable and beneficial services to the State and its citizens. The non-major discretely presented component unit consists of the following governmental fund:
Indiana Economic Development Corporation – The responsibility of this corporation is to improve the quality of life for the citizens of Indiana by encouraging the diversification of Indiana’s economy, by the orderly economic development and growth of Indiana, the creation of new jobs, the growth and modernization of existing industry and the promotion of Indiana.
PROPRIETARY FUNDS Proprietary component units represent funds that are legally separate from the State of Indiana, but provide valuable and beneficial services to the State and its citizens. The non-major discretely presented component units consist of the following proprietary funds:
Indiana Stadium and Convention Building Authority – The authority’s responsibility is to finance, design, construct and own the new Indiana Stadium in Indianapolis and the expansion of the adjacent Indiana Convention Center. Indiana Bond Bank – The Bond Bank issues debt obligations and invests the proceeds in various projects of State and local governments. Indiana Housing and Community Development Authority – The authority’s purpose is to finance residential housing for persons and families of low and moderate incomes. Indiana Board for Depositories – The board is responsible to ensure the safekeeping and prompt payment of all public funds deposited in Indiana banks. It provides insurance on public funds in excess of the Federal Deposit Insurance Corporation limit. Indiana Secondary Market for Education Loans Inc. – The company is responsible for purchasing education loans in the secondary market. White River State Park Development Commission – The responsibility of this commission is to design and implement a plan for the establishment and development of park, exposition, educational, athletic, and recreational projects to be located within one mile from the banks of the Indiana White River in a consolidated first-class city and county. Ports of Indiana – The responsibility of this commission is to construct, maintain, and operate public ports with terminal facilities and traffic exchange points for all forms of transportation on Lake Michigan and the Ohio and Wabash Rivers. State Fair Commission – This commission is responsible for holding the annual Indiana State Fair and for operating and maintaining the State Fairgrounds and other properties it owns. Indiana Comprehensive Health Insurance Association – The responsibility of this Association is to assure that health insurance is made available throughout the year to each eligible Indiana resident applying to the Association for coverage. Indiana Political Subdivision Risk Management Commission – This commission is responsible for administering the Basic and Catastrophic funds that aid political subdivisions in protecting themselves against liabilities.
Indiana State Museum and Historic Sites Corporation – The responsibility of this corporation is to operate and administer the state historic sites including the Indiana State Museum which collects, conserves and exhibits artifacts and materials reflecting the cultural and natural history of Indiana. Indiana Motorsports Commission – The commission is responsible for financing and leasing real and personal property improvements for the benefit of an owner of a qualified motorsports facility within a motorsports investment district.
225 - State of Indiana - Comprehensive Annual Financial Report

COLLEGES AND UNIVERSITIES
College and university funds are used to account for the operations of state-supported colleges and universities. The non-major discretely presented component units consist of the following institutions:
Ball State University Indiana State University Ivy Tech Community College of Indiana University of Southern Indiana Vincennes University
Comprehensive Annual Financial Report - State of Indiana - 226

State of Indiana
Combining Statement of Net Position
Non-Major Discretely Presented Component Units -
Governmental Funds
June 30, 2020
(amounts expressed in thousands)
Indiana Economic
Development
Corporation Totals
Assets
Current assets:
Cash, cash equivalents and investments - unrestricted 11,097$ 11,097$
Cash, cash equivalents and investments - restricted 292,734 292,734
Receivables (net) 1,593 1,593
Total current assets 305,424 305,424
Noncurrent assets:
Loans 86,862 86,862
Capital assets:
Capital assets being depreciated/amortized 507 507
less accumulated depreciation/amortization (290) (290)
Total capital assets, net of depreciation/amortization 217 217
Total noncurrent assets 87,079 87,079
Total assets 392,503 392,503
Deferred Outflows of Resources
Related to pensions 916 916
Total deferred outflows of resources 916 916
Liabilities
Current liabilities:
Accounts payable 42,310 42,310
Unearned revenue 128,824 128,824
Accrued liability for compensated absences 587 587
Total current liabilities 171,721 171,721
Noncurrent liabilities:
Net pension and OPEB liabilities 3,923 3,923
Total noncurrent liabilities 3,923 3,923
Total liabilities 175,644 175,644
Deferred inflows of resources
Related to pensions 640 640
Total deferred inflows of resources 640 640
NET POSITION
Net investment in capital assets 218 218
Restricted - expendable:
Grants/constitutional restrictions 210,570 210,570
Unrestricted 6,347 6,347
Total net position 217,135$ 217,135$
227 - State of Indiana - Comprehensive Annual Financial Report

State of Indiana
Combining Statement of Activities
Non-Major Discretely Presented Component Units -
Governmental Funds
For the Fiscal Year Ended June 30, 2020(amounts expressed in thousands)
Expenses
Operating Grants
and
Contributions
Indiana
Economic
Development
Corporation Total
Indiana Economic Development Corporation 154,645$ 86,282$ (68,363)$ (68,363)$
Total component units 154,645$ 86,282$ (68,363) (68,363)
General Revenues:
Gaming tax 1,228 1,228
Total taxes 1,228 1,228
Revenue not restricted to specific programs
Investment earnings 399 399
Payments from State of Indiana 95,567 95,567
Total general revenues 97,194 97,194
Changes in net position 28,831 28,831
Net position - beginning 188,304 188,304
Net position - ending 217,135$ 217,135$
Net (Expense) Revenue and Changes
in Net Position
Comprehensive Annual Financial Report - State of Indiana - 228
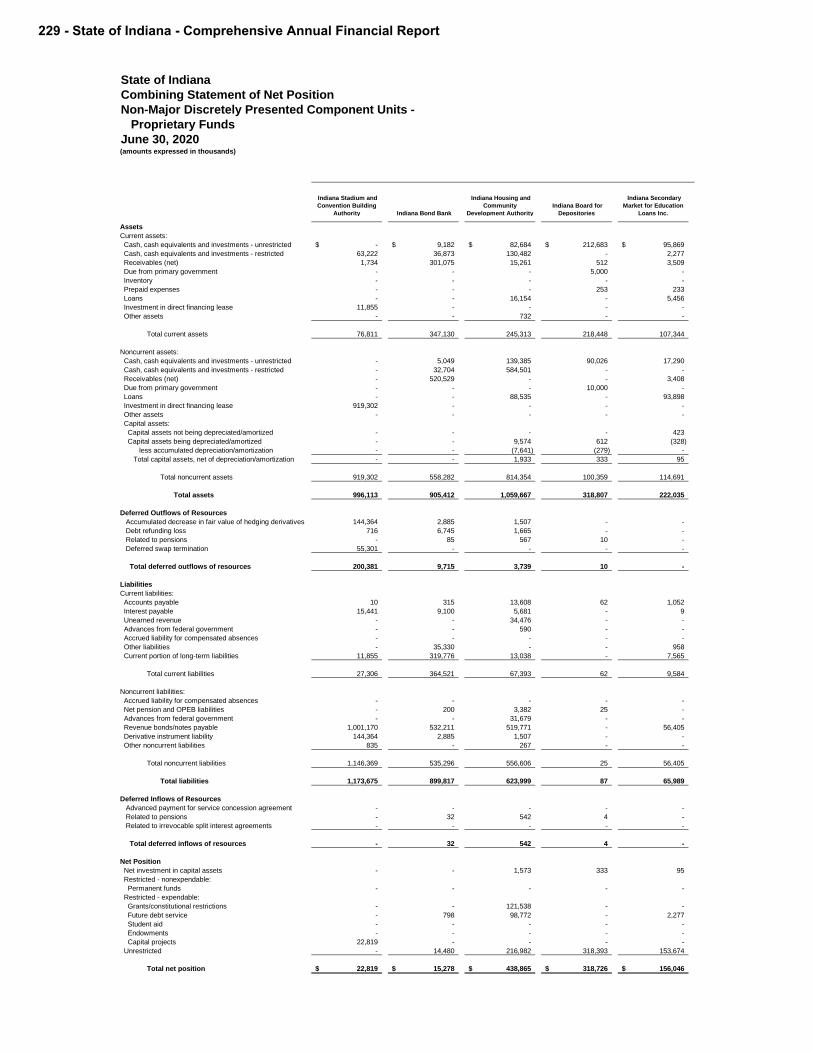
State of Indiana
Combining Statement of Net Position
Non-Major Discretely Presented Component Units -
Proprietary Funds
June 30, 2020(amounts expressed in thousands)
Indiana Stadium and
Convention Building
Authority Indiana Bond Bank
Indiana Housing and
Community
Development Authority
Indiana Board for
Depositories
Indiana Secondary
Market for Education
Loans Inc.
Assets
Current assets:
Cash, cash equivalents and investments - unrestricted -$ 9,182$ 82,684$ 212,683$ 95,869$
Cash, cash equivalents and investments - restricted 63,222 36,873 130,482 - 2,277
Receivables (net) 1,734 301,075 15,261 512 3,509
Due from primary government - - - 5,000 -
Inventory - - - - -
Prepaid expenses - - - 253 233
Loans - - 16,154 - 5,456
Investment in direct financing lease 11,855 - - - -
Other assets - - 732 - -
Total current assets 76,811 347,130 245,313 218,448 107,344
Noncurrent assets:
Cash, cash equivalents and investments - unrestricted - 5,049 139,385 90,026 17,290
Cash, cash equivalents and investments - restricted - 32,704 584,501 - -
Receivables (net) - 520,529 - - 3,408
Due from primary government - - - 10,000 -
Loans - - 88,535 - 93,898
Investment in direct financing lease 919,302 - - - -
Other assets - - - - -
Capital assets:
Capital assets not being depreciated/amortized - - - - 423
Capital assets being depreciated/amortized - - 9,574 612 (328)
less accumulated depreciation/amortization - - (7,641) (279) -
Total capital assets, net of depreciation/amortization - - 1,933 333 95
Total noncurrent assets 919,302 558,282 814,354 100,359 114,691
Total assets 996,113 905,412 1,059,667 318,807 222,035
Deferred Outflows of Resources
Accumulated decrease in fair value of hedging derivatives 144,364 2,885 1,507 - -
Debt refunding loss 716 6,745 1,665 - -
Related to pensions - 85 567 10 -
Deferred swap termination 55,301 - - - -
Total deferred outflows of resources 200,381 9,715 3,739 10 -
Liabilities
Current liabilities:
Accounts payable 10 315 13,608 62 1,052
Interest payable 15,441 9,100 5,681 - 9
Unearned revenue - - 34,476 - -
Advances from federal government - - 590 - -
Accrued liability for compensated absences - - - - -
Other liabilities - 35,330 - - 958
Current portion of long-term liabilities 11,855 319,776 13,038 - 7,565
Total current liabilities 27,306 364,521 67,393 62 9,584
Noncurrent liabilities:
Accrued liability for compensated absences - - - - -
Net pension and OPEB liabilities - 200 3,382 25 -
Advances from federal government - - 31,679 - -
Revenue bonds/notes payable 1,001,170 532,211 519,771 - 56,405
Derivative instrument liability 144,364 2,885 1,507 - -
Other noncurrent liabilities 835 - 267 - -
Total noncurrent liabilities 1,146,369 535,296 556,606 25 56,405
Total liabilities 1,173,675 899,817 623,999 87 65,989
Deferred Inflows of Resources
Advanced payment for service concession agreement - - - - -
Related to pensions - 32 542 4 -
Related to irrevocable split interest agreements - - - - -
Total deferred inflows of resources - 32 542 4 -
Net Position
Net investment in capital assets - - 1,573 333 95
Restricted - nonexpendable:
Permanent funds - - - - -
Restricted - expendable:
Grants/constitutional restrictions - - 121,538 - -
Future debt service - 798 98,772 - 2,277
Student aid - - - - -
Endowments - - - - -
Capital projects 22,819 - - - -
Unrestricted - 14,480 216,982 318,393 153,674
Total net position 22,819$ 15,278$ 438,865$ 318,726$ 156,046$
229 - State of Indiana - Comprehensive Annual Financial Report
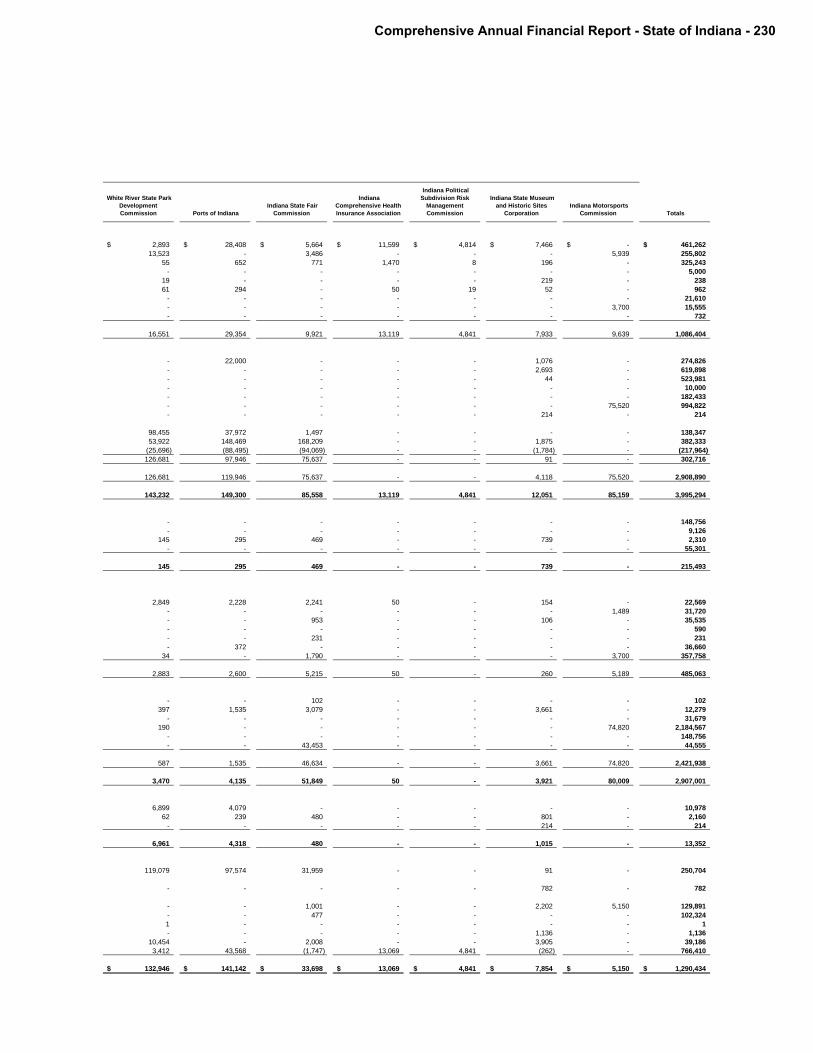
White River State Park
Development
Commission Ports of Indiana
Indiana State Fair
Commission
Indiana
Comprehensive Health
Insurance Association
Indiana Political
Subdivision Risk
Management
Commission
Indiana State Museum
and Historic Sites
Corporation
Indiana Motorsports
Commission Totals
2,893$ 28,408$ 5,664$ 11,599$ 4,814$ 7,466$ -$ 461,262$
13,523 - 3,486 - - - 5,939 255,802
55 652 771 1,470 8 196 - 325,243
- - - - - - - 5,000
19 - - - - 219 - 238
61 294 - 50 19 52 - 962
- - - - - - - 21,610
- - - - - - 3,700 15,555
- - - - - - - 732
16,551 29,354 9,921 13,119 4,841 7,933 9,639 1,086,404
- 22,000 - - - 1,076 - 274,826
- - - - - 2,693 - 619,898
- - - - - 44 - 523,981
- - - - - - - 10,000
- - - - - - - 182,433
- - - - - - 75,520 994,822
- - - - - 214 - 214
98,455 37,972 1,497 - - - - 138,347
53,922 148,469 168,209 - - 1,875 - 382,333
(25,696) (88,495) (94,069) - - (1,784) - (217,964)
126,681 97,946 75,637 - - 91 - 302,716
126,681 119,946 75,637 - - 4,118 75,520 2,908,890
143,232 149,300 85,558 13,119 4,841 12,051 85,159 3,995,294
- - - - - - - 148,756
- - - - - - - 9,126
145 295 469 - - 739 - 2,310
- - - - - - - 55,301
145 295 469 - - 739 - 215,493
2,849 2,228 2,241 50 - 154 - 22,569
- - - - - - 1,489 31,720
- - 953 - - 106 - 35,535
- - - - - - - 590
- - 231 - - - - 231
- 372 - - - - - 36,660
34 - 1,790 - - - 3,700 357,758
2,883 2,600 5,215 50 - 260 5,189 485,063
- - 102 - - - - 102
397 1,535 3,079 - - 3,661 - 12,279
- - - - - - - 31,679
190 - - - - - 74,820 2,184,567
- - - - - - - 148,756
- - 43,453 - - - - 44,555
587 1,535 46,634 - - 3,661 74,820 2,421,938
3,470 4,135 51,849 50 - 3,921 80,009 2,907,001
6,899 4,079 - - - - - 10,978
62 239 480 - - 801 - 2,160
- - - - - 214 - 214
6,961 4,318 480 - - 1,015 - 13,352
119,079 97,574 31,959 - - 91 - 250,704
- - - - - 782 - 782
- - 1,001 - - 2,202 5,150 129,891
- - 477 - - - - 102,324
1 - - - - - - 1
- - - - - 1,136 - 1,136
10,454 - 2,008 - - 3,905 - 39,186
3,412 43,568 (1,747) 13,069 4,841 (262) - 766,410
132,946$ 141,142$ 33,698$ 13,069$ 4,841$ 7,854$ 5,150$ 1,290,434$
Comprehensive Annual Financial Report - State of Indiana - 230

Sta
te o
f In
dia
na
Co
mb
inin
g S
tate
me
nt
of
Ac
tivit
ies
No
n-M
ajo
r D
isc
rete
ly P
res
en
ted
Co
mp
on
en
t U
nit
s -
P
rop
rie
tary
Fu
nd
s
Fo
r th
e F
isc
al Y
ea
r E
nd
ed
Ju
ne
30
, 2
02
0(a
mo
un
ts e
xp
ressed
in
th
ou
san
ds)
Pro
gra
m R
even
ues
Net
(Exp
en
se)
Reven
ue a
nd
Ch
an
ges in
Net
Po
sit
ion
Net
(Exp
en
se)
Reven
ue a
nd
Ch
an
ges in
Net
Po
sit
ion
Exp
en
ses
Ch
arg
es f
or
Serv
ices
Op
era
tin
g G
ran
ts
an
d C
on
trib
uti
on
s
Cap
ital G
ran
ts
an
d C
on
trib
uti
on
s
In
dia
na S
tad
ium
an
d C
on
ven
tio
n
Bu
ild
ing
Au
tho
rity
In
dia
na B
on
d
Ban
k
In
dia
na H
ou
sin
g
an
d C
om
mu
nit
y
Develo
pm
en
t
Au
tho
rity
In
dia
na B
oard
for
Dep
osit
ori
es
India
na S
tadiu
m a
nd C
onvention B
uild
ing A
uth
ority
52,5
89
$
50,6
91
$
4,1
60
$
-$
2,2
62
$
-$
-$
-$
India
na B
ond B
ank
32,6
81
1,8
17
31,0
67
-
-
203
-
-
India
na H
ousin
g a
nd C
om
munity D
evelo
pm
ent A
uth
ority
407,3
72
26,4
55
377,9
50
-
-
-
(2,9
67)
-
India
na B
oard
for
Depositories
1,7
59
-
7,2
78
-
-
-
-
5,5
19
India
na S
econdary
Mark
et fo
r E
ducation L
oans Inc.
7,5
91
-
3,9
81
-
-
-
-
-
White R
iver
Sta
te P
ark
Develo
pm
ent C
om
mis
sio
n5,1
40
2,4
59
56
8,8
77
-
-
-
-
Port
s o
f In
dia
na
13,1
96
13,4
55
636
-
-
-
-
-
India
na S
tate
Fair C
om
mis
sio
n32,4
84
21,7
38
436
-
-
-
-
-
India
na C
om
pre
hensiv
e H
ealth Insura
nce A
ssocia
tion
164
20
-
-
-
-
-
-
India
na P
olit
ical S
ubdiv
isio
n R
isk M
anagem
ent C
om
mis
sio
n75
-
-
-
-
-
-
-
India
na S
tate
Museum
and H
isto
ric S
ites C
orp
ora
tion
13,9
49
1,8
41
2,9
85
-
-
-
-
-
India
na M
oto
rsport
s C
om
mis
sio
n5,4
11
2,0
00
-
-
-
-
-
-
Tota
l com
ponent units
572,4
11
$
120,4
76
$
428,5
49
$
8,8
77
$
2,2
62
203
(2,9
67)
5,5
19
Genera
l re
venues:
Investm
ent earn
ings
1,0
91
355
34,3
94
-
Paym
ents
fro
m S
tate
of In
dia
na
-
-
-
-
Oth
er
-
-
-
-
Tota
l genera
l re
venues
1,0
91
355
34,3
94
-
Change in n
et positio
n3,3
53
558
31,4
27
5,5
19
Net positio
n -
begin
nin
g, as r
esta
ted
19,4
66
14,7
20
407,4
38
313,2
07
Net
po
sit
ion
- e
nd
ing
22,8
19
$
15,2
78
$
438,8
65
$
318,7
26
$
231 - State of Indiana - Comprehensive Annual Financial Report
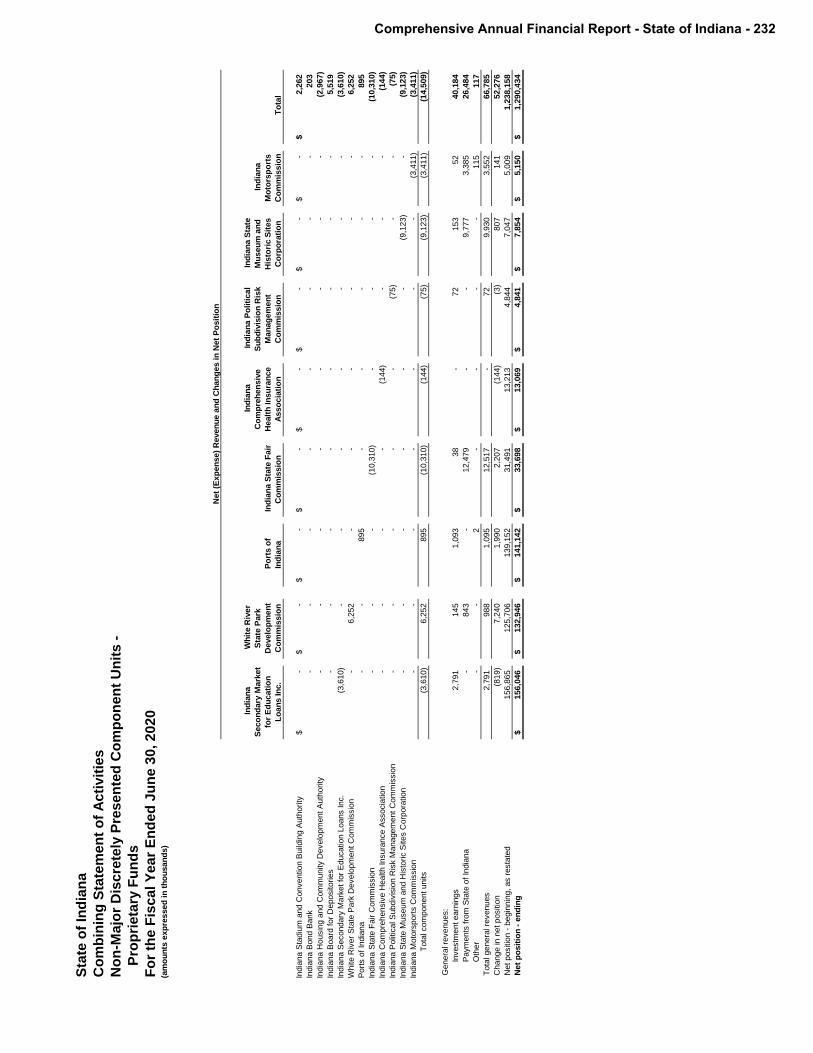
Sta
te o
f In
dia
na
Co
mb
inin
g S
tate
me
nt
of
Ac
tivit
ies
No
n-M
ajo
r D
isc
rete
ly P
res
en
ted
Co
mp
on
en
t U
nit
s -
P
rop
rie
tary
Fu
nd
s
Fo
r th
e F
isc
al Y
ea
r E
nd
ed
Ju
ne
30
, 2
02
0(a
mo
un
ts e
xp
ressed
in
th
ou
san
ds)
Net
(Exp
en
se)
Reven
ue a
nd
Ch
an
ges in
Net
Po
sit
ion
In
dia
na
Seco
nd
ary
Mark
et
for
Ed
ucati
on
Lo
an
s In
c.
Wh
ite R
iver
Sta
te P
ark
Develo
pm
en
t
Co
mm
issio
n
Po
rts o
f
Ind
ian
a
In
dia
na S
tate
Fair
Co
mm
issio
n
In
dia
na
Co
mp
reh
en
siv
e
Healt
h In
su
ran
ce
Asso
cia
tio
n
In
dia
na P
oliti
cal
Su
bd
ivis
ion
Ris
k
Man
ag
em
en
t
Co
mm
issio
n
In
dia
na S
tate
Mu
seu
m a
nd
His
tori
c S
ites
Co
rpo
rati
on
In
dia
na
Mo
tors
po
rts
Co
mm
issio
n
To
tal
India
na S
tadiu
m a
nd C
onvention B
uild
ing A
uth
ority
-$
-$
-$
-$
-$
-$
-$
-$
2,2
62
$
India
na B
ond B
ank
-
-
-
-
-
-
-
-
203
India
na H
ousin
g a
nd C
om
munity D
evelo
pm
ent A
uth
ority
-
-
-
-
-
-
-
-
(2,9
67)
India
na B
oard
for
Depositories
-
-
-
-
-
-
-
-
5,5
19
India
na S
econdary
Mark
et fo
r E
ducation L
oans Inc.
(3,6
10)
-
-
-
-
-
-
-
(3,6
10)
White R
iver
Sta
te P
ark
Develo
pm
ent C
om
mis
sio
n-
6,2
52
-
-
-
-
-
-
6,2
52
Port
s o
f In
dia
na
-
-
895
-
-
-
-
-
895
India
na S
tate
Fair C
om
mis
sio
n-
-
-
(10,3
10)
-
-
-
-
(10,3
10)
India
na C
om
pre
hensiv
e H
ealth Insura
nce A
ssocia
tion
-
-
-
-
(144)
-
-
-
(144)
India
na P
olit
ical S
ubdiv
isio
n R
isk M
anagem
ent C
om
mis
sio
n-
-
-
-
-
(75)
-
-
(75)
India
na S
tate
Museum
and H
isto
ric S
ites C
orp
ora
tion
-
-
-
-
-
-
(9,1
23)
-
(9,1
23)
India
na M
oto
rsport
s C
om
mis
sio
n-
-
-
-
-
-
-
(3,4
11)
(3,4
11)
Tota
l com
ponent units
(3,6
10)
6,2
52
895
(10,3
10)
(144)
(75)
(9,1
23)
(3,4
11)
(14,5
09)
Genera
l re
venues:
Investm
ent earn
ings
2,7
91
145
1,0
93
38
-
72
153
52
40,1
84
Paym
ents
fro
m S
tate
of In
dia
na
-
843
-
12,4
79
-
-
9,7
77
3,3
85
26,4
84
Oth
er
-
-
2
-
-
-
-
115
117
Tota
l genera
l re
venues
2,7
91
988
1,0
95
12,5
17
-
72
9,9
30
3,5
52
66,7
85
Change in n
et positio
n(8
19)
7,2
40
1,9
90
2,2
07
(144)
(3)
807
141
52,2
76
Net positio
n -
begin
nin
g, as r
esta
ted
156,8
65
125,7
06
139,1
52
31,4
91
13,2
13
4,8
44
7,0
47
5,0
09
1,2
38,1
58
Net
po
sit
ion
- e
nd
ing
156,0
46
$
132,9
46
$
141,1
42
$
33,6
98
$
13,0
69
$
4,8
41
$
7,8
54
$
5,1
50
$
1,2
90,4
34
$
Comprehensive Annual Financial Report - State of Indiana - 232

State of Indiana
Combining Statement of Net Position
Non-Major Discretely Presented Component Units -
Colleges and Universities
June 30, 2020(amounts expressed in thousands)
Ball State
University
Indiana State
University
Ivy Tech
Community
College
University of
Southern Indiana
Vincennes
University Totals
Assets
Current assets:
Cash, cash equivalents and investments - unrestricted 110,192$ 43,989$ 274,648$ 85,172$ 100,763$ 614,764$
Cash, cash equivalents and investments - restricted 88,724 18,338 8,256 3,015 6,593 124,926
Receivables (net) 41,391 24,787 44,251 8,403 7,968 126,800
Inventory 1,163 8 5 1,567 1,405 4,148
Prepaid expenses 2,623 1,909 4,507 2 416 9,457
Investment in direct financing lease - - 254 - - 254
Other assets 29,408 2,444 7,162 24,980 18 64,012
Total current assets 273,501 91,475 339,083 123,139 117,163 944,361
Noncurrent assets:
Cash, cash equivalents and investments - unrestricted 239,313 106,617 341,721 36,380 97,737 821,768
Cash, cash equivalents and investments - restricted 247,164 76,586 52,126 127,115 117,423 620,414
Receivables (net) 5,998 5,705 9,004 5,215 174 26,096
Investment in direct financing lease - - 4,458 - - 4,458
Net pension and OPEB assets 2,901 48,698 - - 14,319 65,918
Other assets 10,260 16 245 102 220 10,843
Capital assets:
Capital assets not being depreciated/amortized 111,014 84,718 76,296 27,664 35,860 335,552
Capital assets being depreciated/amortized 1,297,297 847,946 1,011,564 417,377 372,625 3,946,809
less accumulated depreciation/amortization (528,092) (340,541) (430,192) (229,760) (147,272) (1,675,857)
Total capital assets, net of depreciation/amortization 880,219 592,123 657,668 215,281 261,213 2,606,504
Total noncurrent assets 1,385,855 829,745 1,065,222 384,093 491,086 4,156,001
Total assets 1,659,356 921,220 1,404,305 507,232 608,249 5,100,362
Deferred Outflows of Resources
Accumulated decrease in fair value of hedging derivatives - - - 716 359 1,075
Debt refunding loss - 433 - - - 433
Related to pensions 13,448 2,344 1,590 883 73 18,338
Related to OPEB 39,425 2,540 1,519 510 12,980 56,974
Total deferred outflows of resources 52,873 5,317 3,109 2,109 13,412 76,820
Liabilities
Current liabilities:
Accounts payable 47,573 13,139 53,232 9,257 6,889 130,090
Interest payable 8,976 2,278 - 881 225 12,360
Unearned revenue 9,014 5,720 14,548 4,474 2,602 36,358
Accrued liability for compensated absences 4,211 4,322 7,992 478 1,354 18,357
Other liabilities 9,929 6,935 1,138 3,452 6,414 27,868
Current portion of long-term liabilities 24,915 19,506 72,189 13,310 6,450 136,370
Total current liabilities 104,618 51,900 149,099 31,852 23,934 361,403
Noncurrent liabilities:
Accrued liability for compensated absences 4,412 280 10,054 3,277 - 18,023
Net pension and OPEB liabilities 60,134 12,088 52,898 22,300 - 147,420
Funds held in trust for others - - - - 64,542 64,542
Advances from federal government - 6,141 - - 701 6,842
Revenue bonds/notes payable 437,203 251,842 216,004 95,218 42,752 1,043,019
Derivative instrument liability - - - 716 359 1,075
Other noncurrent liabilities 9,215 1,373 11,530 7 - 22,125
Total noncurrent liabilities 510,964 271,724 290,486 121,518 108,354 1,303,046
Total liabilities 615,582 323,624 439,585 153,370 132,288 1,664,449
Deferred Inflows of Resources
Advanced payment for service concession agreement - 1,593 - - - 1,593
Related to pensions 16,884 2,307 3,822 1,180 230 24,423
Related to OPEB 21,212 5,061 6,211 7,228 18,476 58,188
Total deferred inflows of resources 38,096 8,961 10,033 8,408 18,706 84,204
Net Position
Net investment in capital assets 485,236 333,956 350,722 122,917 211,026 1,503,857
Restricted - nonexpendable:
Grants/constitutional restrictions - 3,068 - - - 3,068
Instruction and research 355 9,496 1,300 11,102 - 22,253
Student aid 63,107 33,077 31,258 32,707 23,888 184,037
Other purposes 110,556 7,696 4,216 9,119 5,172 136,759
Restricted - expendable:
Grants/constitutional restrictions 8,263 2,102 23,888 - 1,616 35,869
Future debt service 4,233 - - 102 - 4,335
Instruction and research 12,498 146 113 18,731 - 31,488
Student aid 44,165 8,646 6,449 41,797 10,250 111,307
Endowments 33,576 13,710 2,874 - - 50,160
Capital projects 80,551 5,667 517,253 431 12,349 616,251
Other purposes 6,271 - 2,611 12,120 2,591 23,593
Unrestricted 209,740 176,388 17,112 98,537 203,775 705,552
Total net position 1,058,551$ 593,952$ 957,796$ 347,563$ 470,667$ 3,428,529$
233 - State of Indiana - Comprehensive Annual Financial Report

Sta
te o
f In
dia
na
Co
mb
inin
g S
tate
me
nt
of
Ac
tivit
ies
No
n-M
ajo
r D
isc
rete
ly P
res
en
ted
Co
mp
on
en
t U
nit
s -
Co
lle
ge
s a
nd
Un
ive
rsit
ies
Fo
r th
e Y
ea
r E
nd
ed
Ju
ne 3
0,
20
20
(am
ou
nts
ex
pre
ss
ed
in
th
ou
sa
nd
s)
Pro
gra
m R
eve
nu
es
Ex
pe
ns
es
C
ha
rge
s f
or
Se
rvic
es
Op
era
tin
g
Gra
nts
an
d
Co
ntr
ibu
tio
ns
Ca
pit
al G
ran
ts
an
d
Co
ntr
ibu
tio
ns
Ba
ll S
tate
Un
ive
rsit
y
In
dia
na
Sta
te
Un
ive
rsit
y
Ivy T
ec
h S
tate
Co
lle
ge
Un
ive
rsit
y o
f
So
uth
ern
Ind
ian
a
Vin
ce
nn
es
Un
ive
rsit
y
Ne
t (E
xp
en
se
)
Re
ve
nu
e
Ba
ll S
tate
Un
ive
rsity
56
6,6
59
$
22
5,4
98
$
13
2,7
80
$
5,7
35
$
(20
2,6
46
)$
-$
-
$
-$
-
$
(20
2,6
46
)$
Ind
ian
a S
tate
Un
ive
rsity
24
2,9
20
99
,29
7
67
,30
4
4,2
28
-
(7
2,0
91
)
-
-
-
(72
,09
1)
Ivy T
ech
Co
mm
un
ity C
olle
ge
56
0,6
09
14
4,8
10
18
5,6
25
12
,76
2
-
-
(21
7,4
12
)
-
-
(21
7,4
12
)
Un
ive
rsity o
f S
ou
the
rn I
nd
ian
a1
60
,65
9
7
2,1
56
3
6,6
20
1
,18
3
-
-
-
(50
,70
0)
-
(5
0,7
00
)
Vin
ce
nn
es U
niv
ers
ity
12
2,2
82
31
,55
5
49
,44
1
7,2
84
-
-
-
-
(34
,00
2)
(34
,00
2)
To
tal co
mp
on
en
t u
nits
1,6
53
,12
9$
5
73
,31
6$
4
71
,77
0$
3
1,1
92
$
(2
02
,64
6)
(7
2,0
91
)
(2
17
,41
2)
(5
0,7
00
)
(3
4,0
02
)
(5
76
,85
1)
Ge
ne
ral re
ve
nu
es:
Inve
stm
en
t e
arn
ing
s2
6,0
67
1
4,5
86
2
3,0
23
7
,54
1
8
,31
1
7
9,5
28
Pa
ym
en
ts f
rom
Sta
te o
f In
dia
na
20
3,1
26
84
,01
1
27
2,9
46
59
,25
0
56
,27
2
67
5,6
05
Oth
er
42
,65
6
73
5
27
23
2,6
59
46
,10
0
To
tal g
en
era
l re
ve
nu
es
27
1,8
49
99
,33
2
29
5,9
96
66
,81
4
67
,24
2
80
1,2
33
Ch
an
ge
in
ne
t p
ositio
n6
9,2
03
2
7,2
41
7
8,5
84
1
6,1
14
3
3,2
40
2
24
,38
2
Ne
t p
ositio
n -
be
gin
nin
g9
89
,34
8
5
66
,71
1
8
79
,21
2
3
31
,44
9
4
37
,42
7
3
,20
4,1
47
Ne
t p
os
itio
n -
en
din
g1
,05
8,5
51
$
59
3,9
52
$
95
7,7
96
$
34
7,5
63
$
47
0,6
67
$
3,4
28
,52
9$
Ne
t (E
xp
en
se
) R
eve
nu
e a
nd
Ch
an
ge
s in
Ne
t P
os
itio
n
Comprehensive Annual Financial Report - State of Indiana - 234

235 - State of Indiana - Comprehensive Annual Financial Report

STATISTICAL SECTION
Comprehensive Annual Financial Report - State of Indiana - 236

STATISTICAL SECTION
The statistical section is presented to provide report users a historical perspective and assistance in assessing the current financial status and trends for the State.
These schedules contain trend information to assist users in understanding and assessing how the State’s financial position has changed over time.
Net Position by Component .................................................................................................................................. 238 Changes in Net Position ....................................................................................................................................... 239 Fund Balances, Governmental Funds .................................................................................................................. 241 Changes in Fund Balances, Governmental Funds ............................................................................................... 243
These schedules contain information to assist users in understanding and assessing the factors affecting the State’s ability to generate its own-source revenues.
Taxable Sales by Industry .................................................................................................................................... 244 Sales Tax Revenue Payers by Industry ................................................................................................................ 245 Personal Income Tax Filers and Liability by Income Level ................................................................................... 246 Personal Income by Industry ................................................................................................................................ 247 Personal Income Tax Rates ................................................................................................................................. 248
This schedule is to assist users in understanding and assessing the State’s debt burden and its ability to issue debt.
Ratios of Outstanding Debt by Type .................................................................................................................... 249
These schedules are intended to assist users in understanding the socioeconomic environment within with the State operates and to provide information that facilitates comparisons of financial statement information.
State Facts .......................................................................................................................................................... 250 County Facts ....................................................................................................................................................... 251 Demographic and Economic Statistics ................................................................................................................ 252 Twenty Largest Indiana Public Companies .......................................................................................................... 253 Twenty Largest Indiana Private Companies ........................................................................................................ 254 Principal Employers ............................................................................................................................................. 255 School Enrollment ............................................................................................................................................... 256 Largest Indiana Private Colleges & Universities .................................................................................................. 257
These schedules provide contextual information about the State’s operations and resources to assist readers in using financial statement information to understand and assess the State’s economic condition.
Operating Indicators by Function of Government ................................................................................................ 258 Capital Assets Statistics by Function of Government........................................................................................... 259 Full Time State Employees Paid through the Auditor of State’s Office................................................................. 260 Employees Other Than Full Time Paid through the Auditor of State’s Office ....................................................... 261 Pension, Death Benefits, and Former Governors, Number of People Paid
Through the Auditor of State’s Office .............................................................................................................. 262
FINANCIAL TRENDS
REVENUE CAPACITY
DEBT CAPACITY
DEMOGRAPHIC AND ECONOMIC INFORMATION
OPERATING INFORMATION
237 - State of Indiana - Comprehensive Annual Financial Report

Sta
te o
f In
dia
na
Ne
t P
os
itio
n b
y C
om
po
ne
nt
(accru
al b
asis
of a
cco
un
tin
g, d
olla
rs in
th
ou
sa
nd
s)
Fis
ca
l Y
ea
r
20
11
20
12
20
13
20
14
20
15
20
16
20
17
20
18
20
19
20
20
Go
ve
rnm
enta
l a
ctivitie
s
Ne
t in
ve
stm
ent in
ca
pita
l a
sse
ts1
1,3
44
,65
0$
12
,17
5,4
13
$
13
,30
3,3
74
$
13
,50
1,4
19
$
14
,46
7,9
92
$
14
,93
4,6
00
$
15
,63
7,0
70
$
15
,90
7,5
41
$
16
,40
0,0
27
$
16
,83
4,0
97
$
Re
str
icte
d5
73
,11
5
88
3,8
77
9
61
,10
1
1,0
00
,29
8
99
8,6
09
1
,15
0,8
67
1,1
29
,78
7
1,0
88
,60
2
1,1
02
,61
9
1,1
05
,47
0
Unre
str
icte
d6
,97
9,7
15
6,1
58
,90
2
5,4
75
,10
3
(4,3
27
,35
3)
(4,1
94
,36
2)
(5,1
98
,96
2)
(5,6
91
,08
1)
(5,2
68
,01
1)
(2,8
93
,68
5)
(1,8
81
,62
2)
To
tal go
ve
rnm
enta
l a
ctivitie
s n
et po
sitio
n1
8,8
97
,48
0$
19
,21
8,1
92
$
19
,73
9,5
78
$
10
,17
4,3
64
$
11
,27
2,2
39
$
10
,88
6,5
05
$
11
,07
5,7
76
$
11
,72
8,1
32
$
14
,60
8,9
61
$
16
,05
7,9
45
$
Busin
ess-t
ype
activitie
s
Ne
t in
ve
stm
ent in
ca
pita
l a
sse
ts8
4$
68
5$
66
4$
53
5$
13
8$
23
8$
20
3$
19
4$
40
5$
38
2$
Re
str
icte
d-
- -
- -
23
3,0
46
4
77
,65
9
73
2,3
69
9
62
,47
6
42
6,8
59
Unre
str
icte
d(1
,69
0,5
40
)
(1,5
51
,50
7)
(1,2
13
,65
8)
(80
1,5
68
)
(23
,48
5)
4
7,3
32
4
7,1
82
4
7,6
18
5
2,8
27
5
8,9
60
To
tal b
usin
ess-t
ype
activitie
s n
et po
sitio
n(1
,69
0,4
56
)$
(1,5
50
,82
2)
$
(1,2
12
,99
4)
$
(80
1,0
33
)$
(23
,34
7)
$
2
80
,61
6$
52
5,0
44
$
78
0,1
81
$
1,0
15
,70
8$
48
6,2
01
$
Prim
ary
go
ve
rnm
ent
Ne
t in
ve
stm
ent in
ca
pita
l a
sse
ts1
1,3
44
,73
4$
12
,17
6,0
98
$
13
,30
4,0
38
$
13
,50
1,9
54
$
14
,46
8,1
30
$
14
,93
4,8
38
$
15
,63
7,2
73
$
15
,90
7,7
35
$
16
,40
0,4
32
$
16
,83
4,4
79
$
Re
str
icte
d5
73
,11
5
88
3,8
77
9
61
,10
1
1,0
00
,29
8
99
8,6
09
1
,38
3,9
13
1,6
07
,44
6
1,8
20
,97
1
2,0
65
,09
5
1,5
32
,32
9
Unre
str
icte
d5
,28
9,1
75
4,6
07
,39
5
4,2
61
,44
5
(5,1
28
,92
1)
(4,2
17
,84
7)
(5,1
51
,63
0)
(5,6
43
,89
9)
(5,2
20
,39
3)
(2,8
40
,85
8)
(1,8
22
,66
2)
To
tal p
rim
ary
go
ve
rnm
ent ne
t po
sitio
n1
7,2
07
,02
4$
17
,66
7,3
70
$
18
,52
6,5
84
$
9,3
73
,33
1$
11
,24
8,8
92
$
11
,16
7,1
21
$
11
,60
0,8
20
$
12
,50
8,3
13
$
15
,62
4,6
69
$
16
,54
4,1
46
$
Comprehensive Annual Financial Report - State of Indiana - 238
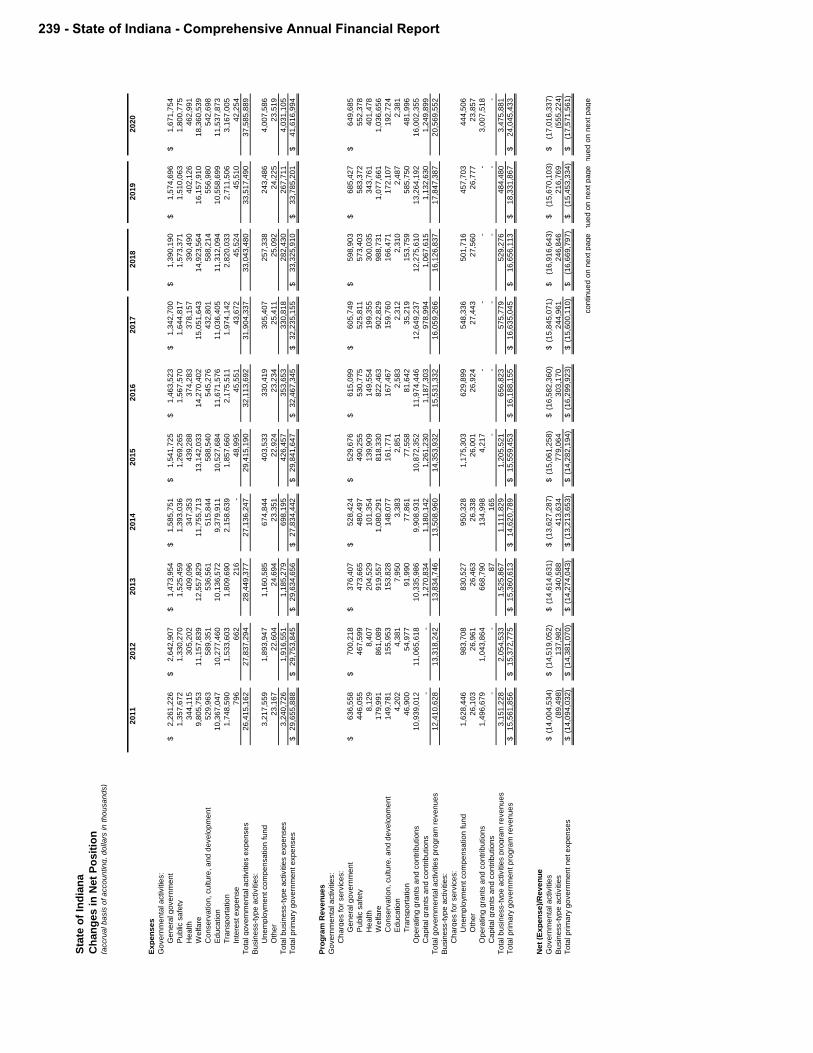
Sta
te o
f In
dia
na
Ch
an
ges i
n N
et
Po
sit
ion
(accru
al b
asis
of a
cco
un
tin
g, d
olla
rs in
th
ou
sa
nd
s)
20
11
20
12
20
13
20
14
20
15
20
16
20
17
20
18
20
19
20
20
Ex
pe
ns
es
Go
ve
rnm
en
tal a
ctivitie
s:
Ge
ne
ral g
ove
rnm
en
t2
,26
1,2
26
$
2,6
42
,90
7$
1,4
73
,95
4$
1,5
85
,75
1$
1,5
41
,72
5$
1,4
63
,52
3$
1,3
42
,70
0$
1,3
90
,19
0$
1,5
74
,69
6$
1,6
71
,75
4$
Pu
blic
sa
fety
1,3
57
,67
2
1,3
30
,27
0
1,5
25
,45
9
1,3
93
,03
6
1,2
69
,26
5
1,5
67
,57
0
1,6
44
,81
7
1,5
73
,37
1
1,5
10
,06
3
1,8
00
,77
5
He
alth
34
4,1
15
3
05
,20
2
40
9,0
96
3
47
,35
3
43
9,2
88
3
74
,28
3
37
8,1
57
3
90
,49
0
40
2,1
26
4
62
,99
1
We
lfa
re9
,80
5,7
53
11
,15
7,8
39
12
,55
7,8
29
11
,75
5,7
13
13
,14
2,0
33
14
,27
0,4
02
15
,05
1,6
43
14
,92
3,5
64
16
,15
7,9
10
18
,36
0,5
39
Co
nse
rva
tio
n, cu
ltu
re, a
nd
de
ve
lop
me
nt
52
9,9
63
5
89
,35
1
53
6,5
61
5
15
,84
4
58
8,5
40
5
45
,27
6
43
2,8
01
5
88
,21
4
55
6,9
80
5
42
,69
8
Ed
uca
tio
n1
0,3
67
,04
7
10
,27
7,4
60
10
,13
6,5
72
9,3
79
,91
1
10
,52
7,6
84
11
,67
1,5
76
11
,03
6,4
05
11
,31
2,0
94
10
,55
8,6
99
11
,53
7,8
73
Tra
nsp
ort
atio
n1
,74
8,5
90
1,5
33
,60
3
1,8
09
,69
0
2,1
58
,63
9
1,8
57
,66
0
2,1
75
,51
1
1,9
74
,14
2
2,8
20
,03
3
2,7
11
,50
6
3,1
67
,00
5
Inte
rest e
xp
en
se
79
6
66
2
21
6
- 4
8,9
95
4
5,5
51
4
3,6
72
4
5,5
24
4
5,5
10
4
2,2
54
To
tal g
ove
rnm
en
tal a
ctivitie
s e
xp
en
se
s2
6,4
15
,16
2
27
,83
7,2
94
28
,44
9,3
77
27
,13
6,2
47
29
,41
5,1
90
32
,11
3,6
92
31
,90
4,3
37
33
,04
3,4
80
33
,51
7,4
90
37
,58
5,8
89
Bu
sin
ess-t
yp
e a
ctivitie
s:
Un
em
plo
ym
en
t co
mp
en
sa
tio
n fu
nd
3,2
17
,55
9
1,8
93
,94
7
1,1
60
,58
5
67
4,8
44
4
03
,53
3
33
0,4
19
3
05
,40
7
25
7,3
38
2
43
,48
6
4,0
07
,58
6
Oth
er
23
,16
7
22
,60
4
24
,69
4
23
,35
1
22
,92
4
23
,23
4
25
,41
1
25
,09
2
24
,22
5
23
,51
9
To
tal b
usin
ess-t
yp
e a
ctivitie
s e
xp
en
se
s3
,24
0,7
26
1,9
16
,55
1
1,1
85
,27
9
69
8,1
95
4
26
,45
7
35
3,6
53
3
30
,81
8
28
2,4
30
2
67
,71
1
4,0
31
,10
5
To
tal p
rim
ary
go
ve
rnm
en
t e
xp
en
se
s2
9,6
55
,88
8$
29
,75
3,8
45
$
29
,63
4,6
56
$
27
,83
4,4
42
$
29
,84
1,6
47
$
32
,46
7,3
45
$
32
,23
5,1
55
$
33
,32
5,9
10
$
33
,78
5,2
01
$
41
,61
6,9
94
$
Pro
gra
m R
ev
en
ue
s
Go
ve
rnm
en
tal a
ctivitie
s:
Ch
arg
es fo
r se
rvic
es:
Ge
ne
ral g
ove
rnm
en
t6
36
,55
8$
70
0,2
18
$
37
6,4
07
$
52
8,4
24
$
52
9,6
76
$
61
5,0
99
$
60
5,7
49
$
59
8,9
03
$
68
5,4
27
$
64
9,6
85
$
Pu
blic
sa
fety
44
6,0
55
4
67
,59
9
47
3,6
65
4
80
,49
7
49
0,2
55
5
30
,77
5
52
5,8
11
5
73
,40
3
58
3,3
72
5
52
,37
8
He
alth
8,1
29
8
,40
7
20
4,5
29
1
01
,35
4
13
9,9
09
1
49
,55
4
19
9,3
55
3
00
,03
5
34
3,7
61
4
01
,47
8
We
lfa
re1
79
,99
1
86
1,0
89
9
19
,55
7
1,0
80
,29
1
81
8,3
30
8
22
,46
3
90
2,8
29
9
88
,73
1
1,0
77
,66
1
1,0
36
,65
6
Co
nse
rva
tio
n, cu
ltu
re, a
nd
de
ve
lop
me
nt
14
9,7
81
1
55
,95
3
15
3,8
28
1
48
,07
7
16
1,7
71
1
67
,46
7
15
9,7
60
1
66
,47
1
17
2,1
07
1
92
,72
4
Ed
uca
tio
n4
,20
2
4,3
81
7
,95
0
3,3
83
2
,85
1
2,5
83
2
,31
2
2,3
10
2
,48
7
2,3
81
Tra
nsp
ort
atio
n4
6,9
00
5
4,9
77
9
1,9
90
7
7,8
61
7
7,5
58
8
1,6
42
3
5,2
19
1
53
,75
9
58
5,7
50
4
81
,99
6
Op
era
tin
g g
ran
ts a
nd
co
ntr
ibu
tio
ns
10
,93
9,0
12
11
,06
5,6
18
10
,33
5,9
86
9,9
08
,93
1
10
,87
2,3
52
11
,97
4,4
46
12
,64
9,2
37
12
,27
5,6
10
13
,26
4,1
92
16
,00
2,3
55
Ca
pita
l g
ran
ts a
nd
co
ntr
ibu
tio
ns
- -
1,2
70
,83
4
1,1
80
,14
2
1,2
61
,23
0
1,1
87
,30
3
97
8,9
94
1
,06
7,6
15
1,1
32
,63
0
1,2
49
,89
9
To
tal g
ove
rnm
en
tal a
ctivitie
s p
rog
ram
re
ve
nu
es
12
,41
0,6
28
13
,31
8,2
42
13
,83
4,7
46
13
,50
8,9
60
14
,35
3,9
32
15
,53
1,3
32
16
,05
9,2
66
16
,12
6,8
37
17
,84
7,3
87
20
,56
9,5
52
Bu
sin
ess-t
yp
e a
ctivitie
s:
Ch
arg
es fo
r se
rvic
es:
Un
em
plo
ym
en
t co
mp
en
sa
tio
n fu
nd
1,6
28
,44
6
98
3,7
08
8
30
,52
7
95
0,3
28
1
,17
5,3
03
62
9,8
99
5
48
,33
6
50
1,7
16
4
57
,70
3
44
4,5
06
Oth
er
26
,10
3
26
,96
1
26
,46
3
26
,33
8
26
,00
1
26
,92
4
27
,44
3
27
,56
0
26
,77
7
23
,85
7
Op
era
tin
g g
ran
ts a
nd
co
ntr
ibu
tio
ns
1,4
96
,67
9
1,0
43
,86
4
66
8,7
90
1
34
,99
8
4,2
17
-
- -
- 3
,00
7,5
18
Ca
pita
l g
ran
ts a
nd
co
ntr
ibu
tio
ns
- -
87
1
65
-
- -
- -
-
To
tal b
usin
ess-t
yp
e a
ctivitie
s p
rog
ram
re
ve
nu
es
3,1
51
,22
8
2,0
54
,53
3
1,5
25
,86
7
1,1
11
,82
9
1,2
05
,52
1
65
6,8
23
5
75
,77
9
52
9,2
76
4
84
,48
0
3,4
75
,88
1
To
tal p
rim
ary
go
ve
rnm
en
t p
rog
ram
re
ve
nu
es
15
,56
1,8
56
$
15
,37
2,7
75
$
15
,36
0,6
13
$
14
,62
0,7
89
$
15
,55
9,4
53
$
16
,18
8,1
55
$
16
,63
5,0
45
$
16
,65
6,1
13
$
18
,33
1,8
67
$
24
,04
5,4
33
$
Ne
t (E
xp
en
se
)/R
ev
en
ue
Go
ve
rnm
en
tal a
ctivitie
s(1
4,0
04
,53
4)
$
(14
,51
9,0
52
)$
(1
4,6
14
,63
1)
$
(13
,62
7,2
87
)$
(1
5,0
61
,25
8)
$
(16
,58
2,3
60
)$
(1
5,8
45
,07
1)
$
(16
,91
6,6
43
)$
(15
,67
0,1
03
)$
(17
,01
6,3
37
)$
Bu
sin
ess-t
yp
e a
ctivitie
s(8
9,4
98
)
13
7,9
82
3
40
,58
8
41
3,6
34
7
79
,06
4
30
3,1
70
2
44
,96
1
24
6,8
46
2
16
,76
9
(55
5,2
24
)
To
tal p
rim
ary
go
ve
rnm
en
t n
et e
xp
en
se
s(1
4,0
94
,03
2)
$
(14
,38
1,0
70
)$
(1
4,2
74
,04
3)
$
(13
,21
3,6
53
)$
(1
4,2
82
,19
4)
$
(16
,29
9,9
23
)$
(1
5,6
00
,11
0)
$
(16
,66
9,7
97
)$
(15
,45
3,3
34
)$
(17
,57
1,5
61
)$
co
ntin
ue
d o
n n
ext p
ag
eco
ntin
ue
d o
n n
ext p
ag
eco
ntin
ue
d o
n n
ext p
ag
e
239 - State of Indiana - Comprehensive Annual Financial Report

20
11
20
12
20
13
20
14
20
15
20
16
20
17
20
18
20
19
20
20
Ge
ne
ral R
ev
en
ue
s a
nd
Oth
er
Ch
an
ge
s in
Ne
t P
os
itio
n
Go
ve
rnm
en
tal a
ctivitie
s:
Ta
xe
s
Inco
me
ta
xe
s5
,78
1,3
40
$
5,4
24
,34
7$
5,3
71
,04
0$
5,8
11
,82
3$
6,2
59
,26
2$
6,2
34
,70
4$
6,4
52
,61
1$
6,3
62
,87
6$
6,8
64
,32
1$
6,7
88
,47
2$
Sa
les ta
xe
s6
,36
5,0
77
6,5
20
,66
4
6,8
45
,29
4
6,9
95
,67
8
7,2
66
,58
1
7,3
36
,63
0
7,5
77
,29
2
7,8
04
,94
2
8,0
85
,69
1
8,3
20
,68
2
Fu
el ta
xe
s7
54
,83
9
76
2,5
63
79
1,6
59
76
3,8
33
79
3,9
66
80
6,8
95
87
1,1
89
1,4
72
,52
1
1,4
94
,94
6
1,4
49
,90
2
Ga
min
g ta
xe
s9
04
,35
3
86
7,0
55
78
8,6
36
68
1,3
83
64
2,9
10
62
9,9
10
62
3,4
60
63
0,2
49
61
9,8
88
44
9,7
13
Un
em
plo
ym
en
t ta
xe
s3
20
10
2
80
91
4
-
-
-
-
-
-
Inh
erita
nce
ta
xe
s1
60
,91
7
16
9,7
69
16
0,8
20
53
,70
1
-
-
-
-
-
-
Alc
oh
ol &
To
ba
cco
ta
xe
s4
64
,69
9
47
9,6
21
50
3,8
79
44
5,3
81
44
5,7
65
44
3,2
14
44
1,9
35
41
8,6
09
41
1,2
91
42
6,4
76
Insu
ran
ce
ta
xe
s1
89
,94
8
20
6,7
33
21
1,9
87
22
4,7
11
22
3,0
39
23
5,3
10
23
5,0
22
23
0,9
97
25
6,2
92
24
8,4
14
Fin
an
cia
l in
stitu
tio
n ta
xe
s8
4,7
43
71
,46
7
12
1,3
69
72
,97
6
12
0,9
00
12
0,2
26
10
3,7
35
10
5,0
01
17
3,9
95
14
9,0
61
Oth
er
taxe
s2
22
,60
3
22
8,9
19
25
1,5
79
32
5,2
65
32
9,7
80
31
6,6
52
32
6,4
18
35
5,8
62
36
8,6
07
41
8,4
92
Inve
stm
en
t e
arn
ing
s2
2,4
60
16
,34
5
27
,99
0
19
,76
9
22
,08
4
38
,31
8
46
,64
1
89
,24
2
18
9,9
09
17
2,4
45
Oth
er
35
,28
3
90
,07
8
58
,91
5
58
,91
2
52
,09
3
32
,21
7
27
,81
4
41
,15
9
42
,73
0
41
,27
2
Tra
nsfe
rs w
ith
in p
rim
ary
go
ve
rnm
en
t2
,61
8
2,1
01
2,7
69
2,7
24
2,7
53
2,5
50
2,2
42
2,0
89
1,9
86
39
2
To
tal g
ove
rnm
en
tal a
ctivitie
s1
4,9
89
,20
0
14
,83
9,7
64
15
,13
6,0
17
15
,45
7,0
70
16
,15
9,1
33
16
,19
6,6
26
16
,70
8,3
59
17
,51
3,5
47
18
,50
9,6
56
18
,46
5,3
21
Bu
sin
ess-t
yp
e a
ctivitie
s:
Inve
stm
en
t e
arn
ing
s1
,75
0
3,7
53
9
1,0
51
1,3
75
3,3
43
1,7
09
10
,38
0
20
,58
2
25
,88
3
Oth
er
10
,00
0
-
-
-
-
-
-
-
16
2
22
8
Tra
nsfe
rs w
ith
in p
rim
ary
go
ve
rnm
en
t(2
,61
8)
(2,1
01
)
(2,7
69
)
(2,7
24
)
(2,7
53
)
(2,5
50
)
(2,2
42
)
(2,0
89
)
(1,9
86
)
(39
4)
To
tal b
usin
ess-t
yp
e a
ctivitie
s9
,13
2
1,6
52
(2,7
60
)
(1,6
73
)
(1,3
78
)
79
3
(53
3)
8,2
91
18
,75
8
25
,71
7
To
tal p
rim
ary
go
ve
rnm
en
t1
4,9
98
,33
2
14
,84
1,4
16
15
,13
3,2
57
15
,45
5,3
97
16
,15
7,7
55
16
,19
7,4
19
16
,70
7,8
26
17
,52
1,8
38
18
,52
8,4
14
18
,49
1,0
38
Ch
an
ge
s in
Ne
t P
os
itio
n
Go
ve
rnm
en
tal a
ctivitie
s9
84
,66
6
32
0,7
12
52
1,3
86
1,8
29
,78
3
1,0
97
,87
5
(38
5,7
34
)
86
3,2
88
59
6,9
04
2,8
39
,55
3
1,4
48
,98
4
Bu
sin
ess-t
yp
e a
ctivitie
s(8
0,3
66
)
13
9,6
34
33
7,8
28
41
1,9
61
77
7,6
86
30
3,9
63
24
4,4
28
25
5,1
37
23
5,5
27
(52
9,5
07
)
To
tal p
rim
ary
go
ve
rnm
en
t9
04
,30
0$
46
0,3
46
$
85
9,2
14
$
2,2
41
,74
4$
1,8
75
,56
1$
(81
,77
1)
$
1,1
07
,71
6$
85
2,0
41
$
3,0
75
,08
0$
91
9,4
77
$
Comprehensive Annual Financial Report - State of Indiana - 240

Sta
te o
f In
dia
na
Fu
nd
Ba
lan
ce
s,
Go
ve
rnm
en
tal
Fu
nd
s,
(modifie
d a
ccru
al basis
of accounting, dolla
rs in thousands)
2011
2012
2013
2014
2015
2016
2017
2018
2019
2020
Genera
l F
und
Nonspendable
Pre
paid
expense
-$
-$
60,9
55
$
99,0
22
$
98,7
12
$
83,1
05
$
77,5
46
$
75,0
21
$
76,4
00
$
73,0
15
$
T
ota
l N
onspendable
-
-
60,9
55
99,0
22
98,7
12
83,1
05
77,5
46
75,0
21
76,4
00
73,0
15
Restr
icte
d
Adm
inis
tration
71,9
90
363,2
12
378,5
59
379,5
68
382,3
24
547,9
31
550,4
60
507,3
92
523,1
89
543,3
48
T
ota
l R
estr
icte
d71,9
90
363,2
12
378,5
59
379,5
68
382,3
24
547,9
31
550,4
60
507,3
92
523,1
89
543,3
48
Com
mitte
d
Adm
inis
tration
-
20,8
59
-
-
-
-
-
4,2
41
70
-
Econom
ic d
evelo
pm
ent
-
-
6,0
30
5,6
28
5,3
39
2,5
51
3,5
39
4,8
46
765
920
Roads &
bridges
-
-
-
20
-
-
21,2
12
46,2
74
40,8
89
33,3
36
T
ota
l C
om
mitte
d-
20,8
59
6,0
30
5,6
48
5,3
39
2,5
51
24,7
51
55,3
61
41,7
24
34,2
56
Assig
ned
Adm
inis
tration
65,1
56
41,5
50
72,5
75
65,4
21
102,1
89
160,8
75
210,3
27
244,7
24
87,9
72
95,7
78
Corr
ections
6,7
17
11,6
80
46,1
95
12,7
24
9,1
50
569,1
49
730,2
30
554,2
63
390,1
31
209,8
34
Polic
e &
pro
tection
1,6
79
2,9
20
11,2
77
11,8
91
14,6
22
23,2
37
27,6
06
23,6
57
20,7
01
29,1
94
Menta
l health
-
-
-
-
-
26,4
91
38,4
85
36,3
61
162,8
47
100,8
84
Public
health
-
-
22
22
22
28,6
98
18,7
32
20,3
31
13,0
71
6,9
26
Child
serv
ices
77,2
85
73,3
02
205,7
13
522,3
88
638,8
15
902,0
85
877,8
90
1,1
04,4
93
1,0
49,1
06
241,4
12
Dis
abili
ty &
agin
g-
-
3
4
4
12,9
60
15,8
39
46,4
75
24,9
89
48,3
03
Econom
ic d
evelo
pm
ent
26,0
44
9,7
33
862
1,0
73
623
12,5
41
4,0
28
6,0
03
5,2
36
2,4
18
Environm
enta
l16,5
28
6,1
77
552
427
364
16,5
18
18,0
49
14,1
44
25,3
87
23,1
63
Natu
ral re
sourc
es
7,5
13
2,8
08
249
147
149
1,0
86
1,1
51
1,0
41
462
1,0
29
Hig
her
education
-
-
-
-
-
10,8
71
286,2
26
93,1
43
45,8
73
65,2
91
Secondary
education
9,5
72
6,3
46
5,3
11
158,5
64
304,2
36
416,5
78
412,9
18
393,5
72
404,0
72
409,7
43
Roads &
bridges
2,9
25
1,0
68
81
63
33
2
74,7
02
47,3
10
130,2
08
124,1
90
Capital outlay
84,8
55
54,1
12
31,9
29
143,2
35
175,8
10
164,9
23
144,8
79
261,7
87
177,3
52
236,9
23
Oth
er
purp
oses
1,5
15
966
44,7
05
158,0
60
41,5
59
18,5
41
90,0
29
181,8
88
145,9
08
250,4
50
Encum
bra
nces
303,0
18
441,4
12
759,5
40
737,2
49
931,1
94
-
-
-
-
-
T
ota
l A
ssig
ned
602,8
07
652,0
74
1,1
79,0
14
1,8
11,2
68
2,2
18,7
70
2,3
64,5
55
2,9
51,0
91
3,0
29,1
92
2,6
83,3
15
1,8
45,5
38
Unassig
ned
2,3
58,2
83
2,3
54,9
99
1,7
12,7
95
1,3
25,9
10
1,0
17,8
29
835,5
91
297,2
23
275,9
35
1,0
24,7
53
2,1
42,4
47
Tota
l genera
l fu
nd
3,0
33,0
80
$
3,3
91,1
44
$
3,3
37,3
53
$
3,6
21,4
16
$
3,7
22,9
74
$
3,8
33,7
33
$
3,9
01,0
71
$
3,9
42,9
01
$
4,3
49,3
81
$
4,6
38,6
04
$
continued o
n n
ext page
241 - State of Indiana - Comprehensive Annual Financial Report

Sta
te o
f In
dia
na
Fu
nd
Ba
lan
ce
s,
Go
ve
rnm
en
tal
Fu
nd
s,
(modifie
d a
ccru
al basis
of accounting, dolla
rs in thousands)
2011
2012
2013
2014
2015
2016
2017
2018
2019
2020
All
oth
er
Govern
menta
l F
unds
Nonspendable
Perm
anent fu
nd p
rincip
al
501,1
25
$
520,6
65
$
520,6
65
$
521,0
28
$
501,1
25
$
520,1
24
$
501,1
25
$
501,1
25
$
502,8
35
$
502,8
35
$
Pre
paid
expense
-
-
922
680
496
344
163
43
44
45
T
ota
l N
onspendable
501,1
25
520,6
65
521,5
87
521,7
08
501,6
21
520,4
68
501,2
88
501,1
68
502,8
79
502,8
80
Restr
icte
d
Natu
ral re
sourc
es
-
-
-
-
-
-
100
150
150
150
Oth
er
purp
oses
-
-
-
-
-
-
-
3,4
89
3,3
99
3,3
64
T
ota
l R
estr
icte
d-
-
-
-
-
-
100
3,6
39
3,5
49
3,5
14
Com
mitte
d
Adm
inis
tration
-
580,2
45
6,7
34
8,5
81
7,6
82
7,7
21
8,8
02
4,2
00
2,6
62
2,6
34
Public
health
3
306,7
93
316,2
90
353,8
81
284,5
04
197,4
00
188,7
28
198,7
56
193,4
58
232,5
67
Econom
ic d
evelo
pm
ent
-
103
11,2
70
10,3
13
9,9
11
7,4
02
6,4
64
9,4
35
8,9
54
8,6
78
Environm
enta
l-
561
646
537
568
1,4
12
2,5
02
355
269
Natu
ral re
sourc
es
-
468
144
19,1
23
-
16,7
59
18,3
31
16,1
46
15,3
50
Hig
her
education
4
4
3
4
5
5
18
29
29
Secondary
education
553,6
86
72
564,6
81
569,5
55
572,8
43
577,1
24
580,1
99
583,6
46
589,2
20
591,6
92
Roads &
bridges
16,1
80
171,7
33
166,1
66
175,3
43
194,8
12
45,7
32
37,9
64
41,7
38
75,9
10
100,0
26
Capital outlay
-
-
-
-
-
-
-
-
-
Oth
er
purp
oses
-
14,8
18
14,9
72
14,2
77
14,0
67
14,4
31
15,4
75
16,8
78
17,7
02
T
ota
l C
om
mitte
d569,8
73
1,0
58,9
46
1,0
80,9
92
1,1
33,4
38
1,1
03,6
93
850,0
19
854,7
64
874,1
01
903,6
12
968,9
47
Assig
ned
Adm
inis
tration
423,5
53
263,2
10
155,5
32
136,0
70
131,9
35
133,5
84
162,5
38
195,9
94
214,1
38
208,5
41
Corr
ections
14,9
76
26,9
45
10,6
76
11,8
72
13,4
30
14,1
93
21,8
59
18,3
21
21,1
91
27,1
75
Polic
e &
pro
tection
284,5
51
511,9
47
190,8
02
256,4
84
229,1
90
287,4
89
312,4
32
336,4
19
386,0
88
455,5
51
Menta
l health
62,7
09
52,3
35
62,0
61
68,5
76
51,3
28
46,9
95
50,4
93
46,3
39
25,6
00
21,9
63
Public
health
689,8
01
575,6
80
692,3
40
669,3
93
734,0
43
727,0
99
807,4
03
893,9
66
868,3
75
627,6
72
Child
serv
ices
134,3
77
112,1
46
133,7
53
160,8
95
183,9
26
141,4
64
85,5
63
62,4
34
78,7
98
86,7
52
Dis
abili
ty &
agin
g8,9
58
7,4
76
9,4
45
9,2
23
8,4
55
3,4
45
8,7
52
5,4
94
10,8
60
16,2
28
Econom
ic d
evelo
pm
ent
43,7
34
53,9
42
43,1
35
47,5
54
51,6
85
59,3
52
15,1
96
22,0
71
28,3
73
38,1
67
Environm
enta
l94,7
57
116,8
74
88,4
26
113,3
20
113,3
66
113,1
64
115,7
74
95,5
66
99,3
54
113,8
96
Natu
ral re
sourc
es
104,4
76
128,8
61
105,7
46
127,9
59
137,4
33
138,6
36
147,2
42
131,9
18
141,5
50
208,3
04
Hig
her
education
27,8
12
19,7
45
23,5
82
42,0
80
35,7
64
69,2
97
94,5
18
13,7
73
16,1
08
15,5
82
Secondary
education
35,3
96
25,1
29
29,6
98
9,6
26
20,6
12
21,6
14
21,4
75
19,4
03
47,2
52
72,4
22
Roads &
bridges
2,0
71,4
04
1,4
90,7
93
1,1
41,4
14
1,1
18,8
84
1,0
94,3
02
1,1
65,8
86
1,3
10,9
25
1,4
31,2
83
1,8
94,5
09
1,9
21,0
14
Capital outlay
138,9
78
86,3
66
66,1
92
76,8
83
63,0
59
93,8
11
84,2
45
97,0
34
93,2
72
110,8
50
Oth
er
purp
oses
99,2
70
61,6
90
52,3
51
57,4
54
72,3
76
78,4
25
74,3
61
86,9
98
111,3
73
109,6
19
T
ota
l A
ssig
ned
4,2
34,7
53
3,5
33,1
38
2,8
05,1
53
2,9
06,2
73
2,9
40,9
04
3,0
94,4
54
3,3
12,7
76
3,4
57,0
13
4,0
36,8
41
4,0
33,7
36
Unassig
ned
(248,2
33)
(258,5
50)
(176,6
49)
(180,2
02)
(327,9
55)
(384,7
01)
(616,9
55)
(520,7
85)
(486,4
55)
(462,4
31)
Tota
l all
oth
er
govern
menta
l fu
nds
5,0
57,5
18
$
4,8
54,1
99
$
4,2
31,0
83
$
4,3
81,2
17
$
4,2
18,2
63
$
4,0
80,2
40
$
4,0
51,9
73
$
4,3
15,1
36
$
4,9
60,4
26
$
5,0
46,6
46
$
Comprehensive Annual Financial Report - State of Indiana - 242

Sta
te o
f In
dia
na
Ch
an
ges in
Fu
nd
Bala
nces, G
overn
men
tal F
un
ds,
(modifie
d a
ccru
al basis
of accounting, dolla
rs in thousands)
Fis
cal Y
ear
2011
2012
2013
2014
2015
2016
2017
2018
2019
2020
Reven
ues
Incom
e taxes
5,5
01,1
54
$
5,7
73,1
37
$
5,4
41,6
31
$
5,8
91,0
93
$
6,2
46,8
97
$
6,3
00,9
08
$
6,4
40,7
29
$
6,4
00,6
68
$
6,8
50,8
51
$
6,6
86,0
04
$
Sale
s taxes
6,3
08,3
56
6,6
54,0
08
6,8
22,8
75
7,0
46,7
34
7,2
69,2
91
7,3
51,7
88
7,5
78,5
08
7,8
30,1
42
8,0
87,3
20
8,3
13,3
16
Fuels
taxes
747,5
45
780,6
53
785,7
44
777,4
48
795,0
23
809,6
92
871,0
05
1,4
73,2
36
1,4
95,6
16
1,4
49,3
60
Gam
ing taxes
904,3
54
867,0
73
788,5
45
681,5
01
642,9
02
629,9
41
623,4
69
630,2
62
619,8
87
449,7
12
Unem
plo
yment ta
xes
320
102
80
914
-
-
-
-
-
-
Inherita
nce taxes
160,9
12
169,7
92
160,8
20
53,7
01
-
-
-
-
-
-
Alc
ohol and tobacco taxes
463,6
08
477,5
07
477,4
48
447,7
95
439,4
51
443,1
92
439,2
43
427,5
68
415,1
79
425,3
34
Insura
nce taxes
189,9
48
206,7
34
211,9
87
224,7
12
223,0
40
235,3
10
235,0
22
230,9
98
256,2
93
248,4
14
Fin
ancia
l in
stitu
tions taxes
56,7
26
92,7
63
120,5
71
92,8
62
125,7
54
119,3
45
103,5
04
105,9
63
173,5
18
142,6
87
Oth
er
taxes
221,2
64
238,4
59
251,5
51
325,2
99
329,3
80
316,9
82
326,4
89
355,8
76
368,4
34
418,0
07
Curr
ent serv
ice c
harg
es
1,4
72,5
70
2,2
12,0
27
2,2
68,4
29
2,4
24,5
42
2,2
19,4
01
2,3
66,3
44
2,4
33,3
45
2,7
84,9
00
3,4
49,0
88
3,3
21,8
18
Investm
ent in
com
e170,7
68
86,7
50
56,0
05
44,7
43
49,7
44
68,2
60
70,2
88
107,7
53
263,2
36
231,1
18
Sale
s/r
ent
19,2
64
28,5
23
21,4
12
21,7
71
22,1
81
19,6
80
22,8
90
15,9
33
17,3
44
18,0
14
Gra
nts
10,7
83,8
07
10,8
27,1
80
11,2
60,4
30
11,3
42,5
54
11,8
50,7
48
13,1
19,9
23
13,4
71,5
61
13,2
15,5
02
14,3
57,9
83
16,7
05,0
76
Oth
er
95,1
56
160,7
71
147,9
36
136,3
46
135,8
05
99,5
10
131,0
32
138,4
85
115,5
16
144,1
66
Tota
l re
venues
27,0
95,7
52
28,5
75,4
79
28,8
15,4
64
29,5
12,0
15
30,3
49,6
17
31,8
80,8
75
32,7
47,0
85
33,7
17,2
86
36,4
70,2
65
38,5
53,0
26
Exp
en
dit
ure
s
Genera
l govern
ment
2,2
06,7
73
2,5
97,5
13
1,8
84,7
70
1,5
05,4
75
1,6
54,0
82
1,5
45,4
61
1,3
46,9
96
1,3
43,3
65
1,5
86,4
73
1,6
72,5
80
Public
safe
ty1,3
48,9
98
1,3
43,2
99
1,6
15,9
75
1,4
10,7
23
1,3
83,4
79
1,5
37,6
49
1,6
29,4
84
1,6
40,5
83
1,7
30,3
63
1,8
07,2
15
Health
345,5
52
308,9
94
407,3
54
352,6
24
439,5
29
375,6
16
377,8
09
385,6
61
407,6
10
447,1
88
Welfare
9,9
11,1
29
11,0
72,3
82
12,1
87,7
64
12,3
32,6
00
12,9
78,6
55
14,3
47,7
63
15,1
03,2
84
15,1
51,9
14
16,3
52,8
26
18,3
67,3
47
Conserv
ation, culture
and d
evelo
pm
ent
587,6
69
538,2
97
556,7
95
514,6
55
518,4
78
546,6
44
554,4
36
560,3
29
569,2
42
551,3
54
Education
10,1
15,0
73
10,1
89,0
27
10,2
76,5
64
10,5
42,0
87
10,6
88,2
55
10,9
41,0
14
11,0
47,0
01
11,4
02,9
21
11,6
50,8
49
11,7
12,7
41
Tra
nsport
ation
2,2
97,3
16
2,4
44,5
90
2,5
64,3
67
2,4
36,6
06
2,6
25,7
44
2,4
99,5
95
2,9
49,4
89
3,0
79,1
47
3,0
28,6
08
3,4
89,0
18
Capital outlay
-
-
14,0
06
16,9
99
26,2
52
15,7
15
20,5
99
16,5
70
20,8
42
22,8
72
Debt serv
ice
Capital le
ase p
rincip
al
-
-
-
-
58,7
03
61,7
65
63,2
06
58,8
62
70,8
12
69,6
16
Capital le
ase inte
rest
-
-
-
-
48,9
95
45,5
51
43,6
72
45,5
24
45,5
10
42,2
21
Tota
l expenditure
s26,8
12,5
10
28,4
94,1
02
29,5
07,5
95
29,1
11,7
69
30,4
22,1
72
31,9
16,7
73
33,1
35,9
76
33,6
84,8
76
35,4
63,1
35
38,1
82,1
52
Revenues o
ver
(under)
expenditure
s283,2
42
81,3
77
(692,1
31)
400,2
46
(72,5
55)
(35,8
98)
(388,8
91)
32,4
10
1,0
07,1
30
370,8
74
Oth
er
Fin
an
cin
g S
ou
rces (
Uses)
Tra
nsfe
rs in
6,5
97,5
79
7,2
80,6
45
6,3
26,1
78
6,0
66,3
09
6,2
52,2
61
6,0
16,7
90
6,6
35,8
00
6,0
42,1
66
6,8
41,2
56
6,8
28,3
94
Tra
nsfe
rs (
out)
(6,5
94,9
61)
(7,2
39,0
94)
(6,3
29,4
65)
(6,0
61,5
30)
(6,2
45,7
27)
(6,0
14,2
98)
(6,6
34,8
58)
(6,0
39,7
46)
(6,8
40,2
53)
(6,8
23,9
86)
Issuance o
f capital le
ases
2,9
95
31,8
17
18,5
11
10,6
45
4,6
25
6,1
42
476,5
05
214,7
11
5,9
33
161
Tota
l oth
er
financin
g s
ourc
es (
uses)
5,6
13
73,3
68
15,2
24
15,4
24
11,1
59
8,6
34
477,4
47
217,1
31
6,9
36
4,5
69
Net
Ch
an
ge in
Fu
nd
Bala
nces
288,8
55
$
154,7
45
$
(676,9
07)
$
415,6
70
$
(61,3
96)
$
(27,2
64)
$
88,5
56
$
249,5
41
$
1,0
14,0
66
$
375,4
43
$
Deb
t S
erv
ice a
s a
Perc
en
tag
e o
f
No
ncap
ital E
xp
en
dit
ure
sN
/AN
/AN
/AN
/A0.3
6%
0.3
4%
0.3
2%
0.3
1%
0.3
3%
0.2
9%
243 - State of Indiana - Comprehensive Annual Financial Report

Sta
te o
f In
dia
na
Taxab
le S
ale
s b
y I
nd
ustr
y*
Last
Ten
Fis
cal
Years
(in
th
ou
sa
nd
s o
f d
olla
rs)
20
11
***
20
12
***
20
13
***
20
14
***
20
15
***
20
16
***
20
17
***
20
18
***
20
19
***
20
20
Ag
ricu
ltu
ral/fo
restr
y,
fish
ing
, a
nd
oth
er
12
9,7
17
$
12
8,4
97
$
1
27
,75
4$
13
9,7
38
$
1
48
,31
8$
15
4,4
62
$
1
60
,99
9$
15
2,6
51
$
1
64
,46
7$
11
4,8
95
$
Co
nstr
uctio
n1
,35
1,4
40
$
1,5
18
,74
5$
1,5
92
,37
5$
1,7
89
,91
4$
1,8
68
,81
9$
1,9
01
,21
9$
1,9
83
,35
0$
2,0
11
,58
2$
2,0
81
,37
8$
1,6
91
,39
6$
Fin
an
ce
, in
su
ran
ce
, a
nd
re
al e
sta
te2
,09
8,4
34
$
2,1
52
,15
1$
2,1
88
,20
1$
2,3
03
,70
9$
2,5
11
,21
3$
2,8
02
,57
2$
2,9
80
,75
0$
3,1
86
,82
2$
3,4
84
,20
1$
2,7
49
,09
1$
Go
ve
rnm
en
t1
,97
9,3
46
$
1,8
94
,43
2$
1,8
84
,43
6$
2,0
57
,26
8$
2,1
16
,33
1$
2,0
68
,38
5$
2,3
37
,02
7$
2,4
39
,21
2$
2,4
62
,25
2$
1,9
73
,87
1$
Ma
nu
factu
rin
g3
,71
9,7
78
$
3,9
46
,20
4$
4,1
02
,46
5$
4,0
60
,30
4$
4,2
15
,72
8$
4,4
76
,55
0$
4,7
99
,04
8$
5,0
61
,91
5$
5,3
33
,65
5$
4,1
89
,57
4$
Min
ing
11
5,9
08
$
12
6,5
59
$
1
27
,44
4$
15
9,1
49
$
1
68
,19
7$
15
7,6
95
$
1
63
,01
7$
18
6,4
81
$
2
04
,10
4$
16
2,0
25
$
Re
tail
tra
de
50
,43
8,5
91
$
5
2,1
50
,47
7$
5
2,6
66
,15
4$
5
3,4
60
,63
4$
5
4,2
49
,78
2$
5
6,1
92
,45
7$
5
7,5
55
,16
4$
5
8,9
87
,88
7$
6
1,8
17
,13
4$
4
8,9
33
,13
7$
Se
rvic
es
20
,22
1,9
46
$
2
1,4
40
,23
0$
2
2,0
81
,35
7$
2
2,6
99
,63
1$
2
3,7
15
,80
0$
2
4,4
48
,81
9$
2
4,8
86
,84
1$
2
5,2
55
,38
7$
2
5,5
94
,79
5$
1
9,8
59
,77
1$
Tra
nsp
ort
atio
n a
nd
pu
blic
utilit
ies
8,9
14
,31
3$
8
,68
9,2
36
$
9
,26
9,4
46
$
1
0,1
12
,60
4$
1
0,1
17
,33
7$
9
,22
5,1
20
$
9
,94
3,2
65
$
1
0,4
99
,39
7$
1
0,7
17
,89
1$
8
,65
5,1
82
$
Wh
ole
sa
le t
rad
e5
,39
5,0
95
$
5,8
35
,48
9$
5,9
28
,93
5$
6,2
83
,45
6$
6,4
22
,64
5$
6,7
55
,45
0$
6,9
95
,60
6$
7,1
37
,79
8$
7,4
44
,85
0$
5,7
05
,85
8$
Un
kn
ow
n**
3,5
93
,65
4$
3
,50
1,1
80
$
3
,44
0,8
77
$
3
,69
1,5
38
$
4
,02
8,6
91
$
4
,50
2,5
63
$
5
,12
2,4
50
$
5
,37
9,1
18
$
5
,70
7,4
96
$
4
,45
3,8
73
$
To
tal
97
,95
8,2
22
$
1
01
,38
3,2
00
$
1
03
,40
9,4
44
$
1
06
,75
7,9
45
$
1
09
,56
2,8
61
$
1
12
,68
5,2
92
$
1
16
,92
7,5
17
$
1
20
,29
8,2
50
$
1
25
,01
2,2
23
$
9
8,4
88
,67
3$
Dir
ect
sa
les t
ax r
ate
7%
7%
7%
7%
7%
7%
7%
7%
7%
7%
So
urc
e:
Ind
ian
a D
ep
art
men
t o
f R
even
ue
* India
na C
ode 6
-8.1
-7-1
pre
vents
the d
isclo
sure
of th
e top ten s
ale
s tax p
ayers
in India
na a
s r
equired b
y G
AS
B S
tate
ment N
o. 44. T
his
schedule
is p
resente
d a
s a
substitu
te for
that re
quirem
ent.
** Industr
y c
ate
gory
is p
rovid
ed to the D
epart
ment of R
evenue o
n S
ale
s T
ax info
rmation s
ubm
itte
d b
y r
eta
il m
erc
hants
on their B
usin
ess T
ax A
pplic
ation. In
the p
ast, type o
f in
dustr
y fie
ld w
as n
ot re
quired o
n the form
.
T
hus, busin
esses s
tart
ed p
rior
to the a
dditio
n o
f th
e industr
y c
ate
gory
fie
ld w
ere
cla
ssifie
d a
s u
nknow
n. T
he industr
y c
ate
gory
fie
ld w
as a
dded in r
ecent years
.
***
Taxable
sale
s for
2011 thro
ugh 2
019 a
re c
orr
ecte
d.
Comprehensive Annual Financial Report - State of Indiana - 244

Sta
te o
f In
dia
na
Sa
les
Ta
x R
eve
nu
e P
aye
rs b
y I
nd
ustr
y*
Fis
ca
l Y
ea
rs 2
014
an
d 2
020
(in t
housands o
f dolla
rs)
Nu
mb
er
of
Fil
ers
%
of
To
tal
Tax
Lia
bil
ity
%
of
To
tal
Nu
mb
er
of
Fil
ers
%
of
To
tal
Tax
Lia
bil
ity
%
of
To
tal
Agricultura
l/fo
restr
y,
fishin
g,
and o
ther
3,2
86
1.9
3%
8,3
84
0.1
3%
3,6
61
2.0
4%
6,8
94
0.1
2%
Constr
uction
7,7
63
4.5
5%
107,3
95
1.6
8%
7,4
88
4.1
7%
101,4
84
1.7
2%
Fin
ance,
insura
nce,
and r
eal esta
te4,3
37
2.5
4%
138,2
23
2.1
6%
4,5
50
2.5
3%
164,9
45
2.7
9%
Govern
ment
1,0
90
0.6
4%
123,4
36
1.9
3%
1,0
61
0.5
9%
118,4
32
2.0
0%
Manufa
ctu
ring
15,6
75
9.2
0%
243,6
18
3.8
0%
16,7
82
9.3
4%
251,3
74
4.2
5%
Min
ing
316
0.1
9%
9,5
49
0.1
5%
283
0.1
6%
9,7
21
0.1
6%
Reta
il tr
ade
52,1
01
30.5
7%
3,2
07,6
38
50.0
8%
57,0
21
31.7
4%
2,9
35,9
88
49.6
8%
Serv
ices
58,2
69
34.1
9%
1,3
61,9
78
21.2
6%
60,3
74
33.6
1%
1,1
91,5
86
20.1
6%
Tra
nsport
ation a
nd p
ublic
utilit
ies
4,1
12
2.4
1%
606,7
56
9.4
7%
3,9
07
2.1
7%
519,3
11
8.7
9%
Whole
sale
tra
de
10,4
20
6.1
1%
377,0
07
5.8
9%
10,9
44
6.0
9%
342,3
52
5.7
9%
Unknow
n**
13,0
79
7.6
7%
221,4
92
3.4
6%
13,5
75
7.5
6%
267,2
32
4.5
2%
To
tal
170,4
48
100.0
0%
6,4
05,4
76
$
100.0
0%
179,6
46
100.0
0%
5,9
09,3
19
$
100.0
0%
So
urc
e:
Ind
ian
a D
ep
art
me
nt
of
Re
ve
nu
e
Fis
cal
Year
En
ded
Ju
ne 3
0,
2014
Fis
cal
Year
En
ded
Ju
ne 3
0,
2020
** I
nd
ustr
y c
ate
go
ry is p
rovid
ed
to
th
e D
ep
art
me
nt
of
Re
ve
nu
e o
n S
ale
s T
ax in
form
atio
n s
ub
mitte
d b
y r
eta
il m
erc
ha
nts
on
th
eir B
usin
ess T
ax A
pp
lica
tio
n.
In t
he
pa
st,
typ
e o
f in
du
str
y f
ield
wa
s n
ot
req
uired
on
th
e f
orm
.
* In
dia
na
Co
de
6-8
.1-7
-1 p
reve
nts
th
e d
isclo
su
re o
f th
e t
op
te
n s
ale
s t
ax p
aye
rs in
In
dia
na
as r
eq
uire
d b
y G
AS
B S
tate
me
nt
No
. 4
4.
Th
is s
ch
ed
ule
is p
rese
nte
d a
s a
su
bstitu
te f
or
tha
t re
qu
ire
me
nt.
T
hu
s,
bu
sin
esse
s s
tart
ed
prio
r to
th
e a
dd
itio
n o
f th
e in
du
str
y c
ate
go
ry f
ield
we
re c
lassifie
d a
s u
nkn
ow
n.
Th
e in
du
str
y c
ate
go
ry f
ield
wa
s a
dd
ed
in
re
ce
nt
ye
ars
.
245 - State of Indiana - Comprehensive Annual Financial Report

Sta
te o
f In
dia
na
Pe
rso
na
l In
co
me
Ta
x F
ile
rs a
nd
Lia
bil
ity b
y I
nc
om
e L
eve
l
Fis
ca
l Y
ea
rs 2
01
3 a
nd
20
19
(in m
illio
ns o
f dolla
rs)
Inc
om
e L
eve
l
Nu
mb
er
of
Fil
ers
%
of
To
tal
Ta
x
Lia
bil
ity
%
of
To
tal
Nu
mb
er
of
Fil
ers
Pe
rce
nta
ge
of
To
tal
Ta
x
Lia
bil
ity
%
of
To
tal
$5
0,0
00
an
d u
nd
er
2,2
23
,41
1
6
8.6
1%
1,7
66
26
.02
%2
,12
7,5
53
63
.69
%1
,93
3
2
2.6
7%
$5
0,0
01
- $
10
0,0
00
67
3,2
56
2
0.7
7%
1,9
68
29
.00
%7
25
,48
7
21
.72
%2
,17
0
2
5.4
5%
$1
00
,00
1 -
$2
50
,00
03
00
,72
0
9.2
8%
1,7
74
26
.14
%4
21
,23
1
12
.61
%2
,58
0
3
0.2
6%
$2
50
,00
1 -
$1
,00
0,0
00
38
,99
8
1
.20
%7
32
10
.79
%6
0,4
58
1.8
1%
1,1
25
13
.20
%
$1
,00
0,0
01
an
d o
ve
r4
,37
5
0.1
3%
54
7
8
.07
%5
,59
9
0.1
7%
71
7
8
.41
%
To
tal
3,2
40
,76
0
1
00
%6
,78
7
1
00
%3
,34
0,3
28
10
0%
8,5
25
10
0%
So
urc
e:
Ind
ian
a D
ep
art
men
t o
f R
even
ue
Fis
ca
l Y
E 2
01
3F
isc
al
YE
20
19
Comprehensive Annual Financial Report - State of Indiana - 246
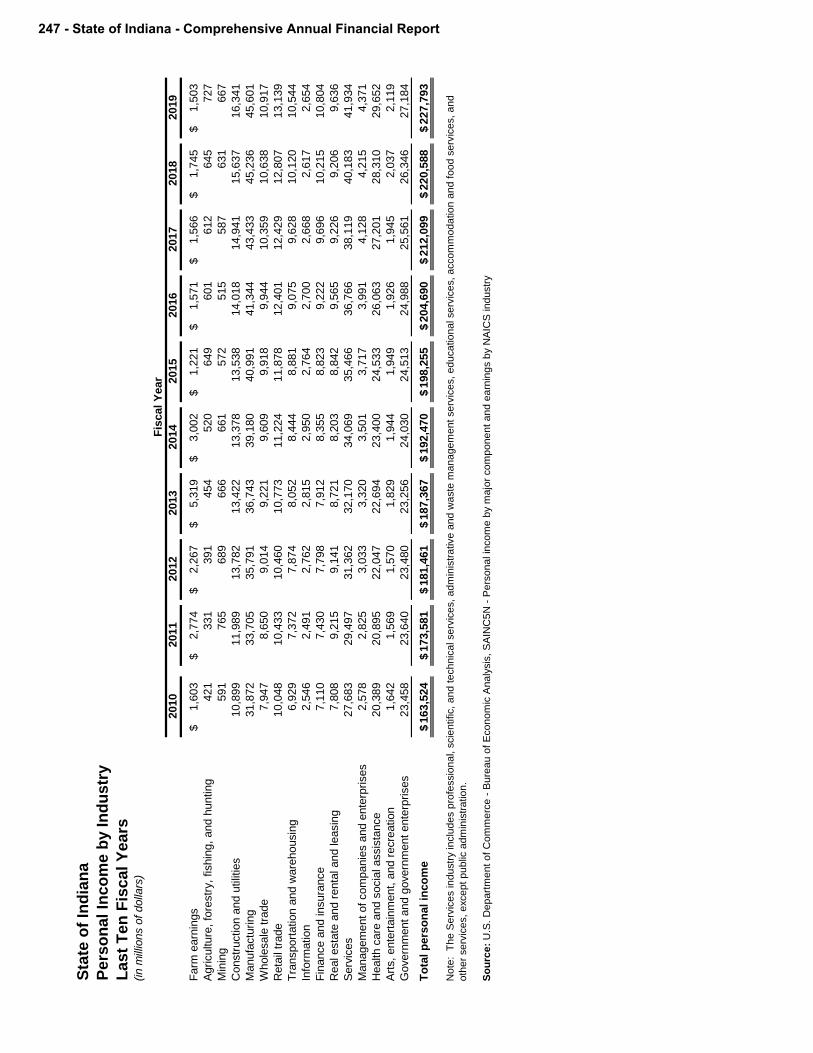
Sta
te o
f In
dia
na
Pe
rso
na
l In
co
me
by I
nd
us
try
La
st
Te
n F
isc
al
Ye
ars
(in m
illio
ns o
f dolla
rs)
Fis
cal
Year
2010
2011
2012
2013
2014
2015
2016
2017
2018
2019
Farm
earn
ings
1,6
03
$
2,7
74
$
2,2
67
$
5,3
19
$
3,0
02
$
1,2
21
$
1,5
71
$
1,5
66
$
1,7
45
$
1,5
03
$
Agri
culture
, fo
restr
y,
fishin
g,
and h
unting
421
331
391
454
520
649
601
612
645
727
Min
ing
591
765
689
666
661
572
515
587
631
667
Constr
uction a
nd u
tilit
ies
10,8
99
11,9
89
13,7
82
13,4
22
13,3
78
13,5
38
14,0
18
14,9
41
15,6
37
16,3
41
Manufa
ctu
ring
31,8
72
33,7
05
35,7
91
36,7
43
39,1
80
40,9
91
41,3
44
43,4
33
45,2
36
45,6
01
Whole
sale
tra
de
7,9
47
8,6
50
9,0
14
9,2
21
9,6
09
9,9
18
9,9
44
10,3
59
10,6
38
10,9
17
Reta
il tr
ade
10,0
48
10,4
33
10,4
60
10,7
73
11,2
24
11,8
78
12,4
01
12,4
29
12,8
07
13,1
39
Tra
nsport
ation a
nd w
are
housin
g6,9
29
7,3
72
7,8
74
8,0
52
8,4
44
8,8
81
9,0
75
9,6
28
10,1
20
10,5
44
Info
rmation
2,5
46
2,4
91
2,7
62
2,8
15
2,9
50
2,7
64
2,7
00
2,6
68
2,6
17
2,6
54
Fin
ance a
nd insura
nce
7,1
10
7,4
30
7,7
98
7,9
12
8,3
55
8,8
23
9,2
22
9,6
96
10,2
15
10,8
04
Real esta
te a
nd r
enta
l and leasin
g7,8
08
9,2
15
9,1
41
8,7
21
8,2
03
8,8
42
9,5
65
9,2
26
9,2
06
9,6
36
Serv
ices
27,6
83
29,4
97
31,3
62
32,1
70
34,0
69
35,4
66
36,7
66
38,1
19
40,1
83
41,9
34
Managem
ent
of
com
panie
s a
nd e
nte
rpri
ses
2,5
78
2,8
25
3,0
33
3,3
20
3,5
01
3,7
17
3,9
91
4,1
28
4,2
15
4,3
71
Health c
are
and s
ocia
l assis
tance
20,3
89
20,8
95
22,0
47
22,6
94
23,4
00
24,5
33
26,0
63
27,2
01
28,3
10
29,6
52
Art
s,
ente
rtain
ment,
and r
ecre
ation
1,6
42
1,5
69
1,5
70
1,8
29
1,9
44
1,9
49
1,9
26
1,9
45
2,0
37
2,1
19
Govern
ment
and g
overn
ment
ente
rpri
ses
23,4
58
23,6
40
23,4
80
23,2
56
24,0
30
24,5
13
24,9
88
25,5
61
26,3
46
27,1
84
To
tal
pers
on
al
inco
me
163,5
24
$
173,5
81
$
181,4
61
$
187,3
67
$
192,4
70
$
198,2
55
$
204,6
90
$
212,0
99
$
220,5
88
$
227,7
93
$
So
urc
e:
U.S
. D
ep
art
me
nt
of
Co
mm
erc
e -
Bu
rea
u o
f E
co
no
mic
An
aly
sis
, S
AIN
C5
N -
Pe
rso
na
l in
co
me
by m
ajo
r co
mp
on
en
t a
nd
ea
rnin
gs b
y N
AIC
S in
du
str
y
No
te:
Th
e S
erv
ice
s in
du
str
y in
clu
de
s p
rofe
ssio
na
l, s
cie
ntific,
an
d t
ech
nic
al se
rvic
es,
ad
min
istr
ative
an
d w
aste
ma
na
ge
me
nt
se
rvic
es,
ed
uca
tio
na
l se
rvic
es,
acco
mm
od
atio
n a
nd
fo
od
se
rvic
es,
an
d
oth
er
se
rvic
es,
exce
pt
pu
blic
ad
min
istr
atio
n.
247 - State of Indiana - Comprehensive Annual Financial Report

Sta
te o
f In
dia
na
Pe
rso
nal In
co
me T
ax R
ate
s
Last
Ten
Fis
cal Y
ears
Fis
cal Y
ear
2010
2011
2012
2013
2014
2015
2016
2017
2018
2019
Pers
onal In
com
e T
ax R
evenues (
in m
illio
ns)
4,5
84
$
4,7
65
$
4,6
20
$
4,8
89
$
5,2
33
$
5,2
66
$
5,4
35
$
5,8
16
$
6,0
57
$
5,2
72
$
Pers
onal In
com
e (
in m
illio
ns)
230,1
09
245,3
46
257,1
50
260,4
25
270,9
86
281,6
92
290,1
48
301,2
03
315,5
16
327,5
70
Avera
ge E
ffective R
ate
¹2.0
%1.9
%1.8
%1.9
%1.9
%1.9
%1.9
%1.9
%1.9
%1.6
%
¹ A
vera
ge e
ffective r
ate
equals
tax c
olle
ctions d
ivid
ed b
y incom
e.
² T
his
assum
es (
a)
a f
am
ily o
f fo
ur
that consis
ts o
f husband, w
ife, and tw
o c
hild
ren a
nd (
b)
sta
te taxable
incom
e e
quals
federa
l adju
ste
d g
ross incom
e
min
us r
ente
r's/h
om
eow
ner's p
ropert
y tax d
eduction m
inus e
xem
ptions. T
he S
tate
incom
e tax r
ate
was 3
.4%
fro
m 2
010 thro
ugh 2
014, 3.3
% f
or
2015 a
nd
2016, and 3
.23%
for
2017 thro
ugh 2
019.
So
urc
es:
U.S
. D
ep
art
men
t o
f C
om
merc
e -
Bu
reau
of
Eco
no
mic
An
aly
sis
; A
ud
ito
r o
f S
tate
Fin
an
cia
l R
eco
rds;
U.S
. C
en
su
s B
ure
au
; &
In
dia
na
Dep
art
men
t o
f R
ev
en
ue T
ax F
orm
s.
Ta
x R
ate
s o
n t
he
Po
rtio
n o
f T
ax
ab
le I
nc
om
e i
n R
an
ge
s²
Ta
x Y
ea
rs 2
01
0-1
2
Ta
x R
ate
0.8
%2
.5%
0.0
%3
.0%
3.1
%3
.2%
3.2
%
Inco
me
Bra
cke
t (i
n t
ho
usa
nd
s)
$0
-20
$2
1-4
0$
41
-60
$6
1-8
0$
81
-10
0$
10
1-1
20
$1
21
+
Ta
x Y
ea
rs 2
01
3-1
5
Ta
x R
ate
0.8
%2
.5%
2.9
%3
.0%
3.1
%3
.1%
3.2
%
Inco
me
Bra
cke
t (i
n t
ho
usa
nd
s)
$0
-20
$2
1-4
0$
41
-60
$6
1-8
0$
81
-10
0$
10
1-1
20
$1
21
+
Ta
x Y
ea
rs 2
01
6-1
9
Ta
x R
ate
0.8
%2
.4%
2.8
%2
.9%
3.0
%3
.0%
3.1
%
Inco
me
Bra
cke
t (i
n t
ho
usa
nd
s)
$0
-20
$2
1-4
0$
41
-60
$6
1-8
0$
81
-10
0$
10
1-1
20
$1
21
+
Comprehensive Annual Financial Report - State of Indiana - 248

Sta
te o
f In
dia
na
Rati
os
of
Ou
tsta
nd
ing
Deb
t b
y T
yp
e
La
st
Te
n F
iscal
Years
(in th
ousand
s o
f dolla
rs)
Fis
cal Y
ear
20
11
20
12
20
13
20
14
20
15
20
16
20
17
20
18
20
19
20
20
Go
vern
men
tal a
cti
vit
ies
Capital le
ases
1,2
25
,31
2$
1,2
09
,97
7$
1
,15
6,9
10
$
1
,11
2,5
99
$
1
,05
7,9
10
$
1,0
00
,25
8$
8
22
,44
4$
97
4,3
46
$
90
4,8
09
$
83
2,3
47
$
To
tal G
overn
men
tal A
cti
vit
ies
1,2
25
,31
2
1,2
09
,97
7
1
,15
6,9
10
1
,11
2,5
99
1
,05
7,9
10
1,0
00
,25
8
8
22
,44
4
9
74
,34
6
9
04
,80
9
8
32
,34
7
To
tal P
rim
ary
Go
vern
men
t1
,22
5,3
12
$
1
,20
9,9
77
$
1,1
56
,91
0$
1,1
12
,59
9$
1,0
57
,91
0$
1
,00
0,2
58
$
82
2,4
44
$
97
4,3
46
$
90
4,8
09
$
83
2,3
47
$
Deb
t as
a P
erc
en
tag
e o
f P
ers
on
al In
co
me
0.5
%0
.5%
0.4
%0
.4%
0.4
%0
.3%
0.3
%0
.3%
0.3
%0
.3%
Am
ou
nt
of
Deb
t p
er
Cap
ita
18
8$
1
85
$
17
6$
1
69
$
1
60
$
15
1$
12
4$
14
6$
13
4$
1
24
$
(in w
ho
le d
olla
rs)
249 - State of Indiana - Comprehensive Annual Financial Report

State of Indiana
State Facts
AREA 36,418 square miles, which includes 550 square miles of water. Length, 270
miles; width, 140 miles. Highest altitude, 1,257 feet in Wayne County;
lowest altitude, 320 feet in Posey County.
CLIMATE Four distinct seasons. Average temperatures in July can range from 73 and 78
degrees Fahrenheit; January averages range from 35 to 36 degrees Fahrenheit.
Record high: 116 degrees at Collegeville in 1936. Record low: 35 below
zero at Greensburg in 1951. Average annual precipitation is 40 inches.
STATE CAPITAL Indianapolis (combination of Indiana and Greek word "polis" meaning city
-- therefore, Indianapolis means "city of Indiana.")
STATE MOTTO The Crossroads of America. Adopted 1937.
STATE FLOWER Peony. Adopted 1957.
STATE TREE Tulip tree (yellow poplar). Adopted 1931.
STATE BIRD Cardinal. Adopted 1933.
STATE SONG "On the Banks of the Wabash, Far Away" by Paul Dresser. Adopted 1913.
STATE POEM "Indiana", by Arthur Franklin Mapes, Kendallville. Adopted 1963.
STATE STONE Limestone. Adopted 1971.
STATE SEAL The seal depicts a pioneer scene: a woodsman felling a tree, a bison
fleeing from the sound of the axe and the sun gleaming over a distant hill.
In use since 1801, the seal was officially adopted in 1963.
STATE FLAG The Indiana flag displays 19 gold stars surrounding a gold torch centered
on a rectangular field of blue. The torch stands for liberty and enlightenment.
Thirteen stars in the outer circle represent the 13 original states; the five in
the inner circle represent the five states next admitted to the Union. The star
above the torch stands for Indiana, the 19th state. Adopted 1917.
STATE NAME The name Indiana means "land of the Indians." It was coined in 1800
when Congress carved the new state of Ohio from the Northwest Territory
and designated the remaining vast area as the Indiana Territory. The
territorial name was retained when Indiana became a state in 1816.
NICKNAME Residents of Indiana have long been referred to as "Hoosiers," and according
to the Indiana Historical Bureau, the term came into general usage in the 1830s
as a result of a poem entitled "The Hoosiers Nest" by John Finley of Richmond.
On January 8, 1933, John W. Davis offered "Hoosier State" as a toast at the
Jackson Dinner. The origins of the actual word have been in debate for well
over a century. The earliest written documentation of Hoosier was in 1827 in
a diary quoted by Sandford Cox. The oral tradition goes back much earlier.
Source: Indiana Historical Bureau website - in.gov/history.
Comprehensive Annual Financial Report - State of Indiana - 250

State of Indiana
County Facts2020 2020 2020 2020
2020 Area County Municipal 2020 2020 Area County Municipal 2020
County Total Sq. Road Street County County Total Sq. Road Street County
Name Population1
Miles Miles Miles Bridges2
Name Population1
Miles Miles Miles Bridges2
ADAMS 34,387 345 676.40 100.73 160 MARION 905,965 392 1,932.25 1,617.66 536
ALLEN 355,200 671 1,325.86 1,281.22 390 MARSHALL 47,051 443 910.28 132.72 116
BARTHOLOMEW 76,418 402 677.99 285.81 202 MARTIN 10,334 345 368.84 31.30 45
BENTON 9,221 409 661.18 57.54 118 MIAMI 37,175 377 785.29 87.28 127
BLACKFORD 12,621 167 321.81 60.18 59 MONROE 137,974 386 714.38 273.77 153
BOONE 61,612 427 745.75 288.67 189 MONTGOMERY 38,124 507 827.73 109.58 172
BROWN 15,242 319 381.90 11.90 83 MORGAN 68,894 406 673.16 151.62 140
CARROLL 20,155 347 755.96 43.39 116 NEWTON 14,244 413 659.03 41.73 122
CASS 38,966 415 866.40 124.22 121 NOBLE 47,007 412 810.51 114.74 64
CLARK 110,232 384 463.11 444.76 141 OHIO 6,128 87 135.14 11.96 32
CLAY 26,890 364 663.86 89.97 157 ORANGE 19,840 405 605.35 67.95 106
CLINTON 33,224 407 774.54 88.82 162 OWEN 21,575 390 623.64 24.09 111
CRAWFORD 11,086 312 460.73 34.97 79 PARKE 17,339 445 732.91 45.48 175
DAVIESS 31,648 430 787.56 119.52 125 PERRY 19,338 384 484.13 63.45 99
DEARBORN 50,047 306 502.46 88.17 101 PIKE 12,845 335 543.53 30.23 110
DECATUR 26,156 370 635.74 93.50 181 PORTER 164,343 425 789.17 534.61 127
DEKALB 42,318 366 709.17 148.98 102 POSEY 25,910 412 705.29 66.81 149
DELAWARE 117,874 396 785.11 462.32 194 PULASKI 13,402 433 876.31 32.24 73
DUBOIS 41,889 433 650.73 185.10 164 PUTNAM 37,963 490 749.45 89.91 221
ELKHART 198,045 468 1,144.49 477.55 172 RANDOLPH 25,967 457 856.64 84.35 217
FAYETTE 24,201 215 377.89 67.87 86 RIPLEY 30,457 442 703.85 91.72 134
FLOYD 74,578 149 347.43 187.16 87 RUSH 17,468 409 747.89 38.75 194
FOUNTAIN 17,240 397 650.21 74.76 143 SAINT JOSEPH 266,931 396 1,132.06 735.79 101
FRANKLIN 21,448 394 623.28 27.86 118 SCOTT 24,181 466 307.30 62.59 73
FULTON 20,836 368 777.88 54.51 57 SHELBY 43,924 193 831.40 112.79 186
GIBSON 33,503 498 950.28 138.11 252 SPENCER 20,952 409 745.21 67.60 166
GRANT 69,993 421 798.48 282.08 189 STARKE 23,363 310 674.56 57.26 58
GREENE 33,165 549 870.97 104.25 161 STEUBEN 34,090 309 617.45 101.06 49
HAMILTON 298,641 401 547.60 1,486.32 305 SULLIVAN 21,475 457 854.00 89.51 178
HANCOCK 67,627 305 643.90 210.48 157 SWITZERLAND 10,613 221 354.70 11.71 41
HARRISON 38,991 479 822.14 37.49 74 TIPPECANOE 172,413 500 853.69 445.80 208
HENDRICKS 145,423 417 764.67 525.28 240 TIPTON 15,930 261 556.40 45.45 84
HENRY 49,265 400 777.30 149.49 142 UNION 7,516 168 264.55 14.69 42
HOWARD 82,752 293 581.92 342.03 136 VANDERBURGH 179,703 241 575.54 548.24 157
HUNTINGTON 37,572 369 671.57 125.34 114 VERMILLION 16,212 263 394.40 81.89 76
JACKSON 42,376 520 727.37 135.92 183 VIGO 107,848 415 836.87 369.91 188
JASPER 33,478 562 934.53 84.23 126 WABASH 32,888 398 728.33 117.85 156
JAY 21,398 386 733.96 82.20 162 WARREN 8,508 368 545.38 24.67 94
JEFFERSON 32,428 366 529.40 80.35 101 WARRICK 59,689 391 747.73 98.35 114
JENNINGS 28,525 377 667.81 47.08 128 WASHINGTON 28,262 561 767.69 66.11 114
JOHNSON 140,126 315 583.37 462.05 158 WAYNE 68,917 405 687.44 255.40 233
KNOX 38,440 516 869.95 173.74 206 WELLS 27,315 368 713.26 94.11 131
KOSCIUSKO 76,872 540 1,163.33 209.22 108 WHITE 24,643 497 909.15 77.65 165
LAGRANGE 37,657 381 780.86 41.69 57 WHITLEY 33,292 337 630.24 67.30 88
LAKE 496,005 513 520.59 2,067.19 178
LAPORTE 111,467 607 1,028.06 357.82 119 Total 6,513,023 36,117 65,226.09 20,020.51 13,071
LAWRENCE 46,134 459 658.71 132.07 127
MADISON 131,643 453 869.76 558.92 216
(1) Represents 2010 decennial census, as adjusted by governor executive order.
(2) Most recent reported per the Association of Indiana Counties 2020 County Fact Book.
Sources: Association of Indiana Counties 2020 County Fact Book, Indiana Department of Transportation, US Department of Commerce - Bureau of
Census
251 - State of Indiana - Comprehensive Annual Financial Report

Sta
te o
f In
dia
na
Dem
og
rap
hic
an
d E
co
no
mic
Sta
tisti
cs
Last
Ten
Cale
nd
ar
Years
2010
2011
2012
2013
2014
2015
2016
2017
2018
2019
Popula
tion
Sta
te (
in thousands)
6,4
90
6,5
17
6,5
38
6,5
69
6,5
94
6,6
08
6,6
34
6,6
58
6,6
95
6,7
32
Perc
enta
ge c
hange
0.5
%0.4
%0.3
%0.5
%0.4
%0.2
%0.4
%0.4
%0.6
%0.6
%
National (in thousands)
309,3
22
311,5
57
313,8
31
315,9
94
318,3
01
320,6
35
322,9
41
324,9
86
326,6
88
328,2
40
Perc
enta
ge c
hange
0.8
%0.7
%0.7
%0.7
%0.7
%0.7
%0.7
%0.6
%0.5
%0.5
%
Tota
l P
ers
onal In
com
e
Sta
te (
in m
illio
ns)
230,1
09
245,3
46
257,1
50
260,4
25
270,9
86
281,6
92
290,1
48
301,2
03
315,5
16
327,5
70
Perc
enta
ge c
hange
4.5
%6.6
%4.8
%1.3
%4.1
%4.0
%3.0
%3.8
%4.8
%3.8
%
National (in m
illio
ns)
12,5
41,9
95
13,3
15,4
78
13,9
98,3
83
14,1
75,5
03
14,9
82,7
15
15,7
09,2
42
16,1
11,6
36
16,8
70,1
06
17,8
13,0
35
18,5
99,0
62
Perc
enta
ge c
hange
4.1
%6.2
%5.1
%1.3
%5.7
%4.8
%2.6
%4.7
%5.6
%4.4
%
Per
Capita P
ers
onal In
com
e
Sta
te35,4
54
37,6
50
39,3
33
39,6
46
41,0
98
42,6
26
43,7
34
45,2
39
47,1
24
48,6
57
Perc
enta
ge c
hange
4.0
%6.2
%4.5
%0.8
%3.7
%3.7
%2.6
%3.4
%4.2
%3.3
%
National
40,5
47
42,7
39
44,6
05
44,8
60
47,0
71
48,9
94
49,8
90
51,9
10
54,5
26
56,6
63
Perc
enta
ge c
hange
3.2
%5.4
%4.4
%0.6
%4.9
%4.1
%1.8
%4.0
%5.0
%3.9
%
Resid
ent C
ivili
an L
abor
Forc
e a
nd
Em
plo
yment
Civ
ilian labor
forc
e (
in thousands)
3,1
75
3,1
82
3,1
70
3,1
88
3,2
25
3,2
67
3,3
28
3,3
34
3,3
82
3,3
87
Em
plo
yed (
in thousands)
2,8
46
2,8
92
2,9
06
2,9
44
3,0
32
3,1
09
3,1
81
3,2
15
3,2
64
3,2
75
Unem
plo
yed (
in thousands)
330
290
264
244
192
158
147
119
118
112
Unem
plo
yment ra
te10.4
%9.1
%8.3
%7.7
%6.0
%4.8
%4.4
%3.6
%3.5
%3.3
%
Sta
te a
nd A
rea E
mplo
yment
Goods-p
roducin
g industr
ies
Min
ing a
nd loggin
g6,6
00
6,9
00
6,8
00
7,1
00
7,2
00
6,5
00
5,9
00
6,0
00
6,3
00
5,9
00
Constr
uction
116,9
00
124,2
00
124,4
00
121,6
00
124,6
00
130,1
00
135,2
00
138,7
00
147,0
00
148,0
00
Manufa
ctu
ring
452,8
00
469,3
00
486,0
00
496,7
00
514,4
00
520,2
00
526,7
00
532,7
00
544,3
00
539,5
00
Subto
tal goods-p
roducin
g industr
ies
576,3
00
600,4
00
617,2
00
625,4
00
646,2
00
656,8
00
667,8
00
677,4
00
697,6
00
693,4
00
Serv
ice-p
roducin
g industr
ies
Tra
nsport
ation a
nd u
tilit
ies
127,2
00
130,4
00
133,9
00
136,3
00
138,3
00
143,0
00
145,1
00
145,7
00
157,3
00
161,1
00
Info
rmation
34,9
00
35,4
00
35,7
00
35,8
00
34,4
00
33,2
00
32,3
00
30,3
00
28,6
00
28,7
00
Fin
ancia
l activitie
s131,7
00
130,2
00
129,0
00
128,4
00
129,1
00
132,7
00
135,1
00
135,8
00
138,4
00
141,1
00
Whole
sale
tra
de
112,7
00
115,7
00
116,1
00
117,2
00
118,5
00
118,2
00
118,5
00
119,8
00
121,1
00
121,8
00
Reta
il tr
ade
305,9
00
310,6
00
313,5
00
319,8
00
320,7
00
328,2
00
333,3
00
332,6
00
319,1
00
316,0
00
Pro
fessio
nal and b
usin
ess s
erv
ices
283,8
00
293,1
00
300,1
00
318,7
00
329,8
00
334,1
00
333,5
00
337,7
00
344,2
00
343,1
00
Education a
nd h
ealth s
erv
ices
420,4
00
426,4
00
436,8
00
437,6
00
440,7
00
453,1
00
461,9
00
476,7
00
484,4
00
484,1
00
Leis
ure
and h
ospitalit
y275,2
00
280,0
00
288,2
00
292,4
00
297,4
00
304,1
00
307,6
00
306,6
00
308,9
00
309,6
00
Oth
er
serv
ices
115,5
00
116,8
00
119,8
00
124,6
00
125,6
00
126,4
00
126,5
00
126,3
00
132,5
00
134,6
00
Sta
te g
overn
ment
112,7
00
115,0
00
112,4
00
118,0
00
117,5
00
119,0
00
116,2
00
115,7
00
118,6
00
120,8
00
Federa
l govern
ment
38,8
00
38,0
00
37,6
00
36,2
00
36,4
00
37,2
00
38,2
00
37,9
00
38,3
00
39,3
00
Local govern
ment
275,1
00
278,4
00
272,1
00
272,4
00
273,0
00
272,1
00
271,1
00
272,4
00
272,1
00
269,4
00
Subto
tal serv
ice-p
roducin
g industr
ies
2,2
33,9
00
2,2
70,0
00
2,2
95,2
00
2,3
37,4
00
2,3
61,4
00
2,4
01,3
00
2,4
19,3
00
2,4
37,5
00
2,4
63,5
00
2,4
69,6
00
Tota
l N
onfa
rm W
age a
nd S
ala
ry E
mplo
yment
2,8
10,2
00
2,8
70,4
00
2,9
12,4
00
2,9
62,8
00
3,0
07,6
00
3,0
58,1
00
3,0
87,1
00
3,1
14,9
00
3,1
61,1
00
3,1
63,0
00
So
urc
es
: U
.S. D
ep
art
me
nt
of
Co
mm
erc
e -
Bu
rea
u o
f E
co
no
mic
An
aly
sis
(B
EA
), U
.S. D
ep
art
me
nt
of
La
bo
r -
Bu
rea
u o
f L
ab
or
Sta
tis
tic
s, a
nd
U.S
. C
en
su
s B
ure
au
(v
ia B
EA
da
ta).
Comprehensive Annual Financial Report - State of Indiana - 252

Sta
te o
f In
dia
na
Tw
en
ty L
arg
est
Ind
ian
a P
ub
lic C
om
pan
ies
(ra
nke
d b
y 2
01
8 r
eve
nu
e)
Ra
nk
ing
Co
mp
an
y
20
18
Re
ve
nu
e
(in
mil
lio
ns
)C
ity
1A
nth
em
In
c.
92
,10
0$
In
dia
na
po
lis
2E
li L
illy a
nd
Co
.2
4,6
00
Ind
ian
ap
olis
3C
um
min
s I
nc.
23
,80
0
C
olu
mb
us
4S
tee
l D
yn
am
ics In
c.
11
,80
0
F
ort
Wa
yn
e
5T
ho
r In
du
str
ies
8,3
00
W
ars
aw
6Z
imm
er
Mio
me
t H
old
ings C
orp
.7
,90
0
Elk
ha
rt
7B
err
y G
lob
al G
rou
p I
nc.
7,9
00
E
va
nsvill
e
8S
imo
n P
rop
ert
y G
rou
p I
nc.
5,7
00
In
dia
na
po
lis
9N
iSo
urc
e I
nc.
5,1
00
M
err
illvill
e
10
CN
O F
ina
ncia
l G
rou
p I
nc.
4,3
00
C
arm
el
11
KA
R A
uctio
n S
erv
ices I
nc.
3,8
00
In
dia
na
po
lis
11
Calu
me
nt
Sp
ecia
lty P
rod
ucts
Pa
rtn
ers
LP
3,5
00
E
va
nsvill
e
13
Ela
nco
3,1
00
C
arm
el
14
Alle
gio
n P
LC
2,7
00
E
va
nsvill
e
15
Alli
son
Tra
nsm
issio
n2
,70
0
Carm
el
16
LC
I In
du
str
ies
2,5
00
In
dia
na
po
lis
17
On
eM
ain
Hold
ings I
nc.
2,3
00
E
lkha
rt
18
Wa
ba
sh
Na
tio
na
l C
orp
.2
,30
0
Ind
ian
ap
olis
18
Pa
tric
k I
nd
ustr
ies I
nc.
2,3
00
L
afa
ye
tte
20
Hill
en
bra
nd
In
c.
1,8
00
In
dia
na
po
lis
So
urc
e:
In
dia
nap
olis B
usin
ess J
ou
rnal, 2
020 B
oo
k o
f L
ists
.
253 - State of Indiana - Comprehensive Annual Financial Report

Sta
te o
f In
dia
na
Tw
en
ty L
arg
es
t In
dia
na
Pri
va
te C
om
pa
nie
s(R
anked b
y 2
018 R
evenue)
Ran
kin
gC
om
pan
y
20
18
Re
ve
nu
e
(in
mil
lio
ns)
Cit
y
1D
o It B
est C
orp
.3,7
00
$
F
ort
Wayne
2C
ook G
roup Inc.
2,4
00
India
napolis
3O
neA
merica F
inancia
l P
art
ners
, In
c.
2,1
00
Blo
om
ingto
n
4F
edera
l H
om
e L
oan B
ank o
f In
dia
napolis
1,6
00
Carm
el
4P
etr
ole
um
Tra
ders
Corp
.1,6
00
Fort
Wayne
6S
teel W
are
house C
o. LLC
1,4
00
Merr
illvill
e
7R
epublic
Airw
ays Inc.
1,3
00
South
Bend
8W
hite L
odgin
g1,2
00
India
napolis
8C
ountr
yM
ark
1,2
00
India
napolis
8T
he B
ob R
ohrm
an A
uto
Gro
up
1,2
00
Lafa
yette
11
Koch E
nte
rprises Inc.
1,0
00
India
napolis
12
Elw
ood S
taffin
g944
India
napolis
13
US
IC L
LC
917
Evansvill
e
14
LD
I Ltd
. LLC
912
Colu
mbus
15
India
na F
arm
Bure
au Insura
nce -
Pro
pert
y/C
asualty &
Life
910
India
napolis
16
Atlas W
orld G
roup Inc.
901
Evansvill
e
17
F.A
. W
ilhelm
Constr
uction C
o. In
c.
898
India
napolis
18
Co-A
llicance L
LP
852
India
napolis
19
Ray S
kill
man A
uto
Cente
rs832
Carm
el
20
Sam
tec Inc.
822
India
napolis
So
urc
e:
In
dia
na
po
lis
Bu
sin
es
s J
ou
rna
l, 2
02
0 B
oo
k o
f L
ists
.
Comprehensive Annual Financial Report - State of Indiana - 254

Sta
te o
f In
dia
na
Pri
nc
ipa
l E
mp
loye
rs
Cu
rre
nt
Ye
ar
an
d N
ine
Ye
ars
Ag
o
2019
2010
Em
plo
yees
Ran
k
Perc
en
tag
e o
f T
ota
l
Sta
te E
mp
loym
en
tE
mp
loyees
Ran
k
Perc
en
tag
e o
f T
ota
l
Sta
te E
mp
loym
en
t
Wal-M
art
Sto
res Inc.
39,6
46
1
1.2
5%
39,4
52
11.4
1%
U.S
. G
overn
ment
38,3
00
2
1.2
1%
35,9
35
21.2
8%
Sta
te o
f In
dia
na (
1)
31,4
70
3
0.9
9%
32,8
01
31.1
7%
India
na U
niv
ers
ity
Health
30,2
70
4
0.9
6%
21,8
83
40.7
8%
India
na U
niv
ers
ity
25,8
09
5
0.8
2%
18,3
37
50.6
5%
The K
roger
Com
pany
19,4
58
6
0.6
2%
9,8
00
11
0.3
5%
Purd
ue U
niv
ers
ity
14,9
84
7
0.4
7%
15,0
33
60.5
4%
Fra
ncis
can A
lliance Inc.
14,4
34
8
0.4
6%
N/A
Thor
Industr
ies
14,4
00
9
0.4
6%
N/A
Com
munity
Health N
etw
ork
13,2
58
10
0.4
2%
8,0
79
12
0.2
9%
St. V
incent H
ealth
11,0
01
11
0.3
5%
11,2
30
90.4
0%
Eli
Lill
y a
nd C
o.
10,6
11
12
0.3
4%
12,0
68
70.4
3%
Cum
min
s Inc.
10,5
54
13
0.3
3%
5,8
00
17
0.2
1%
FedE
x C
orp
9,2
00
14
0.2
9%
7,6
00
14
0.2
7%
Arc
elo
rMitta
l8,5
27
15
0.2
7%
N/A
Am
azon.c
om
8,5
00
16
0.2
7%
N/A
Fia
t C
hry
sle
r A
uto
mobile
s8,2
52
17
0.2
6%
N/A
Cook G
roup Inc.
7,3
00
18
0.2
3%
N/A
City
of
India
napolis
/Marion C
ounty
6,9
82
19
0.2
2%
8,0
75
13
0.2
9%
Genera
l M
oto
rs C
orp
.6,7
00
20
0.2
1%
N/A
To
tal
329,6
56
10.4
2%
226,0
93
8.0
6%
(1)
Full
tim
e S
tate
em
plo
yees p
aid
thro
ugh t
he A
uditor
of
Sta
te's
Off
ice a
s o
f June 2
019 a
nd J
une 2
010.
N/A
= N
ot
availa
ble
So
urc
es:
Ind
ian
ap
oli
s B
usin
ess J
ou
rnal,
2020 a
nd
2011 B
oo
k o
f L
ists
; an
d A
ud
ito
r o
f S
tate
payro
ll r
eco
rds.
255 - State of Indiana - Comprehensive Annual Financial Report

Sta
te o
f In
dia
na
Sc
ho
ol E
nro
llm
en
t
La
st
Ten
Fis
ca
l Y
ea
rs
Fis
ca
l Y
ea
r
2020
2019
2018
2017
2016
2015
2014
2013
2012
2011
Public
School E
nro
llment, G
rades K
-12
Ele
menta
ry (
KG
thro
ugh G
rade 6
)545,2
00
545,6
00
548,9
08
548,1
57
549,1
82
550,4
68
551,8
03
554,4
21
555,3
44
557,9
83
Secondary
(G
rades 7
thro
ugh 1
2)
483,0
80
487,8
67
484,1
62
481,0
34
477,8
86
478,1
86
479,5
81
476,6
85
475,4
57
477,4
55
Tota
l, a
ll gra
des
1,0
28,2
80
1,0
33,4
67
1,0
33,0
70
1,0
29,1
91
1,0
27,0
68
1,0
28,6
54
1,0
31,3
84
1,0
31,1
06
1,0
30,8
01
1,0
35,4
38
Public
Hig
her
Education E
nro
llment¹
India
na U
niv
ers
ity
80,7
63
81,4
72
81,8
96
83,1
41
86,4
24
85,5
40
85,3
73
84,7
86
82,6
71
83,2
28
Purd
ue U
niv
ers
ity
55,3
05
55,2
80
55,1
31
55,3
51
56,4
76
56,6
45
56,7
01
57,2
84
58,7
04
59,1
86
Ball
Sta
te U
niv
ers
ity
18,0
13
18,2
68
18,1
75
19,0
14
18,7
71
18,2
31
18,2
55
18,3
40
18,8
31
19,5
26
India
na S
tate
Univ
ers
ity
9,1
62
9,8
73
10,7
58
11,4
91
11,4
50
11,5
74
11,2
73
10,7
72
10,2
82
9,7
38
Ivy T
ech C
om
munity C
olle
ge
29,8
82
35,0
07
34,9
92
40,3
24
42,7
08
45,0
65
49,7
27
56,0
24
58,7
19
65,9
57
Univ
ers
ity o
f S
outh
ern
India
na
6,9
04
7,1
05
7,3
69
8,1
82
8,1
37
7,6
68
7,8
22
8,2
15
8,7
40
9,0
31
Vin
cennes U
niv
ers
ity
3,6
76
4,9
88
4,7
83
9,6
20
9,5
51
10,0
32
10,1
62
9,8
25
9,3
93
10,0
77
Tota
l, p
ublic
colle
ges a
nd u
niv
ers
itie
s203,7
05
211,9
93
213,1
05
227,1
22
233,5
16
234,7
55
239,3
13
245,2
46
247,3
40
256,7
43
¹ ba
sed o
n F
all
full-
tim
e e
quiv
ale
nt
en
rollm
ent.
S
tart
ing w
ith 2
018
, census c
oun
ts a
re lim
ited
to d
eg
ree-s
eekin
g s
tud
ents
. P
rior
years
inclu
de
bo
th d
egre
e a
nd n
on-d
egre
e s
eekin
g s
tud
ents
.
So
urc
es
: In
dia
na C
om
mis
sio
n f
or
Hig
her
Ed
ucati
on
(fo
r P
ub
lic H
igh
er
Ed
ucati
on
En
rollm
en
t);
an
d In
dia
na D
ep
art
men
t o
f E
du
cati
on
(fo
r G
rad
es K
-12)
Comprehensive Annual Financial Report - State of Indiana - 256

Sta
te o
f In
dia
na
La
rgest
Ind
ian
a P
rivate
Co
lleg
es &
Un
ivers
itie
s
(Ra
nk
ed
by F
all
20
19
Fu
ll-T
ime
Eq
uiv
ale
nt
En
roll
me
nt)
Ran
kin
g
Ins
titu
tio
n
Fa
ll 2
01
9 F
TE
En
roll
me
nt
Lo
ca
tio
n
1U
niv
ers
ity o
f N
otr
e D
am
e1
2,4
94
N
otr
e D
am
e
2In
dia
na
We
sle
ya
n U
niv
ers
ity
11
,40
8
Ma
rio
n
3B
utle
r U
niv
ers
ity
6,8
36
In
dia
na
po
lis
4In
dia
na
Te
ch
6,4
34
F
ort
Wa
yn
e
5W
GU
In
dia
na
5,7
00
In
dia
na
po
lis
6U
niv
ers
ity o
f In
dia
na
po
lis5
,68
0
Ind
ian
ap
olis
7V
alp
ara
iso
Un
ive
rsity
3,4
00
V
alp
ara
iso
8M
aria
n U
niv
ers
ity
3,0
80
In
dia
na
po
lis
9R
ose
Hu
lma
n I
nstitu
te o
f T
ech
no
logy
2,6
96
T
err
e H
au
te
10
Trin
e U
niv
ers
ity
2,6
79
A
ngo
la
11
Univ
ers
ity o
f S
ain
t F
ran
cis
2,4
66
F
ort
Wa
yn
e
12
Univ
ers
ity o
f E
va
nsvill
e2
,07
2
Eva
nsvill
e
13
DeP
au
w U
niv
ers
ity
1,9
53
G
ree
nca
stle
14
Ta
ylo
r U
niv
ers
ity
1,9
06
U
pla
nd
15
An
de
rson
Un
ive
rsity
1,4
17
A
nd
ers
on
16
Ma
nch
este
r U
niv
ers
ity
1,3
77
N
ort
h M
an
ch
este
r
17
Be
the
l C
olle
ge
1,2
10
M
isha
wa
ka
So
urc
es:
In
dia
nap
olis B
usin
ess J
ou
rnal, 2
020 B
oo
k o
f L
ists
257 - State of Indiana - Comprehensive Annual Financial Report

Sta
te o
f In
dia
na
Op
era
tin
g I
nd
ica
tors
by F
un
cti
on
of
Go
ve
rnm
en
t
La
st
Te
n F
isc
al
Ye
ars
20
20
20
19
20
18
20
17
20
16
20
15
20
14
20
13
20
12
20
11
Ge
ne
ral G
ove
rnm
en
t
D
ep
art
me
nt
of
Re
ve
nu
e
N
um
be
r o
f T
ax R
etu
rns F
iled
Ele
ctr
on
ica
lly1
N/A
2,9
88
,23
0
2
,90
3,0
57
2,8
20
,77
3
2
,76
7,4
93
2,7
34
,42
0
2
,72
1,6
93
2,5
65
,62
0
2
,32
8,2
03
2,2
68
,85
6
N
um
be
r o
f T
ax R
etu
rns P
roce
sse
d1
N/A
3,3
12
,19
8
3
,36
8,0
84
3,2
58
,92
9
3
,25
7,8
36
3,3
28
,80
5
3
,35
3,9
18
3,2
54
,31
4
3
,14
0,0
76
3,0
94
,47
9
P
erc
en
t o
f T
ax R
etu
rns F
iled
Ele
ctr
on
ica
lly1
N/A
90
.2%
86
.2%
86
.6%
84
.9%
82
.1%
81
.1%
78
.8%
74
.1%
73
.3%
N
um
be
r o
f T
axp
aye
rs A
ssis
ted
- W
alk
-in
2,
34
4,2
39
66
,63
6
4
8,8
23
64
,98
6
7
7,1
84
65
,41
4
1
02
,12
0
12
,96
9
1
8,7
48
21
,78
4
N
um
be
r o
f T
axp
aye
rs A
ssis
ted
- T
ele
ph
on
e2
79
1,5
22
8
16
,21
2
61
1,2
77
8
21
,11
5
1,1
16
,75
7
8
23
,38
7
75
3,9
39
6
30
,35
2
53
4,6
80
4
16
,23
1
N
um
be
r o
f T
axp
aye
rs A
ssis
ted
- T
ota
l2
83
5,7
61
8
82
,84
8
66
0,1
00
8
86
,10
1
1,1
93
,94
1
8
88
,80
1
85
6,0
59
6
43
,32
1
55
3,4
28
4
38
,01
5
D
ep
art
me
nt
of
Ad
min
istr
atio
n
C
on
str
uctio
n p
roje
cts
ad
min
iste
red
53
4
9
66
4
8
50
5
3
43
3
3
67
3
8
C
on
str
uctio
n v
alu
e e
xclu
din
g d
esig
n f
ee
(th
ou
sa
nd
s)
$5
4,8
18
$4
5,0
56
$4
2,5
16
$4
5,1
02
$4
4,2
00
$3
6,3
52
$2
7,6
13
$2
7,4
48
$3
1,1
61
$2
2,2
65
Pu
blic
Sa
fety
D
ep
art
me
nt
of
Co
rre
ctio
n
D
ep
art
me
nt
Active
Pe
rso
nn
el
5,7
29
5
,87
0
5,8
80
5
,93
5
6,1
21
6
,07
4
6,0
94
6
,25
6
6,1
98
6
,06
4
N
um
be
r o
f A
du
lt In
stitu
tio
ns
18
1
8
18
1
9
20
2
0
20
2
0
20
2
1
In
ca
rce
rate
d O
ffe
nd
ers
42
7,1
25
27
,10
6
2
6,6
28
25
,73
1
2
5,9
93
27
,69
3
2
9,3
29
29
,15
6
2
8,3
78
28
,30
7
A
ve
rag
e C
ost
Pe
r D
iem
$5
9.6
7$
57
.73
$5
8.3
6$
57
.39
$5
7.8
9$
54
.43
$5
5.4
2$
55
.19
$5
4.8
5$
54
.53
C
on
tra
ct
Be
ds
42
2
18
8
19
8
26
3
30
7
30
1
34
1
33
3
39
9
29
4
A
ve
rag
e O
ffe
nd
er
Ag
e a
t In
take
33
.9
33
.7
33
.3
33
.0
33
.0
32
.9
33
.6
32
.7
32
.7
32
.6
A
ve
rag
e O
ffe
nd
er
Ag
e -
Cu
rre
nt
39
.2
38
.9
38
.4
38
.1
37
.9
37
.9
36
.5
36
.9
36
.6
36
.6
S
up
erv
ise
d O
ffe
nd
ers
56
,13
9
6,2
68
6
,76
3
7,5
77
8
,86
5
9,5
96
9
,68
9
10
,38
5
9
,58
1
10
,60
6
S
tate
Po
lice
A
ctive
Sta
te T
roo
pe
rs1
,22
3
1,2
32
1
,22
3
1,2
51
1
,20
1
1,2
42
1
,24
1
1,2
43
1
,24
5
1,2
44
N
um
be
r o
f T
raff
ic C
ita
tio
ns Issu
ed
14
2,8
31
2
04
,29
0
21
7,7
71
2
05
,52
5
22
9,8
29
2
07
,91
9
23
1,6
83
3
23
,60
4
36
4,0
70
4
31
,17
3
N
um
be
r o
f F
ire
arm
Pe
rmits Issu
ed
64
,45
3
5
8,4
42
69
,26
4
7
8,3
76
11
7,9
93
8
3,6
03
10
3,0
62
8
4,8
31
69
,52
5
7
6,8
44
N
um
be
r o
f L
imite
d C
rim
ina
l H
isto
ry S
ea
rch
es (
fee
)2
99
,91
4
34
9,7
70
3
73
,76
7
34
6,6
57
3
25
,80
2
32
4,6
12
2
94
,15
2
24
7,4
58
2
70
,54
7
25
5,8
45
N
um
be
r o
f L
imite
d C
rim
ina
l H
isto
ry S
ea
rch
es (
no
fe
e)
40
2,3
56
4
64
,13
6
49
0,8
77
5
19
,75
1
53
3,1
72
4
42
,08
8
42
4,5
37
3
96
,19
7
39
0,9
12
3
70
,85
7
He
alt
h
D
ep
art
me
nt
of
He
alth
N
um
be
r o
f B
irth
an
d D
ea
th C
ert
ific
ate
s Issu
ed
31
,73
8
4
1,2
50
70
,19
5
7
6,6
96
79
,07
6
4
1,4
54
34
,01
2
4
2,0
76
49
,20
8
6
1,8
84
N
um
be
r o
f A
do
ptio
n R
eco
rds R
ece
ive
d6
,81
8
5,2
45
4
,52
9
4,3
63
3
,93
6
3,9
36
3
,90
4
1,8
31
3
,40
2
2,1
86
N
um
be
r o
f M
arr
iag
e R
eco
rds R
ece
ive
d3
6,1
17
39
,94
4
4
3,4
52
43
,38
2
4
9,1
57
44
,14
3
4
4,8
41
41
,30
1
4
8,7
56
39
,58
6
We
lfa
re
F
SS
A
M
ed
ica
id a
nd
Ch
ildre
n's
He
alth
In
su
ran
ce
Pro
gra
m (
CH
IP)
recip
ien
ts1
,79
3,3
51
1,7
46
,09
6
1
,76
0,4
89
1,7
45
,41
8
1
,72
6,9
48
1,5
00
,58
7
1
,36
5,7
48
1,3
03
,95
8
1
,27
9,2
88
1,2
74
,34
1
T
em
po
rary
Assis
tan
t fo
r N
ee
dy F
am
ilie
s (
TA
NF
) re
cip
ien
ts1
8,9
59
11
,25
9
1
2,9
38
14
,80
1
1
6,8
32
19
,29
0
2
2,3
96
28
,28
5
3
7,5
91
63
,27
8
S
up
ple
me
nta
l N
utr
itio
na
l A
ssis
tan
ce
Pro
gra
m (
SN
AP
) re
cip
ien
ts7
74
,75
7
58
8,9
87
6
01
,06
2
65
4,7
22
7
20
,82
2
81
4,9
59
8
79
,34
2
92
4,1
80
9
08
,51
1
88
2,7
16
Co
nse
rva
tio
n,
Cu
ltu
re,
an
d D
eve
lop
me
nt
D
ep
art
me
nt
of
Na
tura
l R
eso
urc
es
H
un
tin
g lic
en
se
s s
old
35
0,8
50
3
15
,78
7
34
5,8
46
3
57
,82
2
31
1,4
57
3
75
,06
1
39
5,2
58
4
00
,57
5
45
8,1
56
4
47
,00
3
F
ish
ing
lic
en
se
s s
old
46
8,4
60
4
09
,39
1
41
3,8
52
4
16
,42
0
41
5,0
88
4
59
,63
0
47
4,3
61
4
18
,53
5
49
6,4
23
4
29
,37
3
T
rap
pin
g lic
en
se
s s
old
4,2
38
4
,06
1
4,0
49
4
,13
1
4,9
29
5
,55
6
5,6
70
4
,60
9
3,7
14
3
,32
6
Tra
nsp
ort
ati
on
D
ep
art
me
nt
of
Tra
nsp
ort
atio
n
C
on
str
uctio
n p
roje
cts
ad
min
iste
red
51
6
51
2
42
1
45
5
54
5
52
8
48
7
37
9
42
5
44
3
C
on
str
uctio
n v
alu
e e
xclu
din
g d
esig
n f
ee
(th
ou
sa
nd
s)
46
7,2
73
$
2
94
,66
2$
33
9,9
19
$
2
53
,38
4$
29
9,0
45
$
3
07
,68
6$
26
2,6
29
$
2
48
,00
3$
28
2,3
52
$
2
53
,75
1$
C
on
str
uctio
n a
wa
rde
d a
mo
un
t (t
ho
usa
nd
s)
2,1
22
,30
5$
1
,16
4,8
78
$
1,2
25
,91
1$
1
,07
1,0
18
$
1,0
00
,39
8$
9
35
,99
0$
95
4,5
16
$
1
,01
8,3
35
$
99
6,8
06
$
1
,44
3,1
56
$
Bu
sin
ess-t
yp
e a
cti
vit
ies
U
ne
mp
loym
en
t In
su
ran
ce
N
um
be
r o
f p
aym
en
ts m
ad
e t
o c
laim
an
ts (
tho
usa
nd
s)
8,0
68
8
20
8
86
1
,07
1
1,2
51
1
,46
9
2,0
32
2
,32
4
2,5
88
3
,14
4
P
erc
en
tag
e o
f u
ne
mp
loym
en
t5
.5%
3.5
%3
.4%
3.9
%4
.3%
4.9
%5
.9%
8.4
%8
.7%
9.0
%
No
tes
:
1 T
ax
Ye
ar
(Ja
nu
ary
1 -
De
ce
mb
er
30
)
2 F
isca
l Y
ea
r (J
uly
1-J
un
e 3
0)
3 2
01
4 t
hro
ug
h 2
02
0 w
alk
-in
s a
ssis
ted
in
clu
de
d t
he
Do
R's
ma
in,
dis
tric
t, a
nd
mo
tor
ca
rrie
r o
ffic
es.
Pri
or
ye
ars
in
clu
de
d o
nly
th
e m
ain
off
ice
.
4 I
nclu
de
s in
ma
tes h
eld
in
co
un
ty ja
ils a
nd
co
ntr
act
be
ds
5 E
xclu
de
s I
nd
ian
a p
aro
lee
s o
n p
aro
le in
oth
er
sta
tes;
inclu
de
s o
the
r sta
tes p
aro
lee
s s
up
erv
ise
d b
y I
nd
ian
a
So
urc
es
: V
ari
ou
s s
tate
ag
en
cie
s.
Comprehensive Annual Financial Report - State of Indiana - 258

State of Indiana
Capital Assets Statistics by Function of Government
Last Ten Fiscal Years
Fiscal Year Ended June 30
2020 2019 2018 2017 2016 2015 2014 2013 2012 2011
Function
Conservation, Culture and Development
Department of Natural Resources
Acres of land (parks, lakes, etc.) owned 410,474 437,442 433,472 435,487 413,835 411,686 414,212 410,817 406,243 385,950
Number of state parks 24 24 24 24 24 24 24 24 24 24
Number of reservoirs 8 8 8 8 8 8 8 8 8 8
Number of state forests 15 15 15 15 15 15 16 16 15 16
Number of fish & wildlife areas 23 23 21 21 25 26 26 26 25 22
Number of dams 131 131 131 132 132 132 133 133 134 134
Number of vehicles 1,690 1,672 1,761 1,877 1,986 1,996 2,041 2,071 2,073 2,049
Number of watercraft, registered 794 645 730 735 746 799 822 901 899 899
Number of watercraft, non-registered 381 363 332 315 319 324 306 210 212 212
Education
Department of Education
Number of public schools, K-12 1,916 1,912 1,913 1,925 1,926 1,938 1,923 1,928 1,931 1,936
Number of non-public schools, K-12 * 316 304 302 309 308 301 301 304 294 293
Commission for Higher Education
Number of public postsecondary institutions
number of institutions 7 7 7 7 7 7 7 7 7 7
number of campuses 38 38 38 36 43 41 43 43 47 47
Number of private not-for-profit postsecondary institutions
number of institutions 30 30 30 30 31 31 29 31 32 32
number of campuses 30 30 30 30 31 31 29 31 32 32
Number of private for profit postsecondary institutions **
number of institutions 27 25 27 29 31 29 29 32 36 Unavailable
number of campuses 33 31 42 48 59 59 59 61 65 Unavailable
General Government
Department of Administration
Number of buildings 12 12 12 12 12 10 10 10 7 7
Number of fleet service vehicles *** 3,053 2,476 1,725 1,211 1,341 235 239 285 257 259
Number of aircraft 0 0 0 0 0 0 0 0 0 0
Public Safety
Department of Correction
Number of adult facilities 18 18 18 19 20 20 20 20 20 21
Number of juvenile facilities 3 3 3 4 4 4 4 4 5 6
Number of parole facilities 10 10 10 10 10 10 10 10 9 9
Number of vans 270 272 274 280 282 284 289 299 291 294
State Police
Number of state police posts 14 14 14 14 14 14 14 14 14 14
Number of state police cars 1,999 1,961 1,769 1,797 1,699 1,728 1,937 2,080 1,931 1,847
Number of aircraft 5 5 5 3 3 3 5 6 6 6
Number of trailers 126 125 125 125 118 117 121 120 116 108
Transportation
Department of Transportation
Number of interstate miles 1,287 1,285 1,265 1,265 1,265 1,238 1,236 1,238 1,014 1,014
Number of non-interstate miles 9,871 9,917 9,941 9,937 9,944 9,947 9,933 9,930 10,127 10,095
Number of interstate and non-interstate
total miles 11,158 11,202 11,206 11,202 11,209 11,185 11,169 11,168 11,141 11,109
Number of interstate bridges 1,451 1,450 1,431 1,433 1,432 1,381 1,392 1,377 1,264 1,263
Number of non-interstate bridges 4,359 4,358 4,361 4,324 4,317 4,308 4,233 4,081 4,056 4,049
Number of interstate and non-interstate
total bridges 5,810 5,808 5,792 5,757 5,749 5,689 5,625 5,458 5,320 5,312
Acreage from excess land 11,119 11,247 11,358 11,339 11,513 7,165 5,974 6,022 5,879 5,216
Acreage from fixed assets 9,213 2,894 2,385 2,269 2,278 2,262 2,243 2,262 2,298 2,286
Total acres of land owned 20,332 14,141 13,743 13,608 13,791 9,427 8,217 8,284 8,177 7,502
Number of heavy equipment owned 3,238 2,789 3,072 3,457 3,259 3,186 3,101 2,827 2,902 2,864
Welfare
Family and Social Services Administration
Number of hospitals owned 7 7 6 6 6 6 6 6 6 6
Health
Indiana State Department of Health
Number of pieces of laboratory equipment 827 747 825 720 751 751 749 757 742 777
Noted: * Includes only the accredited and freeway schools.
** Institutions authorized through the Board for Proprietary Education, which is administered through ICHE; the list includes eight not-for-profit institutions
*** Increases since 2016 due to policy change requiring vehicle purchases to be made through the Department of Administration
Sources: Various state agencies.
259 - State of Indiana - Comprehensive Annual Financial Report

Fu
nc
tio
n o
f G
ove
rnm
en
tJ
un
e 2
02
0J
un
e 2
01
9J
un
e 2
01
8J
un
e 2
01
7J
un
e 2
01
6J
un
e 2
01
5J
un
e 2
01
4J
un
e 2
01
3J
un
e 2
01
2J
un
e 2
01
1
Ge
ne
ral G
ove
rnm
en
t 5
,08
8
4,9
20
4,9
08
4,8
21
4,8
28
4,8
54
4,8
72
4,9
37
4,9
01
5,1
52
Pu
blic
Sa
fety
1
0,3
35
1
0,4
32
10
,41
6
10
,39
9
10
,45
3
10
,47
8
10
,66
6
10
,93
6
11
,16
2
10
,89
3
He
alt
h
81
5
75
8
75
3
74
5
74
4
77
3
78
3
79
4
78
3
80
2
We
lfa
re
8
,84
4
8,3
08
7,9
43
7,8
67
7,8
52
7,6
08
7,3
92
7,0
37
6,9
07
6,8
58
Co
ns
erv
ati
on
, C
ult
ure
an
d D
eve
lop
me
nt
3,0
47
2,9
62
3,0
35
3,0
33
3,0
90
3,1
92
3,2
72
3,3
66
3,2
75
3,2
51
Ed
uc
ati
on
6
02
6
01
6
16
6
06
6
20
6
19
6
41
5
32
5
50
7
06
Tra
ns
po
rta
tio
n
3
,54
9
3,4
89
3,5
56
3,4
17
3,3
90
3,3
25
3,3
46
3,5
32
3,6
85
3,6
68
To
tals
3
2,2
80
31
,47
0
31
,22
7
30
,88
8
30
,97
7
30
,84
9
30
,97
2
31
,13
4
31
,26
3
31
,33
0
G -
Go
ve
rno
r's
Au
tho
rity
29
,60
7
28
,86
8
28
,63
4
28
,28
6
28
,31
5
28
,15
7
28
,27
9
28
,39
8
28
,48
5
28
,47
2
J -
Ju
dic
iary
95
0
92
2
90
8
89
4
88
6
86
5
84
5
83
1
83
5
83
0
O -
Oth
er
Ele
cte
d O
ffic
ials
1,1
47
1,1
24
1,0
95
1,0
62
1,1
07
1,0
83
1,0
65
1,0
49
1,0
49
1,0
67
D -
Dis
ab
ilit
y L
ea
ve
- in
pa
y s
tatu
s3
95
3
63
3
70
4
25
4
19
4
55
4
71
5
11
5
45
6
10
D2
- D
isa
bilit
y L
ea
ve
- in
no
n-p
ay s
tatu
s1
81
1
93
2
20
2
21
2
50
2
89
3
12
3
45
3
49
3
51
To
tal
32
,28
0
31
,47
0
31
,22
7
30
,88
8
30
,97
7
30
,84
9
30
,97
2
31
,13
4
31
,26
3
31
,33
0
Fu
ll T
ime
Sta
te E
mp
loye
es
Pa
id T
hro
ug
h T
he
Au
dit
or
of
Sta
te's
Off
ice
Comprehensive Annual Financial Report - State of Indiana - 260

Fu
nc
tio
n o
f G
ove
rnm
en
tJu
ne 2
020
Ju
ne 2
019
Ju
ne 2
018
Ju
ne 2
017
Ju
ne 2
016
Ju
ne 2
015
Ju
ne 2
014
Ju
ne 2
013
Ju
ne 2
012
Ju
ne 2
011
Ju
ne 2
010
Ge
nera
l G
overn
men
t1
51
2
08
1
88
1
80
2
09
1
85
1
82
1
73
1
50
1
38
1
52
Pu
blic
Safe
ty1,3
68
20
9
20
4
15
9
16
9
14
1
41
0
26
0
29
6
1,1
68
29
2
Hea
lth
9 4
1 1
2 1
1 3
- -
-
Welf
are
1
62
1
65
3
10
2
98
3
00
2
95
3
19
3
5
34
9
31
3
35
1
Co
nse
rvati
on
, C
ult
ure
an
d D
evelo
pm
en
t 1,2
33
1,5
43
1,5
13
1,5
46
1,4
62
1,4
33
1,5
11
1,4
80
1,4
92
1,5
57
1,1
42
Ed
uca
tio
n1
38
1
31
1
28
1
55
1
74
1
33
1
27
1
05
1
09
1
12
1
10
Tra
nsp
ort
ati
on
44
1
15
1
25
1
38
1
10
6
6
64
1
54
1
70
1
02
8
6
To
tals
3,1
05
2,3
75
2,4
69
2,4
77
2,4
26
2,2
54
2,6
14
2,2
10
2,5
66
3,3
90
2,1
33
G -
Go
vern
or'
s A
uth
ori
ty3,0
28
2,2
86
2,3
78
2,3
87
2,3
12
2,1
35
2,5
02
2,1
03
2,4
76
3,2
92
2,0
36
J -
Ju
dic
iary
12
1
9
19
1
9
22
2
5
25
1
7
18
1
5
12
O -
Oth
er
Ele
cte
d O
ffic
ials
65
7
0
72
7
1
92
9
4
87
9
0
72
8
3
85
To
tal
3,1
05
2,3
75
2,4
69
2,4
77
2,4
26
2,2
54
2,6
14
2,2
10
2,5
66
3,3
90
2,1
33
Em
plo
yees O
ther
Th
an
Fu
ll T
ime P
aid
Th
rou
gh
Th
e A
ud
ito
r o
f S
tate
's O
ffic
e
261 - State of Indiana - Comprehensive Annual Financial Report

Pe
ns
ion
, D
eath
Ben
efi
ts,
an
d F
orm
er
Go
ve
rno
rs
Nu
mb
er
of
Pe
op
le P
aid
Th
rou
gh
Th
e A
ud
ito
r o
f S
tate
's O
ffic
e
Ca
teg
ory
Ju
ne
20
20
Ju
ne
20
19
Ju
ne
20
18
Ju
ne
20
17
Ju
ne
20
16
Ju
ne
20
15
Ju
ne
20
14
Ju
ne
20
13
Ju
ne
20
12
Ju
ne
20
11
Ju
ne
20
10
Ju
ne
20
09
Go
ve
rno
r's W
ido
ws
3 3
3 3
3 2
2 2
1 1
1 2
De
ath
Be
ne
fits
(P
olic
e)
24
2
3
23
2
3
25
2
6
28
3
0
30
3
1
33
3
1
Fo
rme
r G
ove
rno
rs2
2 2
2 2
3 3
2 3
3 2
2
Po
lice
Pe
nsio
n1
,58
7
1,5
95
1,5
91
1,6
17
1,6
22
1,6
17
1,5
84
1,6
22
1,5
50
1,5
36
1,5
31
1,4
99
To
tal
1,6
16
1,6
23
1,6
19
1,6
45
1,6
52
1,6
48
1,6
17
1,6
56
1,5
84
1,5
71
1,5
67
1,5
34
Comprehensive Annual Financial Report - State of Indiana - 262

263 - State of Indiana - Comprehensive Annual Financial Report