Embed Size (px)
Citation preview
TEQSA’s Evidence-based approach to regulation | Slide 1 Benchmarking – TEQSA Resources | Slide 1
Benchmarking – TEQSA Resources
June 2015
TEQSA’s Evidence-based approach to regulation | Slide 2 Benchmarking – TEQSA Resources | Slide 2
Overview
Data Overview
PIR Key Facts
Datasets detailed
Data into Indicators
TEQSA’s Evidence-based approach to regulation | Slide 3 Benchmarking – TEQSA Resources | Slide 3
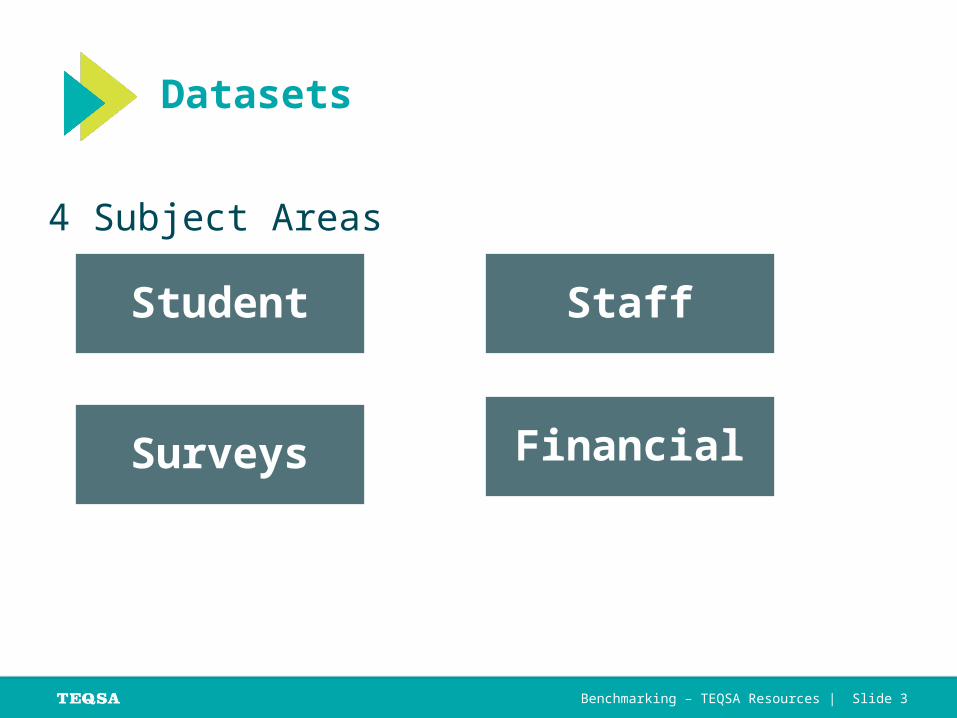
Datasets
4 Subject Areas
Student Staff
Surveys Financial
TEQSA’s Evidence-based approach to regulation | Slide 4 Benchmarking – TEQSA Resources | Slide 4
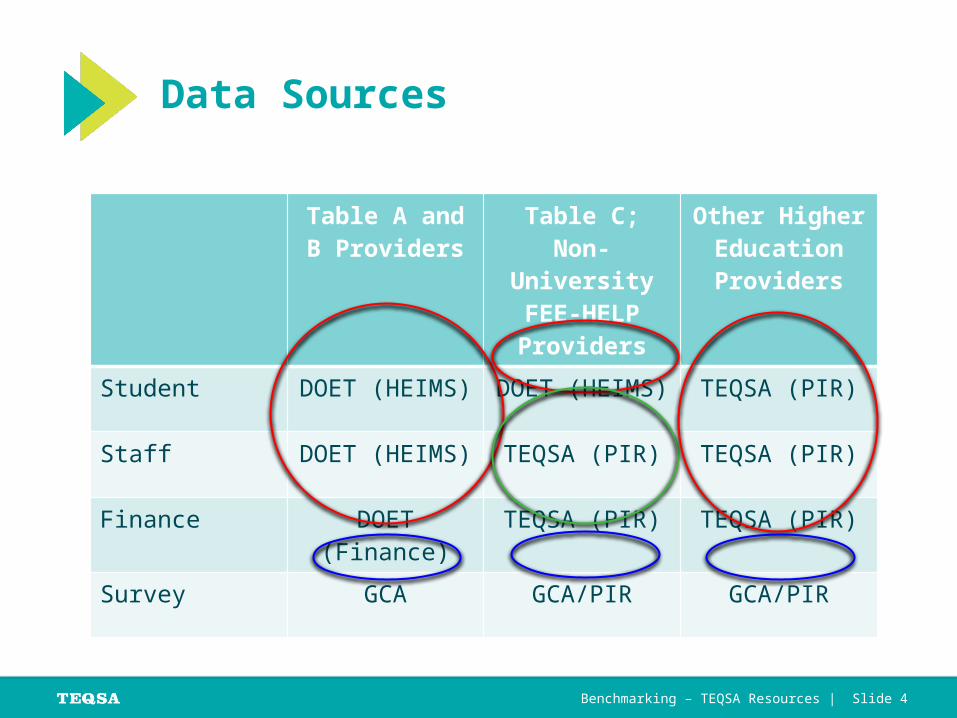
Data Sources
Table A and B Providers
Table C;Non-University
FEE-HELP Providers
Other Higher Education Providers
Student DOET (HEIMS) DOET (HEIMS) TEQSA (PIR)
Staff DOET (HEIMS) TEQSA (PIR) TEQSA (PIR)
Finance DOET (Finance) TEQSA (PIR) TEQSA (PIR)
Survey GCA GCA/PIR GCA/PIR
TEQSA’s Evidence-based approach to regulation | Slide 5 Benchmarking – TEQSA Resources | Slide 5
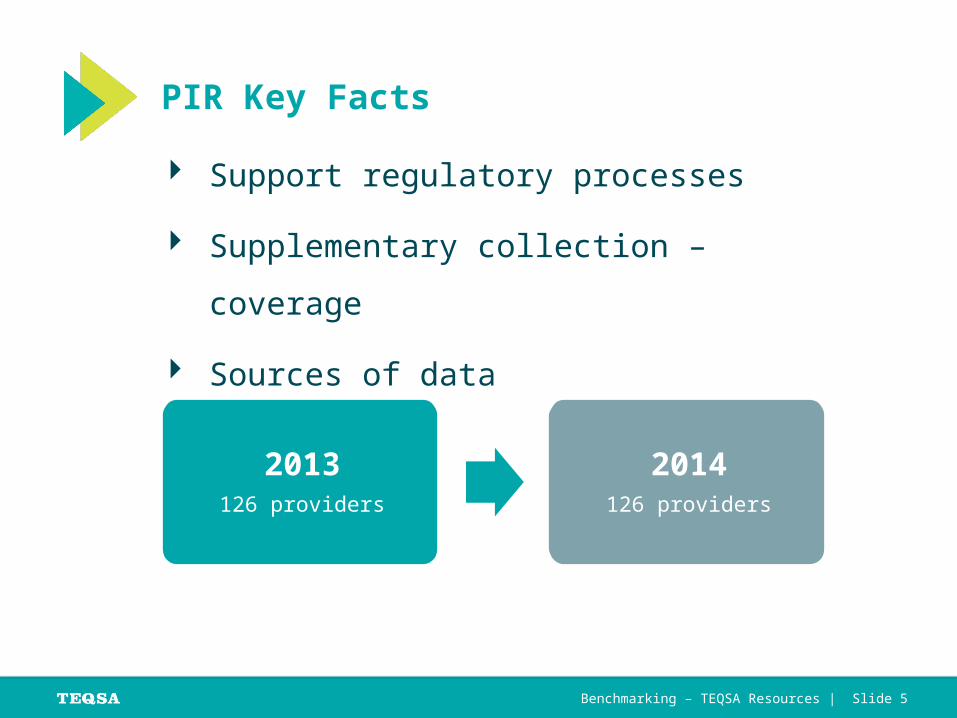
PIR Key Facts
Support regulatory processes
Supplementary collection – coverage
Sources of data
2013126 providers
2014126 providers
TEQSA’s Evidence-based approach to regulation | Slide 6 Benchmarking – TEQSA Resources | Slide 6
Student
All students included
Subject areas
Student load
Course completions
Student load for first half year
TEQSA’s Evidence-based approach to regulation | Slide 7 Benchmarking – TEQSA Resources | Slide 7
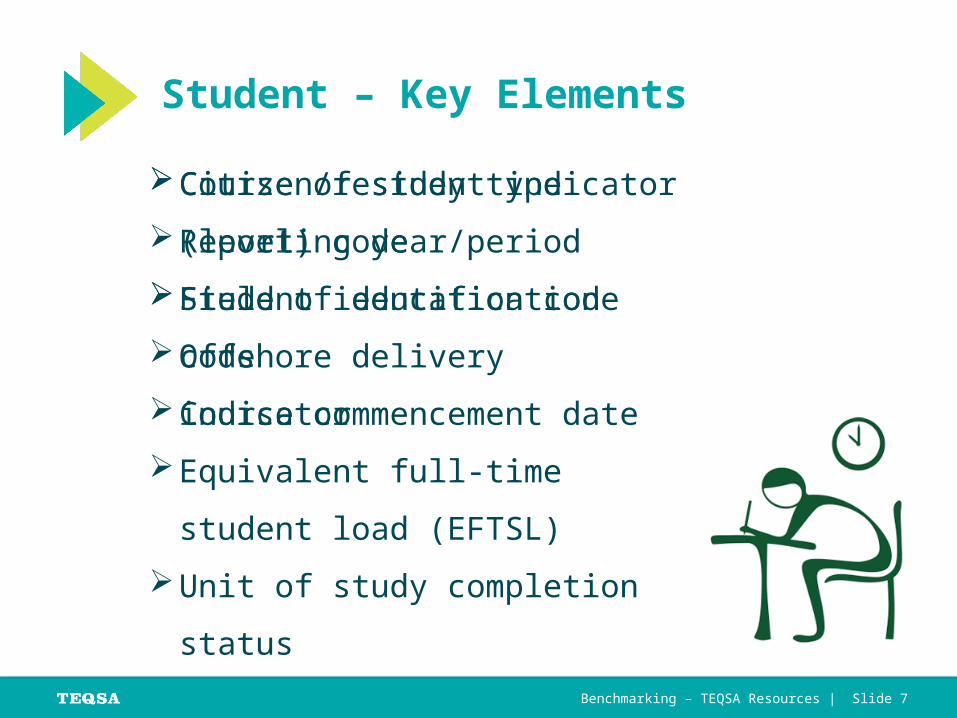
Student – Key Elements
Course of study type (level) code
Student identification code
Course commencement date
Equivalent full-time student load
(EFTSL)
Unit of study completion status
Citizen/resident indicator
Reporting year/period
Field of education code
Offshore delivery indicator
TEQSA’s Evidence-based approach to regulation | Slide 8 Benchmarking – TEQSA Resources | Slide 8
Staff
Academic staff only
Subject areas
Full-time/fractional full-time
Casual/sessional
TEQSA’s Evidence-based approach to regulation | Slide 9 Benchmarking – TEQSA Resources | Slide 9
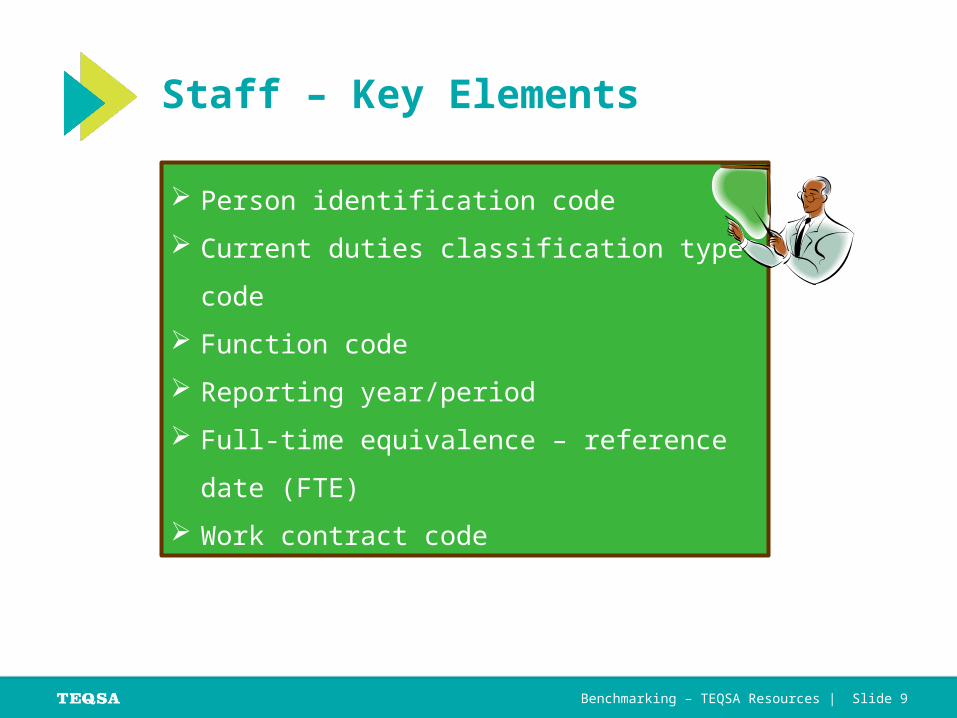
Person identification code
Current duties classification type code
Function code
Reporting year/period
Full-time equivalence – reference date (FTE)
Work contract code
Staff – Key Elements
TEQSA’s Evidence-based approach to regulation | Slide 10 Benchmarking – TEQSA Resources | Slide 10
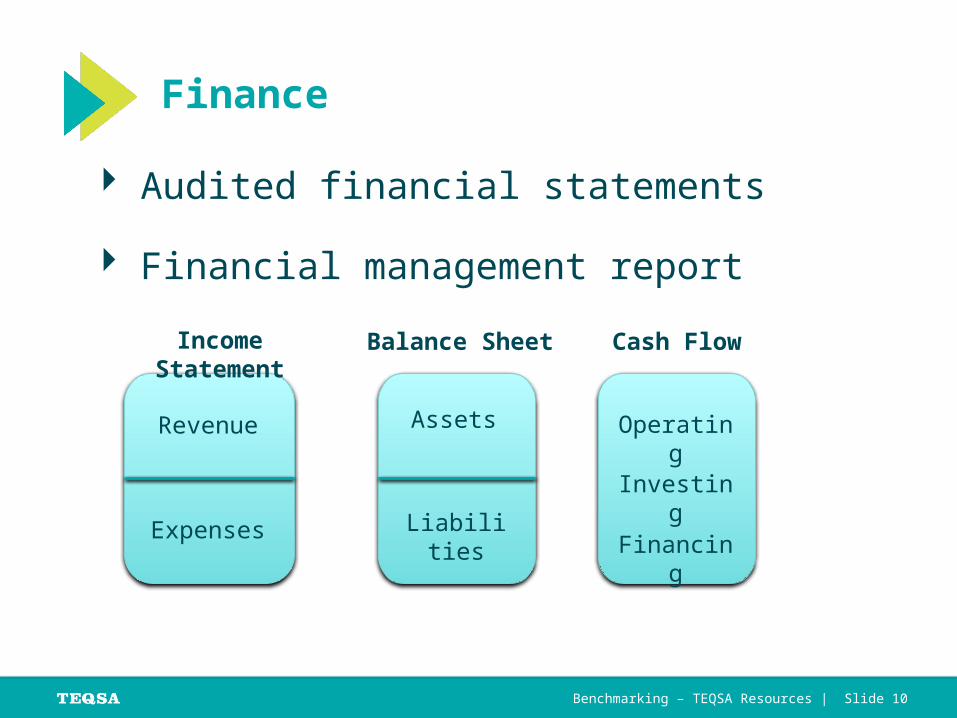
Finance
Audited financial statements
Financial management report
Assets
Liabilities
Revenue
Expenses
Operating
Investing
Financing
Income Statement Balance Sheet Cash Flow
TEQSA’s Evidence-based approach to regulation | Slide 11 Benchmarking – TEQSA Resources | Slide 11
Survey
Student Surveys
Course Evaluation
Graduate Destinations
TEQSA’s Evidence-based approach to regulation | Slide 12 Benchmarking – TEQSA Resources | Slide 12
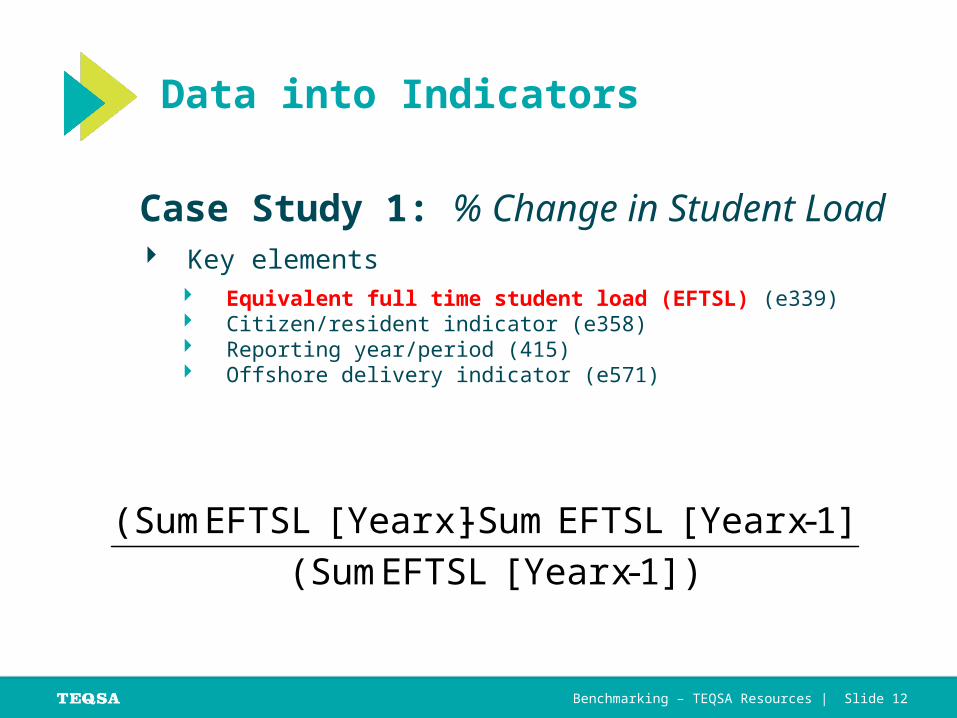
Data into Indicators
Case Study 1: % Change in Student Load Key elements
Equivalent full time student load (EFTSL) (e339) Citizen/resident indicator (e358) Reporting year/period (415) Offshore delivery indicator (e571)
1])- x[Year EFTSL (Sum
1])- x[Year EFTSL Sum - x][Year EFTSL (Sum
TEQSA’s Evidence-based approach to regulation | Slide 13 Benchmarking – TEQSA Resources | Slide 13
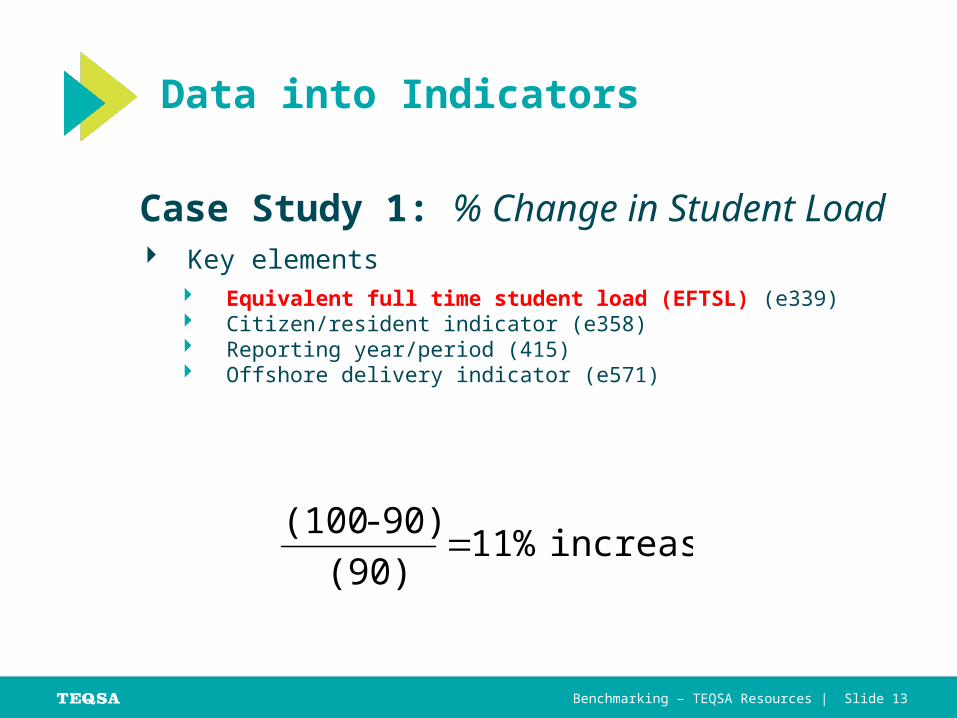
Data into Indicators
increase 11% (90)
90) - (100
Case Study 1: % Change in Student Load Key elements
Equivalent full time student load (EFTSL) (e339) Citizen/resident indicator (e358) Reporting year/period (415) Offshore delivery indicator (e571)
TEQSA’s Evidence-based approach to regulation | Slide 14 Benchmarking – TEQSA Resources | Slide 14
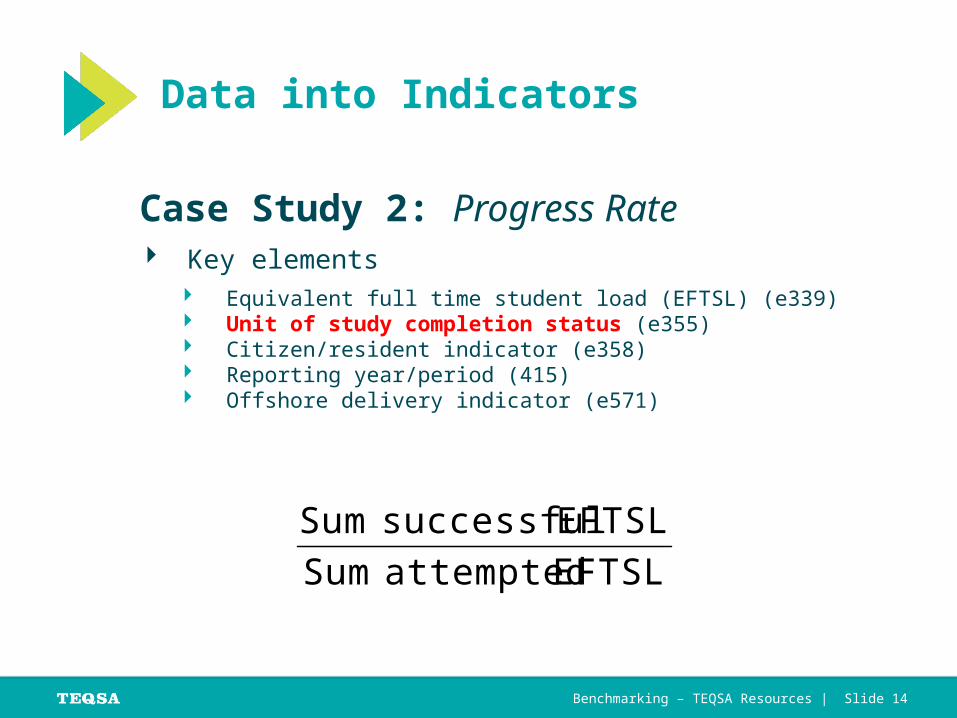
Data into Indicators
Case Study 2: Progress Rate Key elements
Equivalent full time student load (EFTSL) (e339) Unit of study completion status (e355) Citizen/resident indicator (e358) Reporting year/period (415) Offshore delivery indicator (e571)
EFTSL attempted Sum
EFTSL successful Sum
TEQSA’s Evidence-based approach to regulation | Slide 15 Benchmarking – TEQSA Resources | Slide 15
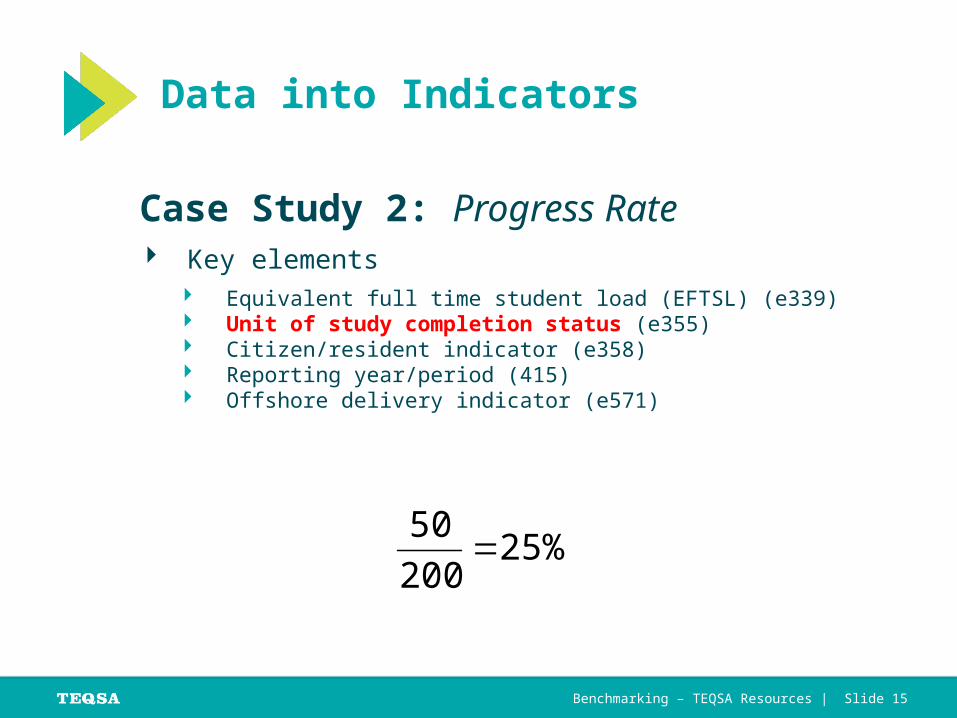
Data into Indicators
Case Study 2: Progress Rate Key elements
Equivalent full time student load (EFTSL) (e339) Unit of study completion status (e355) Citizen/resident indicator (e358) Reporting year/period (415) Offshore delivery indicator (e571)
25% 200
50
TEQSA’s Evidence-based approach to regulation | Slide 16 Benchmarking – TEQSA Resources | Slide 16
TEQSA’s Risk Assessment Framework
TEQSA’s Evidence-based approach to regulation | Slide 17 Benchmarking – TEQSA Resources | Slide 17
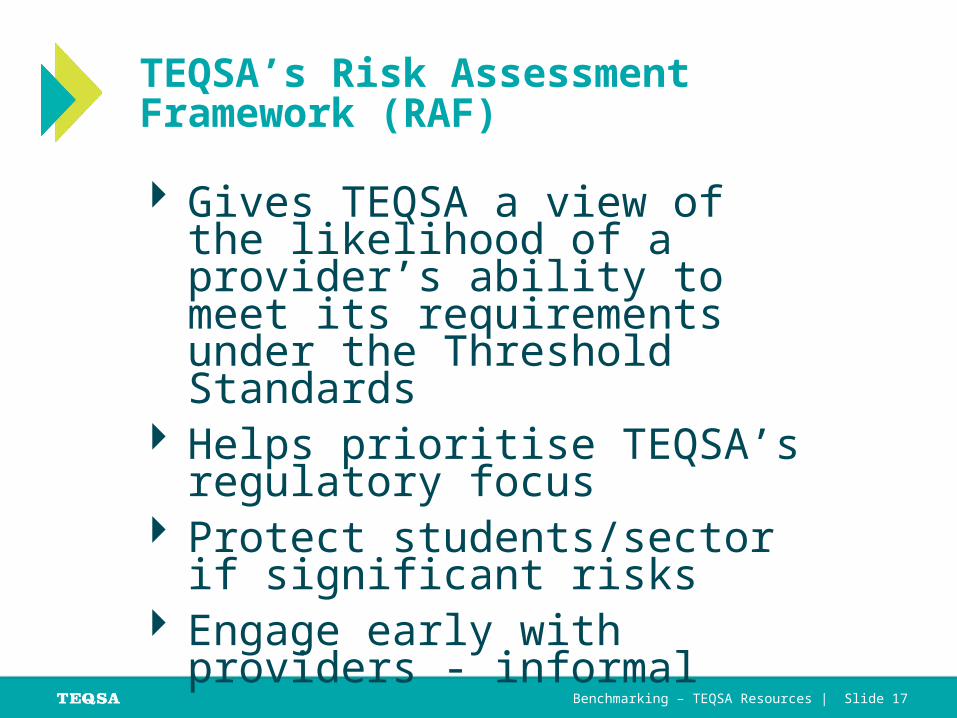
Gives TEQSA a view of the likelihood of a provider’s ability to meet its requirements under the Threshold Standards
Helps prioritise TEQSA’s regulatory focus
Protect students/sector if significant risks
Engage early with providers - informal
TEQSA’s Risk Assessment Framework (RAF)
TEQSA’s Evidence-based approach to regulation | Slide 18 Benchmarking – TEQSA Resources | Slide 18
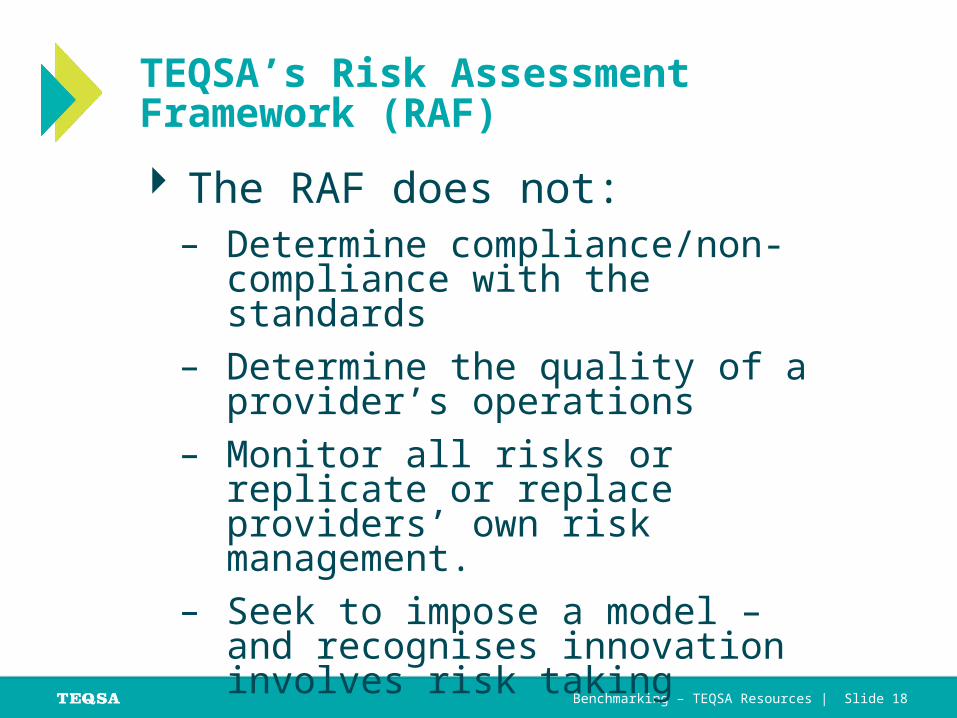
The RAF does not:– Determine compliance/non-
compliance with the standards– Determine the quality of a
provider’s operations– Monitor all risks or replicate or
replace providers’ own risk management.
– Seek to impose a model – and recognises innovation involves risk taking
TEQSA’s Risk Assessment Framework (RAF)
TEQSA’s Evidence-based approach to regulation | Slide 19 Benchmarking – TEQSA Resources | Slide 19
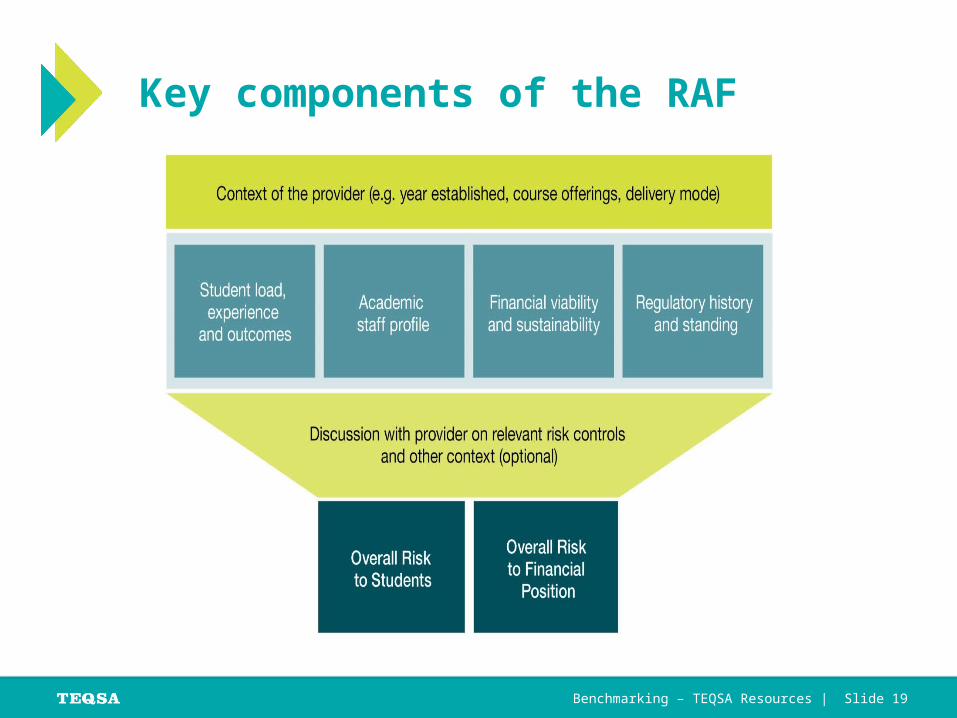
Key components of the RAF
TEQSA’s Evidence-based approach to regulation | Slide 20 Benchmarking – TEQSA Resources | Slide 20
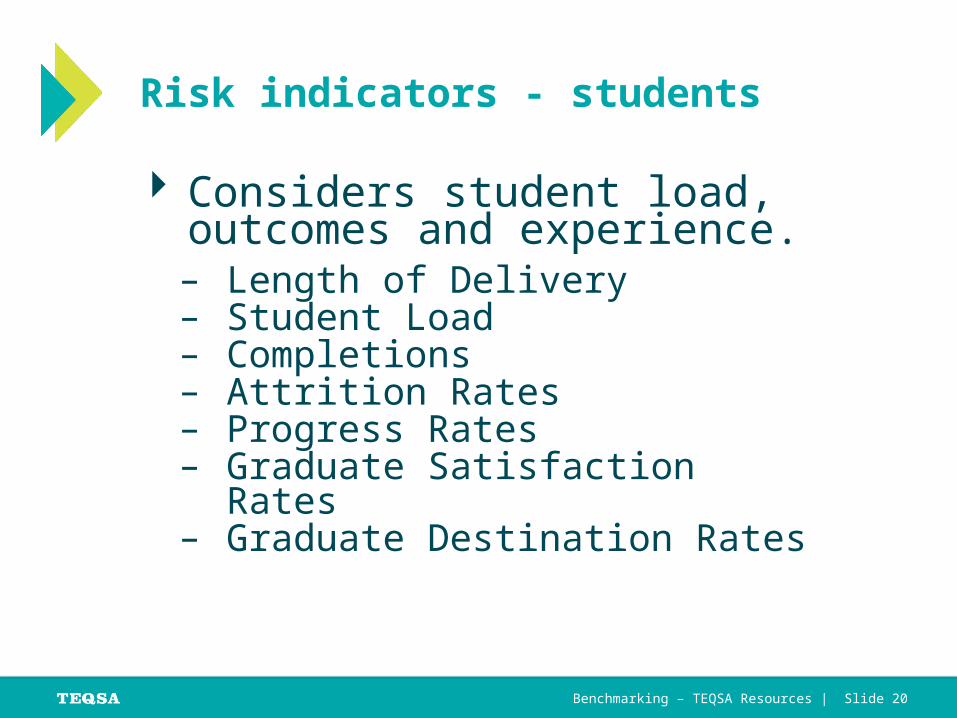
Considers student load, outcomes and experience.– Length of Delivery – Student Load– Completions – Attrition Rates– Progress Rates– Graduate Satisfaction Rates– Graduate Destination Rates
Risk indicators - students
TEQSA’s Evidence-based approach to regulation | Slide 21 Benchmarking – TEQSA Resources | Slide 21
Considers the academic staffing profile of the provider.– Senior Academic Leaders to Broad
Field of Education Ratio– Student to Staff Ratio– Academic Staff Employed on
Casual Work Contracts
Risk indicators - staff
TEQSA’s Evidence-based approach to regulation | Slide 22 Benchmarking – TEQSA Resources | Slide 22
Considers the overall financial position of the provider.– Financial Viability– Financial Sustainability
Risk indicators – financial position
TEQSA’s Evidence-based approach to regulation | Slide 23 Benchmarking – TEQSA Resources | Slide 23
When assessing risk against an indicator, TEQSA considers:– Context– Data– TEQSA’s Risk Thresholds– Risk Controls
How TEQSA uses the data to assess risk
TEQSA’s Evidence-based approach to regulation | Slide 24 Benchmarking – TEQSA Resources | Slide 24
Setting thresholds– Trend analysis of sector data over
multiple years– Distribution of providers by
indicator within a given year Assessing individual providers
– The most current year’s data– A provider’s trend– Comparison to sector trends where
relevant
How TEQSA uses the data to assess risk
TEQSA’s Evidence-based approach to regulation | Slide 25 Benchmarking – TEQSA Resources | Slide 25
Individual indicators are rarely considered in isolation
Overall risk ratings combine a number of observations together to form a view on the ‘Likelihood’ that there is an issue at the provider
Links Between Indicators
TEQSA’s Evidence-based approach to regulation | Slide 26 Benchmarking – TEQSA Resources | Slide 26
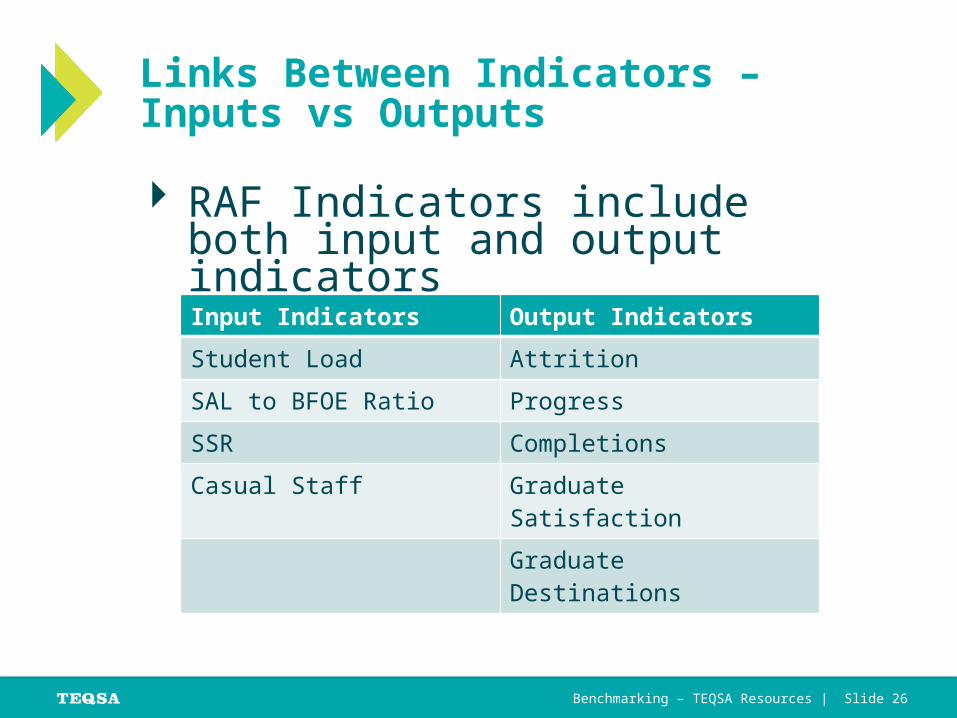
RAF Indicators include both input and output indicators
Links Between Indicators – Inputs vs Outputs
Input Indicators Output Indicators
Student Load Attrition
SAL to BFOE Ratio Progress
SSR Completions
Casual Staff Graduate Satisfaction
Graduate Destinations
TEQSA’s Evidence-based approach to regulation | Slide 27 Benchmarking – TEQSA Resources | Slide 27
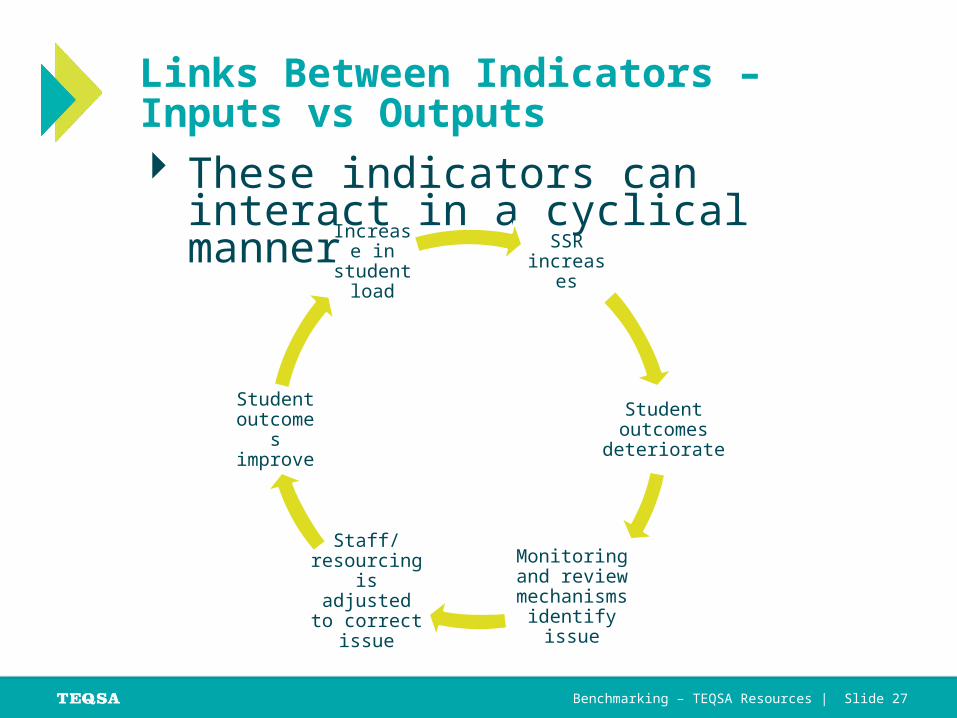
These indicators can interact in a cyclical manner
Links Between Indicators – Inputs vs Outputs
SSR increases
Student outcomes deteriorate
Monitoring and review
mechanisms identify issue
Staff/ resourcing is adjusted to
correct issue
Student outcomes improve
Increase in student
load
TEQSA’s Evidence-based approach to regulation | Slide 28 Benchmarking – TEQSA Resources | Slide 28
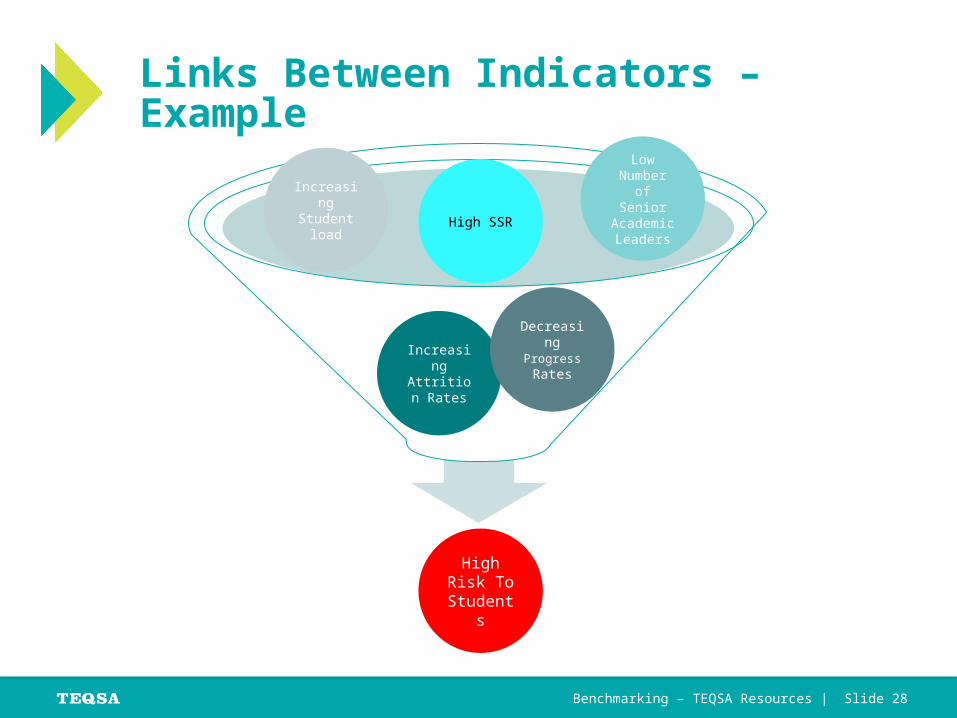
Increasing Attrition Rates
Decreasing Progress Rates
High SSR
Links Between Indicators – Example
High Risk To
Students
Low Number of
Senior Academic Leaders
Increasing Student
load
TEQSA’s Evidence-based approach to regulation | Slide 29 Benchmarking – TEQSA Resources | Slide 29
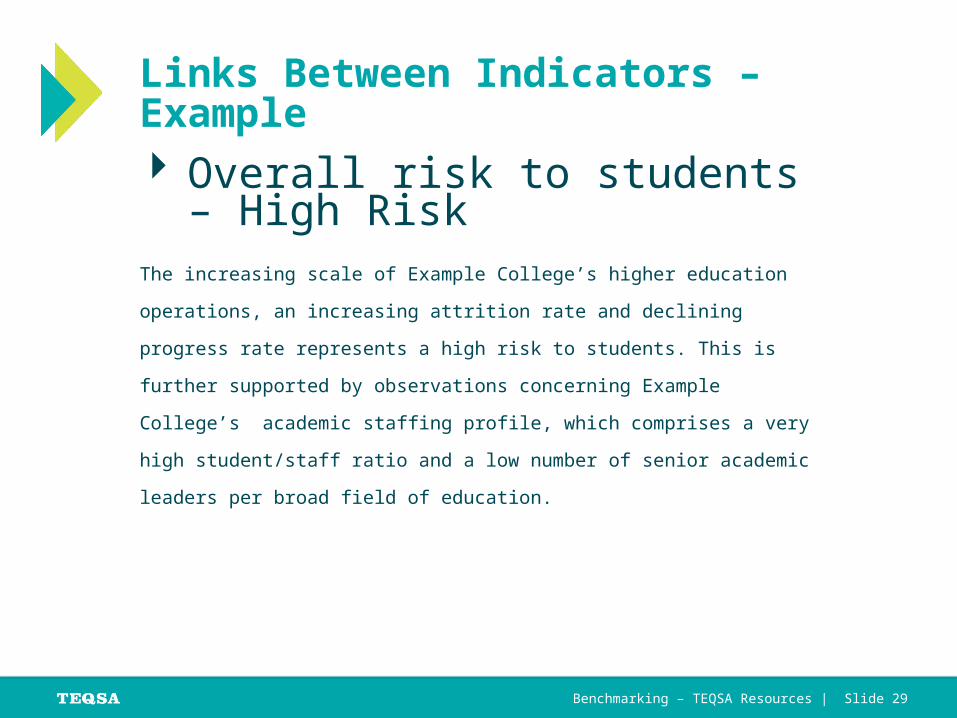
Overall risk to students – High Risk
The increasing scale of Example College’s higher education operations, an
increasing attrition rate and declining progress rate represents a high risk to
students. This is further supported by observations concerning Example College’s
academic staffing profile, which comprises a very high student/staff ratio and a
low number of senior academic leaders per broad field of education.
Links Between Indicators – Example
TEQSA’s Evidence-based approach to regulation | Slide 30 Benchmarking – TEQSA Resources | Slide 30
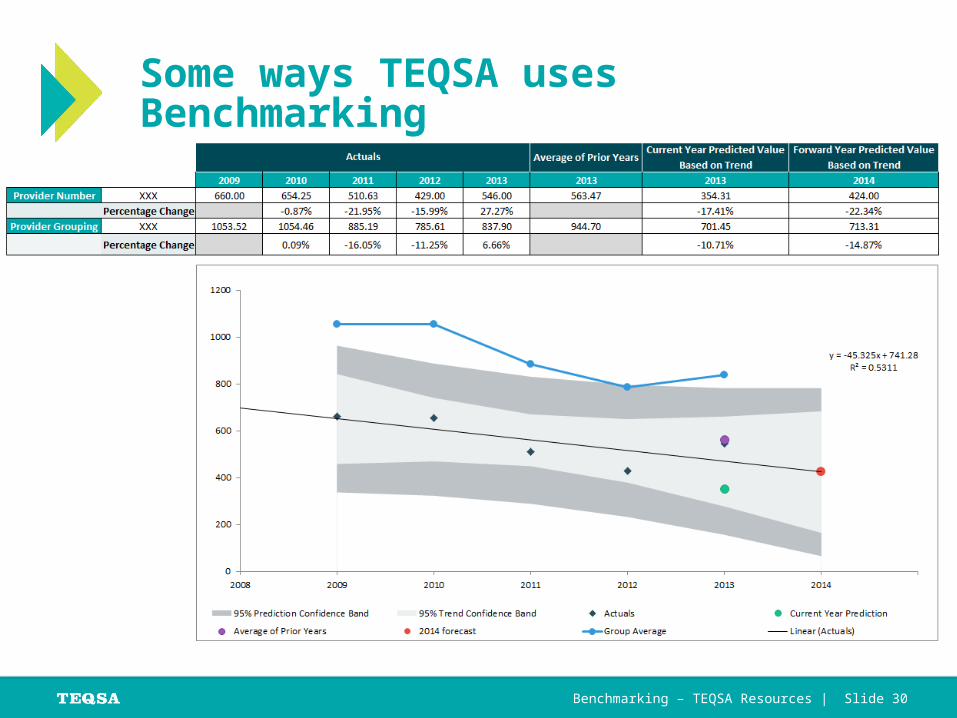
Some ways TEQSA uses Benchmarking
TEQSA’s Evidence-based approach to regulation | Slide 31 Benchmarking – TEQSA Resources | Slide 31
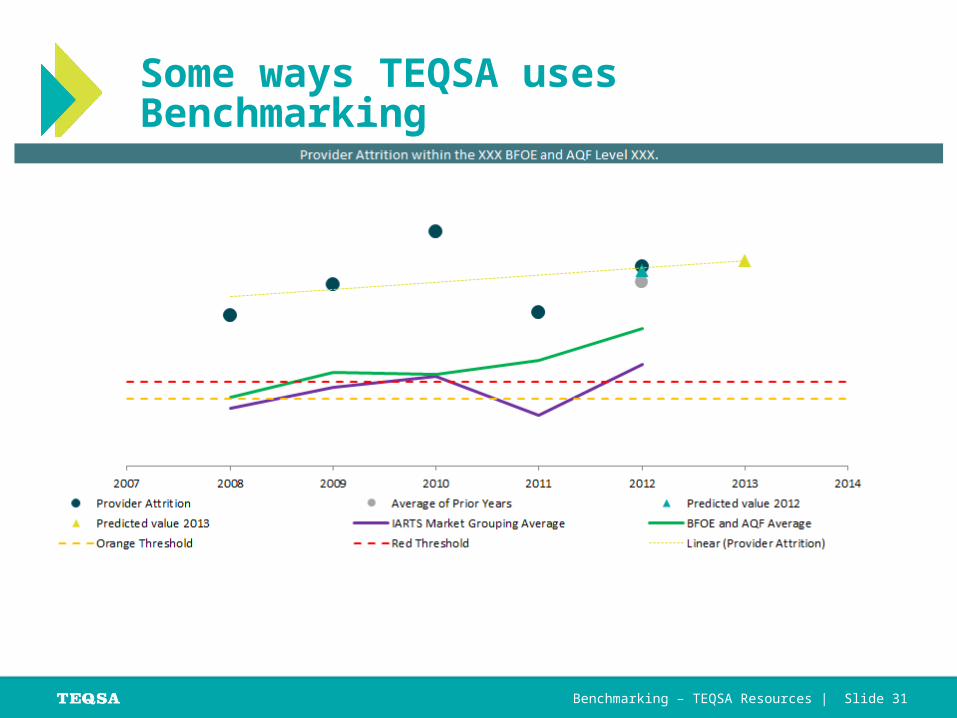
Some ways TEQSA uses Benchmarking
TEQSA’s Evidence-based approach to regulation | Slide 32 Benchmarking – TEQSA Resources | Slide 32
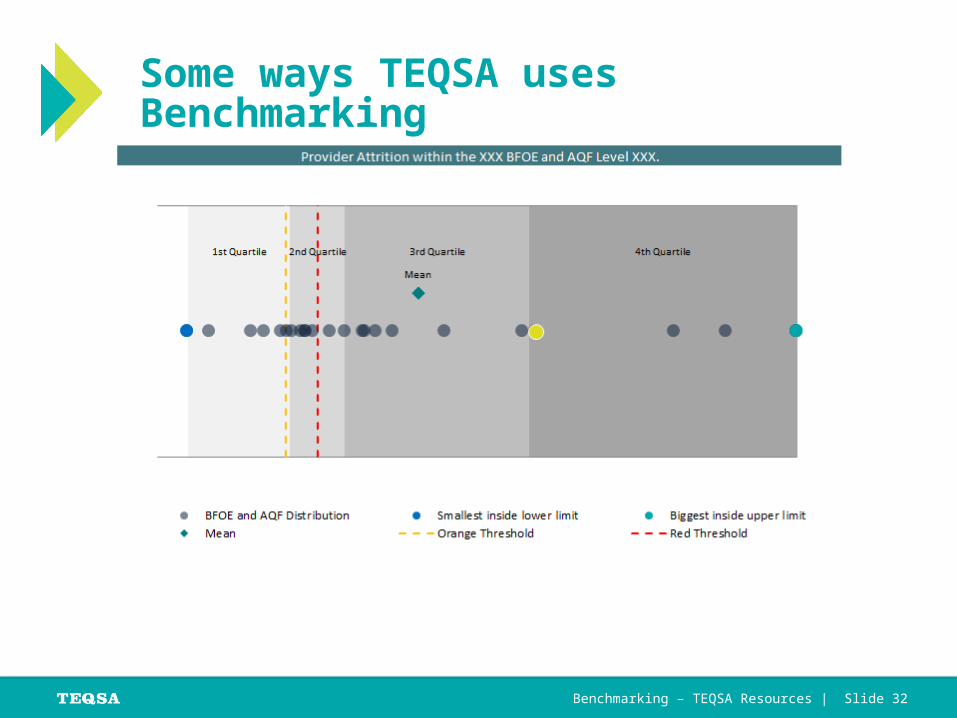
Some ways TEQSA uses Benchmarking
TEQSA’s Evidence-based approach to regulation | Slide 33 Benchmarking – TEQSA Resources | Slide 33
Student, staff data – multi year Formal agreement Agreements with participating
members
How TEQSA Can Help
TEQSA’s Evidence-based approach to regulation | Slide 34 Benchmarking – TEQSA Resources | Slide 34
TEQSA uses data to help inform its view of a provider’s risk of non-compliance with the Threshold Standards
Analysis of inter-related indicators as a whole provides far greater insight than a view of one indicator by itself
Data can be compared across the sector and within groupings to provide additional context and information for a specific assessment
Summary messages
TEQSA’s Evidence-based approach to regulation | Slide 35 Benchmarking – TEQSA Resources | Slide 35
More information
TEQSA’s Risk Assessment Framework
http://teqsa.gov.au/regulatory-approach/risk-assessment-framework
Info sheets
http://teqsa.gov.au/for-providers/frequently-asked-questions-providers
http://teqsa.gov.au/sites/default/files/RiskRatings.pdf
http://www.teqsa.gov.au/sites/default/files/HowTEQSARatesRiskIndicators.pdf
TEQSA’s Evidence-based approach to regulation | Slide 36 Benchmarking – TEQSA Resources | Slide 36
Contacts
[email protected] (Senior Information Analyst)
[email protected] (Senior Risk Analyst)
Your case manager
TEQSA’s Evidence-based approach to regulation | Slide 37 Benchmarking – TEQSA Resources | Slide 37
Questions