Embed Size (px)
Citation preview

Population Projections for the State of Tennessee
2005 to 2025
A joint publication of the
Tennessee Advisory Commission on Intergovernmental Relations
and
The University of Tennessee
Center for Business and Economic Research
December 2003

Contributors to this Report
Harry A. Green, Ph.D. TACIR Executive Director
Matthew N. Murray, Ph.D.
CBER Associate Director and Project Director
Julie L. Marshall, M.A. CBER Research Associate
Stacia E. Couch, B.A.
CBER Publications Specialist
Alex Ransom CBER Student Assistant
Colin McLeod, M.C.P.
Tennessee Office of Local Planning, Principal Planner
Kenneth E. Belliveau, M.C.P., AICP TACIR Senior Research Associate
Teresa A. Gibson
TACIR Publications Assistant

Table of Contents
Overview...............................................................................................................1 Key Findings .........................................................................................................3 Aggregate Projections for State ............................................................................6 Aggregate Projections for Counties ......................................................................8 Aggregate Projections for Cities Arrayed by County ...........................................12 Aggregate Projections for Cities Alphabetically ..................................................26 Aggregate Projections for Counties by Development District..............................36 Aggregate Projections for Counties within MSAs................................................55 Technical Appendix.............................................................................................58

Overview

Population Projections for Tennessee, 2005 to 2025
Tennessee Advisory Commission on Intergovernmental Relations Center for Business and Economic Research Page 1
Overview This report provides updated population projections for Tennessee counties and cities, and for the state as a whole, in five-year intervals extending to 2025. The projections are intended to be used as a tool in the planning process, particularly at the local level in support of Public Chapter 1101, commonly referred to as the Growth Management Law. Those who make use of these population projections should be aware that the Tennessee Department of Health has recently released population projections for the state and sub-state areas as well. The estimates produced by the Department of Health project a slightly lower rate of statewide population growth than the estimates presented here and are based on some different assumptions about the rate of in-migration of people into local communities and the state. Unlike the estimates prepared and released in 1998 by the Center for Business and Economic Research, the current estimates were developed using the well-established cohort-component technique that is widely used in the field of demography. The cohort-component method, explained in greater detail in the Technical Appendix to this report, builds up population estimates by looking at the components of population change: births, deaths, and migration. Fertility and mortality rates are generally quite stable, so migration becomes a critical component of demographic forecasting. Because the projections developed here extend so far into the future (to the year 2025) and the 1990s were a period of unprecedented population growth, an average migration rate for the past four decades is used in this analysis. The use of the cohort-component technique has enabled development of more detailed demographic projections for the state and sub-state areas. Specifically the current projections offer detail on the age and gender composition of counties, cities and unincorporated areas of counties. (The Department of Health projections provide age/gender/race detail but only for county units.) Generally estimates such as these are less precise than estimates of aggregate population. Accordingly the detailed demographic estimates must be used with caution. Greatest confidence is placed in demographic projections for Tennessee counties, since the data used to support these estimates are generally deemed to be of relatively high quality. Estimates for sub-county areas are likely to be less precise than their county-level counterparts so additional caution is warranted in their use. Estimates are presented for counties, cities, and unincorporated areas. The cohort-component model provides county-level figures; population estimates for specific sub-county areas (both cities and unincorporated areas) are extrapolated from the county estimates using actual population data for 2000, 2001, and 2002. It must be recognized that it is impossible to explicitly account for the way the growth management law might cause future population settlement patters to differ from the past. While an intent of the law is to increase relative city densities, this has not been directly factored in to the estimates. When projections were made in 1998, heavy reliance was placed generally on data from the 1990 Census, and in particular on city-level estimates through 1997. The 1990 Census figures have been criticized for undercounting the population, although the magnitude of the undercount has not been well documented. (The 1990 undercount is another reason for using a four-decade average migration rate as noted above.) The current projections benefit from the more recent and presumably more accurate 2000 Census; the city-level projections rely heavily on 2000 Census data and estimates for subsequent years. Differences in methodology and better quality data have produced significant differences in the current estimates for some cities and counties vis-á-vis those developed in 1998; estimates of the state-level population have changed little. Again, the Technical Appendix to this report provides additional detail on the methodology and data used to arrive at and verify the projections. The estimates presented in the body of the report are formatted in a variety of ways to facilitate their use. The first major section of tables provides aggregate projections for (i) counties; (ii) cities arrayed by their

Population Projections for Tennessee, 2005 to 2025
Tennessee Advisory Commission on Intergovernmental Relations Center for Business and Economic Research Page 2
respective county; (iii) cities arrayed alphabetically; (iv) counties by Development District; (v) Tennessee counties within newly-designated metropolitan statistical areas (MSAs) (Tennessee now has 37 counties that are included in 10 different MSAs.), and (vi) demographic information on age-gender composition, alphabetically by county. Additional Data All of the information presented in this report is posted on the web sites of the Center for Business and Economic Research (http://cber.bus.utk.edu), and the Tennessee Advisory Commission on Intergovernmental Relations (www.state.tn.us/tacir/), which funded the research. For those people interested in examining these projections in greater detail, the cohort–component data for individual cities and counties is also available on the TACIR website. In addition, the version of this report posted on these web sites will eventually provide maps (not available in the hard copy of the report) that display unofficial copies of the county-wide growth plans and offer aggregate population projections for 92 of Tennessee’s 95 counties. Three counties, Davidson, Trousdale and Moore, have metropolitan governments and thus are not required to develop growth Plans under PC 1101. The electronic files were graciously provided by Colin McLeod of the State Department of Economic and Community Development’s Office of Local Planning. While these are not official maps, they may still prove useful to those interested in local planning. A Word of Caution Users of this data should be aware that population projections such as these rely on a number of assumptions about the continuation of past trends into the future. When using population projections such as these, people are encouraged to use them as a guide illustrating a general possible scenario of future growth patterns. Although these projections are based on a mathematical model using sound scientific principles, ultimately, the overall accuracy of these projections will depend on the extent to which future events unfold in a manner that mirrors these past observations. Different projections using different assumptions will inevitable yield different results. In addition, there may be people with specific knowledge or understanding of events and factors that may affect their local communities that could result in a more complete understanding of the growth dynamic affecting their community. Thus, we caution users not to construe these figures as predicting a specific or inevitable future course of events. Instead, the numbers contained within this report should be read as a likely course of future population change based on a continuation of past trends. Population projections such as these are simply one of a number of tools that planners and local community leaders should consider when envisioning the future for their communities.

Population Projections for Tennessee, 2005 to 2025
Tennessee Advisory Commission on Intergovernmental Relations Center for Business and Economic Research Page 3
Key Findings Figure 1 shows the projected total state population by five-year intervals out to 2025. The 2000 Census shows Tennessee’s population to be 5,689,283, while the projections indicate a total population of 7,559,532 by 2025. Between 2000 and 2025 the population of the state of Tennessee is expected to grow by 32.9 percent, translating into a compound annual growth rate (CAGR) of 1.1 percent. In comparison, the total state population grew at only a .61 percent CAGR in the 1980s versus a much stronger 1.6 percent CAGR in the 1990s.
Figure 1: Tennessee Projected Population Levels
5,689,2836,017,595
6,425,9696,821,312
7,195,3747,559,531
0
1,000,000
2,000,000
3,000,000
4,000,000
5,000,000
6,000,000
7,000,000
8,000,000
2000 2005 2010 2015 2020 2025
Year
Proj
ecte
dPo
pula
tion
In terms of percentage growth, the most rapidly growing segment of the population through 2025 is the 65 to 69 age group for both males and females. In terms of numbers of people, the most rapidly growing segment of the population is the 75 and over age group. Wide variation in growth rates is expected for Tennessee cities and counties over the next 22 years, although all counties will experience some positive growth. Figure 2 provides a summary map of county growth rates for the 2000-2025 period to place the projected trends in perspective.
Lawrence20
Wayne7 Giles
21
Moore25
Hardin18McNairy
26
Houston39
Humphreys27
Perry26
Lake
9 Obion13 Weakley
25
Henry31
Dyer17 Gibson
7
Hardeman15
Fayette30
Shelby22
Tipton33
Lauderdale7
Haywood4
Crockett32
Madison38
Chester50
Carroll26
Henderson36
Deca
tur
30
Benton30
Lewis34
Hickman39
Maury37
Marshall37
Dickson53
Williamson99
Lincoln15
Franklin33
Bedford40
Coffee30 Grundy
13
Rutherford75
Davidson21
Wilson64
Marion28
Warren38
Cannon24
DeKalb34
Sequatchie
33
Hamilton14
Bradley48 Polk
48
Bledsoe
48 Rhea41
McMinn20
Meig
s93
VanBuren
8
White27
Putnam44
Cumberland41
Monroe29
Roane23 Loudon
64 Blount36
Sevier93
Knox33
Morgan4
Anderson8 Jefferson
49Cocke
39
Union39
Grainger25
Campbell13
Claiborne21
Hancock2
Hamblen32 Greene
23
Hawkins29 Washington
31
Unicoi
16
Sullivan5
Carter14
John
son
14
Scott37Fentress
32
Pickett33
Overton36
Clay40
Jackson51
Macon38
Trousdale27
Sumner61
Robertson48
Montgomery67
Chea
tham
65
Stewart33
Smith30
2 - 19 percent growth 20 - 39 percent growth 80 - 99 percent growth
Figure 2: County Growth Rates for 2000 to 2025
60 - 79 percent growth40 - 59 percent growth

Population Projections for Tennessee, 2005 to 2025
Tennessee Advisory Commission on Intergovernmental Relations Center for Business and Economic Research Page 4
As shown in Figure 3, the five counties with the slowest projected total population growth are Hancock (2.37 percent), Haywood (4.04 percent), Morgan (4.06 percent), Sullivan (5.37 percent), and Lauderdale (7.13 percent). With the exception of Sullivan, all of these are relatively small, rural counties. Figure 4 shows the five counties with the highest projected growth in population through 2025, Williamson, Sevier, Meigs, Rutherford, and Montgomery. Williamson, Rutherford and Montgomery counties are in middle Tennessee where much of the state’s recent growth has been concentrated. Sevier County, adjacent to the Great Smoky Mountains National Park, will continue its strong rate of growth buoyed in part by rapid growth in the tourism trade.
Figure 3: Five Counties with theLowest Projected Population Growth Rate, 2005 to 2025
7.13%
5.37%
4.06% 4.04%
2.37%
0%
1%
2%
3%
4%
5%
6%
7%
8%
Lauderdale29,033
Sullivan161,263
Morgan20,560
Haywood20,596
Hancock6,947
Gro
wth
Rat
e
Projected 2025Population
Figure 4: Five Counties with theHighest Projected Population Growth Rate, 2005 to 2025
99.33%92.98% 92.80%
75.02%66.55%
0%
20%
40%
60%
80%
100%
120%
Williamson252,426
Sevier137,345
Meigs21,374
Rutherford318,583
Montgomery224,457
Gro
wth
Rat
e
Projected 2025Population

Population Projections for Tennessee, 2005 to 2025
Tennessee Advisory Commission on Intergovernmental Relations Center for Business and Economic Research Page 5
Of the five largest cities in Tennessee (i.e., those with population greater than 150,000) the three with the largest projected percentage growth rates are Clarksville, Knoxville, and Nashville (as shown in Figure 5). For mid-sized cities, those with populations between 25,000 and 75,000, the cities with the largest projected growth rates are Franklin (98.78 percent), Smyrna (96.49 percent), Murfreesboro (81.48 percent), Hendersonville (59.19 percent), and Collierville (40.02 percent). For smaller cities with populations between 10,000 and 25,000, the highest projected growth rates are projected for Brentwood (144.51 percent), Mount Juliet (143.37 percent), Sevierville (135.51 percent), and LaVergne (105.77 percent). For small cities with less than 10,000 people, the highest projected growth rates are expected in Whiteville (324.80 percent), Spring Hill (192.63 percent), Gatlinburg (123.76 percent), Atoka (120.36 percent), and Fairview (107.16 percent).
Figure 5: Five Largest Cities(Population Greater than 150,000)
with the Largest Projected Population Growth, 2005 to 2025
Memphis776,158Davidson
657,640
Knoxville220,685
Chattanooga175,755
Clarksville171,485
Projected 2025Population
65.76%
26.91%20.55% 19.39%
12.99%
0%
10%
20%
30%
40%
50%
60%
70%
Nashville-
Perc
ent
While growth rates give an indication of how quickly or slowly an area is growing, it is also important to consider the total number of people in a county or city, as a high growth rate does not necessarily result in a large population. In terms of total number of people, the three counties with the largest population growth throughout the 2000 to 2025 period are Shelby (200,813), Rutherford (136,560), and Williamson (125,788). The three cities with the largest projected populations are Memphis (126,058), Nashville-Davidson (112,116), and Clarksville (68,030). The three counties with the smallest projected population growth are Lake (755), Van Buren (434), and Hancock (161).

Aggregate Projections for State

Population Projections for Tennessee, 2005 to 2025
2000 5,689,283
2005 6,017,5952010 6,425,9692015 6,821,3122020 7,195,3742025 7,559,531
Census
Projected
Projected Population Growth for State of Tennessee, 2005 to 2025
6,821,312
6,425,969
6,017,595
5,689,283
7,195,374
7,559,531
5,500,000
6,500,000
7,500,000
8,500,000
2000 2005 2010 2015 2020 2025
Year
Num
ber o
f Peo
ple
Tennessee Advisory Commission on Intergovernmental RelationsCenter for Business and Economic Research Page 6

Aggregate Projections for Counties

Population Projections for Tennessee, 2005 to 2025
CensusCounty 2000 2005 2010 2015 2020 2025
Tennessee 5,689,283 6,017,599 6,425,969 6,821,312 7,195,375 7,559,532
Anderson 71,330 73,065 75,163 76,583 77,226 77,233Bedford 37,586 40,204 43,224 46,387 49,664 52,468Benton 16,537 17,386 18,500 19,578 20,542 21,442Bledsoe 12,367 12,867 14,416 15,861 17,150 18,316Blount 105,823 112,222 120,592 128,718 136,357 143,707
Bradley 87,965 94,810 103,873 112,856 121,533 130,252Campbell 39,854 41,180 42,615 43,748 44,455 44,885Cannon 12,826 13,445 14,183 14,852 15,426 15,946Carroll 29,475 30,628 32,574 34,295 35,753 37,040Carter 56,742 57,985 60,332 62,239 63,657 64,739
Cheatham 35,912 40,126 44,880 49,691 54,477 59,205Chester 15,540 16,187 18,045 19,892 21,665 23,381Claiborne 29,862 30,920 32,502 33,914 35,159 36,262Clay 7,976 8,408 9,086 9,793 10,481 11,193Cocke 33,565 35,938 38,679 41,401 44,030 46,738
Coffee 48,014 50,303 53,771 56,979 59,888 62,584Crockett 14,532 15,303 16,279 17,267 18,253 19,239Cumberland 46,802 50,082 54,059 58,045 61,922 66,119Davidson 569,891 596,399 620,928 643,675 665,579 688,340Decatur 11,731 12,353 13,189 13,941 14,577 15,202
DeKalb 17,423 18,484 19,835 21,118 22,284 23,430Dickson 43,156 47,288 52,059 56,823 61,487 66,148Dyer 37,279 38,547 40,209 41,617 42,719 43,500Fayette 28,806 30,489 32,525 34,419 35,978 37,360Fentress 16,625 17,657 18,838 19,945 20,968 21,961
Franklin 39,270 40,700 43,870 46,907 49,700 52,207Gibson 48,152 48,967 50,430 51,248 51,514 51,730Giles 29,447 30,548 32,134 33,509 34,616 35,494Grainger 20,659 21,771 22,950 23,998 24,920 25,760Greene 62,909 65,299 68,949 72,169 74,935 77,456
Grundy 14,332 14,778 15,355 15,775 16,067 16,253Hamblen 58,128 61,754 65,881 69,721 73,315 76,938Hamilton 307,896 314,958 324,353 335,636 344,951 352,285Hancock 6,786 6,684 6,690 6,835 6,932 6,947Hardeman1 28,105 30,188 30,908 31,456 31,891 32,239
Hardin 25,578 26,543 27,780 28,808 29,604 30,225Hawkins 53,563 56,786 60,314 63,571 66,538 69,354Haywood 19,797 20,046 20,339 20,474 20,573 20,596Henderson 25,522 27,448 29,414 31,281 33,034 34,713Henry 31,115 32,767 34,960 37,065 38,947 40,764
Projections
Tennessee Advisory Commission on Intergovernmental RelationsCenter for Business and Economic Research Page 8

Population Projections for Tennessee, 2005 to 2025
CensusCounty 2000 2005 2010 2015 2020 2025
Projections
Hickman 22,295 23,979 25,800 27,564 29,259 30,981Houston 8,088 8,571 9,268 9,963 10,563 11,228Humphreys 17,929 18,909 20,078 21,112 22,000 22,778Jackson 10,984 11,915 13,060 14,225 15,385 16,592Jefferson 44,294 47,374 52,111 56,796 61,318 65,928
Johnson 17,499 18,099 18,749 19,278 19,655 19,959Knox 382,032 398,735 427,593 455,614 481,842 507,438Lake2 7,954 8,085 8,240 8,409 8,558 8,709Lauderdale 27,101 27,900 28,657 29,098 29,172 29,033Lawrence 39,926 41,763 43,752 45,430 46,861 48,066
Lewis 11,367 11,947 13,086 14,040 14,740 15,283Lincoln 31,340 32,336 33,655 34,715 35,476 36,004Loudon 39,086 43,334 48,362 53,574 58,729 64,291Macon 20,386 21,827 23,473 25,092 26,628 28,140Madison 91,837 96,726 104,797 112,639 120,008 126,951
Marion 27,776 28,459 30,519 32,253 33,845 35,616Marshall 26,767 28,615 30,756 32,808 34,737 36,544Maury 69,498 74,185 79,962 85,453 90,486 95,303McMinn 49,015 50,968 53,356 55,434 57,155 58,629McNairy 24,653 25,856 27,413 28,803 30,005 31,126
Meigs 11,086 12,801 14,768 16,869 19,040 21,374Monroe 38,961 41,214 43,817 46,203 48,317 50,290Montgomery 134,768 147,946 165,840 184,458 203,842 224,457Moore 5,740 5,992 6,335 6,650 6,930 7,162Morgan 19,757 19,936 20,257 20,361 20,476 20,560
Obion 32,450 33,381 34,622 35,545 36,219 36,681Overton 20,118 21,423 22,927 24,441 25,887 27,417Perry 7,631 7,987 8,448 8,888 9,260 9,611Pickett 4,945 5,203 5,565 5,919 6,230 6,559Polk 16,050 17,446 18,999 20,545 22,086 23,733
Putnam 62,315 67,240 72,535 78,000 83,488 89,595Rhea 28,400 30,172 32,809 35,329 37,665 39,964Roane 51,910 54,224 57,042 59,604 61,836 63,942Robertson 54,433 59,380 64,809 70,196 75,388 80,534Rutherford 182,023 203,240 231,326 260,125 288,924 318,583
Scott 21,127 22,648 24,325 25,942 27,451 28,965Sequatchie 11,370 12,138 13,011 13,792 14,501 15,168Sevier 71,170 82,423 95,196 108,709 122,526 137,345Shelby 897,472 934,295 979,507 1,021,875 1,061,943 1,098,285Smith 17,712 18,744 19,927 21,033 22,032 22,963
Tennessee Advisory Commission on Intergovernmental RelationsCenter for Business and Economic Research Page 9

Population Projections for Tennessee, 2005 to 2025
CensusCounty 2000 2005 2010 2015 2020 2025
Projections
Stewart 12,370 13,151 14,036 14,873 15,659 16,401Sullivan 153,048 155,515 158,561 160,466 161,390 161,263Sumner 130,449 145,007 161,570 177,616 193,675 209,736Tipton 51,271 54,406 58,372 62,179 65,544 68,414Trousdale 7,259 7,586 8,055 8,495 8,881 9,226
Unicoi 17,667 18,165 18,897 19,536 20,056 20,560Union 17,808 19,162 20,660 22,106 23,436 24,748Van Buren 5,508 5,610 5,779 5,886 5,942 5,942Warren 38,276 40,837 44,069 47,176 50,056 52,905Washington 107,198 112,764 120,236 127,230 133,790 140,466
Wayne 16,842 17,223 17,630 17,909 18,046 18,056Weakley 34,895 36,420 38,202 39,975 41,642 43,457White 23,102 24,318 25,757 27,060 28,185 29,249Williamson 126,638 149,596 174,261 199,813 226,133 252,426Wilson 88,809 98,910 110,448 122,115 133,704 145,249
1. In October 2002, a new prison facility was opened in Whiteville, Hardeman county. The 2003 population of the prison is 1,500; this addition is reflected in the projections beginning in 2005.2. In 2001, Tiptonville, Lake county, was rezoned to include the prison population. This addition is reflected in the projections beginning in 2005.
Tennessee Advisory Commission on Intergovernmental RelationsCenter for Business and Economic Research Page 10

Aggregate Projections for Cities Arrayed by County

Population Projections for Tennessee, 2005 to 2025
CensusCounty Municipality 2000 2005 2010 2015 2020 2025
Clinton city 9,409 9,513 9,658 9,711 9,669 9,546Lake City town (pt.) 1,858 1,863 1,879 1,876 1,853 1,815Norris city 1,446 1,439 1,436 1,424 1,398 1,359Oak Ridge city (pt.) 24,610 24,813 25,127 25,196 25,014 24,622Oliver Springs town (pt.) 2,309 2,345 2,398 2,420 2,425 2,402Unincorporated 31,698 33,091 34,665 35,956 36,868 37,489Total 71,330 73,065 75,163 76,583 77,226 77,233
Bell Buckle town 391 402 415 427 442 446Normandy town 141 149 160 172 179 189Shelbyville city 16,105 17,609 19,351 21,227 23,228 25,080Wartrace town 548 567 588 612 631 645Unincorporated 20,401 21,477 22,710 23,950 25,185 26,108Total 37,586 40,204 43,224 46,387 49,664 52,468
Big Sandy town 518 548 587 625 659 695Camden city 3,828 3,964 4,154 4,329 4,472 4,597Unincorporated 12,191 12,874 13,760 14,625 15,411 16,150Total 16,537 17,386 18,500 19,578 20,542 21,442
Pikeville city 1,781 1,844 2,056 2,251 2,422 2,573Unincorporated 10,586 11,023 12,361 13,610 14,729 15,743Total 12,367 12,867 14,416 15,861 17,150 18,316
Alcoa city 7,734 8,316 9,056 9,808 10,540 11,252Friendsville city 890 920 953 991 1,009 1,035Louisville city 2,001 2,188 2,424 2,664 2,904 3,147Maryville city 23,120 24,655 26,639 28,588 30,462 32,277Rockford city 798 830 868 901 941 963Townsend city 244 247 265 270 273 287Vonore town (pt.) 0 0 0 0 0 0Unincorporated 71,036 75,065 80,386 85,495 90,228 94,746Total 105,823 112,222 120,592 128,718 136,357 143,707
Charleston city 630 673 727 779 826 873Cleveland city 37,192 39,375 42,380 45,233 47,860 50,381Unincorporated 50,143 54,762 60,765 66,844 72,847 78,998Total 87,965 94,810 103,873 112,856 121,533 130,252
Caryville town 2,243 2,413 2,600 2,774 2,934 3,084Jacksboro town 1,887 1,981 2,080 2,170 2,241 2,294Jellico city 2,448 2,533 2,625 2,695 2,743 2,774La Follette city 7,926 8,207 8,510 8,750 8,909 9,013Lake City town (pt.) 30 33 34 35 40 40Unincorporated 25,320 26,013 26,766 27,325 27,589 27,680Total 39,854 41,180 42,615 43,748 44,455 44,885
Auburntown town 252 258 267 273 276 279Woodbury town 2,428 2,528 2,664 2,785 2,889 2,982Unincorporated 10,146 10,659 11,253 11,794 12,260 12,685Total 12,826 13,445 14,183 14,852 15,426 15,946
Projections
Bedford
Anderson
Blount
Bradley
Benton
Bledsoe
Campbell
Cannon
Tennessee Advisory Commission on Intergovernmental RelationsCenter for Business and Economic Research Page 12

Population Projections for Tennessee, 2005 to 2025
CensusCounty Municipality 2000 2005 2010 2015 2020 2025
Projections
Atwood town 1,000 1,038 1,104 1,163 1,212 1,256Bruceton town 1,554 1,577 1,671 1,749 1,816 1,871Clarksburg town 285 294 313 329 343 356Hollow Rock town 963 1,005 1,068 1,125 1,173 1,215Huntingdon town 4,349 4,429 4,691 4,918 5,109 5,271McKenzie city (pt.) 4,963 5,247 5,599 5,916 6,189 6,434McLemoresville town 259 263 280 292 304 311Trezevant town 901 928 987 1,039 1,080 1,119Unincorporated 15,201 15,847 16,860 17,765 18,527 19,209Total 29,475 30,628 32,574 34,295 35,753 37,040
Elizabethton city 13,372 13,360 13,834 14,209 14,463 14,644Johnson City city (pt.) 1,138 1,200 1,255 1,301 1,337 1,366Watauga city (pt.) 331 348 368 380 395 401Unincorporated 41,901 43,077 44,875 46,350 47,463 48,328Total 56,742 57,985 60,332 62,239 63,657 64,739
Ashland City town 3,641 4,434 5,045 5,685 6,336 7,010Kingston Springs town 2,773 3,078 3,442 3,806 4,167 4,523Pegram town 2,146 2,343 2,608 2,872 3,138 3,392Pleasant View city 2,934 3,342 3,752 4,169 4,587 5,003Unincorporated 24,418 26,928 30,034 33,159 36,249 39,277Total 35,912 40,126 44,880 49,691 54,477 59,205
Enville town (pt.) 230 147 162 179 193 206Henderson city 5,670 6,331 7,157 8,001 8,835 9,668Milledgeville town (pt.) 83 84 92 101 110 119Silerton town (pt.) 0 0 0 0 0 0Unincorporated 9,557 9,625 10,634 11,611 12,527 13,388Total 15,540 16,187 18,045 19,892 21,665 23,381
Cumberland Gap town 204 198 205 214 218 221Harrogate city 4,126 4,125 4,307 4,460 4,592 4,703New Tazewell town 2,871 2,910 3,045 3,164 3,266 3,354Tazewell town 2,165 2,164 2,259 2,343 2,412 2,469Unincorporated 20,496 21,523 22,687 23,733 24,671 25,513Total 29,862 30,920 32,502 33,914 35,159 36,262
Celina city 1,379 1,442 1,556 1,675 1,789 1,907Unincorporated 6,597 6,966 7,530 8,118 8,692 9,286Total 7,976 8,408 9,086 9,793 10,481 11,193
Newport city 7,242 7,551 8,084 8,607 9,105 9,614Parrottsville town 207 223 240 257 273 290Unincorporated 26,116 28,165 30,355 32,537 34,652 36,834Total 33,565 35,938 38,679 41,401 44,030 46,738
Manchester city 8,294 9,065 9,776 10,444 11,073 11,672Tullahoma city (pt.) 16,970 17,536 18,696 19,755 20,709 21,579Unincorporated 22,750 23,702 25,299 26,780 28,105 29,333Total 48,014 50,303 53,771 56,979 59,888 62,584
Coffee
Carroll
Carter
Cheatham
Chester
Claiborne
Clay
Cocke
Tennessee Advisory Commission on Intergovernmental RelationsCenter for Business and Economic Research Page 13

Population Projections for Tennessee, 2005 to 2025
CensusCounty Municipality 2000 2005 2010 2015 2020 2025
Projections
Alamo town 2,392 2,519 2,680 2,842 3,004 3,165Bells city 2,171 2,471 2,670 2,877 3,088 3,307Friendship city 608 640 680 722 763 802Gadsden town 553 589 628 668 708 748Maury City town 704 754 804 856 909 960Unincorporated 8,104 8,329 8,817 9,302 9,780 10,256Total 14,532 15,303 16,279 17,267 18,253 19,239
Crab Orchard city 838 881 946 1,010 1,077 1,144Crossville city 8,981 9,881 10,725 11,580 12,422 13,343Pleasant Hill town 544 586 632 685 731 780Unincorporated 36,439 38,733 41,755 44,770 47,692 50,852Total 46,802 50,082 54,059 58,045 61,922 66,119
Belle Meade city 2,943 3,101 3,229 3,347 3,528 3,648Berry Hill city 674 716 745 772 799 826Forest Hills city 4,710 5,129 5,402 5,664 5,924 6,126Goodlettsville city (pt.) 9,155 9,781 10,245 10,685 11,049 11,495Lakewood city 2,341 2,505 2,608 2,703 2,795 2,891Nashville-Davidson 545,534 570,277 593,607 615,225 635,961 657,640Oak Hill city 4,493 4,831 5,030 5,214 5,458 5,644Ridgetop city (pt.) 41 60 62 64 67 69Total 569,891 596,399 620,928 643,675 665,579 688,340
Decaturville town 859 894 954 1,005 1,048 1,092Parsons city 2,452 2,577 2,750 2,907 3,038 3,167Scotts Hill town (pt.) 349 369 394 417 436 456Unincorporated 8,071 8,513 9,092 9,613 10,055 10,488Total 11,731 12,353 13,189 13,941 14,577 15,202
Alexandria town 814 858 918 976 1,030 1,080Dowelltown town 302 318 341 363 381 401Liberty town 367 388 417 443 468 492Smithville city 3,994 4,209 4,510 4,796 5,054 5,307Unincorporated 11,946 12,712 13,649 14,540 15,352 16,150Total 17,423 18,484 19,835 21,118 22,284 23,430
Burns town 1,366 1,494 1,645 1,790 1,937 2,084Charlotte town 1,153 1,225 1,338 1,455 1,562 1,674Dickson city 12,244 13,118 14,379 15,621 16,829 18,019Slayden town 185 199 219 239 258 278Vanleer town 310 331 364 392 424 450White Bluff town 2,142 2,355 2,598 2,835 3,074 3,307Unincorporated 25,756 28,566 31,517 34,491 37,403 40,337Total 43,156 47,288 52,059 56,823 61,487 66,148
Dyersburg city 17,452 17,932 18,685 19,314 19,800 20,136Newbern town 2,988 3,103 3,241 3,358 3,447 3,515Trimble town (pt.) 728 740 768 791 812 822Unincorporated 16,111 16,772 17,515 18,153 18,660 19,027Total 37,279 38,547 40,209 41,617 42,719 43,500
Dickson
DeKalb
Dyer
Crockett
Cumberland
Davidson
Decatur
Tennessee Advisory Commission on Intergovernmental RelationsCenter for Business and Economic Research Page 14

Population Projections for Tennessee, 2005 to 2025
CensusCounty Municipality 2000 2005 2010 2015 2020 2025
Projections
Braden town 271 271 289 303 313 321Gallaway city 666 680 719 754 784 807Grand Junction city (pt.) 0 0 0 0 0 0Hickory Withe town 2,574 2,659 2,823 2,970 3,091 3,194La Grange town 136 134 140 148 151 153Moscow city 422 439 468 496 514 534Oakland town 1,279 1,308 1,389 1,459 1,515 1,562Piperton city 589 628 673 712 748 777Rossville town 380 387 410 430 450 463Somerville town 2,519 2,582 2,739 2,877 2,990 3,086Williston city 341 351 371 389 403 418Unincorporated 19,629 21,050 22,504 23,880 25,019 26,044Total 28,806 30,489 32,525 34,419 35,978 37,360
Allardt city 642 673 718 758 795 830Jamestown city 1,839 1,923 2,046 2,160 2,262 2,363Unincorporated 14,144 15,061 16,074 17,027 17,911 18,768Total 16,625 17,657 18,838 19,945 20,968 21,961
Cowan city 1,770 1,783 1,908 2,031 2,137 2,234Decherd city 2,246 2,243 2,404 2,552 2,684 2,798Estill Springs town 2,152 2,202 2,365 2,524 2,664 2,793Huntland town 916 912 974 1,032 1,088 1,133Monteagle town (pt.) 6 37 57 89 139 209Tullahoma city (pt.) 1,024 1,046 1,127 1,201 1,267 1,331Winchester city 7,329 7,656 8,265 8,851 9,393 9,883Unincorporated 23,827 24,823 26,770 28,627 30,327 31,826Total 39,270 40,700 43,870 46,907 49,700 52,207
Bradford town 1,113 1,112 1,140 1,153 1,154 1,154Dyer city 2,406 2,483 2,562 2,614 2,632 2,654Gibson town 305 323 333 343 345 352Humboldt city (pt.) 9,442 9,519 9,783 9,927 9,958 9,984Kenton town (pt.) 753 764 787 799 804 802Medina city 969 974 1,004 1,015 1,020 1,019Milan city 7,664 7,947 8,215 8,379 8,459 8,525Rutherford town 1,272 1,273 1,306 1,327 1,329 1,329Trenton city 4,683 4,706 4,836 4,904 4,914 4,925Yorkville city 293 299 308 313 314 316Unincorporated 19,252 19,567 20,157 20,474 20,585 20,671Total 48,152 48,967 50,430 51,248 51,514 51,730
Ardmore city (pt.) 995 1,033 1,086 1,136 1,173 1,203Elkton city 510 528 553 576 595 610Lynnville town 345 351 370 385 398 405Minor Hill city 437 446 469 486 502 511Pulaski city 7,871 8,321 8,785 9,195 9,533 9,814Unincorporated 19,289 19,869 20,871 21,731 22,414 22,950Total 29,447 30,548 32,134 33,509 34,616 35,494
Fayette
Fentress
Franklin
Gibson
Giles
Tennessee Advisory Commission on Intergovernmental RelationsCenter for Business and Economic Research Page 15

Population Projections for Tennessee, 2005 to 2025
CensusCounty Municipality 2000 2005 2010 2015 2020 2025
Projections
Bean Station city 2,570 2,719 2,869 3,002 3,120 3,228Blaine city 1,585 1,676 1,767 1,850 1,921 1,989Rutledge town 1,187 1,234 1,297 1,353 1,401 1,445Unincorporated 15,317 16,141 17,017 17,792 18,478 19,098Total 20,659 21,771 22,950 23,998 24,920 25,760
Baileyton town 504 509 538 563 577 596Greeneville town 15,198 15,476 16,272 16,967 17,550 18,070Mosheim town 1,749 1,809 1,910 1,999 2,076 2,146Tusculum city 2,004 2,044 2,144 2,237 2,315 2,386Unincorporated 43,454 45,461 48,085 50,403 52,417 54,258Total 62,909 65,299 68,949 72,169 74,935 77,456
Altamont town 1,136 1,181 1,228 1,264 1,289 1,305Beersheba Springs town 553 562 580 595 604 609Coalmont city 948 984 1,023 1,052 1,073 1,087Gruetli-Laager city 1,867 1,933 2,010 2,067 2,106 2,131Monteagle town (pt.) 804 813 840 860 872 879Palmer town 726 745 772 793 807 816Tracy City town 1,679 1,710 1,772 1,817 1,846 1,863Unincorporated 6,619 6,851 7,129 7,327 7,470 7,563Total 14,332 14,778 15,355 15,775 16,067 16,253
Morristown city (pt.) 24,959 26,455 28,210 29,848 31,371 32,906White Pine town (pt.) 0 0 0 0 0 0Unincorporated 33,169 35,298 37,671 39,873 41,943 44,032Total 58,128 61,754 65,881 69,721 73,315 76,938
Chattanooga city (pt.) 155,554 158,014 162,501 167,919 172,338 175,755Collegedale city 6,514 7,244 7,590 7,988 8,348 8,666East Ridge city 20,640 20,441 20,921 21,514 21,973 22,300Lakesite city 1,845 1,890 1,946 1,980 2,035 2,078Lookout Mountain town 2,000 1,984 2,011 2,081 2,104 2,149Red Bank city 12,418 12,283 12,552 12,922 13,177 13,387Ridgeside city 389 378 389 403 414 423Signal Mountain town 7,429 7,433 7,622 7,854 8,037 8,173Soddy-Daisy city 11,530 12,189 12,617 13,123 13,591 13,950Walden town 1,960 1,984 2,043 2,115 2,173 2,219Unincorporated 87,617 91,118 94,160 97,737 100,760 103,184Total 307,896 314,958 324,353 335,636 344,951 352,285
Sneedville town 1,257 1,349 1,374 1,429 1,474 1,503Unincorporated 5,529 5,335 5,316 5,406 5,458 5,444Total 6,786 6,684 6,690 6,835 6,932 6,947
Grundy
Grainger
Greene
Hamblen
Hamilton
Hancock
Tennessee Advisory Commission on Intergovernmental RelationsCenter for Business and Economic Research Page 16

Population Projections for Tennessee, 2005 to 2025
CensusCounty Municipality 2000 2005 2010 2015 2020 2025
Projections
Bolivar city 5,802 5,721 5,758 5,760 5,740 5,706Grand Junction city (pt.) 301 299 300 299 300 297Hickory Valley town 136 133 133 135 134 132Hornsby town 306 302 306 305 306 303Middleton city 602 634 646 654 660 664Saulsbury town 99 100 99 101 99 100Silerton town (pt.) 60 57 59 60 57 58Toone town 330 329 331 330 332 329Whiteville town1 3,148 6,998 8,286 9,755 11,436 13,373Unincorporated 17,321 15,616 14,990 14,058 12,827 11,277Total 28,105 30,188 30,908 31,456 31,891 32,239
Adamsville town (pt.) 33 37 39 40 41 42Crump city 1,521 1,585 1,661 1,723 1,773 1,810Milledgeville town (pt.) 74 80 83 86 89 91Saltillo town 342 358 375 389 400 408Savannah city 6,917 7,196 7,534 7,816 8,037 8,209Unincorporated 16,691 17,287 18,087 18,754 19,263 19,664Total 25,578 26,543 27,780 28,808 29,604 30,225
Bulls Gap town 714 727 766 801 832 860Church Hill city 5,916 6,298 6,695 7,063 7,399 7,719Kingsport city (pt.) 2,907 3,021 3,197 3,357 3,493 3,627Mount Carmel town 4,795 5,264 5,627 5,976 6,301 6,609Rogersville town 4,240 4,373 4,620 4,844 5,044 5,222Surgoinsville town 1,484 1,760 1,912 2,066 2,209 2,358Unincorporated 33,507 35,343 37,498 39,465 41,261 42,958Total 53,563 56,786 60,314 63,571 66,538 69,354
Brownsville city 10,748 10,929 11,099 11,181 11,245 11,268Stanton town 615 613 620 622 623 622Unincorporated 8,434 8,504 8,620 8,671 8,704 8,706Total 19,797 20,046 20,339 20,474 20,573 20,596
Lexington city 7,393 7,891 8,445 8,968 9,458 9,921Parkers Crossroads city 241 272 294 316 337 354Sardis town 445 472 503 535 562 587Scotts Hill town (pt.) 545 579 618 657 690 726Unincorporated 16,898 18,234 19,555 20,805 21,988 23,125Total 25,522 27,448 29,414 31,281 33,034 34,713
Cottage Grove town 97 102 108 111 117 122Henry town 520 557 598 634 670 705McKenzie city (pt.) 90 95 101 107 113 118Paris city 9,763 10,135 10,782 11,401 11,945 12,466Puryear city 667 704 752 797 837 876Unincorporated 19,978 21,174 22,619 24,014 25,265 26,476Total 31,115 32,767 34,960 37,065 38,947 40,764
Centerville town 3,793 3,990 4,275 4,545 4,804 5,065Unincorporated 18,502 19,989 21,525 23,019 24,454 25,915Total 22,295 23,979 25,800 27,564 29,259 30,981
Hardeman
Hardin
Hawkins
Haywood
Henderson
Henry
Hickman
Tennessee Advisory Commission on Intergovernmental RelationsCenter for Business and Economic Research Page 17

Population Projections for Tennessee, 2005 to 2025
CensusCounty Municipality 2000 2005 2010 2015 2020 2025
Projections
Erin city 1,490 1,546 1,665 1,782 1,882 1,992Tennessee Ridge town (pt.) 1,327 1,398 1,510 1,621 1,718 1,823Unincorporated 5,271 5,627 6,093 6,560 6,963 7,413Total 8,088 8,571 9,268 9,963 10,563 11,228
McEwen city 1,702 1,759 1,861 1,949 2,022 2,086New Johnsonville city 1,905 2,042 2,176 2,297 2,400 2,494Waverly city 4,028 4,185 4,431 4,645 4,827 4,982Unincorporated 10,294 10,923 11,609 12,222 12,751 13,216Total 17,929 18,909 20,078 21,112 22,000 22,778
Gainesboro town 879 923 1,006 1,090 1,171 1,254Unincorporated 10,105 10,992 12,054 13,135 14,214 15,338Total 10,984 11,915 13,060 14,225 15,385 16,592
Baneberry city 366 417 464 511 558 607Dandridge town 2,078 2,255 2,491 2,721 2,949 3,178Jefferson City city 7,760 7,935 8,650 9,349 10,001 10,654Morristown city (pt.) 6 9 16 17 25 26New Market town 1,234 1,284 1,407 1,522 1,637 1,754White Pine town (pt.) 1,997 2,075 2,267 2,459 2,637 2,822Unincorporated 30,853 33,399 36,816 40,217 43,512 46,888Total 44,294 47,374 52,111 56,796 61,318 65,928
Mountain City town 2,383 2,478 2,569 2,645 2,699 2,742Unincorporated 15,116 15,621 16,180 16,633 16,957 17,216Total 17,499 18,099 18,749 19,278 19,655 19,959
Farragut town (pt.) 17,718 18,900 20,353 21,778 23,128 24,459Knoxville city 173,890 176,959 188,825 200,151 210,613 220,685Unincorporated 190,424 202,877 218,414 233,685 248,101 262,294Total 382,032 398,735 427,593 455,614 481,842 507,438
Ridgely town 1,667 1,738 1,781 1,826 1,868 1,911Tiptonville town2 4,296 4,359 4,441 4,530 4,609 4,689Unincorporated 1,991 1,988 2,019 2,053 2,080 2,109Total 7,954 8,085 8,240 8,409 8,558 8,709
Gates town 901 879 894 896 890 877Halls town 2,311 2,302 2,347 2,369 2,357 2,331Henning town 970 1,398 1,536 1,667 1,788 1,905Ripley city 7,844 7,592 7,700 7,723 7,649 7,517Unincorporated 15,075 15,730 16,180 16,443 16,488 16,404Total 27,101 27,900 28,657 29,098 29,172 29,033
Ethridge town 536 564 591 613 637 654Iron City city (pt.) 365 380 398 413 426 437Lawrenceburg city 10,796 11,113 11,603 12,012 12,348 12,627Loretto city 1,665 1,737 1,816 1,885 1,945 1,995St. Joseph city 829 873 914 949 979 1,005Unincorporated 25,735 27,096 28,430 29,557 30,525 31,349Total 39,926 41,763 43,752 45,430 46,861 48,066
Jackson
Houston
Humphreys
Jefferson
Johnson
Knox
Lake
Lauderdale
Lawrence
Tennessee Advisory Commission on Intergovernmental RelationsCenter for Business and Economic Research Page 18

Population Projections for Tennessee, 2005 to 2025
CensusCounty Municipality 2000 2005 2010 2015 2020 2025
Projections
Hohenwald city 3,754 4,001 4,394 4,727 4,978 5,175Unincorporated 7,613 7,946 8,692 9,313 9,763 10,108Total 11,367 11,947 13,086 14,040 14,740 15,283
Ardmore city (pt.) 87 91 94 97 99 101Fayetteville city 6,994 7,072 7,333 7,533 7,666 7,752Petersburg town (pt.) 412 420 438 451 461 468Unincorporated 23,847 24,753 25,790 26,634 27,250 27,683Total 31,340 32,336 33,655 34,715 35,476 36,004
Farragut town (pt.) 2 4 5 5 6 6Greenback city 954 1,036 1,151 1,270 1,386 1,511Lenoir City city 6,819 7,570 8,454 9,365 10,272 11,244Loudon town 4,476 4,849 5,388 5,941 6,484 7,066Philadelphia city 533 585 653 723 787 861Unincorporated 26,302 29,289 32,712 36,270 39,795 43,602Total 39,086 43,334 48,362 53,574 58,729 64,291
Lafayette city 3,885 4,143 4,450 4,755 5,041 5,321Red Boiling Springs city 1,023 1,080 1,157 1,235 1,307 1,376Unincorporated 15,478 16,604 17,865 19,103 20,280 21,442Total 20,386 21,827 23,473 25,092 26,628 28,140
Humboldt city (pt.) 25 29 31 34 36 38Jackson city 59,643 62,814 68,055 73,148 77,933 82,442Medon city 191 203 210 225 240 254Three Way city 1,375 1,393 1,499 1,599 1,692 1,777Unincorporated 30,603 32,287 35,002 37,632 40,107 42,440Total 91,837 96,726 104,797 112,639 120,008 126,951
Chattanooga city (pt.) 0 0 0 0 0 0Jasper town 3,214 3,182 3,388 3,554 3,703 3,871Kimball town 1,312 1,375 1,480 1,571 1,658 1,752Monteagle town (pt.) 428 418 443 464 484 502New Hope city 1,043 1,036 1,105 1,161 1,212 1,268Orme town 124 122 131 135 142 150Powells Crossroads town 1,286 1,264 1,346 1,409 1,469 1,531South Pittsburg city 3,295 3,227 3,430 3,593 3,736 3,896Whitwell city 1,660 1,676 1,795 1,890 1,977 2,076Unincorporated 15,414 16,159 17,402 18,474 19,464 20,569Total 27,776 28,459 30,519 32,253 33,845 35,616
Chapel Hill town 943 964 1,027 1,086 1,139 1,191Cornersville town 962 976 1,040 1,096 1,150 1,199Lewisburg city 10,413 11,260 12,130 12,969 13,763 14,512Petersburg town (pt.) 168 175 188 200 212 219Unincorporated 14,281 15,240 16,372 17,457 18,473 19,423Total 26,767 28,615 30,756 32,808 34,737 36,544
Columbia city 33,055 34,006 36,391 38,599 40,574 42,419Mount Pleasant city 4,491 4,629 4,958 5,264 5,538 5,794Spring Hill city (pt.) 2,462 3,932 4,598 5,324 6,108 6,976Unincorporated 29,490 31,617 34,015 36,266 38,267 40,113Total 69,498 74,185 79,962 85,453 90,486 95,303
Macon
Lewis
Lincoln
Loudon
Madison
Marshall
Maury
Marion
Tennessee Advisory Commission on Intergovernmental RelationsCenter for Business and Economic Research Page 19

Population Projections for Tennessee, 2005 to 2025
CensusCounty Municipality 2000 2005 2010 2015 2020 2025
Projections
Athens city 13,220 13,700 14,337 14,884 15,335 15,718Calhoun town 496 510 534 554 566 580Englewood town 1,590 1,651 1,734 1,802 1,858 1,905Etowah city 3,663 3,680 3,826 3,947 4,041 4,116Niota city 781 795 827 859 880 897Sweetwater city (pt.) 0 0 0 0 0 0Unincorporated 29,265 30,632 32,099 33,388 34,476 35,412Total 49,015 50,968 53,356 55,434 57,155 58,629
Adamsville town (pt.) 1,950 2,056 2,179 2,293 2,391 2,481Bethel Springs town 763 794 842 884 918 952Eastview town 618 641 677 711 738 766Enville town (pt.) 0 0 0 0 0 0Finger city 350 367 387 406 423 439Guys town 483 504 535 562 585 607Michie town 647 680 721 758 789 819Milledgeville town (pt.) 130 137 145 150 156 162Ramer city 354 367 387 406 420 436Selmer town 4,541 4,729 5,006 5,254 5,464 5,662Stantonville town 312 328 348 366 384 398Unincorporated 14,505 15,253 16,187 17,014 17,736 18,405Total 24,653 25,856 27,413 28,803 30,005 31,126
Decatur town 1,395 1,609 1,856 2,120 2,391 2,685Unincorporated 9,691 11,192 12,912 14,749 16,649 18,689Total 11,086 12,801 14,768 16,869 19,040 21,374
Madisonville city 3,939 4,101 4,342 4,565 4,759 4,933Sweetwater city (pt.) 5,586 5,786 6,126 6,431 6,697 6,945Tellico Plains town 859 894 946 998 1,039 1,076Vonore town (pt.) 1,162 1,261 1,350 1,428 1,503 1,574Unincorporated 27,415 29,172 31,053 32,781 34,320 35,761Total 38,961 41,214 43,817 46,203 48,317 50,290
Clarksville city 103,455 113,267 126,901 141,073 155,817 171,485Unincorporated 31,313 34,679 38,939 43,384 48,026 52,971Total 134,768 147,946 165,840 184,458 203,842 224,457
Lynchburg, Moore County 5,740 5,992 6,335 6,650 6,930 7,162Unincorporated 0 0 0 0 0 0Total 5,740 5,992 6,335 6,650 6,930 7,162
Harriman city (pt.) 0 0 0 0 0 0Oakdale town 244 239 241 240 240 241Oliver Springs town (pt.) 52 52 51 51 51 51Sunbright city 577 584 594 597 600 604Wartburg city 890 879 889 890 891 892Unincorporated 17,994 18,182 18,482 18,583 18,695 18,771Total 19,757 19,936 20,257 20,361 20,476 20,560
Moore
McMinn
McNairy
Meigs
Morgan
Monroe
Montgomery
Tennessee Advisory Commission on Intergovernmental RelationsCenter for Business and Economic Research Page 20

Population Projections for Tennessee, 2005 to 2025
CensusCounty Municipality 2000 2005 2010 2015 2020 2025
Projections
Hornbeak town 435 441 457 466 474 477Kenton town (pt.) 553 574 599 615 627 638Obion town 1,134 1,155 1,194 1,226 1,246 1,258Rives town 331 337 350 359 366 370Samburg town 260 270 280 288 293 297South Fulton city 2,517 2,550 2,638 2,698 2,742 2,769Trimble town (pt.) 0 0 0 0 0 0Troy town 1,273 1,305 1,354 1,390 1,416 1,431Union City city 10,876 11,076 11,463 11,748 11,945 12,072Woodland Mills city 296 300 312 316 322 326Unincorporated 14,775 15,372 15,974 16,440 16,787 17,042Total 32,450 33,381 34,622 35,545 36,219 36,681
Livingston town 3,498 3,653 3,893 4,133 4,359 4,601Unincorporated 16,620 17,770 19,034 20,308 21,528 22,816Total 20,118 21,423 22,927 24,441 25,887 27,417
Linden town 1,015 1,045 1,102 1,155 1,200 1,242Lobelville city 915 963 1,020 1,074 1,120 1,164Unincorporated 5,701 5,978 6,327 6,659 6,939 7,205Total 7,631 7,987 8,448 8,888 9,260 9,611
Byrdstown town 903 945 1,010 1,073 1,128 1,187Unincorporated 4,042 4,258 4,555 4,846 5,102 5,372Total 4,945 5,203 5,565 5,919 6,230 6,559
Benton town 1,138 1,226 1,334 1,440 1,546 1,659Copperhill city 511 541 585 631 674 719Ducktown city 427 452 488 526 561 600Unincorporated 13,974 15,227 16,592 17,948 19,305 20,755Total 16,050 17,446 18,999 20,545 22,086 23,733
Algood town 2,942 3,147 3,395 3,643 3,891 4,166Baxter town 1,279 1,385 1,494 1,615 1,728 1,855Cookeville city 23,923 27,414 29,928 32,573 35,290 38,329Monterey town 2,717 2,885 3,104 3,323 3,548 3,799Unincorporated 31,454 32,410 34,614 36,847 39,030 41,447Total 62,315 67,240 72,535 78,000 83,488 89,595
Dayton city 6,180 6,602 7,185 7,744 8,267 8,780Graysville town 1,411 1,478 1,604 1,721 1,831 1,938Spring City town 2,025 2,088 2,257 2,417 2,561 2,702Unincorporated 18,784 20,004 21,762 23,448 25,006 26,544Total 28,400 30,172 32,809 35,329 37,665 39,964
Harriman city (pt.) 6,744 6,892 7,222 7,510 7,760 7,986Kingston city 5,264 5,498 5,784 6,044 6,270 6,484Midtown city 1,306 1,388 1,460 1,532 1,595 1,656Oak Ridge city (pt.) 2,777 2,934 3,097 3,242 3,370 3,498Oliver Springs town (pt.) 942 965 1,010 1,049 1,082 1,119Rockwood city 5,774 5,910 6,195 6,443 6,660 6,861Unincorporated 29,103 30,637 32,274 33,784 35,098 36,338Total 51,910 54,224 57,042 59,604 61,836 63,942
Polk
Obion
Overton
Perry
Pickett
Putnam
Rhea
Roane
Tennessee Advisory Commission on Intergovernmental RelationsCenter for Business and Economic Research Page 21

Population Projections for Tennessee, 2005 to 2025
CensusCounty Municipality 2000 2005 2010 2015 2020 2025
Projections
Adams city 566 594 642 688 731 773Cedar Hill city 298 315 337 365 384 411Coopertown town 3,027 3,248 3,532 3,812 4,078 4,341Cross Plains city 1,381 1,449 1,568 1,685 1,794 1,909Greenbrier town 4,940 5,873 6,520 7,181 7,848 8,529Millersville city (pt.) 978 1,116 1,231 1,341 1,455 1,570Orlinda city 594 635 687 744 792 846Ridgetop city (pt.) 1,042 1,817 2,178 2,590 3,053 3,584Springfield city 14,329 15,451 16,824 18,181 19,480 20,762White House city (pt.) 3,085 3,569 3,940 4,324 4,697 5,074Unincorporated 24,193 25,313 27,349 29,286 31,075 32,737Total 54,433 59,380 64,809 70,196 75,388 80,534
Eagleville city 464 467 509 546 607 637La Vergne city 18,687 22,824 26,464 30,279 34,266 38,453Murfreesboro city 68,816 78,410 89,593 101,163 112,796 124,885Smyrna town 25,569 30,445 35,092 39,981 44,985 50,241Unincorporated 68,487 71,093 79,669 88,157 96,270 104,368Total 182,023 203,240 231,326 260,125 288,924 318,583
Huntsville town 981 1,037 1,112 1,180 1,246 1,312Oneida town 3,615 3,832 4,106 4,369 4,612 4,855Winfield town 911 987 1,063 1,136 1,205 1,274Unincorporated 15,620 16,791 18,044 19,257 20,388 21,524Total 21,127 22,648 24,325 25,942 27,451 28,965
Dunlap city 4,173 4,483 4,811 5,107 5,377 5,630Unincorporated 7,197 7,655 8,199 8,685 9,124 9,538Total 11,370 12,138 13,011 13,792 14,501 15,168
Gatlinburg city 3,382 4,253 4,988 5,794 6,641 7,568Pigeon Forge city 5,083 5,893 6,816 7,784 8,773 9,834Pittman Center town 477 528 609 685 772 852Sevierville city 11,757 15,207 17,954 20,970 24,162 27,689Unincorporated 50,471 56,542 64,828 73,476 82,178 91,403Total 71,170 82,423 95,196 108,709 122,526 137,345
Arlington town 2,569 3,177 3,526 3,781 4,035 4,393Bartlett city 40,543 43,445 45,841 48,028 50,230 52,278Collierville town 31,872 35,783 38,103 40,364 42,584 44,700Germantown city 37,348 38,867 40,650 42,408 44,071 45,579Lakeland city 6,862 7,381 7,836 8,277 8,602 9,006Memphis city 650,100 667,554 697,899 726,144 752,493 776,158Millington city 10,433 10,651 11,166 11,547 12,000 12,411Unincorporated 117,745 127,438 134,486 141,325 147,929 153,760Total 897,472 934,295 979,507 1,021,875 1,061,943 1,098,285
Carthage town 2,251 2,315 2,447 2,568 2,675 2,772Gordonsville town 1,066 1,130 1,204 1,270 1,331 1,387South Carthage town 1,302 1,342 1,421 1,491 1,553 1,612Unincorporated 13,093 13,956 14,856 15,703 16,473 17,192Total 17,712 18,744 19,927 21,033 22,032 22,963
Sevier
Robertson
Rutherford
Scott
Sequatchie
Shelby
Smith
Tennessee Advisory Commission on Intergovernmental RelationsCenter for Business and Economic Research Page 22

Population Projections for Tennessee, 2005 to 2025
CensusCounty Municipality 2000 2005 2010 2015 2020 2025
Projections
Cumberland City town 316 329 349 369 387 403Dover city 1,442 1,503 1,599 1,687 1,769 1,845Tennessee Ridge town (pt.) 7 7 7 7 8 8Unincorporated 10,605 11,313 12,081 12,810 13,495 14,144Total 12,370 13,151 14,036 14,873 15,659 16,401
Bluff City city 1,559 1,571 1,601 1,621 1,630 1,629Bristol city 24,821 25,302 25,814 26,156 26,323 26,318Johnson City city (pt.) 240 264 270 289 291 290Kingsport city (pt.) 41,998 41,958 42,637 43,005 43,107 42,928Unincorporated 84,430 86,419 88,239 89,396 90,040 90,098Total 153,048 155,515 158,561 160,466 161,390 161,263
Gallatin city 23,230 26,348 29,470 32,539 35,617 38,738Goodlettsville city (pt.) 4,625 5,061 5,606 6,146 6,682 7,215Hendersonville city 40,620 44,909 49,974 54,883 59,787 64,662Millersville city (pt.) 4,330 5,191 5,881 6,572 7,263 7,991Mitchellville city 207 218 242 266 271 294Portland city 8,458 10,194 11,536 12,895 14,293 15,730Walnut Grove town 677 725 808 870 949 1,028Westmoreland town 2,093 2,233 2,472 2,700 2,905 3,125White House city (pt.) 4,135 4,901 5,542 6,163 6,798 7,467Unincorporated 42,074 45,228 50,038 54,581 59,110 63,487Total 130,449 145,007 161,570 177,616 193,675 209,736
Atoka town 3,235 4,537 5,143 5,795 6,456 7,129Brighton town 1,719 1,991 2,171 2,350 2,523 2,682Burlison town 453 457 484 516 537 554Covington city 8,463 8,672 9,240 9,775 10,231 10,604Garland town 309 310 327 348 360 376Gilt Edge city 489 501 531 560 590 609Mason town 1,089 1,159 1,243 1,324 1,396 1,457Munford town 4,708 5,256 5,691 6,125 6,522 6,876Unincorporated 30,806 31,523 33,541 35,386 36,928 38,127Total 51,271 54,406 58,372 62,179 65,544 68,414
Hartsville town 7,259 7,586 8,055 8,495 8,881 9,226Unincorporated 0 0 0 0 0 0Total 7,259 7,586 8,055 8,495 8,881 9,226
Erwin town 5,610 5,675 5,885 6,064 6,203 6,339Unicoi town 3,519 3,649 3,804 3,938 4,051 4,159Unincorporated 8,538 8,841 9,209 9,534 9,801 10,062Total 17,667 18,165 18,897 19,536 20,056 20,560
Luttrell town 915 977 1,052 1,123 1,191 1,255Maynardville city 1,782 1,903 2,049 2,188 2,315 2,443Plainview city 1,866 2,091 2,273 2,452 2,620 2,789Unincorporated 13,245 14,192 15,286 16,343 17,310 18,261Total 17,808 19,162 20,660 22,106 23,436 24,748
Spencer town 1,713 1,737 1,787 1,819 1,834 1,833Unincorporated 3,795 3,873 3,992 4,067 4,108 4,109Total 5,508 5,610 5,779 5,886 5,942 5,942
Sumner
Stewart
Sullivan
Van Buren
Tipton
Trousdale
Unicoi
Union
Tennessee Advisory Commission on Intergovernmental RelationsCenter for Business and Economic Research Page 23

Population Projections for Tennessee, 2005 to 2025
CensusCounty Municipality 2000 2005 2010 2015 2020 2025
Projections
Centertown town 257 274 295 316 335 349McMinnville city 12,749 13,582 14,653 15,681 16,634 17,575Morrison town 684 723 780 835 886 931Viola town 129 135 145 156 165 175Unincorporated 24,457 26,123 28,196 30,188 32,036 33,875Total 38,276 40,837 44,069 47,176 50,056 52,905
Johnson City city (pt.) 54,091 57,329 61,224 64,887 68,340 71,848Jonesborough town 4,168 4,488 4,809 5,115 5,405 5,703Watauga city (pt.) 72 79 84 102 107 112Unincorporated 48,867 50,868 54,118 57,126 59,938 62,803Total 107,198 112,764 120,236 127,230 133,790 140,466
Clifton city 2,699 2,640 2,680 2,697 2,694 2,672Collinwood city 1,024 995 1,008 1,015 1,012 1,002Iron City city (pt.) 3 3 4 4 4 4Waynesboro city 2,228 2,153 2,177 2,187 2,178 2,156Unincorporated 10,888 11,431 11,761 12,006 12,158 12,222Total 16,842 17,223 17,630 17,909 18,046 18,056
Dresden town 2,855 2,932 3,064 3,194 3,319 3,450Gleason town 1,463 1,541 1,620 1,695 1,770 1,851Greenfield city 2,208 2,273 2,376 2,482 2,578 2,681McKenzie city (pt.) 242 259 271 284 300 313Martin city 10,515 10,831 11,331 11,825 12,284 12,785Sharon town 988 1,009 1,054 1,099 1,141 1,182Unincorporated 16,624 17,576 18,486 19,396 20,251 21,194Total 34,895 36,420 38,202 39,975 41,642 43,457
Doyle town 525 550 582 612 637 661Sparta city 4,599 4,827 5,110 5,366 5,586 5,794Unincorporated 17,978 18,942 20,065 21,082 21,962 22,794Total 23,102 24,318 25,757 27,060 28,185 29,249
Brentwood city 23,445 31,026 36,978 43,379 50,224 57,351Fairview city 5,800 7,001 8,190 9,431 10,719 12,015Franklin city 41,842 49,352 57,471 65,878 74,533 83,174Nolensville town 3,099 2,543 2,753 2,937 3,098 3,206Spring Hill city (pt.) 5,253 7,749 9,428 11,309 13,387 15,600Thompson's Station town 1,283 1,496 1,743 1,978 2,239 2,499Unincorporated 45,916 50,429 57,698 64,899 71,933 78,580Total 126,638 149,596 174,261 199,813 226,133 252,426
Lebanon city 20,235 22,067 24,542 27,012 29,455 31,868Mount Juliet city 12,366 17,181 20,046 23,165 26,514 30,096Watertown city 1,358 1,454 1,613 1,771 1,925 2,063Unincorporated 54,850 58,209 64,247 70,168 75,811 81,223Total 88,809 98,910 110,448 122,115 133,704 145,249
White
Williamson
1. In October 2002, a new prison facility was opened in Whiteville, Hardeman county. The 2003 population of the prison is 1,500; this addition is reflected in the projections beginning in 2005.2. In 2001, Tiptonville, Lake county, was rezoned to include the prison population. This addition is reflected in the projections beginning in 2005.
Wilson
Warren
Washington
Wayne
Weakley
Tennessee Advisory Commission on Intergovernmental RelationsCenter for Business and Economic Research Page 24

Aggregate Projections for Cities Alphabetically

Population Projections for Tennessee, 2005 to 2025
CensusPlace County 2000 2005 2010 2015 2020 2025
Adams city Robertson 566 594 642 688 731 773Adamsville town Hardin 33 37 39 40 41 42Adamsville town McNairy 1,950 2,056 2,179 2,293 2,391 2,481Alamo town Crockett 2,392 2,519 2,680 2,842 3,004 3,165Alcoa city Blount 7,734 8,316 9,056 9,808 10,540 11,252
Alexandria town DeKalb 814 858 918 976 1,030 1,080Algood town Putnam 2,942 3,147 3,395 3,643 3,891 4,166Allardt city Fentress 642 673 718 758 795 830Altamont town Grundy 1,136 1,181 1,228 1,264 1,289 1,305Ardmore city (pt.) Giles 995 1,033 1,086 1,136 1,173 1,203
Ardmore city (pt.) Lincoln 87 91 94 97 99 101Arlington town Shelby 2,569 3,177 3,526 3,781 4,035 4,393Ashland City town Cheatham 3,641 4,434 5,045 5,685 6,336 7,010Athens city McMinn 13,220 13,700 14,337 14,884 15,335 15,718Atoka town Tipton 3,235 4,537 5,143 5,795 6,456 7,129
Atwood town Carroll 1,000 1,038 1,104 1,163 1,212 1,256Auburntown town Cannon 252 258 267 273 276 279Baileyton town Greene 504 509 538 563 577 596Baneberry city Jefferson 366 417 464 511 558 607Bartlett city Shelby 40,543 43,445 45,841 48,028 50,230 52,278
Baxter town Putnam 1,279 1,385 1,494 1,615 1,728 1,855Bean Station Grainger 2,570 2,719 2,869 3,002 3,120 3,228Beersheba Springs town Grundy 553 562 580 595 604 609Bell Buckle town Bedford 391 402 415 427 442 446Belle Meade city Davidson 2,943 3,101 3,229 3,347 3,528 3,648
Bells city Crockett 2,171 2,471 2,670 2,877 3,088 3,307Benton town Polk 1,138 1,226 1,334 1,440 1,546 1,659Berry Hill city Davidson 674 716 745 772 799 826Bethel Springs town McNairy 763 794 842 884 918 952Big Sandy town Benton 518 548 587 625 659 695
Blaine city Grainger 1,585 1,676 1,767 1,850 1,921 1,989Bluff City city Sullivan 1,559 1,571 1,601 1,621 1,630 1,629Bolivar city Hardeman 5,802 5,721 5,758 5,760 5,740 5,706Braden town Fayette 271 271 289 303 313 321Bradford town Gibson 1,113 1,112 1,140 1,153 1,154 1,154
Brentwood city Williamson 23,445 31,026 36,978 43,379 50,224 57,351Brighton town Tipton 1,719 1,991 2,171 2,350 2,523 2,682Bristol city Sullivan 24,821 25,302 25,814 26,156 26,323 26,318Brownsville city Haywood 10,748 10,929 11,099 11,181 11,245 11,268Bruceton town Carroll 1,554 1,577 1,671 1,749 1,816 1,871
Bulls Gap town Hawkins 714 727 766 801 832 860Burlison town Tipton 453 457 484 516 537 554Burns town Dickson 1,366 1,494 1,645 1,790 1,937 2,084Byrdstown town Pickett 903 945 1,010 1,073 1,128 1,187Calhoun town McMinn 496 510 534 554 566 580
Projections
Tennessee Advisory Commission on Intergovernmental RelationsCenter for Business and Economic Research Page 26

Population Projections for Tennessee, 2005 to 2025
CensusPlace County 2000 2005 2010 2015 2020 2025
Projections
Camden city Benton 3,828 3,964 4,154 4,329 4,472 4,597Carthage town Smith 2,251 2,315 2,447 2,568 2,675 2,772Caryville town Campbell 2,243 2,413 2,600 2,774 2,934 3,084Cedar Hill city Robertson 298 315 337 365 384 411Celina city Clay 1,379 1,442 1,556 1,675 1,789 1,907
Centertown town Warren 257 274 295 316 335 349Centerville town Hickman 3,793 3,990 4,275 4,545 4,804 5,065Chapel Hill town Marshall 943 964 1,027 1,086 1,139 1,191Charleston city Bradley 630 673 727 779 826 873Charlotte town Dickson 1,153 1,225 1,338 1,455 1,562 1,674
Chattanooga city (pt.) Hamilton 155,554 158,014 162,501 167,919 172,338 175,755Chattanooga city (pt.) Marion 0 0 0 0 0 0Church Hill city Hawkins 5,916 6,298 6,695 7,063 7,399 7,719Clarksburg town Carroll 285 294 313 329 343 356Clarksville city Montgomery 103,455 113,267 126,901 141,073 155,817 171,485
Cleveland city Bradley 37,192 39,375 42,380 45,233 47,860 50,381Clifton city Wayne 2,699 2,640 2,680 2,697 2,694 2,672Clinton city Anderson 9,409 9,513 9,658 9,711 9,669 9,546Coalmont city Grundy 948 984 1,023 1,052 1,073 1,087Collegedale city Hamilton 6,514 7,244 7,590 7,988 8,348 8,666
Collierville town Shelby 31,872 35,783 38,103 40,364 42,584 44,700Collinwood city Wayne 1,024 995 1,008 1,015 1,012 1,002Columbia city Maury 33,055 34,006 36,391 38,599 40,574 42,419Cookeville city Putnam 23,923 27,414 29,928 32,573 35,290 38,329Coopertown town Robertson 3,027 3,248 3,532 3,812 4,078 4,341
Copperhill city Polk 511 541 585 631 674 719Cornersville town Marshall 962 976 1,040 1,096 1,150 1,199Cottage Grove town Henry 97 102 108 111 117 122Covington city Tipton 8,463 8,672 9,240 9,775 10,231 10,604Cowan city Franklin 1,770 1,783 1,908 2,031 2,137 2,234
Crab Orchard city Cumberland 838 881 946 1,010 1,077 1,144Cross Plains city Robertson 1,381 1,449 1,568 1,685 1,794 1,909Crossville city Cumberland 8,981 9,881 10,725 11,580 12,422 13,343Crump city Hardin 1,521 1,585 1,661 1,723 1,773 1,810Cumberland City town Stewart 316 329 349 369 387 403
Cumberland Gap town Claiborne 204 198 205 214 218 221Dandridge town Jefferson 2,078 2,255 2,491 2,721 2,949 3,178Dayton city Rhea 6,180 6,602 7,185 7,744 8,267 8,780Decatur town Meigs 1,395 1,609 1,856 2,120 2,391 2,685Decaturville town Decatur 859 894 954 1,005 1,048 1,092
Tennessee Advisory Commission on Intergovernmental RelationsCenter for Business and Economic Research Page 27

Population Projections for Tennessee, 2005 to 2025
CensusPlace County 2000 2005 2010 2015 2020 2025
Projections
Decherd city Franklin 2,246 2,243 2,404 2,552 2,684 2,798Dickson city Dickson 12,244 13,118 14,379 15,621 16,829 18,019Dover city Stewart 1,442 1,503 1,599 1,687 1,769 1,845Dowelltown town DeKalb 302 318 341 363 381 401Doyle town White 525 550 582 612 637 661
Dresden town Weakley 2,855 2,932 3,064 3,194 3,319 3,450Ducktown city Polk 427 452 488 526 561 600Dunlap city Sequatchie 4,173 4,483 4,811 5,107 5,377 5,630Dyer city Gibson 2,406 2,483 2,562 2,614 2,632 2,654Dyersburg city Dyer 17,452 17,932 18,685 19,314 19,800 20,136
Eagleville city Rutherford 464 467 509 546 607 637East Ridge city Hamilton 20,640 20,441 20,921 21,514 21,973 22,300Eastview town McNairy 618 641 677 711 738 766Elizabethton city Carter 13,372 13,360 13,834 14,209 14,463 14,644Elkton city Giles 510 528 553 576 595 610
Englewood town McMinn 1,590 1,651 1,734 1,802 1,858 1,905Enville town (pt.) Chester 230 147 162 179 193 206Enville town (pt.) McNairy 0 0 0 0 0 0Erin city Houston 1,490 1,546 1,665 1,782 1,882 1,992Erwin city Unicoi 5,610 5,675 5,885 6,064 6,203 6,339
Estill Springs town Franklin 2,152 2,202 2,365 2,524 2,664 2,793Ethridge town Lawrence 536 564 591 613 637 654Etowah city McMinn 3,663 3,680 3,826 3,947 4,041 4,116Fairview city Williamson 5,800 7,001 8,190 9,431 10,719 12,015Farragut town (pt.) Knox 17,718 18,900 20,353 21,778 23,128 24,459
Farragut town (pt.) Loudon 2 4 5 5 6 6Fayetteville city Lincoln 6,994 7,072 7,333 7,533 7,666 7,752Finger city McNairy 350 367 387 406 423 439Forest Hills city Davidson 4,710 5,129 5,402 5,664 5,924 6,126Franklin city Williamson 41,842 49,352 57,471 65,878 74,533 83,174
Friendship city Crockett 608 640 680 722 763 802Friendsville city Blount 890 920 953 991 1,009 1,035Gadsden town Crockett 553 589 628 668 708 748Gainesboro town Jackson 879 923 1,006 1,090 1,171 1,254Gallatin city Sumner 23,230 26,348 29,470 32,539 35,617 38,738
Gallaway city Fayette 666 680 719 754 784 807Garland town Tipton 309 310 327 348 360 376Gates town Lauderdale 901 879 894 896 890 877Gatlinburg city Sevier 3,382 4,253 4,988 5,794 6,641 7,568Germantown city Shelby 37,348 38,867 40,650 42,408 44,071 45,579
Tennessee Advisory Commission on Intergovernmental RelationsCenter for Business and Economic Research Page 28

Population Projections for Tennessee, 2005 to 2025
CensusPlace County 2000 2005 2010 2015 2020 2025
Projections
Gibson town Gibson 305 323 333 343 345 352Gilt Edge city Tipton 489 501 531 560 590 609Gleason town Weakley 1,463 1,541 1,620 1,695 1,770 1,851Goodlettsville city (pt.) Davidson 9,155 9,781 10,245 10,685 11,049 11,495Goodlettsville city (pt.) Sumner 4,625 5,061 5,606 6,146 6,682 7,215
Gordonsville town Smith 1,066 1,130 1,204 1,270 1,331 1,387Grand Junction city (pt.) Fayette 0 0 0 0 0 0Grand Junction city (pt.) Hardeman 301 299 300 299 300 297Graysville town Rhea 1,411 1,478 1,604 1,721 1,831 1,938Greenback city Loudon 954 1,036 1,151 1,270 1,386 1,511
Greenbrier town Robertson 4,940 5,873 6,520 7,181 7,848 8,529Greeneville town Greene 15,198 15,476 16,272 16,967 17,550 18,070Greenfield city Weakley 2,208 2,273 2,376 2,482 2,578 2,681Gruetli-Laager city Grundy 1,867 1,933 2,010 2,067 2,106 2,131Guys town McNairy 483 504 535 562 585 607
Halls town Lauderdale 2,311 2,302 2,347 2,369 2,357 2,331Harriman city (pt.) Morgan 0 0 0 0 0 0Harriman city (pt.) Roane 6,744 6,892 7,222 7,510 7,760 7,986Hartsville town Claiborne 4,126 4,125 4,307 4,460 4,592 4,703Hartsville town Trousdale 7,259 7,586 8,055 8,495 8,881 9,226
Henderson city Chester 5,670 6,331 7,157 8,001 8,835 9,668Hendersonville city Sumner 40,620 44,909 49,974 54,883 59,787 64,662Henning town Lauderdale 970 1,398 1,536 1,667 1,788 1,905Henry town Henry 520 557 598 634 670 705Hickory Valley town Hardeman 136 133 133 135 134 132
Hickory Withe town Fayette 2,574 2,659 2,823 2,970 3,091 3,194Hohenwald city Lewis 3,754 4,001 4,394 4,727 4,978 5,175Hollow Rock town Carroll 963 1,005 1,068 1,125 1,173 1,215Hornbeak town Obion 435 441 457 466 474 477Hornsby town Hardeman 306 302 306 305 306 303
Humboldt city (pt.) Gibson 9,442 9,519 9,783 9,927 9,958 9,984Humboldt city (pt.) Madison 25 29 31 34 36 38Huntingdon town Carroll 4,349 4,429 4,691 4,918 5,109 5,271Huntland town Franklin 916 912 974 1,032 1,088 1,133Huntsville town Scott 981 1,037 1,112 1,180 1,246 1,312
Iron City city (pt.) Lawrence 365 380 398 413 426 437Iron City city (pt.) Wayne 3 3 4 4 4 4Jacksboro town Campbell 1,887 1,981 2,080 2,170 2,241 2,294Jackson city Madison 59,643 62,814 68,055 73,148 77,933 82,442Jamestown city Fentress 1,839 1,923 2,046 2,160 2,262 2,363
Jasper town Marion 3,214 3,182 3,388 3,554 3,703 3,871Jefferson City city Jefferson 7,760 7,935 8,650 9,349 10,001 10,654Jellico city Campbell 2,448 2,533 2,625 2,695 2,743 2,774Johnson City city (pt.) Carter 1,138 1,200 1,255 1,301 1,337 1,366Johnson City city (pt.) Sullivan 240 264 270 289 291 290
Tennessee Advisory Commission on Intergovernmental RelationsCenter for Business and Economic Research Page 29

Population Projections for Tennessee, 2005 to 2025
CensusPlace County 2000 2005 2010 2015 2020 2025
Projections
Johnson City city (pt.) Washington 54,091 57,329 61,224 64,887 68,340 71,848Jonesborough town Washington 4,168 4,488 4,809 5,115 5,405 5,703Kenton town (pt.) Gibson 753 764 787 799 804 802Kenton town (pt.) Obion 553 574 599 615 627 638Kimball town Marion 1,312 1,375 1,480 1,571 1,658 1,752
Kingsport city (pt.) Hawkins 2,907 3,021 3,197 3,357 3,493 3,627Kingsport city (pt.) Sullivan 41,998 41,958 42,637 43,005 43,107 42,928Kingston city Roane 5,264 5,498 5,784 6,044 6,270 6,484Kingston Springs town Cheatham 2,773 3,078 3,442 3,806 4,167 4,523Knoxville city Knox 173,890 176,959 188,825 200,151 210,613 220,685
La Follette city Campbell 7,926 8,207 8,510 8,750 8,909 9,013La Grange town Fayette 136 134 140 148 151 153La Vergne city Rutherford 18,687 22,824 26,464 30,279 34,266 38,453Lafayette city Macon 3,885 4,143 4,450 4,755 5,041 5,321Lake City town (pt.) Anderson 1,858 1,863 1,879 1,876 1,853 1,815
Lake City town (pt.) Campbell 30 33 34 35 40 40Lakeland city Shelby 6,862 7,381 7,836 8,277 8,602 9,006Lakesite city Hamilton 1,845 1,890 1,946 1,980 2,035 2,078Lakewood city Davidson 2,341 2,505 2,608 2,703 2,795 2,891Lawrenceburg city Lawrence 10,796 11,113 11,603 12,012 12,348 12,627
Lebanon city Wilson 20,235 22,067 24,542 27,012 29,455 31,868Lenoir City city Loudon 6,819 7,570 8,454 9,365 10,272 11,244Lewisburg city Marshall 10,413 11,260 12,130 12,969 13,763 14,512Lexington city Henderson 7,393 7,891 8,445 8,968 9,458 9,921Liberty town DeKalb 367 388 417 443 468 492
Linden town Perry 1,015 1,045 1,102 1,155 1,200 1,242Livingston town Overton 3,498 3,653 3,893 4,133 4,359 4,601Lobelville city Perry 915 963 1,020 1,074 1,120 1,164Lookout Mountain town Hamilton 2,000 1,984 2,011 2,081 2,104 2,149Loretto city Lawrence 1,665 1,737 1,816 1,885 1,945 1,995
Loudon town Loudon 4,476 4,849 5,388 5,941 6,484 7,066Louisville city Blount 2,001 2,188 2,424 2,664 2,904 3,147Luttrell town Union 915 977 1,052 1,123 1,191 1,255Lynchburg, Moore County Moore 5,740 5,992 6,335 6,650 6,930 7,162Lynnville town Giles 345 351 370 385 398 405
Madisonville town Monroe 3,939 4,101 4,342 4,565 4,759 4,933Manchester city Coffee 8,294 9,065 9,776 10,444 11,073 11,672Martin city Weakley 10,515 10,831 11,331 11,825 12,284 12,785Maryville city Blount 23,120 24,655 26,639 28,588 30,462 32,277Mason town Tipton 1,089 1,159 1,243 1,324 1,396 1,457
Maury City town Crockett 704 754 804 856 909 960Maynardville city Union 1,782 1,903 2,049 2,188 2,315 2,443McEwen city Humphreys 1,702 1,759 1,861 1,949 2,022 2,086McKenzie city (pt.) Carroll 4,963 5,247 5,599 5,916 6,189 6,434McKenzie city (pt.) Henry 90 95 101 107 113 118
Tennessee Advisory Commission on Intergovernmental RelationsCenter for Business and Economic Research Page 30

Population Projections for Tennessee, 2005 to 2025
CensusPlace County 2000 2005 2010 2015 2020 2025
Projections
McKenzie city (pt.) Weakley 242 259 271 284 300 313McLemoresville town Carroll 259 263 280 292 304 311McMinnville city Warren 12,749 13,582 14,653 15,681 16,634 17,575Medina city Gibson 969 974 1,004 1,015 1,020 1,019Medon city Madison 191 203 210 225 240 254
Memphis city Shelby 650,100 667,554 697,899 726,144 752,493 776,158Michie town McNairy 647 680 721 758 789 819Middleton city Hardeman 602 634 646 654 660 664Midtown city Roane 1,306 1,388 1,460 1,532 1,595 1,656Milan city Gibson 7,664 7,947 8,215 8,379 8,459 8,525
Milledgeville town (pt.) Chester 83 84 92 101 110 119Milledgeville town (pt.) Hardin 74 80 83 86 89 91Milledgeville town (pt.) McNairy 130 137 145 150 156 162Millersville city (pt.) Robertson 978 1,116 1,231 1,341 1,455 1,570Millersville city (pt.) Sumner 4,330 5,191 5,881 6,572 7,263 7,991
Millington city Shelby 10,433 10,651 11,166 11,547 12,000 12,411Minor Hill city Giles 437 446 469 486 502 511Mitchellville city Sumner 207 218 242 266 271 294Monteagle town (pt.) Franklin 6 37 57 89 139 209Monteagle town (pt.) Grundy 804 813 840 860 872 879
Monteagle town (pt.) Marion 428 418 443 464 484 502Monterey town Putnam 2,717 2,885 3,104 3,323 3,548 3,799Morrison town Warren 684 723 780 835 886 931Morristown city Hamblen 24,959 26,455 28,210 29,848 31,371 32,906Morristown city Jefferson 6 9 16 17 25 26
Moscow city Fayette 422 439 468 496 514 534Mosheim town Greene 1,749 1,809 1,910 1,999 2,076 2,146Mount Carmel town Hawkins 4,795 5,264 5,627 5,976 6,301 6,609Mount Juliet city Wilson 12,366 17,181 20,046 23,165 26,514 30,096Mount Pleasant city Maury 4,491 4,629 4,958 5,264 5,538 5,794
Mountain City town Johnson 2,383 2,478 2,569 2,645 2,699 2,742Munford town Tipton 4,708 5,256 5,691 6,125 6,522 6,876Murfreesboro city Rutherford 68,816 78,410 89,593 101,163 112,796 124,885Nashville-Davidson Davidson 545,524 570,277 593,607 615,225 635,961 657,640New Hope city Marion 1,043 1,036 1,105 1,161 1,212 1,268
New Johnsonville city Humphreys 1,905 2,042 2,176 2,297 2,400 2,494New Market town Jefferson 1,234 1,284 1,407 1,522 1,637 1,754New Tazewell town Claiborne 2,871 2,910 3,045 3,164 3,266 3,354Newbern town Dyer 2,988 3,103 3,241 3,358 3,447 3,515Newport city Cocke 7,242 7,551 8,084 8,607 9,105 9,614
Niota city McMinn 781 795 827 859 880 897Nolensville town Williamson 3,099 2,543 2,753 2,937 3,098 3,206Normandy town Bedford 141 149 160 172 179 189Norris city Anderson 1,446 1,439 1,436 1,424 1,398 1,359Oak Hill city Davidson 4,493 4,831 5,030 5,214 5,458 5,644
Tennessee Advisory Commission on Intergovernmental RelationsCenter for Business and Economic Research Page 31

Population Projections for Tennessee, 2005 to 2025
CensusPlace County 2000 2005 2010 2015 2020 2025
Projections
Oak Ridge city (pt.) Anderson 24,610 24,813 25,127 25,196 25,014 24,622Oak Ridge city (pt.) Roane 2,777 2,934 3,097 3,242 3,370 3,498Oakdale town Morgan 244 239 241 240 240 241Oakland town Fayette 1,279 1,308 1,389 1,459 1,515 1,562Obion town Obion 1,134 1,155 1,194 1,226 1,246 1,258
Oliver Springs town (pt.) Anderson 2,309 2,345 2,398 2,420 2,425 2,402Oliver Springs town (pt.) Morgan 52 52 51 51 51 51Oliver Springs town (pt.) Roane 942 965 1,010 1,049 1,082 1,119Oneida town Scott 3,615 3,832 4,106 4,369 4,612 4,855Orlinda town Robertson 594 635 687 744 792 846
Orme town Marion 124 122 131 135 142 150Palmer town Grundy 726 745 772 793 807 816Paris city Henry 9,763 10,135 10,782 11,401 11,945 12,466Parkers Crossroads city Henderson 241 272 294 316 337 354Parrottsville town Cocke 207 223 240 257 273 290
Parsons city Decatur 2,452 2,577 2,750 2,907 3,038 3,167Pegram town Cheatham 2,146 2,343 2,608 2,872 3,138 3,392Petersburg town (pt.) Lincoln 412 420 438 451 461 468Petersburg town (pt.) Marshall 168 175 188 200 212 219Philadelphia city Loudon 533 585 653 723 787 861
Pigeon Forge city Sevier 5,083 5,893 6,816 7,784 8,773 9,834Pikeville city Bledsoe 1,781 1,844 2,056 2,251 2,422 2,573Piperton city Fayette 589 628 673 712 748 777Pittman Center town Sevier 477 528 609 685 772 852Plainview city Union 1,866 2,091 2,273 2,452 2,620 2,789
Pleasant Hill town Cumberland 544 586 632 685 731 780Pleasant View city Cheatham 2,934 3,342 3,752 4,169 4,587 5,003Portland city Sumner 8,458 10,194 11,536 12,895 14,293 15,730Powells Crossroads town Marion 1,286 1,264 1,346 1,409 1,469 1,531Pulaski city Giles 7,871 8,321 8,785 9,195 9,533 9,814
Puryear city Henry 667 704 752 797 837 876Ramer city McNairy 354 367 387 406 420 436Red Bank city Hamilton 12,418 12,283 12,552 12,922 13,177 13,387Red Boiling Springs city Macon 1,023 1,080 1,157 1,235 1,307 1,376Ridgely town Lake 1,667 1,738 1,781 1,826 1,868 1,911
Ridgeside city Hamilton 389 378 389 403 414 423Ridgetop city (pt.) Davidson 41 60 62 64 67 69Ridgetop city (pt.) Robertson 1,042 1,817 2,178 2,590 3,053 3,584Ripley city Lauderdale 7,844 7,592 7,700 7,723 7,649 7,517Rives town Obion 331 337 350 359 366 370
Rockford city Blount 798 830 868 901 941 963Rockwood city Roane 5,774 5,910 6,195 6,443 6,660 6,861Rogersville town Hawkins 4,240 4,373 4,620 4,844 5,044 5,222Rossville town Fayette 380 387 410 430 450 463Rutherford town Gibson 1,272 1,273 1,306 1,327 1,329 1,329
Tennessee Advisory Commission on Intergovernmental RelationsCenter for Business and Economic Research Page 32

Population Projections for Tennessee, 2005 to 2025
CensusPlace County 2000 2005 2010 2015 2020 2025
Projections
Rutledge town Grainger 1,187 1,234 1,297 1,353 1,401 1,445Saltillo town Hardin 342 358 375 389 400 408Samburg town Obion 260 270 280 288 293 297Sardis town Henderson 445 472 503 535 562 587Saulsbury town Hardeman 99 100 99 101 99 100
Savannah city Hardin 6,917 7,196 7,534 7,816 8,037 8,209Scotts Hill town (pt.) Decatur 349 369 394 417 436 456Scotts Hill town (pt.) Henderson 545 579 618 657 690 726Selmer town McNairy 4,541 4,729 5,006 5,254 5,464 5,662Sevierville city Sevier 11,757 15,207 17,954 20,970 24,162 27,689
Sharon town Weakley 988 1,009 1,054 1,099 1,141 1,182Shelbyville city Bedford 16,105 17,609 19,351 21,227 23,228 25,080Signal Mountain town Hamilton 7,429 7,433 7,622 7,854 8,037 8,173Silerton town (pt.) Chester 0 0 0 0 0 0Silerton town (pt.) Hardeman 60 57 59 60 57 58
Slayden town Dickson 185 199 219 239 258 278Smithville city DeKalb 3,994 4,209 4,510 4,796 5,054 5,307Smyrna town Rutherford 25,569 30,445 35,092 39,981 44,985 50,241Sneedville town Hancock 1,257 1,349 1,374 1,429 1,474 1,503Soddy-Daisy city Hamilton 11,530 12,189 12,617 13,123 13,591 13,950
Somerville town Fayette 2,519 2,582 2,739 2,877 2,990 3,086South Carthage town Smith 1,302 1,342 1,421 1,491 1,553 1,612South Fulton city Obion 2,517 2,550 2,638 2,698 2,742 2,769South Pittsburg city Marion 3,295 3,227 3,430 3,593 3,736 3,896Sparta city White 4,599 4,827 5,110 5,366 5,586 5,794
Spencer town Van Buren 1,713 1,737 1,787 1,819 1,834 1,833Spring City town Rhea 2,025 2,088 2,257 2,417 2,561 2,702Spring Hill city (pt.) Maury 2,462 3,932 4,598 5,324 6,108 6,976Spring Hill city (pt.) Williamson 5,253 7,749 9,428 11,309 13,387 15,600Springfield city Robertson 14,329 15,451 16,824 18,181 19,480 20,762
St. Joseph city Lawrence 829 873 914 949 979 1,005Stanton town Haywood 615 613 620 622 623 622Stantonville town McNairy 312 328 348 366 384 398Sunbright city Morgan 577 584 594 597 600 604Surgoinsville town Hawkins 1,484 1,760 1,912 2,066 2,209 2,358
Sweetwater city (pt.) McMinn 0 0 0 0 0 0Sweetwater city (pt.) Monroe 5,586 5,786 6,126 6,431 6,697 6,945Tazewell town Claiborne 2,165 2,164 2,259 2,343 2,412 2,469Tellico Plains town Monroe 859 894 946 998 1,039 1,076Tennessee Ridge town Houston 1,327 1,398 1,510 1,621 1,718 1,823
Tennessee Ridge town Stewart 7 7 7 7 8 8Thompson's Station town Williamson 1,283 1,496 1,743 1,978 2,239 2,499Three Way city Madison 1,375 1,393 1,499 1,599 1,692 1,777Tiptonville town2 Lake 4,296 4,359 4,441 4,530 4,609 4,689Toone town Hardeman 330 329 331 330 332 329
Tennessee Advisory Commission on Intergovernmental RelationsCenter for Business and Economic Research Page 33

Population Projections for Tennessee, 2005 to 2025
CensusPlace County 2000 2005 2010 2015 2020 2025
Projections
Townsend city Blount 244 247 265 270 273 287Tracy City town Grundy 1,679 1,710 1,772 1,817 1,846 1,863Trenton city Gibson 4,683 4,706 4,836 4,904 4,914 4,925Trezevant town Carroll 901 928 987 1,039 1,080 1,119Trimble town (pt.) Dyer 728 740 768 791 812 822
Trimble town (pt.) Obion 0 0 0 0 0 0Troy town Obion 1,273 1,305 1,354 1,390 1,416 1,431Tullahoma city (pt.) Coffee 16,970 17,536 18,696 19,755 20,709 21,579Tullahoma city (pt.) Franklin 1,024 1,046 1,127 1,201 1,267 1,331Tusculum city Greene 2,004 2,044 2,144 2,237 2,315 2,386
Unicoi town Unicoi 3,519 3,649 3,804 3,938 4,051 4,159Union City city Obion 10,876 11,076 11,463 11,748 11,945 12,072Vanleer town Dickson 310 331 364 392 424 450Viola town Warren 129 135 145 156 165 175Vonore town Blount 0 0 0 0 0 0
Vonore town Monroe 1,162 1,261 1,350 1,428 1,503 1,574Walden town Hamilton 1,960 1,984 2,043 2,115 2,173 2,219Walnut Grove town Sumner 677 725 808 870 949 1,028Wartburg city Morgan 890 879 889 890 891 892Wartrace town Bedford 548 567 588 612 631 645
Watauga city Carter 331 348 368 380 395 401Watauga city Washington 72 79 84 102 107 112Watertown city Wilson 1,358 1,454 1,613 1,771 1,925 2,063Waverly city Humphreys 4,028 4,185 4,431 4,645 4,827 4,982Waynesboro city Wayne 2,228 2,153 2,177 2,187 2,178 2,156
Westmoreland town Sumner 2,093 2,233 2,472 2,700 2,905 3,125White Bluff town Dickson 2,142 2,355 2,598 2,835 3,074 3,307White House city (pt.) Robertson 3,085 3,569 3,940 4,324 4,697 5,074White House city (pt.) Sumner 4,135 4,901 5,542 6,163 6,798 7,467White Pine town Hamblen 0 0 0 0 0 0
White Pine town Jefferson 1,997 2,075 2,267 2,459 2,637 2,822Whiteville town1 Hardeman 3,148 6,998 8,286 9,755 11,436 13,373Whitwell city Marion 1,660 1,676 1,795 1,890 1,977 2,076Williston city Fayette 341 351 371 389 403 418Winchester city Franklin 7,329 7,656 8,265 8,851 9,393 9,883
Winfield town Scott 911 987 1,063 1,136 1,205 1,274Woodbury town Cannon 2,428 2,528 2,664 2,785 2,889 2,982Woodland Mills city Obion 296 300 312 316 322 326Yorkville city Gibson 293 299 308 313 314 316
1. In October 2002, a new prison facility was opened in Whiteville, Hardeman county. The 2003 population of the prison is 1,500; this addition is reflected in the projections beginning in 2005.2. In 2001, Tiptonville, Lake county, was rezoned to include the prison population. This addition is reflected in the projections beginning in 2005.
Tennessee Advisory Commission on Intergovernmental RelationsCenter for Business and Economic Research Page 34

Aggregate Projections for Counties by
Development District

Population Projections for Tennessee, 2005 to 2025
CensusCounty Municipality 2000 2005 2010 2015 2020 2025
FIRST TENNESSEE DEVELOPMENT DISTRICT
Elizabethton city 13,372 13,360 13,834 14,209 14,463 14,644Johnson City city (pt.) 1,138 1,200 1,255 1,301 1,337 1,366Watauga city (pt.) 331 348 368 380 395 401Unincorporated 41,901 43,077 44,875 46,350 47,463 48,328Total 56,742 57,985 60,332 62,239 63,657 64,739
Baileyton town 504 509 538 563 577 596Greeneville town 15,198 15,476 16,272 16,967 17,550 18,070Mosheim town 1,749 1,809 1,910 1,999 2,076 2,146Tusculum city 2,004 2,044 2,144 2,237 2,315 2,386Unincorporated 43,454 45,461 48,085 50,403 52,417 54,258Total 62,909 65,299 68,949 72,169 74,935 77,456
Sneedville town 1,257 1,349 1,374 1,429 1,474 1,503Unincorporated 5,529 5,335 5,316 5,406 5,458 5,444Total 6,786 6,684 6,690 6,835 6,932 6,947
Bulls Gap town 714 727 766 801 832 860Church Hill city 5,916 6,298 6,695 7,063 7,399 7,719Kingsport city (pt.) 2,907 3,021 3,197 3,357 3,493 3,627Mount Carmel town 4,795 5,264 5,627 5,976 6,301 6,609Rogersville town 4,240 4,373 4,620 4,844 5,044 5,222Surgoinsville town 1,484 1,760 1,912 2,066 2,209 2,358Unincorporated 33,507 35,343 37,498 39,465 41,261 42,958Total 53,563 56,786 60,314 63,571 66,538 69,354
Mountain City town 2,383 2,478 2,569 2,645 2,699 2,742Unincorporated 15,116 15,621 16,180 16,633 16,957 17,216Total 17,499 18,099 18,749 19,278 19,655 19,959
Bluff City city 1,559 1,571 1,601 1,621 1,630 1,629Bristol city 24,821 25,302 25,814 26,156 26,323 26,318Johnson City city (pt.) 240 264 270 289 291 290Kingsport city (pt.) 41,998 41,958 42,637 43,005 43,107 42,928Unincorporated 84,430 86,419 88,239 89,396 90,040 90,098Total 153,048 155,515 158,561 160,466 161,390 161,263
Erwin town 5,610 5,675 5,885 6,064 6,203 6,339Unicoi town 3,519 3,649 3,804 3,938 4,051 4,159Unincorporated 8,538 8,841 9,209 9,534 9,801 10,062Total 17,667 18,165 18,897 19,536 20,056 20,560
Johnson City city (pt.) 54,091 57,329 61,224 64,887 68,340 71,848Jonesborough town 4,168 4,488 4,809 5,115 5,405 5,703Watauga city (pt.) 72 79 84 102 107 112Unincorporated 48,867 50,868 54,118 57,126 59,938 62,803Total 107,198 112,764 120,236 127,230 133,790 140,466
Projections
Carter
Greene
Hancock
Hawkins
Johnson
Sullivan
Unicoi
Washington
Tennessee Advisory Commission on Intergovernmental RelationsCenter for Business and Economic Research Page 36

Population Projections for Tennessee, 2005 to 2025
CensusCounty Municipality 2000 2005 2010 2015 2020 2025
Projections
EAST TENNESSEE DEVELOPMENT DISTRICT
Clinton city 9,409 9,513 9,658 9,711 9,669 9,546Lake City town (pt.) 1,858 1,863 1,879 1,876 1,853 1,815Norris city 1,446 1,439 1,436 1,424 1,398 1,359Oak Ridge city (pt.) 24,610 24,813 25,127 25,196 25,014 24,622Oliver Springs town (pt.) 2,309 2,345 2,398 2,420 2,425 2,402Unincorporated 31,698 33,091 34,665 35,956 36,868 37,489Total 71,330 73,065 75,163 76,583 77,226 77,233
Alcoa city 7,734 8,316 9,056 9,808 10,540 11,252Friendsville city 890 920 953 991 1,009 1,035Louisville city 2,001 2,188 2,424 2,664 2,904 3,147Maryville city 23,120 24,655 26,639 28,588 30,462 32,277Rockford city 798 830 868 901 941 963Townsend city 244 247 265 270 273 287Vonore town (pt.) 0 0 0 0 0 0Unincorporated 71,036 75,065 80,386 85,495 90,228 94,746Total 105,823 112,222 120,592 128,718 136,357 143,707
Caryville town 2,243 2,413 2,600 2,774 2,934 3,084Jacksboro town 1,887 1,981 2,080 2,170 2,241 2,294Jellico city 2,448 2,533 2,625 2,695 2,743 2,774La Follette city 7,926 8,207 8,510 8,750 8,909 9,013Lake City town (pt.) 30 33 34 35 40 40Unincorporated 25,320 26,013 26,766 27,325 27,589 27,680Total 39,854 41,180 42,615 43,748 44,455 44,885
Cumberland Gap town 204 198 205 214 218 221Harrogate city 4,126 4,125 4,307 4,460 4,592 4,703New Tazewell town 2,871 2,910 3,045 3,164 3,266 3,354Tazewell town 2,165 2,164 2,259 2,343 2,412 2,469Unincorporated 20,496 21,523 22,687 23,733 24,671 25,513Total 29,862 30,920 32,502 33,914 35,159 36,262
Newport city 7,242 7,551 8,084 8,607 9,105 9,614Parrottsville town 207 223 240 257 273 290Unincorporated 26,116 28,165 30,355 32,537 34,652 36,834Total 33,565 35,938 38,679 41,401 44,030 46,738
Bean Station city 2,570 2,719 2,869 3,002 3,120 3,228Blaine city 1,585 1,676 1,767 1,850 1,921 1,989Rutledge town 1,187 1,234 1,297 1,353 1,401 1,445Unincorporated 15,317 16,141 17,017 17,792 18,478 19,098Total 20,659 21,771 22,950 23,998 24,920 25,760
Morristown city (pt.) 24,959 26,455 28,210 29,848 31,371 32,906White Pine town (pt.) 0 0 0 0 0 0Unincorporated 33,169 35,298 37,671 39,873 41,943 44,032Total 58,128 61,754 65,881 69,721 73,315 76,938
Blount
Anderson
Campbell
Claiborne
Cocke
Grainger
Hamblen
Tennessee Advisory Commission on Intergovernmental RelationsCenter for Business and Economic Research Page 37

Population Projections for Tennessee, 2005 to 2025
CensusCounty Municipality 2000 2005 2010 2015 2020 2025
Projections
EAST TENNESSEE DEVELOPMENT DISTRICT, continued
Baneberry city 366 417 464 511 558 607Dandridge town 2,078 2,255 2,491 2,721 2,949 3,178Jefferson City city 7,760 7,935 8,650 9,349 10,001 10,654Morristown city (pt.) 6 9 16 17 25 26New Market town 1,234 1,284 1,407 1,522 1,637 1,754White Pine town (pt.) 1,997 2,075 2,267 2,459 2,637 2,822Unincorporated 30,853 33,399 36,816 40,217 43,512 46,888Total 44,294 47,374 52,111 56,796 61,318 65,928
Farragut town (pt.) 17,718 18,900 20,353 21,778 23,128 24,459Knoxville city 173,890 176,959 188,825 200,151 210,613 220,685Unincorporated 190,424 202,877 218,414 233,685 248,101 262,294Total 382,032 398,735 427,593 455,614 481,842 507,438
Farragut town (pt.) 2 4 5 5 6 6Greenback city 954 1,036 1,151 1,270 1,386 1,511Lenoir City city 6,819 7,570 8,454 9,365 10,272 11,244Loudon town 4,476 4,849 5,388 5,941 6,484 7,066Philadelphia city 533 585 653 723 787 861Unincorporated 26,302 29,289 32,712 36,270 39,795 43,602Total 39,086 43,334 48,362 53,574 58,729 64,291
Madisonville city 3,939 4,101 4,342 4,565 4,759 4,933Sweetwater city (pt.) 5,586 5,786 6,126 6,431 6,697 6,945Tellico Plains town 859 894 946 998 1,039 1,076Vonore town (pt.) 1,162 1,261 1,350 1,428 1,503 1,574Unincorporated 27,415 29,172 31,053 32,781 34,320 35,761Total 38,961 41,214 43,817 46,203 48,317 50,290
Harriman city (pt.) 0 0 0 0 0 0Oakdale town 244 239 241 240 240 241Oliver Springs town (pt.) 52 52 51 51 51 51Sunbright city 577 584 594 597 600 604Wartburg city 890 879 889 890 891 892Unincorporated 17,994 18,182 18,482 18,583 18,695 18,771Total 19,757 19,936 20,257 20,361 20,476 20,560
Harriman city (pt.) 6,744 6,892 7,222 7,510 7,760 7,986Kingston city 5,264 5,498 5,784 6,044 6,270 6,484Midtown city 1,306 1,388 1,460 1,532 1,595 1,656Oak Ridge city (pt.) 2,777 2,934 3,097 3,242 3,370 3,498Oliver Springs town (pt.) 942 965 1,010 1,049 1,082 1,119Rockwood city 5,774 5,910 6,195 6,443 6,660 6,861Unincorporated 29,103 30,637 32,274 33,784 35,098 36,338Total 51,910 54,224 57,042 59,604 61,836 63,942
Jefferson
Knox
Loudon
Monroe
Morgan
Roane
Tennessee Advisory Commission on Intergovernmental RelationsCenter for Business and Economic Research Page 38

Population Projections for Tennessee, 2005 to 2025
CensusCounty Municipality 2000 2005 2010 2015 2020 2025
Projections
EAST TENNESSEE DEVELOPMENT DISTRICT, continued
Huntsville town 981 1,037 1,112 1,180 1,246 1,312Oneida town 3,615 3,832 4,106 4,369 4,612 4,855Winfield town 911 987 1,063 1,136 1,205 1,274Unincorporated 15,620 16,791 18,044 19,257 20,388 21,524Total 21,127 22,648 24,325 25,942 27,451 28,965
Gatlinburg city 3,382 4,253 4,988 5,794 6,641 7,568Pigeon Forge city 5,083 5,893 6,816 7,784 8,773 9,834Pittman Center town 477 528 609 685 772 852Sevierville city 11,757 15,207 17,954 20,970 24,162 27,689Unincorporated 50,471 56,542 64,828 73,476 82,178 91,403Total 71,170 82,423 95,196 108,709 122,526 137,345
Luttrell town 915 977 1,052 1,123 1,191 1,255Maynardville city 1,782 1,903 2,049 2,188 2,315 2,443Plainview city 1,866 2,091 2,273 2,452 2,620 2,789Unincorporated 13,245 14,192 15,286 16,343 17,310 18,261Total 17,808 19,162 20,660 22,106 23,436 24,748
Scott
Sevier
Union
Tennessee Advisory Commission on Intergovernmental RelationsCenter for Business and Economic Research Page 39

Population Projections for Tennessee, 2005 to 2025
CensusCounty Municipality 2000 2005 2010 2015 2020 2025
Projections
SOUTHEAST TENNESSEE DEVELOPMENT DISTRICT
Pikeville city 1,781 1,844 2,056 2,251 2,422 2,573Unincorporated 10,586 11,023 12,361 13,610 14,729 15,743Total 12,367 12,867 14,416 15,861 17,150 18,316
Charleston city 630 673 727 779 826 873Cleveland city 37,192 39,375 42,380 45,233 47,860 50,381Unincorporated 50,143 54,762 60,765 66,844 72,847 78,998Total 87,965 94,810 103,873 112,856 121,533 130,252
Altamont town 1,136 1,181 1,228 1,264 1,289 1,305Beersheba Springs town 553 562 580 595 604 609Coalmont city 948 984 1,023 1,052 1,073 1,087Gruetli-Laager city 1,867 1,933 2,010 2,067 2,106 2,131Monteagle town (pt.) 804 813 840 860 872 879Palmer town 726 745 772 793 807 816Tracy City town 1,679 1,710 1,772 1,817 1,846 1,863Unincorporated 6,619 6,851 7,129 7,327 7,470 7,563Total 14,332 14,778 15,355 15,775 16,067 16,253
Chattanooga city (pt.) 155,554 158,014 162,501 167,919 172,338 175,755Collegedale city 6,514 7,244 7,590 7,988 8,348 8,666East Ridge city 20,640 20,441 20,921 21,514 21,973 22,300Lakesite city 1,845 1,890 1,946 1,980 2,035 2,078Lookout Mountain town 2,000 1,984 2,011 2,081 2,104 2,149Red Bank city 12,418 12,283 12,552 12,922 13,177 13,387Ridgeside city 389 378 389 403 414 423Signal Mountain town 7,429 7,433 7,622 7,854 8,037 8,173Soddy-Daisy city 11,530 12,189 12,617 13,123 13,591 13,950Walden town 1,960 1,984 2,043 2,115 2,173 2,219Unincorporated 87,617 91,118 94,160 97,737 100,760 103,184Total 307,896 314,958 324,353 335,636 344,951 352,285
Chattanooga city (pt.) 0 0 0 0 0 0Jasper town 3,214 3,182 3,388 3,554 3,703 3,871Kimball town 1,312 1,375 1,480 1,571 1,658 1,752Monteagle town (pt.) 428 418 443 464 484 502New Hope city 1,043 1,036 1,105 1,161 1,212 1,268Orme town 124 122 131 135 142 150Powells Crossroads town 1,286 1,264 1,346 1,409 1,469 1,531South Pittsburg city 3,295 3,227 3,430 3,593 3,736 3,896Whitwell city 1,660 1,676 1,795 1,890 1,977 2,076Unincorporated 15,414 16,159 17,402 18,474 19,464 20,569Total 27,776 28,459 30,519 32,253 33,845 35,616
Bledsoe
Bradley
Grundy
Hamilton
Marion
Tennessee Advisory Commission on Intergovernmental RelationsCenter for Business and Economic Research Page 40

Population Projections for Tennessee, 2005 to 2025
CensusCounty Municipality 2000 2005 2010 2015 2020 2025
Projections
SOUTHEAST TENNESSEE DEVELOPMENT DISTRICT, continued
Athens city 13,220 13,700 14,337 14,884 15,335 15,718Calhoun town 496 510 534 554 566 580Englewood town 1,590 1,651 1,734 1,802 1,858 1,905Etowah city 3,663 3,680 3,826 3,947 4,041 4,116Niota city 781 795 827 859 880 897Sweetwater city (pt.) 0 0 0 0 0 0Unincorporated 29,265 30,632 32,099 33,388 34,476 35,412Total 49,015 50,968 53,356 55,434 57,155 58,629
Decatur town 1,395 1,609 1,856 2,120 2,391 2,685Unincorporated 9,691 11,192 12,912 14,749 16,649 18,689Total 11,086 12,801 14,768 16,869 19,040 21,374
Benton town 1,138 1,226 1,334 1,440 1,546 1,659Copperhill city 511 541 585 631 674 719Ducktown city 427 452 488 526 561 600Unincorporated 13,974 15,227 16,592 17,948 19,305 20,755Total 16,050 17,446 18,999 20,545 22,086 23,733
Dayton city 6,180 6,602 7,185 7,744 8,267 8,780Graysville town 1,411 1,478 1,604 1,721 1,831 1,938Spring City town 2,025 2,088 2,257 2,417 2,561 2,702Unincorporated 18,784 20,004 21,762 23,448 25,006 26,544Total 28,400 30,172 32,809 35,329 37,665 39,964
Dunlap city 4,173 4,483 4,811 5,107 5,377 5,630Unincorporated 7,197 7,655 8,199 8,685 9,124 9,538Total 11,370 12,138 13,011 13,792 14,501 15,168
McMinn
Meigs
Polk
Rhea
Sequatchie
Tennessee Advisory Commission on Intergovernmental RelationsCenter for Business and Economic Research Page 41

Population Projections for Tennessee, 2005 to 2025
CensusCounty Municipality 2000 2005 2010 2015 2020 2025
Projections
UPPER CUMBERLAND DEVELOPMENT DISTRICT
Auburntown town 252 258 267 273 276 279Woodbury town 2,428 2,528 2,664 2,785 2,889 2,982Unincorporated 10,146 10,659 11,253 11,794 12,260 12,685Total 12,826 13,445 14,183 14,852 15,426 15,946
Celina city 1,379 1,442 1,556 1,675 1,789 1,907Unincorporated 6,597 6,966 7,530 8,118 8,692 9,286Total 7,976 8,408 9,086 9,793 10,481 11,193
Crab Orchard city 838 881 946 1,010 1,077 1,144Crossville city 8,981 9,881 10,725 11,580 12,422 13,343Pleasant Hill town 544 586 632 685 731 780Unincorporated 36,439 38,733 41,755 44,770 47,692 50,852Total 46,802 50,082 54,059 58,045 61,922 66,119
Alexandria town 814 858 918 976 1,030 1,080Dowelltown town 302 318 341 363 381 401Liberty town 367 388 417 443 468 492Smithville city 3,994 4,209 4,510 4,796 5,054 5,307Unincorporated 11,946 12,712 13,649 14,540 15,352 16,150Total 17,423 18,484 19,835 21,118 22,284 23,430
Allardt city 642 673 718 758 795 830Jamestown city 1,839 1,923 2,046 2,160 2,262 2,363Unincorporated 14,144 15,061 16,074 17,027 17,911 18,768Total 16,625 17,657 18,838 19,945 20,968 21,961
Gainesboro town 879 923 1,006 1,090 1,171 1,254Unincorporated 10,105 10,992 12,054 13,135 14,214 15,338Total 10,984 11,915 13,060 14,225 15,385 16,592
Lafayette city 3,885 4,143 4,450 4,755 5,041 5,321Red Boiling Springs city 1,023 1,080 1,157 1,235 1,307 1,376Unincorporated 15,478 16,604 17,865 19,103 20,280 21,442Total 20,386 21,827 23,473 25,092 26,628 28,140
Livingston town 3,498 3,653 3,893 4,133 4,359 4,601Unincorporated 16,620 17,770 19,034 20,308 21,528 22,816Total 20,118 21,423 22,927 24,441 25,887 27,417
Byrdstown town 903 945 1,010 1,073 1,128 1,187Unincorporated 4,042 4,258 4,555 4,846 5,102 5,372Total 4,945 5,203 5,565 5,919 6,230 6,559
Algood town 2,942 3,147 3,395 3,643 3,891 4,166Baxter town 1,279 1,385 1,494 1,615 1,728 1,855Cookeville city 23,923 27,414 29,928 32,573 35,290 38,329Monterey town 2,717 2,885 3,104 3,323 3,548 3,799Unincorporated 31,454 32,410 34,614 36,847 39,030 41,447Total 62,315 67,240 72,535 78,000 83,488 89,595
Cannon
Clay
Cumberland
DeKalb
Fentress
Jackson
Macon
Overton
Pickett
Putnam
Tennessee Advisory Commission on Intergovernmental RelationsCenter for Business and Economic Research Page 42

Population Projections for Tennessee, 2005 to 2025
CensusCounty Municipality 2000 2005 2010 2015 2020 2025
Projections
UPPER CUMBERLAND DEVELOPMENT DISTRICT, continued
Carthage town 2,251 2,315 2,447 2,568 2,675 2,772Gordonsville town 1,066 1,130 1,204 1,270 1,331 1,387South Carthage town 1,302 1,342 1,421 1,491 1,553 1,612Unincorporated 13,093 13,956 14,856 15,703 16,473 17,192Total 17,712 18,744 19,927 21,033 22,032 22,963
Spencer town 1,713 1,737 1,787 1,819 1,834 1,833Unincorporated 3,795 3,873 3,992 4,067 4,108 4,109Total 5,508 5,610 5,779 5,886 5,942 5,942
Centertown town 257 274 295 316 335 349McMinnville city 12,749 13,582 14,653 15,681 16,634 17,575Morrison town 684 723 780 835 886 931Viola town 129 135 145 156 165 175Unincorporated 24,457 26,123 28,196 30,188 32,036 33,875Total 38,276 40,837 44,069 47,176 50,056 52,905
Doyle town 525 550 582 612 637 661Sparta city 4,599 4,827 5,110 5,366 5,586 5,794Unincorporated 17,978 18,942 20,065 21,082 21,962 22,794Total 23,102 24,318 25,757 27,060 28,185 29,249
Smith
Van Buren
Warren
White
Tennessee Advisory Commission on Intergovernmental RelationsCenter for Business and Economic Research Page 43

Population Projections for Tennessee, 2005 to 2025
CensusCounty Municipality 2000 2005 2010 2015 2020 2025
Projections
GREATER NASHVILLE REGIONAL COUNCIL
Ashland City town 3,641 4,434 5,045 5,685 6,336 7,010Kingston Springs town 2,773 3,078 3,442 3,806 4,167 4,523Pegram town 2,146 2,343 2,608 2,872 3,138 3,392Pleasant View city 2,934 3,342 3,752 4,169 4,587 5,003Unincorporated 24,418 26,928 30,034 33,159 36,249 39,277Total 35,912 40,126 44,880 49,691 54,477 59,205
Belle Meade city 2,943 3,101 3,229 3,347 3,528 3,648Berry Hill city 674 716 745 772 799 826Forest Hills city 4,710 5,129 5,402 5,664 5,924 6,126Goodlettsville city (pt.) 9,155 9,781 10,245 10,685 11,049 11,495Lakewood city 2,341 2,505 2,608 2,703 2,795 2,891Nashville-Davidson 545,534 570,277 593,607 615,225 635,961 657,640Oak Hill city 4,493 4,831 5,030 5,214 5,458 5,644Ridgetop city (pt.) 41 60 62 64 67 69Total 569,891 596,399 620,928 643,675 665,579 688,340
Burns town 1,366 1,494 1,645 1,790 1,937 2,084Charlotte town 1,153 1,225 1,338 1,455 1,562 1,674Dickson city 12,244 13,118 14,379 15,621 16,829 18,019Slayden town 185 199 219 239 258 278Vanleer town 310 331 364 392 424 450White Bluff town 2,142 2,355 2,598 2,835 3,074 3,307Unincorporated 25,756 28,566 31,517 34,491 37,403 40,337Total 43,156 47,288 52,059 56,823 61,487 66,148
Erin city 1,490 1,546 1,665 1,782 1,882 1,992Tennessee Ridge town (pt.) 1,327 1,398 1,510 1,621 1,718 1,823Unincorporated 5,271 5,627 6,093 6,560 6,963 7,413Total 8,088 8,571 9,268 9,963 10,563 11,228
McEwen city 1,702 1,759 1,861 1,949 2,022 2,086New Johnsonville city 1,905 2,042 2,176 2,297 2,400 2,494Waverly city 4,028 4,185 4,431 4,645 4,827 4,982Unincorporated 10,294 10,923 11,609 12,222 12,751 13,216Total 17,929 18,909 20,078 21,112 22,000 22,778
Clarksville city 103,455 113,267 126,901 141,073 155,817 171,485Unincorporated 31,313 34,679 38,939 43,384 48,026 52,971Total 134,768 147,946 165,840 184,458 203,842 224,457
Cheatham
Davidson
Dickson
Houston
Humphreys
Montgomery
Tennessee Advisory Commission on Intergovernmental RelationsCenter for Business and Economic Research Page 44
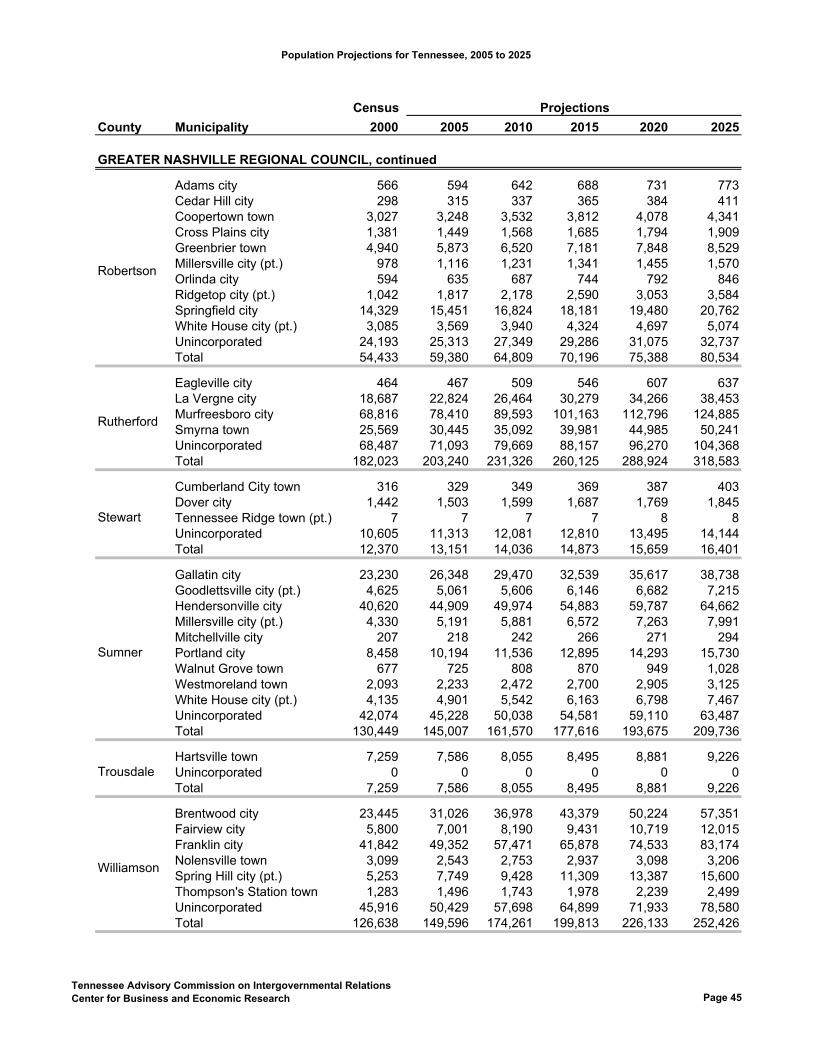
Population Projections for Tennessee, 2005 to 2025
CensusCounty Municipality 2000 2005 2010 2015 2020 2025
Projections
GREATER NASHVILLE REGIONAL COUNCIL, continued
Adams city 566 594 642 688 731 773Cedar Hill city 298 315 337 365 384 411Coopertown town 3,027 3,248 3,532 3,812 4,078 4,341Cross Plains city 1,381 1,449 1,568 1,685 1,794 1,909Greenbrier town 4,940 5,873 6,520 7,181 7,848 8,529Millersville city (pt.) 978 1,116 1,231 1,341 1,455 1,570Orlinda city 594 635 687 744 792 846Ridgetop city (pt.) 1,042 1,817 2,178 2,590 3,053 3,584Springfield city 14,329 15,451 16,824 18,181 19,480 20,762White House city (pt.) 3,085 3,569 3,940 4,324 4,697 5,074Unincorporated 24,193 25,313 27,349 29,286 31,075 32,737Total 54,433 59,380 64,809 70,196 75,388 80,534
Eagleville city 464 467 509 546 607 637La Vergne city 18,687 22,824 26,464 30,279 34,266 38,453Murfreesboro city 68,816 78,410 89,593 101,163 112,796 124,885Smyrna town 25,569 30,445 35,092 39,981 44,985 50,241Unincorporated 68,487 71,093 79,669 88,157 96,270 104,368Total 182,023 203,240 231,326 260,125 288,924 318,583
Cumberland City town 316 329 349 369 387 403Dover city 1,442 1,503 1,599 1,687 1,769 1,845Tennessee Ridge town (pt.) 7 7 7 7 8 8Unincorporated 10,605 11,313 12,081 12,810 13,495 14,144Total 12,370 13,151 14,036 14,873 15,659 16,401
Gallatin city 23,230 26,348 29,470 32,539 35,617 38,738Goodlettsville city (pt.) 4,625 5,061 5,606 6,146 6,682 7,215Hendersonville city 40,620 44,909 49,974 54,883 59,787 64,662Millersville city (pt.) 4,330 5,191 5,881 6,572 7,263 7,991Mitchellville city 207 218 242 266 271 294Portland city 8,458 10,194 11,536 12,895 14,293 15,730Walnut Grove town 677 725 808 870 949 1,028Westmoreland town 2,093 2,233 2,472 2,700 2,905 3,125White House city (pt.) 4,135 4,901 5,542 6,163 6,798 7,467Unincorporated 42,074 45,228 50,038 54,581 59,110 63,487Total 130,449 145,007 161,570 177,616 193,675 209,736
Hartsville town 7,259 7,586 8,055 8,495 8,881 9,226Unincorporated 0 0 0 0 0 0Total 7,259 7,586 8,055 8,495 8,881 9,226
Brentwood city 23,445 31,026 36,978 43,379 50,224 57,351Fairview city 5,800 7,001 8,190 9,431 10,719 12,015Franklin city 41,842 49,352 57,471 65,878 74,533 83,174Nolensville town 3,099 2,543 2,753 2,937 3,098 3,206Spring Hill city (pt.) 5,253 7,749 9,428 11,309 13,387 15,600Thompson's Station town 1,283 1,496 1,743 1,978 2,239 2,499Unincorporated 45,916 50,429 57,698 64,899 71,933 78,580Total 126,638 149,596 174,261 199,813 226,133 252,426
Robertson
Rutherford
Stewart
Sumner
Trousdale
Williamson
Tennessee Advisory Commission on Intergovernmental RelationsCenter for Business and Economic Research Page 45

Population Projections for Tennessee, 2005 to 2025
CensusCounty Municipality 2000 2005 2010 2015 2020 2025
Projections
GREATER NASHVILLE REGIONAL COUNCIL, continued
Lebanon city 20,235 22,067 24,542 27,012 29,455 31,868Mount Juliet city 12,366 17,181 20,046 23,165 26,514 30,096Watertown city 1,358 1,454 1,613 1,771 1,925 2,063Unincorporated 54,850 58,209 64,247 70,168 75,811 81,223Total 88,809 98,910 110,448 122,115 133,704 145,249
Wilson
Tennessee Advisory Commission on Intergovernmental RelationsCenter for Business and Economic Research Page 46
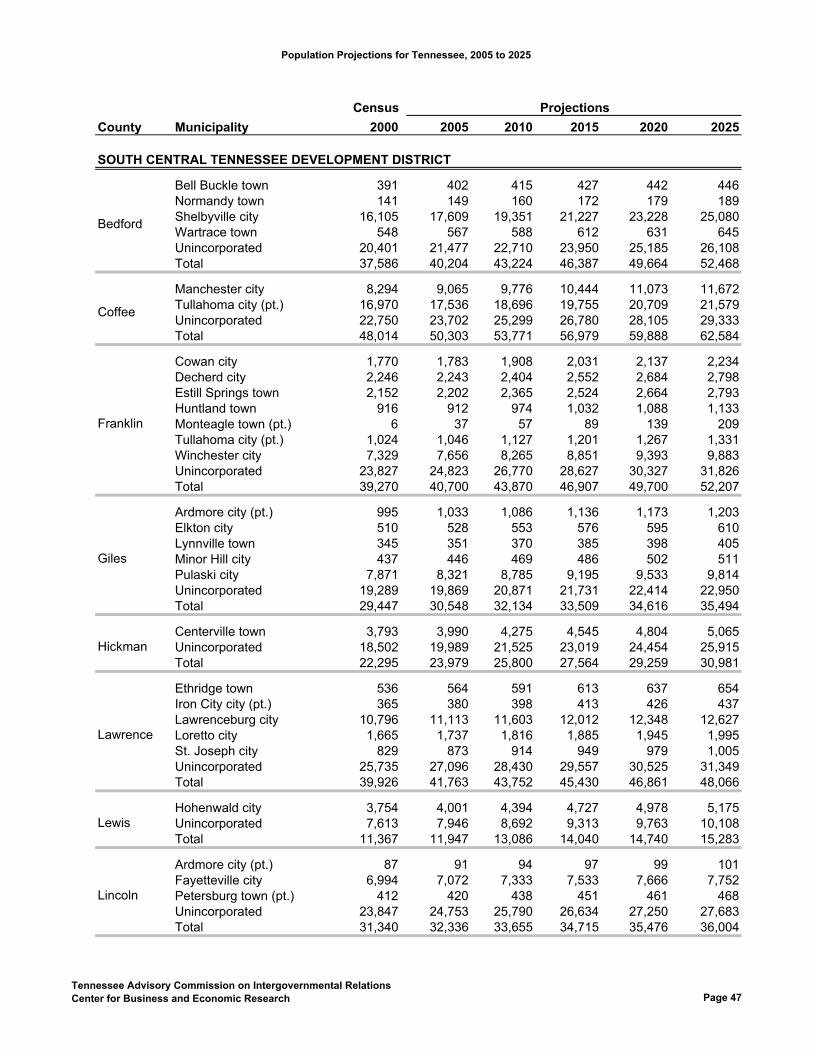
Population Projections for Tennessee, 2005 to 2025
CensusCounty Municipality 2000 2005 2010 2015 2020 2025
Projections
SOUTH CENTRAL TENNESSEE DEVELOPMENT DISTRICT
Bell Buckle town 391 402 415 427 442 446Normandy town 141 149 160 172 179 189Shelbyville city 16,105 17,609 19,351 21,227 23,228 25,080Wartrace town 548 567 588 612 631 645Unincorporated 20,401 21,477 22,710 23,950 25,185 26,108Total 37,586 40,204 43,224 46,387 49,664 52,468
Manchester city 8,294 9,065 9,776 10,444 11,073 11,672Tullahoma city (pt.) 16,970 17,536 18,696 19,755 20,709 21,579Unincorporated 22,750 23,702 25,299 26,780 28,105 29,333Total 48,014 50,303 53,771 56,979 59,888 62,584
Cowan city 1,770 1,783 1,908 2,031 2,137 2,234Decherd city 2,246 2,243 2,404 2,552 2,684 2,798Estill Springs town 2,152 2,202 2,365 2,524 2,664 2,793Huntland town 916 912 974 1,032 1,088 1,133Monteagle town (pt.) 6 37 57 89 139 209Tullahoma city (pt.) 1,024 1,046 1,127 1,201 1,267 1,331Winchester city 7,329 7,656 8,265 8,851 9,393 9,883Unincorporated 23,827 24,823 26,770 28,627 30,327 31,826Total 39,270 40,700 43,870 46,907 49,700 52,207
Ardmore city (pt.) 995 1,033 1,086 1,136 1,173 1,203Elkton city 510 528 553 576 595 610Lynnville town 345 351 370 385 398 405Minor Hill city 437 446 469 486 502 511Pulaski city 7,871 8,321 8,785 9,195 9,533 9,814Unincorporated 19,289 19,869 20,871 21,731 22,414 22,950Total 29,447 30,548 32,134 33,509 34,616 35,494
Centerville town 3,793 3,990 4,275 4,545 4,804 5,065Unincorporated 18,502 19,989 21,525 23,019 24,454 25,915Total 22,295 23,979 25,800 27,564 29,259 30,981
Ethridge town 536 564 591 613 637 654Iron City city (pt.) 365 380 398 413 426 437Lawrenceburg city 10,796 11,113 11,603 12,012 12,348 12,627Loretto city 1,665 1,737 1,816 1,885 1,945 1,995St. Joseph city 829 873 914 949 979 1,005Unincorporated 25,735 27,096 28,430 29,557 30,525 31,349Total 39,926 41,763 43,752 45,430 46,861 48,066
Hohenwald city 3,754 4,001 4,394 4,727 4,978 5,175Unincorporated 7,613 7,946 8,692 9,313 9,763 10,108Total 11,367 11,947 13,086 14,040 14,740 15,283
Ardmore city (pt.) 87 91 94 97 99 101Fayetteville city 6,994 7,072 7,333 7,533 7,666 7,752Petersburg town (pt.) 412 420 438 451 461 468Unincorporated 23,847 24,753 25,790 26,634 27,250 27,683Total 31,340 32,336 33,655 34,715 35,476 36,004
Bedford
Coffee
Franklin
Giles
Hickman
Lawrence
Lewis
Lincoln
Tennessee Advisory Commission on Intergovernmental RelationsCenter for Business and Economic Research Page 47

Population Projections for Tennessee, 2005 to 2025
CensusCounty Municipality 2000 2005 2010 2015 2020 2025
Projections
SOUTH CENTRAL TENNESSEE DEVELOPMENT DISTRICT, continued
Chapel Hill town 943 964 1,027 1,086 1,139 1,191Cornersville town 962 976 1,040 1,096 1,150 1,199Lewisburg city 10,413 11,260 12,130 12,969 13,763 14,512Petersburg town (pt.) 168 175 188 200 212 219Unincorporated 14,281 15,240 16,372 17,457 18,473 19,423Total 26,767 28,615 30,756 32,808 34,737 36,544
Columbia city 33,055 34,006 36,391 38,599 40,574 42,419Mount Pleasant city 4,491 4,629 4,958 5,264 5,538 5,794Spring Hill city (pt.) 2,462 3,932 4,598 5,324 6,108 6,976Unincorporated 29,490 31,617 34,015 36,266 38,267 40,113Total 69,498 74,185 79,962 85,453 90,486 95,303
Lynchburg, Moore County 5,740 5,992 6,335 6,650 6,930 7,162Unincorporated 0 0 0 0 0 0Total 5,740 5,992 6,335 6,650 6,930 7,162
Linden town 1,015 1,045 1,102 1,155 1,200 1,242Lobelville city 915 963 1,020 1,074 1,120 1,164Unincorporated 5,701 5,978 6,327 6,659 6,939 7,205Total 7,631 7,987 8,448 8,888 9,260 9,611
Clifton city 2,699 2,640 2,680 2,697 2,694 2,672Collinwood city 1,024 995 1,008 1,015 1,012 1,002Iron City city (pt.) 3 3 4 4 4 4Waynesboro city 2,228 2,153 2,177 2,187 2,178 2,156Unincorporated 10,888 11,431 11,761 12,006 12,158 12,222Total 16,842 17,223 17,630 17,909 18,046 18,056
Marshall
Maury
Moore
Perry
Wayne
Tennessee Advisory Commission on Intergovernmental RelationsCenter for Business and Economic Research Page 48

Population Projections for Tennessee, 2005 to 2025
CensusCounty Municipality 2000 2005 2010 2015 2020 2025
Projections
NORTHWEST TENNESSEE DEVELOPMENT DISTRICT
Big Sandy town 518 548 587 625 659 695Camden city 3,828 3,964 4,154 4,329 4,472 4,597Unincorporated 12,191 12,874 13,760 14,625 15,411 16,150Total 16,537 17,386 18,500 19,578 20,542 21,442
Atwood town 1,000 1,038 1,104 1,163 1,212 1,256Bruceton town 1,554 1,577 1,671 1,749 1,816 1,871Clarksburg town 285 294 313 329 343 356Hollow Rock town 963 1,005 1,068 1,125 1,173 1,215Huntingdon town 4,349 4,429 4,691 4,918 5,109 5,271McKenzie city (pt.) 4,963 5,247 5,599 5,916 6,189 6,434McLemoresville town 259 263 280 292 304 311Trezevant town 901 928 987 1,039 1,080 1,119Unincorporated 15,201 15,847 16,860 17,765 18,527 19,209Total 29,475 30,628 32,574 34,295 35,753 37,040
Alamo town 2,392 2,519 2,680 2,842 3,004 3,165Bells city 2,171 2,471 2,670 2,877 3,088 3,307Friendship city 608 640 680 722 763 802Gadsden town 553 589 628 668 708 748Maury City town 704 754 804 856 909 960Unincorporated 8,104 8,329 8,817 9,302 9,780 10,256Total 14,532 15,303 16,279 17,267 18,253 19,239
Dyersburg city 17,452 17,932 18,685 19,314 19,800 20,136Newbern town 2,988 3,103 3,241 3,358 3,447 3,515Trimble town (pt.) 728 740 768 791 812 822Unincorporated 16,111 16,772 17,515 18,153 18,660 19,027Total 37,279 38,547 40,209 41,617 42,719 43,500
Bradford town 1,113 1,112 1,140 1,153 1,154 1,154Dyer city 2,406 2,483 2,562 2,614 2,632 2,654Gibson town 305 323 333 343 345 352Humboldt city (pt.) 9,442 9,519 9,783 9,927 9,958 9,984Kenton town (pt.) 753 764 787 799 804 802Medina city 969 974 1,004 1,015 1,020 1,019Milan city 7,664 7,947 8,215 8,379 8,459 8,525Rutherford town 1,272 1,273 1,306 1,327 1,329 1,329Trenton city 4,683 4,706 4,836 4,904 4,914 4,925Yorkville city 293 299 308 313 314 316Unincorporated 19,252 19,567 20,157 20,474 20,585 20,671Total 48,152 48,967 50,430 51,248 51,514 51,730
Cottage Grove town 97 102 108 111 117 122Henry town 520 557 598 634 670 705McKenzie city (pt.) 90 95 101 107 113 118Paris city 9,763 10,135 10,782 11,401 11,945 12,466Puryear city 667 704 752 797 837 876Unincorporated 19,978 21,174 22,619 24,014 25,265 26,476Total 31,115 32,767 34,960 37,065 38,947 40,764
Benton
Carroll
Crockett
Dyer
Gibson
Henry
Tennessee Advisory Commission on Intergovernmental RelationsCenter for Business and Economic Research Page 49
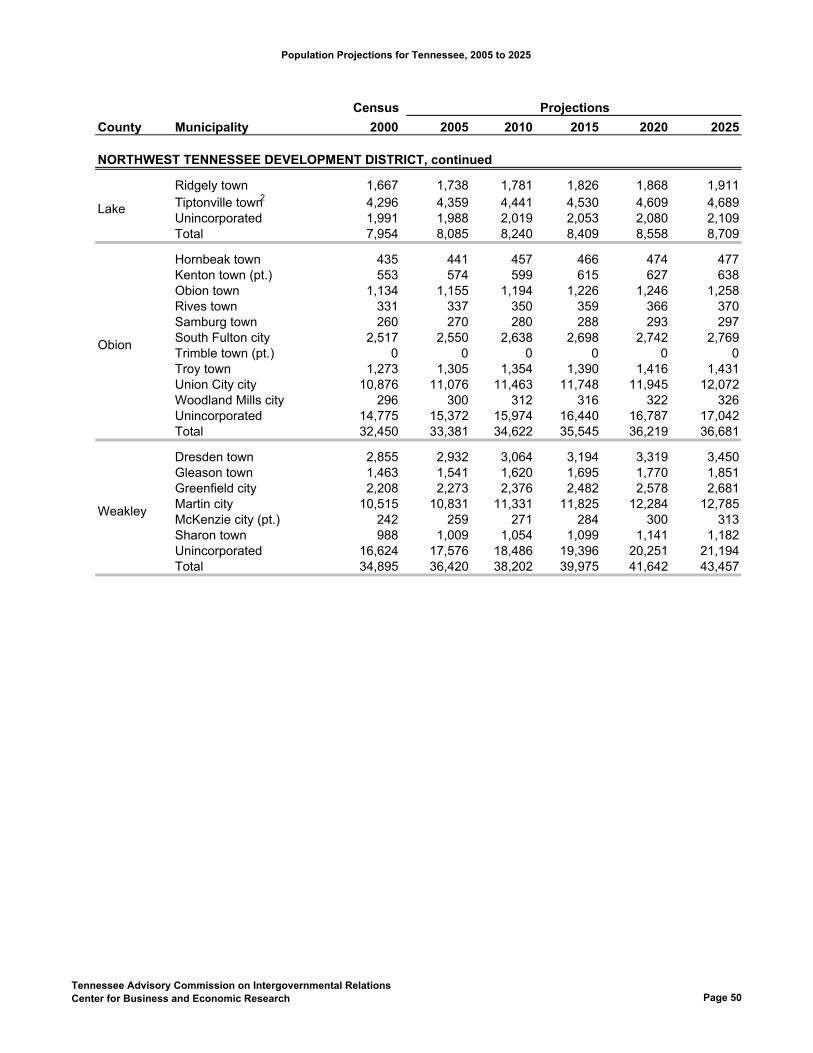
Population Projections for Tennessee, 2005 to 2025
CensusCounty Municipality 2000 2005 2010 2015 2020 2025
Projections
NORTHWEST TENNESSEE DEVELOPMENT DISTRICT, continued
Ridgely town 1,667 1,738 1,781 1,826 1,868 1,911Tiptonville town2 4,296 4,359 4,441 4,530 4,609 4,689Unincorporated 1,991 1,988 2,019 2,053 2,080 2,109Total 7,954 8,085 8,240 8,409 8,558 8,709
Hornbeak town 435 441 457 466 474 477Kenton town (pt.) 553 574 599 615 627 638Obion town 1,134 1,155 1,194 1,226 1,246 1,258Rives town 331 337 350 359 366 370Samburg town 260 270 280 288 293 297South Fulton city 2,517 2,550 2,638 2,698 2,742 2,769Trimble town (pt.) 0 0 0 0 0 0Troy town 1,273 1,305 1,354 1,390 1,416 1,431Union City city 10,876 11,076 11,463 11,748 11,945 12,072Woodland Mills city 296 300 312 316 322 326Unincorporated 14,775 15,372 15,974 16,440 16,787 17,042Total 32,450 33,381 34,622 35,545 36,219 36,681
Dresden town 2,855 2,932 3,064 3,194 3,319 3,450Gleason town 1,463 1,541 1,620 1,695 1,770 1,851Greenfield city 2,208 2,273 2,376 2,482 2,578 2,681Martin city 10,515 10,831 11,331 11,825 12,284 12,785McKenzie city (pt.) 242 259 271 284 300 313Sharon town 988 1,009 1,054 1,099 1,141 1,182Unincorporated 16,624 17,576 18,486 19,396 20,251 21,194Total 34,895 36,420 38,202 39,975 41,642 43,457
Lake
Obion
Weakley
Tennessee Advisory Commission on Intergovernmental RelationsCenter for Business and Economic Research Page 50

Population Projections for Tennessee, 2005 to 2025
CensusCounty Municipality 2000 2005 2010 2015 2020 2025
Projections
SOUTHWEST TENNESSEE DEVELOPMENT DISTRICT
Enville town (pt.) 230 147 162 179 193 206Henderson city 5,670 6,331 7,157 8,001 8,835 9,668Milledgeville town (pt.) 83 84 92 101 110 119Silerton town (pt.) 0 0 0 0 0 0Unincorporated 9,557 9,625 10,634 11,611 12,527 13,388Total 15,540 16,187 18,045 19,892 21,665 23,381
Decaturville town 859 894 954 1,005 1,048 1,092Parsons city 2,452 2,577 2,750 2,907 3,038 3,167Scotts Hill town (pt.) 349 369 394 417 436 456Unincorporated 8,071 8,513 9,092 9,613 10,055 10,488Total 11,731 12,353 13,189 13,941 14,577 15,202
Bolivar city 5,802 5,721 5,758 5,760 5,740 5,706Grand Junction city (pt.) 301 299 300 299 300 297Hickory Valley town 136 133 133 135 134 132Hornsby town 306 302 306 305 306 303Middleton city 602 634 646 654 660 664Saulsbury town 99 100 99 101 99 100Silerton town (pt.) 60 57 59 60 57 58Toone town 330 329 331 330 332 329Whiteville town1 3,148 6,998 8,286 9,755 11,436 13,373Unincorporated 17,321 15,616 14,990 14,058 12,827 11,277Total 28,105 30,188 30,908 31,456 31,891 32,239
Adamsville town (pt.) 33 37 39 40 41 42Crump city 1,521 1,585 1,661 1,723 1,773 1,810Milledgeville town (pt.) 74 80 83 86 89 91Saltillo town 342 358 375 389 400 408Savannah city 6,917 7,196 7,534 7,816 8,037 8,209Unincorporated 16,691 17,287 18,087 18,754 19,263 19,664Total 25,578 26,543 27,780 28,808 29,604 30,225
Brownsville city 10,748 10,929 11,099 11,181 11,245 11,268Stanton town 615 613 620 622 623 622Unincorporated 8,434 8,504 8,620 8,671 8,704 8,706Total 19,797 20,046 20,339 20,474 20,573 20,596
Lexington city 7,393 7,891 8,445 8,968 9,458 9,921Parkers Crossroads city 241 272 294 316 337 354Sardis town 445 472 503 535 562 587Scotts Hill town (pt.) 545 579 618 657 690 726Unincorporated 16,898 18,234 19,555 20,805 21,988 23,125Total 25,522 27,448 29,414 31,281 33,034 34,713
Humboldt city (pt.) 25 29 31 34 36 38Jackson city 59,643 62,814 68,055 73,148 77,933 82,442Medon city 191 203 210 225 240 254Three Way city 1,375 1,393 1,499 1,599 1,692 1,777Unincorporated 30,603 32,287 35,002 37,632 40,107 42,440Total 91,837 96,726 104,797 112,639 120,008 126,951
Chester
Decatur
Hardeman
Hardin
Haywood
Henderson
Madison
Tennessee Advisory Commission on Intergovernmental RelationsCenter for Business and Economic Research Page 51

Population Projections for Tennessee, 2005 to 2025
CensusCounty Municipality 2000 2005 2010 2015 2020 2025
Projections
SOUTHWEST TENNESSEE DEVELOPMENT DISTRICT, continued
Adamsville town (pt.) 1,950 2,056 2,179 2,293 2,391 2,481Bethel Springs town 763 794 842 884 918 952Eastview town 618 641 677 711 738 766Enville town (pt.) 0 0 0 0 0 0Finger city 350 367 387 406 423 439Guys town 483 504 535 562 585 607Michie town 647 680 721 758 789 819Milledgeville town (pt.) 130 137 145 150 156 162Ramer city 354 367 387 406 420 436Selmer town 4,541 4,729 5,006 5,254 5,464 5,662Stantonville town 312 328 348 366 384 398Unincorporated 14,505 15,253 16,187 17,014 17,736 18,405Total 24,653 25,856 27,413 28,803 30,005 31,126
McNairy
Tennessee Advisory Commission on Intergovernmental RelationsCenter for Business and Economic Research Page 52
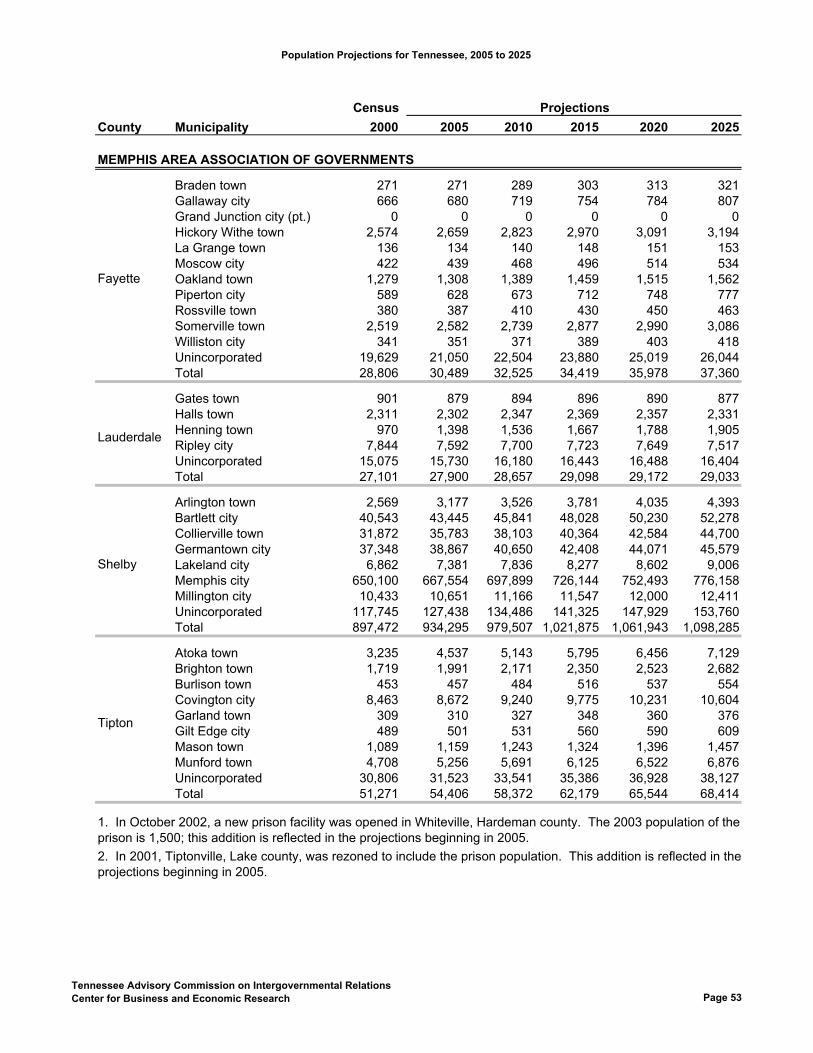
Population Projections for Tennessee, 2005 to 2025
CensusCounty Municipality 2000 2005 2010 2015 2020 2025
Projections
MEMPHIS AREA ASSOCIATION OF GOVERNMENTS
Braden town 271 271 289 303 313 321Gallaway city 666 680 719 754 784 807Grand Junction city (pt.) 0 0 0 0 0 0Hickory Withe town 2,574 2,659 2,823 2,970 3,091 3,194La Grange town 136 134 140 148 151 153Moscow city 422 439 468 496 514 534Oakland town 1,279 1,308 1,389 1,459 1,515 1,562Piperton city 589 628 673 712 748 777Rossville town 380 387 410 430 450 463Somerville town 2,519 2,582 2,739 2,877 2,990 3,086Williston city 341 351 371 389 403 418Unincorporated 19,629 21,050 22,504 23,880 25,019 26,044Total 28,806 30,489 32,525 34,419 35,978 37,360
Gates town 901 879 894 896 890 877Halls town 2,311 2,302 2,347 2,369 2,357 2,331Henning town 970 1,398 1,536 1,667 1,788 1,905Ripley city 7,844 7,592 7,700 7,723 7,649 7,517Unincorporated 15,075 15,730 16,180 16,443 16,488 16,404Total 27,101 27,900 28,657 29,098 29,172 29,033
Arlington town 2,569 3,177 3,526 3,781 4,035 4,393Bartlett city 40,543 43,445 45,841 48,028 50,230 52,278Collierville town 31,872 35,783 38,103 40,364 42,584 44,700Germantown city 37,348 38,867 40,650 42,408 44,071 45,579Lakeland city 6,862 7,381 7,836 8,277 8,602 9,006Memphis city 650,100 667,554 697,899 726,144 752,493 776,158Millington city 10,433 10,651 11,166 11,547 12,000 12,411Unincorporated 117,745 127,438 134,486 141,325 147,929 153,760Total 897,472 934,295 979,507 1,021,875 1,061,943 1,098,285
Atoka town 3,235 4,537 5,143 5,795 6,456 7,129Brighton town 1,719 1,991 2,171 2,350 2,523 2,682Burlison town 453 457 484 516 537 554Covington city 8,463 8,672 9,240 9,775 10,231 10,604Garland town 309 310 327 348 360 376Gilt Edge city 489 501 531 560 590 609Mason town 1,089 1,159 1,243 1,324 1,396 1,457Munford town 4,708 5,256 5,691 6,125 6,522 6,876Unincorporated 30,806 31,523 33,541 35,386 36,928 38,127Total 51,271 54,406 58,372 62,179 65,544 68,414
1. In October 2002, a new prison facility was opened in Whiteville, Hardeman county. The 2003 population of the prison is 1,500; this addition is reflected in the projections beginning in 2005.2. In 2001, Tiptonville, Lake county, was rezoned to include the prison population. This addition is reflected in the projections beginning in 2005.
Fayette
Lauderdale
Shelby
Tipton
Tennessee Advisory Commission on Intergovernmental RelationsCenter for Business and Economic Research Page 53

Aggregate Projections for Counties within MSAs

Population Projections for Tennessee, 2005 to 2025
CensusCounty 2000 2005 2010 2015 2020 2025
CHATTANOOGA METROPOLITAN STATISTICAL AREA
Hamilton 307,896 314,958 324,353 335,636 344,951 352,285Marion 27,776 28,459 30,519 32,253 33,845 35,616Sequatchie 11,370 12,138 13,011 13,792 14,501 15,168Catoosa GA 53,282Dade GA 15,154Walker GA 61,053
CLARKSVILLE METROPOLITAN STATISTICAL AREA
Montgomery 134,768 147,946 165,840 184,458 203,842 224,457Stewart 12,370 13,151 14,036 14,873 15,659 16,401Christian KY 72,265Trigg KY 12,597
CLEVELAND METROPOLITAN STATISTICAL AREA
Bradley 87,965 94,810 103,873 112,856 121,533 130,252Polk 16,050 17,446 18,999 20,545 22,086 23,733
JACKSON METROPOLITAN STATISTICAL AREA
Chester 15,540 16,187 18,045 19,892 21,665 23,381Madison 91,837 96,726 104,797 112,639 120,008 126,951
JOHNSON CITY METROPOLITAN STATISTICAL AREA
Carter 56,742 57,985 60,332 62,239 63,657 64,739Unicoi 17,667 18,165 18,897 19,536 20,056 20,560Washington 107,198 112,764 120,236 127,230 133,790 140,466
KINGSTON-BRISTOL METROPOLITAN STATISTICAL AREA
Hawkins 53,563 56,786 60,314 63,571 66,538 69,354Sullivan 153,048 155,515 158,561 160,466 161,390 161,263Scott VA 23,403
KNOXVILLE METROPOLITAN STATISTICAL AREA
Anderson 71,330 73,065 75,163 76,583 77,226 77,233Blount 105,823 112,222 120,592 128,718 136,357 143,707Knox 382,032 398,735 427,593 455,614 481,842 507,438Loudon 39,086 43,334 48,362 53,574 58,729 64,291Union 17,808 19,162 20,660 22,106 23,436 24,748
Projections
Tennessee Advisory Commission on Intergovernmental RelationsCenter for Business and Economic Research Page 55

Population Projections for Tennessee, 2005 to 2025
CensusCounty 2000 2005 2010 2015 2020 2025
Projections
MEMPHIS METROPOLITAN STATISTICAL AREA
Fayette 28,806 30,489 32,525 34,419 35,978 37,360Shelby 897,472 934,295 979,507 1,021,875 1,061,943 1,098,285Tipton 51,271 54,406 58,372 62,179 65,544 68,414Desoto MS 107,199Marshall MS 34,993Tate MS 25,370Tunica MS 9,227Crittenden AR 50,866
MORRISTOWN METROPOLITAN STATISTICAL AREA
Grainger 20,659 21,771 22,950 23,998 24,920 25,760Hamblen 58,128 61,754 65,881 69,721 73,315 76,938Jefferson 44,294 47,374 52,111 56,796 61,318 65,928
NASHVILLE-DAVIDSON-MURFREESBORO METROPOLITAN STATISTICAL AREA
Cannon 12,826 13,445 14,183 14,852 15,426 15,946Cheatham 35,912 40,126 44,880 49,691 54,477 59,205Davidson 569,891 596,399 620,928 643,675 665,579 688,340Dickson 43,156 47,288 52,059 56,823 61,487 66,148Hickman 22,295 23,979 25,800 27,564 29,259 30,981Macon 20,386 21,827 23,473 25,092 26,628 28,140Robertson 54,433 59,380 64,809 70,196 75,388 80,534Rutherford 182,023 203,240 231,326 260,125 288,924 318,583Smith 17,712 18,744 19,927 21,033 22,032 22,963Sumner 130,449 145,007 161,570 177,616 193,675 209,736Trousdale 7,259 7,586 8,055 8,495 8,881 9,226Williamson 126,638 149,596 174,261 199,813 226,133 252,426Wilson 88,809 98,910 110,448 122,115 133,704 145,249
Tennessee Advisory Commission on Intergovernmental RelationsCenter for Business and Economic Research Page 56

Technical Appendix

Tennessee Advisory Commission on Intergovernmental Relations Center for Business and Economic Research Page 58
Technical Appendix
State, County, and Sub-county Population Projections for the State of Tennessee
State Level Projections The projections of the state population for each period result from summing the county populations obtained through the cohort-component method, which is outlined below. County Level Projections 1. Technique
A cohort-component demographic model is used to project population for the Tennessee counties. Using the 2000 Census counts, the population is carried forward at five-year intervals to the year 2025. The population is categorized by gender and five-year age groups. The cohort-component model allows one to make assumptions about how each age and gender cohort will migrate and survive between each five-year interval. This model also allows one to make assumptions about fertility rates so that children projected to be born in future periods can be added in at each projection interval. The component aspect of this model examines those activities that are the “components” of population growth: births, deaths, and migration. Mortality The first step in the projection procedure is to calculate the number of people in each age group that are alive in the base year (2000) and survive through the first projection period (2005). This is accomplished by multiplying the base year population by the age-specific five-year survival rates. In this study, the age-specific survival rates have been calculated from the United States Life Tables, 2000 edition. Migration In these projections, a net migration model at the county level is used. Due to the known undercount in Census 1990, and in order to more accurately capture the long-term migration patterns of the state that are extrapolated to 2025, net migration rates are calculated for the previous four decades: 1960-1970, 1970-1980, 1980-1990, 1990-2000. These rates are then averaged to obtain the average net migration rate for each age and gender cohort at the county level. Because the rates that are calculated are for a ten-year period, the rates must be adjusted to a five-year rate in order to match the projection period.
Tennessee Advisory Commission on Intergovernmental Relations Center for Business and Economic Research Page 59
Fertility In order to gain the most accuracy in the projections, age-specific fertility rates
are calculated for each county using the average of the fertility rates for 1999, 2000, and 2001. There are three steps that need to be computed in order to arrive at the number of births. In the first step, the at-risk female population (broken down by age) is multiplied by the calculated age-specific fertility rates in order to project the total number of births. (At-risk females are simply the females of childbearing age.) The second step is to allocate births as males and females using historical proportions. The final step is to survive the births forward; this becomes the youngest age group in the next projection period. These calculations are performed for each county separately. Institutional Effects Special populations include those people living at colleges and universities, nursing homes, military bases, and prisons. Because these populations do not exhibit the same demographic characteristics as the general population, they must be treated differently in the projections. For the purposes of this study the assumption is made that these populations do not change in size or age distribution throughout the projection period and therefore, the population counts of these groups are held constant. Final Projections The final projections combine the results of each of the three previous steps: mortality, migration, and fertility. The process is then repeated for the next projection period and continues until the results for the final period are obtained. The county population projections are the foundation for the sub-county projections, which are detailed in a separate section below.
2. Data Using the cohort-component method at the county-level requires a large amount of data. The level of specificity of the data affects the accuracy of the projections and the most detailed data are used whenever possible. The population at the county level for the base year (2000) is available from the United States Census Bureau in Summary File 1 (SF-1). This file contains population counts separated into the desired cohorts: 5-year age groups for males and females. The special population counts are also obtained from the Census Bureau in the file Group Quarters Population by Race and Hispanic Origin: 2000 (PHC-T-7). To calculate the five-year age-gender-specific survival rates, an abridged life table available from the Centers for Disease Control and Prevention (CDC) is used (United States Life Tables, 2000). The calculations of the county net migration rates require the most data. The age-gender-specific Census population counts at both the county level and for the United States are needed for the following years: 1960, 1970, 1980, and 1990, in addition to the 2000 counts already used. Calculation of the net migration rates involves projecting the number of people that are expected to survive to the next time period and in order

Tennessee Advisory Commission on Intergovernmental Relations Center for Business and Economic Research Page 60
accomplish this, 10-year survival rates are calculated for each decade using the life tables for the United States available from the CDC. An exception is the survival rate for the decade of the 1960s, which is not available, so the rate from 1966 is used instead. Use of historical survival rates increases the accuracy of the projections since survival rates have exhibited an increase in the United States over the last four decades. Age-specific fertility rates at the county level are obtained from the Tennessee Department of Health for the years 1999, 2000, and 2001. An average of the three years is used in order to smooth any peaks that may have occurred in any given year. The fertility rates are applied to all females between the ages 10-44 that are not part of the institutional population. Sub-county Level Projections 1. Technique Due to the immense data requirements of the cohort-component method at the sub-county level and the lack of availability of the necessary data, a different method is employed for these projections. An exponential extrapolation method is used to allocate the county population projections into their respective sub-county areas. Possible extrapolation methods include the linear method, the geometric method, and the exponential method. The linear extrapolation method assumes that the population is increasing (decreasing) by the same number of people in each future period as the average annual increase in the base period. The geometric extrapolation method assumes that the population will increase (decrease) at the same annual percentage rate during the projection period as during the base period with the growth rates compounding at discrete time intervals (most often, annually.) The exponential extrapolation method is very similar to the geometric method except that the growth rate is continuously compounded. Because population growth is assumed to occur continuously rather than discretely, the exponential extrapolation method was deemed superior to the other two methods. For the sub-county projections, three years of data are used, 2000, 2001, and 2002. The intercensal population estimates provided by the Census Bureau for 1991-1999 are based on the 1990 Census, which is known to have a significant undercount, therefore, those estimates were deemed unreliable for the use of projections. The sub-county area population as a share of the previously calculated county population for each projection period is obtained using the exponential extrapolation method. Census 2000 provides the age-gender population at the sub-county level. These data are then used to calculate the sub-county age-gender shares. These share are applied to the sub-county population totals to allocate the population into the appropriate age-gender cohort. An important implication of this procedure is that the age-gender mix of the sub-county population is assumed to remain constant over the entire projection period. 2. Data The Census Bureau provides estimates of the sub-county populations for 2001 and 2002 and are based on Census 2000. These estimates are used to calculate the sub-county population shares for each projection period.

Tennessee Advisory Commission on Intergovernmental Relations Center for Business and Economic Research Page 61
Checks The population projections are checked against the Projections of the Total Population of the States: 1995-2025, Series B, provided by the Census Bureau as well as those projections completed by the firm Woods & Poole Economics. The results for the total population for the state of Tennessee are found in the table below. It should be noted that the projections provided by the Census Bureau are based on the 1990 Census. Population Projections for the State of Tennessee 2000-2025 (numbers in thousands)
2000
2005 2010 2015 2020 2025
Census Bureau
5668 6039 X* 6707 X* 7249
CBER
5689 6017 6426 6821 7195 7559
Woods &
Poole
5703 6031 6386 6755 7138 7537
*data not available The difference between population projections in this report and those provided by Woods & Poole is found to be, on average one half of one percent. The differences between the numbers for 2000 are due to the following: the Census Bureau is an estimate based on the Census numbers for 1990. Woods & Poole use data from the United States Department of Commerce that are based on Census population estimates.