Embed Size (px)
Citation preview

TennCare Presentation on the Governor’s FY 2012 Recommended Budget
Darin GordonDr. Wendy Long
Scott Pierce

Presentation Overview
• Over the past five years, the TennCare program has been successful in reducing escalating costs, improving quality of care, and increasing care options for the state’s most vulnerable populations.
• Difficult decisions positioned the program to weather recent nation-wide economic difficulties.
• In addition to a solid fiscal and programmatic foundation, an influx of non-recurring funds has postponed the implementation of reductions included in the past two budgets.
• Some or all of these one-time funds will not be available to offset reductions in the upcoming fiscal year.
• This recommended budget puts forth a plan that will allow the Bureau to continue providing quality health care to approximately 20 percent of Tennesseans despite current budgetary restrictions.
1

TennCare Overview
2
Pharmacy Benefits Manager (PBM), SXC
Dental Benefits Manager (DBM), Delta Dental (enrollees under 21)
•United •BlueCare
•United •BlueCare
•United•AmeriGroup
TennCare Select
WEST MIDDLE EAST
TennCare Statewide Managed Care Delivery System
Percentage Breakdown of the TennCare Budget
*Percentage includes: funding for DHS county offices and outreach at health departments.
•TennCare is 100 percent Managed Care – meaning all 1.2 million TennCare enrollees receive coordinated health services through a Managed Care Organization (MCO). •TennCare uses an integrated approach which means all physical, behavioral and LTC needs are taken care of by one of four MCOs.•This helps reduce costs because of better coordination of care and increases the quality of care for enrollees by ensuring appropriate care and preventative care.•TennCare uses a “Medical Home” model where all enrollees are matched with a primary care provider to deliver patient-centered care and ensure the appropriate care is provided at each step.
72%
10%
10%6%
2%
Managed Care Services
Supplemental Payments to Hospitals
Intellectual Disability Services
Medicare Cost Sharing
Administration*
MCO
s

$0
$1,000
$2,000
$3,000
2002 2003 2004 2005 2006 2007 2008 2009 est. 2010
Taking Control of Rising Costs
2000 2001 2002 2003 2004 2005 2006 2007 2008 2009 2010
Expenditures $4.5 $5.4 $6.1 $6.9 $7.6 $8.6 $6.9 $7.1 $7.5 $7.7 $8.2
McKinsey Est. $9.5 $10.6 $11.8 $13.1 $14.6
Actual Expenditures vs. McKinsey and Co.’s Best Case Scenario Estimates
Pharmacy Spend
$0
$100
$200
$300
$400
2004 2005 2006 2007 2008 2009 est. 2010
HH/PDN Spend
• Costs under control – McKinsey and Co.’s best case scenario estimated the TennCare budget at more than $4 billion over actual expenditures in 2008.
• Requested no new state dollars two years in a row due to aggressive program management.
• Reserves built up to record highs and available to help the state through recent tough economic times.
• Effective monitoring and management of cost-drivers - soaring pharmacy and Home Health/Private Duty Nursing costs contained.
3
In millions
In Billions
*
* The 2009 and 2010 figures were calculated by continuing the 2006-2008 trend.
In millions
55%60%65%70%75%80%85%90%95%
100%
1994
1995
1996
1997
1998
1999
2000
2001
2002
2003
2004
2005
2006
2007
2008
2009
2010 10%
40%
70%
100%
1999 2000 2001 2002 2003 2004 2005 2006 2007 2008 2009
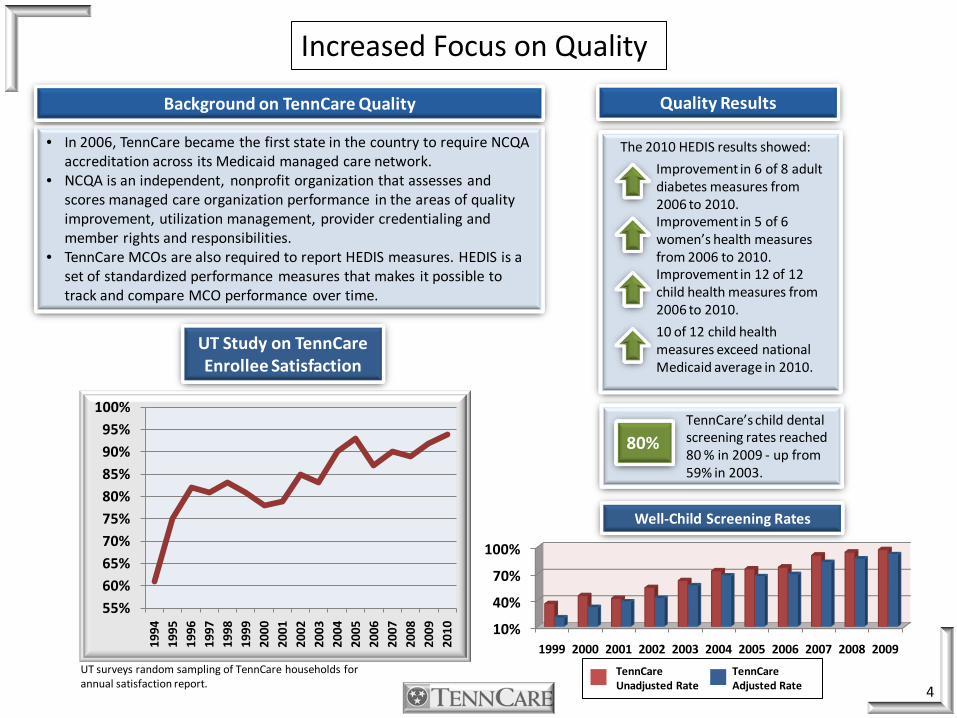
• In 2006, TennCare became the first state in the country to require NCQA accreditation across its Medicaid managed care network.
• NCQA is an independent, nonprofit organization that assesses and scores managed care organization performance in the areas of quality improvement, utilization management, provider credentialing and member rights and responsibilities.
• TennCare MCOs are also required to report HEDIS measures. HEDIS is a set of standardized performance measures that makes it possible to track and compare MCO performance over time.
TennCare’s child dental screening rates reached 80 % in 2009 - up from 59% in 2003.
Background on TennCare Quality
Increased Focus on Quality
Well-Child Screening Rates
UT Study on TennCareEnrollee Satisfaction
TennCareUnadjusted Rate
TennCareAdjusted Rate 4
80%
The 2010 HEDIS results showed:
Improvement in 6 of 8 adult diabetes measures from 2006 to 2010.Improvement in 5 of 6 women’s health measures from 2006 to 2010.Improvement in 12 of 12 child health measures from 2006 to 2010.
10 of 12 child health measures exceed national Medicaid average in 2010.
Quality Results
UT surveys random sampling of TennCare households for annual satisfaction report.

Statewide LTC CHOICES New Enrollment
NF 66.1%
HCBS 33.9%
Statewide LTC Enrollment Before CHOICES 3/1/10
NF 82.5 %
HCBS 17.5%
Rebalances Long-Term Care Enrollment and Funding
5
Less than a year after CHOICES implementation, enrollment has shifted 27 percent from NFs to HCBS.
• TennCare CHOICES in Long-Term Care integrates TennCarenursing facility (NF) services and Home and Community Based Services (HCBS) for the elderly and adults with physical disabilities into the existing managed care system offering more options for individuals in need of LTC.
• This better prepares the program to adapt to the state’s growing aging population in the years to come.
• CHOICES was implemented in Middle TN in March of 2010 and statewide in August of 2010.
TennCare CHOICES in Long-Term Care (LTC) allows the state to use existing dollars to offer more options to those in need of LTC .
How?
• Often times the home is the most appropriate and cost effective setting to receive LTC services.
• The CHOICES program design allows more people to be served with existing funding so long as it can be done safely and cost effectively.
• $19,000 (average annual cost HCBS)
vs.• $55,000 (average annual cost level 1 NF)
Since the statewide launch of CHOICES, total enrollment has shifted from 17.5% to
25.7% HCBS in just one year.
Statewide LTC Enrollment as of 4/1/11
NF 74.3%
HCBS 25.7%

Beating National Medicaid Inflation Trends
6
Although TennCare is beating national Medicaid inflation trends - as well as most commercial insurance medical inflation trends - some medical inflation will always exist. For FY 2012, we project a trend of approximately 3.8 percent at an estimated cost of $90 million (state dollars). This increase in cost is due to medical inflation, enrollment, and shifts in population within TennCare eligibility categories. Also, a cost increase of $16 million is expected because provisions of the Affordable Care Act prevent the Bureau from implementing more stringent requirements for nursing home placements as contemplated under the Long Term Care Community Choices Act of 2008.
Nationally Medicaid Programs project an inflation rate of approximately 7.5 percent and commercial plans a rate of 9.0 percent. TennCare projects an inflation rate of approximately 3.8 percent.
TennCare projected Medical Inflation SFY 2012
National Medicaid projected Medical Inflation FFY 2011 (Source: OMB)
Commercial Plans projected Medical Inflation CY 2011(Source: PricewaterhouseCoopers)
How does TennCare control trend?
MCOs and PBM provide Coordination of Care and Medical Management:
Pharmacy• Point of Sale Edits• Preferred Drug List/Drug
Rebates/Generics• Prescription Limits
Medical• Prior authorization• Medical Home• Network Consolidation• Disease Management• Case Management
Fraud and Abuse• Narcotic Controls• Pharmacy Lock-In• Outlier Monitoring
0.00%
1.00%
2.00%
3.00%
4.00%
5.00%
6.00%
7.00%
8.00%
9.00%
3.8%
7.5%
9.0%
How do Commercial Plans Control Trend?
• Shifting from co-payments to cost sharing and raising deductibles - requiring more out-of pocket payment from members
• Shifting to Generics
• Assuming savings from return to pre-ARRA COBRA requirements
Projected Medical Inflation Trends

EnrollmentChange optional eligibility categories:
Tighten Criteria
Close
Eliminate
ARRA and ACA prevent restrictions in eligibility
Mandatory enrollment increasing due to economy
Requires CMS approval
Provider Reimbursement
Decrease rates
FY 10 and FY 11 budgets include 7% reduction (postponed by ARRA and hospital fee)
Further reduction may stress provider network
Cost SharingPremiums
Co-pays
Deductibles
CMS limits the population to which cost sharing can be applied and cost sharing amounts
Requires CMS approval
BenefitsIncrease existing benefit limits
Eliminate optional benefits
Place new limits on benefits
Cannot change benefit package for pregnant women and approximately 700,000 children.
Requires CMS approval
Categories Options Challenges /Limitations
Ways to Significantly Reduce Expenditures
7

Recommended FY 2012 Budget and Proposed Hospital Fee
8
$5.0
$6.0
$7.0
$8.0
$9.0
FY 2009
FY 2010
FY 2011
FY 2012
FY 2012
General Fund ARRA
Clawback Hosp. Fee
In Billions
State and Federal $s
Without Hospital Fee
FY 2011 Budget
Hosp. Fee dependent
upon Legislative approval
FY 2012 Base Budget
without Hosp. Fee
$8.29 Billion $6.98 Billion
FY 2012 Hospital Fee Proposal* Total State
8 day In- Patient Hosp. benefit limit $135,441,500 $45,734,531
Hospital Rate Reduction 109,830,500 37,086,465
Essential Access Hosp. Payment 100,000,000 33,767,000
DSH MATCH 81,023,000 27,306,600
8 Lab/Xray benefit Limit 80,772,800 27,274,551
Professional Rate Reduction** 76,292,600 25,761,722
Hospital Ceiling @100% Medicare 66,565,700 22,477,240
GME (Graduate Medical Education) 50,000,000 16,883,500
8 Office Visit benefit limit 42,496,100 14,349,658
Medicare Part A 35,550,400 12,004,304
Standard Spend Down up to 7,000 enrollees 32,727,300 11,051,027
8 Outpatient benefit limit 30,566,900 10,321,525
Elimination of PT/OT/ST benefit limit 13,277,600 4,483,447
Critical Access Hosp. Payment 10,000,000 3,376,700
Critical Access State-Only Payment 6,000,000 6,000,000
TOTAL $870,544,400 $297,878,271
•Approximately $455 million total ($154m state) of Hosp. Fee funds are used as a pool payment to hospitals and not reflected in these budget figures.** Certain provider types are not included in the rate reduction buy-back: Nursing Homes, MCO Admin. Rates, Transportation, Mental Health Services, Lab and XrayServices, Dental Services, ICF-MR, PACE, Home Health Providers (excludes HCBS Services).
FY 2012 Budget with
Hosp. Fee
$8.69 Billion
• The reductions identified to be funded with the proposed FY 2012 Hospital Fee are required to be implemented 7/1/2011 if the fee is not ultimately approved.
• As a result, notices informing enrollees about the benefit changes would have to be drafted and ready to print by 5/1/2011.

Reductions Total State
7% Rate Reduction
A. Nursing Homes $76,673,400 $25,890,300
B. MCO Administrative rates 23,348,300 7,884,000
C. Transportation providers 5,470,400 1,847,200
D. Mental Health Services 19,847,600 6,701,900
E. Lab and Xray services 16,322,200 5,511,500
F. Dental Services 11,403,000 3,850,500
G. ICF-MR providers 7,000,000 2,363,700
H. PACE program 876,100 295,800
I. Home Health providers (excludes HCBS services) 16,821,600 5,680,100
Meharry Grant eligible for federal matching funds 10,000,000 3,376,700
Meharry Grant not eligible for federal matching funds 3,000,000 3,000,000
Pharmacy Reimbursement - $4 for drugs that are widely accessible for $4 on commercial formularies 16,502,100 5,572,300
More aggressive MAC pricing for generic drugs 12,000,000 4,052,000
$2 Co-pay for Non-Emergency Transportation Services 3,829,300 1,293,000
Grant to the Regional Med, Metro General, and Jellico Hospitals for charity care 10,000,000 10,000,000
Perinatal Grants 4,545,600 2,272,800
TOTAL $237,639,600 $89,591,800
Reductions* Total State
1.5% rate reduction
A. Nursing Homes $16,430,000 $5,547,900
B. MCO Administrative rates 5,003,200 1,689,400
C. Transportation providers 1,172,200 395,800
D. Mental Health Services 5,430,500 1,833,700
E. Lab and Xray services 3,534,500 1,193,500
F. Dental Services 1,036,600 350,000
G. ICF-MR providers 1,500,000 506,500
H. PACE program 79,600 26,900
I. Home Health providers (excludes HCBS services) 3,351,000 1,131,500
Change payment rates for C-section and vaginal deliveries 44,221,900 14,932,400
↓ payment rate to ER physicians for non-emergency services 24,998,200 8,441,100
Dosage limit on Opioid detox drugs for adults 5,561,800 1,314,600
Quantity limit on Sedative Hypnotics for adults 1,721,500 406,900
Implement new Hemophilia management program 1,200,000 283,600
Exclude acne products for adults 634,600 150,000
TNAAP Grant 468,200 234,100
TOTAL $116,343,800 $38,437,900
Postponed FY 2010 and FY 2011 reductions and FY 2012 reductions and are scheduled to be
implemented 7/1/2011.
Reductions to be Implemented 7/1/2011
9
FY 2010 and FY 2011 Reductions Previously Postponed with Non-Recurring Funds
FY 2012 Reduction Plan
*Excludes interdepartmental reductions

• The Social Security Administration (SSA) determines who receives disability benefits.
• Over the past 35 years, the SSA made a systematic error in the handling of about 300,000 cases of people who applied for disability.
• This resulted in some individuals receiving Supplemental Security Income (SSI) when they should have been receiving Social Security Disability Insurance (SSDI).
• SSA refers to the effort to correct this problem as the Special Disability Workload or SDW.
Background
• The SSA error has a cost impact to states because states were required to provide a portion of the funding for Medicaidbenefits to individuals who should have qualified for federally-funded Medicare benefits.
• Individuals receiving SSI automatically receive Medicaidbenefits. Medicaid is funded by the state and the federal government.
• Individuals receiving SSDI are eligible to receive Medicarebenefits after receiving SSDI for two years. Medicare is primarily funded by the federal government.
• This resulted in states being owed approximately $4.2 billion* for services provided to SDW cases that Medicare should have covered.
Financial Burden to States
Potential Credit to States
*Center for Health Care Financing at the Univ. of Mass. Med. School estimate.
• The federal government is in discussions on how to credit the amount owed to states for providing Medicaid services to those wrongfully identified as SSIs.
• If the federal government agrees to credit states, Tennessee could receive an estimated one-time payment of approximately $82 million.*
Special Disability Workload Dispute
Current Status
• Though the federal government is looking at the issue, there is no guarantee they will credit states.
• If the federal government does credit states, there is no certainty states will receive the funds during the 2012 fiscal year.
10

Conclusion
• The Bureau has been successful in the past solving difficult budget situations.
• TennCare has been able to reduce spending while improving program quality.• Previously TennCare was part of the budget problem. In recent years, TennCare
has been part of the budget solution to help the state through the recent economic downturn.
• We must make difficult decisions in order to continue to live within our means during these trying economic times.
• This recommended budget accounts for the loss of one-time funding and provides further reduction options that are needed given projected revenues.
• We are prepared to implement these changes while continuing to provide quality health care to 1.2 million Tennesseans.
11