Embed Size (px)
Citation preview

1
Tender Evaluation and Award Methodologies in Public
Procurement
Mats A. Bergman
Department of Economics, Södertörn University of South Stockholm, Sweden
e-mail: [email protected]
Sofia Lundberg (corresponding author)
Department of Economics, Umeå University, SE 901 87, Umeå, Sweden.
e-mail: [email protected]
Abstract
The EU procurement directives stipulate that public contracts are awarded to the lowest bidder or
to the bidder with the economically most advantageous offer; the latter requiring that a scoring
rule must be specified. We provide a simple theoretical framework for tender evaluation and
discuss the pros and cons of common scoring rules, e.g., highest quality (beauty contest) and
price-and-quality-based evaluation. Some descriptive facts are presented for a sample of Swedish
public procurements. We argue that the most common method, price-to-quality scoring, is flawed
for several reasons. It is non-transparent, making accurate representation of the procurer’s
preferences difficult. It is often open to strategic manipulation, due to dependence on irrelevant
alternatives, and it is unreasonably non-linear in bid prices. We prefer quality-to-price scoring,
where money values are assigned to different quality levels. When the costs of quality are
relatively well-known, however, lowest price is the preferable award criteria.
JEL Code: D44, H57
Key words: Public Contracts, Public Procurement, Scoring Rules, Quality

2
1. Introduction
Public procurement is an important government activity, with an estimated value corresponding
to 15 percent of world GDP. In the US, procurement contracts are usually awarded to the lowest
qualified bidder, although other methods have recently attracted interest (Bajari and Tadelis,
2009). In the EU, lowest price is used for slightly less than half of the contracts; a majority of the
contracts are awarded according to a combination of price and quality.1 Using both price and
quality in tender evaluation can enhance the efficiency of public procurement – but it also adds
complexity to the procedure. The tender evaluation methodologies that are used in practice are
often poorly designed. We argue that the application of simple economic principles can enhance
the effectiveness of tender evaluation.
According to EU’s procurement directives, Directives 2004/17/EC and 2004/18/EC, articles 55
and 53, respectively, the winning bidder in a public procurement auction can be nominated on
the basis of price only, subject to the bidder meeting minimum quality requirements, or,
alternatively, to the economically most advantageous bid. The economically most advantageous
bid can be the bid with the highest quality for a given price, in so-called beauty contests. It can
also be the bid that achieves the highest combined price and quality score. The latter method falls
into two main categories. First, quality can be evaluated in monetary terms, so that quality value
in excess of the minimum requirement can be subtracted from the price bid or, alternatively, so
that the value of the quality gap relative to the maximum quality level can be added to the price
bid. This method can be seen as a quality-adjusted lowest-price tender; here the expression
quality-to-price scoring will be used. Second, price can be transformed into a score that is added
to the quality score, making the tender a price-adjusted highest-quality tender. This procedure
will be called price-to-quality scoring.

3
Lowest-price tender evaluation is in principle straight-forward, although it may in practice be
challenging to define effective and appropirate minimum quality requirements, as well as to
weigh multiple prices into a single cost measure. Highest-quality tender evaluations (beauty
contests) can be more complicated. If quality is measured in more than one dimension, the
quality measures will have to be combined (weighed) into a single overall score, but, unlike
prices, they cannot simply be added together. This paper will focus on the related problem of
combining quality and price into a single overall score, using either quality-to-price or price-to-
quality scoring.
There appears to be a paucity of research that bridge the gaps between theoretical analyses of
abstract scoring rules and the practical application of scoring rules that can be used in real
procurement. One of the few exceptions is Dini et al (2006), which offer guidance also for
practitioners. For example, they emphisize the favourable properties of scoring rules that are
linear in prices. Asker and Cantillon (2008) demonstrate that scoring rules dominate beauty
contests, price-only auctions and menu auctions. Scoring rules should be designed to correspond
to the utility function of the procuring entity – although there may be strategic reasons to slightly
distort the utility of quality downward (Laffont and Tiole, 1987; Che, 1993). When bidders have
private information of a multidimensional nature and quality is contractible, scoring rules are
found to outperform bargaining models (Asker and Cantillon, 2010). In practice, however, it is
not apparent how to design a good scoring rule. Many of the methods used in actual
procurements have properties that are not desirable from an economic perspective.
Public procurement can be seen as a process in several steps, from the identification of needs via
design of the tender process, choice of methods for evaluating bids and contract design, to ex-
post control and contract enforcement mechanisms. This paper will focus on how already

4
identified needs can and should be expressed in a model for evaluating bids: a scoring rule. We
will discuss scoring rules from a theoretical perspective; to facilitate the analysis, we introduce a
graphical analysis of procurement when quality matters. Furthermore, we compare different
procurement schemes under uncertainty, drawing on environmental economics theory.
The main conclusion is that quality-to-price scoring is much to be preferred over price-to-quality
scoring. An appealing characteristic of the quality-to-price models is that they do not require
explicit weights; neither relative weights for price and quality, nor relative weights for different
quality criteria. The value of the different quality criteria can simply be added together and then
subtracted from the bid price.2 Further, in this paper we emphasize the importance of using a
scoring rule that reflects the preferences of the procuring authority or its principal, the society.
The importance of designing a scoring rule that reflects preferences is underlined by the fact that
public procurement is more and more becoming a policy tool. For example, contracts can be
allocated partly on the basis of environmental criteria when the procurement process is used as
an instrument for achieving environmental objectives.
We will also report the results of an empirical study of a sample of 189 Swedish public
procurements of four services: elderly care, waste transport, food wholesale services and
cleaning services. Price-only is used in more than one third of the procurements while scoring
rules that include both price and quality measures are used in more than half of the
procurements.3 Within this latter category, the large majority relies on scoring rules that from an
economic perspective has one or several undesirable properties, indicating that a proper
understanding of the complexities of scoring in two (or more) dimensions is essential for public
procurement.

5
This paper is organized as follows. A theoretical framework for procurement when quality
matters is outlined in Section 2. Price-to-quality and quality-to-price scoring rules are described
in Section 3, followed by price-only or quality-only scoring rules in Section 4. Weighing is
discussion in Section 5 and e-procurement is a topical subject among legislatures and
practicioners; its relation to scoring rules is discussed in Section 6. Section 7 deals with scoring
rules and bid evalution in practice, building on the findings from the Swedish survey. The suvery
results are discussed in more detail in Section 8. Conclusions are presented in Section 9.
2. Public procurement when quality matters – a theoretical framework
The ultimate goal of public procurement is to obtain adequately high quality at a low cost.
Similarly to a standard auction, achieving the objective requires competitive bidding, low
transaction costs and an absence of corruption and favouritism. However, public procurement
differs from standard auctions in that the quality of the product to be purchased often varies
between the different suppliers and can be influenced by the buyer. The procurement design
problem, therefore, tends to be more complex than designing an auction. In an auction, the
objective of the seller is typically just to maximize revenues. In a procurement auction, the buyer
will want both to optimize the quality and to minimize the cost of acquiring a product with that
quality.4 The problem of optimizing quality will be discussed at length below.
2.1 Observability and verifiability of ex ante and ex post quality
When analyzing quality, an important distinction is that between ex-post and ex-ante quality.
Sometimes the quality of the product to be purchased is fixed in advance (ex ante) and the
procurer’s problem is to evaluate quality before selecting the winner of the tender. This tends to
be the case when standardized goods are purchased. For example, there is little reason to believe

6
that an auto manufacturer or the manufacturer of standardized hospital equipment will degrade
product quality after having secured a public contract. In other settings, in particular for
specialized services, the quality is determined as the service is provided, i.e., after the contract is
won (ex post). Often it will be less costly to provide low-quality services, and then the provider
will have incentives to degrade quality. To prevent this from happening, some mechanism must
offer incentives to the contrary. Sometimes simple penalties for low quality or bonuses for high
quality will be sufficient.
Another important distinction is that between verifiable, observable but non-verifiable and non-
observable quality, respectively. Verifiable quality can be measured to the standard required by a
court; if quality is verifiable then penalties and bonuses are in principle sufficient to give the
provider incentives to deliver quality as promised in the tender. See e.g. Dellarocas et al (2006)
and Alabano et al (2006).
When quality is observable but not (directly) verifiable, the buyer must resort to other
mechanisms. In non-procurement markets with ex-ante observable quality, the buyer simply
selects products on the basis of price and quality. Even when quality is only observable ex post,
after the purchase has been made, the seller often has an incentive to provide high-quality
products. High quality will generate repeat customers and will preserve or enhance the seller’s
reputation and trademark value. Many consumers will be willing to pay a premium for premium
brands, even if quality is not observable prior to purchase and even if they do not plan to make
repeat purchases – exactly because they understand that reputation is valuable for the seller.
The procurement official cannot rely on subjective criteria, such as reputation, to overcome the
problem of non-observable or non-verifiable quality, at least not directly. One way around the

7
problem is to engage an expert panel that assesses quality. This method can be used when quality
is mainly determined ex ante. When quality is intrinsically non-verifiable while determined ex
post, the procuring organization can sometimes use customer evaluation schemes linked to
bonuses or penalties (Laffont and Tirole, 1993).
Another method is to rely on consumer choice. With a voucher system, a low-quality provider
will attract few customers and will therefore receive little payment. Customer demand may have
an impact even in the absence of competition. One example is public transport: low-quality
provision will push some potential commuters to travel by car or bike and may discourage casual
riders from travelling at all. Consequently, providers will have incentives to offer high quality
even in the absence of explicit bonuses or penalties.
If the procurer has the power to discretionally extend the duration of the contract beyond an
initial term, this gives further incentives to provide non-verifiable quality. In Sweden, procuring
entities have been considered to have the unilateral right to extend the duration of the contract, as
long as this option was mentioned in the call for tender. In other EU member states, the procurer
may have less discretion in exercising such options for extension.
2.2 The optimal combination of price and quality
In the following, the issues of ex-post observability and non-verifiable quality will be ignored,
even though they are important aspects of real-life procurement. Instead, we focus on ex-ante
quality optimization. To simplify the analysis, assume initially that the procurer has preferences
over a single quality dimension, in addition to preferences over money, as shown in Figure 1.
Quality increases along the horizontal axis and price and cost along the vertical axis. As quality
increases, the sellers’ cost of production rises, as illustrated by the upward-bending (convex)

8
production cost curve. Note that the cost curve represents the cost of producing a fixed quantity,
varying only the level of quality. Buyer utility, represented by the downward-bending (concave)
curves, increases downwards (as cost decreases, holding quality constant) and to the right (as
quality increases, holding price constant). The point of tangency between the cost curve and an
indifference curve represents the optimal combination of quality and cost, at (Q*, C*). The buyer
would be better off moving further down and to the right, but then prices would have to be set
below costs; presumably this will not happen.
Figure 1. The quality cost curve and the procurer’s preferences for quality and cost
Quality
Cost
Increasingutility
Production cost
Indifferencecurves
C*
Q*
•
•
•
•
•
•
In principle, the procurer may select any point along the production cost curve. In practice,
however, all quality levels may not be available. The procurer may be restricted to certain quality
levels that are available in the market. In the graph, the dots along the cost curve illustrate a
situation where six different versions of the product are available, each with its own combination
of quality and cost.

9
Also from the bidders’ perspective, choice may be restricted to offering one or a few price-and-
quality combinations. Assume that only one bid per bidder is allowed in the procurement
process. The bidder would obviously like to submit its most competitive combination of price
and quality. However, if the scoring rule is not transperant, the bidder may inadvertently submit
a non-optimal bid. This is likely to be unfortunate also for the procurer, since the bids will then
in general offer inoptimal qualities; also from a social perspective this will be ineffecicent. For
this reason, transperant scoring rules that match the procurer’s utility are likely to improve the
outcome.
2.3 Cost uncertainty and the competitive process
Assume initially that all producers are identical and that competition is intense. If the location of
the cost production curve is known to the procurer, there are several ways to structure the
procurement so as to yield the optimal combination of quality and price, (Q*, C*). First, the
procurer can specify that the minimum quality should be Q* and select the winner on the basis of
price only. This would actually correspond to the standard first-price sealed-bid auction with
reverse bidding and lowest bid winning (Vickrey, 1961). With strong competition, a price close
to C* will be offered and no firm will want to offer quality in excess of Q*. Second, the procurer
can set the price a C* and select the winner on the basis of quality only. If competition is strong,
the winner will offer to produce a quality close to Q*. Third, the procurer can specify a scoring
rule that reflects its utility function and select the bidder that offers the combination of quality
and price that results in the highest utility. With strong competition, we will again see a quality
and price combination close to the optimal one.

10
The third method differs in an important way from the first two. The procurer now no longer
needs to know the shape of the cost curve to achieve an optimal outcome. With competition in
price only or in quality only, respectively, optimization will not happen, except by coincidence,
unless the procurer knows the location of the cost curve. The policy conclusion is immediate. If
the costs of producing different qualities are well known to the procurer, price-only or quality-
only procurement can easily generate the optimal outcome. If the cost structure is not known to
the procurer, a scoring rule that combines price and quality is needed to achieve the optimum,
except in special cases that will be discussed below.
Assume now that instead of a large number of identical bidders (perfect competition), there are
only three bidders with different cost functions, as illustrated by Figure 2. Firm 3 can produce
quality Q3* at cost C*. If it sets price P3 such that P3 = C*, the procurer gets utility U3. The best
Firm 2 can offer the procurer, without incurring a loss, is quality Q2* at price P2=C*. (For
simplicity of exposition, we assume all firms have cost C* at their respective optimal quality
levels.) This would give the procurer utility U2. Firm 1 has even less to offer: quality Q1* at price
P1=C*, resulting in utility U1 for the procurer.
Figure 2. Equilibrium price and quality with heterogeneous bidders

11
If Firm 3 maximizes profit and if the firms know each other’s cost function, Firm 3 knows that it
can set a price above C* and still provide the most attractive combination of price and quality.
Specifically, it can raise price to (almost) P* while offering quality Q3*, since this will result in a
utility of (slightly more than) U2. Hence, the vertical distance P*-C* represents the profit
available to Firm 3.5 If the procurer truthfully represents its utility, it will be in the interest of the
bidders to offer the optimal quality level they can provide, because that will maximize the
available surplus.6
More generally, under imperfect competition the rivals will not know each other’s costs exactly.
The firms will still optimize quality, but they will now have to set a bid price that maximizes
their expected profit. First-price bidding for a public procurement contract is analogous to first-
price bidding in a private-value auction; we can therefore draw on standard results from auction
theory. Assume that the social surplus ui that bidder i can achieve (without making negative
profit) is drawn from a continuous distribution F(u) on [u, u ] that is identical for each bidder.
The realized draw is revealed for the bidder, but remains unknown for the other bidders.

12
However, it is common knowledge that the achievable surpluses are drawn from the same
distribution. The bidder should then offer the procurer a utility U=U(u) such that
(1)
in
u
ux
in
uF
dxxFuuU
))((
))(()(
Proof: See Klemperer (2004), p. 43. That is, the utility offered to the procurer is increasing in the
utility the bidder can achieve, it is lower than the achievable utility and as the number of bidders
increases, the bidder will bid closer and closer to the achievable utility.
In principle, scoring rules are easy do design. They should just correspond to the procuring
entity’s utility function.7 In practice, however, it is not apparent how to design a good scoring
rule. Many of the methods used in actual procurements have properties that are not desirable
from an economic perspective.
3. Price-to-quality or quality-to-price scoring
In standard economic theory, consumers are assumed to be risk averse. This is linked to the idea
that the marginal value of money (or consumption) falls as the consumer gets richer, which in
turn is linked to the so-called income effect. Due to the income effect, consumption of many
goods will increase with income. When analysing savings decisions and insurance markets, it is
critical to consider risk aversion and income effects. However, when looking at relatively small
purchases of standard goods, it is convenient to abstract away from income effects. When a
consumer considers how much ice-cream to buy, for example, we do not have to think too much
about the fact that the consumer will be slightly poorer after having bought the ice-cream. If it
can be assumed that there are no income effects, the utility function will be quasi linear so that

13
(2) U(Q, C) = V(Q) + B – C(Q)
where B is the consumer’s (or procurer’s) budget, V(Q) is the value assigned to a product with
quality Q and C(Q) is the cost of the product. The V(Q) and C(Q) functions are the non-linear
element of equation (2).
Figures 1 and 2 are in principle constructed from such utility functions. The exercise of finding
the best possible indifference curve is equivalent to finding the value of Q that maximizes the
above expression. If the budget and the cost enter linearly, as in equation (2), this exercise is
much simplified. If the price of the product to be procured is small relative to the procurer’s
budget, it does indeed seem reasonable to assume away income effects. In most situations, this is
likely to be the case. Even though the total value of all procurements is very large, almost all
individual procurements constitute only a small fraction of the procuring entity’s budget.8
Note that in equation (2), quality is transformed to money value, i.e., this is a quality-to-price
scoring rule. The price, C(Q), is subtracted from the monetary value of the quality, V(Q). Hence,
V(Q) is a function that transforms quality measure Q into money value V(Q). In a procurement
setting, the above expression is often written in inverse, as
(3) Evaluation price = C(Q) – V(Q)
where the procurer’s budget is left out of the equation. The submitted price C(Q) is discounted
with quality value V(Q). The bidder that submits the lowest evaluation price will be the
designated winner, but will be paid according to the before-discount price; this is equivalent with
selecting the bidder that offers the highest utility according to equation 21).

14
Looking at equation (2) it is obvious that it would be in the procurer’s interest not to procure if
the winning bid offers a negative incremental value, i.e., if V(Q) is less than C(Q). In equation
(4), if the quality-value function is expressed in absolute terms, this is equivalent with setting a
reservation price for the evaluation price at 0. I.e., only as long as the evaluation price is negative
should the procurement proceed. (In practice, the quality discount is often defined relative to
some benchmark quality, rather than in absolute terms, so a positive evaluation price does not
necessarily imply that the procurement is destroying value.)
Above, a quality-to-price scoring method has been described. In principle, there is nothing that
prevents the use of price-to-quality scoring. However, as long as we have reason to believe that
utility is linear in money – and this is the most natural assumption in almost all situations – the
final score must be linear in the bid. This means that the price score must be calculated as
(4) Price score = a+bC(Q)
This is of course easy to do. Less obvious is how to design a quality scale that is commensurate
with the bC(Q) term. In fact, the easiest way to achieve this would be to rely on the same value
function we had before, V(Q), and then just multiply that by the same b as we use for the price
score. To be specific, assume that the price score is calculated as
Price score = 5 – 5(C – 100)/100 = 10 – 0.05 C
Then quality can be scored as 0.05V(Q), using the same quality-value function as before. But this
seems to be a rather roundabout method for achieving the same thing!9 Note that the V(Q)
function is typically not linear. Increasing the quality (on some scale) from 100 to 101 is
generally not worth as much as the increase from 0 to 1.
15
It follows that in principle scoring rules with money as the unit of measurement and scoring rules
with quality points as the unit of measurement can be constructed to be equivalent. In spite of
this, we will distinguish between price-to-quality and quality-to-price scoring. That is because
often the price-to-quality scoring rules that are used in practice are not linear and, even if they
were, the close link between the quality scoring and the quality valuation is not recognized. The
main reason to prefer quality-to-price scoring over price-to-quality scoring is that in almost all
cases, valuation should be (almost) linear in bids. This will automatically be the case under
quality-to-price scoring, but often not in price-to-quality scoring. The latter can be due to non-
linearities in the price-to-quality transformation, due to non-linearities in quality valuation, or
both. Also, quality-to-price scoring allows bid evaluation to be performed in familiar units of
measurements (currency). Although consistent price-to-quality scoring is possible, it requires the
use of an unfamiliar unit of measurement.Further, price-to-quality scoring can make the bid
ranking dependent on irrelevant alternatives. We will discuss this argument, dependence on
irrelevant alternatives, in Section 7.
Although price-to-quality scoring can be designed so that bids are ranked according to the
procurer’s preferences, this is more complex than designing a good quality-to-price scoring.
According to our experience, price-to-quality scoring is often poorly designed. A likely reason is
that it is difficult to understand and design such rules. In Section 8, the practical application of
price-to-quality and quality-to-price scoring will be discussed in further detail.
4. Scoring rules, price only or quality only
As long as the procurer knows the exact location of the cost curve, it makes no difference if the
procurement mechanism is price only (with minimum quality criteria), quality only (at a fixed

16
price) or a price-and-quality scoring rule. However, if we abandon the assumption of perfect
information, this is no longer true.
A scoring rule that truthfully represents the utility function of the procurer will still result in the
optimal outcome.10
However, with reference to Figure 1, a price-only procurement that fixes
quality at Q* will no longer be equivalent with a quality-only procurement that fixes price at P*
if there is cost uncertainty.
The reason is that the loss due to ex-post inoptimality will now depend on the relative slopes of
the marginal benefit-of-quality curve and the marginal cost-of-quality curve. This can most
easily be seen in a graph representing marginal valuation of quality and the corresponding
marginal cost of production, as shown in Figure 3. The graph represents the marginal cost of
increasing quality, holding the quantity of output fixed. Around some quality level Q or Q* the
marginal cost of further quality increases begins to rise steeply. Also shown in the graph is the
marginal benefit (MB) of successive quality increases. As the graph is drawn, the marginal
benefit of improving quality falls only slowly. We assume that the marginal benefit is known
with certainty by the procurer.
Figure 3. Marginal cost and benefit of quality and the choice between price and quality
competition

17
The optimal quality level is Q* if the marginal cost of quality is given by MC*; assume that the
procurer believes that the marginal cost of quality will be given by MC*. The procurer may then
try to achieve optimum by fixing quality at Q* and arranging a price-only procurement.
Alternatively, the procurer may fix the price at P* and arrange a quality-only procurement. If the
true marginal cost of quality is indeed MC* the two procurement schemes will yield the same
outcome – the optimal outcome. However, if the true marginal cost of quality is actually MC
rather than MC*, then a price-only procurement will result in price P’, which is much higher than
the new optimal price P. The corresponding optimal quality level will now be Q. Producing at
quality level Q* is socially inefficient. The loss, relative to the optimum, corresponds to the
shaded area.
If the procurer had instead opted for a quality-only procurement, fixing price at P*, the result
would have been a much smaller relative loss, represented by the small triangle between the MB
curve and the MC curve and between quality levels Q’ and Q.

18
Under uncertainty, fixing price is in general preferable to fixing quality if the slope of the
marginal cost curve is steeper than the slope of the marginal benefit curve. Conversely, if the
marginal benefit curve is steeper, it is more efficient to fix quality. (See Weitzman, 1973.)
Note that representing the procurer’s utility function truthfully will still be optimal.11
With
reference to the graph, the procurer reveals its marginal benefit curve and announces that it will
give the contract to the bidder that offers the price and quality combination that results in the
largest consumer surplus. The maximum gross surplus is achieved by setting quality at the level
where the marginal benefit and the marginal cost are equally large.
From a policy perspective, the analysis of this section can be summarized as follows: If the
procurer has accurate knowledge of the cost of producing different levels of quality, relying on
lowest price with appropriate minimum quality requirements, on highest quality with price fixed
at an appropriate level or a price-and-quality scoring rule are equally efficient. With cost
uncertainty and if it is critical to achieve a certain quality level, lowest price (with minimum
quality requirements) is an efficient procurement mechanism. With cost uncertainty and if the
marginal cost of quality rises steeply, while the marginal valuation of quality is relatively
constant, quality only is an efficient procurement mechanism. With cost uncertainty and when
both the cost and the value of quality vary significantly with quality, quality-to-price scoring is
an appropriate method. Note that we are maintaining the assumption that quality is easily
observable and verifiable. Even so, incentive mechanisms may have to be put in place so that the
provider has incentives to deliver the quality that was promised in the tender.
5. Weighing

19
A single procurement can be for one product only, so that there is just one price to evaluate,
possibly together with a quality evaluation. Many if not most procurements, however, are for
more than one product. Then prices will typically be weighed into a single price index, before a
total score is calculated as a function of price and quality.12 In many situations the best way to
handle multiple prices is to weigh them with the expected purchase amounts according to
(5) Total cost = X1C1+X2C2+...+XnCn
where Xi, the expected purchase amount of product i, is used to weigh the price of product i. If
other weights are used, e.g., zero weights for some products, then bidders have incentives to set
very high prices for products with zero weight and very low prices for products with weights
greater than expected purchases.
There is nothing in principle that prevents the extension of the above arguments to the
procurement of products with multidimensional quality. This is most easily done with quality-to-
price scoring. Theoretically, the procurer should just use its utility function to score the different
bids. Maintaining the assumption of no income effect, the utility function will take the form
(6) U(Q1,Q2, ...,Qn, C) = V(Q1, Q2,...,Qn) + B – C
where B is the procurer’s budget and V(Q1, Q2,...,Qn) is the value assigned to a product with
qualities Q1, Q2,...,Qn in the n different quality dimensions. The analysis becomes simpler if we
can assume that the quality-value function takes the form
(7) V(Q1, Q2,...,Qn)=V1(Q1)+V2(Q2)+...+Vn(Qn)
Unfortunately, there is no general argument to justify such an assumption. It may well be that
different quality dimensions are substitutes or complements. For example, size and frequency of

20
departure are to some extent substitutes in public bus services. When departures are frequent
enough, the size of the busses becomes less importance. On the other hand, having multiple exits
is more important in a larger bus, making exits and seats complements. Still, in many cases it
may be reasonable to use a function form such as equation (7), to approximate the true utility
function, possibly with some additional non-linear terms when this is particularly important.
Eventually, prices will have been combined into a total price index, according to a function such
as (5), and different qualities will have been evaluated and added together, according to a
function such as (7). As a final step, the quality measure and the price measure will be combined
into a total score, according to the principles explain above.
The above method is potentially complicated by the fact that EU’s procurement directives
(Directive 2004/17/EC and Directive 2004/18/EC) recommend that the weights for price and
quality used for this operation be specified in advance. It has been argued, at least in the Swedish
context, that assigning values to quality characteristics is not the same as assigning weights.
However, from a mathematical point of view, using weights in quality-to-price scoring is a
redundant step that simply adds complexity.
To see this, assume that quality Q ranges from 0 to 100 and that each step is assigned gross value
v, so that a bid with quality Q gets a gross quality penalty of (100-Q)v. Assume that weight w is
assigned to (money) bid b and, accordingly, weight 1-w to quality, for a total score of
(8) wb + (1-w)(100-Q)v
Divide both sides by w to get
(9) b + (1-w)(100-Q)v/w

21
The original scheme, with price weight w and a gross quality value of v per quality point, is
equivalent to a scheme that gives equal weight to price and quality and with a quality value of (1-
w)v/w per quality point. It would seem that the latter scheme is more transparent and therefore to
be preferred.
Note also that even with pre-specified weights the ranking may be quite arbitrary, unless the
quality scale is well defined. To see this, assume that true quality (in some dimension) ranges
between 0 and 100. Assume, however, that we only measure quality over a more limited range,
say between 50 and 70, perhaps because we have minimum quality requirements and because we
are not interested in quality above a certain threshold. If we increase the range over which quality
is measured to between 40 and 80, say, while holding the bidders’ respective qualities fixed, the
importance of these quality differences will diminish. Doubling the range of measurement will
reduce quality-score differences by half, given that no firm offers a level of quality outside of
either scale’s range. In conclusion, with poorly specified quality scales – as often is the case with
price-to-quality scoring schemes – exact weights will not make the bid evaluation mechanism
transparent and predictable.
The policy conclusions are the following: When calculating the overall price, use the expected
purchase volumes for each component product as the weight. When calculating overall quality
value and when combining price and quality into a final score, weights are mathematically
redundant. If weights are required for legal reasons, use equal weights for price and quality.
6. Scoring and e-tendering
E-tendering with multiple quality attributes requires quality measurements in all relevant
dimensions, as well as the weights, to be precisely specified. In principle, quality-to-price and

22
price-to-quality scoring can both be used, but for the reasons given above the former is to be
preferred. Also, price weights should be set as closely as possible to the products’ share of
consumption. Assume that a quality value and costs are calculated according to equations (7) and
(5), respectively, so that
(10) EP = X1C1+X2C2+...+XnCn - V1(Q1)-V2(Q2)-...-Vm(Qm)
where EP is the evaluation price for a bid with prices C1 through Cn for the n products to be
bought in quantities X1 through Xn, Q1 through Qm are the quality measures attributed to the
bidder and V(Q1) through V(Qm) are the quality values assigned to these quality measures.13
All
of the bid prices will most likely be set in the auction, while the quality values may either be
open for bidding or fixed in advance, or a combination. For example, prior experience is
sometimes used as a measure of quality. Each bidder’s value in this dimension cannot be subject
to bidding. Other quality dimensions, however, such as the minimum number of staff in a care
unit or the number of seats in a buss, can be determined by the bidders. Provided that bids are
legally binding in these dimensions, they can be subject to bidding; this would require observable
and verifiable quality.
An interesting twist is that equation (10) allows for reservation prices to be set relatively easily.
Assume that, for all quality variables, quality is measured on a scale from 0 to some higher
value, where 0 is the minimum acceptable quality level. Assume also that the procurer values the
provision of quantities X1 through Xn with minimum quality to Vmin. Then the total value can be
calculated as
(11) Value = Vmin – EP

23
where EP is given by equation (10). If equation (11) generates a negative value for all bids,
the procurement should be cancelled. It follows that the reservation price PR is
(12) PR (Q1, Q2,...,Qm) = Vmin + V1(Q1) + V2(Q2) + ... + Vm(Qm)
Note that the reservation price depends on the quality that is promised. The bidders will
therefore, in general, have different reservation prices.
7. Scoring rules and bid evaluation in practice
Lunander and Andersson (2004) studied a sample of Swedish public procurements, mainly from
the early 2000s. They identified twelve main rules for tender evaluation, listed as rules I to XII
below
I Lowest price (Fixed quality)
II Highest quality (Fixed price)
Price-to-quality scoring rules
III Si = Smax x Plowest / Pi
IV Si = Smax - Smax x (Pi - Plowest)/Plowest
V Si = Smax x (Phighest - Pi )/(Phighest - Plowest )
VI Si = 1 + Smax - k if Pi belongs to the k:th best price interval, ranging from
lowest to highest price and where the length of the intervals are (Phighest -
Plowest)/(Smax)
VII As VI, but the steps are built around the mean price
VIII As VII, but the score falls symmetrically as price deviates from mean price
Quality-to-price scoring rules

24
IX EPi = Pi – bQi
X EPi = Pi + b(Qmax – Qi)
XI EPi = Pi (1-bQi)
XII EPi = Pi (1+b(Qi – Qmax)
In the formulae, the bid under evaluation is denoted Pi, the maximum submitted bid is Phighest, the
lowest submitted bid is Plowest and the maximum attainable price-to-quality score is Smax. Note
that Plowest is in practice sometimes replaced with Pmedian or Pmean. The score of bid i is denoted Si
for price-to-quality scoring rules. As before, EPi denotes the evaluation price of bid i with
quality-to-price scoring, Qi denotes quality of bid i and Qmax is the highest possible quality; b is
the value per quality point.14
The lowest price and highest quality rules avoid the problem of
weighing price and quality, but do, in the general case, require a weighing of different prices and
different qualities, respectively.
7.1 Price-to-quality scoring
All of the price-to-quality rules suffer, to varying degrees, from the problems discussed in
previous sections. It is difficult to design a price-to-quality rule so that it truthfully represents the
preferences of the procuring authority or those of its masters. A particular weakness that may
affect price-to-quality scoring becomes apparent when the rules are written explicitly: the
valuation of quality may depend on the bids and this can make the ranking of the bids dependent
on irrelevant alternatives and, consequently, susceptible to strategic manipulation. Futher, the use
of an endogenous reference price of any kind makes the scoring rule non transparent to the
bidders. If bidders, as in general is the case, only are allowed to submit one bid per contract they
may inadvertently submit a non-optimal bid. This is a problem for the bidders as well as the
society.

25
All of the above price-to-quality rules introduce one or several of the submitted bids into the
formula that is used to calculate the price score. If the score value of a given amount of money
depends on the bids, then the money value of a given quality difference will also depend on the
bids. Another implication of this kind of endogenity is that the ranking of the bids may depend
on irrelevant alternatives, so that the inclusion or exclusion of a non-winning bid may change the
ranking among the other bidders. The most drastic consequence is that strategic manipulation
becomes easy when the highest bid enters the formula. A high-quality high-cost bidder can
submit (or ask an accomplice to submit) an extremely high bid. This will all but eliminate the
importance of price in the assessment and therefore strongly favour high-quality bidders.
However, there is a way out. If price scoring is made relative to a reference price (or to two
reference prices, one upper and one lower) set by the procurer, the ranking will no longer depend
on irrelevant alternatives and strategic manipulation will no longer be possible. However, none
of the Swedish procurements used pre-specified reference prices, neither in Lunander and
Andersson’s study, nor in the current study.
It seems quite arbitrary that Swedish procurers have converged on the specific rules listed above.
For example, a more general version of the Rule III is Si = Smax x (Plowest/Pi)k, where k is a
constant, while a more general version of the Rule IV is Si = Smax – kSmax x (Pi –Plowest)/Plowest.15
In practice, Rule IV is often written as Si = Smax - Smax x (Pi – Plowest)/(Phighest – Plowest) or Si
= 1 + (Smax – 1) x (Phighest – Pi)/(Phighest – Plowest).
Rule VI is a step-function version of Rule V and consequently suffers from the same problem. In
addition, the discontinuities at the steps create additional distortions. Rules VII and VIII build on

26
the mean bid, a property that does not resolve any of the problems mentioned so far. Rule VIII
favours bids close to the mean, which mainly has the effect of weakening competition.16
In a choice among Rules III through VIII, the first two rules are the most attractive, because they
are less easy to manipulate. Here, only low-price bids can be used to influcence the outcome and
low bids stand the risk of being nominated the winning bid. They are also the rules that are used
most often in practice, together with Rule I, lowest price.
Overall, we agree with Dini et al (2006) in concluding that exogenous reference prices should be
used if the procurer wishes to use a price-to-quality scoring rule. In principle, the scores and the
reference price(s) can be calibrated so that the monetary value of quality differentials reflects the
procurer’s utility function. In most situations it can be presumed that utility is virtually linear in
money and hence that a reference-price version of Rules IV or V is to be preferred over a version
of Rule III. However, a more direct way to achieve this is to use rules that directly value quality;
we now turn to such rules.
7.2 Quality-to-price scoring
The procurer can set a monetary value on the quality offered by the bidders and this value can be
combined with the bid in two alternative ways. Either quality in excess of the minimum quality
level gives a value that is subtracted from the bids to get an evaluation price, or the difference
between the offered quality and the maximum quality level results a penalty that is added to the
bid to get the evaluation price. The quality discounts or surcharges can be either absolute,i.e., the
same for all bidders, or they can be proportional to the bidder’s own bid. This gives four possible
rules, corresponding to Rules IX through XII.

27
The evaluation prices, EP, will only be used to assign the winning bidder; bidders will be paid
according to their nominal bids. Obviously, using relative surcharges or penalties means that an
identical quality variation will be assigned different values, depending on the bid price. For this
reason, Rules IX and X are to be preferred over the two alternative quality-to-price scoring rules.
8. A survey of evaluation practices for four product categories
We studied public procurement within four product categories in Sweden during the 2002 to
2009 period. The categories were elderly care (nursing homes), waste disposal, food wholesale
services and cleaning services. Most of the buyers were Swedish municipalities and all
procurements followed the Public Procurement Act, which in turn is derived from EU’s
procurement directives.17
The procurements were identified by searching two commercial public procurement tender
databases (OPIC and Allego) and a publicly owned web service for public procurement (e-
avrop). From the tender documents, the bid evaluation and the formal decision the following
information was extracted: Type of product (four categories), Date of tender, Length of contract,
Options for contract extensions (zero, one or two), Length of extension/s, Type of procurement
mechanism (simplified, open or restricted), Number of contracts corresponding to each tender,
Number of bidders, Scoring rule (12 types, as listed above). Table 1 gives some descriptive
statistics for the four types of services.
Table 1. Descriptive statistics for four procured product categories
Type of service
Variable Elderly care Waste disposal Food
wholesaling
Cleaning
services
Time period 2002-2008 2006-2008 2007- 2008 2006-2009
Number of 85 33 32 39

28
procurements
Number of contracts 125 53 66 126
Mechanism
Simplified 85 8 16 24
Open 0 25 16 14
Restrictive 0 0 0 1
Since elderly care is a so-called B-service according to EU’s procurement rules, the simplified
mechanism can be used irrespective of value. For the other services, the simplified mechanism
can only be used below a value threshold. The fact that the simplified mechanism is used more
often for food than for waste disposal, and even more often for cleaning services, implies that the
contract value tends to be the largest for waste disposal and the smallest for cleaning services.
Table 2 gives additional information. It can be seen that the average number of contracts per
tender ranges from 1.5 to 3.2, although 77 percent of all tenders result in a single contract. The
number of bidders per contract ranges from 2.2 for food wholesale services to 6.4 for cleaning
services; 6.2 percent of all tenders attracted only one bidder.
In most cases there was an option to extend the duration of the contract. The average contract
length varied between two and just over three years, while the extension period varied, on
average, between 1.5 and 2.5 years. Including the contract extension, the contracts lasted on
average six years for elderly care and waste management and a little more than three years for
cleaning services and food wholesaling. Relative to the initial contract period, the extension
period represented about 75 percent for cleaning services and food wholesaling. For elderly care
the average contract could be extended by about two thirds while the waste management
contracts could be extended by about 50 percent.
29
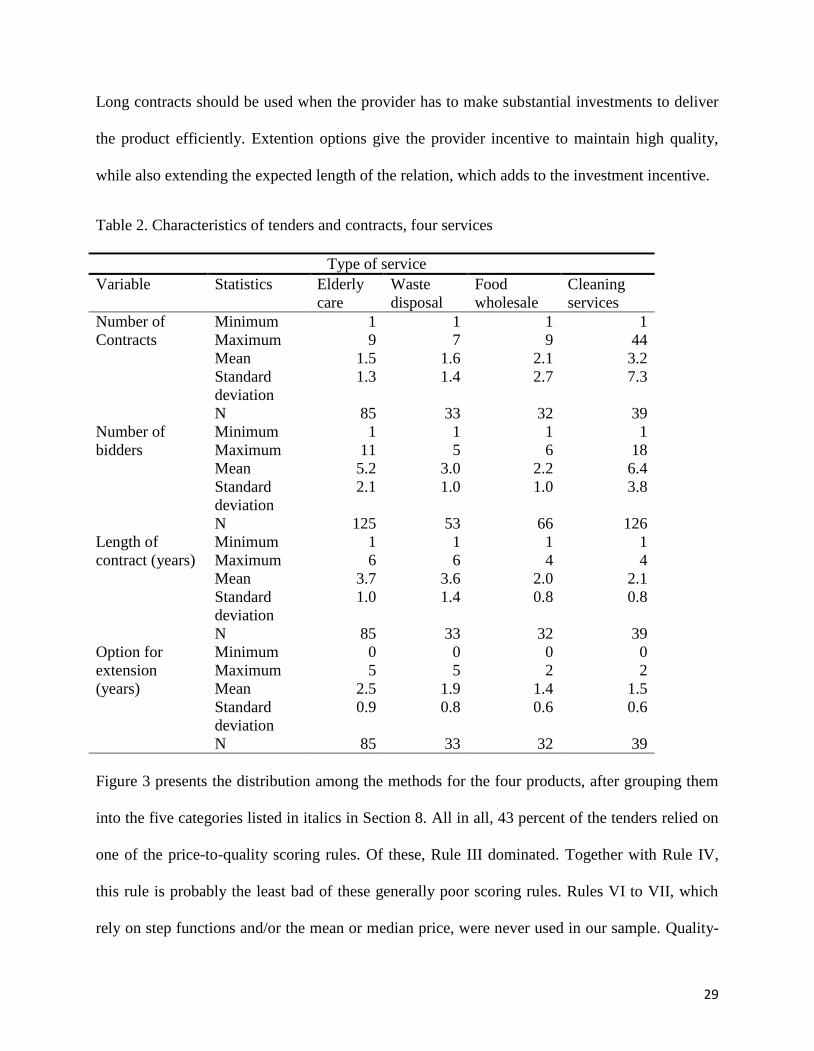
Long contracts should be used when the provider has to make substantial investments to deliver
the product efficiently. Extention options give the provider incentive to maintain high quality,
while also extending the expected length of the relation, which adds to the investment incentive.
Table 2. Characteristics of tenders and contracts, four services
Type of service
Variable Statistics Elderly
care
Waste
disposal
Food
wholesale
Cleaning
services
Number of
Contracts
Minimum 1 1 1 1
Maximum 9 7 9 44
Mean 1.5 1.6 2.1 3.2
Standard
deviation
1.3 1.4 2.7 7.3
N 85 33 32 39
Number of
bidders
Minimum 1 1 1 1
Maximum 11 5 6 18
Mean 5.2 3.0 2.2 6.4
Standard
deviation
2.1 1.0 1.0 3.8
N 125 53 66 126
Length of
contract (years)
Minimum 1 1 1 1
Maximum 6 6 4 4
Mean 3.7 3.6 2.0 2.1
Standard
deviation
1.0 1.4 0.8 0.8
N 85 33 32 39
Option for
extension
(years)
Minimum 0 0 0 0
Maximum 5 5 2 2
Mean 2.5 1.9 1.4 1.5
Standard
deviation
0.9 0.8 0.6 0.6
N 85 33 32 39
Figure 3 presents the distribution among the methods for the four products, after grouping them
into the five categories listed in italics in Section 8. All in all, 43 percent of the tenders relied on
one of the price-to-quality scoring rules. Of these, Rule III dominated. Together with Rule IV,
this rule is probably the least bad of these generally poor scoring rules. Rules VI to VII, which
rely on step functions and/or the mean or median price, were never used in our sample. Quality-

30
to-price scoring was used in about 13 percent of the procurements, most commonly for elderly
care and waste management. Rules with relative discounts or surcharges were about twice as
common as rules with absolute discounts.
Competition in quality only, i.e., procurement with a fixed price, was used in 6 percent of the
cases, but only for procurement of elderly care. Within this product category it was used for 13
percent of the procurements. Evaluation on price only was used in 36 percent of all
procurements. In four cases, corresponding to about two percent of the procurements, the method
for evaluation was not specified. This is remarkable, given that the legislation requires that the
method for evaluation should be made known to the potential bidders.
Figure 3. Distribution of method for scoring by product category.
Elderly care apparently differs from the other product categories. Rules that convert price into a
score are used less often while quality valuation and pure quality competition (fixed price) are

31
used more often. A Chi-2 test confirms that the hypothesis that all four services have the same
underlying distribution can be rejected at the 5 percent level. The same test applied to the other
three services shows that the hypothesis that they are drawn from the same distribution cannot be
rejected (p-value 0.62). We conclude that procurements of elderly care do indeed differ from
procurements for the other product categories.
9. Conclusions
In many situations pure price competition in combination with appropriate compulsory quality
conditions or, alternatively, pure quality competition, will be appropriate. The former method is
primarily applicable when there is little uncertainty concerning production costs for different
product specifications or when it is important to reach a minimum quality threshold. The latter
method is appropriate when it is not critical to achieve a particular quality level, but when there
are reasons to believe that excessive quality will be very expensive. A weighing of price and
quality may be a good choice when there is uncertainty regarding what combinations of price and
quality are achievable, while quality is not too difficult to measure and verify.
Another main conclusions is that if a scoring rule based on both quality and price is used, then
the procuring authority should put a monetary value on quality that can be added to or subtracted
from the actual bids, rather than calculate a price score that can be added to a quality score. That
is, quality-to-price scoring should be preferred over price-to-quality scoring. The primary reason
for this is that we are all used to thinking in monetary terms and to make choices between
products that differ in terms of quality and price. Quality valuation as a method for bid
evaluation also has the advantage that the ranking of the bids will not depend on irrelevant
alternatives (non-competitive bids) due to an endogenously determined reference prices,

32
although dependence on irrelevant alternatives is not an unavoidable consequence of price-to-
quality scoring. Furthermore, there are good theoretical reasons to believe that valuation should
be close to linear in bid prices, something that automatically follows from using our preferred
method.
We can speculate that the main attraction of price-to-quality scoring to practitioners,
paradoxically, has been that it is not transparent. Since it is difficult to understand the
implications of a particular scoring rule, the procuring authorities have not been impelled to
consider their preferences in detail and it has been difficult, for them and for other concerned
parties, to object against a proposed formula. The opaqueness of the rules has also hidden the
fact that many versions of price-to-quality scoring do not treat bidders equally. In particular, non-
linear functions for price scores implies that different bidders will have to reduce their prices by
different amounts in order to improve their score by a given amount. We argue, therefore, that
price-to-quality scoring, as applied in practice, often violates both the transparancy principle and
the principle of equal treatment enshrined in EU’s procurement rules. From a mathematical point
of view, there is no need to weigh price and quality when using quality-to-price scoring; the
weighing follows implicitly from the quality values. If there is a legal requirement to apply
formal weights, equal weights should be given to price and quality.
To summarize, the policy recommendations are as follows: If bids are to be evaluated according
to a combination of price and quality, this should be done by asigning monetary values to quality
characteristics (quality-to-price scoring), rather than by transforming bid prices into scores
(price-to-quality scoring). Total value should, in almost all situations, be linear in bid prices. This
follows automatically from the quality-to-price scoring, but can also be achieved with price-to-
quality scoring. If price-to-quality scoring should at all be used, it should be based on pre-

33
specified reference prices. Whether quality-to-price scoring is based on quality discounts or on
quality surcharges is inconsequential, but absolute discounts or surcharges are to be prefered
over relative ones. Quality-to-price scoring makes explicit weighting redundant.
If several quality dimensions are combined before quality is valued in monetary terms, then the
quality scales should be of equal length, in particular if uneven weights are applied to the
different quality measures. In most situations, however, it would appear better to value quality
first and then aggregate, rather than the opposite. Calculations of total price (or cost) should be
based on actual purchases or the best possible prediction of actual purchases. In particular, it is
not recommended that total price (cost) is calculated from a few “representative” products when,
in fact, a large number of different products will actually be purchased.
In non-complex situations, when the cost of producing to different quality levels are well known,
lowest price, being a simple and robust method, is to be preferred. Highest quality may be a
better choice when there is cost uncertainty and when the marginal cost of quality rises steeply,
so that a lowest-price tender can result in unpleasantly large cost surprises. In other situations,
quality-to-price scoring may be the best response to cost uncertainty.
10. References
Albano, Gian Luigi, Milo Bianchi and Giancarlo Spagnolo, 2006, Bid Average Methods in
Procurement, Rivista di Politica Economica, 1-2, 41-62.
Asker, John and Estelle Cantillon, 2008, Properties of Scoring Auctions, Rand Journal of
Economics, 39(1): 69-85.
Asker, John and Estelle Cantillon, 2010, Procurement when Price and Quality Matter, Rand

34
Journal of Economics, 41(1): 1-34.
Bajari, Patrick, and Gregory Lewis, 2009, Procurement Contracting with Time Incentives:
Theory and Evidence, NBER Working Paper No. w14855.
Bergman, Mats, Hans Christian Sundelin Svendsen and Johan Y. Stake, Samordnade ramavtal –
en empirisk undersökning, Report for the Swedish Competition Authority No xx (in Swedish).
Che, Yeon-Koo, 1993, "Design Competition through Multidimensional Auctions" Rand Journal
of Economics 24(4): 668-680.
Decarolis, Francesco, 2009, When the Highest Bidder Loses the Auction: Theory and Evidence
from Public Procurement, Band of Italy Working Paper No 717
Dellarocas, Chrysantanos, Dini Federico, and Giancarlo Spagnolo, 2006, “Designing Reputation
Mechanisms”, in Handbook of Procurement, Nicola Dimitri, Gustavo Piga and Giancarlo
Spagnolo (Eds), Cambridge University Press
Dini, Federico, Riccardo Pacini and Tommaso Valletti, 2006, Scoring Rules, in
Handbook of Procurement, Nicola Dimitri, Gustavo Piga and Giancarlo Spagnolo (Eds),
Cambridge University Press
GHK, 2010, Evaluation of SMEs’ Access to Public Procurement Markets in the EU, Report to
DG Enterprise and Industry
Laffont, Jean-Jacques and Jean Tirole, 1987, Auctioning Incentive Contracts, Journal of Political
Economy, 95(5): 921-937.

35
Laffont, Jean-Jacques and Jean Tirole, 1993, A Theory of Incentives in Procurement and
Regulation, The MIT Press
Lunander, Anders and Arne Andersson, 2004, Metoder vid utvärdering av pris och kvalitet i
offentlig upphandling. En inventering och analys av utvärderingsmodeller inom offentlig
upphandling. The Swedish Competiton Authority, Commission Report: 2004:1 (In Swedish).
Weitzman, Martin L, 1974, Prices vs. Quantities, Review of Economic Studies, 41(4): 477-91.
Vickrey, William, 1961, Counterspeculation, Auctions and Sealed Tenders, Journal of Finance,
16, 8-37.

36
Notes
1 Máté Péter Vincze, GHK, personal communication. See also GHK, 2010.
2 Assuming the value of high quality is subtracted from bid price. As explained below, low quality penalties can also
be added to the bid price. If, e.g. for legal reasons, weights must be specified, then equal weight for price and quality
should be used. 3 Similar results are reported by Bergman et al, 2010.
4 When multiple units are to be sold, such as lots of radio spectrum, auction design can be quite complicated,
although the quality of the units is largely independent of the auction design. Procurement can obviously involve
multiple units as well, but again the quality of each procured unit can be influenced by the tender evaluation
methodology and criteria. 5 This is true if the scoring rule is linear in the bid; see Asker and Cantillon, 2008. It is then optimal to offer the same
quality at a higher price, since, for a given quality, the slope of all indifference curves will be the same. This follows
from the scoring rule (or preferences) being linear in the bid; we discuss this property in the next section. 6 It may be in the interest of the procurer to distort its preferences in order to induce more competition. It will want
to claim that it values quality less than it does, because this will make the other firms better substitutes for the best
firm and this, in turn, will decrease the rent available to the winner. See Asker and Cantillon, 2008. They argue,
however, that the benefits from misrepresenting the utility function tend to be small. 7 Ignoring strategic reasons to distort preferences; see the previous footnote.
8 In situations where this may not be true, such as when purchasing a new series of fighter aircraft or when deciding
to build a dedicated high-speed rail track, income effects will at least implicitly be considered by the politicians that
chose between competing uses of funds. Similarly, when a government’s top-level budget is implemented it is
relevant to consider income effects. 9 Another way of expressing this is to say that quality should be valued in some currency unit that is not the one we
are used to, say Euro, but one that is (in this case) worth about 1/0.05=20 times as much per unit, such as
(approximately) one gram of gold. 10
Assuming that competition is intense. 11
Except for the possible strategic reasons to bias quality valuation downwards. 12
Total cost (or weighted price) can enter nonlinearly into the utility function if there are income effects, but it
would not make sense to let individual prices enter nonlinearly. Given that we have decided what to procure, it can
only be the total cost that matters. 13
The winning bidder should be paid according to the equation (5), not according to the evaluation cost. 14
Or, with rule XI and XII, the value per quality point expressed as a fraction of the bid price. 15
Note that if k = Plowest/(Phighest – Plowest), then the generalization of Rule IV coincides with the Rule V. Also, with
exogenous reference prices Rules IV and V are mathematically equivalent. 16
Albano et al, 2006, and Decarolis, 2009, discuss properties of average bid auctions. 17
See also Bergman and Lundberg, 2009.