Embed Size (px)
Citation preview

G E O M A T I C A
TEN YEARS OF TECHNOLOGY ADVANCEMENTIN REMOTE SENSING AND THE RESEARCH INTHE CRC-AGIP LAB IN GGE
Yun Zhang, Department of Geodesy and Geomatics EngineeringUniversity of New Brunswick, Fredericton, New Brunswick
This paper briefly reviews the development of remote sensing technologies in the last ten years, includingthe development of optical, radar, and laser sensors and the trend of remote sensing software development. Italso introduces some of the research activities and achievements of the Canada Research Chair Laboratory inAdvanced Geomatics Image Processing (CRC-AGIP Lab) in the Department of Geodesy and GeomaticsEngineering (GGE) at the University of New Brunswick (UNB). According to literature review and ourresearch experience, we have concluded that the “bottle neck” of remote sensing is still the lack of softwaretools for effective information extraction from remote sensing data, especially after the rapid advancementof remote sensing sensor technologies in the last ten years and the increased demand for quickly updated,accurate geo-spatial information.
1. Introduction
In the last ten years, remote sensing technolo-gies and remote sensing applications have beenexperiencing a revolutionary advancement in vari-ous areas, including sensor development, softwaredevelopment, and applications.
1.1 Remote SensingSensor Development
In the area of sensor development, all of thesensor technology domains (optical, radar, andlaser) have exhibited evidence of the revolution:
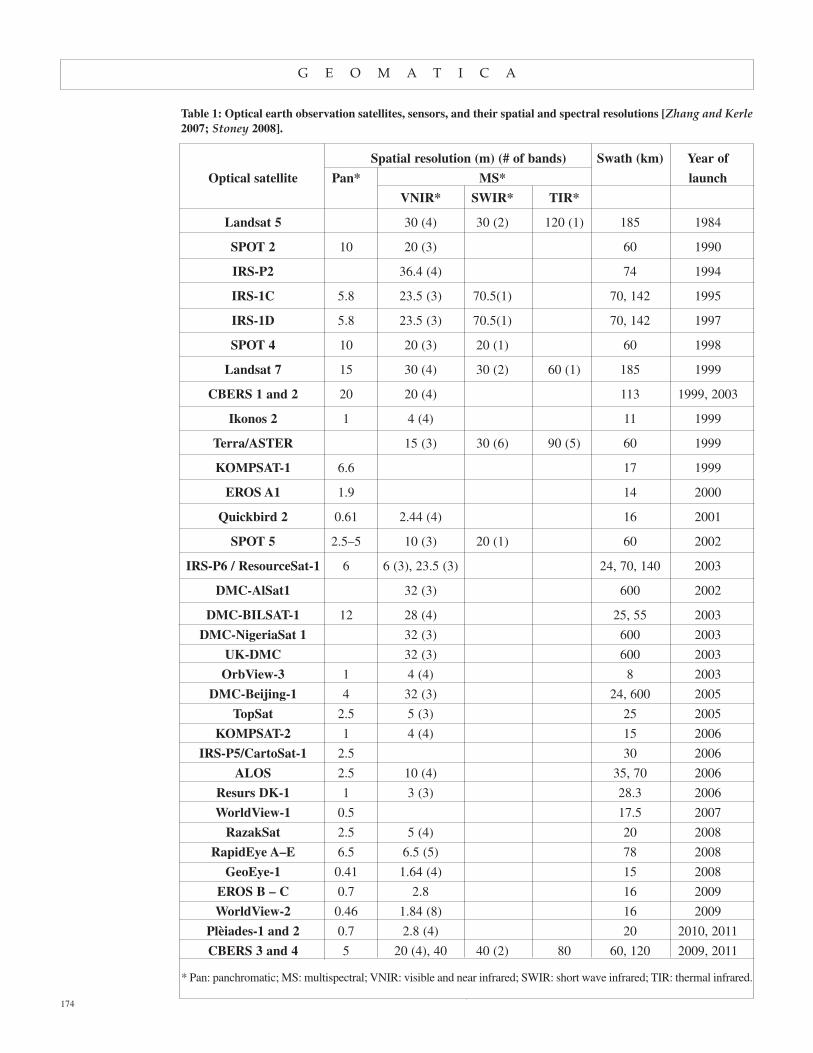
• In optical remote sensing: 1) The spatial resolution of satellite images
dramatically increased from tens of metresto metres and to sub-metre (Table 1). Thisallows users to see increased detail of theearth’s surface, from streets and buildings10 years ago to cars and even individualpeople now.
2) The first digital aerial cameras were pre-sented to the photogrammetric community
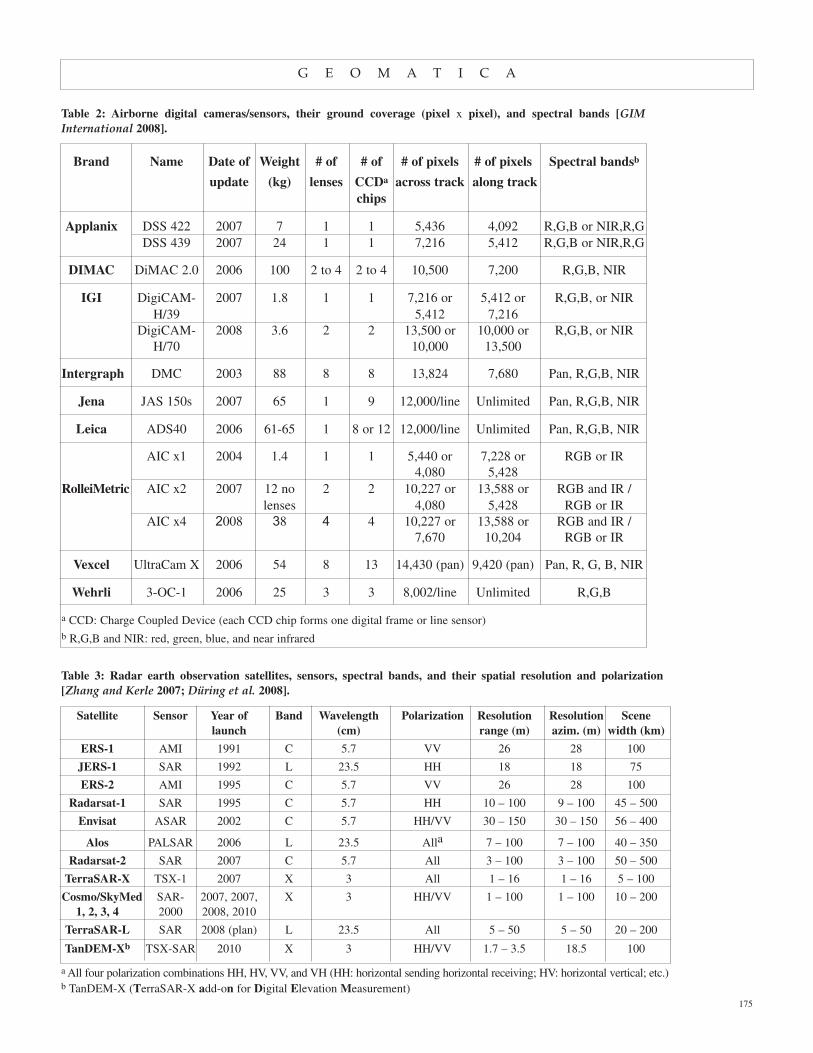
in 2000 at the ISPRS congress inAmsterdam. Now, digital airborne cam-eras/sensors with 50-cm to 5-cm resolu-tion are increasingly used by the mappingindustry (Table 2). Traditional film-basedcameras are being gradually phased out.
• In radar remote sensing: 1) The spatial resolution of radar images has
also increased from tens of metres tometre level (Table 3).
2) More importantly, the sensor capacity hasimproved from collecting single-polariza-tion images to capturing multi-polarizationimages (Table 3). This improvement providesmore textural information of land cover typesand allows for better land cover classification.
• In laser remote sensing: 1) Laser was invented in 1960 [Lidar Remote
Sensing Overview 2007]. The use ofLiDAR (Light Detection and Ranging) forproducing high-accuracy digital elevation
GEOMATICA Vol. 64, No. 2, 2010 pp. 173 to 189
Cet article examine brièvement le développement des technologies de télédétection au cours des dixdernières années, y compris le développement des capteurs radars, optiques et lasers et les tendances dudéveloppement des logiciels de télédétection. Il présente également certaines activités de recherche et certainesréalisations du Laboratoire des chaires de recherche en traitement de pointe des images de la géomatique(CRC-AGIP Lab) du Département de géodésie et de génie géomatique (GGE) de l’Université du Nouveau-Brunswick (UNB). À la suite d’une analyse documentaire et de notre expérience de recherche, nous avonsconclu que le « goulot d’étrangement » de la télédétection demeure toujours le manque d’outils logicielspermettant d’extraire des renseignements utiles des données de télédétection, plus particulièrement après leprogrès rapide des technologies de télédétection au cours des dix dernières années et l’augmentation de lademande d’information géospatiale précise et rapidement actualisée.
G E O M A T I C A
174
Table 1: Optical earth observation satellites, sensors, and their spatial and spectral resolutions [Zhang and Kerle2007; Stoney 2008].
Spatial resolution (m) (# of bands) Swath (km) Year of
Optical satellite Pan* MS* launch
VNIR* SWIR* TIR*
Landsat 5 30 (4) 30 (2) 120 (1) 185 1984
SPOT 2 10 20 (3) 60 1990
IRS-P2 36.4 (4) 74 1994
IRS-1C 5.8 23.5 (3) 70.5(1) 70, 142 1995
IRS-1D 5.8 23.5 (3) 70.5(1) 70, 142 1997
SPOT 4 10 20 (3) 20 (1) 60 1998
Landsat 7 15 30 (4) 30 (2) 60 (1) 185 1999
CBERS 1 and 2 20 20 (4) 113 1999, 2003
Ikonos 2 1 4 (4) 11 1999
Terra/ASTER 15 (3) 30 (6) 90 (5) 60 1999
KOMPSAT-1 6.6 17 1999
EROS A1 1.9 14 2000
Quickbird 2 0.61 2.44 (4) 16 2001
SPOT 5 2.5–5 10 (3) 20 (1) 60 2002
IRS-P6 / ResourceSat-1 6 6 (3), 23.5 (3) 24, 70, 140 2003
DMC-AlSat1 32 (3) 600 2002
DMC-BILSAT-1 12 28 (4) 25, 55 2003
DMC-NigeriaSat 1 32 (3) 600 2003
UK-DMC 32 (3) 600 2003
OrbView-3 1 4 (4) 8 2003
DMC-Beijing-1 4 32 (3) 24, 600 2005
TopSat 2.5 5 (3) 25 2005
KOMPSAT-2 1 4 (4) 15 2006
IRS-P5/CartoSat-1 2.5 30 2006
ALOS 2.5 10 (4) 35, 70 2006
Resurs DK-1 1 3 (3) 28.3 2006
WorldView-1 0.5 17.5 2007
RazakSat 2.5 5 (4) 20 2008
RapidEye A–E 6.5 6.5 (5) 78 2008
GeoEye-1 0.41 1.64 (4) 15 2008
EROS B – C 0.7 2.8 16 2009
WorldView-2 0.46 1.84 (8) 16 2009
Plèiades-1 and 2 0.7 2.8 (4) 20 2010, 2011
CBERS 3 and 4 5 20 (4), 40 40 (2) 80 60, 120 2009, 2011
* Pan: panchromatic; MS: multispectral; VNIR: visible and near infrared; SWIR: short wave infrared; TIR: thermal infrared.
G E O M A T I C A
175
Table 2: Airborne digital cameras/sensors, their ground coverage (pixel x pixel), and spectral bands [GIMInternational 2008].
Brand Name Date of Weight # of # of # of pixels # of pixels Spectral bandsb
update (kg) lenses CCDa across track along trackchips
Applanix DSS 422 2007 7 1 1 5,436 4,092 R,G,B or NIR,R,GDSS 439 2007 24 1 1 7,216 5,412 R,G,B or NIR,R,G
DIMAC DiMAC 2.0 2006 100 2 to 4 2 to 4 10,500 7,200 R,G,B, NIR
IGI DigiCAM- 2007 1.8 1 1 7,216 or 5,412 or R,G,B, or NIRH/39 5,412 7,216
DigiCAM- 2008 3.6 2 2 13,500 or 10,000 or R,G,B, or NIRH/70 10,000 13,500
Intergraph DMC 2003 88 8 8 13,824 7,680 Pan, R,G,B, NIR
Jena JAS 150s 2007 65 1 9 12,000/line Unlimited Pan, R,G,B, NIR
Leica ADS40 2006 61-65 1 8 or 12 12,000/line Unlimited Pan, R,G,B, NIR
AIC x1 2004 1.4 1 1 5,440 or 7,228 or RGB or IR4,080 5,428
RolleiMetric AIC x2 2007 12 no 2 2 10,227 or 13,588 or RGB and IR /lenses 4,080 5,428 RGB or IR
AIC x4 2008 38 4 4 10,227 or 13,588 or RGB and IR /7,670 10,204 RGB or IR
Vexcel UltraCam X 2006 54 8 13 14,430 (pan) 9,420 (pan) Pan, R, G, B, NIR
Wehrli 3-OC-1 2006 25 3 3 8,002/line Unlimited R,G,B
a CCD: Charge Coupled Device (each CCD chip forms one digital frame or line sensor)b R,G,B and NIR: red, green, blue, and near infrared
Table 3: Radar earth observation satellites, sensors, spectral bands, and their spatial resolution and polarization[Zhang and Kerle 2007; Düring et al. 2008].
Satellite Sensor Year of Band Wavelength Polarization Resolution Resolution Scene launch (cm) range (m) azim. (m) width (km)
ERS-1 AMI 1991 C 5.7 VV 26 28 100
JERS-1 SAR 1992 L 23.5 HH 18 18 75
ERS-2 AMI 1995 C 5.7 VV 26 28 100
Radarsat-1 SAR 1995 C 5.7 HH 10 – 100 9 – 100 45 – 500
Envisat ASAR 2002 C 5.7 HH/VV 30 – 150 30 – 150 56 – 400
Alos PALSAR 2006 L 23.5 Alla 7 – 100 7 – 100 40 – 350
Radarsat-2 SAR 2007 C 5.7 All 3 – 100 3 – 100 50 – 500
TerraSAR-X TSX-1 2007 X 3 All 1 – 16 1 – 16 5 – 100
Cosmo/SkyMed SAR- 2007, 2007, X 3 HH/VV 1 – 100 1 – 100 10 – 2001, 2, 3, 4 2000 2008, 2010
TerraSAR-L SAR 2008 (plan) L 23.5 All 5 – 50 5 – 50 20 – 200
TanDEM-Xb TSX-SAR 2010 X 3 HH/VV 1.7 – 3.5 18.5 100
a All four polarization combinations HH, HV, VV, and VH (HH: horizontal sending horizontal receiving; HV: horizontal vertical; etc.)b TanDEM-X (TerraSAR-X add-on for Digital Elevation Measurement)

G E O M A T I C A
models (DEMs) was brought about by thedemand for mass DEMs from the telecom-munications boom in the 1990s [LiDAR—Overview 2006].
2) In the last ten years, airborne LiDAR sen-sor technology has developed to the stageof maturity, which can capture highlyaccurate terrain data through the collectionof xyz point clouds in a highly automatedfashion [LiDAR—Overview 2006; GIMInternational 2009] (Table 4).
1.2. Remote SensingSoftware Development
In the area of software development, severalbreakthroughs have been achieved to more effec-tively utilize and extract information from availableremote sensing images, despite the reality that itsprogress is still far behind the advancement of the
sensor technology and the demand from end usersto solve real-world problems. For example:
• In optical remote sensing: 1) More than 80% of the modern earth obser-
vation satellite sensors and many airbornedigital cameras simultaneously collecthigh-resolution panchromatic (Pan) andlow-resolution multispectral (MS) images.The demand for effectively sharpeninglow-resolution MS images using high-res-olution Pan images has been growing rap-idly. However, traditional image fusion(also called pan-sharpening) algorithmsand software tools could not produce sat-isfactory pan-sharpening results, eventhough operators’ intervention wasrequired in the fusion process to achievethe best possible results. • To solve this problem, the first fully
automated pan-sharpening software
176
Table 4: Airborne LiDAR sensors, vertical and horizontal precisions, and maximum point density [GIM International 2009].
Brand Name Date of Weight Wave- Elevation Overall Max. # / no. of points/m2
update (kg) length precision planimetric (nm) at 1km precision
(cm) (cm)
Airborne Dragon 2008 25 1,000 GPS/INS GPS/INS 50 @ 150m, 300kHz, 20m/sHydro- Eye Pending Pending
graphy AB Hawk Eye 2006/ 95 532 / Bathy<50 Bathy<5m Bathy 1/m2, topo 10/m2
II 2008 1,064 Topo<30 Topo<1m
Leica Geo- ALS60 2008 38.5 1,064 14 - 16 20 - 26 91 @ 150km/h, 200m, 15°systems
ALTM 2006 23.4 1,064 < 10 1/11 000Optech Gemini
ALTM 2008 27 1,064 < 10 1/5 500Orion
RIEGL 2008 11.5 1,550 < 15 < 10 50 @ 50km/h, 150m, 60°RIEGL VQ-480
RIEGL 2008 16 1,550 < 15 < 10 4 @ 200km/h, 500m, 60°LMS-Q560 66 @ 50km/h, 150m, 60°
RIEGL 2009 17.5 1,550 < 15 < 10 5 @ 200km/h, 500m, 60°LMS-Q680
Harrier 2008 42 1,550 < 15 < 10 4 @ 200km/h, 500 m, 60°TopoSys 56/G4 66 @ 50km/h, 150m, 60°
Harrier 2009 N/A 1,550 < 15 < 10 5 @ 200km/h, 500m, 60°68/G1
Falcon II 2000/ 41 1,560 < 15 < 10 12 @ 200km/h, 500m, 14.3°2008

G E O M A T I C A
tool (PCI-Pansharp) was released byPCI Geomatics Inc. in early 2003,which can fuse Pan and MS imagesfrom all satellites with optimal fusionresults in a one-step process. Sincethen, PCI-Pansharp has been widelyused throughout the world.
• DigitalGloble Inc. also installed thesame technology into their productionline in late 2003. Since then all thepan-sharpened QuickBird imageshave been produced using the tech-nology and distributed worldwide.
2) With the significantly increased imageresolution, human operators can interpretmuch more information. However, tradi-tional image classification algorithms andsoftware tools failed to effectively extractthe information which human eyes canclearly see.• To overcome this problem, a break-
through software package—eCognition—involving a new conceptfor image classification (i.e. object-based classification) was first intro-duced into the commercial market in2000. It has now become the mostadvanced and most popular softwarefor classification of high-resolutionsatellite images.
• However, the major drawbacks ofeCognition are that - the software is very complicated
to use, - it needs a tedious trial-and-error
process to achieve reasonableresults in an iterative fashion,which is, therefore, very timeconsuming, and
- the classification quality dependsheavily on the knowledge andexperience of the operator.
These drawbacks have prevented thesoftware from being widely used byremote sensing practitioners.
3) Due to the rapid increase of digital aerialphotos and high-resolution satelliteimages, photogrammetric image process-ing software has also come into a fullydigital processing stage, i.e. digital pho-togrammetry. The first commercial digitalphotogrammetric software—SOCETSET—was developed in the 1990s[Center for Photogrammetric Training2008; Hughes et al. 2010]. Now, manydigital photogrammetric software pack-
ages (Digital PhotogrammetricWorkstations) dealing with geometricaspects of image mapping and measure-ment have been released into the market. • Sensor modeling and image matching
are two of the most important techni-cal components of the software pack-ages. However,- current sensor modeling tech-
niques are still sensor specific andcontain certain geometric errors,and
- existing image matching algo-rithms cannot find reliable match-ing points in smooth areas such asforest, grass, and roof areas, sothat no software can achieve fullyautomated, accurate matching ofimages with a large coverage ofsmooth land covers.
• In radar remote sensing:1) Because of the newly emerging multi-
polarization radar images and the increaseof the spatial resolution, software pack-ages dealing with image polarization arebeing quickly developed, and research inutilizing polarization information forimproved land cover classification is alsogrowing rapidly.
• In LiDAR remote sensing:1) LiDAR software development, compared
to sensor development, is surprisinglyimmature. Major commercial hardwarevendors just provide software for essentialprocessing of their data. Very few compa-nies produce commercial LiDAR editingpackages. And, the LiDAR editing processis still very labour intensive [LiDAR—Overview 2006].
2) The potential application opportunity ofLiDAR data, except for DEM generation,will be the utilization of the “noise” in thedata, i.e. the laser points that are notreflected from the bare earth but from any-thing standing above the ground, such asbuilding roofs, trees, and electric powerlines [LiDAR—Overview 2006]. For thisnew opportunity, new software tools needto be developed.
1.3. Remote Sensing ApplicationsIn the area of application, remote sensing has, in
the last ten years, quickly become an indispensibletool and information source in many professional
177
In the areaof applica-
tion, remotesensing has,
in the lastten years,
quicklybecome an
indispensibletool and
informationsource…
G E O M A T I C A
fields where location information is needed.Natural resourse management, environment moni-toring, urban planning, disaster relief, and lawenforcement are just a few examples where remotesensing information has played an important role.Thanks to the significant increase of image resolu-tion and image diversity, remote sensing hasincreasingly influenced our daily life. One of themost influential remote sensing applications thathas emerged in the last ten years is:
• The launch of Google Maps in 2004 andGoogle Earth in 2005 [Google Milestones2010], which initiated the revolution ofbringing remote sensing application fromgovernment, research, and industry usesinto people’s everyday lives.
2. Technology Development inthe CRC-AGIP Lab of GGE
Joining UNB (the University of NewBrunswick) in 2000, Dr. Zhang and his researchgroup, named CRC-AGIP Lab (Canada ResearchChair Laboratory in Advanced Geomatics ImageProcessing) since 2008, have done remote sensingresearch in all of the three remote sensing areas—optical, radar, and LiDAR. The goal of the researchis to develop new algorithms and software tools forimproved remote sensing applications. The mainemphasise of the research has been high-resolutionoptical remote sensing.
In the areas of radar and LiDAR remote sens-ing, research conducted by the research labincludes, for example, algorithm and softwaredevelopment to utilize radar polarization informa-tion for improved land cover classification and toextract above-ground LiDAR points for GPS(Global Position System) applications. In the opti-cal remote sensing field, some research results ofthe research lab are introduced below.
2.1. Pan-Sharpening of MS Images Since the launch of Landsat 7 and Ikonos in
1999, traditional image fusion techniques can nolonger produce satisfactory fusion results of the Panand MS images of the new satellites launched there-after. Because the spectral band width of the Panimages of most new satellites is extended from tra-ditional visible wavelength range into near infraredrange, traditional image fusion (pan-sharpening)techniques failed to consider this additional infor-mation in the image fusion, causing significantcolour distortion (Figure 1). In addition, operator
dependency was also a main problem of traditionalfusion techniques, i.e. different operators with dif-ferent knowledge and experience usually produceddifferent fusion results.
To overcome these problems, Dr. Zhang start-ed a research program in 2000. Based on his imagefusion research experience gained in his Ph.D.studies, he quickly achieved a breakthrough in2001, resulting in the new fusion technique—UNB-Pansharp. It solved the image fusion problems andproduced optimal fusion results of the then-availablePan and MS images of Ikonos and Landsat 7,achieving minimum colour distortion, maximumspatial detail, and optimal integration of colour andspatial detail (Figure 2). The results were presentedat IEEE IGARSS 2002 [Zhang 2002a] in Torontoand at the 2002 ISPRS, CIG and SDH JointSymposium in Ottawa [Zhang 2002b]. The UNB-Pansharp technique was then licensed to PCIGeomatics Inc. and DigitalGlobe Inc. in 2002 and2003, respectively, resulting in PCI-Pansharp beingwidely used throughout the world and DG-Pansharp producing significantly improvedQuickBird pan-sharpened MS images for globaldistribution.
Around 80% of earth observation satellitescollect low-resolution MS and high-resolution Panimages simultaneously (see Table 1). UNB-Pansharp can produce optimal pan-sharpeningresults of available Pan and MS images from allremote sensing satellites [Zhang 2004]. Figure 3shows one example of GeoEye-1 pan-sharpeningusing UNB-Pansharp.
Due to the superior fusion quality and fullyautomated one-step process, UNB-Pansharp is nowbeing used by industrial, governmental, academic,and military organizations worldwide at all levels,from globally leading organizations such as NASAto local organizations such as a marine conservationorganization in Mauritius. It was selected by theAssociation of University Technology Managers (aninternational organization) as one of nine Canadianresearch achievements for “The Better World Project2006” and reported in Technology Transfer Works:100 Cases from Research to Realization [AUTM2006]. Other universities being reported includeMIT, Stanford and Yale.
2.2. Control Network-Based ImageMatching
Image interest point (also called feature point)matching is a key technique for image registration.It is widely used for 3D reconstruction, changedetection, medical image processing, computervision, and pattern recognition. It is also an essential
178
UNB-Pansharpcan produceoptimal pan-sharpeningresults ofavailablePan and MSimages fromall remotesensingsatellites.

G E O M A T I C A
179
Figure 1: Colour distortion of pan-sharpened QuickBird natural colour image, downloaded fromwww.DigitalGlobe.com in 2003. (The image was taken on June 2, 2002 covering Brussels, Belgium.)
Figure 2: Image fusion quality of UNB-Pansparp. (a) Original Ikonos MS image, 4m resolution; (b) Original Ikonos Pan image, 1m; (c)Pan-sharpened Ikonos MS image, 1m, using UNB-Pansharp. (The image shows a portion of UNB campus in Fredericton. The image wastaken in October 2001.)
Figure 3: Fusion quality of UNB-Pansharp for GeoEye-1 images (launched in 2008). (a) Original GeoEye-1 MS image, 2m resolution; (b)Original GeoEye-1 Pan image, 0.5m; (c) Pan-sharpened GeoEye-1 MS image, 0.5m, using UNB-Pansharp.
G E O M A T I C A
technique in digital photogrammetry. Althoughnumerous algorithms have been developed, match-ing images with local distortions caused by viewingangle differences and relief variations remains prob-lematic. In earth-oriented remote sensing, however,local distortions are unavoidable in high-resolutionsatellite images and aerial photos, because theimages are normally acquired at widely-spacedintervals and from different viewpoints.
Currently, there are two main types of interestpoint matching algorithms: area-based and featurebased. Although each type has its own particularadvantages in specific applications, they all face thecommon problem of dealing with ambiguity insmooth (low-texture) areas, such as forest, grass,highway surfaces, building roofs, etc. However, lowtexture areas appear everywhere in real-life remotesensing images. This limitation has significantlylowered the accuracy and the degree of automationof image matching in many aspects.
To deal with the image matching problemscaused by local distortions and low-texture areas, anew algorithm—Control Network BasedMatching—was developed in the CRC-AGIP Lab in2008. The algorithm consists of (1) the detection of“super points” (i.e. those points which have thegreatest interest strength and represent the mostprominent features) and (2) the subsequent construc-tion of a control network. Sufficient spatial informa-tion can then be extracted to reduce the ambiguity inlow-texture areas and avoid false matches in areaswith local distortions [Xiong and Zhang 2009a].
The experiment with a variety of remote sensingimages, including Ikonos, QuickBird, and ordinarydigital photos, have shown that the new algorithmand software developed by CRC-AGIP can success-fully process local distortion and avoid ambiguity inmatching smooth areas (Figure 4, 5, and 6).
The new algorithm and software developed inCRC-AGIP, because of the construction of a controlnetwork, can find matching points at a much higherspeed and with a much better accuracy than anyexisting feature point matching methods. It exhibitsa tremendous potential in improving the currentimage matching process, accuracy, and automation.
2.3. Generic Method for RPCSensor Model Refinement
In remote sensing image processing, geometricsensor models are used to represent the geometricrelationship between object space and image space,and transform (or rectify) image data to conform toa map projection. An RPC (Rational PolynomialCoefficient) is a commonly used sensor model thathas been used to transform/rectify images of a variety
of high-resolution satellite sensors. It can also be usedto transform images from airborne digital sensors.But, certain geometric errors exist, so that the RPCsprovided by image vendors usually need to be refined.
To date, numerous research papers have beenpublished on RPC refinement, aimed at improvingthe accuracy of the transformation. The BiasCompensation method is, so far, the most acceptedone and has been widely used in the remote sensingcommunity. But, this method can only be used toimprove the RPCs of the images obtained by sensorswith a narrow field of view, such as those sensors onboard of Ikonos or QuickBird satellites, and underthe condition that the sensor’s position and attitudeerrors are sufficiently small. In many cases, howev-er, images may be collected by sensors with a widefield of view and/or with large sensor position andattitude errors, such as airborne digital sensors,which usually have a very large field of view, andsome satellite sensors, which may have large posi-tion and attitude errors. Therefore, it is desirable tohave a more robust method that can be used to refinethe RPCs of images collected by a wider range ofsensors and containing larger sensor position andattitude errors.
The CRC-AGIP Lab developed a genericmethod for RPC sensor model refinement (namedGeneric RPC Refinement Method) in 2008, whichcan refine the RPCs of a much wider range of sen-sors, has a much larger tolerance for sensor positionand attitude errors, and still reaches sub-pixel to 1-pixel accuracy. The method first restores the sensor’spseudo position and attitude, then adjusts theseparameters using ground control points. Finally, anew RPC is generated based on the sensor’s adjust-ed position and attitude [Xiong and Zhang 2009b].
Experiments with Ikonos and SPOT-5 imagesconfirmed that the Bias Compensation method (thecurrent industry standard method) worked well onlyunder the condition when the sensor’s field of view isnarrow and the sensor position and attitude errors aresmall. Under this condition, the Generic RPCRefinement Method developed by the CRC-AGIPLab also reached the same accuracy (Figure 7).However, the accuracy of the Bias Compensationmethod decreased rapidly when the sensor’s positionerror and attitude error increased (Figure 8 and 9,case 3 and 9). In contrary, the Generic RPCRefinement Method was found to yield highly accu-rate results under a variety of sensor conditions withdifferent position and attitude errors (Figure 8 and 9).
Because of the superior advantages of theGeneric RPC Refinement Method—(1) reachingsub-pixel to 1-pixel accuracy for a wide range ofoptical sensors, including satellite and airbornesensors, under a large range of sensor errors, (2)
180
The newalgorithmand softwaredeveloped inCRC-AGIP…canfind matchingpoints at amuch higherspeed andwith a muchbetter accu-racy thanany existingfeature pointmatchingmethods.

G E O M A T I C A
Figure 6: Feature points in tree and grass areas of a pair of ordinary photographs extracted and matched by the control network-based matching technique.
181
Figure 4: Feature points in forest area of a QuickBird MS image pair (2.8m) extracted and matched by the control net-work-based matching technique developed in the CRC-AGIP Lab.
Figure 5: Feature points in built-up and grass areas of a 315-degree rotated Ikonos Pan image pair (1m) extracted and matchedby the control network-based matching technique.

G E O M A T I C A
working well with any number of GCPs, (3) notrequiring any other auxiliary data (except for one ora few GCPs), and (4) simple in calculation and sta-ble with the results—the method exhibits a greatpotential for upgrading the current industry standardsolutions in sensor modeling and RPC sensor modelrefinement.
2.4. Supervised Image SegmentationAlong with the significant improvement of spa-
tial resolution of remote sensing imagery since 1999,traditional per-pixel based classification techniqueshave been facing increased problems in achievingacceptable classification results. Object-based classi-fication has proven to be a promising direction forclassifying high-resolution remote sensing imagery,such as Ikonos, QuickBird, GeoEye-1, and airbornedigital multispectral images.
In object-based classification, the image needsto be segmented into individual object segmentsfirst. The segments will then be classified into differ-ent classes. The object segmentation is a crucialprocess. It significantly influences the classificationefficiency and accuracy. However, current state-of-the-art techniques, such as eCognition, rely heavilyon the operator’s experience to achieve a proper seg-mentation through a labour-intensive and time-con-suming trial-and-error process, in which a set ofproper segmentation parameters are repeatedlyselected, tested, and compared with the previous oneuntil the operator cannot find any better set or doesnot want to continue the comparison anymore.Therefore, the experience of the operator heavilyinfluences the accuracy of the classification.
In the CRC-AGIP Lab, a breakthrough algo-rithm for supervised image segmentation was devel-oped in 2005, a Fuzzy-Based SupervisedSegmentation algorithm [Maxwell and Zhang 2005].The algorithm can find/calculate a set of optimal seg-mentation parameters for segmenting objects of inter-est for the state-of-the-art commercial softwareeCognition (now renamed Definiens), through analgorithm training and fuzzy logical analysis process,instead of through operator’s trial-and-error process.
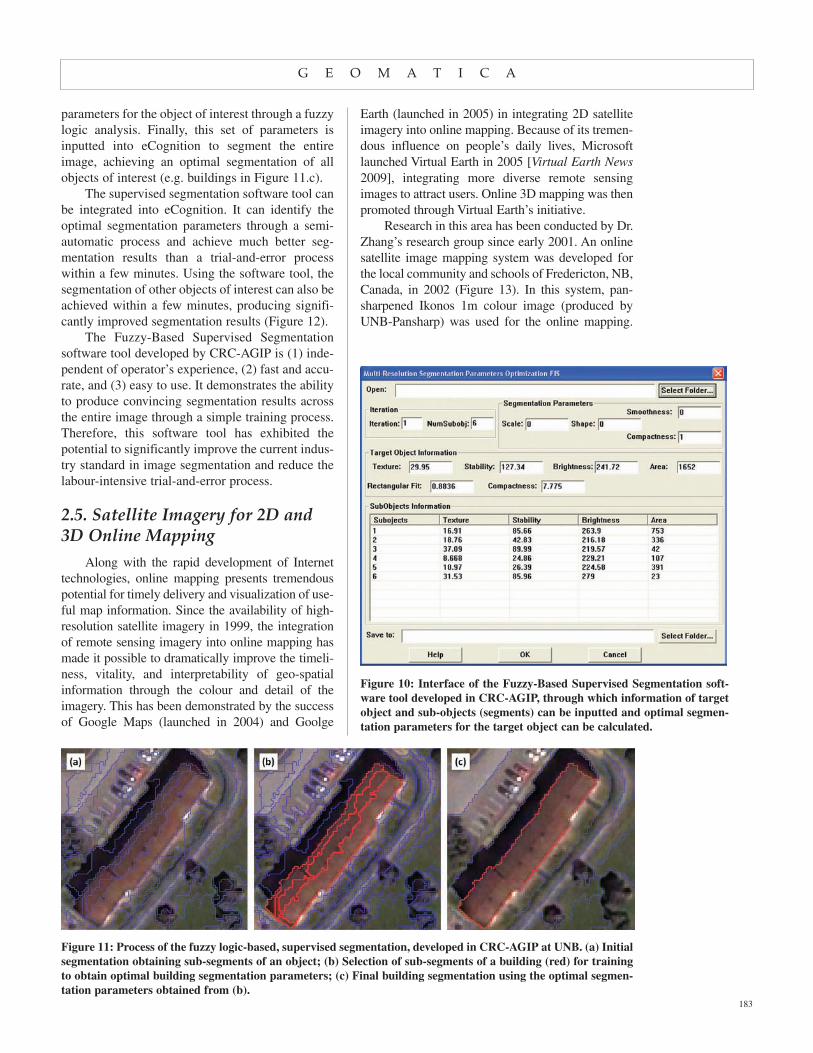
In 2009, a software tool for supervised seg-mentation was developed by CRC-AGIP Lab basedon the concept of the Fuzzy-Based SupervisedSegmentation algorithm (Figure 10). To find theoptimal segmentation parameters, the operator justneeds to use eCognition for an initial segmentation(Figure 11.a), and then use the initially segmentedsub-segments of an object of interest (also calledtarget object) (e.g. building in Figure 11.b) to trainthe algorithm. After the training, the algorithm canthen identify a set of most suitable segmentation
182
Figure 7: Accuracy comparison between the Bias Compensation methodand the Generic RPC Refinement Method developed in CRC-AGIP usingIkonos images (narrow field of view) in three cases (all with small sensorposition and attitude errors). (Note: RMSE = Root Mean Square Error;Row = Row direction of image; Col. = Column direction of image; Generic= Generic RPC Refinement Method; Bias = Bias Compensation method.)
Figure 8: Accuracy comparison between the Bias Compensation method andGeneric RPC Refinement Method using simulated SPOT-5 data with ninedifferent magnitudes of errors and using one GCP as ground control and 36check points for accuracy assessment. (Case 2: The sensor position error is100m in x, y, and z directions, and the sensor attitude error is 0.01 radianabout the three axes; Case 3: Position error is 1000m in x, y, z, and attitudeerror is 0.1 radian about the three axes; Case 8: Position error is 0, and atti-tude error is 0.01 radian; Case 9: Position error is 0, and attitude error is 0.1radian; and Cases 1, 4, 5, 6, and 7: The sensor position error varies from 10mto 1000m in x, y, z, and attitude error varies from 0.0 to 0.001 radian.)
Figure 9: Accuracy comparison between the Bias Compensation methodand Generic RPC Refinement Method using simulated SPOT-5 data withnine different magnitudes of errors and using three GCP as ground con-trol and 34 check points for accuracy assessment. (The magnitudes oferrors of the nine cases are the same as in Figure 8.)
G E O M A T I C A
parameters for the object of interest through a fuzzylogic analysis. Finally, this set of parameters isinputted into eCognition to segment the entireimage, achieving an optimal segmentation of allobjects of interest (e.g. buildings in Figure 11.c).
The supervised segmentation software tool canbe integrated into eCognition. It can identify theoptimal segmentation parameters through a semi-automatic process and achieve much better seg-mentation results than a trial-and-error processwithin a few minutes. Using the software tool, thesegmentation of other objects of interest can also beachieved within a few minutes, producing signifi-cantly improved segmentation results (Figure 12).
The Fuzzy-Based Supervised Segmentationsoftware tool developed by CRC-AGIP is (1) inde-pendent of operator’s experience, (2) fast and accu-rate, and (3) easy to use. It demonstrates the abilityto produce convincing segmentation results acrossthe entire image through a simple training process.Therefore, this software tool has exhibited thepotential to significantly improve the current indus-try standard in image segmentation and reduce thelabour-intensive trial-and-error process.
2.5. Satellite Imagery for 2D and3D Online Mapping
Along with the rapid development of Internettechnologies, online mapping presents tremendouspotential for timely delivery and visualization of use-ful map information. Since the availability of high-resolution satellite imagery in 1999, the integrationof remote sensing imagery into online mapping hasmade it possible to dramatically improve the timeli-ness, vitality, and interpretability of geo-spatialinformation through the colour and detail of theimagery. This has been demonstrated by the successof Google Maps (launched in 2004) and Goolge
Earth (launched in 2005) in integrating 2D satelliteimagery into online mapping. Because of its tremen-dous influence on people’s daily lives, Microsoftlaunched Virtual Earth in 2005 [Virtual Earth News2009], integrating more diverse remote sensingimages to attract users. Online 3D mapping was thenpromoted through Virtual Earth’s initiative.
Research in this area has been conducted by Dr.Zhang’s research group since early 2001. An onlinesatellite image mapping system was developed forthe local community and schools of Fredericton, NB,Canada, in 2002 (Figure 13). In this system, pan-sharpened Ikonos 1m colour image (produced byUNB-Pansharp) was used for the online mapping.
183
Figure 10: Interface of the Fuzzy-Based Supervised Segmentation soft-ware tool developed in CRC-AGIP, through which information of targetobject and sub-objects (segments) can be inputted and optimal segmen-tation parameters for the target object can be calculated.
Figure 11: Process of the fuzzy logic-based, supervised segmentation, developed in CRC-AGIP at UNB. (a) Initialsegmentation obtaining sub-segments of an object; (b) Selection of sub-segments of a building (red) for trainingto obtain optimal building segmentation parameters; (c) Final building segmentation using the optimal segmen-tation parameters obtained from (b).

G E O M A T I C A
Users can select a destination (such as a school), andthen the system can “fly” from the current locationto the destination (e.g. Leo Hayes High School in theexample in Figure 13). A full screen view can also bedisplayed to allow viewers to zoom in, zoom out,and move the image. This system had been widelyused by the local community until 2006 when ahigh-resolution satellite image of the Frederictonarea was made available on Google Maps.
In 2003, an initial research result of generatingcolour 3D satellite images for online mapping wasachieved in GGE [Zhang and Xie 2003]. After furtherdevelopment, an automated software system for 3Dsatellite image generation and online visualizationwas developed in 2005. Now, the system has beenimproved with more functions (Figure 14 and 15).The system can produce, distribute, and visualize 2Dand 3D satellite images at different scales. Satelliteimages from a variety of satellites, from Landsat (15mPan, 30m MS) to GeoEye-1 (0.5m Pan, 2m MS), canbe used for the 2D and 3D image generation.
184
Figure 12: Example of street segmentation obtained using the parametersidentified by the Fuzzy-Based Supervised Segmentation software tool in theeCognition environment.
Figure 13: Online 2D satellite image mapping system developed in GGE in 2002 with pan-sharpened Ikonos image of Fredericton.

G E O M A T I C A
185
Figure 14: 2D view of the online 2D and 3D satellite image mapping system developed in CRC-AGIP of GGE (pan-sharpened QuickBird image of a part of the Great Wall near Beijing).
Figure 15: 3D view of the online 2D and 3D satellite image mapping system developed in CRC-AGIP of GGE (producedusing pan-sharpened QuickBird image, the Great Wall near Beijing).

G E O M A T I C A
Using current 2D displays, such as computerscreens and digital televisions, viewers can see thesame colour 2D satellite images as on Google Maps.However, with a pair of inexpensive colour stereoglasses, viewers will see colour 3D images of theearth’s surface, adding the third dimension into theonline satellite image mapping. Along with theemergence of modern glasses-free 3D displays andtelevisions, the online 3D image mapping technolo-gy developed in the CRC-AGIP Lab will have amuch higher application potential, because no 3Dglasses are needed and a better 3D effect is achieved.
2.6. Moving InformationExtraction from Single-SetSatellite Imagery
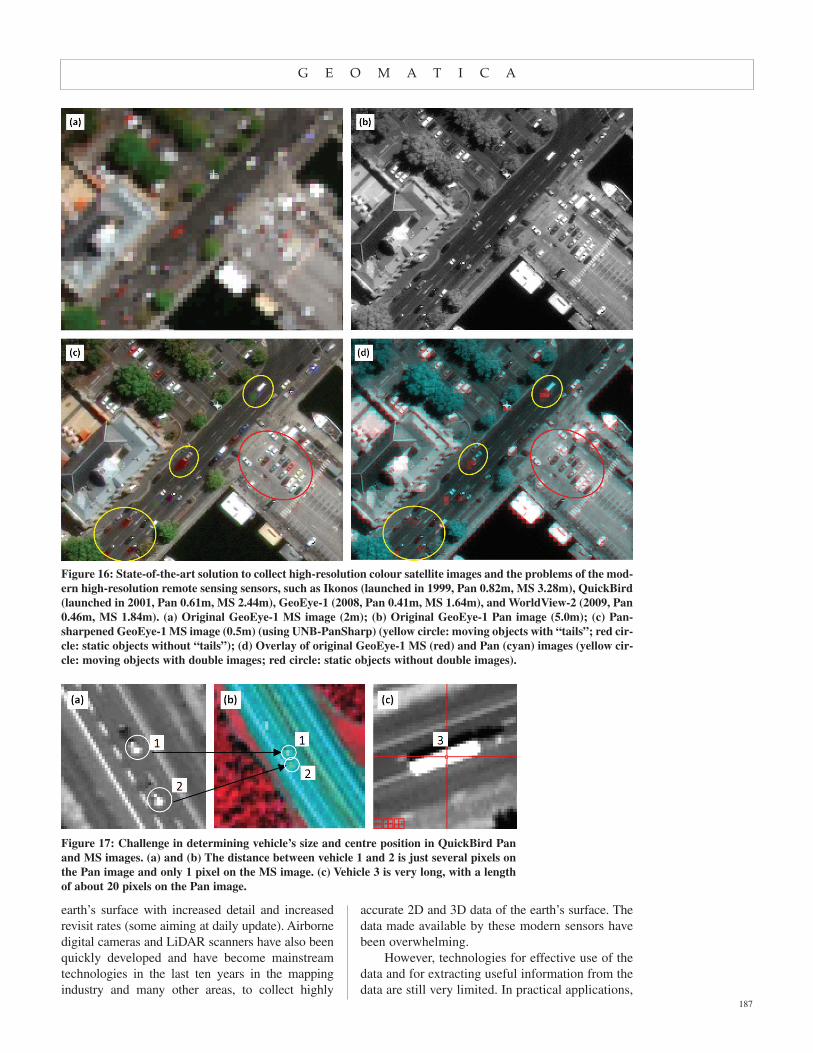
To collect high-resolution colour/multispectralimages at a very high speed from space, an effectivesolution is to simultaneously record a low-resolutionmultispectral (MS) image (Figure 16.a) and a high-resolution panchromatic (Pan) image (Figure 16.b)from the same satellite, and then fuse the Pan andMS images (also called pan-sharpen) to reconstructa high-resolution MS image (Figure 16.c).
However, to reduce the satellite payload, the lin-ear CCD (Charge Coupled Device) array of the Pansensor and those for the MS sensor are built into thesame sensor system to share the same optical lens.Consequently, the optical axes of the Pan and MSsensors cannot be exactly parallel to each other,causing a very small viewing angle difference. Thisangle difference leads to a slight time delay andrelief distortion (geometric distortion caused byheight variation of ground objects) between the Panand MS images. Due to the time delay, any movingobjects are recorded at two slightly different loca-tions (see Figure 16.d), resulting in annoying “tails”for all moving objects when the Pan and MS imagesare fused to reconstruct a high-resolution MS image(Figure 16.c). Objects with different heights are alsodisplaced to different extents between Pan and MS,causing strange artefacts along building edges andedges of other objects in pan-sharpened MS images.These are unwanted problems in remote sensing andneed to be removed through image processing.
These problems were identified by Dr. Zhang inhis image fusion research in 2001 using Ikonos Panand MS images. While exploring solutions for solv-ing or mitigating these problems for image fusion,the idea of utilizing these unwanted problems foruseful information emerged. However, the researchchallenge for moving information extraction from asingle set Pan and MS imagery is very high, because:
• The time delay is too small to detect mov-ing information using any existing state-of-the-art solutions,
• The double positions of any moving objectis not only caused by movement of theobject but also the elevation where theobject is located,
• No available sensor model is preciseenough to achieve acceptable positionaccuracy for moving speed and directioncalculation, and
• No proper methods or algorithms havebeen found which are capable of extractingcars and their exact centres from availablesatellite images.
With funding support from NSERC, successfulalgorithms and computer software for movinginformation extraction from a single set of high-resolution satellite imagery were developed in2006. The algorithms consist of a refined new sen-sor model, new solutions for detecting cars, and anew algorithm for speed calculation [Xiong andZhang 2008]. The initial experiment withQuickBird Pan (0.7m) and MS (2.8m) imagesresulted in an accuracy of speed informationextraction at ± 20 km/h, despite limited image res-olutions and other technical challenges (Figure 17).
The initial research result was published inPhotogrammetric Engineering and Remote Sensingin 2008 [Xiong and Zhang 2008]. It was then quick-ly recognized by the remote sensing communityand was selected by ASPRS (American Society forPhotogrammetry and Remote Sensing) in 2009 forthe First Place Recipient of the prestigious John I.Davidson President’s Award for Practical Papers.Former recipients of the award include NASA sci-entists at the Goddard Space Flight Center.
After the publication of CRC-AGIP’s researchpapers, researchers in other countries also startedsimilar research. Papers on this topic can now beincreasingly seen in conference proceedings andscholarly journals.
3. Discussion andConclusion
Driven by the increasing demand from industry,government, academia, and military for updated,more detailed, more diversified, and more reliablegeo-spatial information, many earth observationoptical and radar satellites have been developed,launched, or planned to launch in the last ten years,in order to collect data with a large coverage of the
186
G E O M A T I C A
earth’s surface with increased detail and increasedrevisit rates (some aiming at daily update). Airbornedigital cameras and LiDAR scanners have also beenquickly developed and have become mainstreamtechnologies in the last ten years in the mappingindustry and many other areas, to collect highly
accurate 2D and 3D data of the earth’s surface. Thedata made available by these modern sensors havebeen overwhelming.
However, technologies for effective use of thedata and for extracting useful information from thedata are still very limited. In practical applications,
187
Figure 16: State-of-the-art solution to collect high-resolution colour satellite images and the problems of the mod-ern high-resolution remote sensing sensors, such as Ikonos (launched in 1999, Pan 0.82m, MS 3.28m), QuickBird(launched in 2001, Pan 0.61m, MS 2.44m), GeoEye-1 (2008, Pan 0.41m, MS 1.64m), and WorldView-2 (2009, Pan0.46m, MS 1.84m). (a) Original GeoEye-1 MS image (2m); (b) Original GeoEye-1 Pan image (5.0m); (c) Pan-sharpened GeoEye-1 MS image (0.5m) (using UNB-PanSharp) (yellow circle: moving objects with “tails”; red cir-cle: static objects without “tails”); (d) Overlay of original GeoEye-1 MS (red) and Pan (cyan) images (yellow cir-cle: moving objects with double images; red circle: static objects without double images).
Figure 17: Challenge in determining vehicle’s size and centre position in QuickBird Panand MS images. (a) and (b) The distance between vehicle 1 and 2 is just several pixels onthe Pan image and only 1 pixel on the MS image. (c) Vehicle 3 is very long, with a lengthof about 20 pixels on the Pan image.

G E O M A T I C A
the use of remote sensing data still stays mostly atthe level of visualizing the data as backgroundimages, or producing digital or hardcopy imagemaps. To extract useful information from the imagedata, manual interpretation and editing are still themajor methods in practical operations. These limi-tations have significantly limited the effectivenessof geo-spatial information updating, leading to thereality that numerous remote sensing data havebeen collected for information updating, but manyhave become outdated before being effectively usedor ever being used.
The research activities in the CRC-AGIP Labat UNB have mainly focused on algorithm and soft-ware development for improved utilization ofremote sensing data and improved informationextraction from the data. To date, the research lab hasachieved several breakthroughs in this area, leadingto advanced technologies for improved remotesensing applications globally. However, numeroustechnical problems and challenges still exist. Theresearch lab is continuing its effort in solving ormitigating some the problems and challenges.
Along with the fast development of modernsensor technologies, new technical problems andchallenges are continually emerging. The fastdevelopment of sensor technologies has broughttremendous challenges to the technology develop-ment of information extraction, but it has alsobrought tremendous opportunities in the extractionof more accurate and reliable geo-spatial informa-tion. Therefore, research on technology developmentfor improved information extraction has nowbecome more important than ever before. In order tomeet the demand for updated, more detailed, morediversified, and more reliable geo-spatial informa-tion, an increased research effort on technologydevelopment for automated information extraction isrequired nationally and internationally.
ReferencesAUTM. 2006. Sharpening Our View of the World. The
Better World Project, Advancing Discoveries for aBetter World, 2006 Edition. Association ofUniversity Technology Managers. http://www.bet-terworldproject.net/documents/AUTM_RFF.pdf
Center for Photogrammetric Training. 2008. History ofPhotogrammetry. By: Center for PhotogrammetricTraining, Ferris State University. http://www.fer-ris.edu/faculty/burtchr/sure340/notes/HISTORY.pdf[last accessed Jan 15, 2010].
Düring, R., F.N. Koudogbo, and M. Weber. 2008.TerraSAR-X and TanDEM-X: Revolution in space-borne radar. 2008 ISPRS Congress Beijing. TheInternational Archives of the Photogrammetry,
Remote Sensing and Spatial Information Sciences.Vol. XXXVII. Part B1. Beijing 2008, pp. 227-234.
GIM International. 2008. Product Survey—Digital AerialCameras. GIM International, April 2008.
GIM International. 2009. Product Survey—AirborneLiDAR Sensors. GIM International, Feb 2009, pp.16-19.
Google Milestones. 2010. http://www.google.com/corpo-rate/history.html [last accessed Jan 15, 2010].
Hughes, D. et al. 2010. The Development ofPhotogrammetry in Switzerland. http://www.wild-heerbrugg.com/photogrammetry1.htm [last accessedJan 15, 2010].
LiDAR—Overview. 2006. LiDAR—Overview of technol-ogy, applications, market features and industry. By:BC-CARMS, Centre for Applied Remote Sensing,Modelling and Simulation, University of Victoria,Victoria, BC, 2006,http://carms.geog.uvic.ca/LiDAR%20Web%20Docs/LiDAR%20paper%20june%202006.pdf [lastaccessed Jan 15, 2010].
Lidar Remote Sensing Overview. 2007. Lecture 03. LidarRemote Sensing Overview (1), University of Colorado.http://superlidar.colorado.edu/Classes/Lidar2007/Lecture03.pdf [last accessed Jan 15, 2010].
Maxwell, T., and Y. Zhang. 2005. A fuzzy logic approachto optimization of segmentation of object-orientedclassification. Proceedings of SPIE 50th AnnualMeeting—Optics & Photonics 2005, San Diego,California, USA, 31 July–4 August 2005.
Stoney, W.E. 2008. ASPRS guide to land imaging satellites.http://www.asprs.org/news/satellites/ASPRS_DATA-BASE_021208.pdf [Last accessed Jan 15, 2010].
Virtual Earth News, 2009. http://www.mp2kmag.com/vir-tual-earth.asp [last accessed Jan 15, 2010].
Xiong, Z., and Y. Zhang. 2008. An initial study on vehicleinformation extraction from single pass of satelliteQuickBird Imagery. Photogrammetric Engineeringand Remote Sensing, 74(11), pp. 1401-1412.
Xiong, Z. and Y. Zhang. 2009a. A novel interest pointmatching algorithm for high resolution satelliteimages, IEEE Transactions on Geoscience andRemote Sensing, 47(12), December 2009, pp. 4189-4200.
Xiong, Z., and Y. Zhang. 2009b. A generic method forRPC refinement using ground control information.Photogrammetric Engineering and Remote Sensing,Vol. 75, pp.1083-1092.
Zhang, Y. 2002a. A new automatic approach for effec-tively fusing Landsat 7 images and IKONOSimages. IEEE/IGARSS’02, Toronto, Canada, June24-28, 2002.
Zhang, Y. 2002b. Problems in the fusion of commercialhigh-resolution satellite images as well as Landsat 7images and initial solutions. International Archives ofPhotogrammetry and Remote Sensing (IAPRS),34(4), ISPRS, CIG, SDH Joint InternationalSymposium on GeoSpatial Theory, Processing andApplications, Ottawa, Canada, July 8-12, 2002.
Zhang, Y. 2004. Highlight Article: Understanding ImageFusion. Photogrammetric Engineering & RemoteSensing, 70(6), pp. 657-661.
188

G E O M A T I C A
Zhang, Y. and N. Kerle. 2007. Satellite remote sensingfor real-time data collection and the challenges. In:Zlatanova and Li (eds.): Geo-InformationTechnology for Emergency Response, London, NewYork: Taylor & Francis Group, 75-102.
Zhang, Y. and P. Xie. 2003. Web-based natural colour 3Dvisualization of urban environment using stereo-scopic satellite images. Proceedings of ISPRSWorkshop on Spatial Analysis and DecisionMaking, 3-5 Dec. 2003, Hong Kong.
AuthorYun Zhang received a B.Sc. degree in Land
Information and Mapping from Wuhan University
(1982), a Master’s degree in Geography andRemote Sensing from the East China NormalUniversity, Shanghai (1989), and a Ph.D. degree inRemote Sensing from the Free University of Berlin,Germany (1997).
He is a Canada Research Chair in AdvancedGeomatics Image Processing, and a Professor at theUniversity of New Brunswick, Canada. With inter-national research experience, Dr. Zhang is aninventor of two patent and four patent-pendingtechnologies (three with his students) and developerof six commercially licensed technologies (one withhis student). He is the author of 150 scholarly papersand the recipient of three major internationalresearch awards. ❏
189