Embed Size (px)
Citation preview

Ten Years in the Evolution of the Internet Ecosystem
Amogh DhamdhereConstantine Dovrolis
College of ComputingGeorgia Tech

04/18/23
Motivation
How did the Internet AS ecosystem grow during the last decade?
Is growth more important than rewiring? Is the population of transit providers
increasing or decreasing? Diversification or consolidation of transit
market? Given that the Internet grows in size, does
the average AS-path length also increase?

04/18/23
Motivation (cont’)
Which ASes engage in aggressive multihoming?
What is the preferred type of transit provider for different AS customer types?
Which ASes tend to adjust their set of providers most often?
Are there regional differences in how the Internet evolves?
Where is the Internet heading towards?

04/18/23
Previous work Lots of previous work in describing the structure and
growth of the Internet graph The focus was mostly graph-theoretic in nature,
studying static snapshots of the (inferred) topology Heavy-tailed degree distribution, clustering, small-world properties,
and evolutionary models such as preferential attachment, etc
We focus on how the topology has been changing over time Most relevant work: Siganos-Faloutsos^2 (TR ’01), Magoni-Pansiot
(CCR‘01), Leskovec et al (KDD‘06), Oliveira et al. (Sigcomm’07)
More importantly, the Internet is much more than a graph We need to consider business properties of ASes (“nodes”) and the
semantics of AS relations (“links”) Most relevant works: Chang/Jamin/Willinger (Sigcomm workshop:03,
Infocom:06)

04/18/23
Approach
We start from BGP routes from all available RouteViews and RIPE monitors during 1997-2007 Focus on primary links (filter transient appearance of
backup links) Not described in this talk
Classify ASes based on their business function Enterprise ASes, small transit providers, large transit
providers, access providers, content providers, etc Classify inter-AS relations as “transit”
(antagonistic) and “peering” (symbiotic) Measure and characterize evolutionary trends of:
Global Internet Each AS-species Relation between species
04/18/23
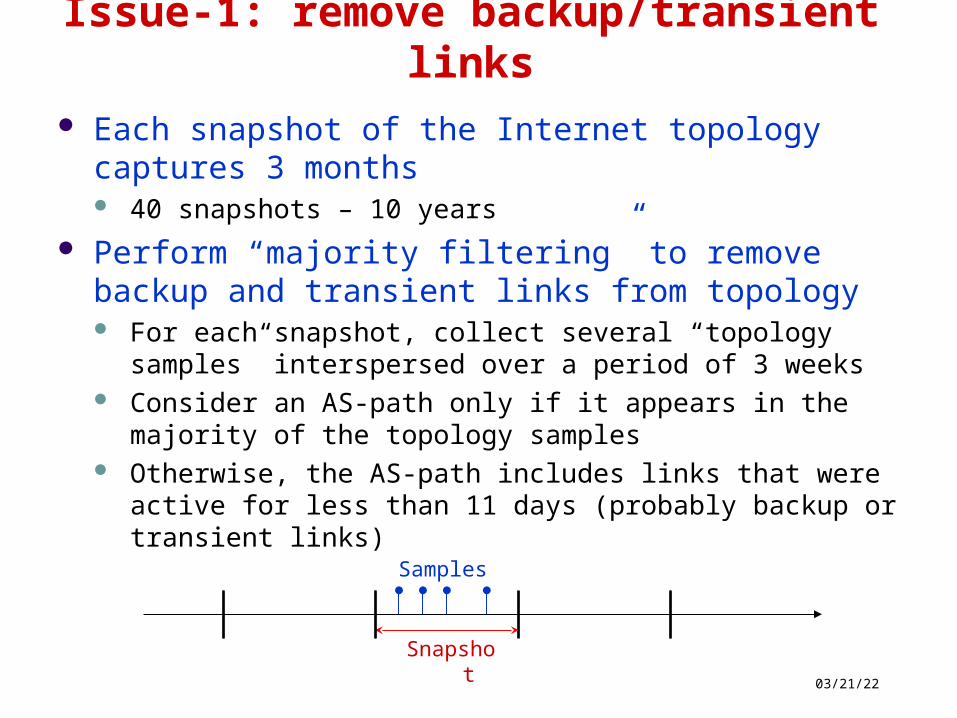
Issue-1: remove backup/transient links
Each snapshot of the Internet topology captures 3 months 40 snapshots – 10 years
Perform “majority filtering” to remove backup and transient links from topology For each snapshot, collect several “topology samples”
interspersed over a period of 3 weeks Consider an AS-path only if it appears in the majority of
the topology samples Otherwise, the AS-path includes links that were active for
less than 11 days (probably backup or transient links)
Snapshot
Samples

04/18/23
Issue-2: variable set of BGP monitors
Some observed link births may be links revealed due to increased monitor set Similarly for observed link deaths
We calculated error bounds for link births and deaths Relative error < 10% for CP links See paper for details

04/18/23
Issue-3: visibility of ASes, Customer-Provider (CP) and Peering (PP) links
Number of ASes and CP links is robust to number of monitors
But we cannot reliably estimate the number of PP links

04/18/23
Global Internet trends

04/18/23
Internet growth
Number of CP links and ASes showed initial exponential growth until mid-2001
Followed by linear growth until today Change in trajectory followed stock market crash in North
America in mid-2001

04/18/23
Transit (CP) vs Peering (PP) relations
The fraction of peering links has been increasing steadily But remember: this is just a lower bound
At least 20% of inter-AS links are of PP type today

04/18/23
The Internet gets larger but not longer
Average path length remains almost constant at 4 hops Average multihoming degree of providers increases faster
than that of stubs Densification at core much more important than at edges

04/18/23
Rewiring is more important than growth
Most new links are due to internal rewiring and not birth (75% currently)
Most dead links are due to internal rewiring and not death (almost 90% currently)

04/18/23
Classification of ASes in “species” based on business
type & function

04/18/23
Classification of ASes based on business function
Four AS types: Enterprise customers (EC) Small Transit Providers
(STP) Large Transit Providers
(LTP) Content, Access and
Hosting Providers (CAHP) Classification based on
customer and peering degrees
Classification based on decision-trees 80-85% accurate

04/18/23
Evolution of AS types
LTPs: constant population (top-30 ASes in terms of customers) Slow growth of STPs (30% increase since 2001) EC and CAHP populations produce most growth
Since 2001: EC growth factor 2.5, CAHP growth factor 1.5

04/18/23

04/18/23
Regional distribution of AS types
Based on “whois” registration entry for each AS Europe is catching up with North America w.r.t the
population of ECs and LTPs CAHPs have always been more in Europe More STPS in Europe since 2002

04/18/23
Evolution of Internet transit: the customer’s perspective

04/18/23
How common is multihoming among AS species?
CAHPs have increased their multihoming degree significantly On the average, 8 providers for CAHPs today
Multihoming degree of ECs has been almost constant (average < 2) Densification of the Internet occurs at the core

04/18/23
Who prefers large vs small transit providers?
After 2004, ECs prefer STPs than LTPs Mainly driven by lower prices or regional constraints?
CAHPs connect to LTPs and STPs with same probability

04/18/23
Customer activity by region
Initially most active customers were in North America After 2004-05, customers in Europe have been more active
Due to increased availability of providers? More competitive market?

04/18/23
Evolution of Internet transit: the provider’s perspective

04/18/23
Attractiveness (repulsiveness) of transit providers
Attractiveness of provider X: fraction of new CP links that connect to X Repulsiveness, defined similarly
Both metrics some positive correlation with customer degree Preferential attachment and preferential detachment of rewired links

04/18/23
Evolution of attractors and repellers
A few providers (50-60) account for 50% of total attractiveness (attractors)
The total number of attractors and repellers increases The Internet is NOT heading towards oligopoly of few large players
LTPs dominate set of attractors and repellers CAHPs are increasingly present however

04/18/23
Correlation of attractiveness and repulsiveness
Timeseries of attractiveness and repulsiveness for each provider
Calculate cross-correlation at different lags Most significant correlation values at lags 1,2 and 3
Attractiveness precedes repulsiveness by 3-9 months

04/18/23
Evolution of Internet peering (conjectures)

04/18/23
Evolution of Internet Peering
ECs and STPs have low peering frequency Aggressive peering by CAHPs after 2003
Open peering policies to reduce transit costs

04/18/23
Which AS pairs like to peer?
Peering by CAHPs has increased significantly CAHPs try to get close to sources/destinations of content
Peering by LTPs has remained almost constant (or declined) “Restrictive” peering by LTPs

04/18/23
Conclusions Where is the Internet heading towards?
Initial exponential growth up to mid-2001, followed by linear growth phase
Average path length practically constant Rewiring more important than growth Need to classify ASes according to business type ECs contribute most of the overall growth Increasing multihoming degree for STPs, LTPs and
CAHPs Densification at core
CAHPs are most active in terms of rewiring, while ECs are least active

04/18/23
Conclusions Where does the Internet head toward?
Positive correlations between attractiveness & repulsiveness of provider and its customer degree
Strong attractiveness precedes strong repulsiveness by period of 3-9 months
Number of attractors and repellers between shows increasing trend
The Internet market will soon be larger in Europe than in North America In terms of number of transit providers and CAHPs
Providers from Europe increasingly feature in the set of attractors and repellers

Extra slides
04/18/23
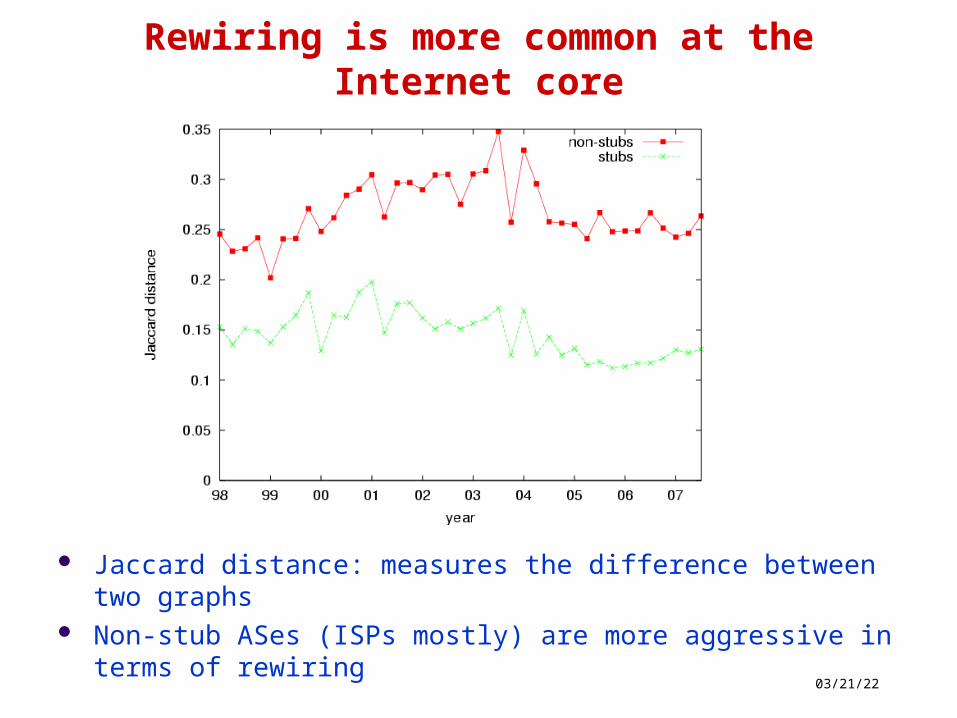
Rewiring is more common at the Internet core
Jaccard distance: measures the difference between two graphs
Non-stub ASes (ISPs mostly) are more aggressive in terms of rewiring

04/18/23
Activity of AS types
ECs are least active (most inert) CAHPs show high rewiring activity after 2001

04/18/23
Attractors and Repellers
A few providers (50-60) account for 50% of total attractiveness
Similar for repulsiveness Heavy hitters called “Attractors” and “Repellers”


![Nick Feamsterfeamster/cv/cv.pdf42(3):54–71, July 2012. [20] Murtaza Motiwala, Amogh Dhamdhere, and Nick Feamster. Towards a Cost Model for Network Traffic. ACM SIGCOMM Computer](https://img.pdfslide.us/doc/110x75/60d1121e44c3f92e404118c4/nick-feamster-feamstercvcvpdf-42354a71-july-2012-20-murtaza-motiwala.jpg)


![Nick Feamster - University of Chicagofeamster/cv/cv-jun2019.pdf[18] Murtaza Motiwala, Amogh Dhamdhere, and Nick Feamster. Towards a Cost Model for Network Traffic. ACM SIGCOMM Computer](https://img.pdfslide.us/doc/110x75/5e7c6c2c7771750d9f4d7ffa/nick-feamster-university-of-chicago-feamstercvcv-jun2019pdf-18-murtaza-motiwala.jpg)