Embed Size (px)
Citation preview
Kentucky Chapter HFMA
March 14, 2013 Presented by:
Scott Houk
Cleverley + Associates
TEN WAYS TO IMPROVE MEDICARE PROFITABILITY

| 2 |
1) Why focus on Medicare profitability?
2) Current Medicare Payment Information
3) High and Low Medicare Profit Hospital Differences
4) Ten Areas to Improve Medicare Profit
Today’s Objectives
| 3 |
Why focus on M
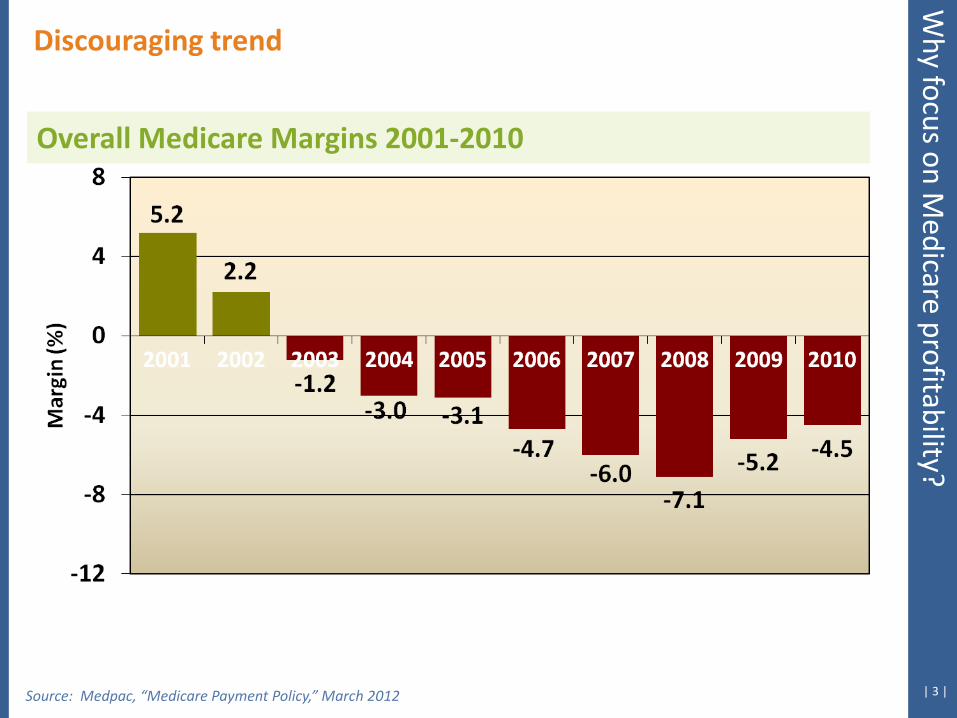
edicare profitability? Discouraging trend
Overall Medicare Margins 2001-2010
Source: Medpac, “Medicare Payment Policy,” March 2012
| 4 |
Implications for the future W
hy focus on Medicare profitability?
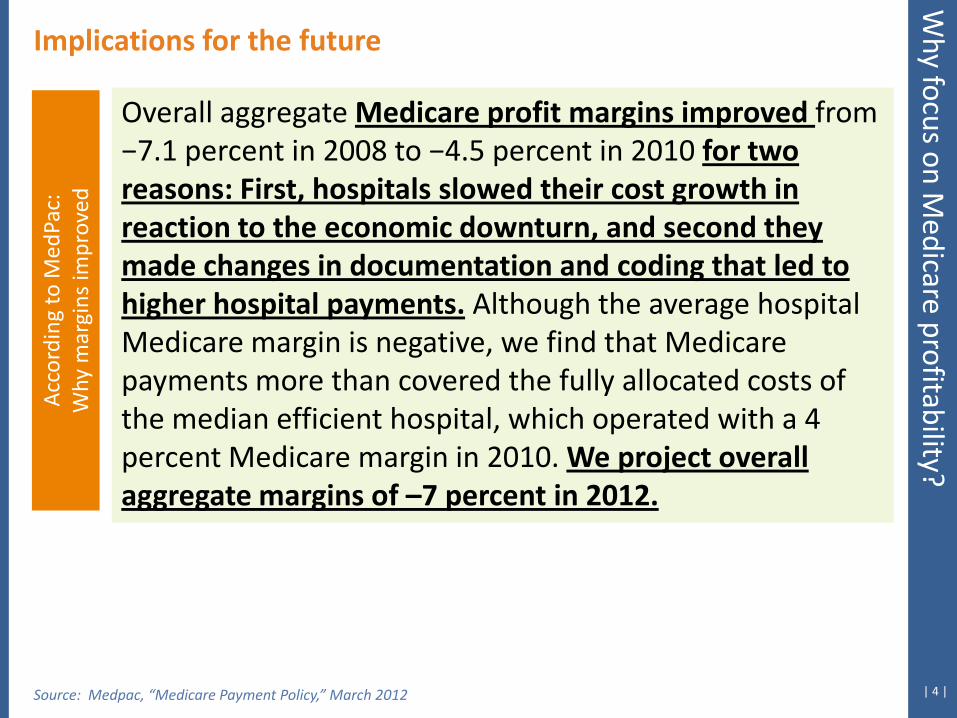
Source: Medpac, “Medicare Payment Policy,” March 2012
Acc
ordi
ng to
Med
Pac:
W
hy m
argi
ns im
prov
ed
Overall aggregate Medicare profit margins improved from −7.1 percent in 2008 to −4.5 percent in 2010 for two reasons: First, hospitals slowed their cost growth in reaction to the economic downturn, and second they made changes in documentation and coding that led to higher hospital payments. Although the average hospital Medicare margin is negative, we find that Medicare payments more than covered the fully allocated costs of the median efficient hospital, which operated with a 4 percent Medicare margin in 2010. We project overall aggregate margins of –7 percent in 2012.
| 5 |
Implications for the future W
hy focus on Medicare profitability?
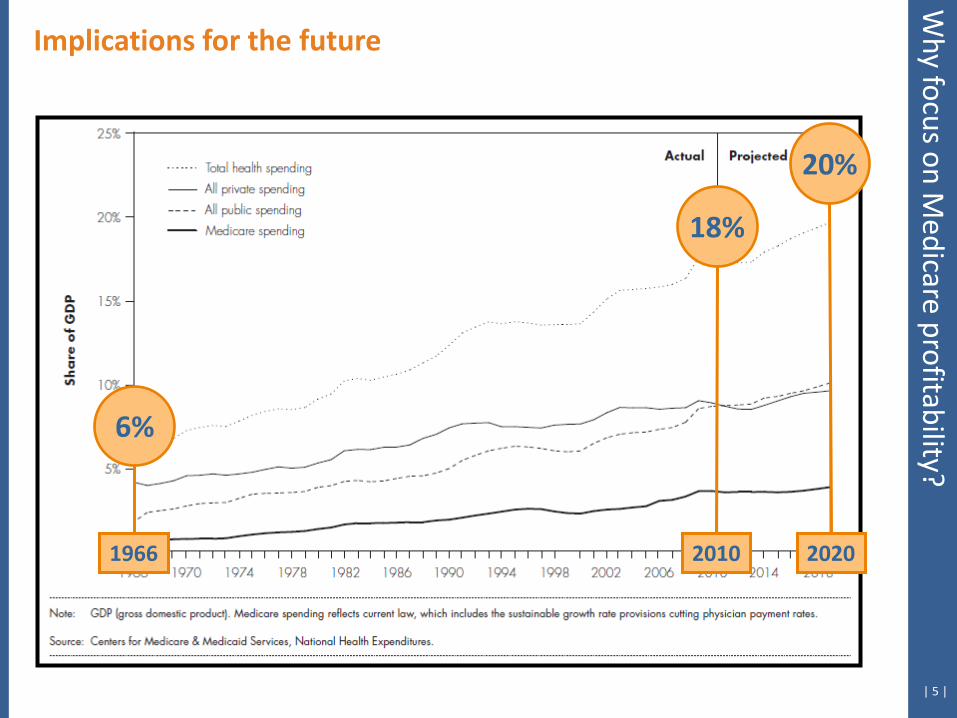
18%
20%
6%
2010 2020 1966

| 6 |
Implications for the future W
hy focus on Medicare profitability?
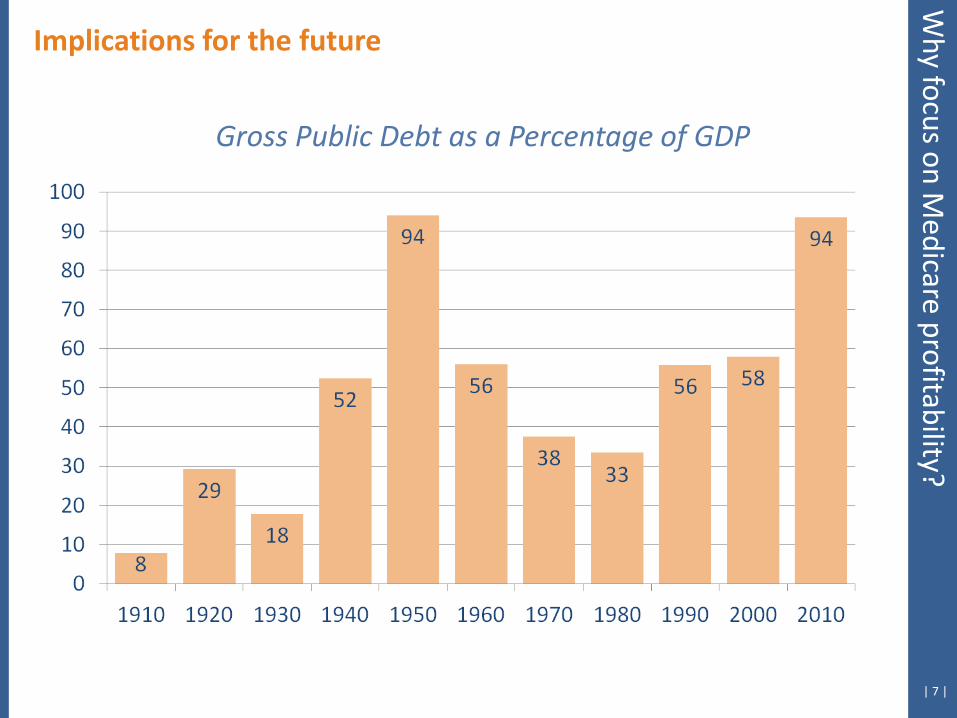
Source: CMS Data Compendium 2011 Edition
| 7 |
Implications for the future
Gross Public Debt as a Percentage of GDP
Why focus on M
edicare profitability?

| 8 |
A little math:
Implications for the future
Rising Health Expenditures + Increasing Government Responsibility for Healthcare + Rapidly Escalating Federal Debt Levels = Limited Growth for Federal Health Programs
Why focus on M
edicare profitability?
Medicare Payment Information
| 10 |
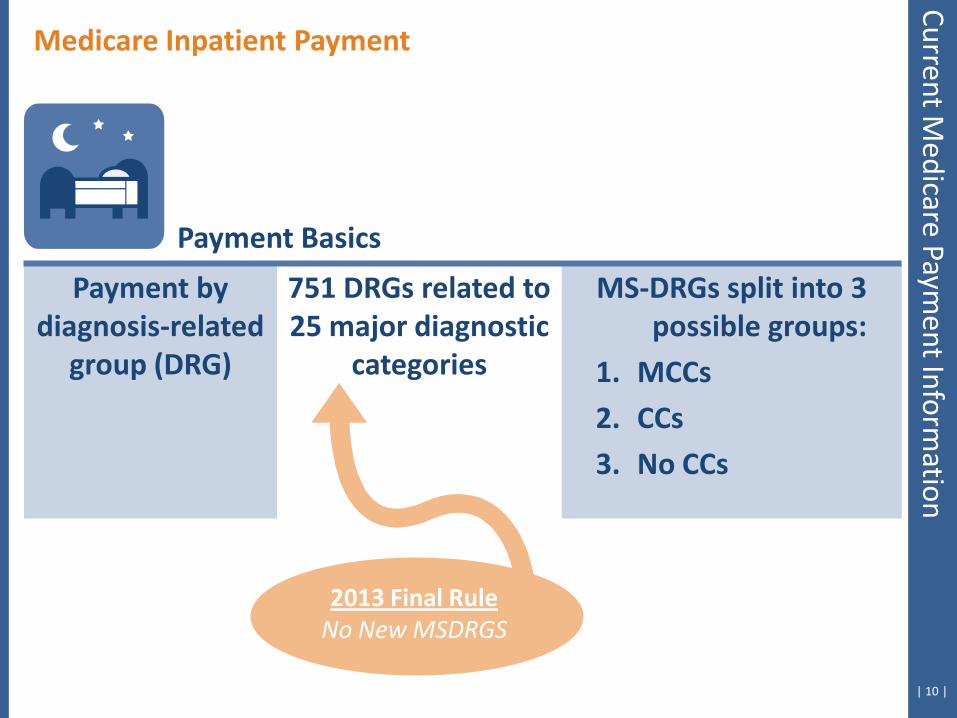
Payment by diagnosis-related
group (DRG)
751 DRGs related to 25 major diagnostic
categories
MS-DRGs split into 3 possible groups:
1. MCCs
2. CCs
3. No CCs
Medicare Inpatient Payment
Payment Basics
Current Medicare Paym
ent Information
2013 Final Rule No New MSDRGS
| 11 |
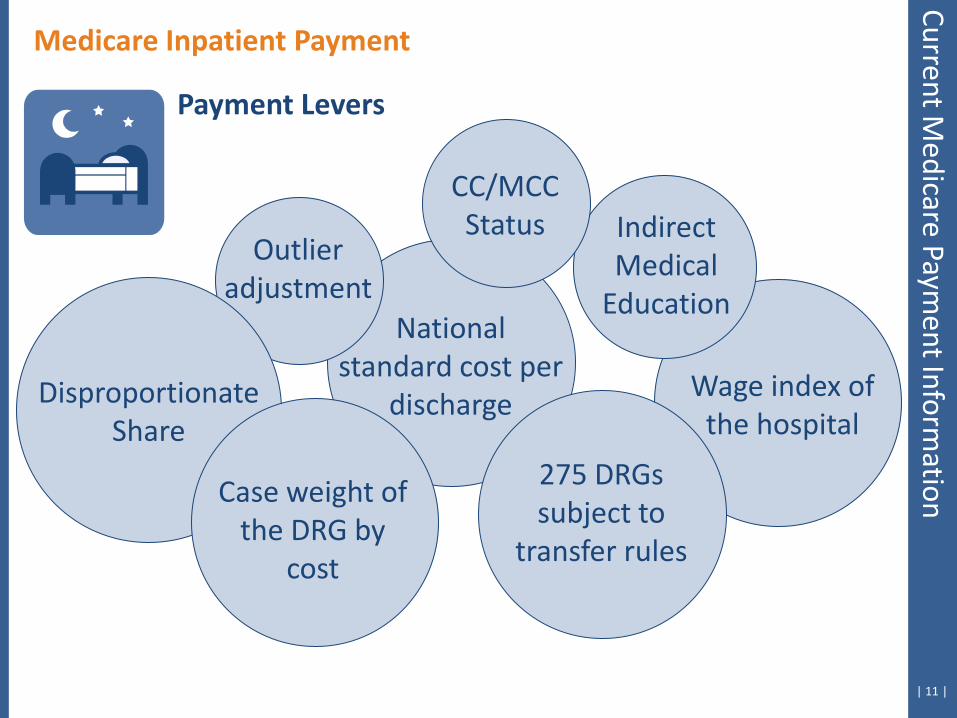
Case weight of
the DRG by cost
National standard cost per
discharge Wage index of
the hospital
Indirect Medical
Education
Disproportionate Share
Outlier adjustment
275 DRGs subject to
transfer rules
Medicare Inpatient Payment
Payment Levers
Current Medicare Paym
ent Information
CC/MCC Status
| 12 | Source: 2013 IPPS Final Rule
Medicare Inpatient Payment
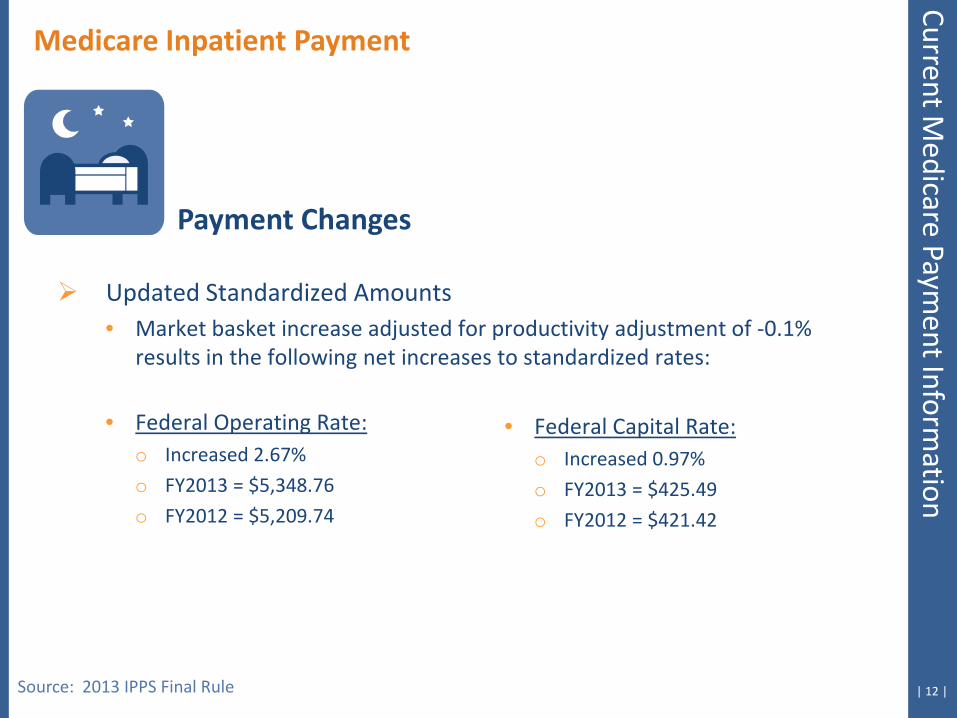
Payment Changes
Current Medicare Paym
ent Information
Updated Standardized Amounts • Market basket increase adjusted for productivity adjustment of -0.1%
results in the following net increases to standardized rates:
• Federal Operating Rate: o Increased 2.67%
o FY2013 = $5,348.76
o FY2012 = $5,209.74
• Federal Capital Rate: o Increased 0.97%
o FY2013 = $425.49
o FY2012 = $421.42
| 13 | Source: 2013 IPPS Final Rule
Medicare Inpatient Payment
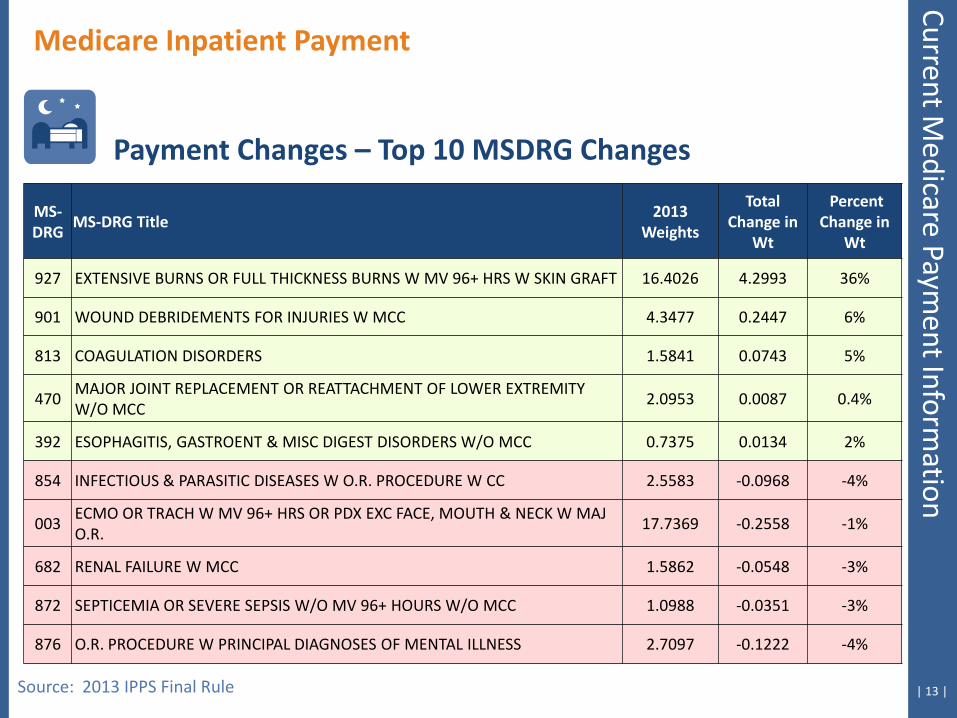
Payment Changes – Top 10 MSDRG Changes
MS-DRG
MS-DRG Title 2013
Weights
Total Change in
Wt
Percent Change in
Wt
927 EXTENSIVE BURNS OR FULL THICKNESS BURNS W MV 96+ HRS W SKIN GRAFT 16.4026 4.2993 36%
901 WOUND DEBRIDEMENTS FOR INJURIES W MCC 4.3477 0.2447 6%
813 COAGULATION DISORDERS 1.5841 0.0743 5%
470 MAJOR JOINT REPLACEMENT OR REATTACHMENT OF LOWER EXTREMITY W/O MCC
2.0953 0.0087 0.4%
392 ESOPHAGITIS, GASTROENT & MISC DIGEST DISORDERS W/O MCC 0.7375 0.0134 2%
854 INFECTIOUS & PARASITIC DISEASES W O.R. PROCEDURE W CC 2.5583 -0.0968 -4%
003 ECMO OR TRACH W MV 96+ HRS OR PDX EXC FACE, MOUTH & NECK W MAJ O.R.
17.7369 -0.2558 -1%
682 RENAL FAILURE W MCC 1.5862 -0.0548 -3%
872 SEPTICEMIA OR SEVERE SEPSIS W/O MV 96+ HOURS W/O MCC 1.0988 -0.0351 -3%
876 O.R. PROCEDURE W PRINCIPAL DIAGNOSES OF MENTAL ILLNESS 2.7097 -0.1222 -4%
Current Medicare Paym
ent Information
| 14 |
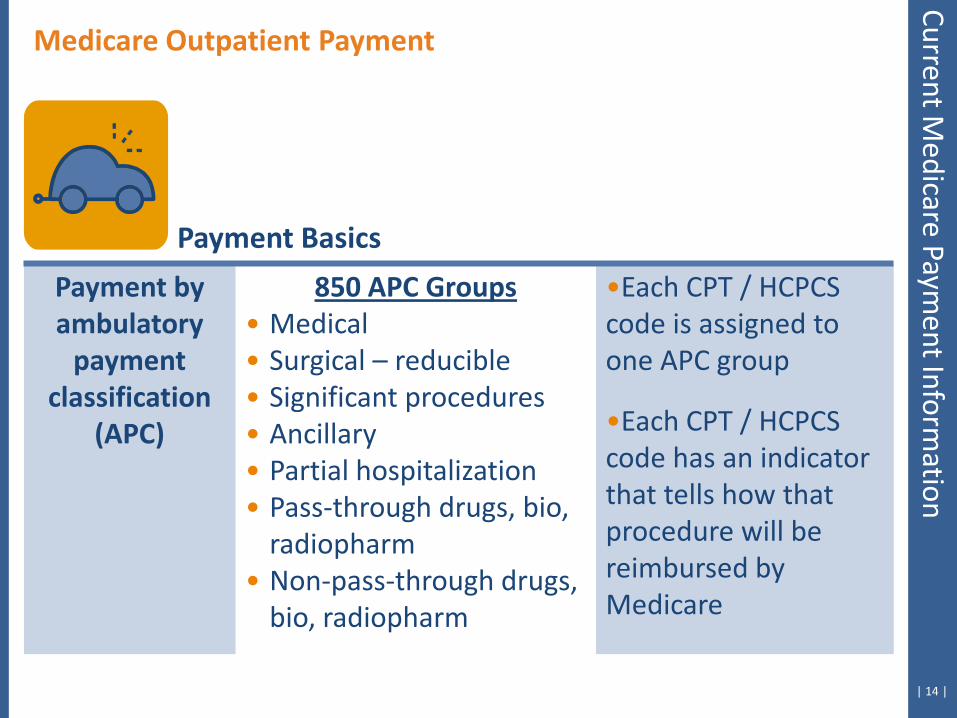
Payment by ambulatory
payment classification
(APC)
850 APC Groups • Medical • Surgical – reducible • Significant procedures • Ancillary • Partial hospitalization • Pass-through drugs, bio,
radiopharm • Non-pass-through drugs,
bio, radiopharm
•Each CPT / HCPCS code is assigned to one APC group
•Each CPT / HCPCS code has an indicator that tells how that procedure will be reimbursed by Medicare
Payment Basics
Medicare Outpatient Payment Current M
edicare Payment Inform
ation

| 15 |
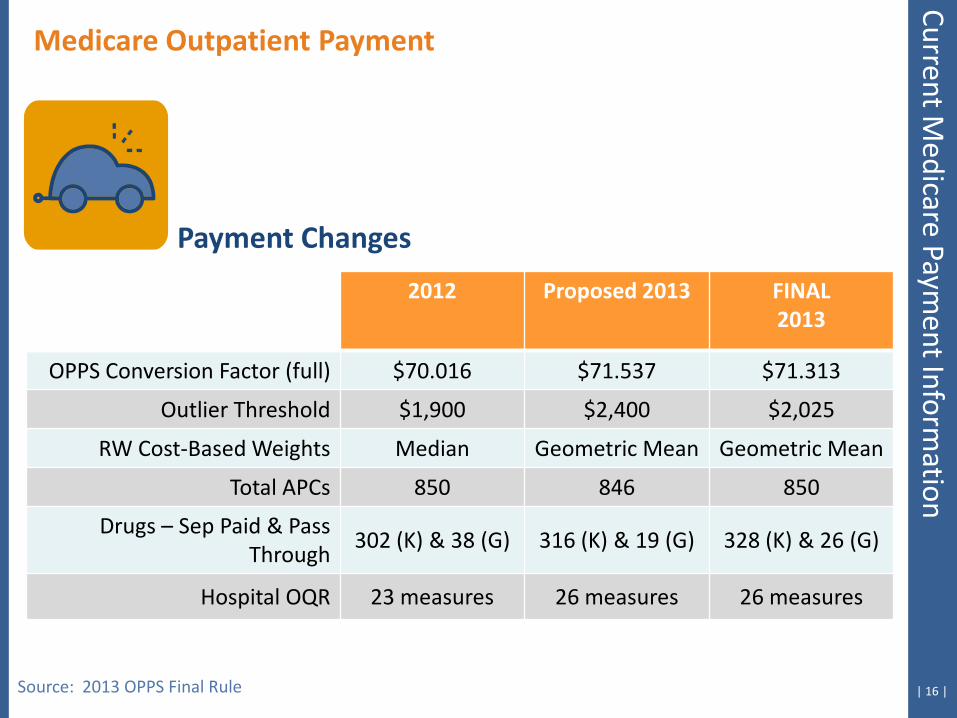
Payment Changes
Medicare Outpatient Payment
• Increase to Conversion Factor = $71.313 (2012=$70.016) • HOP QDRP Measures 2011 – 2014
• 26 measures collected • Outlier Threshold = $2,025 (2012=$1,900) • 850 APCs • Key Change
• RW cost-based weights will use Geometric Means rather than Median
Source: 2013 OPPS Final Rule
Current Medicare Paym
ent Information
| 16 |
Payment Changes
Medicare Outpatient Payment Current M
edicare Payment Inform
ation
2012 Proposed 2013 FINAL 2013
OPPS Conversion Factor (full) $70.016 $71.537 $71.313
Outlier Threshold $1,900 $2,400 $2,025
RW Cost-Based Weights Median Geometric Mean Geometric Mean
Total APCs 850 846 850
Drugs – Sep Paid & Pass Through
302 (K) & 38 (G) 316 (K) & 19 (G) 328 (K) & 26 (G)
Hospital OQR 23 measures 26 measures 26 measures
Source: 2013 OPPS Final Rule
| 17 |
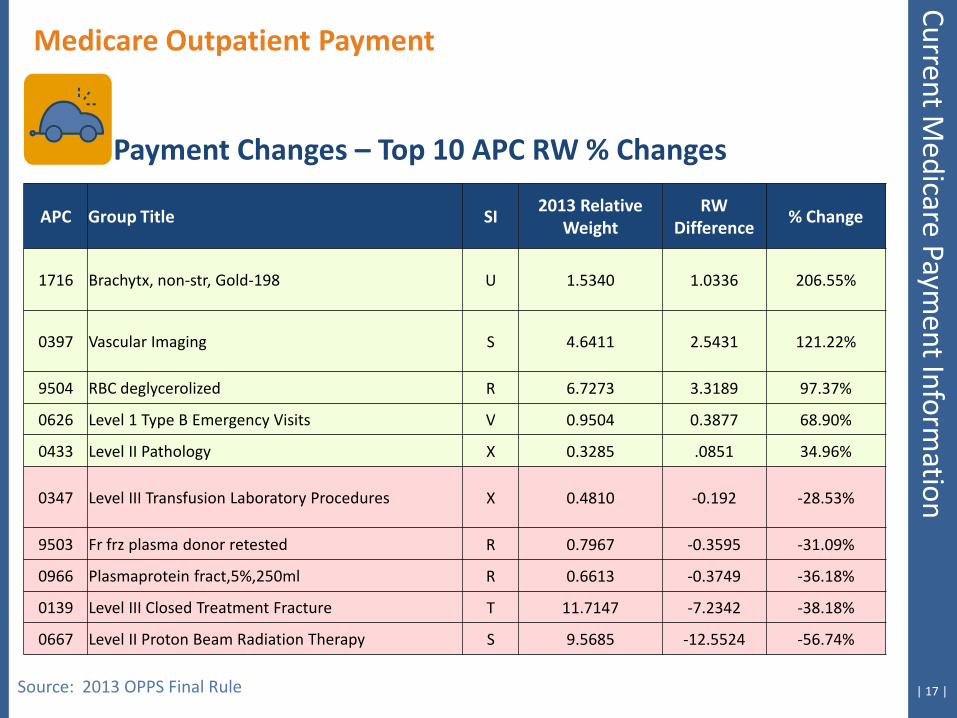
Medicare Outpatient Payment
Source: 2013 OPPS Final Rule
Payment Changes – Top 10 APC RW % Changes
APC Group Title SI 2013 Relative
Weight RW
Difference % Change
1716 Brachytx, non-str, Gold-198 U 1.5340 1.0336 206.55%
0397 Vascular Imaging S 4.6411 2.5431 121.22%
9504 RBC deglycerolized R 6.7273 3.3189 97.37%
0626 Level 1 Type B Emergency Visits V 0.9504 0.3877 68.90%
0433 Level II Pathology X 0.3285 .0851 34.96%
0347 Level III Transfusion Laboratory Procedures X 0.4810 -0.192 -28.53%
9503 Fr frz plasma donor retested R 0.7967 -0.3595 -31.09%
0966 Plasmaprotein fract,5%,250ml R 0.6613 -0.3749 -36.18%
0139 Level III Closed Treatment Fracture T 11.7147 -7.2342 -38.18%
0667 Level II Proton Beam Radiation Therapy S 9.5685 -12.5524 -56.74%
Current Medicare Paym
ent Information

High- and Low-Medicare Profit Hospital Differences
| 19 |
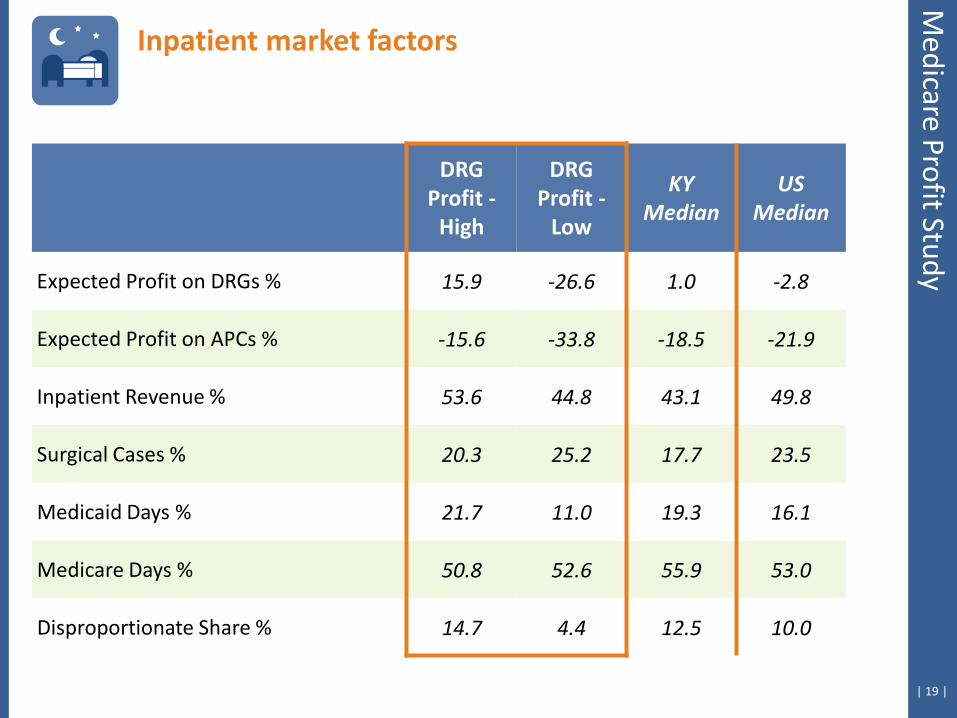
Inpatient market factors
Medicare Profit Study
DRG Profit -
High
DRG Profit -
Low
KY Median
US Median
Expected Profit on DRGs % 15.9 -26.6 1.0 -2.8
Expected Profit on APCs % -15.6 -33.8 -18.5 -21.9
Inpatient Revenue % 53.6 44.8 43.1 49.8
Surgical Cases % 20.3 25.2 17.7 23.5
Medicaid Days % 21.7 11.0 19.3 16.1
Medicare Days % 50.8 52.6 55.9 53.0
Disproportionate Share % 14.7 4.4 12.5 10.0
| 20 | Source: MedPar Files
DRG Profit
– High DRG Profit
– Low US
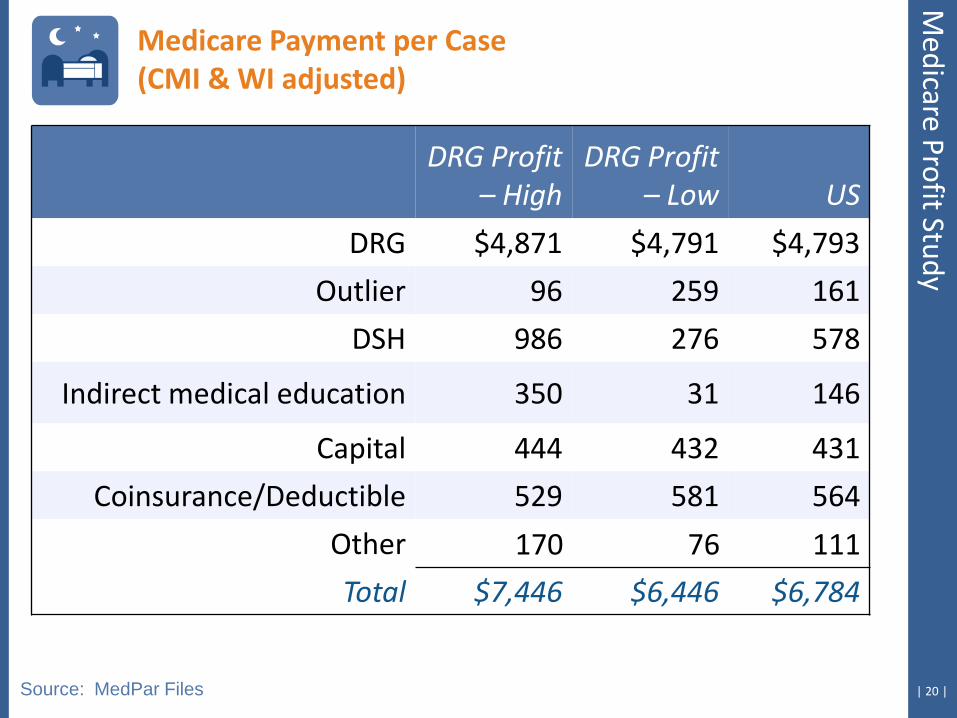
DRG $4,871 $4,791 $4,793
Outlier 96 259 161
DSH 986 276 578
Indirect medical education 350 31 146
Capital 444 432 431
Coinsurance/Deductible 529 581 564
Other 170 76 111
Total $7,446 $6,446 $6,784
Medicare Payment per Case (CMI & WI adjusted)
Medicare Profit Study
| 21 |
DRG Profit –
High DRG Profit –
Low US
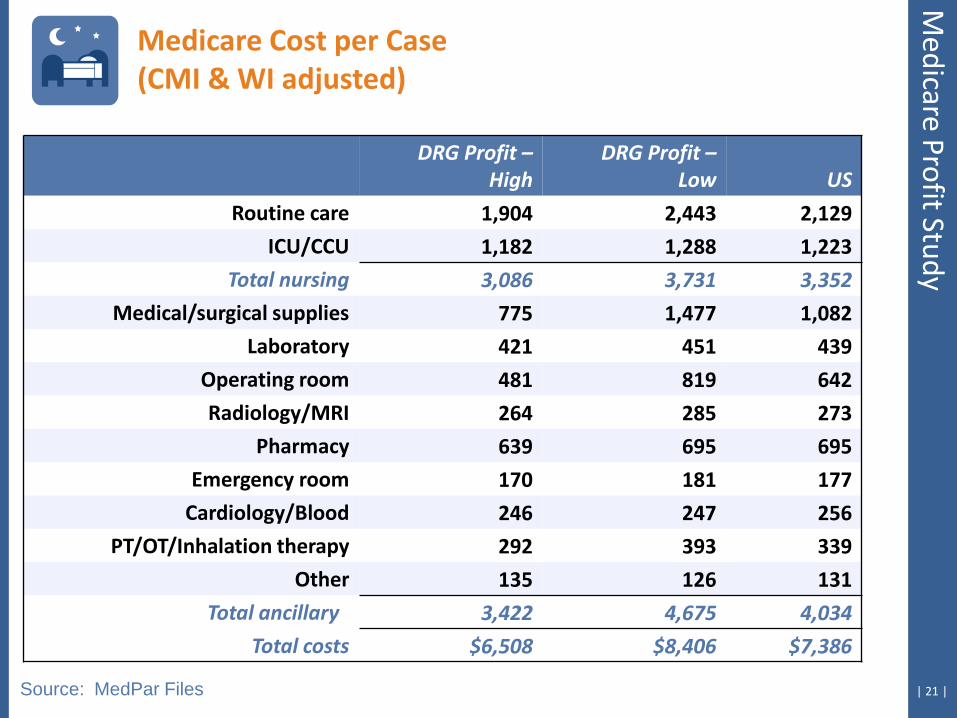
Routine care 1,904 2,443 2,129
ICU/CCU 1,182 1,288 1,223
Total nursing 3,086 3,731 3,352
Medical/surgical supplies 775 1,477 1,082
Laboratory 421 451 439
Operating room 481 819 642
Radiology/MRI 264 285 273
Pharmacy 639 695 695
Emergency room 170 181 177
Cardiology/Blood 246 247 256
PT/OT/Inhalation therapy 292 393 339
Other 135 126 131
Total ancillary 3,422 4,675 4,034
Total costs $6,508 $8,406 $7,386
Source: MedPar Files
Medicare Cost per Case (CMI & WI adjusted)
Medicare Profit Study
| 22 |
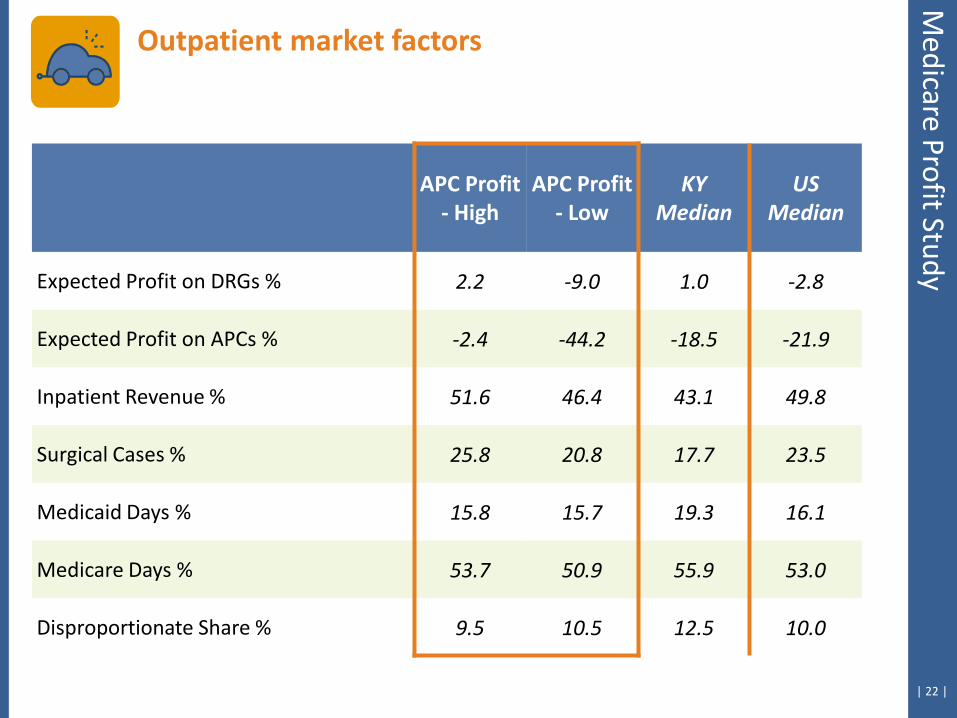
Outpatient market factors
Medicare Profit Study
APC Profit - High
APC Profit - Low
KY Median
US Median
Expected Profit on DRGs % 2.2 -9.0 1.0 -2.8
Expected Profit on APCs % -2.4 -44.2 -18.5 -21.9
Inpatient Revenue % 51.6 46.4 43.1 49.8
Surgical Cases % 25.8 20.8 17.7 23.5
Medicaid Days % 15.8 15.7 19.3 16.1
Medicare Days % 53.7 50.9 55.9 53.0
Disproportionate Share % 9.5 10.5 12.5 10.0
| 23 |
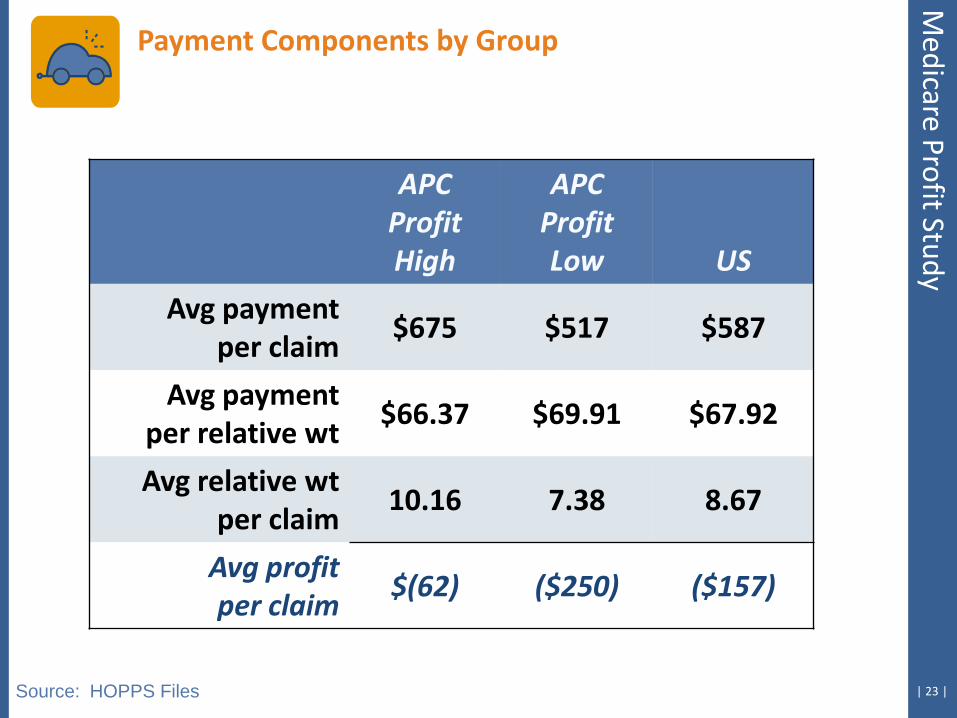
APC Profit High
APC Profit Low US
Avg payment per claim
$675 $517 $587
Avg payment per relative wt
$66.37 $69.91 $67.92
Avg relative wt per claim
10.16 7.38 8.67
Avg profit per claim
$(62) ($250) ($157)
Source: HOPPS Files
Payment Components by Group
Medicare Profit Study
| 24 |
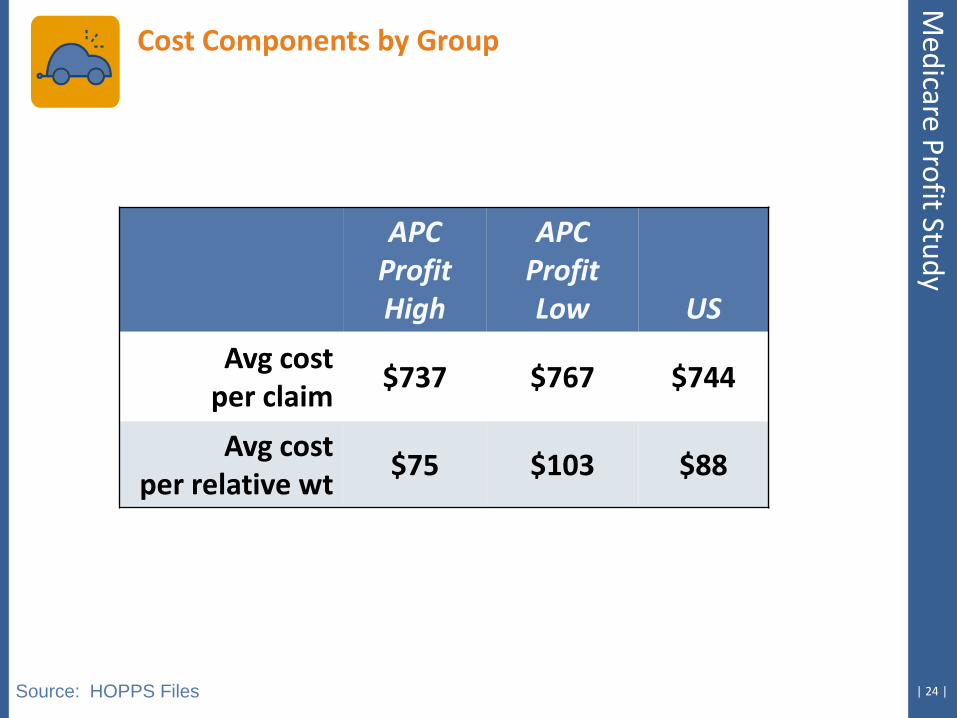
APC Profit High
APC Profit Low US
Avg cost per claim
$737 $767 $744
Avg cost per relative wt
$75 $103 $88
Source: HOPPS Files
Cost Components by Group
Medicare Profit Study
Review Current Medicare Profit
Case Hospital Discussion
| 26 |
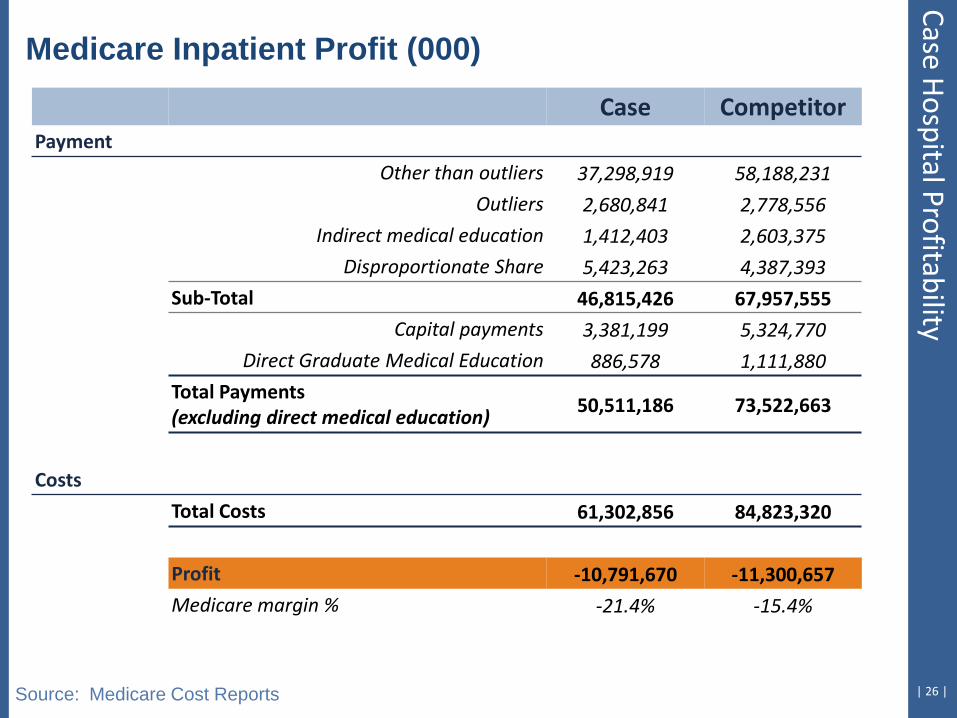
Medicare Inpatient Profit (000)
Source: Medicare Cost Reports
Case Competitor Payment
Other than outliers 37,298,919 58,188,231
Outliers 2,680,841 2,778,556
Indirect medical education 1,412,403 2,603,375
Disproportionate Share 5,423,263 4,387,393
Sub-Total 46,815,426 67,957,555
Capital payments 3,381,199 5,324,770
Direct Graduate Medical Education 886,578 1,111,880
Total Payments (excluding direct medical education) 50,511,186 73,522,663
Costs
Total Costs 61,302,856 84,823,320
Profit -10,791,670 -11,300,657
Medicare margin % -21.4% -15.4%
Case Hospital Profitability
| 27 |
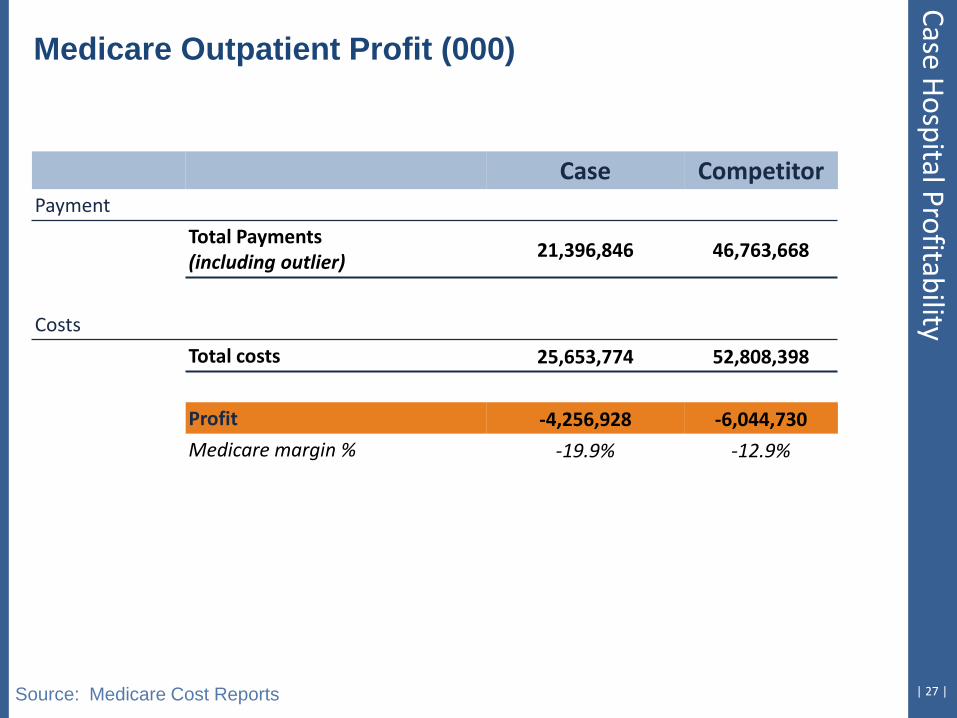
Medicare Outpatient Profit (000)
Source: Medicare Cost Reports
Case Competitor Payment
Total Payments (including outlier) 21,396,846 46,763,668
Costs
Total costs 25,653,774 52,808,398
Profit -4,256,928 -6,044,730
Medicare margin % -19.9% -12.9%
Case Hospital Profitability
Ten Areas to Enhance Medicare Profitability
| 29 |
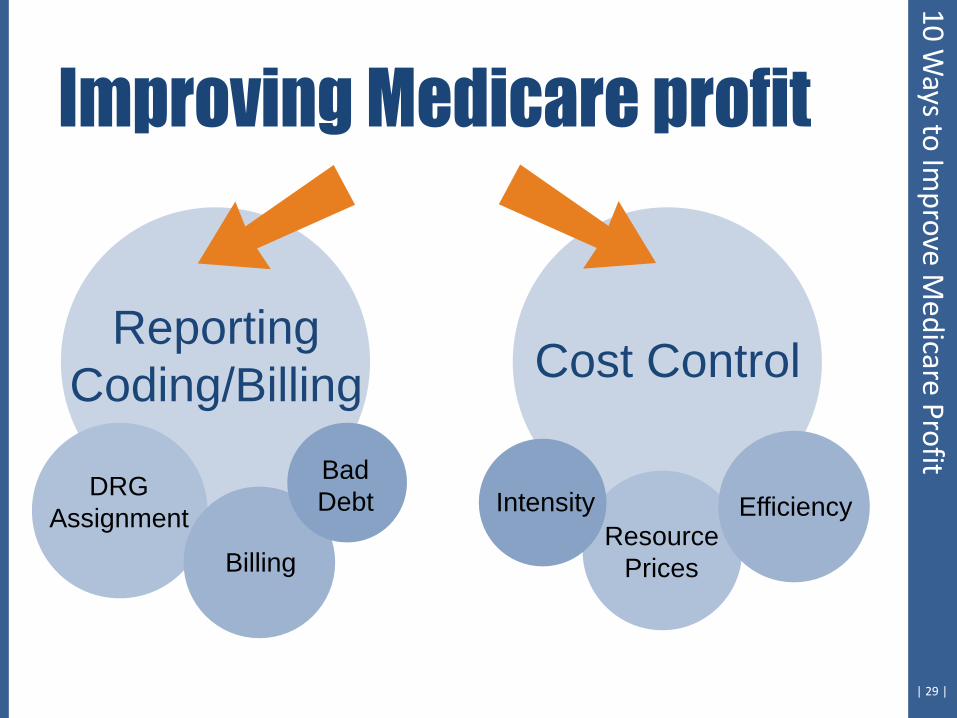
DRG
Assignment
Billing
Bad Debt
Resource Prices
Efficiency Intensity
Reporting Coding/Billing Cost Control
10 Ways to Im
prove Medicare Profit

1. Payment Issues: Medicare Bad Debt, DSH
| 31 |
Notes on bad debt and DSH: • Medicare bad debt levels have been increasing across the US, but
leveled off in 2011. Determine if your levels reflect “typical” increases. Levels can be compared historically and to peers.
• Medicare disproportionate share payments (DSH) are targeted for reduction in the ACA, but will still be an important revenue source for qualifying hospitals. Comparison of DSH levels in your market can serve as an important benchmark. Medicaid eligible patient assessment is key.
• SSI, which is a component of the DSH calculation, may present opportunities as hospitals have the option to use their cost report year rather than the published data based on the FFY.
1 Payment Issues 10 W
ays to Improve M
edicare Profit
| 32 |
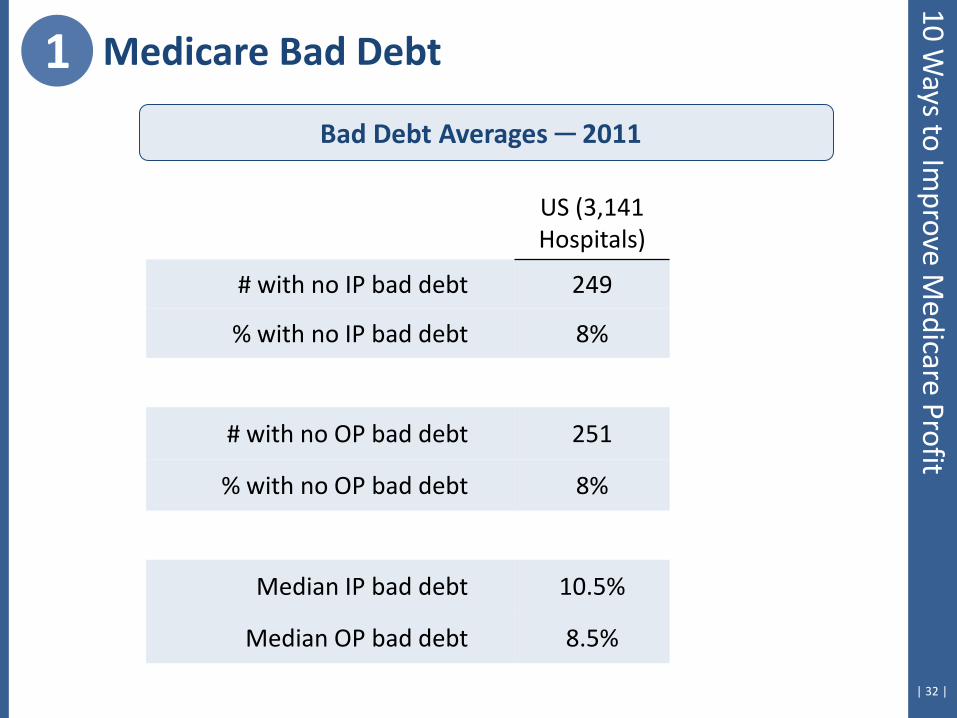
Bad Debt Averages ─ 2011
US (3,141 Hospitals)
# with no IP bad debt 249
% with no IP bad debt 8%
# with no OP bad debt 251
% with no OP bad debt 8%
Median IP bad debt 10.5%
Median OP bad debt 8.5%
1 Medicare Bad Debt 10 W
ays to Improve M
edicare Profit
| 33 |
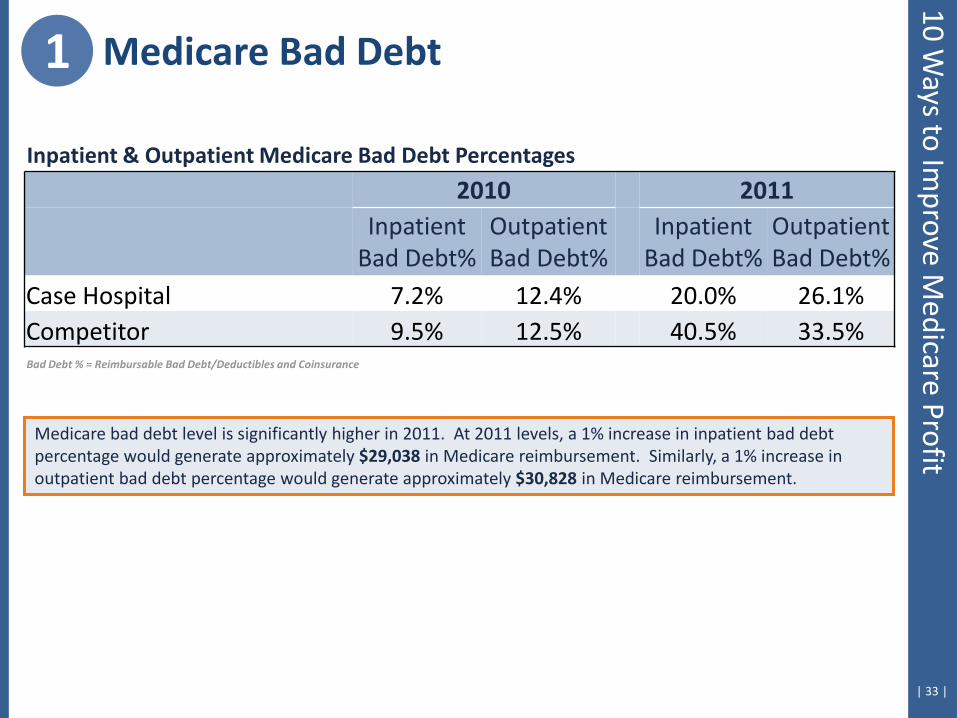
2010 2011
Inpatient
Bad Debt% Outpatient Bad Debt%
Inpatient Bad Debt%
Outpatient Bad Debt%
Case Hospital 7.2% 12.4% 20.0% 26.1% Competitor 9.5% 12.5% 40.5% 33.5%
Inpatient & Outpatient Medicare Bad Debt Percentages
Bad Debt % = Reimbursable Bad Debt/Deductibles and Coinsurance
Medicare bad debt level is significantly higher in 2011. At 2011 levels, a 1% increase in inpatient bad debt percentage would generate approximately $29,038 in Medicare reimbursement. Similarly, a 1% increase in outpatient bad debt percentage would generate approximately $30,828 in Medicare reimbursement.
1 Medicare Bad Debt 10 W
ays to Improve M
edicare Profit
| 34 |
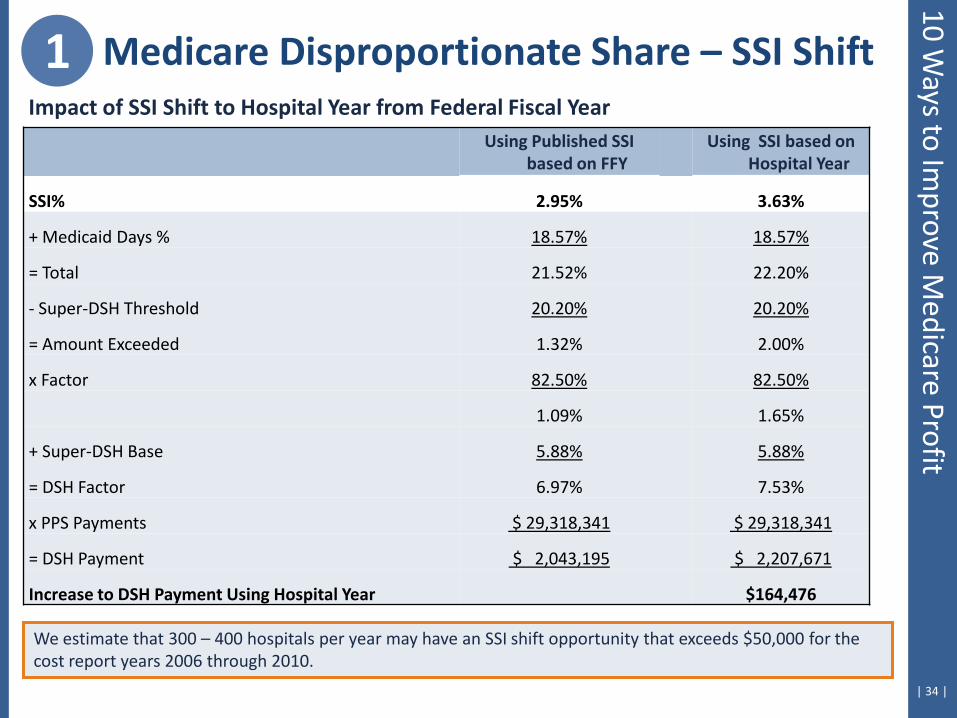
Using Published SSI based on FFY
Using SSI based on Hospital Year
SSI% 2.95% 3.63%
+ Medicaid Days % 18.57% 18.57%
= Total 21.52% 22.20%
- Super-DSH Threshold 20.20% 20.20%
= Amount Exceeded 1.32% 2.00%
x Factor 82.50% 82.50%
1.09% 1.65%
+ Super-DSH Base 5.88% 5.88%
= DSH Factor 6.97% 7.53%
x PPS Payments $ 29,318,341 $ 29,318,341
= DSH Payment $ 2,043,195 $ 2,207,671
Increase to DSH Payment Using Hospital Year $164,476
Impact of SSI Shift to Hospital Year from Federal Fiscal Year
We estimate that 300 – 400 hospitals per year may have an SSI shift opportunity that exceeds $50,000 for the cost report years 2006 through 2010.
1 Medicare Disproportionate Share – SSI Shift 10 W
ays to Improve M
edicare Profit
2. Review DRG Coding
| 36 |
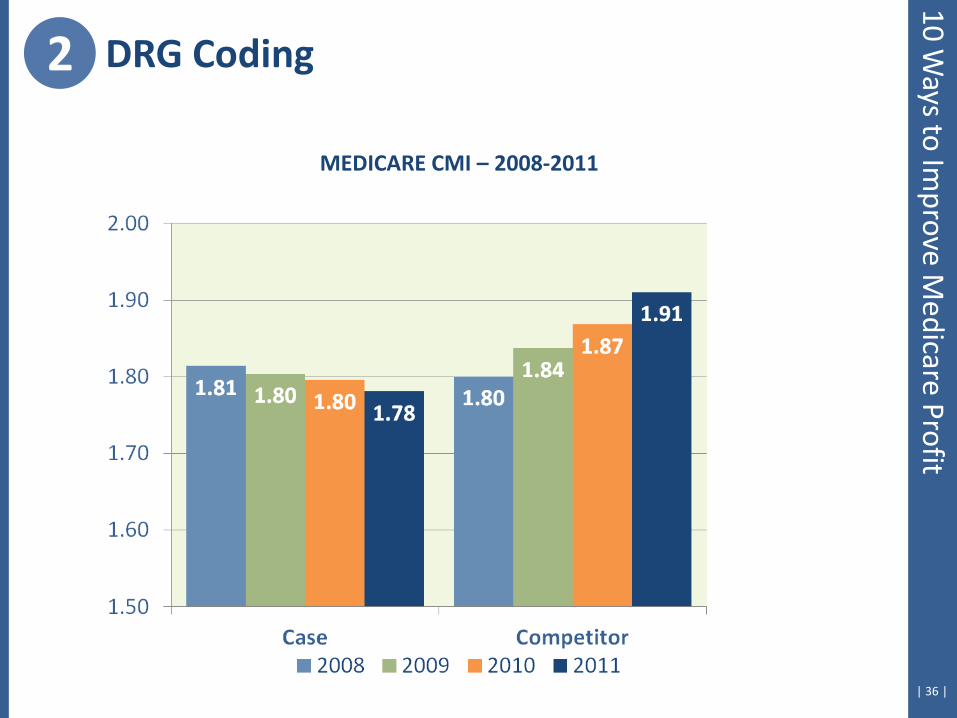
MEDICARE CMI – 2008-2011
2 DRG Coding 10 W
ays to Improve M
edicare Profit
| 37 |
10 Ways to Im
prove Medicare Profit
2 DRG Coding
DRG Profit -
High
DRG Profit -
Low
KY Median
US Median
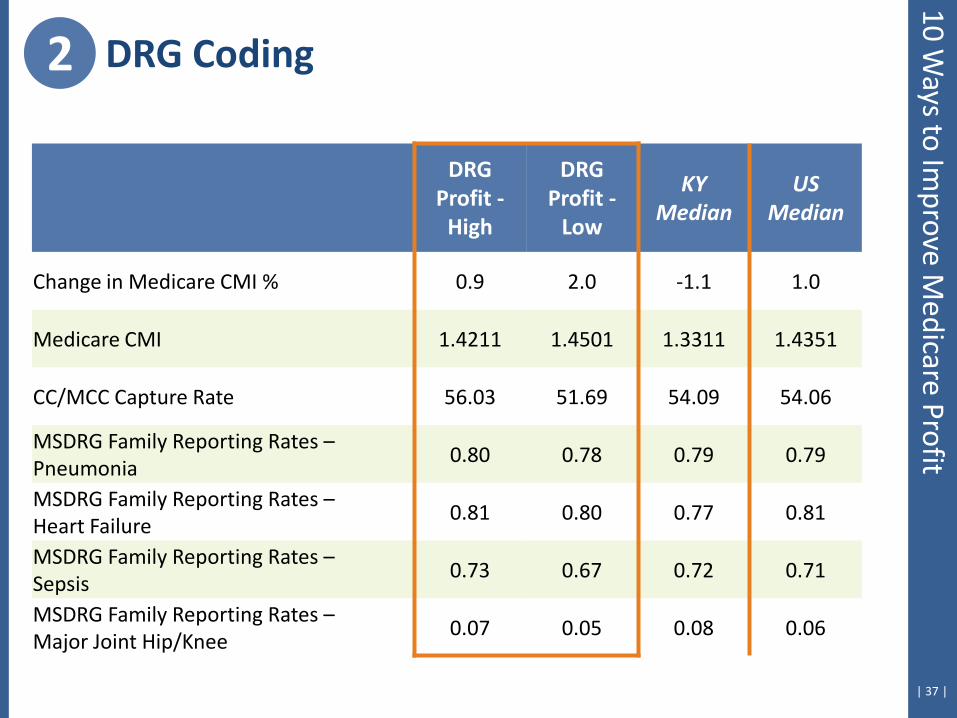
Change in Medicare CMI % 0.9 2.0 -1.1 1.0
Medicare CMI 1.4211 1.4501 1.3311 1.4351
CC/MCC Capture Rate 56.03 51.69 54.09 54.06
MSDRG Family Reporting Rates – Pneumonia
0.80 0.78 0.79 0.79
MSDRG Family Reporting Rates – Heart Failure
0.81 0.80 0.77 0.81
MSDRG Family Reporting Rates – Sepsis
0.73 0.67 0.72 0.71
MSDRG Family Reporting Rates – Major Joint Hip/Knee
0.07 0.05 0.08 0.06
| 38 |
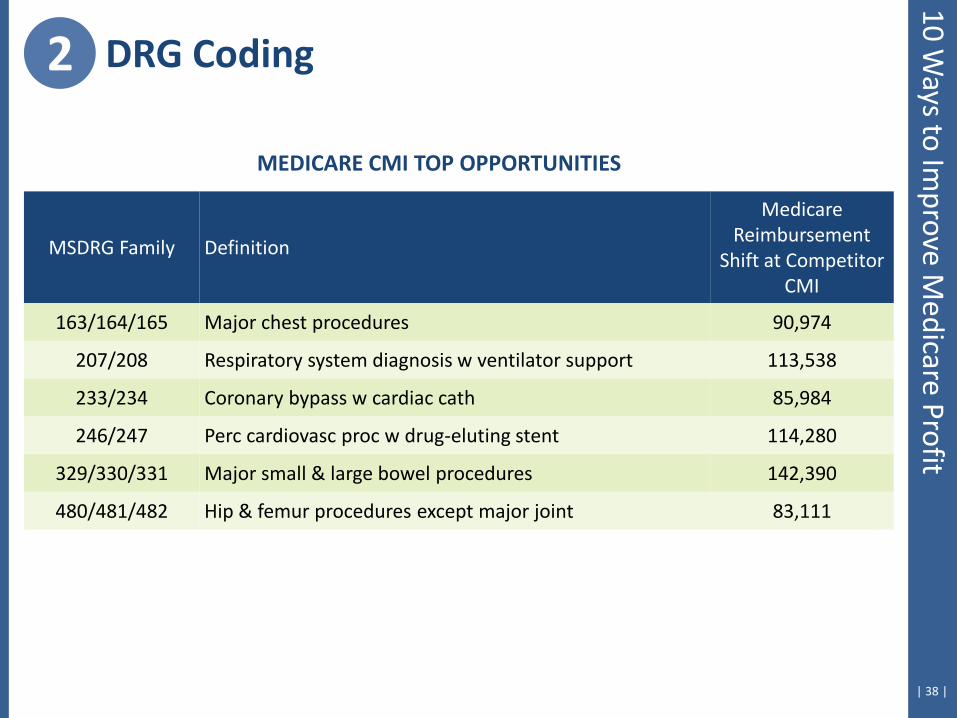
MSDRG Family Definition
Medicare Reimbursement
Shift at Competitor CMI
163/164/165 Major chest procedures 90,974
207/208 Respiratory system diagnosis w ventilator support 113,538
233/234 Coronary bypass w cardiac cath 85,984
246/247 Perc cardiovasc proc w drug-eluting stent 114,280
329/330/331 Major small & large bowel procedures 142,390
480/481/482 Hip & femur procedures except major joint 83,111
MEDICARE CMI TOP OPPORTUNITIES
2 DRG Coding 10 W
ays to Improve M
edicare Profit
| 39 |
Diagnosis Code
Definition % on Case
Hosp Claims
% on Compet Claims
MCC or CC?
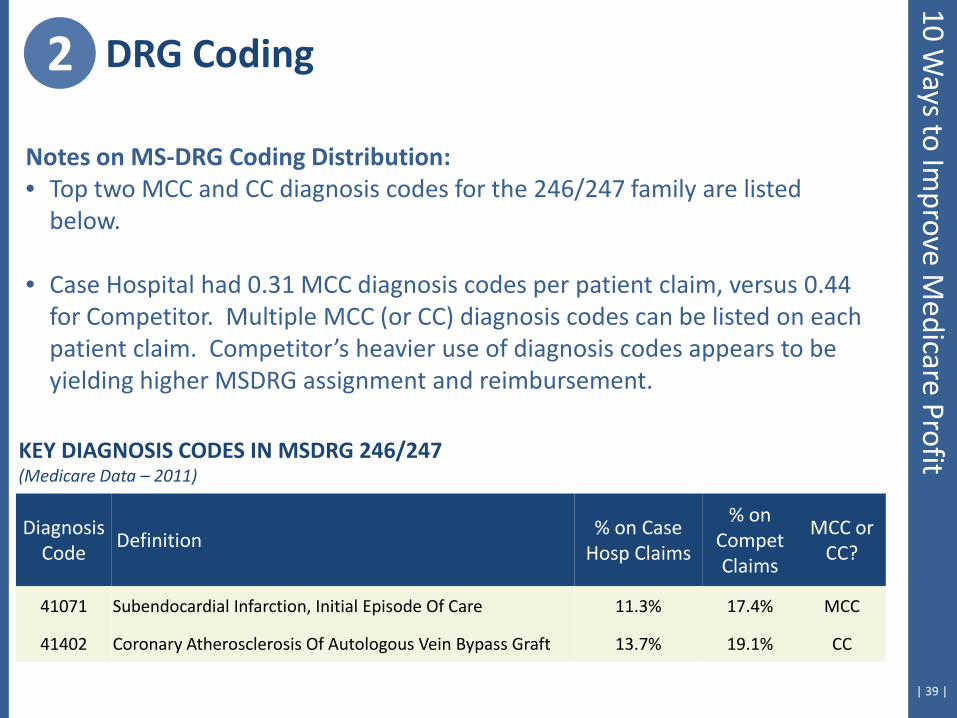
41071 Subendocardial Infarction, Initial Episode Of Care 11.3% 17.4% MCC
41402 Coronary Atherosclerosis Of Autologous Vein Bypass Graft 13.7% 19.1% CC
Notes on MS-DRG Coding Distribution: • Top two MCC and CC diagnosis codes for the 246/247 family are listed
below.
• Case Hospital had 0.31 MCC diagnosis codes per patient claim, versus 0.44 for Competitor. Multiple MCC (or CC) diagnosis codes can be listed on each patient claim. Competitor’s heavier use of diagnosis codes appears to be yielding higher MSDRG assignment and reimbursement.
KEY DIAGNOSIS CODES IN MSDRG 246/247 (Medicare Data – 2011)
2 DRG Coding 10 W
ays to Improve M
edicare Profit
3. Review Transfer Payment Validity
| 41 |
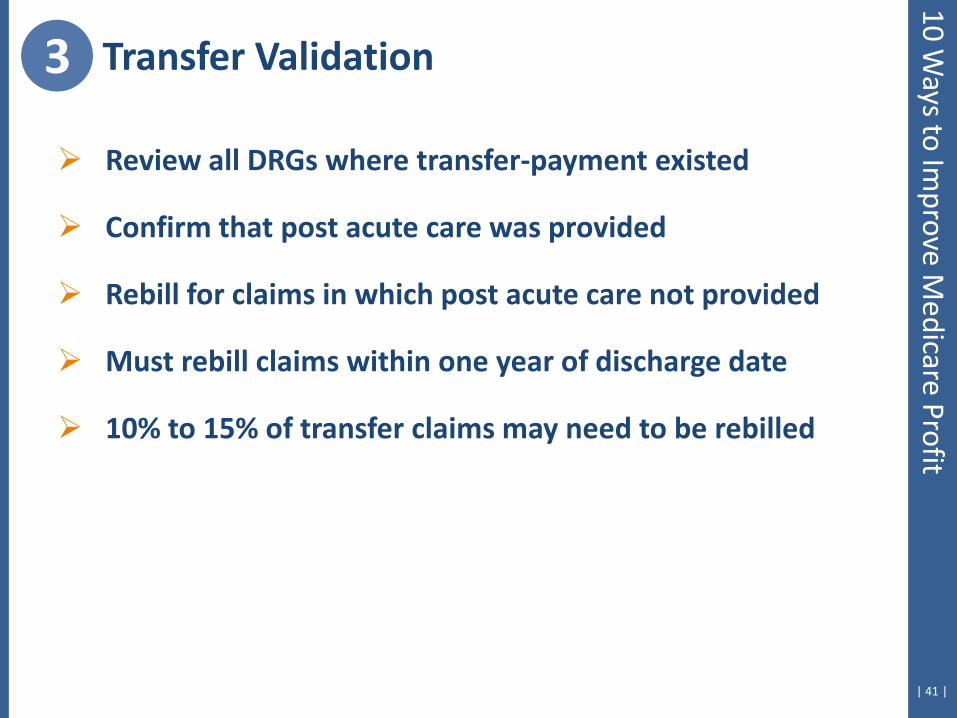
Review all DRGs where transfer-payment existed
Confirm that post acute care was provided
Rebill for claims in which post acute care not provided
Must rebill claims within one year of discharge date
10% to 15% of transfer claims may need to be rebilled
3 Transfer Validation 10 W
ays to Improve M
edicare Profit

| 42 |
MSDRG # 870
02/20/2010 to 02/26/2010
SNF Discharge Status
$20,780 Total payments
$18,444 Additional payment
Transfer Case Example
3 Transfer Validation 10 W
ays to Improve M
edicare Profit
4. Monitor Billing Procedures
| 44 |
4 Billing Procedures 10 W
ays to Improve M
edicare Profit
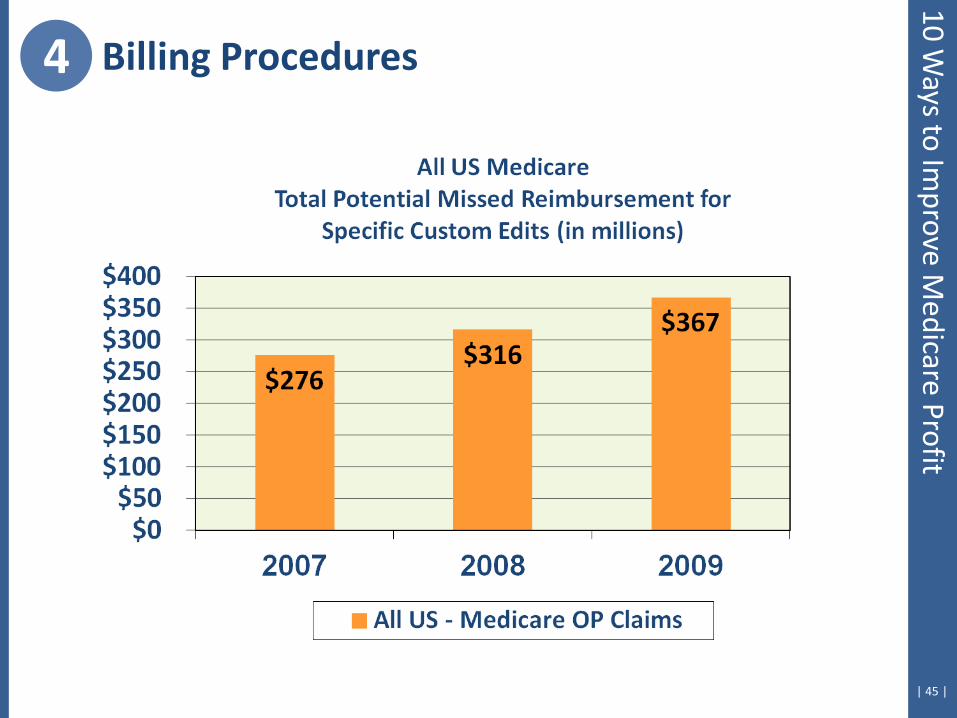
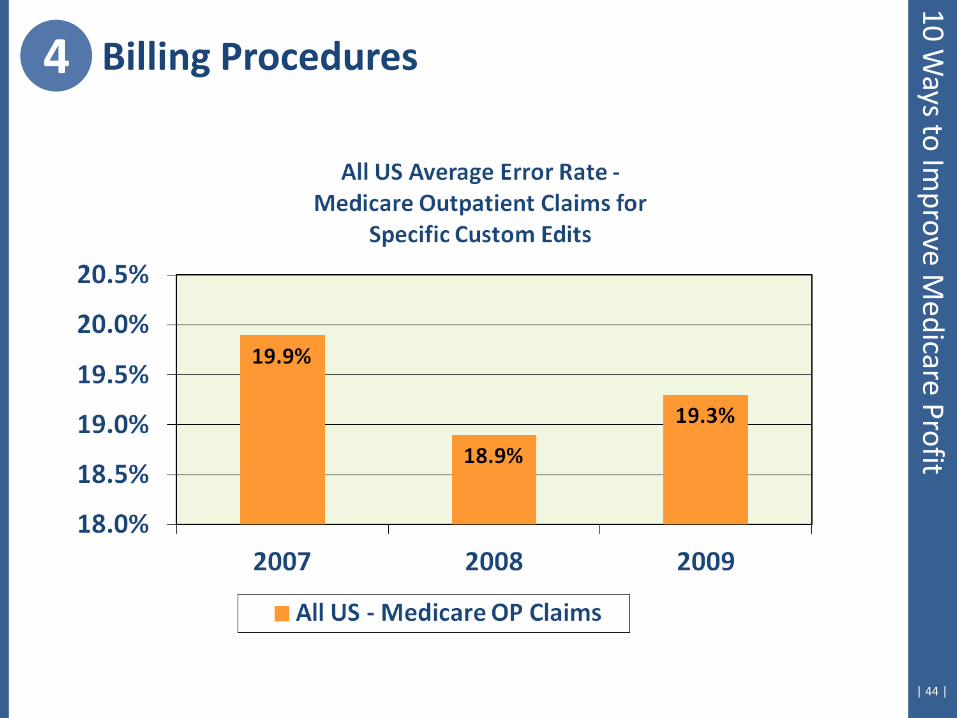
| 45 |
4 Billing Procedures 10 W
ays to Improve M
edicare Profit
| 46 |
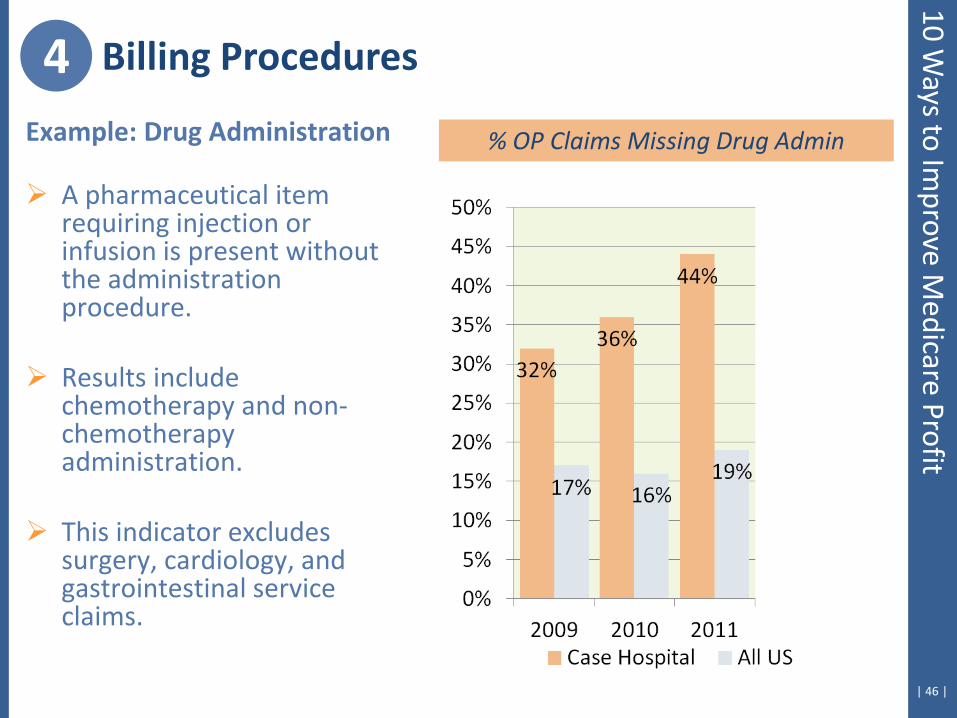
Example: Drug Administration
A pharmaceutical item requiring injection or infusion is present without the administration procedure.
Results include
chemotherapy and non-chemotherapy administration.
This indicator excludes surgery, cardiology, and gastrointestinal service claims.
4 Billing Procedures
% OP Claims Missing Drug Admin
10 Ways to Im
prove Medicare Profit
| 47 |
10 Ways to Im
prove Medicare Profit
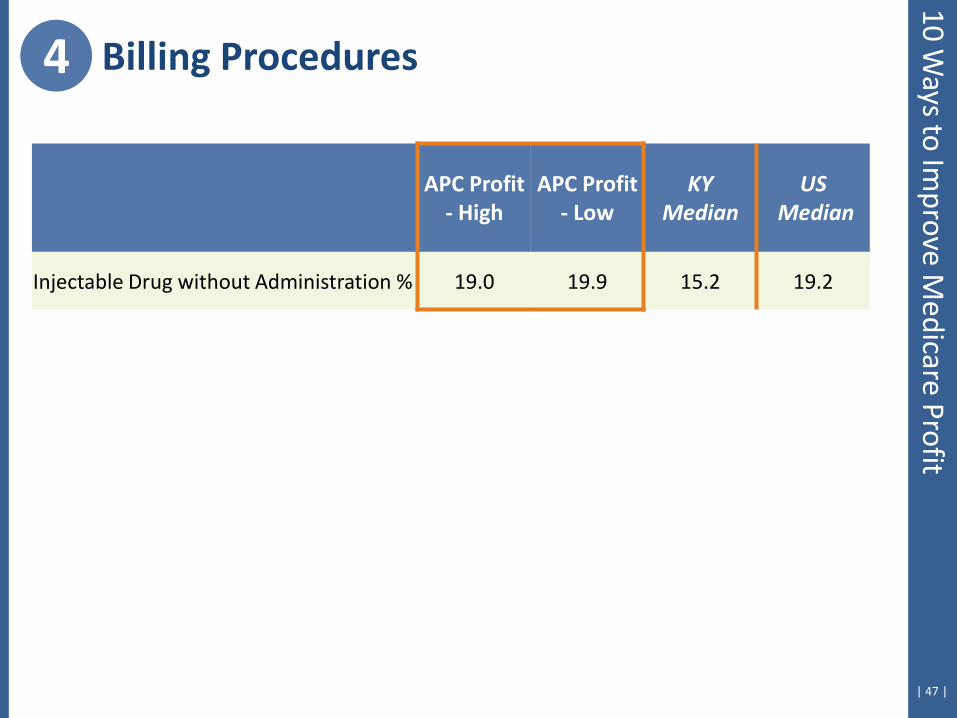
4 Billing Procedures
APC Profit - High
APC Profit - Low
KY Median
US Median
Injectable Drug without Administration % 19.0 19.9 15.2 19.2
| 48 |
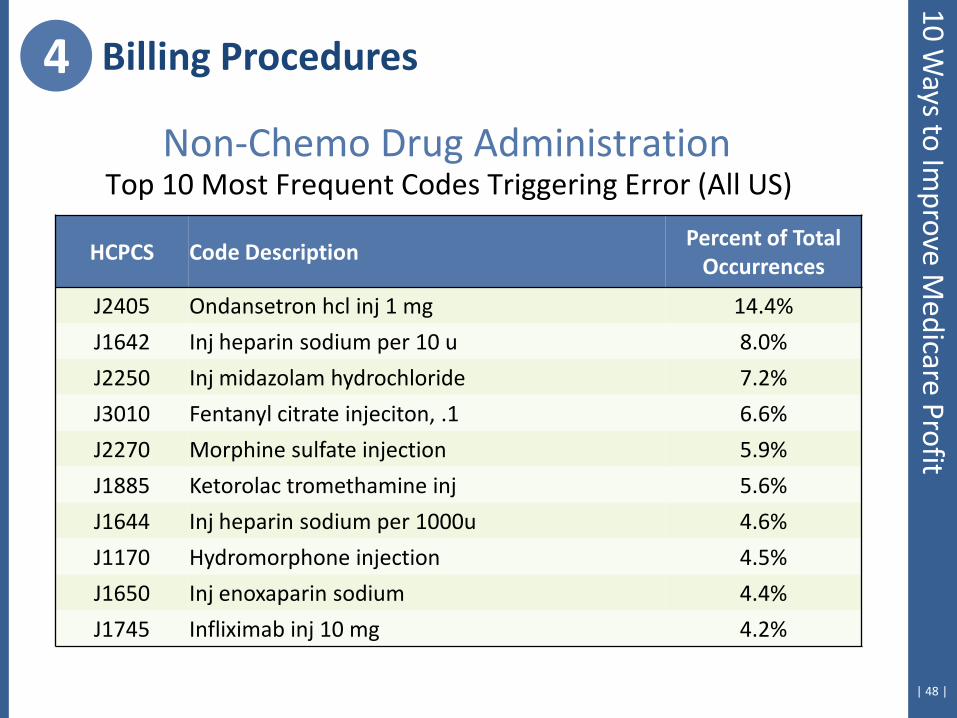
Non-Chemo Drug Administration Top 10 Most Frequent Codes Triggering Error (All US)
HCPCS Code Description Percent of Total
Occurrences
J2405 Ondansetron hcl inj 1 mg 14.4%
J1642 Inj heparin sodium per 10 u 8.0%
J2250 Inj midazolam hydrochloride 7.2%
J3010 Fentanyl citrate injeciton, .1 6.6%
J2270 Morphine sulfate injection 5.9%
J1885 Ketorolac tromethamine inj 5.6%
J1644 Inj heparin sodium per 1000u 4.6%
J1170 Hydromorphone injection 4.5%
J1650 Inj enoxaparin sodium 4.4%
J1745 Infliximab inj 10 mg 4.2%
4 Billing Procedures 10 W
ays to Improve M
edicare Profit
5. Emergency Room & Clinic Coding Frequency
| 50 |
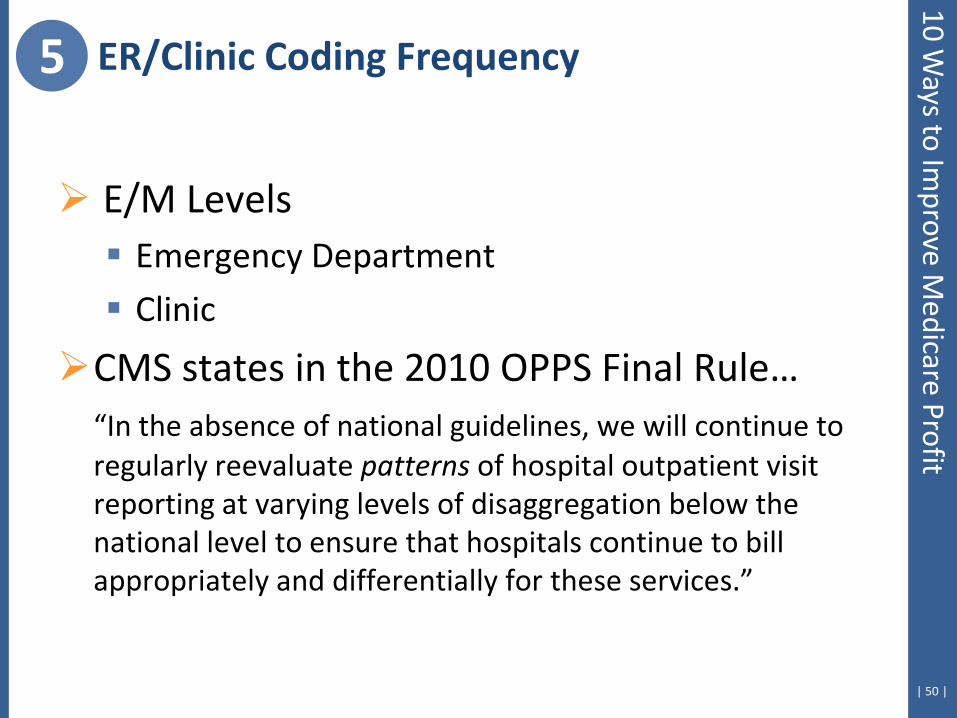
5 ER/Clinic Coding Frequency
E/M Levels Emergency Department
Clinic
CMS states in the 2010 OPPS Final Rule… “In the absence of national guidelines, we will continue to
regularly reevaluate patterns of hospital outpatient visit reporting at varying levels of disaggregation below the national level to ensure that hospitals continue to bill appropriately and differentially for these services.”
10 Ways to Im
prove Medicare Profit
| 51 |
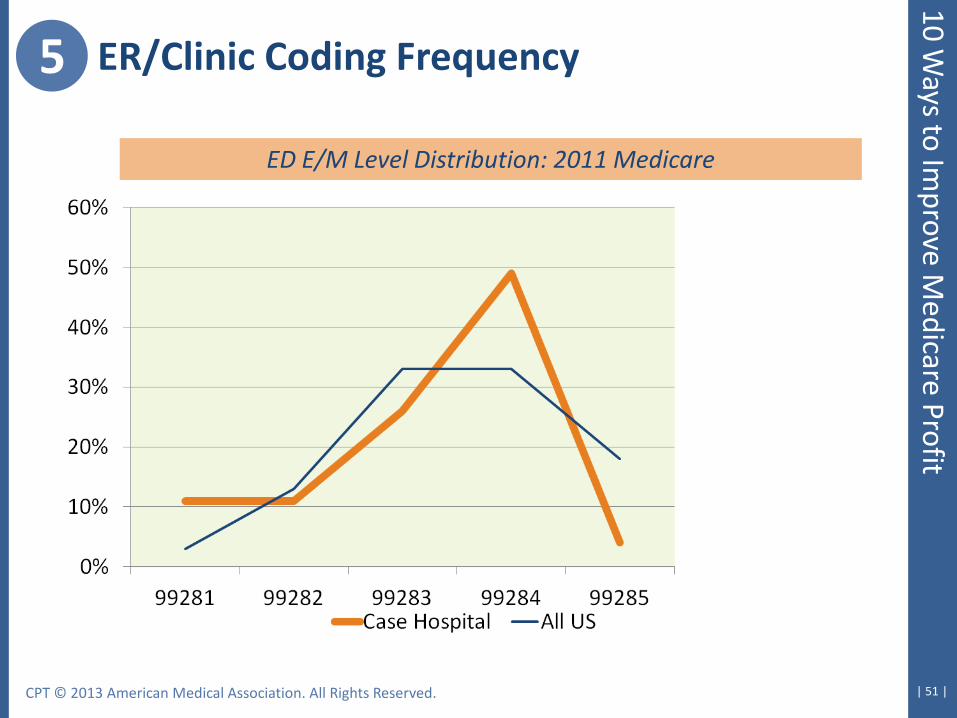
5 ER/Clinic Coding Frequency
ED E/M Level Distribution: 2011 Medicare
CPT © 2013 American Medical Association. All Rights Reserved.
10 Ways to Im
prove Medicare Profit
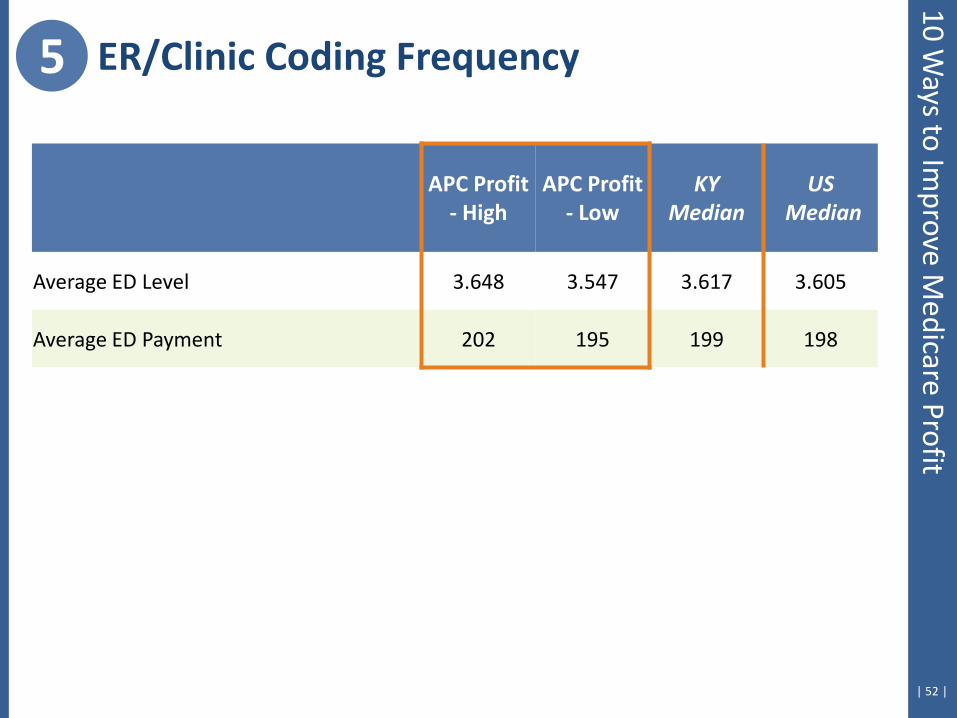
| 52 |
10 Ways to Im
prove Medicare Profit
APC Profit - High
APC Profit - Low
KY Median
US Median
Average ED Level 3.648 3.547 3.617 3.605
Average ED Payment 202 195 199 198
5 ER/Clinic Coding Frequency
6. Comparison with Fee Schedule
| 54 |
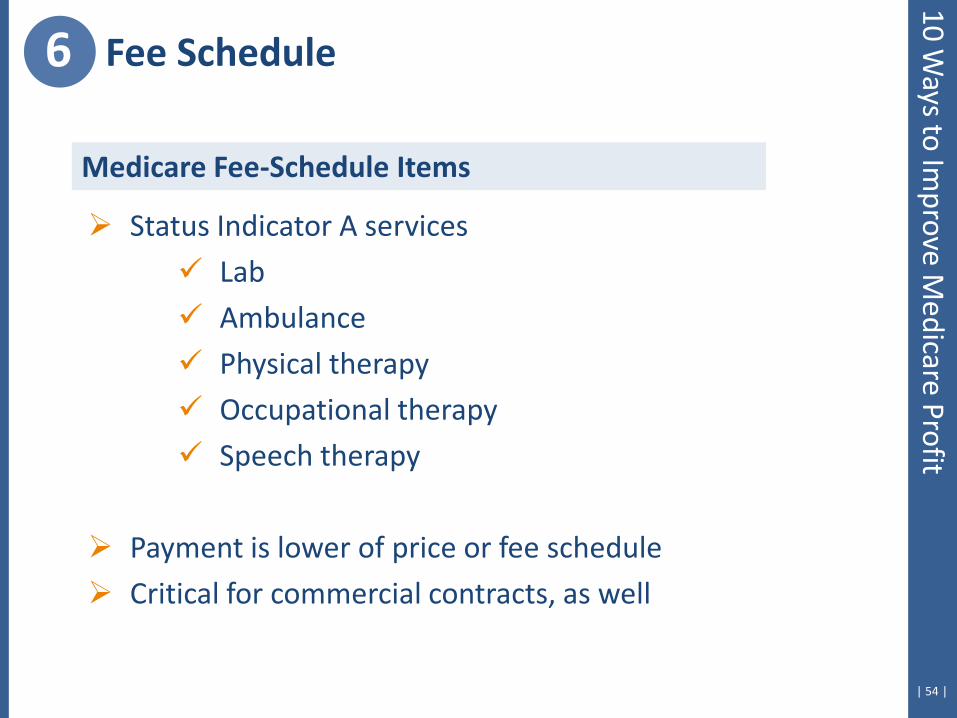
Status Indicator A services
Lab
Ambulance
Physical therapy
Occupational therapy
Speech therapy
Payment is lower of price or fee schedule
Critical for commercial contracts, as well
Medicare Fee-Schedule Items
6 Fee Schedule 10 W
ays to Improve M
edicare Profit
| 55 |
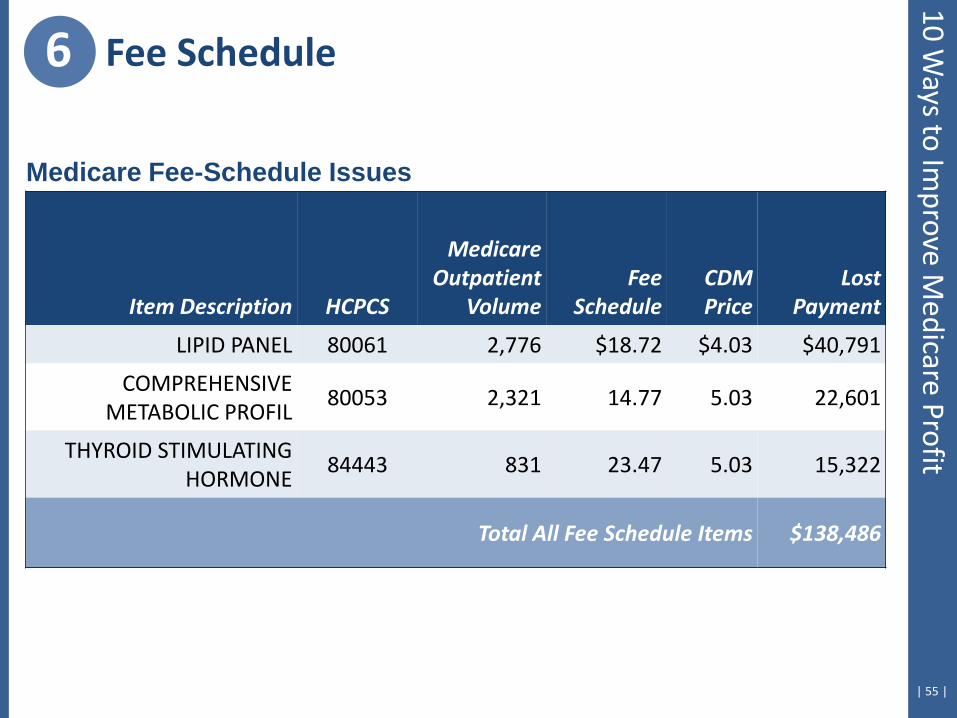
Medicare Fee-Schedule Issues
Item Description HCPCS
Medicare Outpatient
Volume Fee
Schedule CDM Price
Lost Payment
LIPID PANEL 80061 2,776 $18.72 $4.03 $40,791
COMPREHENSIVE METABOLIC PROFIL
80053 2,321 14.77 5.03 22,601
THYROID STIMULATING HORMONE
84443 831 23.47 5.03 15,322
Total All Fee Schedule Items $138,486
6 Fee Schedule 10 W
ays to Improve M
edicare Profit
7. Assess Facility-Level Costliness
| 57 |
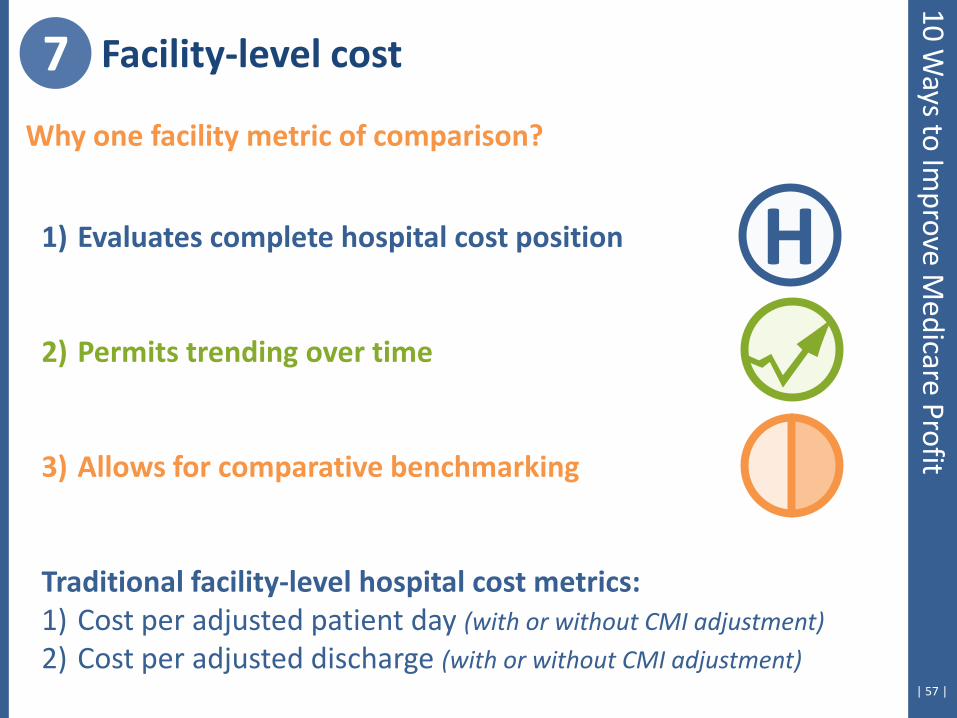
Why one facility metric of comparison?
1) Evaluates complete hospital cost position
2) Permits trending over time
3) Allows for comparative benchmarking
Traditional facility-level hospital cost metrics: 1) Cost per adjusted patient day (with or without CMI adjustment)
2) Cost per adjusted discharge (with or without CMI adjustment)
H
7 Facility-level cost 10 W
ays to Improve M
edicare Profit
| 58 |
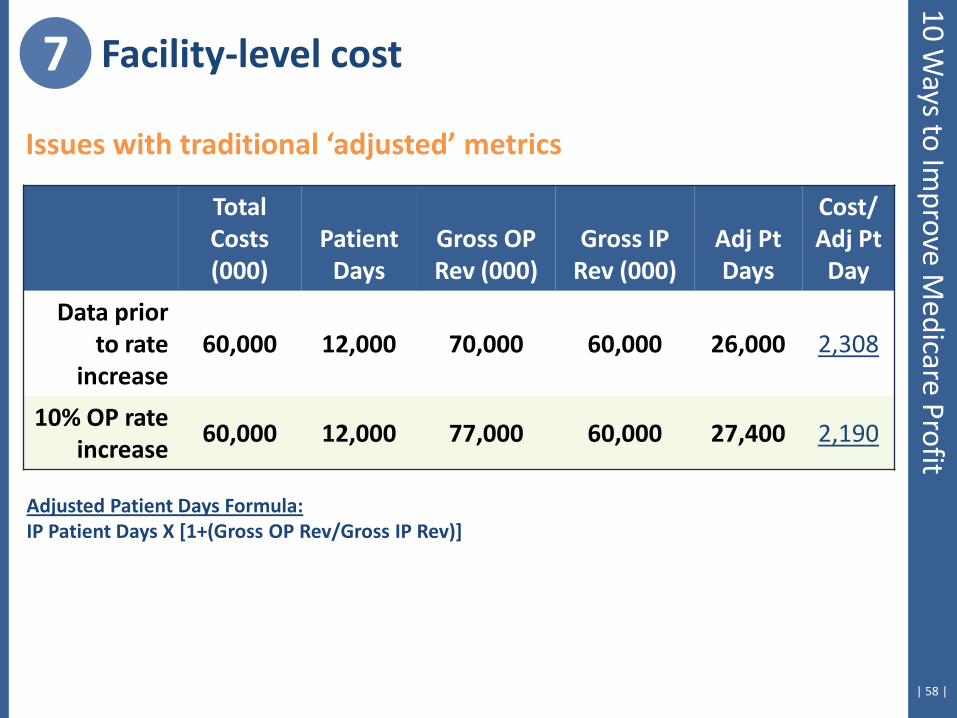
Issues with traditional ‘adjusted’ metrics
Total Costs (000)
Patient Days
Gross OP Rev (000)
Gross IP Rev (000)
Adj Pt Days
Cost/ Adj Pt
Day
Data prior to rate
increase 60,000 12,000 70,000 60,000 26,000 2,308
10% OP rate increase
60,000 12,000 77,000 60,000 27,400 2,190
Adjusted Patient Days Formula: IP Patient Days X [1+(Gross OP Rev/Gross IP Rev)]
7 Facility-level cost 10 W
ays to Improve M
edicare Profit
| 59 |
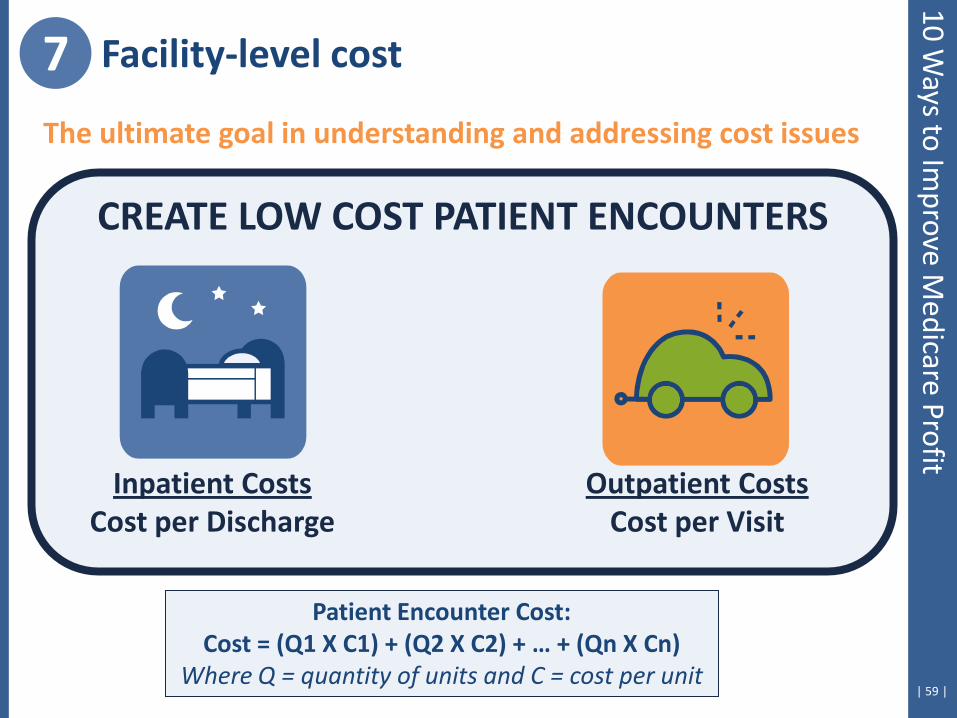
The ultimate goal in understanding and addressing cost issues
CREATE LOW COST PATIENT ENCOUNTERS
Inpatient Costs Cost per Discharge
Outpatient Costs Cost per Visit
Patient Encounter Cost: Cost = (Q1 X C1) + (Q2 X C2) + … + (Qn X Cn)
Where Q = quantity of units and C = cost per unit
7 Facility-level cost 10 W
ays to Improve M
edicare Profit
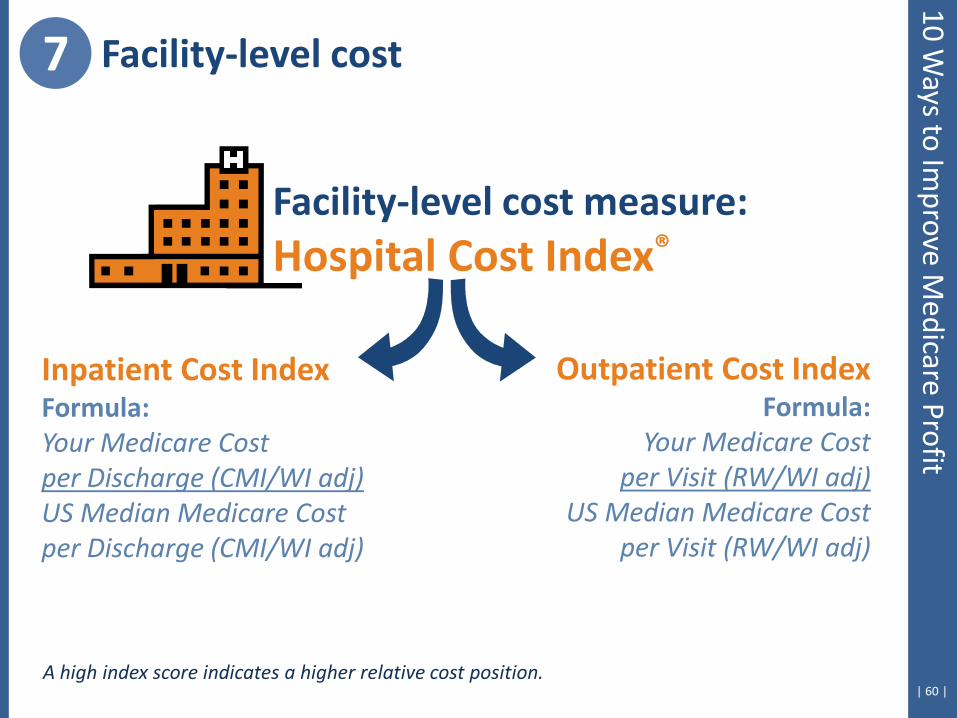
| 60 | A high index score indicates a higher relative cost position.
Facility-level cost measure: Hospital Cost Index®
Outpatient Cost Index Formula:
Your Medicare Cost per Visit (RW/WI adj)
US Median Medicare Cost per Visit (RW/WI adj)
Inpatient Cost Index Formula: Your Medicare Cost per Discharge (CMI/WI adj) US Median Medicare Cost per Discharge (CMI/WI adj)
7 Facility-level cost 10 W
ays to Improve M
edicare Profit
| 61 |
7 Facility-level cost 10 W
ays to Improve M
edicare Profit
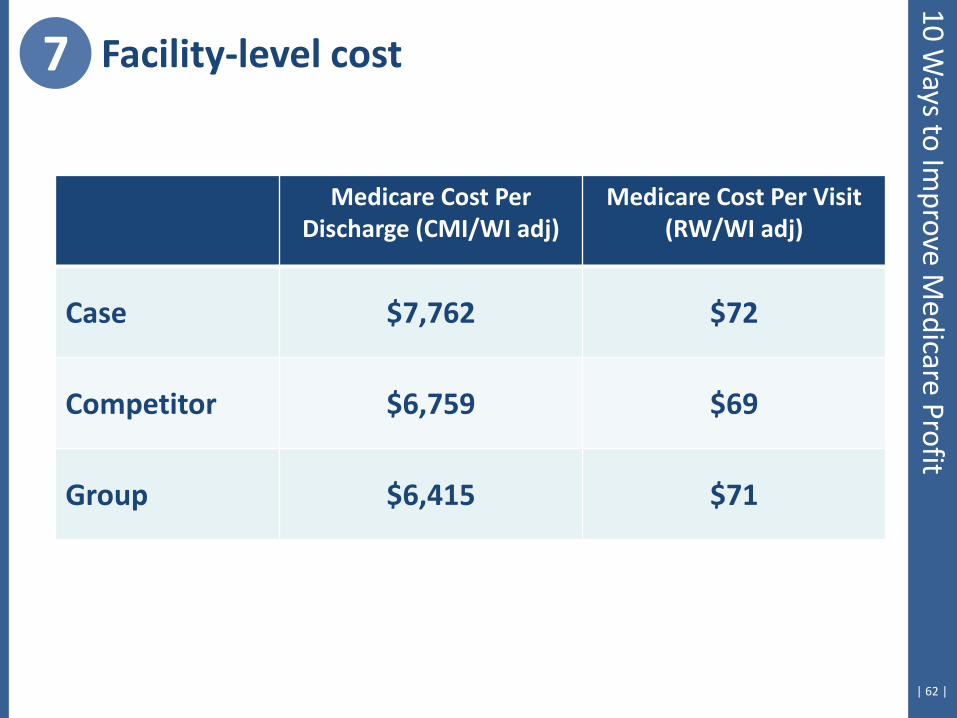
| 62 |
Medicare Cost Per Discharge (CMI/WI adj)
Medicare Cost Per Visit (RW/WI adj)
Case $7,762 $72
Competitor $6,759 $69
Group $6,415 $71
7 Facility-level cost 10 W
ays to Improve M
edicare Profit
| 63 |
7 Facility-level cost 10 W
ays to Improve M
edicare Profit
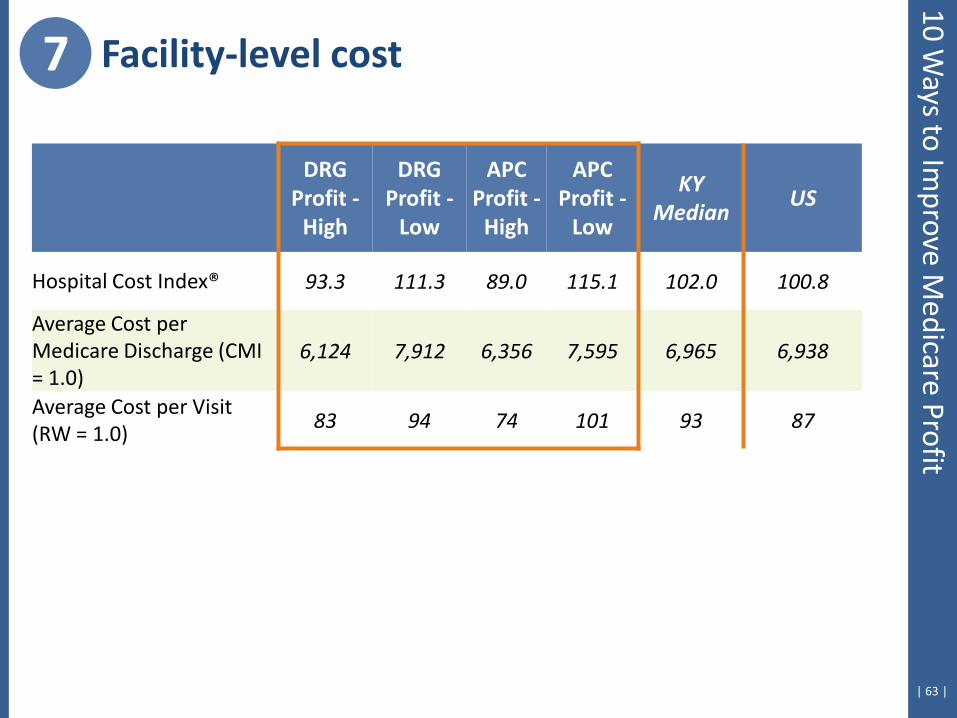
DRG Profit -
High
DRG Profit -
Low
APC Profit -
High
APC Profit -
Low
KY Median
US
Hospital Cost Index® 93.3 111.3 89.0 115.1 102.0 100.8
Average Cost per Medicare Discharge (CMI = 1.0)
6,124 7,912 6,356 7,595 6,965 6,938
Average Cost per Visit (RW = 1.0)
83 94 74 101 93 87
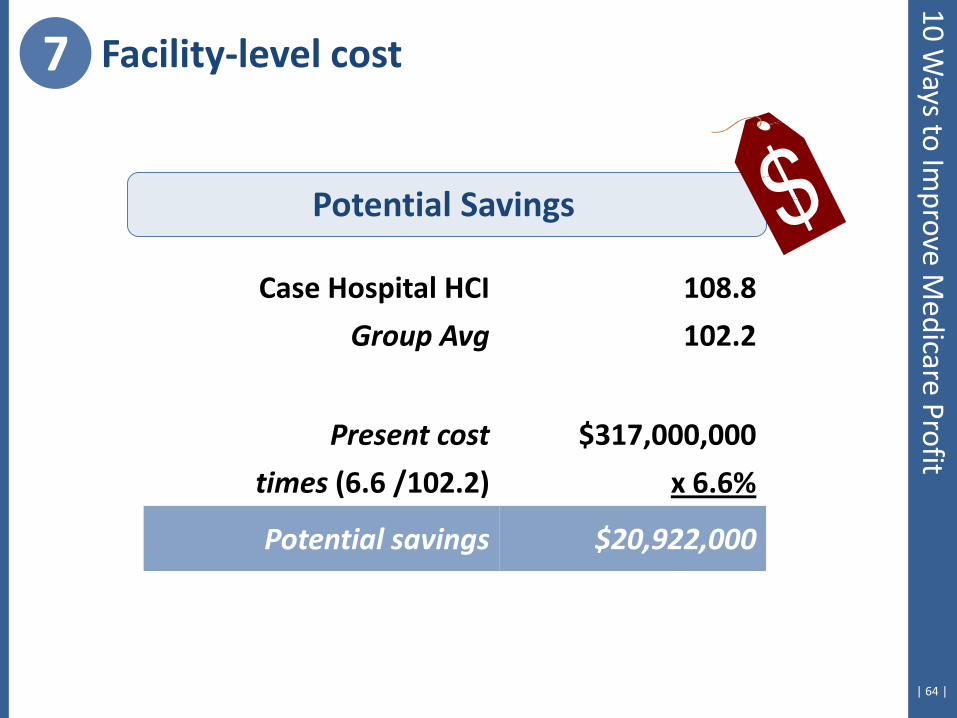
| 64 |
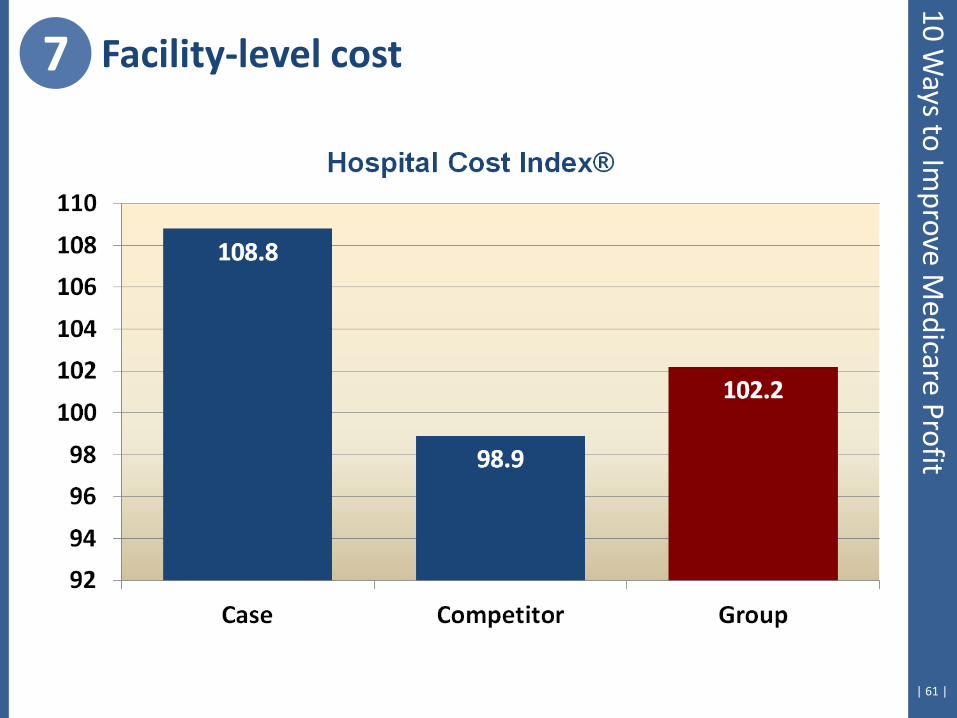
Case Hospital HCI 108.8
Group Avg 102.2
Present cost $317,000,000
times (6.6 /102.2) x 6.6%
Potential savings $20,922,000
Potential Savings
7 Facility-level cost 10 W
ays to Improve M
edicare Profit

8. Macro Issues of Price & Intensity
| 66 |
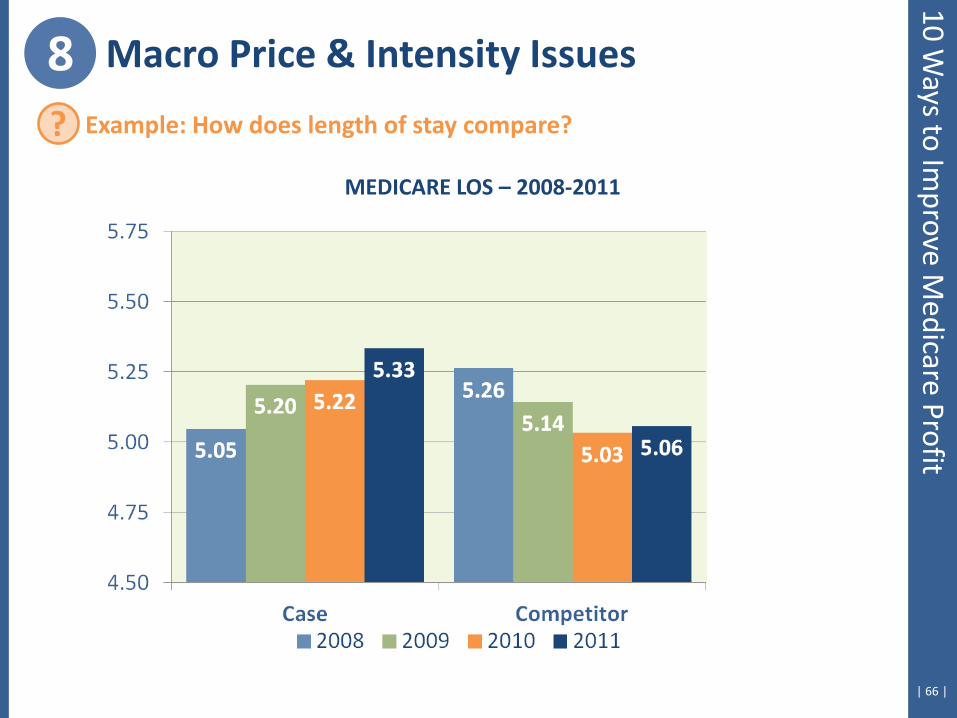
8 Macro Price & Intensity Issues
MEDICARE LOS – 2008-2011
? Example: How does length of stay compare?
10 Ways to Im
prove Medicare Profit
| 67 |
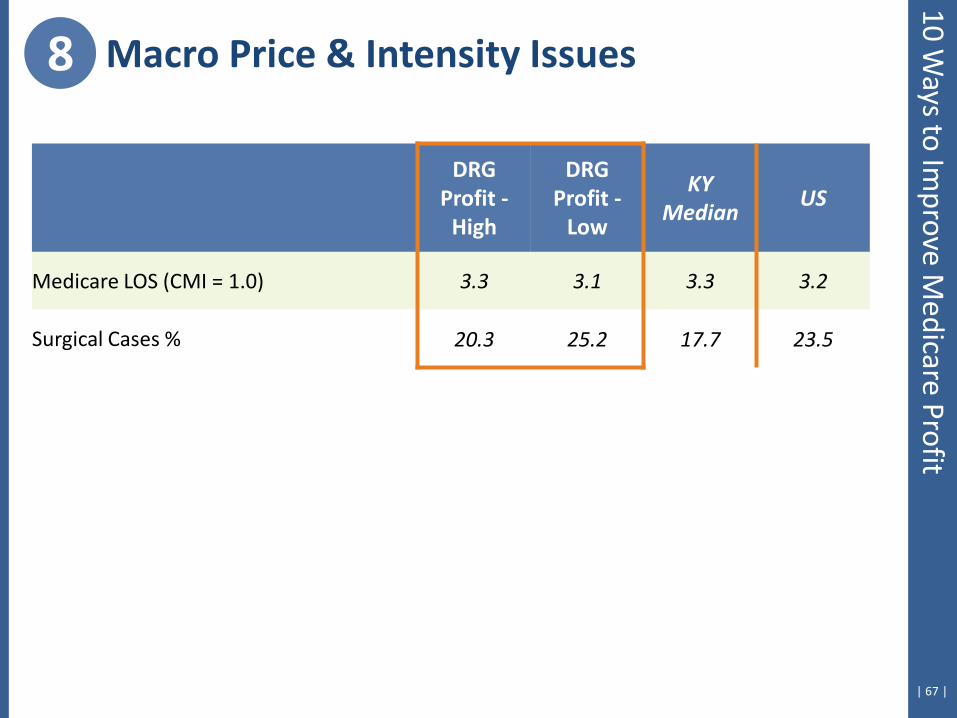
8 Macro Price & Intensity Issues 10 W
ays to Improve M
edicare Profit
DRG Profit -
High
DRG Profit -
Low
KY Median
US
Medicare LOS (CMI = 1.0) 3.3 3.1 3.3 3.2
Surgical Cases % 20.3 25.2 17.7 23.5
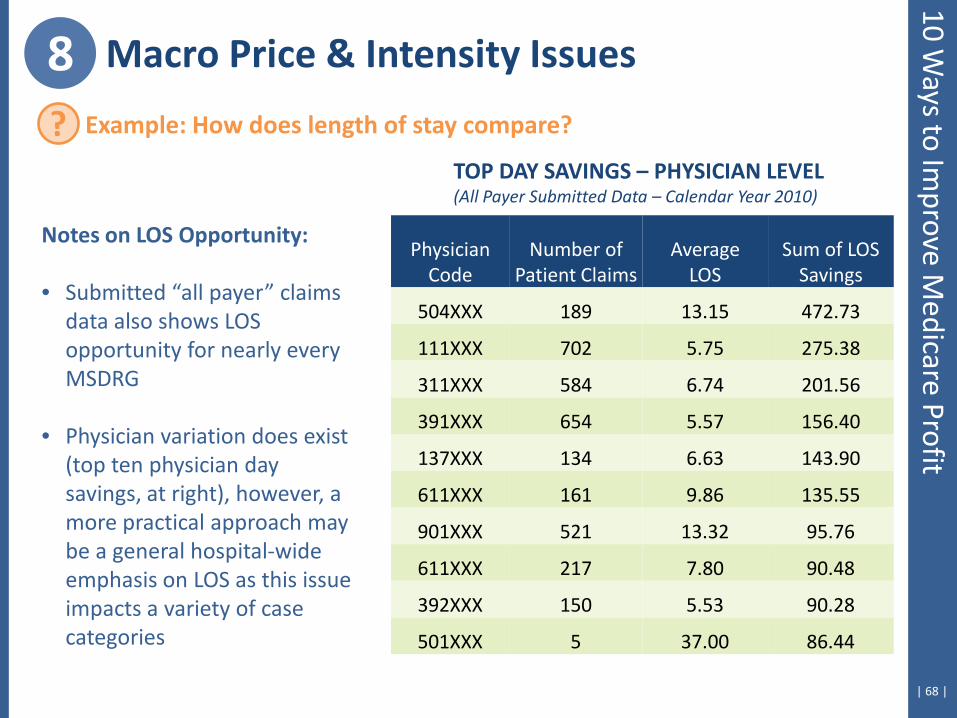
| 68 |
Notes on LOS Opportunity: • Submitted “all payer” claims
data also shows LOS opportunity for nearly every MSDRG
• Physician variation does exist (top ten physician day savings, at right), however, a more practical approach may be a general hospital-wide emphasis on LOS as this issue impacts a variety of case categories
Physician Code
Number of Patient Claims
Average LOS
Sum of LOS Savings
504XXX 189 13.15 472.73
111XXX 702 5.75 275.38
311XXX 584 6.74 201.56
391XXX 654 5.57 156.40
137XXX 134 6.63 143.90
611XXX 161 9.86 135.55
901XXX 521 13.32 95.76
611XXX 217 7.80 90.48
392XXX 150 5.53 90.28
501XXX 5 37.00 86.44
TOP DAY SAVINGS – PHYSICIAN LEVEL (All Payer Submitted Data – Calendar Year 2010)
8 Macro Price & Intensity Issues
? Example: How does length of stay compare?
10 Ways to Im
prove Medicare Profit
| 69 |
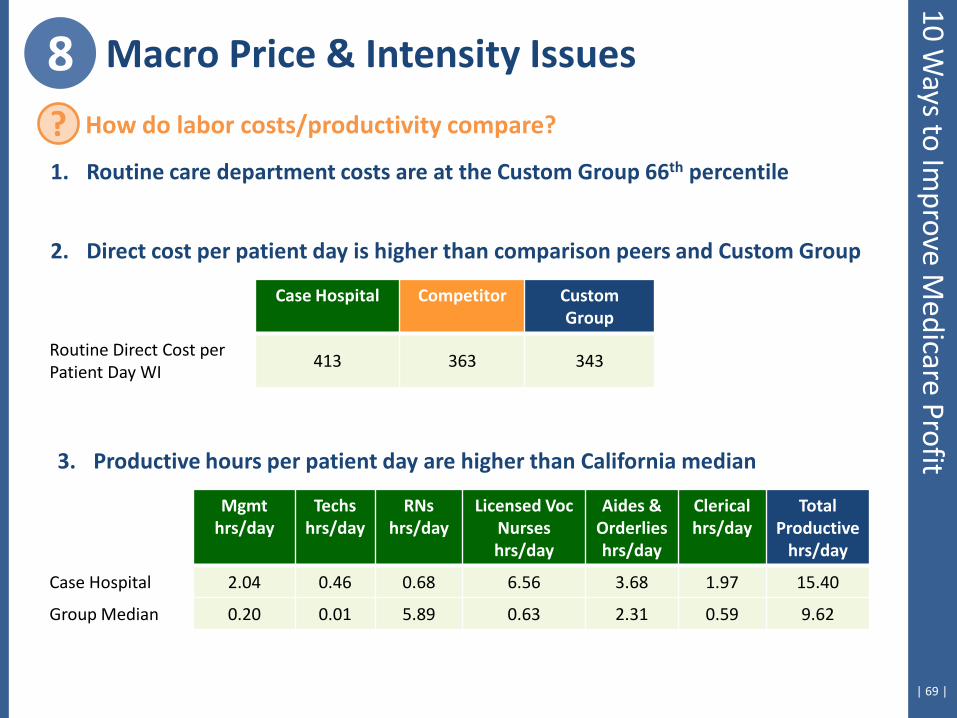
8 Macro Price & Intensity Issues
? How do labor costs/productivity compare?
1. Routine care department costs are at the Custom Group 66th percentile
2. Direct cost per patient day is higher than comparison peers and Custom Group
Case Hospital Competitor Custom Group
Routine Direct Cost per Patient Day WI
413 363 343
3. Productive hours per patient day are higher than California median
Mgmt hrs/day
Techs hrs/day
RNs hrs/day
Licensed Voc Nurses hrs/day
Aides & Orderlies hrs/day
Clerical hrs/day
Total Productive
hrs/day
Case Hospital 2.04 0.46 0.68 6.56 3.68 1.97 15.40
Group Median 0.20 0.01 5.89 0.63 2.31 0.59 9.62
10 Ways to Im
prove Medicare Profit
| 70 |
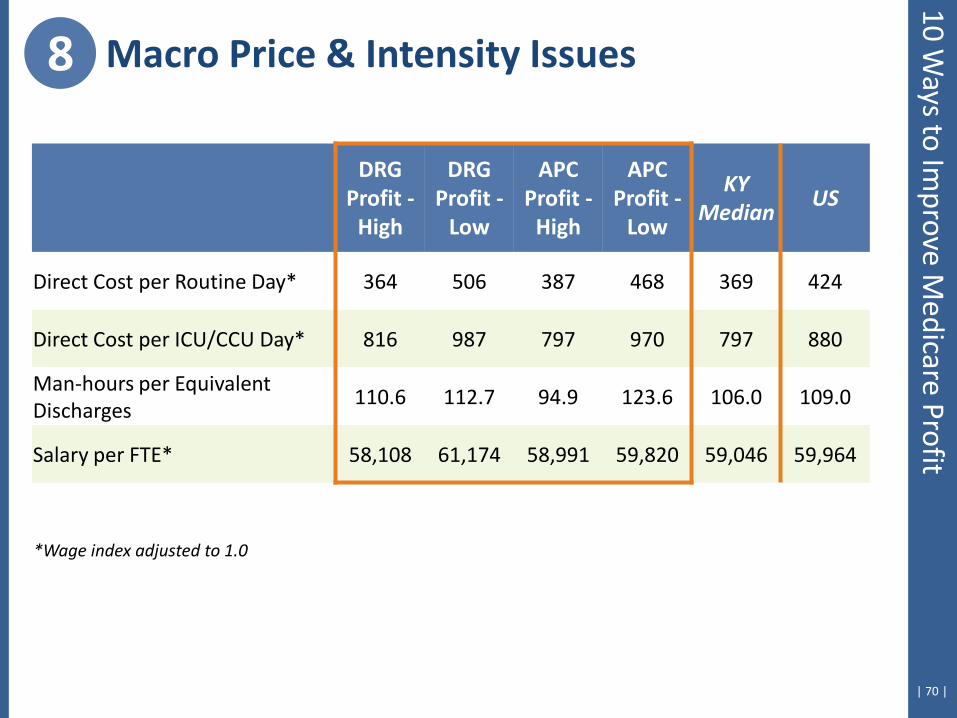
8 Macro Price & Intensity Issues 10 W
ays to Improve M
edicare Profit
DRG Profit -
High
DRG Profit -
Low
APC Profit -
High
APC Profit -
Low
KY Median
US
Direct Cost per Routine Day* 364 506 387 468 369 424
Direct Cost per ICU/CCU Day* 816 987 797 970 797 880
Man-hours per Equivalent Discharges
110.6 112.7 94.9 123.6 106.0 109.0
Salary per FTE* 58,108 61,174 58,991 59,820 59,046 59,964
*Wage index adjusted to 1.0

9. Identify Specific DRG-Savings Opportunities
| 72 |
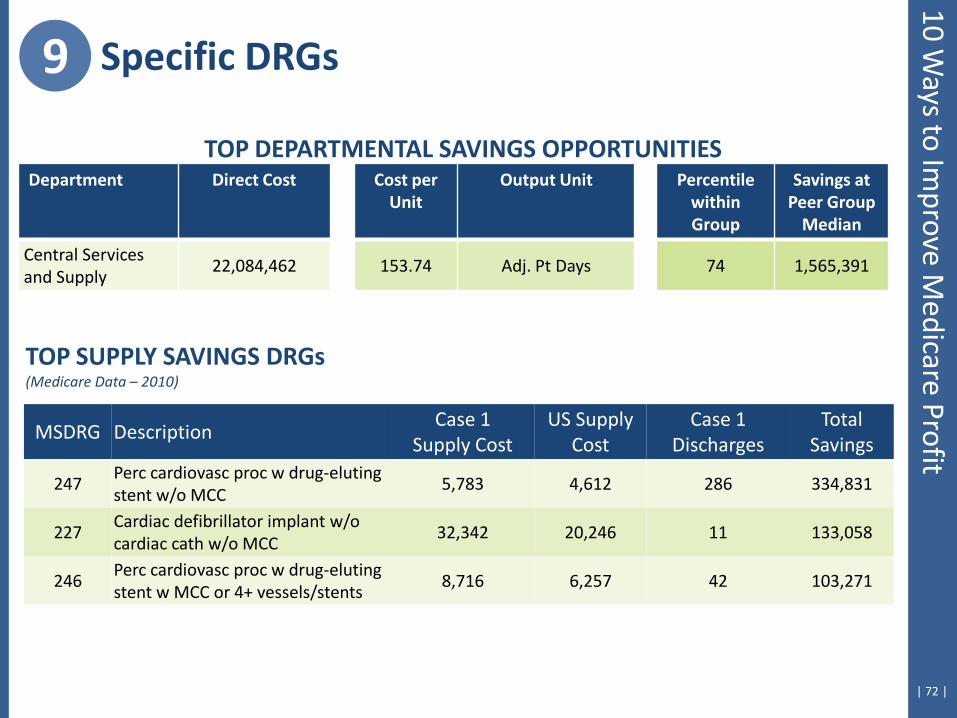
9 Specific DRGs
TOP SUPPLY SAVINGS DRGs (Medicare Data – 2010)
MSDRG Description Case 1
Supply Cost US Supply
Cost Case 1
Discharges Total
Savings
247 Perc cardiovasc proc w drug-eluting stent w/o MCC
5,783 4,612 286 334,831
227 Cardiac defibrillator implant w/o cardiac cath w/o MCC
32,342 20,246 11 133,058
246 Perc cardiovasc proc w drug-eluting stent w MCC or 4+ vessels/stents
8,716 6,257 42 103,271
Department Direct Cost Cost per Unit
Output Unit Percentile within Group
Savings at Peer Group
Median
Central Services and Supply
22,084,462 153.74 Adj. Pt Days 74 1,565,391
TOP DEPARTMENTAL SAVINGS OPPORTUNITIES
10 Ways to Im
prove Medicare Profit
| 73 |
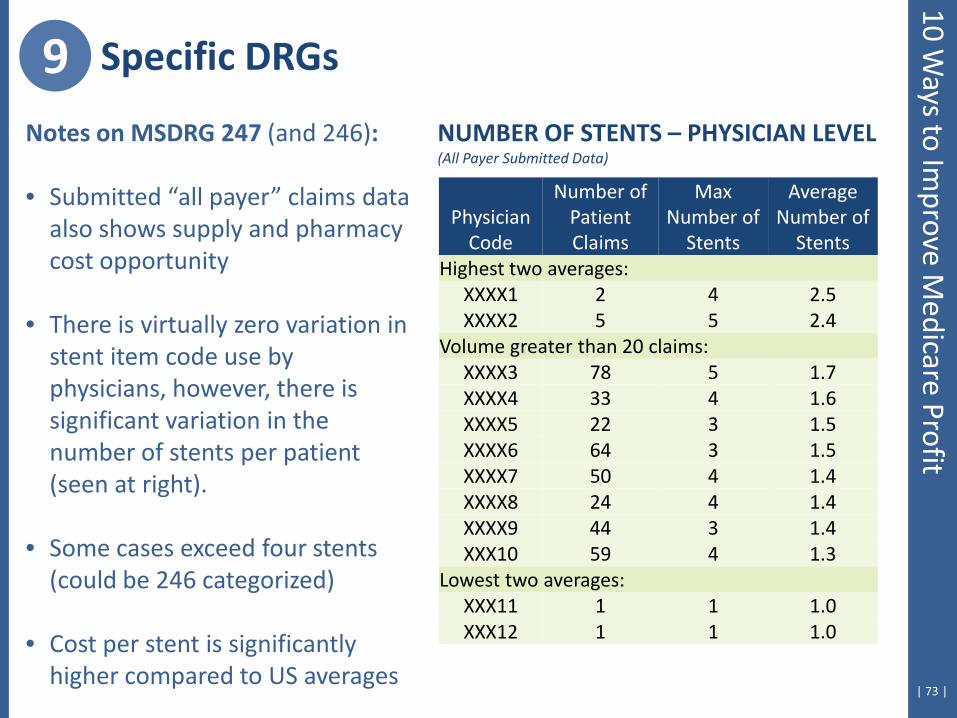
Notes on MSDRG 247 (and 246): • Submitted “all payer” claims data
also shows supply and pharmacy cost opportunity
• There is virtually zero variation in stent item code use by physicians, however, there is significant variation in the number of stents per patient (seen at right).
• Some cases exceed four stents (could be 246 categorized)
• Cost per stent is significantly higher compared to US averages
Physician Code
Number of Patient Claims
Max Number of
Stents
Average Number of
Stents Highest two averages:
XXXX1 2 4 2.5 XXXX2 5 5 2.4
Volume greater than 20 claims: XXXX3 78 5 1.7 XXXX4 33 4 1.6 XXXX5 22 3 1.5 XXXX6 64 3 1.5 XXXX7 50 4 1.4 XXXX8 24 4 1.4 XXXX9 44 3 1.4 XXX10 59 4 1.3
Lowest two averages: XXX11 1 1 1.0 XXX12 1 1 1.0
NUMBER OF STENTS – PHYSICIAN LEVEL (All Payer Submitted Data)
9 Specific DRGs 10 W
ays to Improve M
edicare Profit
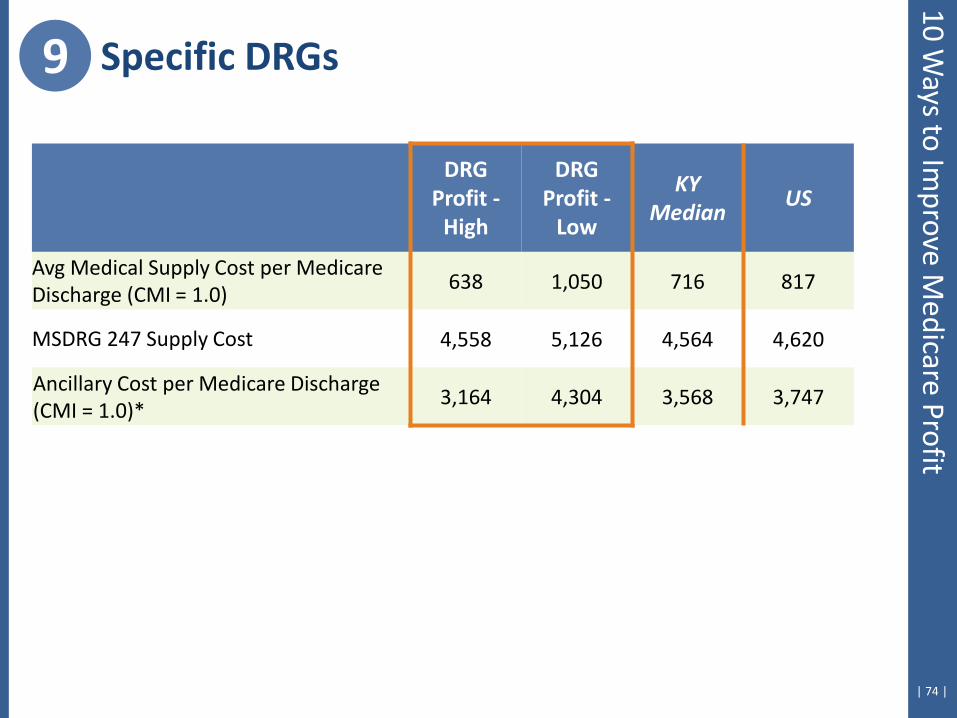
| 74 |
9 Specific DRGs 10 W
ays to Improve M
edicare Profit
DRG Profit -
High
DRG Profit -
Low
KY Median
US
Avg Medical Supply Cost per Medicare Discharge (CMI = 1.0)
638 1,050 716 817
MSDRG 247 Supply Cost 4,558 5,126 4,564 4,620
Ancillary Cost per Medicare Discharge (CMI = 1.0)*
3,164 4,304 3,568 3,747
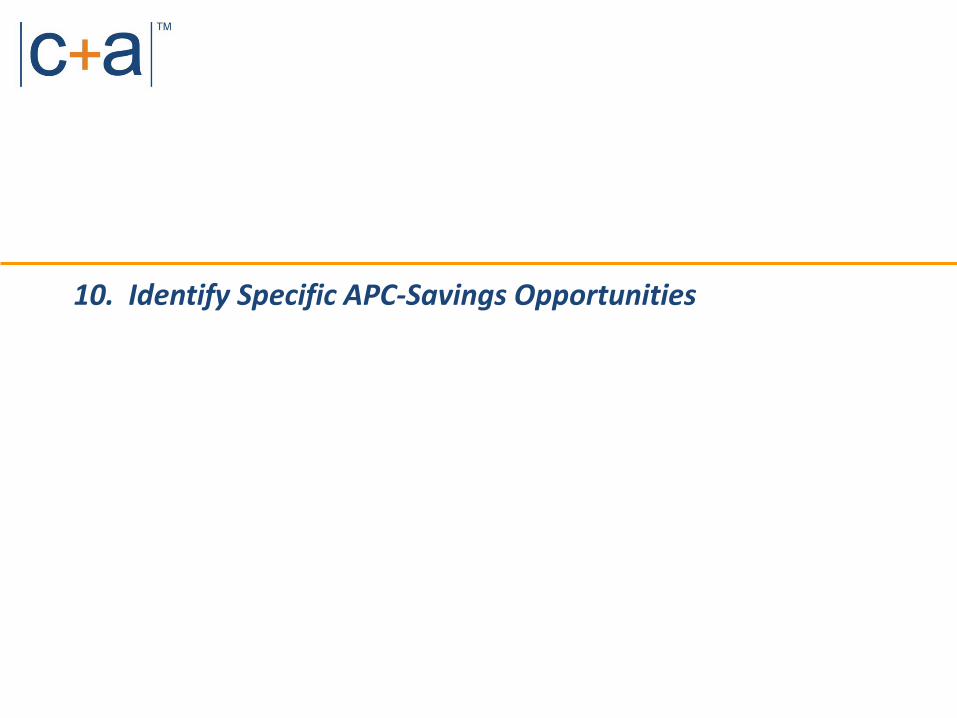
10. Identify Specific APC-Savings Opportunities
| 76 |
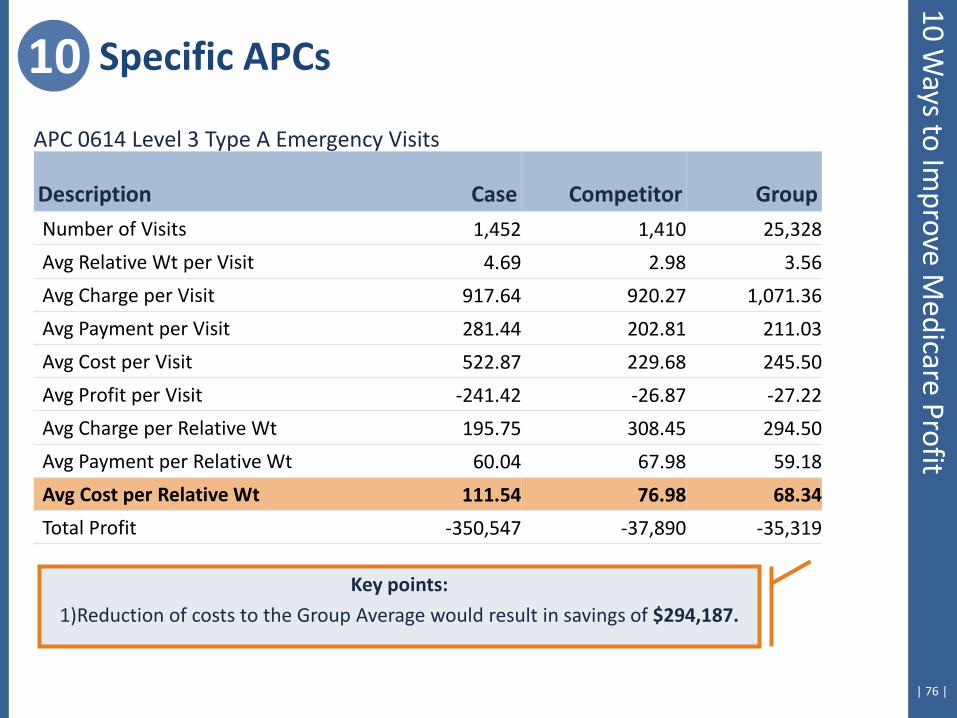
10 Specific APCs
Key points:
1)Reduction of costs to the Group Average would result in savings of $294,187.
APC 0614 Level 3 Type A Emergency Visits
Description Case Competitor Group Number of Visits 1,452 1,410 25,328
Avg Relative Wt per Visit 4.69 2.98 3.56
Avg Charge per Visit 917.64 920.27 1,071.36
Avg Payment per Visit 281.44 202.81 211.03
Avg Cost per Visit 522.87 229.68 245.50
Avg Profit per Visit -241.42 -26.87 -27.22
Avg Charge per Relative Wt 195.75 308.45 294.50
Avg Payment per Relative Wt 60.04 67.98 59.18
Avg Cost per Relative Wt 111.54 76.98 68.34
Total Profit -350,547 -37,890 -35,319
10 Ways to Im
prove Medicare Profit

| 77 |
10 Specific APCs
APC Cost Detail, cont.
Case Competitor Group
APC Procedures – Cost per Unit & Utilization Rate
Weight Cost/Visit Cost/Visit Cost/Visit
99283 Emergency dept visit 2.1150 295.78 100 155.10 100 119.02 100 93005 Electrocardiogram, tracing 0.3789 42.40 43 52.43 4 46.87 13 71020 Chest x-ray 0.7093 47.35 32 54.03 10 50.06 10 90774 Ther/proph/diag inj, iv p 0.7942 57.98 18 70.11 1 35.29 11 90760 Hydration iv infusion, in 1.8090 129.60 16 89.31 1 89.74 3 90775 Tx/pro/dx inj new drug add-on 0.7942 86.53 13 39.14 7 90801 Psy dx interview 1.7066 94.74 12 76.82 1 172.81 0 90761 Hydrate iv infusion, add- 0.3945 55.38 9 72.94 1 84.30 3 94640 Airway inhalation treatment 0.3527 70.31 8 41.48 2 29.99 2
Fee Procedures – Cost per Unit & Utilization Rate
36415 Drawing blood 0.0504 1.61 9 2.06 22 2.75 19 85025 Automated hemogram 0.1788 16.24 55 13.18 18 15.35 29 84484 Assay of troponin, quant 0.2202 43.39 30 19.28 1 19.95 8
Bundled Procedures – Cost per Unit & Utilization Rate
NULLC No CPT® Code 38.66 24 13.81 9 13.15 71
10 Ways to Im
prove Medicare Profit
| 78 |
10 Ways to Im
prove Medicare Profit
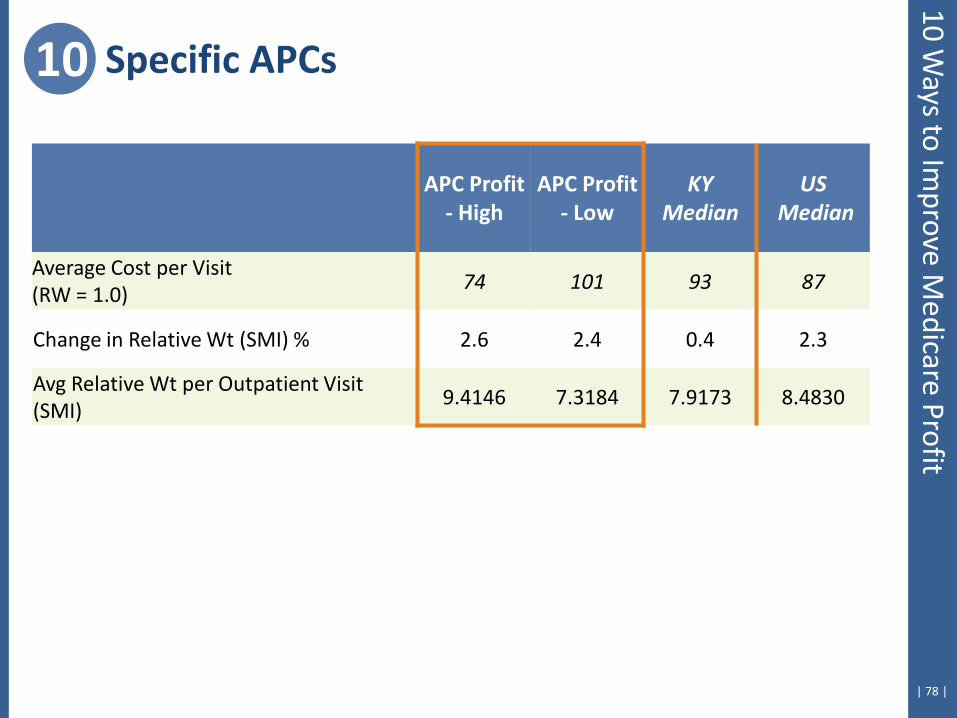
10 Specific APCs
APC Profit - High
APC Profit - Low
KY Median
US Median
Average Cost per Visit (RW = 1.0)
74 101 93 87
Change in Relative Wt (SMI) % 2.6 2.4 0.4 2.3
Avg Relative Wt per Outpatient Visit (SMI)
9.4146 7.3184 7.9173 8.4830
| 79 |
+ Medicare payments will not keep pace with cost increases
+ Hospitals that make money on Medicare control both cost and payment
+ Benchmarking data can help to identify payment and cost opportunities
Summary
| 80 |
Scott Houk, Senior Strategic Advisor Cleverley + Associates
438 e wilson bridge road, suite 200 worthington, oh 43085-2382
888-779-5663 www.cleverleyassociates.com
? Questions?