Embed Size (px)
Citation preview

1
Ten days to better application performanceA real-life case study
Ten days to better application performance
A real-life case study
UKCMG Industry Forum21st November 2005
© Capacitas 2002-2005 2
Ten days to better application performanceA real-life case study
Agenda
• Background• Architecture Review• Capacity and Performance Monitoring• Testing
• Goods Receipting• Purchase Order Maintain
• Conclusions

2
© Capacitas 2002-2005 3
Ten days to better application performanceA real-life case study
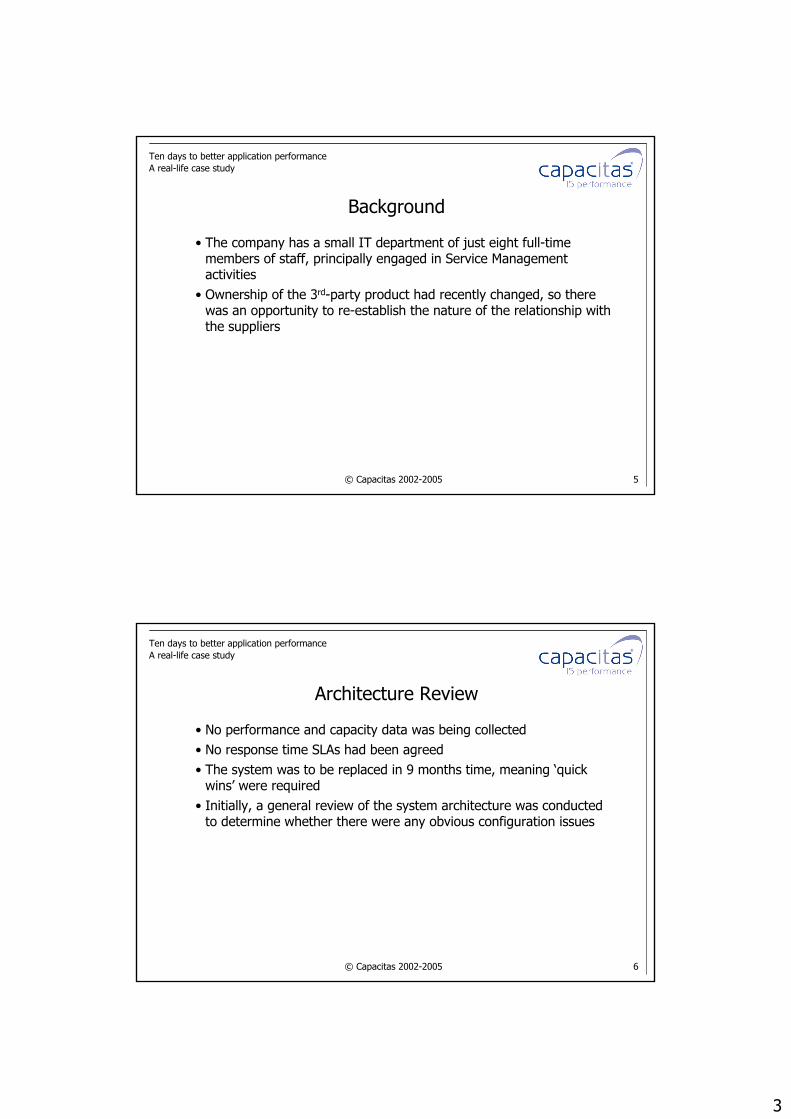
Background
• A retailer was experiencing poor performance of its commercial off-the-shelf application
• This system is used to track and order stock for the company’s retail outlets
• The system runs on a SQL Server 7 database under Windows 2000 on a server with 4 CPUs
• Response times for a number for key business transactions were reported to be excessive (up to 30 minutes)
• The workload profile of the system is seasonal, with the majority of stock ordered for Christmas
• There was little confidence that the system could cope
© Capacitas 2002-2005 4
Ten days to better application performanceA real-life case study
Background
• Capacitas was asked to spend 5 man-days investigating the performance problems
• The impact of poor response times on the business was such that if significant improvements were not realised, the board were considering switching to manual processes
• As there was no budget for tools, bundled monitoring tools were used
3
© Capacitas 2002-2005 5
Ten days to better application performanceA real-life case study
Background
• The company has a small IT department of just eight full-time members of staff, principally engaged in Service Management activities
• Ownership of the 3rd-party product had recently changed, so there was an opportunity to re-establish the nature of the relationship with the suppliers
© Capacitas 2002-2005 6
Ten days to better application performanceA real-life case study
Architecture Review
• No performance and capacity data was being collected• No response time SLAs had been agreed• The system was to be replaced in 9 months time, meaning ‘quick
wins’ were required• Initially, a general review of the system architecture was conducted
to determine whether there were any obvious configuration issues
4
© Capacitas 2002-2005 7
Ten days to better application performanceA real-life case study
Architecture Review
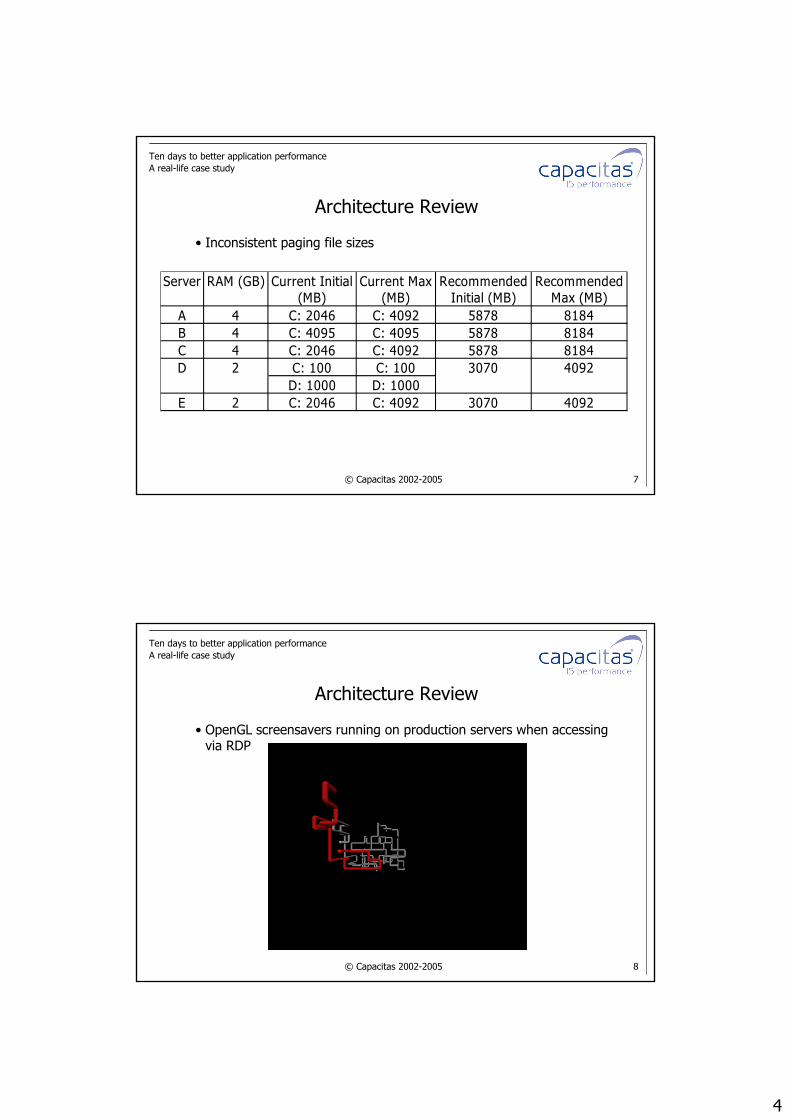
• Inconsistent paging file sizes
Server RAM (GB) Current Initial (MB)
Current Max (MB)
Recommended Initial (MB)
Recommended Max (MB)
A 4 C: 2046 C: 4092 5878 8184B 4 C: 4095 C: 4095 5878 8184C 4 C: 2046 C: 4092 5878 8184
C: 100 C: 100D: 1000 D: 1000
E 2 C: 2046 C: 4092 3070 4092
D 2 3070 4092
© Capacitas 2002-2005 8
Ten days to better application performanceA real-life case study
Architecture Review
• OpenGL screensavers running on production servers when accessingvia RDP

5
© Capacitas 2002-2005 9
Ten days to better application performanceA real-life case study
Capacity and Performance Monitoring
• Freely available tools were used to conduct analysis of the system’s performance :
• Sysmon• Standard OS performance and capacity metrics• Also has a set of SQL Server performance objects
• SQL Profiler• A tracing tool that may be used to determine the cost of
the SQL transactions running during the monitoring period
© Capacitas 2002-2005 10
Ten days to better application performanceA real-life case study
Sysmon
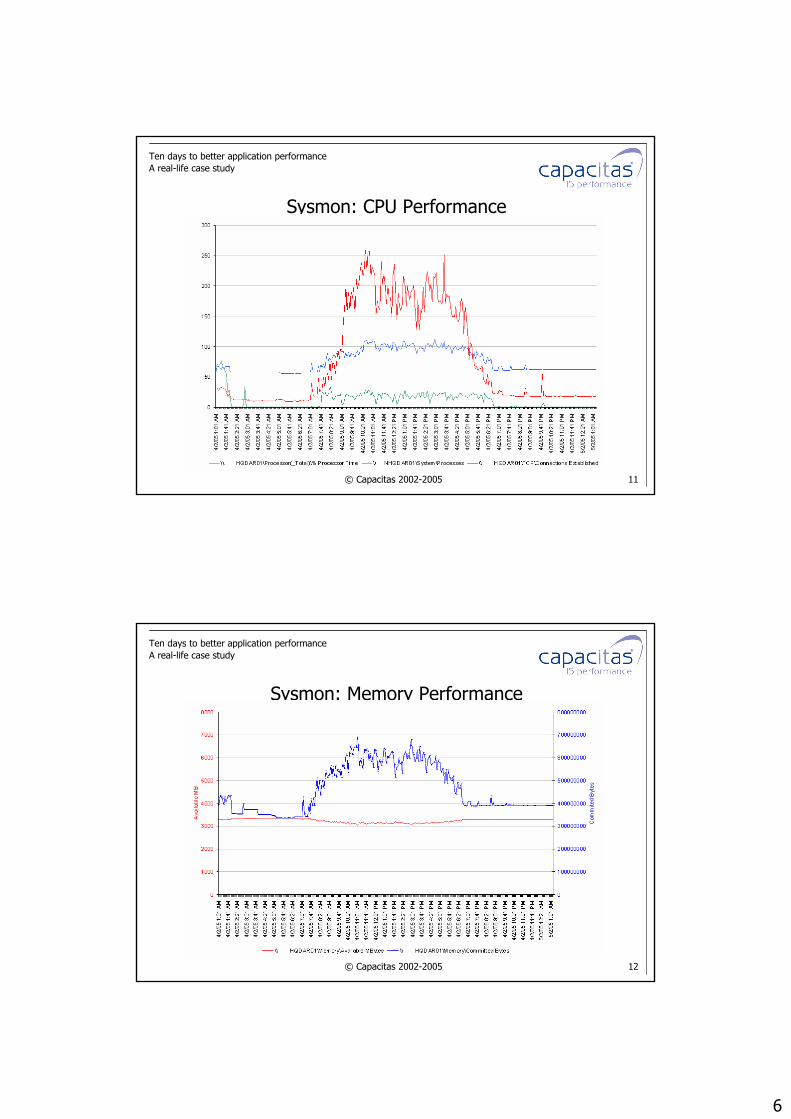
• Initially some performance monitoring was conducted to determinethe daily performance profile of the system
• Initial monitoring using Sysmon did not identify any obvious CPU or memory constraints
• Further investigation using specific SQL Server Sysmon counters was conducted
6
© Capacitas 2002-2005 11
Ten days to better application performanceA real-life case study
Sysmon: CPU Performance
© Capacitas 2002-2005 12
Ten days to better application performanceA real-life case study
Sysmon: Memory Performance

7
© Capacitas 2002-2005 13
Ten days to better application performanceA real-life case study
Sysmon: I/O Performance
© Capacitas 2002-2005 14
Ten days to better application performanceA real-life case study
Sysmon: SQL Server User ConnectionsOnline day
07:00 to 18:00
Batch
22:00 – 01:00

8
© Capacitas 2002-2005 15
Ten days to better application performanceA real-life case study
Sysmon: SQL Server User Connections
• There is not a one-to-one correlation between User Connections and the actual number users of the system
• Each user may have multiple SQL Server User Connections• Some User Connections may be held by system processes rather
than human users
© Capacitas 2002-2005 16
Ten days to better application performanceA real-life case study
Sysmon: SQL Server Transactions/secOnline day
07:00 to 18:00
Batch
22:00 – 01:00
02:30
03:30

9
© Capacitas 2002-2005 17
Ten days to better application performanceA real-life case study
Sysmon: SQL Server Transactions/secOnline day
07:00 to 18:00
Batch
22:00 – 01:00
02:30
03:30
© Capacitas 2002-2005 18
Ten days to better application performanceA real-life case study
SQL Server Transactions/sec
• 22% of SQL Server Transactions were conducted against the database
• 75% of SQL Server Transactions were conducted against tempdb• tempdb is a system database used by SQL Server to store temporary
tables and temporary stored procedures for subqueries, sorting and aggregation
10
© Capacitas 2002-2005 19
Ten days to better application performanceA real-life case study
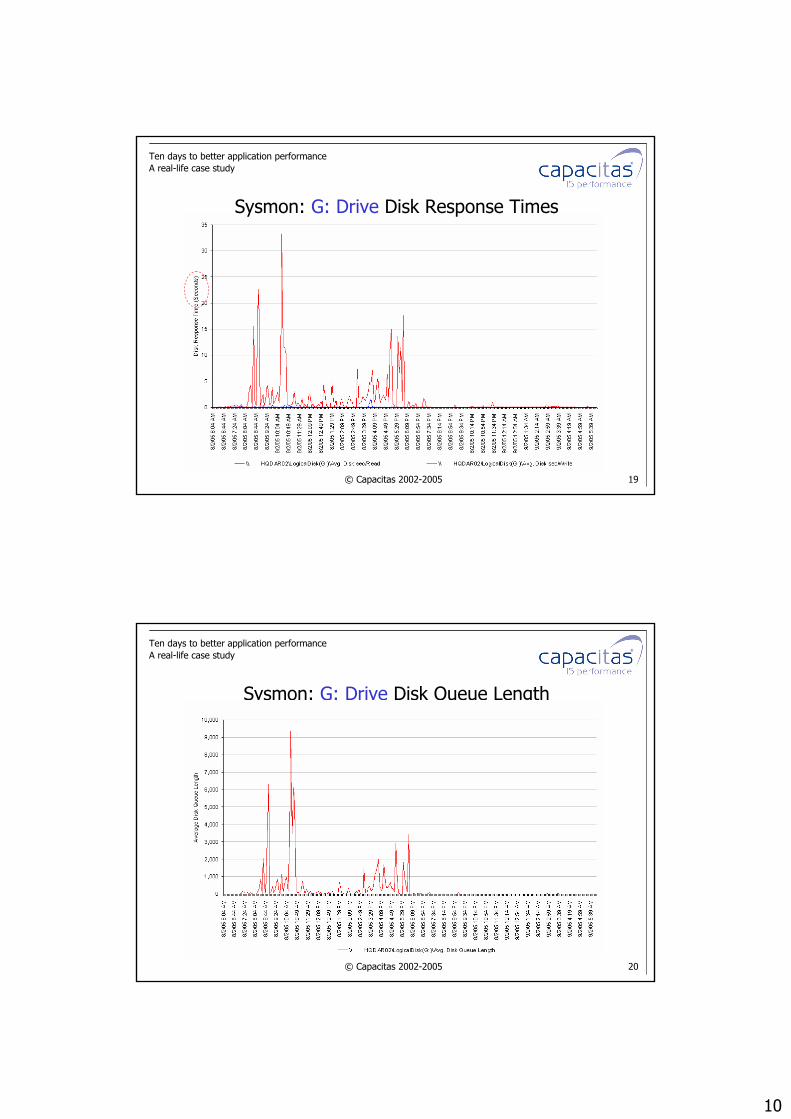
Sysmon: G: Drive Disk Response Times
© Capacitas 2002-2005 20
Ten days to better application performanceA real-life case study
Sysmon: G: Drive Disk Queue Length

11
© Capacitas 2002-2005 21
Ten days to better application performanceA real-life case study
Disk Response Times
• Disk response times where found to be high on the G: Drive• This disk corresponds to tempdb• The delay is caused by large number of writes on G:, causing
queuing• SQL server generates disk writes asynchronously, typically resulting
in increased queuing for disk resources as reported by system monitor
• However, even taking this into consideration, this level of queuing across an extended period indicates that the disk subsystem may be a performance bottleneck
• In addition, activity to tempdb is more likely to be synchronous
© Capacitas 2002-2005 22
Ten days to better application performanceA real-life case study
Database Tables
• The database was found to contain 601 tables and 299 stored procedures
• The large number of tables indicates potential over-normalisation of the database
• This might explain the high usage of tempdb as many joins were required for complex queries
• Possible solutions:• Faster disks• Reduce use of tempdb through more efficient SQL

12
© Capacitas 2002-2005 23
Ten days to better application performanceA real-life case study
Housekeeping
• Analysis revealed that a number of database tables had old versions appended with _281004
• Indicates that the tables had been copied on 28/10/2004 to improve performance
• The system is supplied with a clear down program which the retailer had not used
• The view of the third party suppliers was that specific scripts would need writing to remove the old data
© Capacitas 2002-2005 24
Ten days to better application performanceA real-life case study
Testing
• The goal of testing was to isolate known slow transactions and determine their impact on system resources
• Single user testing was conducted on an unloaded system• Testing was conducted between 5am and 8am, running read-only
transactions on the production system• Sysmon and SQL Profiler were used to monitor a number of business
transactions in isolation on an otherwise idle system• Of particular interest was the Purchase Order Maintain and Goods
Receipting transactions

13
© Capacitas 2002-2005 25
Ten days to better application performanceA real-life case study
Transaction Isolation
• Tests were run with the intention of being single user• However after analysis of the test results, the 3rd-party supplier’s
development team reported the following activity during testing• Two retail outlets creating purchase orders between 7:00am
and 8:00am• A Business Object report ran via the Business Object scheduler• Dream portal (a feed to an external system) checking the
database• Comms and scheduler services were still running, starting a
stored procedure that checks the results of the overnight run
© Capacitas 2002-2005 26
Ten days to better application performanceA real-life case study
Comms Run
• A particular SQL statement ran for 82 seconds during the post-test idle period
• Similar transactions ran for 4 seconds at 07:32:00 and 18 seconds at 07:17:00
• It is believed that this SQL runs every 15 minutes• The developers confirmed that this stored procedure is stored in the
database job scheduler• It reads the results of the overnight batch and if completed,
completion times and branch failures are sent via e-mail and SMS to the Service Manager

14
© Capacitas 2002-2005 27
Ten days to better application performanceA real-life case study
Goods Receipting
• The Goods Receipting process allows staff in a remote warehouse to keep a record of the stock that has been received from suppliers
• The system employs MS-Terminal Server across a Wide Area Network connection
© Capacitas 2002-2005 28
Ten days to better application performanceA real-life case study
Goods Receipting
• The Goods Receipting business process is composed of two steps:
• Step One• The Goods Receipting process of bin allocation and saving the
GR Order into work in progress• This transaction took 8 minutes to complete (07:17 to 07:25)
• Between 07:26 and 07:38 the system was left idle
• Step Two• Data refresh after Goods Receipting authorisation• This transaction took 8 minutes to complete (07:39 to 07:47)

15
© Capacitas 2002-2005 29
Ten days to better application performanceA real-life case study
Sysmon: Terminal Server CPU Time during GR
© Capacitas 2002-2005 30
Ten days to better application performanceA real-life case study
Goods Receipting
• The Goods Receipting application resulted in two eight-minute long periods of 50% CPU Time on the Terminal Server
• Further analysis indicates that the application processGRGoodReceipting.exe used this CPU resource
• As the Terminal Server is a single CPU server with hyper-threading, this was the maximum CPU that could be consumed by this process
• This indicates that the transaction is in fact CPU bound, rather than network bound

16
© Capacitas 2002-2005 31
Ten days to better application performanceA real-life case study
Goods Receipting
• The development team confirmed they could recreate this problem in their test environment
• The problem occurs when creating read-only files for reporting purposes
• The problem was also noted when processing Pick Createtransactions
• The problem was functional, resulting in a negative impact on system capacity and response times
© Capacitas 2002-2005 32
Ten days to better application performanceA real-life case study
SQL Profiler
• Bundled with SQL Server 2000 client tools• Provides statement level SQL tracing• Useful source of capacity and performance information:
• Statement execution duration• CPU time used• Number of I/Os
• Built in filter list to limit data collected• Traces to log file or another SQL database

17
© Capacitas 2002-2005 33
Ten days to better application performanceA real-life case study
SQL Profiler Event Classes• Will trace only those events that
are selected• Events are defined by ‘event
classes’• E.g:
• User can trace the event class ‘Audit Login’ under ‘Security Audit’
• User can trace the event class ‘SQL: Batch Completed’under ‘TSQL’
• Warning: running SQL Profiler can add a significant overhead
• Limit traces to a small set of event classes
© Capacitas 2002-2005 34
Ten days to better application performanceA real-life case study
SQL Profiler Data Columns
• Limit the impact on the system by only collecting data columns that are required
18
© Capacitas 2002-2005 35
Ten days to better application performanceA real-life case study
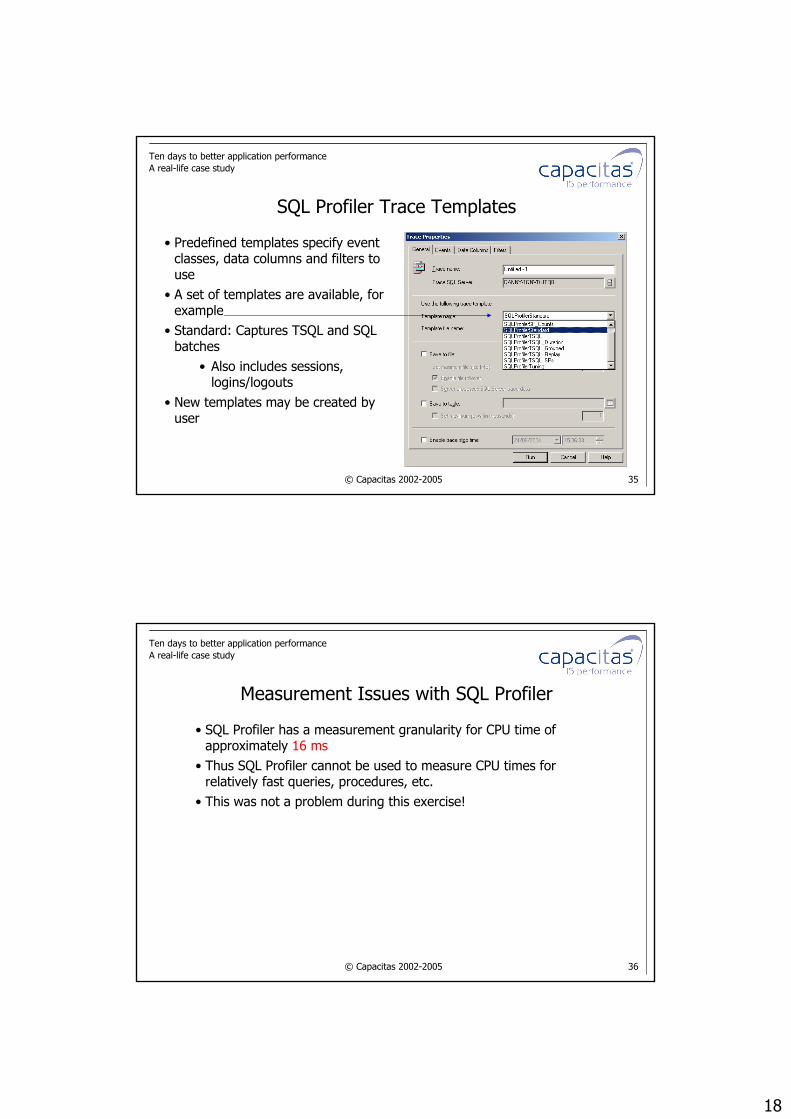
SQL Profiler Trace Templates
• Predefined templates specify event classes, data columns and filters to use
• A set of templates are available, for example
• Standard: Captures TSQL and SQL batches
• Also includes sessions, logins/logouts
• New templates may be created by user
© Capacitas 2002-2005 36
Ten days to better application performanceA real-life case study
Measurement Issues with SQL Profiler
• SQL Profiler has a measurement granularity for CPU time of approximately 16 ms
• Thus SQL Profiler cannot be used to measure CPU times for relatively fast queries, procedures, etc.
• This was not a problem during this exercise!

19
© Capacitas 2002-2005 37
Ten days to better application performanceA real-life case study
Graph showing how SQL Profiler reports CPU time as nearly a multiple of 16ms
0
16
32
0 10 20 30 40 50 60 70 80 90 100 110 120 130 140 150Duration
CP
U T
ime
repo
rted
by S
QL
prof
iler (
ms)
© Capacitas 2002-2005 38
Ten days to better application performanceA real-life case study
SQL Server Profiler Tracing
• SQL Server Profiler tracing was enabled to allow data collectionduring testing
• The SQL ServerProfilerStandard trace template was used• Separate trace files were collected for each component of testing:
• pretestidle.trc• PO_Step1.trc• PO_Step2.trc• posttestidle.trc

20
© Capacitas 2002-2005 39
Ten days to better application performanceA real-life case study
Purchase Order Maintain Transaction
• Testing was conducted using an existing purchase order no. 171662, which is composed of 144 lines (one item per line) for 65 stores, resulting in a matrix containing over 9,000 items
• We can identify SQL batches that relate to this test by searching the output of the trace file for ‘171662’
• The Purchase Order Maintain transaction is composed of two steps, referred to as:
• PO_Step1• PO_Step2
© Capacitas 2002-2005 40
Ten days to better application performanceA real-life case study
Screenshot

21
© Capacitas 2002-2005 41
Ten days to better application performanceA real-life case study
PO_Step1
• Loading purchase order details• Response time measured manually• This transaction took 2 minutes to complete (06:26 to 06:28)
© Capacitas 2002-2005 42
Ten days to better application performanceA real-life case study
PO_Step2
• Loading the Purchase Order matrix of over 9,000 items• This transaction took over 28 minutes to complete (06:31 to 06:59)• During PO_Step2 a single SQL statement (PO_HEADER HEAD) took
over 23 minutes to complete (as measured using a stopwatch) and used over 22 minutes of CPU (as measured using SQL Profiler)
• Remember – these are response times for a single user test on an otherwise unloaded production system!

22
© Capacitas 2002-2005 43
Ten days to better application performanceA real-life case study
PO_Step2
• This transaction resulted in a period where % CPU time increased by exactly 25% for the duration of this query, indicating that thistransaction ran as a single thread across the four CPUs on the KPP SQL Server
• Upon investigation of the parallelism settings for SQL Server, it was discovered that SQL Server is currently configured to only use one of the available four CPUs for parallel execution of queries
© Capacitas 2002-2005 44
Ten days to better application performanceA real-life case study
Parallel Execution of Queries
• Optimises query execution in multi-processor computers• Rather than using one thread to execute one query, work is broken
down into multiple threads• Subject to available threads and memory• SQL Server creates and executes a parallel plan for a query only when
the estimated cost to execute a serial plan for the same query is higher than the value set in elapsed time in seconds
• Known as ‘cost threshold for parallelism’• Only relevant for symmetric multiprocessors (SMP) systems

23
© Capacitas 2002-2005 45
Ten days to better application performanceA real-life case study
© Capacitas 2002-2005 46
Ten days to better application performanceA real-life case study
Parallel Execution of Queries
• Known bug in SQL 7.0
• Any changes elsewhere on the Processor tab may result in the setting ‘Use 1 Processor’
• The value displayed in the GUI may not be correct http://support.microsoft.com/kb/q273880/

24
© Capacitas 2002-2005 47
Ten days to better application performanceA real-life case study
Parallel Execution of Queries
• Use the system stored procedure to definitively view/change the setting:
© Capacitas 2002-2005 48
Ten days to better application performanceA real-life case study
Parallelism
• The following response was received from the developers:• “About 12-18 months ago a problem occurred on the
overnight runs• This manifested itself as a hang on either the till log update or
the extract to accounts• The problem was reported to Microsoft who recommended
turning off parallelism; this solved the problem• Microsoft then issued a hot fix which was tested and approved
by the developers• However the IT manager at the time had reservations about
this hot fix and said he would wait until the appropriate service pack became available”

25
© Capacitas 2002-2005 49
Ten days to better application performanceA real-life case study
Conclusions
• By rewriting the SQL for offending transaction, the execution time for the Purchase Order Maintain transaction was reduced from 23 minutes to 26 seconds
• This had a direct impact on the end user response time• This negated any strong requirement to implement the fix and
amend the parallelism settings
© Capacitas 2002-2005 50
Ten days to better application performanceA real-life case study
Summary
• Implementation of a 3rd-party product had left a gap in understanding of the performance of the system
• Insufficient understanding of architectural decisions surrounding performance and capacity
• No performance monitoring• After five days of investigation conducted over a ten-day period, a
set of recommendations were delivered that were used to reduce end-user response times for some transactions from minutes to seconds
• This had a direct positive impact on business productivity, at a low cost, using bundled tools

![The Virtues of these 10 Days - WordPress.com€¦ · The Virtues of these 10 Days -> Allah swore by these 10 days in Surah Al-Fajr [86:2]: "By the ten nights (i.e. the first ten days](https://img.pdfslide.us/doc/110x75/5f5caa40e812f479d5758a75/the-virtues-of-these-10-days-the-virtues-of-these-10-days-allah-swore-by.jpg)