Embed Size (px)
Citation preview

May, 2017
Temporary Protected Status
in The United States:
The Experiences of Honduran and Salvadoran Immigrants
Contributing Organizations
Center for Migration Research, University of Kansas (CMR at KU) Central American Resource Center (CARECEN) –Los Angeles
National Day Laborer Organizing Network (NDLON)
Cecilia Menjívar, PhD
Department of Sociology
University of Kansas

About the Research Team
Byeongdon Oh, University of Kansas, Project Manager
Ana Garcia, CARECEN-Los Angeles, Survey Field Coordinator
Daniel Alvord, University of Kansas, Research Assistant
Andrea Gómez-Cervantes, University of Kansas, Research Assistant
Natalie Jansen, University of Kansas, Research Assistant
Acknowledgements
This project was made possible with funding from the Center for Migration Research at the University of Kansas, as well as from Foundation Distinguished Professorship research funds for Menjívar.
From its inception this project benefited from the assistance of various individuals at key points. Maria Enchautegui assisted with questionnaire construction as did Leisy Abrego and Walter Nicholls, and together with the entire research team they all read versions of this report and provided immensely helpful comments.
Preferred Citation
Menjívar, Cecilia. 2017. Temporary Protected Status in the United States: The Experiences of Honduran and Salvadoran Immigrants. Center for Migration Research, The University of Kansas.

Temporary Protected Status
Center for Migration Research May, 2017
1
Executive Summary
This report presents findings from a nationwide survey of immigrants holding Temporary Protected
Status (TPS). In collaboration with CARECEN-Los Angeles, NDLON and other organizations, the
Center for Migration Research (CMR) at the University of Kansas designed and administered a
randomized telephone survey and in-person survey of 2,098 respondents (Men 53.7%, Women
46.3%) from El Salvador (92.3%), Honduras (7.5%), and Nicaragua (0.2%). The survey was
conducted in Spanish during the period April, 2016 to August, 2016 in the six cities with the largest
populations of Central Americans: Los Angeles (34.1%), Houston (28.7%), Washington (21.0%),
San Francisco (9.4%), New York (4.9%), and New Jersey (1.9%).
Survey results indicate that generally, TPS has contributed positively to the socioeconomic
integration of these immigrants and therefore this legal status has benefitted these immigrants, their
families and society in general. Key findings include:
TPS holders have significantly high levels of labor force participation: 94.0% of men and 82.1%
are working, with 83.2% of men and 54.9% of women working more than 40 hours per week, and
7.6% of men and 10.0% of women working more than one job. About one tenth of survey
respondents were self-employed (men 13.4%, women 7.8%).
Men work in construction/painting (18.9%), driving (9.3%), cleaning (6.3%), cooking (3.2%),
gardening (2.8%), while women concentrate in cleaning buildings (16.5%) or houses (12.2%),
childcare (7.6%), cooking (6.0%), or in clothing manufacture (5.8%).
The average monthly income of the survey respondents is $2,909.87 (men=$3,597.64;
women=$2,054.31)
33.6% of men and 29.94% of women in the survey live in owner-occupied homes in the United
States.
The average educational level of the survey respondents at the time they arrived in the United
States was 7.64 years; however, 49.2% of them have furthered their education in the United
States, enrolling in at least one educational program, such as English language courses (36.4%),
high school diploma or GED (9.6%), vocational certificate (4.9%), college courses (1.6%), and
university (1.0%)
29.7% of the survey respondents volunteered in civic organizations, committees, or community
groups in the 12 months prior to the survey, showing high levels of social integration. In addition,
20.2% engaged in activities to benefit to their community including donating blood, cleaning
streets, etc.
80.3% of survey respondents pay income taxes, including 79.3% of those who are self-employed.
They have contributed to social security for an avg. of 15.4 years and 90% file taxes every year.

Table of Contents
What is Temporary Protected Status? .................................................................................... 1 Understanding Temporary Protected Status ....................................................................................1
Temporary Protected Status In the United States ................................................................... 2 Salvadorans and Hondurans on TPS: A Background ......................................................................2
Data Collection ...................................................................................................................... 4 Data Collection ................................................................................................................................4
1. Demographic Profile .......................................................................................................... 5 Demographic Profile ........................................................................................................................6
TPS holders families ........................................................................................................................7
2. Education ......................................................................................................................... 8 Educational Attainment ...................................................................................................................8
3. Economic Activities ............................................................................................................ 9 Labor Force Participation ..............................................................................................................10
Remittances ....................................................................................................................................10
Current Occupation ........................................................................................................................11
Work Violations .............................................................................................................................12
4. Taxes & Contributions...................................................................................................... 13 Taxes & Social Security.................................................................................................................13
5. Health Insurance .............................................................................................................. 14 Health Insurance ............................................................................................................................14
6. Community Settlement & Involvement ............................................................................ 15 Homeownership .............................................................................................................................15
Community Involvement ...............................................................................................................16
7. Effects of TPS ................................................................................................................... 17 Effects of TPS ........................................................................................................................................................17
Final Considerations and Recommendations ........................................................................ 18 Social, Economic and Cultural Integration ....................................................................................18
Moving Beyond Temporariness .....................................................................................................19
References .......................................................................................................................... 20 References ......................................................................................................................................20

Temporary Protected Status
Center for Migration Research May, 2017
1
What is Temporary Protected Status?
According to U.S. Citizenship and Immigration Services (2017) a country may be
designated for Temporary Protected Status (TPS) when conditions in that country temporarily
prevent the country’s nationals from returning safely, or under certain circumstances, where the
country is unable to handle the return of its nationals adequately. The Secretary of Homeland
Security (DHS) may designate a country for TPS if there is ongoing armed conflict in that
country, if an environmental disaster or an epidemic has occurred there, or for other
extraordinary and temporary conditions. During the designated period, TPS beneficiaries are not
removable from the United States, can obtain employment authorization (EAD), and in principle
may be granted travel authorization, though this is very rarely used. Unlike undocumented
immigrants, TPS beneficiaries cannot be detained by DHS on the basis of their legal status.
However, unlike other forms of permanent legal residence, TPS is a temporary benefit that does
not lead to lawful permanent residence status or any other immigration status (United States
Citizenship and Immigration Services 2017). Importantly, TPS is only granted if it is consistent
with U.S. national interests (Segerblom 2007; Seghetti, Ester, and Wasem 2015) and, contrary to
refugee or asylum status, TPS is granted based on country conditions, not on individual
situations (Bergeron 2014).
In practice, as Fitzpatrick (2000:280) observes, TPS “expands the protection of forced
migrants who cannot satisfy the criteria [of refugee or asylum status]…it promises group-based
protection when the determination of an individual’s status proves impossible… TP[S] serves as
a short-term strategy to secure the immediate physical safety of refugees and a way station to
more durable protection.” As such, TPS allows for the creation of international ties, solidarity,
and political treaties between nations. And according to refugee law under the United Nations
High Commission for Refugees (UNHRC), temporary protection helps countries fulfill remedial
obligations to other states that have provoked human rights violations and victims of flight
(Fitzpatrick 2000; Golay 2001). Countries of Western Europe, Australia and others have created
temporary protection statuses at different times for various groups as a result of: (1) armed
conflicts, (2) internal strife, (3) systematic human rights violations, or (4) natural disaster (United
Nations High Commission for Refugees (UNHCR) 2014). However, the mechanisms that make
TPS possible and its requirements make it difficult for beneficiaries to incorporate in the host
countries, an aspect that highlights the temporariness of this designation.
Research has found that the in-between legality of immigrants in temporary statuses (e.g.,
not undocumented but not permanent legal residence either) and the embedded ambiguity
inherent in these statuses is reflected in the experiences of immigrants who hold them (Abrego
and Lakhani 2015; Gonzales 2016; Menjívar 2006). Although research has found that these
immigrants share uncertainties and face barriers similar to those that undocumented immigrants
also encounter, TPS holders’ experiences can differ from those of undocumented immigrants as
well as from those of permanent residents (Bergeron 2014; Cebulko 2014; Menjívar 2006). A
temporary status affects immigrants’ sense of belonging in society and process of socioeconomic
integration. TPS holders are able to access economic opportunities they would otherwise be
ineligible for, but the temporariness of the status can hinder other forms of more stable
integration. That is, “TPS confers partial inclusion while simultaneously affirming that this status
is temporary and partial” (Waters and Gernstein Pineau 2016:140).

Temporary Protected Status
Center for Migration Research May, 2017
2
Temporary Protected Status in the United States
Table 1. Temporary Protected Status Country Designations in the U.S. Country Designation
Date Expiration Date
Re-registration Period
Employment Authorization Document Expiration
Estimated Number 2015
El Salvador Mar. 9, 2001 Mar. 9, 2018 Jul. 8, 2016 – Sep. 6, 2016
Mar. 9, 2017 204,000
Guinea Nov. 21, 2014 May 21, 2017 N/A May 20, 2017 2,000
Haiti Jul. 23, 2011 Jul. 22, 2017 Aug. 25, 2015- Oct. 26, 2015
Jul. 22, 2016 50,000
Honduras Jan. 5, 1999 Jan. 5, 2018 May 16, 2016 – Jul. 15, 2016
Jan. 5, 2017 61,000
Liberia Nov. 21, 2014 May 21, 2017 N/A May 20, 2017 4,000
Nepal Jun. 24, 2015 Jun. 24, 2018 Oct. 26, 2016 – Dec. 27, 2016
Jun. 24, 2017 10,000 - 25,000
Nicaragua Jan. 5, 1999 Jan. 5, 2018 May 16, 2016 – Jul. 15, 2016
Jan. 5, 2017 2,800
Sierra Leone Nov. 21, 2014 May 21, 2017 N/A May 20, 2017 2,000
Somalia Sep. 18, 2012 Mar. 17, 2017 Jun. 1, 2015 – Jul. 31, 2015
NO Automatic Extension*.
270
Sudan May 3, 2013 Nov. 2, 2017 Jan. 25, 2016 – Mar. 25, 2016
Nov. 2, 2016 300 – 500
South Sudan May 3, 2016 Nov. 2, 2017 Jan. 25, 2016 – Mar. 25, 2016
Nov. 2, 2016 600
Syria Aug. 1, 2016 Mar. 31, 2018 Aug. 1, 2016 – Sep. 30, 2016
Mar. 31, 2017 5,000
Yemen Sep. 3, 2015 Mar. 3, 2017 N/A N/A N/A *Sufficient time was deemed available to issue new EADs
Note: Data from U.S. Citizenship and Immigration Offices, Temporary Protected Status
https://www.uscis.gov/humanitarian/temporary-protected-status
Estimates come from Congressional Research Service (see Arguenta and Wasem 2016).
Salvadorans and Hondurans on TPS: A Background
The Immigration Act of 1990 authorized the creation of TPS. The U.S. Congress
designated El Salvador as the first country whose nationals could apply for TPS (Chishti and
Yale-Loehr 2016), a decision based on the civil war raging in that country at the time. This new
status included important limitations: individuals applying for TPS had to already be in the
United States; they could not apply for this benefit overseas. An applicant also had to meet the
following requirements: continued residence in the United States, no felony convictions, not
more than two misdemeanors committed in the United States, not pose a national security threat,
and the person registered and reapplied for continuous status during a stipulated timeframe
(Chishti and Yale-Loehr 2016). Since 1990, the requirements to apply, process, and maintain
TPS have remained the same.
According to estimates by the Migration Policy Institute (2016) there are approximately
323,000 immigrants on TPS at the moment; they make up approximately 4% of the U.S. foreign-
born population (Passel and Cohn 2016a). The overwhelming majority of those on TPS are

Temporary Protected Status
Center for Migration Research May, 2017
3
nationals of El Salvador (204,000) and Honduras (61,000). Other designated countries at the
moment include Haiti (50,000), Syria (10,000), Liberia (4,000), and Nicaragua (2,800). Smaller
numbers of recipients come from Nepal, Yemen, Sierra Leone, Somalia, Sudan, South Sudan and
Guinea are also included (Argueta and Wasem 2016; Chishti and Yale-Loehr 2016; Seghetti et
al. 2015).
TPS is temporary, granted for a designated time period usually lasting between 6 to 18
months and can be extended if country conditions do not change (Bergeron 2014; Seghetti et al.
2015). And TPS does not lead to permanent residency or citizenship. Thus, unlike family
reunification visas, TPS holders are unable to sponsor family members, and in contrast to
refugees or those granted asylum, TPS beneficiaries do not receive settlement aid nor qualify for
public assistance benefits (Kerwin 2014). However, they are eligible for emergency Medicaid,
public health programs (e.g. immunizations), disaster relief, reduced lunch programs, and public
K-12 education (Kerwin 2014). The only way that TPS holders can be adjusted to legal
permanent residency is through an affirmative supermajority vote in the Senate (involving 3/5ths
of all Senators), given an Immigration and Nationality Act (INA) provision for TPS (Kerwin
2014; Seghetti et al. 2015).
The first TPS designation for Salvadorans expired in 1992, but after the 12-year civil war
ended country conditions did not change and a weakened economy did not recover. TPS holders,
therefore, were granted another form of temporary relief, “deferred enforcement departure”
(DED), which lasted until 1995. In January 2001 El Salvador suffered two deadly earthquakes,
which prompted the U.S. government to once again designate El Salvador for TPS. An estimated
290,000 Salvadorans already present in the United States at the time were granted TPS, but
according to estimates this number has declined to approximately 204,000 by 2015 (Orrenius and
Zavodny 2015). Salvadoran TPS holders have had continuous presence in the country since
March, 2001 and TPS has been expanded for them nine times.
Hondurans on TPS have been on this status consecutively longer than any other
designated group. In October 1998, Hurricane Mitch left extensive devastation in Honduras,
including an estimated 1.5 million homeless (out of approximately 6 million people at the time),
entire villages destroyed, and billions of dollars in damages. The U.S. Congress designated
Hondurans for TPS and according to estimates initially approximately 105,000 Hondurans
benefited but the number has declined to approximately 61,000 today (Magaña-Salgado 2016).
TPS has been renewed 10 times for Hondurans. As is the case for Salvadorans, Hondurans have
had continuous presence in the United States, since January 1999.
Who are the TPS holders?
Even though Salvadorans and Hondurans have held TPS status for a decade and a half,
little is known about their experiences. This is in part due to the lack of publically available data
on this population. However, some extant research points to the benefits of this status, in
particular protection from deportation. Research has shown that the threat of deportation has
significant consequences to immigrants and their families, ranging from alterations in everyday
routines, low wages and work exploitation, economic instability, mental and physical health
downturns, decreases in educational attainment and cognitive development for children, and
indefinite family separations (Aranda, Menjívar, and Donato 2014; Brabeck and Xu 2010; Dreby
2015; Gonzalez and Chaves 2012; Hagan, Castro, and Rodriguez 2010; Hasselberg 2016).

Temporary Protected Status
Center for Migration Research May, 2017
4
Furthermore, TPS gives immigrants access to a social security number and a work permit, which
allows immigrants to obtain driver’s licenses and other state-regulated licenses, leading to access
to jobs with certain degree of mobility and to participate in society’s institutions and civic
organizations. Undoubtedly, TPS has provided immigrants with certain opportunities to expand
their economic and social contributions to society that undocumented immigrants do not have.
Salvadoran and Honduran TPS holders comprise over 80% of the TPS population; they
also make up 16 % of the Salvadoran population and 11.5% of the Honduran population in the
United States today. These two groups are also the national-origin groups with the longest TPS
tenure—17 years for Hondurans and 16 years for Salvadorans. Noteworthy, they have lived in
the United States for much longer, for an average of 20 years, since TPS registration required
that applicants already reside in the United States at the time of application. And the TPS
program does not allow new entrants; thus, everyone on TPS today registered during a specified
time period when the countries were designated. With a median age for TPS holders of 42 years,
the average TPS holder has spent one third of their lives on TPS. This long-term settlement has
allowed these TPS holders to become dynamic members of their communities and active
contributors to the nation’s coffers.
Based on a national-level telephone survey of 2,098 respondents in the five U.S. regions
with the largest concentration of Salvadoran and Honduran immigrants, this report presents their
demographic profile, educational background, economic activities and contributions, community
involvement, and some of the effects and benefits of having TPS in the United States.
Data Collection
We determined the population of Central Americans to survey for this study using the
U.S. Census. With data from the U.S. Census we identified the largest concentrations of
Salvadorans and Hondurans in the country, assuming that TPS holders would live in the same
geographic areas. Thus, we selected the top six metropolitan areas with the largest populations of
Salvadorans and Hondurans: Los Angeles, San Francisco, Houston, Washington D.C., New York
and New Jersey. We did not select the Miami area because although it has a high concentration
of Hondurans it has far fewer Salvadorans and TPS holders are not as represented in Miami as
they are in the other regions of the survey.
Without a sampling frame from which to select a sample of TPS holders to survey in
those regions, we turned to community organizations that work with Central American
communities to enlist their assistance in this effort. They were critical in two ways: They
provided lists of TPS holders from which we selected survey participants. Equally important,
they also enrolled volunteers to conduct the survey. These organizations include the Central
American Resource Center (CARECEN), Red Nacional de Salvadoreños en el Exterior
(RENASE), and Wind of the Spirit. We also obtained assistance from Salvadoran consulates.
Some of these organizations, like CARECEN, provide legal services and assist
individuals with TPS renewals every 18 months, maintaining lists of the people they serve.
However, we also obtained assistance from community organizations that do not provide direct
legal services to TPS holders; in these cases, they worked in collaboration with local Salvadoran
consulates to select potential survey participants from list of registrants that the consulates
maintain. The table below shows what organization participated in each city, indicating whether

Temporary Protected Status
Center for Migration Research May, 2017
5
they are a direct service organization, the total number of volunteers in each city, and the total
number of surveys collected there.
Table 2. Data Collection Regional Dispersion Region Organization(s) Total
Volunteers Total Surveys Collected
Los Angeles CARECEN-LA (legal services provider) RENACE-LA (non-legal service provider)
16 715
San Francisco RENACE-SF (non-legal service provider) 4 198
Houston CRECEN- Houston (legal services provider) 6 600
Washington D.C. CARECEN-DC (legal services provider) RENACE-DC (non-legal service provider)
6 441
New York REANCE-NY (non-legal services provider) 2 103
Ney Jersey Wind of the Spirit (non-legal service provider) 5 39
Each list of TPS holders was randomized and the selection proceeded with an interval=5,
that is, every fifth name was selected, determined as an optimal N to be secured based on the
total number of names on each list1, a compromise on the selection procedure that can still allow
us to conduct statistical analysis. The selected names were then placed on a calling list for the
telephone survey. Volunteers, TPS holders themselves, who were trained in administering the
survey as well as in human subjects protocols and the ethics of conducting research,2 then called
each person on the selected list and recorded whether the person participated, declined to
participate, if a voicemail was left, or if that person was unreachable.
Potential participants who were marked as unreachable were tried again up to total of 3
attempts. If by the 3rd
attempt the potential participant was still unreachable, they were taken off
the calling list. Some potential participants doubted the legitimacy of the survey and visited the
organization in person to verify that the request for participation was not a scam. These few
individuals completed the survey in person. Furthermore, some organizations came across some
obstacles to complete the survey over the phone and thus opted for interviewing individuals as
they came to the organization to obtain assistance to renew their TPS.
For those who agreed to participate, a letter of consent describing their rights and
including contact information for Dr. Cecilia Menjívar was read to them before beginning with
the survey. Once the surveys were completed, they were mailed to the coordinator at
CARECEN-Los Angeles to review for completeness. Once reviewed, the surveys were mailed to
the University of Kansas for data entering and management.
1. Demographic Profile
Given that the goal of the survey was to capture the largest TPS population, 92.3% of the
survey participants originated in El Salvador and 7.5% in Honduras. As indicated earlier, the
1 The total number of TPS holders on the lists provided by the organizations and the Salvadoran consulate varied by
city. For instance, CARECEN-Los Angeles had a total list of TPS holders of 1,225, thus we obtained more than half
of those on the list. The list in Houston had 4,000 names; the 600 names we obtained there made up a small
proportion of the total. We adopted the interval of 5 to select from all lists to avoid confusion across organizations.
2 This study was approved by the University of Kansas Institutional Review Board and Dr. Cecilia Menjívar,
assisted by Ana Garcia, from CARECEN-Los Angeles, conducted the trainings for the survey takers.

Temporary Protected Status
Center for Migration Research May, 2017
6
survey was conducted in five regions with large concentrations of these immigrants: Houston,
Los Angeles, New York/New Jersey region, San Francisco, and the Washington D.C. region
However, the majority of the survey participants lived either in Houston (28.7%) or Los Angeles
(34.1%), which conforms with settlement patterns of Salvadorans in the United States (Lopez
2015), who make up the majority of TPS holders.
Of the 2,098 survey participants, the majority (53.7%) were men. The median age of TPS
holders in the study was 43 years (42 for men, 43 for women), a group older than both the
undocumented population and the immigrant population with permanent legal status (both have a
median age of 36.1 years) (Taylor, Lopez, and Motel 2011), and older than the U.S. population
in general, with a median age of 37 years (Lopez 2015).3
Table 3. Demographic Profile Men Women Total
N 1,126 972 2,098
Age (Median) 42 43 43
Country of Origin
El Salvador 93.0% 91.5% 92.3%
Honduras 6.7% 8.3% 7.5%
Nicaragua 0.3% 0.1% 0.2%
Interview Missing 0.0% 0.1% 0.0%
Years in the U.S. 19.9 20.8 20.3
City of Residency
Houston 31.7% 25.2% 28.7%
Los Angeles 29.4% 39.5% 34.1%
New Jersey 2.0% 1.7% 1.9%
New York 5.6% 4.1% 4.9%
San Francisco 9.8% 9.1% 9.4%
Washington D.C. 21.6% 20.4% 21.0%
The majority of TPS holders were married (40.7% total), a rate lower than among the
general U.S. population (48.2%) (U.S. Census Bureau 2015a). Among TPS holders, more men
(44.2%) than women (36.6%) were married; the marriage rate for women among TPS holders is
lower than that of women in the general U.S. population (46.5%) (U.S. Census Bureau 2015a).
Overall, 36% of TPS holders were single, but this rate was higher among women (42%) than
among men (30%). This is comparable to the general U.S. population, among whom 30% live in
single-person households, but higher than legal immigrants (17%) and undocumented
immigrants (13%) who live in single-person households (Immigration Council 2014; Passel and
Cohn 2009). Thus, TPS holders have lower rates of marriage than the U.S-born population, and
also have higher rates of singlehood than the U.S.-born population, authorized immigrants, and
undocumented immigrants. 4
3 It should be kept in mind that TPS survey respondents are older (just their time on TPS adds a decade and a half to their age as TPS was not extended to immigrants under 18 years of age). 4 Conventionally, ‘married and cohabiting’ is coded as ‘married’. We separated ‘married’ and ‘cohabiting’.

Temporary Protected Status
Center for Migration Research May, 2017
7
About 13% of TPS holders were cohabiting, a pattern that was more common among
men (16%) than among women (10%). These cohabiting patterns mirror those in the countries of
origin as well as among Latinos in the United States.
With respect to family composition, most TPS survey participants (86.3%) had at least
one child, but on average they had between two and three children. This rate is higher than
among unauthorized immigrants (46%), authorized adult immigrant (38%), or among the U.S.-
born population (29%) (Taylor et al. 2011), which may be related to TPS holders being older
than any of the other comparison groups.
TPS Holders’ Families
Table 4. Family Composition Men Women Total
N 1,126 972 2,098
Marital Status
Single 30.8% 42.0% 36.0%
Married 44.2% 36.6% 40.7%
Cohabiting 16.3% 10.0% 13.3%
Divorced 4.8% 6.4% 5.5%
Separated 2.8% 2.0% 2.4%
Widow 1.0% 2.9% 1.9%
Married, but cohabiting now 0.1% 0.1% 0.1%
Interview Missing 0.0% 0.1% 0.0%
Children
Yes 82.3% 90.8% 86.3%
No 17.3% 9.0% 13.4%
Interview Missing 0.4% 0.2% 0.3%
Number of Children 2.7 2.9 2.8
Location of Children Everyone lives in the US 57.9% 65.1% 61.2%
Everyone lives in another country 9.5% 6.9% 8.3%
Some here and some in another country
14.9% 18.4% 16.5%
Interview Missing 0.0% 0.4% 0.2%
Not Applicable 17.7% 9.2% 13.7%
Children under 21 years of age
Yes 64.9% 58.0% 61.7%
No 17.2% 32.4% 24.3%
Interview Missing 0.2% 0.4% 0.3%
Not Applicable 17.7% 9.2% 13.7%
Children under 21 years of age living in another country
Yes 11.5% 7.2% 9.5%
No 48.1% 46.3% 47.3%
Interview Missing 5.2% 4.5% 4.9%
Not Applicable 35.1% 42.0% 38.3%
Children in the United States
Yes 60.5% 61.5% 61.0%
No 20.7% 28.3% 24.2%
Interview Missing 1.2% 1.0% 1.1%
Not Applicable 17.7% 9.2% 13.7%

Temporary Protected Status
Center for Migration Research May, 2017
8
Sixty-one percent of TPS respondents had all of their children living in the United States;
however, women were slightly more likely to have all of their children living in the United States
than were men. On the other hand, 24% of TPS holders had either some or all of their children
living outside of the United States. Specifically, 9.5% of men and 6.9% of women had all of their
children abroad, while 14.9% of men and 18.4% of women had at least one child living in a
different country. Although the majority of participants’ children living abroad were older than
21 years of age, we must take into account that the TPS holders’ average time spent living in the
United States is over a decade and a half. Therefore, the majority of TPS holders who have
children living abroad most likely left their children while they were young. These parents have
been separated from their children for a significant part of the children’s lives. The long-term
separations in these families and the uncertainty of not knowing when they will see each other
again, has created conditions for TPS holders to create new families in the United States
(Menjívar 2006). Many TPS holders live in mixed-status families, with 61% having at least one
child born in the U.S. (among those with children). The length of time spent living in the U.S.
(16 years among Hondurans and 15 years for Salvadorans) and the formation of these new
families, with almost two thirds having a U.S-born child, means that TPS holders are rooted and
settled in the United States and socially integrated in their communities across the country.
2. Education
Table 5. Education Men Women Total
N 1,126 972 2,098
Educational grade obtained in country of origin 7.8 7.4 7.6
Educational Experience in U.S.
Yes 47.4% 51.3% 49.2%
No 51.9% 48.6% 50.3%
Interview Missing 0.7% 0.1% 0.4%
Finished high school or has a GED Yes 10.1% 9.0% 9.6%
No 30.1% 36.7% 33.2%
Interview Missing 7.2% 5.7% 6.5%
Not Applicable 52.6% 48.7% 50.8%
Some college courses without graduating Yes 1.3% 1.9% 1.6%
No 38.3% 43.5% 40.7%
Interview Missing 7.8% 6.0% 7.0%
Not Applicable 52.6% 48.7% 50.8%
Certificate Yes 4.0% 6.0% 4.9%
No 35.8% 39.6% 37.6%
Interview Missing 7.6% 5.8% 6.8%
Not Applicable 52.6% 48.7% 50.8%
University title Yes 0.9% 1.1% 1.0%
No 38.7% 44.2% 41.3%
Interview Missing 7.8% 6.0% 7.0%
Not Applicable 52.6% 48.7% 50.8%
English courses Yes 35.1% 37.9% 36.4%
No 11.9% 12.8% 12.3%
Interview Missing 0.4% 0.7% 0.6%
Not Applicable 52.6% 48.7% 50.8%

Temporary Protected Status
Center for Migration Research May, 2017
9
The average level of education TPS holders obtained in their country of origin before
migration is between 7th
and 8th
grade, a reflection of the constraints to accessing education that
prevail in the origin countries. However, about half of TPS holders continued some form of
education after arriving in the United States. For instance, about 36.4% enrolled in English
courses, 9.6% finished high school or obtained a GED, 4.9% obtained a certificate, and about
2.6% enrolled in some college or obtained a college degree. Whereas there are small differences
between women and men’s educational attainment, this gender variation is important to note
because it may impact the jobs that TPS holders can obtain. Thus, women showed higher
involvement in higher education, English classes or certificates than men, while slightly more
men finished high school or their GED. The lower educational levels of TPS holders are
comparable to those of Salvadorans living in the U.S., who tend to have lower education levels
than other Latinos and other groups in the United States (Lopez 2015). The general educational
levels for TPS holders are also similar to those of undocumented immigrants; in 2009, 47% of
undocumented immigrant adults ages 25-64 had less than a high school education, compared to
8% of U.S.-born residents of the same age (Passel and Cohn 2009).
3. Economic Activities
Table 6. Economic Activities Men Women Total
N 1,126 972 2,098
Number of Previous Jobs 4.8 4.0 4.4
Current Working Status
Yes 94.0% 82.1% 88.5%
No 5.7% 17.6% 11.2%
Interview Missing 0.4% 0.3% 0.3%
Self-employed
Yes 13.4% 7.8% 10.8%
No 78.2% 71.5% 75.1%
Interview Missing 2.3% 2.8% 2.5%
Not Applicable 6.0% 17.9% 11.5%
Number of Current Jobs 1.1 1.2 1.1
Working Hours per Week
20 hours or less 2.6% 8.3% 5.2%
21 -39 hours 5.1% 16.4% 10.3%
40 - 45 hours 52.8% 43.4% 48.4%
46 hours or more 30.5% 11.5% 21.7%
Interview Missing 3.1% 2.5% 2.8%
Not Applicable 6.0% 17.9% 11.5%
Monthly Income $3,598 $2,054 $2,910
Remittance
Yes 79.7% 73.3% 76.7%
No 18.6% 24.8% 21.4%
Interview Missing 1.8% 2.0% 1.9%
Remittance per month $303 $227 $269
The U.S. labor force is made up of 133 million U.S.-born workers (83% of the total), 19.5
million lawful immigrant workers (12%), and 8 million unauthorized immigrant workers (5%)
(Passel and Cohn 2016). Through the work permit TPS holders obtain as part of TPS benefits,
they have been active in the labor force and have made significant contributions to the U.S.

Temporary Protected Status
Center for Migration Research May, 2017
10
economy (see Orrenius and Zavodny 2015). The overall labor force participation rate of TPS
holders is 88.5%, much higher than the 62.9 % in the U.S. population (Buerau of Labor Statistics
2017). With regard to labor force participation by gender, the overwhelming majority of men
TPS holders, 93.9%, are currently working. This rate is higher than any of the other comparison
groups. For instance, 91% of undocumented immigrant men, 79% of U.S.-born men, and 84% of
lawful immigrants of similar age were in the labor force in 2014 (Passel and Cohn 2016).
Women TPS holders have similarly high levels of labor force participation; 82.1% of them are
currently working, a rate also higher than among other comparison groups. For instance, 61% of
undocumented immigrant women, 72% of U.S.-born women, and 67% of lawful immigrant
women were in the labor force in 2014 (Passel and Cohn 2016). Thus, overall, TPS holders’
labor force participation rate is significantly higher than that of the general U.S. population and
higher than among other immigrant groups, both authorized and undocumented.
Reflecting their active labor force participation both
women and men TPS holders have had between 4 and 5 jobs
since they arrived to the United States. The majority of TPS
holders only have one job at present; 85% of men and 71.1% of
women had one job at the time of the survey. However, among
those who had more than one job, there is a gender difference:
More women (8.6% of women) than men (6.6%) had two jobs.
This difference could be due to the fact that women have a
higher rate of part-time work and thus they often stitch together
various jobs in order to earn what full-time work would generate,
a situation observed in other immigrant-receiving contexts (see
Menjívar 2000).
Men TPS holders make approximately $3,597.64 a month while women make $2,054, a
monthly income that is slightly higher than that of other Hispanics (Lopez 2015), but
considerably less than median U.S. earnings. According to the ACS, the median annual
household income is $53,889, which works out to approximately $4,500 a month (U.S. Census
Bureau 2015c). And although TPS holders work in a variety of sectors and occupations, there are
concentrations by gender. For instance, 23% men concentrate in construction; almost 14% work
in driving and delivery, and approximately 8% work as dishwashers or cleaning offices or
buildings. However, approximately 25.7% of men reported an “other” occupation, which
comprises factory work. Among women, almost 17% work cleaning offices or buildings,
approximately 18% work in childcare or cleaning houses, and close to 23% reported “other”
occupations.
TPS holders are likely to put in long hours at work. While the
majority work between 40-45 hours per week, women are more
likely to work part-time; 24.7% of women worked 39 hours or less
compared to only 8% of men. And men are more likely than women
to work overtime (we define overtime as 46 hours of work per
week). Thus, 52.75% of men reported working between 40 and 45
hours a week and 43.42% of women reported working those hours.
In comparison, in the U.S. population in general, in 2015 the average
93.9% men TPS
holders and 82.1% women are currently working, a higher rate than any other comparison group.
TPS holders have held between 4 to
5 jobs since arriving in the
U.S.

Temporary Protected Status
Center for Migration Research May, 2017
11
number of hours men worked was 41 hours whereas women worked 36.2 hours per week (Pew
Research Center 2016).
TPS holders remit regularly, contributing to their families and to maintain their countries’
economies afloat. Approximately 77% of all TPS holders send remittances to their home
country. Men send on average $303 per month and women send on average $226 per month. The
lower remitted amount by women likely reflects their lower earnings. However, while men send
approximately 8% of their monthly wages, women remit about 11% of their monthly earnings.
Table 7. Current Job/Occupation Men Women Total
N 1,126 972 2,098
Current Job
Agriculture 0.6% 0.3% 0.5%
Cook 3.9% 5.2% 4.5%
Dishwasher 0.7% 0.9% 0.8%
Waiter 0.9% 1.6% 1.2%
Construction/ Painter 23.0% 0.8% 12.7%
Cleaning in offices/ buildings/school/hospital/restaurant/hotel 7.1% 16.7% 11.5%
Nurse 0.3% 1.9% 1.0%
Eldercare 0.2% 1.9% 1.0%
Receptionist 0.0% 0.5% 0.2%
Plummer 1.5% 0.1% 0.9%
Stylist/barber 0.4% 1.1% 0.7%
Car mechanic 2.7% 0.0% 1.4%
Electrician 2.3% 0.0% 1.2%
Gardener 3.4% 0.5% 2.0%
Childcare 0.3% 6.6% 3.2%
Cleaning houses 0.2% 11.2% 5.3%
Factory of clothes/ stockings/ accessories 1.5% 4.0% 2.7%
Worker at a store/supermarket 2.5% 3.8% 3.1%
Warehouse 2.7% 2.4% 2.5%
Driving/Delivery 13.7% 1.1% 7.9%
Other 25.7% 21.7% 23.8%
Currently not working 5.3% 14.5% 9.6%
Interview Missing 1.3% 3.1% 2.1%
One of the most significant benefits of having TPS is obtaining a work permit. As
Orrenius and Zavodny (2015) found, having TPS had a significant impact on Salvadorans’ labor
force participation. Looking at pre- and post-TPS Salvadorans, the authors examined whether
obtaining TPS aids Salvadorans in obtaining better wages or having better jobs compared to
other Salvadorans who are not eligible for TPS and are undocumented. Orrenius and Zavodny’s
(2015) findings show that TPS leads to higher earnings for men and higher employment for
women. Specifically, employed Salvadoran men with TPS are likely to earn about 13% more
than those who do not have TPS. Furthermore, TPS holders are able to be more selective in the
kinds of jobs they secure. Women who are employed and have TPS are also likely to work more
than women who do not have TPS. Thus, as Orrenius and Zavodny found, even having a
temporary permit increases the likelihood of better wages and employment. The findings we
report here are consistent with this earlier conclusion.

Temporary Protected Status
Center for Migration Research May, 2017
12
Table 8. Workplace Violations Men Women Total
N 1,126 972 2,098
Your boss did not pay you on time in the last 12 months
Yes 7.2% 6.9% 7.1%
No 88.5% 85.3% 87.0%
Interview Missing 4.3% 7.8% 5.9%
Your boss paid you less in the last 12 months
Yes 10.6% 10.9% 10.7%
No 84.6% 81.1% 83.0%
Interview Missing 4.8% 8.0% 6.3%
Your boss owe you now for your work in the last 12 months
Yes 3.7% 1.6% 2.8%
How much? $2,162 $512 $1,832
No 91.7% 90.0% 90.9%
Interview Missing 4.5% 8.3% 6.3%
You had injury in the last 12 months
Yes 5.9% 7.1% 6.4%
No 90.9% 86.2% 88.7%
Interview Missing 3.3% 6.7% 4.9%
You had to leave your job due to an injury in the last 12 months
Yes 2.2% 3.3% 2.7%
No 92.2% 88.4% 90.4%
Interview Missing 5.6% 8.3% 6.9%
Thus, although TPS has had positive effects, particularly on its beneficiaries’ ability to
secure employment and better paying jobs, it should be noted that TPS holders remain
susceptible to worker exploitation. Temporary statuses are sometimes little understood, in
government offices as well as in the workplace; often employers mistakenly understand TPS to
be undocumented status because beneficiaries cannot show a green card. As such, some
employers assume that it is a status incompatible with workers’ rights even though all workers
have rights. Thus, misunderstandings about a temporary legal status may leave TPS workers
vulnerable to mistreatment in the workplace. In this survey, about 7% of TPS holders mentioned
that their boss did not pay them on time in the 12 months prior to the survey, and almost 11%
indicated that their boss paid them less than what they were supposed to be paid. About 6.4%
described having an injury at work, and fewer than 3% described having to leave their job due to
an injury in the 12 months prior to the survey. Finally about 2.8% of the respondents described
that their boss owed them wages. Workplace violations that we identified among TPS
respondents are similar those that undocumented immigrants have been found to experience (see

Temporary Protected Status
Center for Migration Research May, 2017
13
Hall and Greenman 2015). For instance, in a national study of workplace violations in several
occupations and economic sectors, Bernhardt et al. (2009) found that foreign-born Latino
workers had the highest minimum wage violation rates of any racial or ethnic group.
4. Taxes & Contributions
Table 9. Taxes and Contributions Men Women Total
N 1,126 972 2,098
Pay Social Security
Among the employed Yes 80.9% 79.4% 80.3%
No 14.0% 16.2% 14.9%
Interview Missing 5.1% 4.4% 4.8%
Among the self-employed Yes 82.1% 73.7% 79.3%
No 7.9% 6.6% 7.5%
Interview Missing 9.9% 19.7% 13.2%
Years of paying Social Security 15.8 14.9 15.4
Pay Income Tax
2015
Yes 95.1% 89.9% 92.7%
No 3.6% 7.7% 5.5%
Interview Missing 1.2% 2.4% 1.8%
2014
Yes 93.7% 87.7% 90.9%
No 3.3% 6.8% 4.9%
Interview Missing 3.0% 5.6% 4.2%
2013
Yes 94.4% 87.9% 91.4%
No 2.6% 6.8% 4.5%
Interview Missing 3.0% 5.3% 4.1%
The overwhelming majority of TPS holders, 80.3%, pay income
taxes, including 79.3% of those who are self-employed. And TPS
holders have contributed to social security for an average of 15.4
years, making contributions since they obtained TPS status. And
90% of TPS holders reported having filed income taxes every year in
the three years prior to the survey. The ability to pay taxes and make
more contributions to the nation’s coffers that a more stable legal
status affords translates into contributions to the economy. It also
represents a social investment that TPS holders are able to make as
they become more socioeconomically integrated in society.
80.3% of TPS holders pay income taxes, including
79.3% of those who are self-employed.
90% file taxes every year.
TPS holders have contributed to social security for an avg. of
15.4 years.
Temporary Protected Status
Center for Migration Research May, 2017
14
5. Health Insurance
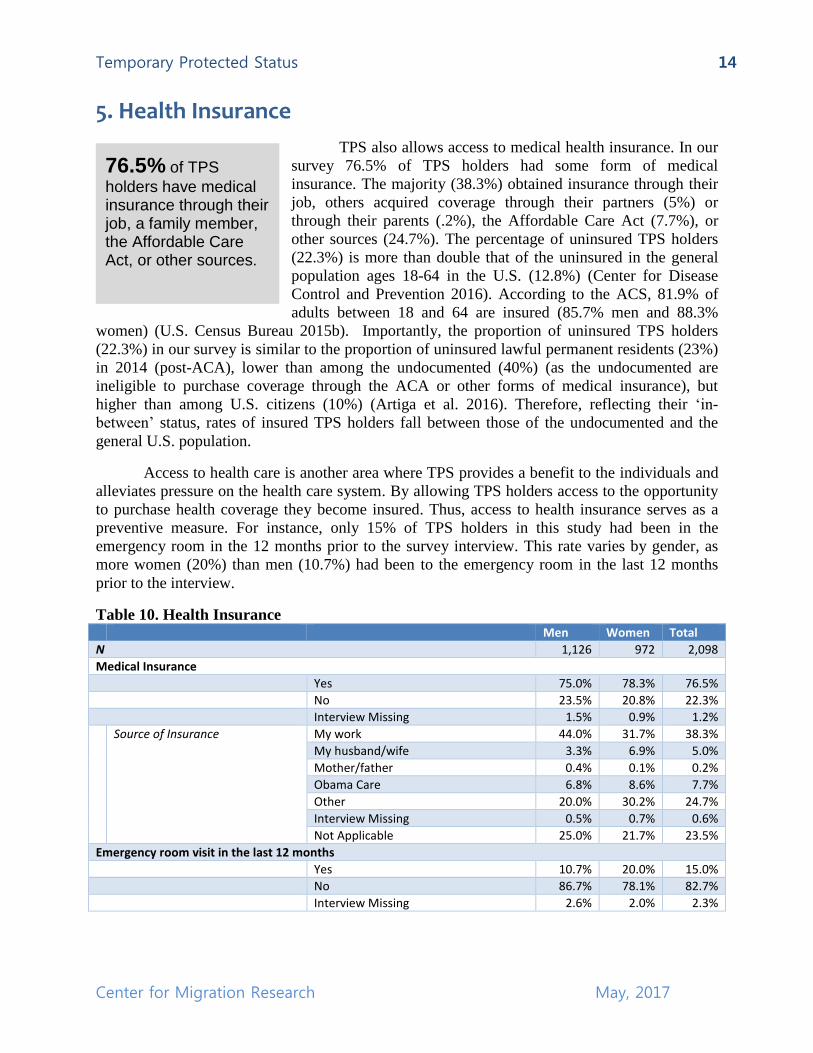
TPS also allows access to medical health insurance. In our
survey 76.5% of TPS holders had some form of medical
insurance. The majority (38.3%) obtained insurance through their
job, others acquired coverage through their partners (5%) or
through their parents (.2%), the Affordable Care Act (7.7%), or
other sources (24.7%). The percentage of uninsured TPS holders
(22.3%) is more than double that of the uninsured in the general
population ages 18-64 in the U.S. (12.8%) (Center for Disease
Control and Prevention 2016). According to the ACS, 81.9% of
adults between 18 and 64 are insured (85.7% men and 88.3%
women) (U.S. Census Bureau 2015b). Importantly, the proportion of uninsured TPS holders
(22.3%) in our survey is similar to the proportion of uninsured lawful permanent residents (23%)
in 2014 (post-ACA), lower than among the undocumented (40%) (as the undocumented are
ineligible to purchase coverage through the ACA or other forms of medical insurance), but
higher than among U.S. citizens (10%) (Artiga et al. 2016). Therefore, reflecting their ‘in-
between’ status, rates of insured TPS holders fall between those of the undocumented and the
general U.S. population.
Access to health care is another area where TPS provides a benefit to the individuals and
alleviates pressure on the health care system. By allowing TPS holders access to the opportunity
to purchase health coverage they become insured. Thus, access to health insurance serves as a
preventive measure. For instance, only 15% of TPS holders in this study had been in the
emergency room in the 12 months prior to the survey interview. This rate varies by gender, as
more women (20%) than men (10.7%) had been to the emergency room in the last 12 months
prior to the interview.
Table 10. Health Insurance Men Women Total
N 1,126 972 2,098
Medical Insurance
Yes 75.0% 78.3% 76.5%
No 23.5% 20.8% 22.3%
Interview Missing 1.5% 0.9% 1.2%
Source of Insurance
My work 44.0% 31.7% 38.3%
My husband/wife 3.3% 6.9% 5.0%
Mother/father 0.4% 0.1% 0.2%
Obama Care 6.8% 8.6% 7.7%
Other 20.0% 30.2% 24.7%
Interview Missing 0.5% 0.7% 0.6%
Not Applicable 25.0% 21.7% 23.5%
Emergency room visit in the last 12 months
Yes 10.7% 20.0% 15.0%
No 86.7% 78.1% 82.7%
Interview Missing 2.6% 2.0% 2.3%
76.5% of TPS
holders have medical insurance through their job, a family member, the Affordable Care Act, or other sources.

Temporary Protected Status
Center for Migration Research May, 2017
15
6. Community Settlement and Involvement
An important indicator of immigrant settlement in the country is homeownership.
Homeownership is a marker of economic mobility and incorporation; it
also signals social embeddedness, membership, and a commitment to the
neighborhood, city and country, as homeowners are considered to be
connected members of their communities (Castillo 2014).
Homeownership conveys the will to create a permanent group and stable
social relations (Bourdieu 2005). And as Castillo (2014) observes,
homeownership is deeply rooted in American culture, and for
immigrants it may create better opportunities for themselves and their
families. For TPS holders then homeownership is an economic indicator but also a sign of
belonging and membership. Almost 32% of TPS holders in our survey own their home, which is
half of the proportion of homeowners in the general U.S. population (64%) and slightly less than
Hispanic homeowners (38%) (Lopez 2015). Furthermore, research has shown that undocumented
immigrants are less likely to own a home (McConnell 2015) than documented immigrants (Hall
and Greenman 2013). Given that TPS is a temporary status, therefore, the fact that one third of
TPS holders own a home means that this group seeks to be part of U.S. society and to be active
members of their communities.
Table 11. Homeownership Men Women Total
N 1,126 972 2,098
Home Ownership
Yes 33.6% 29.9% 31.9%
No 63.8% 68.4% 65.9%
Interview Missing 2.7% 1.6% 2.2%
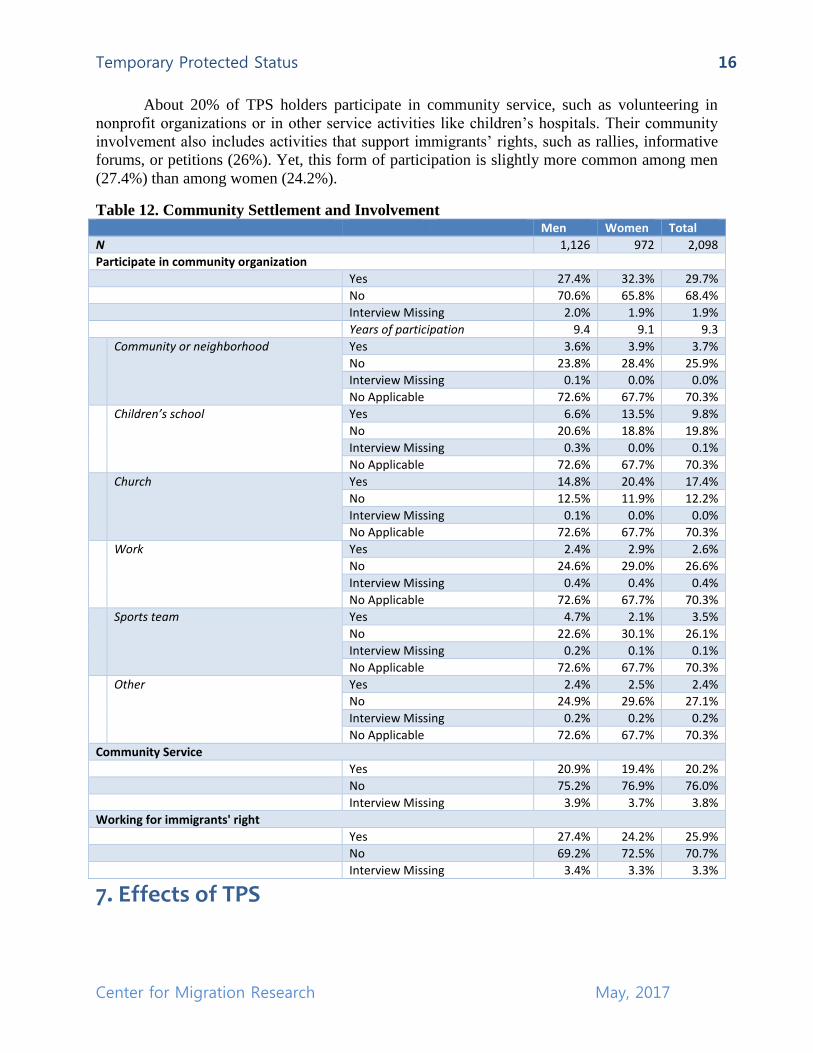
They also pay property taxes and contribute in other ways that come with owning a
home. Thus, it is not a coincidence that about 30% of TPS holders are actively involved in their
communities, through neighborhood organizations (3.7%), their children’s schools (9.8%),
church (17.4%), work organizations or events (2.6%), sports teams (3.5%), or other activities
(2.4%). Community involvement is more common among women (32.3%) than among men
(27.4%), especially in children’s schools or church. Indeed, the community involvement of TPS
holders as a whole is slightly higher than that of the general U.S. population. According to a
2016 Bureau of Labor Statistics report, 24.9% of the U.S. population reported volunteering for
an organization, and U.S. women volunteer at a higher rate than men, with 27.8% of women
stating that they volunteer compared with 21.8% among men (U.S. Department of Labor 2016).
31.9% of
TPS holders own their
home.
30% of TPS holders are civically active in
neighborhood and work associations, schools, sports teams, or other activities.
Temporary Protected Status
Center for Migration Research May, 2017
16
About 20% of TPS holders participate in community service, such as volunteering in
nonprofit organizations or in other service activities like children’s hospitals. Their community
involvement also includes activities that support immigrants’ rights, such as rallies, informative
forums, or petitions (26%). Yet, this form of participation is slightly more common among men
(27.4%) than among women (24.2%).
Table 12. Community Settlement and Involvement Men Women Total
N 1,126 972 2,098
Participate in community organization
Yes 27.4% 32.3% 29.7%
No 70.6% 65.8% 68.4%
Interview Missing 2.0% 1.9% 1.9%
Years of participation 9.4 9.1 9.3
Community or neighborhood Yes 3.6% 3.9% 3.7%
No 23.8% 28.4% 25.9%
Interview Missing 0.1% 0.0% 0.0%
No Applicable 72.6% 67.7% 70.3%
Children’s school Yes 6.6% 13.5% 9.8%
No 20.6% 18.8% 19.8%
Interview Missing 0.3% 0.0% 0.1%
No Applicable 72.6% 67.7% 70.3%
Church Yes 14.8% 20.4% 17.4%
No 12.5% 11.9% 12.2%
Interview Missing 0.1% 0.0% 0.0%
No Applicable 72.6% 67.7% 70.3%
Work Yes 2.4% 2.9% 2.6%
No 24.6% 29.0% 26.6%
Interview Missing 0.4% 0.4% 0.4%
No Applicable 72.6% 67.7% 70.3%
Sports team Yes 4.7% 2.1% 3.5%
No 22.6% 30.1% 26.1%
Interview Missing 0.2% 0.1% 0.1%
No Applicable 72.6% 67.7% 70.3%
Other Yes 2.4% 2.5% 2.4%
No 24.9% 29.6% 27.1%
Interview Missing 0.2% 0.2% 0.2%
No Applicable 72.6% 67.7% 70.3%
Community Service
Yes 20.9% 19.4% 20.2%
No 75.2% 76.9% 76.0%
Interview Missing 3.9% 3.7% 3.8%
Working for immigrants' right
Yes 27.4% 24.2% 25.9%
No 69.2% 72.5% 70.7%
Interview Missing 3.4% 3.3% 3.3%
7. Effects of TPS

Temporary Protected Status
Center for Migration Research May, 2017
17
In general, TPS has brought significant benefits to the TPS holders. Compared to the
undocumented population, TPS has meant an increase in quality of life, higher incomes, better
jobs, and higher rates of homeownership, among other indicators of integration and well-being.
This has translated into benefits for families and communities and society as a whole; as it has
allowed TPS holders to actively contribute to society economically, socially, and culturally. It
also allows TPS holders to pay for their own medical insurance and to increase their tax
contributions through homeownership, formal employment, and entrepreneurial activities. Thus,
one of the most significant benefits of TPS is obtaining a work permit albeit for 18 months at a
time. Therefore, benefits go beyond the economic gains of better employment and higher pay.
TPS allows its beneficiaries to progress toward worker rights and protections, an important
benefit that impacts all workers who labor alongside TPS holders, regardless of legal status or
citizenship status. For instance, after obtaining TPS, 56.7% of survey participants were able to
get a new job, and over half of those job changes involved getting a better job. And
approximately 78% of TPS holders described better job opportunities as a direct benefit of TPS,
with more men (81.6%) than women (73.8%) stating that their job opportunities improved after
obtaining TPS. And about 12% of TPS holders were able to start their own business, with men
reporting a higher rate of business ownership (14.2%) than women (9.6%).
Table 13. Effects of TPS Men Women Total
N 1,126 972 2,098
Years of TPS 15.4 15.3 15.3
Change a job after TPS
Yes 60.7% 52.1% 56.7%
No 37.8% 44.8% 41.0%
Interview Missing 1.4% 3.2% 2.2%
Got a better job
Yes 58.5% 48.8% 54.0%
No 2.2% 3.0% 2.6%
Interview Missing 0.00% 0.3% 0.1%
Not Applicable 39.2% 48.0% 43.3%
Benefit from TPS
Better job opportunities 81.6% 73.8% 78.0%
Better pay 52.3% 41.6% 47.3%
Opportunity to open my own business 14.2% 9.6% 12.1%
Less fear and worry for me 47.0% 46.8% 46.9%
Less fear and worry for my family 34.0% 37.4% 35.6%
More security for me 67.5% 67.0% 67.3%
More security for my family 38.0% 37.0% 37.6%
Easier to use medical services 21.7% 21.7% 21.7%
Being able to travel and visit my family 27.3% 21.7% 24.7%
Driver’s license 18.3% 15.6% 17.1%
Other 26.6% 27.0% 26.8%
Another critical benefit of TPS is relief from deportation, which translates into lower
levels of anxiety and fear deportation. Research has shown that this fear can affect individuals
and their families in multiple ways, including their physical and mental health (Aranda et al.
2014; Brabeck et al. 2015; Capps et al. 2015; De Genova 2002; Dreby 2015; Gonzales and

Temporary Protected Status
Center for Migration Research May, 2017
18
Chavez 2012; Menjívar and Abrego 2012; Yoshikawa, Suárez-Orozco, and Gonzales 2016). As
such, our survey participants noted that TPS has helped decrease their fears and worries related
to deportation for themselves (46.9%) and their family members (35.6%), which leads to a sense
of certain stability in these families, in spite of the insecurity that comes from the renewals
required to maintain this status. And approximately 67.5% of TPS holders stated that TPS has
provided them with security for themselves or their families (37.6%).
Finally, survey participants noted that TPS has allowed them to obtain driver’s licenses,
which translates into a benefit for themselves, their families, and society in general. For instance,
they are able to purchase car insurance, to drive without fear and safely, to have more freedom of
movement to get to jobs that pay better or to attend their children’s school or extracurricular
activities, and to drive for a living as many TPS holders do on a daily basis.
Final Considerations and Recommendations
TPS has been critical and significantly beneficial for those who hold this status. As this
report has shown, this legal status has elevated the quality of life of its recipients, and through
these improvements, TPS also has had positive effects on these immigrants’ family members, co-
workers, neighbors, and coreligionists. In this report we have demonstrated, through contrasts
with comparable groups such as undocumented immigrants, authorized residents, and the general
U.S. population, the benefits that accrue to this legal status.
The comparisons we have made to immigrants in other legal statuses as well as to the
U.S. population as a whole also highlight two fundamental aspects of his status: in-between and
temporary. Thus, TPS holders’ in-between legal status is reflected in their in-between conditions,
as they generally do better than undocumented immigrants on the various indicators discussed in
this report but not as well as those immigrants who are authorized or naturalized, or the U.S.
population in general. As such, TPS represents a step in the right direction. It positions its
beneficiaries in a favorable starting position in the process of integration, but this process is
truncated as these immigrants quickly encounter a legal ceiling that precludes them from
advancing further. For instance, in further analyses conducted based on data collected for this
survey, a critical bifurcation was identified: TPS holders with higher levels of education do not
earn commensurate earnings to their educational level; their earnings are similar to those of TPS
holders with lower levels of education, other things being equal. In spite of this mismatch
between education and earnings, TPS holders participate actively in civic society, which
increases with time in the United States (Oh, Menjívar, Alvord and Agadjanian n.d.). Thus, TPS
holders are de facto citizens and active members of their communities but lack full de jure
recognition.
This legal ambiguity has repercussions for the individuals with TPS but also for their
families and communities. Although TPS has allowed individual holders to acquire a measure of
economic advancement and to gain partial formal integration, it does not allow for the
integration of their families as TPS holders are prohibited from petitioning for family members.
And although TPS has lessened the constant fear of deportation for its beneficiaries, this fear has
not fully disappeared. Indeed, it has resurfaced with force in recent weeks with news reports of
an expansion of detention and deportation of immigrants holding temporary statutes, such as
DACA, and thus thought to have more secure statuses.

Temporary Protected Status
Center for Migration Research May, 2017
19
TPS also brings a measure of equity as individuals on this status are closer to feeling
more equal to others—in owning a home or renting, when getting paid on time for a day of work,
when seeking employment, when driving their kids to school—in general, when doing the
routine activities of others who know their rights. Thus, the benefits go beyond the individual.
TPS holders have already fulfilled many of the requirements for legal permanent
residence—the overwhelming majority holds at least one job; they pay taxes and purchase their
own insurance; they have clean criminal records (these checks are required with every renewal);
and have demonstrated that they have the will to belong and become full members of society
through homeownership and raising children in the United States. Many also have continued to
advance educationally. Thus, whereas TPS grants temporary relief, it is not ideal to live in
uncertain legality for 15 years (but often longer), especially when those in this status are already
de facto members of society. This report has demonstrated the benefits that can ensue from
legality, even temporary; it also has shown that moving these immigrants to permanent legal
residence would be even more beneficial for the immigrants, their families, and for U.S. society
in general.

Temporary Protected Status
Center for Migration Research May, 2017
20
References
Abrego, Leisy J. and Sarah M. Lakhani. 2015. “Incomplete Inclusion: Legal Violence and
Immigrants in Liminal Legal Statuses.” Law & Policy 37(4):265–93.
Aranda, Elizabeth, Cecilia Menjívar, and Katharine M. Donato. 2014. “The Spillover
Consequences of an Enforcement-First U.S. Immigration Regime.” American Behavioral
Scientist 58(13):1687–95.
Argueta, Carla N. and Ruth Ellen Wasem. 2016. Temporary Protected Status: Current
Immigration Policy and Issues. Washington, DC: Congressional Research Service.
Retrieved March 10, 2017 (https://fas.org/sgp/crs/homesec/RS20844.pdf).
Artiga, Samantha, Anthony Damico, Katherine Young, Elizabeth Cornachione, and Rachel
Garfield. 2016. Health Coverage and Care for Immigrants. The Kaiser Commission on
Mexicaid and the Uninsured. Retrieved May 16, 2017
(http://files.kff.org/attachment/issue-brief-health-coverage-and-care-for-immigrants).
Bergeron, Claire. 2014. “Temporary Protected Status after 25 Years: Addressing the Challenge
of Long-Term ‘Temporary’ Residents and Strengthening a Centerpiece of US
Humanitarian Protection.” Journal of Migration and Human Security 2(1):22–43.
Brabeck, Kalina, Erin Silbey, Patricia Taubin, and Angela Murcia. 2015. “The Influence of
Immigrant Parent Legal Status on U.S.-Born Children’s Academic Abilities: The
Moderating Effects of Social Service Use.” Applied Developmental Science 1–13.
Brabeck, Kalina and Qingwen Xu. 2010. “The Impact of Detention and Deportation on Latino
Immigrant Children and Families: A Quantitative Exploration.” Hispanic Journal of
Behavioral Sciences 32(3):341–61.
Buerau of Labor Statistics. 2017. Labor Force Statistics from the Current Population Survey.
Washington, DC. Retrieved March 9, 2017
(https://data.bls.gov/timeseries/LNS11300000).
Capps, Randy et al. 2015. Implications of Immigrant Enforcement Activities for the Well-Being
of Children in Immigrant Families. Washington, DC: Migration Policy Institute.
Retrieved March 14, 2017 (http://www.migrationpolicy.org/research/implications-
immigration-enforcement-activities-well-being-children-immigrant-families).
Castillo, Esther. 2014. “Keys to Achieving the American Dream among Mexican Immigrants:
The Roles of Homeownership, Naturalization, and Racial Identity.” University of
California Irvine, Irvine, CA. Retrieved March 9, 2017
(http://escholarship.org/uc/item/5t07506b).
Cebulko, Kara B. 2014. “Documented, Undocumented, and Liminally Legal: Legal Status
During the Transition to Adulthood for 1.5- Generation Brazilian Immigrants.” The
Sociological Quarterly 55(1):143–67.

Temporary Protected Status
Center for Migration Research May, 2017
21
Center for Disease Control and Prevention. 2016. Health Insurance Coverage. Washington, DC.
Retrieved December 20, 2016 (https://www.cdc.gov/nchs/fastats/health-insurance.htm).
Chishti, Muzaffar and Stephen Yale-Loehr. 2016. The Immigration Act of 1990: Unfinished
Business a Quarter-Century Later. Washington, DC: Migration Policy Institute.
Retrieved March 9, 2017 (www.migrationpolicy.org/sites/default/files/publications/1990-
Act_2016_FINAL.pdf).
De Genova, Nicholas. 2002. “Migrant ‘Illegality’ and Deportability in Everyday Life.” Annual
Review of Anthropology 31(1):419–47.
Dreby, Joanna. 2012. “The Burden of Deportation on Children in Mexican Immigrant Families.”
Journal of Marriage and Family 74(4):829–45.
Dreby, Joanna. 2015. Everyday Illegal: When Policies Undermine Immigrant Families.
Berkeley, CA: University of California Press.
Fitzpatrick, Joan. 2000. “Temporary Protection of Refugees: Elements of a Formalized Regime.”
The American Journal of International Law 94(2):279–306.
Golay, Yann. 2001. “How Temporary Is Temporary Protection? La Protection Temporaire" Un
Provisoire Appele a Durer?” Refugee Survey Quarterly 20(2):141–52.
Gonzales, Roberto. 2016. Lives in Limbo: Undocumented and Coming of Age in America.
Berkeley, CA: University of California Press.
Gonzales, Roberto and Leo R. Chavez. 2012. “Awakening to a Nightmare:” Abjectivity and
Illegality in the Lives of Undocumented 1.5-Generation Latino Immigrants in the United
States.” Current Anthropology 53(3):255–81.
Hagan, Jacqueline, Brianna Castro, and Nestor Rodriguez. 2010. “The Effects of U.S.
Deportation Policies on Immigrant Families and Communities: Cross-Border
Perspectives.” North Carolina Law Review 88:1800–1824.
Hasselberg, Ines. 2016. Enduring Uncertainty: Deportation, Punishment and Everyday Life.
New York, NY: Berghahn Books.
Immigration Council. 2014. Unauthorized Immigrants Today: A Demographic Profile.
Washington, DC. Retrieved January 23, 2017
(https://www.americanimmigrationcouncil.org/sites/default/files/research/profile_of_the_
unauthorized_ii_final_1_0.pdf).
Kerwin, Donald M. 2014. “Creating a More Responsive and Seamless Refugee Protection
System: The Scope, Promise and Limitations of US Temporary Protection Programs.”
Journal of Migration and Human Security 2(1):44–72.
Lopez, Gustavo. 2015. Hispanics of Salvadoran Origin in the United States, 2013. Washington,
DC: Pew Research Center. Retrieved March 9, 2017

Temporary Protected Status
Center for Migration Research May, 2017
22
(http://www.pewhispanic.org/2015/09/15/hispanics-of-salvadoran-origin-in-the-united-
states-2013/).
Magaña-Salgado, Jose. 2016. Relief Not RAids: Temporary Protected Status for El Salvador,
Guatemala and Honduras. Washington, DC: Immigrant Legal Resource Center.
Retrieved May 16, 2017 (https://www.ilrc.org/sites/default/files/resources/01-13-
2016_relief_not_raids_-_immigrant_legal_resource_center.pdf).
Menjívar, Cecilia. 2000. Fragmented Ties: Salvadorian Immigrant Networks in America.
Berkeley, CA: University of California Press.
Menjívar, Cecilia. 2006. “Liminal Legality: Salvadoran and Guatemalan Immigrants’ Lives in
the United States.” American Journal of Sociology 111(4):999–1037.
Menjívar, Cecilia and Leisy J. Abrego. 2012. “Legal Violence: Immigration Law and the Lives
of Central American Immigrants.” American Journal of Sociology 117(5):1380–1421.
Orrenius, Pia M. and Madeline Zavodny. 2015. “The Impact of Temporary Protected Status on
Immigrants’ Labor Market Outcomes.” American Economic Review 105(5):576–80.
Passel, Jeffrey S. and D’Vera Cohn. 2009. A Portrait of Unauthorized Immigrants in the United
States. Washington, DC: Pew Hispanic Center. Retrieved March 9, 2017
(http://www.pewhispanic.org/files/reports/107.pdf).
Passel, Jeffrey S. and D’Vera Cohn. 2016. Size of U.S. Unauthorized Immigrant Workforce
Stable After the Great Recession. Washington, DC: Pew Hispanic Center. Retrieved
March 14, 2017 (http://www.pewhispanic.org/2016/11/03/size-of-u-s-unauthorized-
immigrant-workforce-stable-after-the-great-recession/).
Segerblom, Eva. 2007. “Temporary Protected Status: An Immigration Statue That Redefines
Traditional Notions of Status and Temporariness.” Nevada Law Journal 7:664–85.
Seghetti, Lisa, Karma Ester, and Ruth Ellen Wasem. 2015. Temporary Protected Status: Current
Immigration Policy and Issues. Washington, DC: Congressional Research Service.
Retrieved December 14, 2016
(http://digitalcommons.ilr.cornell.edu/key_workplace/1461).
Taylor, Paul, Mark Hugo Lopez, and Seth Motel. 2011. Unauthorized Immigrants: Length of
Residency, Patterns of Parenthood. Washington, DC: Pew Hispanic Center. Retrieved
March 14, 2017 (http://www.pewhispanic.org/2011/12/01/unauthorized-immigrants-
length-of-residency-patterns-of-parenthood/).
United Nations High Commission for Refugees (UNHCR). 2014. Guidelines on Temporary
Protection or Stay Arrangements. Geneva, Switzerland. Retrieved March 14, 2017
(http://www.unhcr.org/5304b71c9.pdf).

Temporary Protected Status
Center for Migration Research May, 2017
23
United States Citizenship and Immigration Services. 2017. Temporary Protected Status.
Washington, DC. Retrieved March 20, 2017
(https://www.uscis.gov/humanitarian/temporary-protected-status).
Waters, Mary and Marisa Gernstein Pineau. 2016. The Integration of Immigrants into American
Society. Washington, DC: National Academies of Science, Engineering and Medicine.
Yoshikawa, Hirokazu, Carola Suárez-Orozco, and Roberto Gonzales. 2016. “Unauthorized
Status and Youth Development in the United States: Consensus Statement of the Society
for Research on Adolescence.” Journal of Research on Adolescence 1–16.