Embed Size (px)
Citation preview
.sciencedirect.com
f u n g a l e c o l o g y x x x ( 2 0 1 4 ) 1e8
available at www
ScienceDirect
journal homepage: www.elsevier .com/locate/ funeco
Temporal variation in fungal communitiesassociated with tropical hummingbirds andnectarivorous bats
Melinda BELISLEa,*, Chase D. MENDENHALLa,b, Federico OVIEDO BRENESc,Tadashi FUKAMIa,*aDepartment of Biology, Stanford University, Stanford, CA 94305, USAbCenter for Conservation Biology, Stanford University, Stanford, CA 94305, USAcOrganization for Tropical Studies, Las Cruces Biological Station, Apartado 78-8257, San Vito, Coto Brus, Costa Rica
a r t i c l e i n f o
Article history:
Received 2 December 2013
Revision received 30 January 2014
Accepted 11 February 2014
Available online -
Corresponding editor:
Nicole Hynson
Keywords:
Bats
Countryside biogeography
Hummingbirds
Nectar-inhabiting yeasts
* Corresponding authors. Department of Biolofax: þ1 650 723 6132.
E-mail addresses: belisle.melinda@gmail1754-5048/$ e see front matter ª 2014 Elsevhttp://dx.doi.org/10.1016/j.funeco.2014.02.007
Please cite this article in press as: Belislemingbirds and nectarivorous bats, Funga
a b s t r a c t
Species of yeasts and other microfungi carried by pollinators are of general ecological
interest because some of these microbial species can grow in floral nectar and affect
plantepollinator interactions. It is, however, not well understood how the composition of
fungal species found on pollinators varies over space or time. The spatial and temporal
distribution patterns in the microfungi found on the bills of hummingbirds and in the
mouths of nectarivorous bats was investigated along a gradient of deforestation within a
Costa Rican countryside landscape. The community composition of microfungi found on
hummingbirds’ bills and bats’ mouths underwent substantial compositional turnover over
a 2-month period and between 2 yr. In contrast, fungal community composition was not
significantly correlated with spatial distance, habitat type, species of hummingbirds, nor
the forest dependency of the hummingbirds sampled for microfungi. These findings sug-
gest that, in this landscape, fungal communities on a nectarivous vertebrate vector might
be influenced primarily by temporal factors such as plant and flower phenology rather than
spatial environmental heterogeneity.
ª 2014 Elsevier Ltd and The British Mycological Society. All rights reserved.
Introduction for growth (Vannette et al., 2013; Peay et al., 2012; Brysch-
Recent studies have shown that flower-visiting animals such
as bees, beetles, ants and hummingbirds vector multiple
species of microfungi from flower to flower as they forage for
floral nectar (Brysch-Herzberg, 2004; Herrera et al., 2008, 2010;
2013; Belisle et al., 2012; Vannette et al., 2013; De Vega and
Herrera, 2013). Once introduced into nectar, some of the
fungi utilize the sugars and amino acids present in the nectar
gy, Stanford University, 3
.com (M. Belisle), fukamitier Ltd and The British M
M, et al., Temporal varl Ecology (2014), http://d
Herzberg, 2004; Herrera et al., 2008). These microbes are of
general ecological interest because they have the potential to
alter plantepollinator interactions by changing the chemical
properties of nectar (Herrera et al., 2008; Peay et al., 2012 De
Vega and Herrera, 2013; Vannette et al., 2013) and, con-
sequently, the attractiveness of flowers to pollinators (Herrera
et al., 2013; Vannette et al., 2013). Recent research indicates
that the effects of nectar-inhabiting microbes on
71 Serra Mall, Stanford, CA 94305-5020, USA. Tel.: þ1 650 721 2404;
@stanford.edu (T. Fukami).ycological Society. All rights reserved.
iation in fungal communities associated with tropical hum-x.doi.org/10.1016/j.funeco.2014.02.007
2 M. Belisle et al.
plantepollinator interactions depend on the identity of
microbial species (Vannette et al., 2013; Good et al., 2014). If so,
to improve our understanding of the implications of microbes
in nectar, it is important to know how the community com-
position of fungi (and bacteria) found on pollinators may vary
over space and time. However, few data are currently avail-
able to address this question.
In this paper, we report a survey of the community com-
position of fungal species found on the bills of hummingbirds
and nectarivorous bats in Costa Rica. We hypothesized that
the fungal communities would: (1) vary in species composi-
tion through time and (2) vary in both abundance and species
composition through space across a gradient of deforestation
in the countryside landscape. Our analysis for testing these
hypotheses focused primarily on hummingbirds because we
had more extensive data on hummingbirds than on bats.
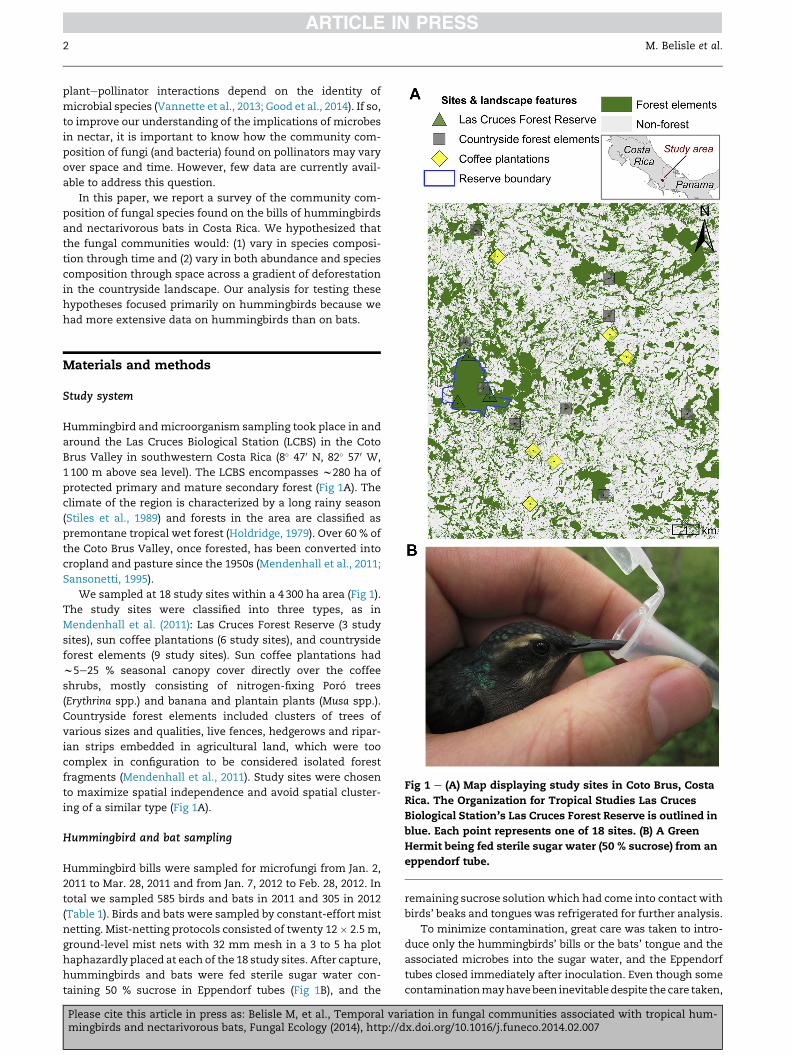
Fig 1 e (A) Map displaying study sites in Coto Brus, Costa
Rica. The Organization for Tropical Studies Las Cruces
Biological Station’s Las Cruces Forest Reserve is outlined in
blue. Each point represents one of 18 sites. (B) A Green
Hermit being fed sterile sugar water (50 % sucrose) from an
eppendorf tube.
Materials and methods
Study system
Hummingbird andmicroorganism sampling took place in and
around the Las Cruces Biological Station (LCBS) in the Coto
Brus Valley in southwestern Costa Rica (8� 470 N, 82� 570 W,
1100 m above sea level). The LCBS encompasses w280 ha of
protected primary and mature secondary forest (Fig 1A). The
climate of the region is characterized by a long rainy season
(Stiles et al., 1989) and forests in the area are classified as
premontane tropical wet forest (Holdridge, 1979). Over 60 % of
the Coto Brus Valley, once forested, has been converted into
cropland and pasture since the 1950s (Mendenhall et al., 2011;
Sansonetti, 1995).
We sampled at 18 study sites within a 4 300 ha area (Fig 1).
The study sites were classified into three types, as in
Mendenhall et al. (2011): Las Cruces Forest Reserve (3 study
sites), sun coffee plantations (6 study sites), and countryside
forest elements (9 study sites). Sun coffee plantations had
w5e25 % seasonal canopy cover directly over the coffee
shrubs, mostly consisting of nitrogen-fixing Por�o trees
(Erythrina spp.) and banana and plantain plants (Musa spp.).
Countryside forest elements included clusters of trees of
various sizes and qualities, live fences, hedgerows and ripar-
ian strips embedded in agricultural land, which were too
complex in configuration to be considered isolated forest
fragments (Mendenhall et al., 2011). Study sites were chosen
to maximize spatial independence and avoid spatial cluster-
ing of a similar type (Fig 1A).
Hummingbird and bat sampling
Hummingbird bills were sampled for microfungi from Jan. 2,
2011 to Mar. 28, 2011 and from Jan. 7, 2012 to Feb. 28, 2012. In
total we sampled 585 birds and bats in 2011 and 305 in 2012
(Table 1). Birds and bats were sampled by constant-effort mist
netting. Mist-netting protocols consisted of twenty 12� 2.5 m,
ground-level mist nets with 32 mm mesh in a 3 to 5 ha plot
haphazardly placed at each of the 18 study sites. After capture,
hummingbirds and bats were fed sterile sugar water con-
taining 50 % sucrose in Eppendorf tubes (Fig 1B), and the
Please cite this article in press as: Belisle M, et al., Temporal varmingbirds and nectarivorous bats, Fungal Ecology (2014), http://d
remaining sucrose solution which had come into contact with
birds’ beaks and tongues was refrigerated for further analysis.
To minimize contamination, great care was taken to intro-
duce only the hummingbirds’ bills or the bats’ tongue and the
associated microbes into the sugar water, and the Eppendorf
tubes closed immediately after inoculation. Even though some
contaminationmayhavebeen inevitabledespite thecare taken,
iation in fungal communities associated with tropical hum-x.doi.org/10.1016/j.funeco.2014.02.007
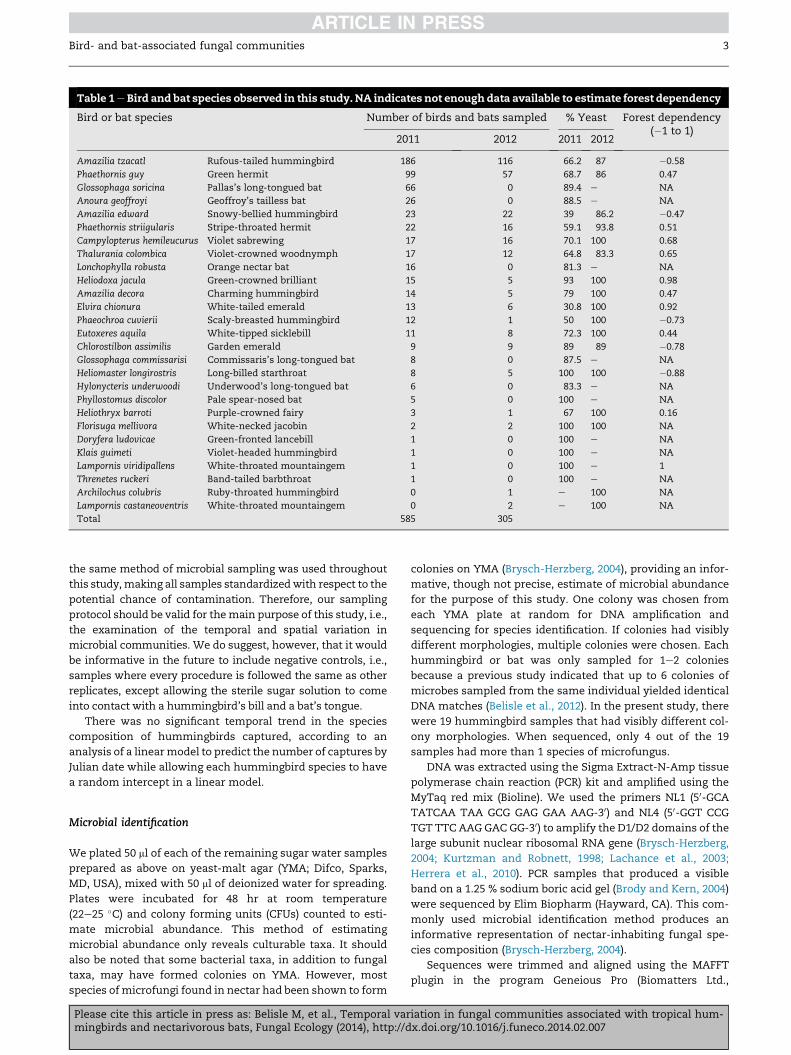
Table 1e Bird and bat species observed in this study. NA indicates not enoughdata available to estimate forest dependency
Bird or bat species Number of birds and bats sampled % Yeast Forest dependency(�1 to 1)
2011 2012 2011 2012
Amazilia tzacatl Rufous-tailed hummingbird 186 116 66.2 87 �0.58
Phaethornis guy Green hermit 99 57 68.7 86 0.47
Glossophaga soricina Pallas’s long-tongued bat 66 0 89.4 e NA
Anoura geoffroyi Geoffroy’s tailless bat 26 0 88.5 e NA
Amazilia edward Snowy-bellied hummingbird 23 22 39 86.2 �0.47
Phaethornis striigularis Stripe-throated hermit 22 16 59.1 93.8 0.51
Campylopterus hemileucurus Violet sabrewing 17 16 70.1 100 0.68
Thalurania colombica Violet-crowned woodnymph 17 12 64.8 83.3 0.65
Lonchophylla robusta Orange nectar bat 16 0 81.3 e NA
Heliodoxa jacula Green-crowned brilliant 15 5 93 100 0.98
Amazilia decora Charming hummingbird 14 5 79 100 0.47
Elvira chionura White-tailed emerald 13 6 30.8 100 0.92
Phaeochroa cuvierii Scaly-breasted hummingbird 12 1 50 100 �0.73
Eutoxeres aquila White-tipped sicklebill 11 8 72.3 100 0.44
Chlorostilbon assimilis Garden emerald 9 9 89 89 �0.78
Glossophaga commissarisi Commissaris’s long-tongued bat 8 0 87.5 e NA
Heliomaster longirostris Long-billed starthroat 8 5 100 100 �0.88
Hylonycteris underwoodi Underwood’s long-tongued bat 6 0 83.3 e NA
Phyllostomus discolor Pale spear-nosed bat 5 0 100 e NA
Heliothryx barroti Purple-crowned fairy 3 1 67 100 0.16
Florisuga mellivora White-necked jacobin 2 2 100 100 NA
Doryfera ludovicae Green-fronted lancebill 1 0 100 e NA
Klais guimeti Violet-headed hummingbird 1 0 100 e NA
Lampornis viridipallens White-throated mountaingem 1 0 100 e 1
Threnetes ruckeri Band-tailed barbthroat 1 0 100 e NA
Archilochus colubris Ruby-throated hummingbird 0 1 e 100 NA
Lampornis castaneoventris White-throated mountaingem 0 2 e 100 NA
Total 585 305
Bird- and bat-associated fungal communities 3
the same method of microbial sampling was used throughout
this study,making all samples standardizedwith respect to the
potential chance of contamination. Therefore, our sampling
protocol should be valid for themain purpose of this study, i.e.,
the examination of the temporal and spatial variation in
microbial communities. We do suggest, however, that it would
be informative in the future to include negative controls, i.e.,
samples where every procedure is followed the same as other
replicates, except allowing the sterile sugar solution to come
into contact with a hummingbird’s bill and a bat’s tongue.
There was no significant temporal trend in the species
composition of hummingbirds captured, according to an
analysis of a linearmodel to predict the number of captures by
Julian date while allowing each hummingbird species to have
a random intercept in a linear model.
Microbial identification
We plated 50 ml of each of the remaining sugar water samples
prepared as above on yeast-malt agar (YMA; Difco, Sparks,
MD, USA), mixed with 50 ml of deionized water for spreading.
Plates were incubated for 48 hr at room temperature
(22e25 �C) and colony forming units (CFUs) counted to esti-
mate microbial abundance. This method of estimating
microbial abundance only reveals culturable taxa. It should
also be noted that some bacterial taxa, in addition to fungal
taxa, may have formed colonies on YMA. However, most
species of microfungi found in nectar had been shown to form
Please cite this article in press as: Belisle M, et al., Temporal varmingbirds and nectarivorous bats, Fungal Ecology (2014), http://d
colonies on YMA (Brysch-Herzberg, 2004), providing an infor-
mative, though not precise, estimate of microbial abundance
for the purpose of this study. One colony was chosen from
each YMA plate at random for DNA amplification and
sequencing for species identification. If colonies had visibly
different morphologies, multiple colonies were chosen. Each
hummingbird or bat was only sampled for 1e2 colonies
because a previous study indicated that up to 6 colonies of
microbes sampled from the same individual yielded identical
DNA matches (Belisle et al., 2012). In the present study, there
were 19 hummingbird samples that had visibly different col-
ony morphologies. When sequenced, only 4 out of the 19
samples had more than 1 species of microfungus.
DNA was extracted using the Sigma Extract-N-Amp tissue
polymerase chain reaction (PCR) kit and amplified using the
MyTaq red mix (Bioline). We used the primers NL1 (50-GCATATCAA TAA GCG GAG GAA AAG-30) and NL4 (50-GGT CCG
TGT TTC AAG GAC GG-30) to amplify the D1/D2 domains of the
large subunit nuclear ribosomal RNA gene (Brysch-Herzberg,
2004; Kurtzman and Robnett, 1998; Lachance et al., 2003;
Herrera et al., 2010). PCR samples that produced a visible
band on a 1.25 % sodium boric acid gel (Brody and Kern, 2004)
were sequenced by Elim Biopharm (Hayward, CA). This com-
monly used microbial identification method produces an
informative representation of nectar-inhabiting fungal spe-
cies composition (Brysch-Herzberg, 2004).
Sequences were trimmed and aligned using the MAFFT
plugin in the program Geneious Pro (Biomatters Ltd.,
iation in fungal communities associated with tropical hum-x.doi.org/10.1016/j.funeco.2014.02.007
4 M. Belisle et al.
Auckland, New Zealand). Aligned sequences were grouped
into operational taxonomic units (OTUs) using a 98 %
sequence similarity cutoff (Kurtzman and Robnett, 1998). Use
of 99 % and 97 % sequence similarity cutoffs yielded virtually
identical results. The consensus sequence of each OTU was
input into the National Center for Biotechnology Information
GenBank, and species names assigned using Basic Local
Alignment Search Tool (BLAST) matches in combination with
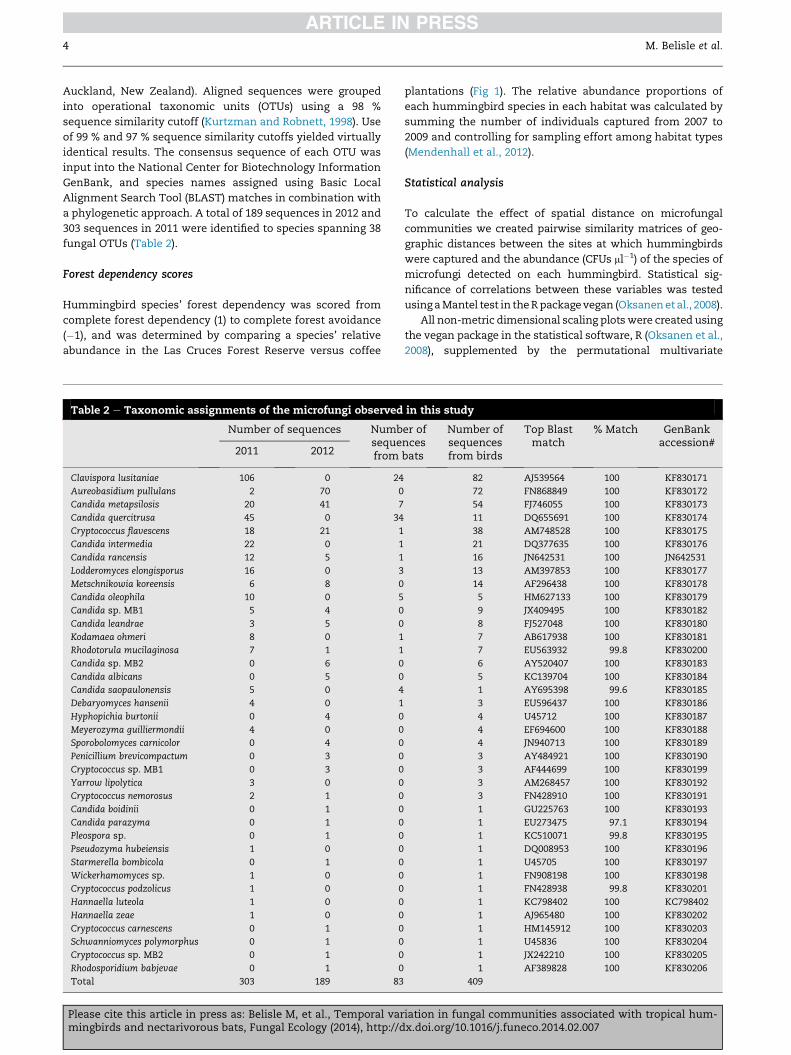
a phylogenetic approach. A total of 189 sequences in 2012 and
303 sequences in 2011 were identified to species spanning 38
fungal OTUs (Table 2).
Forest dependency scores
Hummingbird species’ forest dependency was scored from
complete forest dependency (1) to complete forest avoidance
(�1), and was determined by comparing a species’ relative
abundance in the Las Cruces Forest Reserve versus coffee
Table 2 e Taxonomic assignments of the microfungi observed
Number of sequences Numbsequefrom2011 2012
Clavispora lusitaniae 106 0 24
Aureobasidium pullulans 2 70 0
Candida metapsilosis 20 41 7
Candida quercitrusa 45 0 34
Cryptococcus flavescens 18 21 1
Candida intermedia 22 0 1
Candida rancensis 12 5 1
Lodderomyces elongisporus 16 0 3
Metschnikowia koreensis 6 8 0
Candida oleophila 10 0 5
Candida sp. MB1 5 4 0
Candida leandrae 3 5 0
Kodamaea ohmeri 8 0 1
Rhodotorula mucilaginosa 7 1 1
Candida sp. MB2 0 6 0
Candida albicans 0 5 0
Candida saopaulonensis 5 0 4
Debaryomyces hansenii 4 0 1
Hyphopichia burtonii 0 4 0
Meyerozyma guilliermondii 4 0 0
Sporobolomyces carnicolor 0 4 0
Penicillium brevicompactum 0 3 0
Cryptococcus sp. MB1 0 3 0
Yarrow lipolytica 3 0 0
Cryptococcus nemorosus 2 1 0
Candida boidinii 0 1 0
Candida parazyma 0 1 0
Pleospora sp. 0 1 0
Pseudozyma hubeiensis 1 0 0
Starmerella bombicola 0 1 0
Wickerhamomyces sp. 1 0 0
Cryptococcus podzolicus 1 0 0
Hannaella luteola 1 0 0
Hannaella zeae 1 0 0
Cryptococcus carnescens 0 1 0
Schwanniomyces polymorphus 0 1 0
Cryptococcus sp. MB2 0 1 0
Rhodosporidium babjevae 0 1 0
Total 303 189 83
Please cite this article in press as: Belisle M, et al., Temporal varmingbirds and nectarivorous bats, Fungal Ecology (2014), http://d
plantations (Fig 1). The relative abundance proportions of
each hummingbird species in each habitat was calculated by
summing the number of individuals captured from 2007 to
2009 and controlling for sampling effort among habitat types
(Mendenhall et al., 2012).
Statistical analysis
To calculate the effect of spatial distance on microfungal
communities we created pairwise similarity matrices of geo-
graphic distances between the sites at which hummingbirds
were captured and the abundance (CFUs ml�1) of the species of
microfungi detected on each hummingbird. Statistical sig-
nificance of correlations between these variables was tested
usingaMantel test in theRpackagevegan (Oksanenetal., 2008).
All non-metric dimensional scaling plots were created using
the vegan package in the statistical software, R (Oksanen et al.,
2008), supplemented by the permutational multivariate
in this study
er ofncesbats
Number ofsequencesfrom birds
Top Blastmatch
% Match GenBankaccession#
82 AJ539564 100 KF830171
72 FN868849 100 KF830172
54 FJ746055 100 KF830173
11 DQ655691 100 KF830174
38 AM748528 100 KF830175
21 DQ377635 100 KF830176
16 JN642531 100 JN642531
13 AM397853 100 KF830177
14 AF296438 100 KF830178
5 HM627133 100 KF830179
9 JX409495 100 KF830182
8 FJ527048 100 KF830180
7 AB617938 100 KF830181
7 EU563932 99.8 KF830200
6 AY520407 100 KF830183
5 KC139704 100 KF830184
1 AY695398 99.6 KF830185
3 EU596437 100 KF830186
4 U45712 100 KF830187
4 EF694600 100 KF830188
4 JN940713 100 KF830189
3 AY484921 100 KF830190
3 AF444699 100 KF830199
3 AM268457 100 KF830192
3 FN428910 100 KF830191
1 GU225763 100 KF830193
1 EU273475 97.1 KF830194
1 KC510071 99.8 KF830195
1 DQ008953 100 KF830196
1 U45705 100 KF830197
1 FN908198 100 KF830198
1 FN428938 99.8 KF830201
1 KC798402 100 KC798402
1 AJ965480 100 KF830202
1 HM145912 100 KF830203
1 U45836 100 KF830204
1 JX242210 100 KF830205
1 AF389828 100 KF830206
409
iation in fungal communities associated with tropical hum-x.doi.org/10.1016/j.funeco.2014.02.007
Bird- and bat-associated fungal communities 5
analysis of variance (PERMANOVA) on abundance-based
BrayeCurtis dissimilarity coefficients using the function ADO-
NIS in the vegan package (Oksanen et al., 2008). Microfungal
species were pooled by the hummingbird species on which
they were found to analyze the effects of time (Fig 2A and B)
and of hummingbird’s forest dependency (Fig 2B) on microbial
community composition. The variables used in the multi-
variate analyses were the composition of fungal OTUs, as
represented by the CFU ml�1 of each OTU observed, which were
each averaged across all samples for each hummingbird
NMDS 1
NM
DS
2
Year20112012
Forest dependancy
-0.5-1.0
0.0
0.5
1.0
A
B
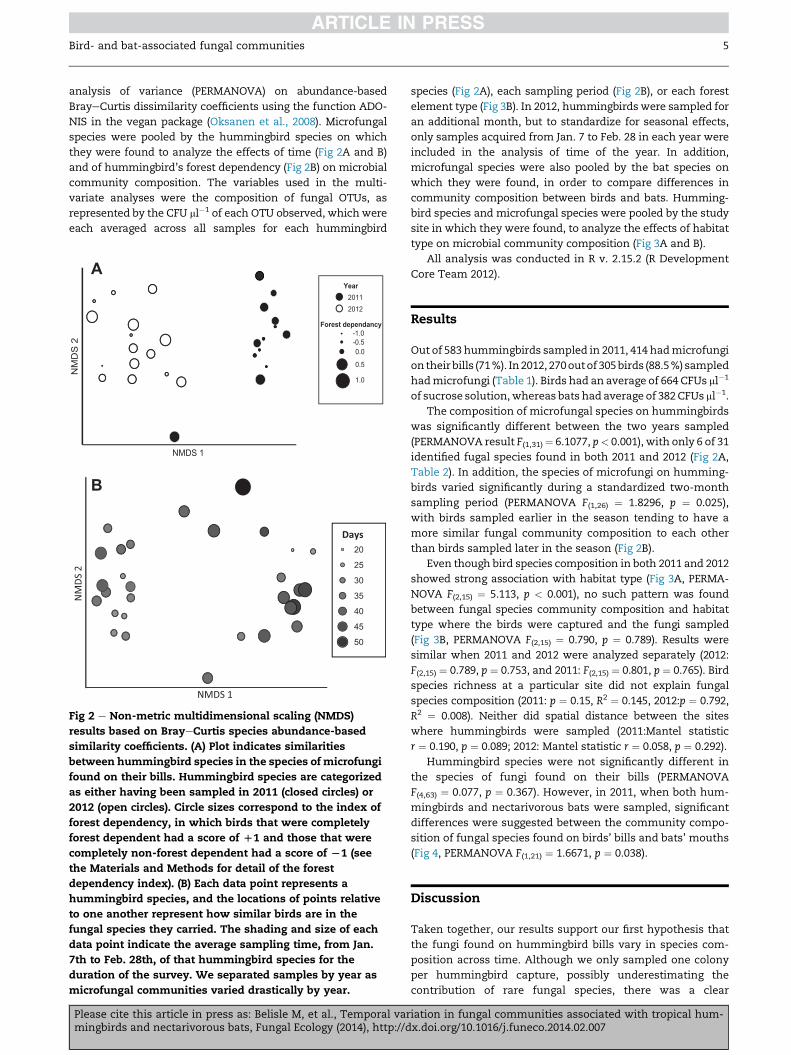
Fig 2 e Non-metric multidimensional scaling (NMDS)
results based on BrayeCurtis species abundance-based
similarity coefficients. (A) Plot indicates similarities
between hummingbird species in the species of microfungi
found on their bills. Hummingbird species are categorized
as either having been sampled in 2011 (closed circles) or
2012 (open circles). Circle sizes correspond to the index of
forest dependency, in which birds that were completely
forest dependent had a score of D1 and those that were
completely non-forest dependent had a score of L1 (see
the Materials and Methods for detail of the forest
dependency index). (B) Each data point represents a
hummingbird species, and the locations of points relative
to one another represent how similar birds are in the
fungal species they carried. The shading and size of each
data point indicate the average sampling time, from Jan.
7th to Feb. 28th, of that hummingbird species for the
duration of the survey. We separated samples by year as
microfungal communities varied drastically by year.
Please cite this article in press as: Belisle M, et al., Temporal varmingbirds and nectarivorous bats, Fungal Ecology (2014), http://d
species (Fig 2A), each sampling period (Fig 2B), or each forest
element type (Fig 3B). In 2012, hummingbirds were sampled for
an additional month, but to standardize for seasonal effects,
only samples acquired from Jan. 7 to Feb. 28 in each year were
included in the analysis of time of the year. In addition,
microfungal species were also pooled by the bat species on
which they were found, in order to compare differences in
community composition between birds and bats. Humming-
bird species and microfungal species were pooled by the study
site in which they were found, to analyze the effects of habitat
type on microbial community composition (Fig 3A and B).
All analysis was conducted in R v. 2.15.2 (R Development
Core Team 2012).
Results
Out of 583 hummingbirds sampled in 2011, 414 hadmicrofungi
on their bills (71%). In2012, 270outof 305birds (88.5%) sampled
hadmicrofungi (Table 1). Birds had an average of 664 CFUs ml�1
of sucrose solution,whereas bats had average of 382 CFUs ml�1.
The composition of microfungal species on hummingbirds
was significantly different between the two years sampled
(PERMANOVA result F(1,31)¼ 6.1077, p< 0.001), with only 6 of 31
identified fugal species found in both 2011 and 2012 (Fig 2A,
Table 2). In addition, the species of microfungi on humming-
birds varied significantly during a standardized two-month
sampling period (PERMANOVA F(1,26) ¼ 1.8296, p ¼ 0.025),
with birds sampled earlier in the season tending to have a
more similar fungal community composition to each other
than birds sampled later in the season (Fig 2B).
Even though bird species composition in both 2011 and 2012
showed strong association with habitat type (Fig 3A, PERMA-
NOVA F(2,15) ¼ 5.113, p < 0.001), no such pattern was found
between fungal species community composition and habitat
type where the birds were captured and the fungi sampled
(Fig 3B, PERMANOVA F(2,15) ¼ 0.790, p ¼ 0.789). Results were
similar when 2011 and 2012 were analyzed separately (2012:
F(2,15) ¼ 0.789, p ¼ 0.753, and 2011: F(2,15) ¼ 0.801, p ¼ 0.765). Bird
species richness at a particular site did not explain fungal
species composition (2011: p ¼ 0.15, R2 ¼ 0.145, 2012:p ¼ 0.792,
R2 ¼ 0.008). Neither did spatial distance between the sites
where hummingbirds were sampled (2011:Mantel statistic
r ¼ 0.190, p ¼ 0.089; 2012: Mantel statistic r ¼ 0.058, p ¼ 0.292).
Hummingbird species were not significantly different in
the species of fungi found on their bills (PERMANOVA
F(4,63) ¼ 0.077, p ¼ 0.367). However, in 2011, when both hum-
mingbirds and nectarivorous bats were sampled, significant
differences were suggested between the community compo-
sition of fungal species found on birds’ bills and bats’ mouths
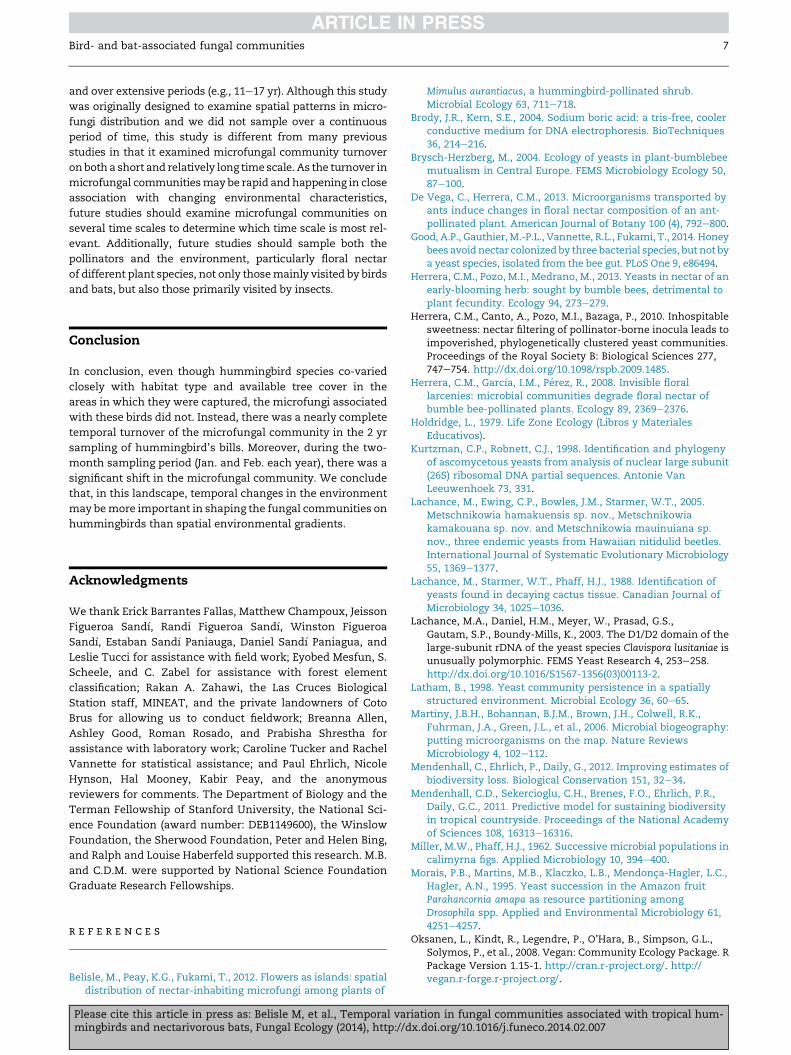
(Fig 4, PERMANOVA F(1,21) ¼ 1.6671, p ¼ 0.038).
Discussion
Taken together, our results support our first hypothesis that
the fungi found on hummingbird bills vary in species com-
position across time. Although we only sampled one colony
per hummingbird capture, possibly underestimating the
contribution of rare fungal species, there was a clear
iation in fungal communities associated with tropical hum-x.doi.org/10.1016/j.funeco.2014.02.007
A B
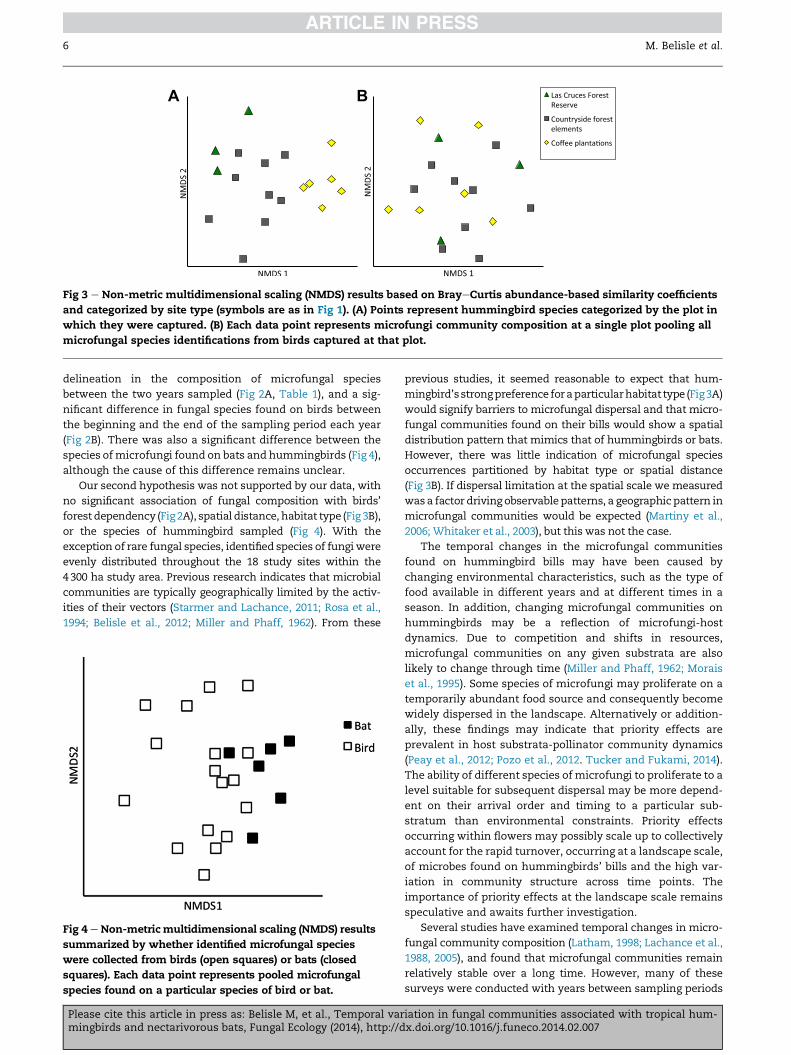
Fig 3 e Non-metric multidimensional scaling (NMDS) results based on BrayeCurtis abundance-based similarity coefficients
and categorized by site type (symbols are as in Fig 1). (A) Points represent hummingbird species categorized by the plot in
which they were captured. (B) Each data point represents microfungi community composition at a single plot pooling all
microfungal species identifications from birds captured at that plot.
6 M. Belisle et al.
delineation in the composition of microfungal species
between the two years sampled (Fig 2A, Table 1), and a sig-
nificant difference in fungal species found on birds between
the beginning and the end of the sampling period each year
(Fig 2B). There was also a significant difference between the
species ofmicrofungi found on bats and hummingbirds (Fig 4),
although the cause of this difference remains unclear.
Our second hypothesis was not supported by our data, with
no significant association of fungal composition with birds’
forest dependency (Fig2A), spatial distance, habitat type (Fig 3B),
or the species of hummingbird sampled (Fig 4). With the
exception of rare fungal species, identified species of fungiwere
evenly distributed throughout the 18 study sites within the
4300 ha study area. Previous research indicates that microbial
communities are typically geographically limited by the activ-
ities of their vectors (Starmer and Lachance, 2011; Rosa et al.,
1994; Belisle et al., 2012; Miller and Phaff, 1962). From these
Fig 4 e Non-metricmultidimensional scaling (NMDS) results
summarized by whether identified microfungal species
were collected from birds (open squares) or bats (closed
squares). Each data point represents pooled microfungal
species found on a particular species of bird or bat.
Please cite this article in press as: Belisle M, et al., Temporal varmingbirds and nectarivorous bats, Fungal Ecology (2014), http://d
previous studies, it seemed reasonable to expect that hum-
mingbird’sstrongpreference foraparticularhabitat type (Fig3A)
would signify barriers to microfungal dispersal and that micro-
fungal communities found on their bills would show a spatial
distribution pattern that mimics that of hummingbirds or bats.
However, there was little indication of microfungal species
occurrences partitioned by habitat type or spatial distance
(Fig 3B). If dispersal limitation at the spatial scale we measured
wasa factor driving observablepatterns, a geographic pattern in
microfungal communities would be expected (Martiny et al.,
2006; Whitaker et al., 2003), but this was not the case.
The temporal changes in the microfungal communities
found on hummingbird bills may have been caused by
changing environmental characteristics, such as the type of
food available in different years and at different times in a
season. In addition, changing microfungal communities on
hummingbirds may be a reflection of microfungi-host
dynamics. Due to competition and shifts in resources,
microfungal communities on any given substrata are also
likely to change through time (Miller and Phaff, 1962; Morais
et al., 1995). Some species of microfungi may proliferate on a
temporarily abundant food source and consequently become
widely dispersed in the landscape. Alternatively or addition-
ally, these findings may indicate that priority effects are
prevalent in host substrata-pollinator community dynamics
(Peay et al., 2012; Pozo et al., 2012. Tucker and Fukami, 2014).
The ability of different species of microfungi to proliferate to a
level suitable for subsequent dispersal may be more depend-
ent on their arrival order and timing to a particular sub-
stratum than environmental constraints. Priority effects
occurring within flowers may possibly scale up to collectively
account for the rapid turnover, occurring at a landscape scale,
of microbes found on hummingbirds’ bills and the high var-
iation in community structure across time points. The
importance of priority effects at the landscape scale remains
speculative and awaits further investigation.
Several studies have examined temporal changes in micro-
fungal community composition (Latham, 1998; Lachance et al.,
1988, 2005), and found that microfungal communities remain
relatively stable over a long time. However, many of these
surveys were conducted with years between sampling periods
iation in fungal communities associated with tropical hum-x.doi.org/10.1016/j.funeco.2014.02.007
Bird- and bat-associated fungal communities 7
and over extensive periods (e.g., 11e17 yr). Although this study
was originally designed to examine spatial patterns in micro-
fungi distribution and we did not sample over a continuous
period of time, this study is different from many previous
studies in that it examined microfungal community turnover
onboth a short and relatively long time scale. As the turnover in
microfungal communitiesmay be rapid and happening in close
association with changing environmental characteristics,
future studies should examine microfungal communities on
several time scales to determine which time scale is most rel-
evant. Additionally, future studies should sample both the
pollinators and the environment, particularly floral nectar
of different plant species, not only thosemainly visited by birds
and bats, but also those primarily visited by insects.
Conclusion
In conclusion, even though hummingbird species co-varied
closely with habitat type and available tree cover in the
areas in which they were captured, the microfungi associated
with these birds did not. Instead, there was a nearly complete
temporal turnover of the microfungal community in the 2 yr
sampling of hummingbird’s bills. Moreover, during the two-
month sampling period (Jan. and Feb. each year), there was a
significant shift in the microfungal community. We conclude
that, in this landscape, temporal changes in the environment
may bemore important in shaping the fungal communities on
hummingbirds than spatial environmental gradients.
Acknowledgments
We thank Erick Barrantes Fallas, Matthew Champoux, Jeisson
Figueroa Sand�ı, Randi Figueroa Sand�ı, Winston Figueroa
Sand�ı, Estaban Sand�ı Paniauga, Daniel Sand�ı Paniagua, and
Leslie Tucci for assistance with field work; Eyobed Mesfun, S.
Scheele, and C. Zabel for assistance with forest element
classification; Rakan A. Zahawi, the Las Cruces Biological
Station staff, MINEAT, and the private landowners of Coto
Brus for allowing us to conduct fieldwork; Breanna Allen,
Ashley Good, Roman Rosado, and Prabisha Shrestha for
assistance with laboratory work; Caroline Tucker and Rachel
Vannette for statistical assistance; and Paul Ehrlich, Nicole
Hynson, Hal Mooney, Kabir Peay, and the anonymous
reviewers for comments. The Department of Biology and the
Terman Fellowship of Stanford University, the National Sci-
ence Foundation (award number: DEB1149600), the Winslow
Foundation, the Sherwood Foundation, Peter and Helen Bing,
and Ralph and Louise Haberfeld supported this research. M.B.
and C.D.M. were supported by National Science Foundation
Graduate Research Fellowships.
r e f e r e n c e s
Belisle, M., Peay, K.G., Fukami, T., 2012. Flowers as islands: spatialdistribution of nectar-inhabiting microfungi among plants of
Please cite this article in press as: Belisle M, et al., Temporal varmingbirds and nectarivorous bats, Fungal Ecology (2014), http://d
Mimulus aurantiacus, a hummingbird-pollinated shrub.Microbial Ecology 63, 711e718.
Brody, J.R., Kern, S.E., 2004. Sodium boric acid: a tris-free, coolerconductive medium for DNA electrophoresis. BioTechniques36, 214e216.
Brysch-Herzberg, M., 2004. Ecology of yeasts in plant-bumblebeemutualism in Central Europe. FEMS Microbiology Ecology 50,87e100.
De Vega, C., Herrera, C.M., 2013. Microorganisms transported byants induce changes in floral nectar composition of an ant-pollinated plant. American Journal of Botany 100 (4), 792e800.
Good, A.P., Gauthier,M.-P.L., Vannette, R.L., Fukami, T., 2014. Honeybees avoid nectar colonized by three bacterial species, but not bya yeast species, isolated from the bee gut. PLoS One 9, e86494.
Herrera, C.M., Pozo, M.I., Medrano, M., 2013. Yeasts in nectar of anearly-blooming herb: sought by bumble bees, detrimental toplant fecundity. Ecology 94, 273e279.
Herrera, C.M., Canto, A., Pozo, M.I., Bazaga, P., 2010. Inhospitablesweetness: nectar filtering of pollinator-borne inocula leads toimpoverished, phylogenetically clustered yeast communities.Proceedings of the Royal Society B: Biological Sciences 277,747e754. http://dx.doi.org/10.1098/rspb.2009.1485.
Herrera, C.M., Garc�ıa, I.M., P�erez, R., 2008. Invisible florallarcenies: microbial communities degrade floral nectar ofbumble bee-pollinated plants. Ecology 89, 2369e2376.
Holdridge, L., 1979. Life Zone Ecology (Libros y MaterialesEducativos).
Kurtzman, C.P., Robnett, C.J., 1998. Identification and phylogenyof ascomycetous yeasts from analysis of nuclear large subunit(26S) ribosomal DNA partial sequences. Antonie VanLeeuwenhoek 73, 331.
Lachance, M., Ewing, C.P., Bowles, J.M., Starmer, W.T., 2005.Metschnikowia hamakuensis sp. nov., Metschnikowiakamakouana sp. nov. and Metschnikowia mauinuiana sp.nov., three endemic yeasts from Hawaiian nitidulid beetles.International Journal of Systematic Evolutionary Microbiology55, 1369e1377.
Lachance, M., Starmer, W.T., Phaff, H.J., 1988. Identification ofyeasts found in decaying cactus tissue. Canadian Journal ofMicrobiology 34, 1025e1036.
Lachance, M.A., Daniel, H.M., Meyer, W., Prasad, G.S.,Gautam, S.P., Boundy-Mills, K., 2003. The D1/D2 domain of thelarge-subunit rDNA of the yeast species Clavispora lusitaniae isunusually polymorphic. FEMS Yeast Research 4, 253e258.http://dx.doi.org/10.1016/S1567-1356(03)00113-2.
Latham, B., 1998. Yeast community persistence in a spatiallystructured environment. Microbial Ecology 36, 60e65.
Martiny, J.B.H., Bohannan, B.J.M., Brown, J.H., Colwell, R.K.,Fuhrman, J.A., Green, J.L., et al., 2006. Microbial biogeography:putting microorganisms on the map. Nature ReviewsMicrobiology 4, 102e112.
Mendenhall, C., Ehrlich, P., Daily, G., 2012. Improving estimates ofbiodiversity loss. Biological Conservation 151, 32e34.
Mendenhall, C.D., Sekercioglu, C.H., Brenes, F.O., Ehrlich, P.R.,Daily, G.C., 2011. Predictive model for sustaining biodiversityin tropical countryside. Proceedings of the National Academyof Sciences 108, 16313e16316.
Miller, M.W., Phaff, H.J., 1962. Successive microbial populations incalimyrna figs. Applied Microbiology 10, 394e400.
Morais, P.B., Martins, M.B., Klaczko, L.B., Mendonca-Hagler, L.C.,Hagler, A.N., 1995. Yeast succession in the Amazon fruitParahancornia amapa as resource partitioning amongDrosophila spp. Applied and Environmental Microbiology 61,4251e4257.
Oksanen, L., Kindt, R., Legendre, P., O’Hara, B., Simpson, G.L.,Solymos, P., et al., 2008. Vegan: Community Ecology Package. RPackage Version 1.15-1. http://cran.r-project.org/. http://vegan.r-forge.r-project.org/.
iation in fungal communities associated with tropical hum-x.doi.org/10.1016/j.funeco.2014.02.007
8 M. Belisle et al.
Peay, K.G., Belisle, M., Fukami, T., 2012. Phylogenetic relatednesspredicts priority effects in nectar yeast communities.Proceedings of the Royal Society B: Biological Sciences 279,749e758.
Pozo, M.I., Lachance, M., Herrera, C.M., 2012. Nectar yeasts of twosouthern Spanish plants: the roles of immigration andphysiological traits in community assembly. FEMSMicrobiology Ecology 80, 281e293. http://dx.doi.org/10.1111/j.1574-6941.2011.01286.x.
Rosa, C.A., Morais, P.B., Hagler, A.N., Mendonca-Hagler, L.C.,Monteiro, R.F., 1994.Yeast communitiesof the cactusPilosocereusarrabidae and associated insects in the Sandy Coastal Plains ofSoutheastern Brazil. Antonie Van Leeuwenhoek 65, 55e62.
Sansonetti, V., 1995. Quem�e Mis Naves En Estas Monta~nas: LaColonizaci�on De La Altiplanicie De Coto Brus y La Fundaci�onDe San Vito De Java. Jim�enez & Tanzi, San Jos�e.
Please cite this article in press as: Belisle M, et al., Temporal varmingbirds and nectarivorous bats, Fungal Ecology (2014), http://d
Starmer, W., Lachance, M., 2011. Yeast Ecology. The Yeasts: aTaxonomic Study, fifth ed. Elsevier, Waltham, MA, pp. 65e83.
Stiles, F.G., Skutch, A.F., Gardner, D., 1989. A Guide to the Birds ofCosta Rica. Christopher Helm.
Tucker, C.M., Fukami, T., 2014. Environmental variabilitycounteracts priority effects to facilitate species coexistence:evidence from nectar microbes. Proceedings of the RoyalSociety B: Biological Sciences 281, 20132637.
Vannette,R.L.,Gauthier,M.P.L., Fukami,T., 2013.Nectarbacteria,butnot yeast, weaken a plantepollinatormutualism. Proceedings ofthe Royal Society B: Biological Sciences 280, 20122601.
Whitaker, R.J., Grogan, D.W., Taylor, J.W., 2003. Geographicbarriers isolate endemic populations of hyperthermophilicarchaea. Science 301, 976e978.
iation in fungal communities associated with tropical hum-x.doi.org/10.1016/j.funeco.2014.02.007