Embed Size (px)
Citation preview
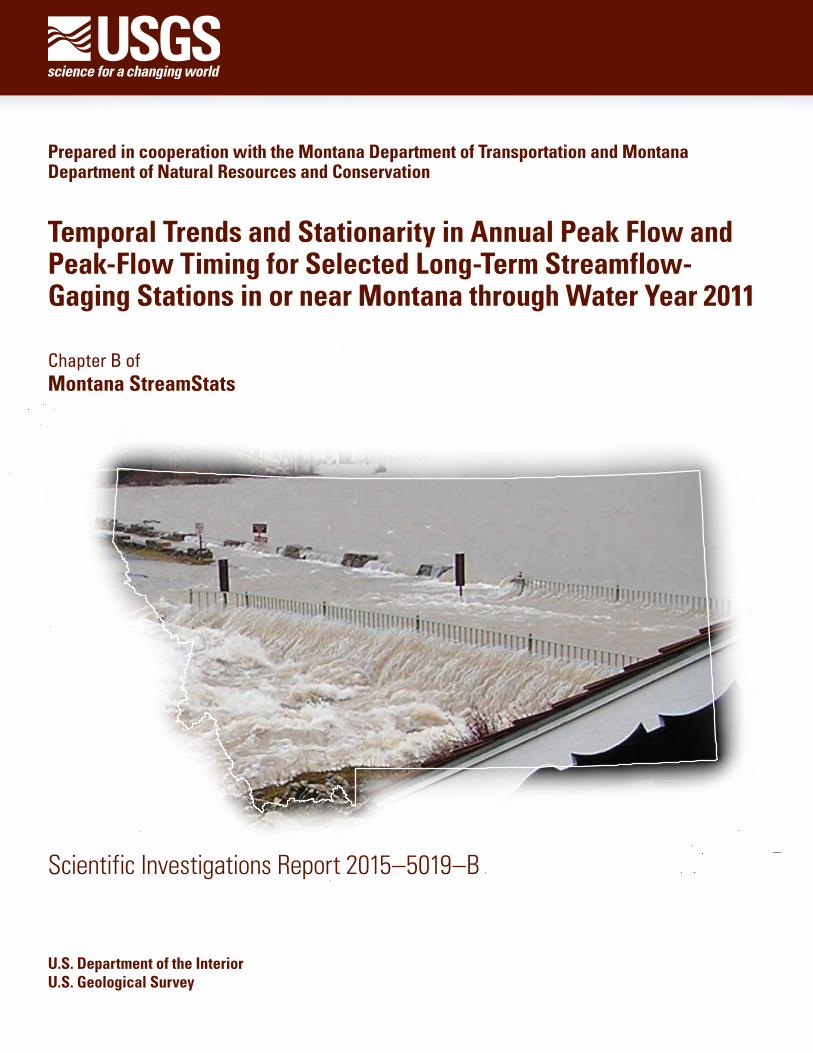
Prepared in cooperation with the Montana Department of Transportation and Montana Department of Natural Resources and Conservation
Temporal Trends and Stationarity in Annual Peak Flow and Peak-Flow Timing for Selected Long-Term Streamflow-Gaging Stations in or near Montana through Water Year 2011
Chapter B ofMontana StreamStats
U.S. Department of the InteriorU.S. Geological Survey
Scientific Investigations Report 2015–5019–B

Cover photograph: Swiftcurrent Creek at Many Glacier, Montana. Photograph by Don Bischoff, U.S. Geological Survey, November 7, 2006.
Temporal Trends and Stationarity in Annual Peak Flow and Peak-Flow Timing for Selected Long-Term Streamflow-Gaging Stations in or near Montana through Water Year 2011
By Steven K. Sando, Peter M. McCarthy, Roy Sando, and DeAnn M. Dutton
Chapter B ofMontana StreamStats
Prepared in cooperation with the Montana Department of Transportation and Montana Department of Natural Resources and Conservation
Scientific Investigations Report 2015–5019–B
U.S. Department of the InteriorU.S. Geological Survey
U.S. Department of the InteriorSALLY JEWELL, Secretary
U.S. Geological SurveySuzette M. Kimball, Director
U.S. Geological Survey, Reston, Virginia: 2016
For more information on the USGS—the Federal source for science about the Earth, its natural and living resources, natural hazards, and the environment—visit http://www.usgs.gov or call 1–888–ASK–USGS.
For an overview of USGS information products, including maps, imagery, and publications, visit http://www.usgs.gov/pubprod/.
Any use of trade, firm, or product names is for descriptive purposes only and does not imply endorsement by the U.S. Government.
Although this information product, for the most part, is in the public domain, it also may contain copyrighted materials as noted in the text. Permission to reproduce copyrighted items must be secured from the copyright owner.
Suggested citation:Sando, S.K., McCarthy, P.M., Sando, Roy, and Dutton, D.M., 2016, Temporal trends and stationarity in annual peak flow and peak-flow timing for selected long-term streamflow-gaging stations in or near Montana through water year 2011: U.S. Geological Survey Scientific Investigations Report 2015–5019–B, 48 p., http://dx.doi.org/10.3133/sir20155019B.
ISSN 2328-0328 (online)
iii
Contents
Acknowledgments ........................................................................................................................................viAbstract ...........................................................................................................................................................1Introduction.....................................................................................................................................................2
Purpose and Scope ..............................................................................................................................2Selection of Streamflow-Gaging Stations .................................................................................................2Methods of Analysis ......................................................................................................................................7Factors that Affect Interpretation of Results ............................................................................................8Temporal Trends and Stationarity in Annual Peak Flow and Peak-Flow Timing .................................9
Streamflow-Gaging Stations in the Saskatchewan River Basin ..................................................9Streamflow-Gaging Stations in the Missouri River Basin ...........................................................21
Missouri River Headwaters Tributaries .................................................................................21Upper Missouri River Tributaries ............................................................................................23Musselshell River Basin ...........................................................................................................25Upper Milk River Basin .............................................................................................................25Lower Missouri River Tributary ...............................................................................................25Yellowstone River Basin ...........................................................................................................26
Streamflow-Gaging Stations in the Columbia River Basin ..........................................................33Summary Observations ......................................................................................................................33Discussion of Stationarity Issues for Low-Elevation Streamflow-Gaging Stations in Eastern
Montana ..................................................................................................................................37Summary and Conclusions .........................................................................................................................39References ....................................................................................................................................................40Appendix 1. Information on Peak-Flow Frequency Analyses for Low-Elevation Streamflow-
Gaging Stations in Eastern Montana ..........................................................................................44
Figures
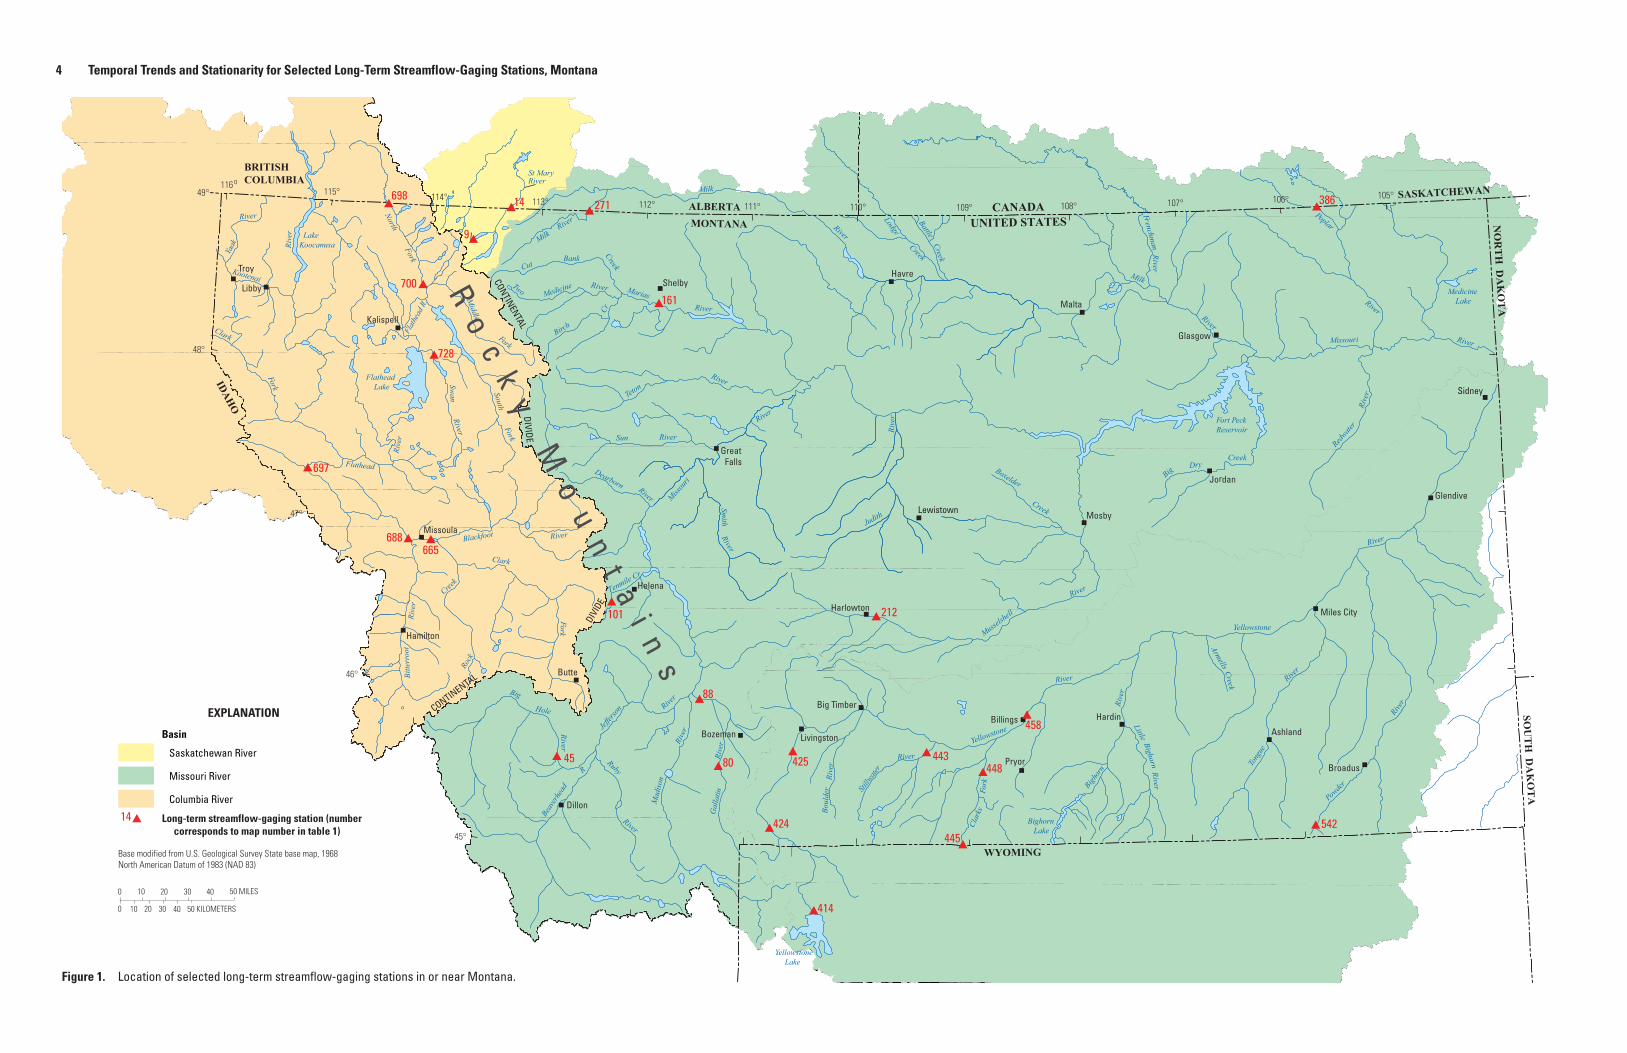
1. Map showing location of selected long-term streamflow-gaging stations in or near Montana .........................................................................................................................................4
2. Graphs showing fitted trends for annual peak flow and peak-flow timing, and statistical distributions for summary time periods for streamflow-gaging stations in the Saskatchewan River Basin ................................................................................................20
3. Graphs showing fitted trends for annual peak flow and peak-flow timing, and statistical distributions for summary time periods for streamflow-gaging stations on Missouri River headwaters tributaries ...................................................................................22
4. Graphs showing fitted trends for annual peak flow and peak-flow timing, and statistical distributions for summary time periods for streamflow-gaging stations on upper Missouri River tributaries ..............................................................................................24
5. Graphs showing fitted trends for annual peak flow and peak-flow timing, and statistical distributions for summary time periods for the streamflow-gaging station in the Musselshell River Basin .................................................................................................26

iv
6. Graphs showing fitted trends for annual peak flow and peak-flow timing, and statistical distributions for summary time periods for the streamflow-gaging station in the upper Milk River Basin ....................................................................................................27
7. Graphs showing fitted trends for annual peak flow and peak-flow timing, and statistical distributions for summary time periods for the streamflow-gaging station on a lower Missouri River tributary .........................................................................................28
8. Graphs showing fitted trends for annual peak flow and peak-flow timing, and statistical distributions for summary time periods for streamflow-gaging stations in the Yellowstone River Basin .....................................................................................................29
9. Graphs showing fitted trends for annual peak flow and peak-flow timing, and statistical distributions for summary time periods for streamflow-gaging stations in the Columbia River Basin ..........................................................................................................34
Appendix Figure
1–1. Graphs showing annual peak flows and peak-flow frequency curves for low-elevation streamflow-gaging stations in eastern Montana ........................................48
Tables
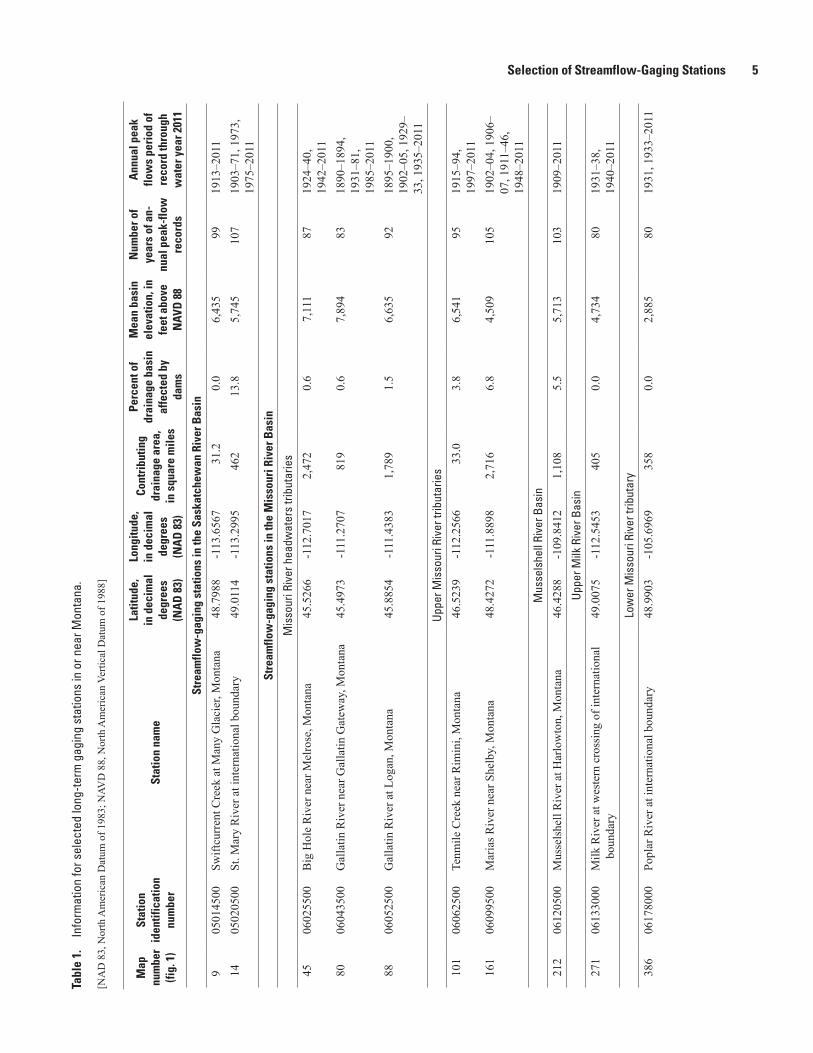
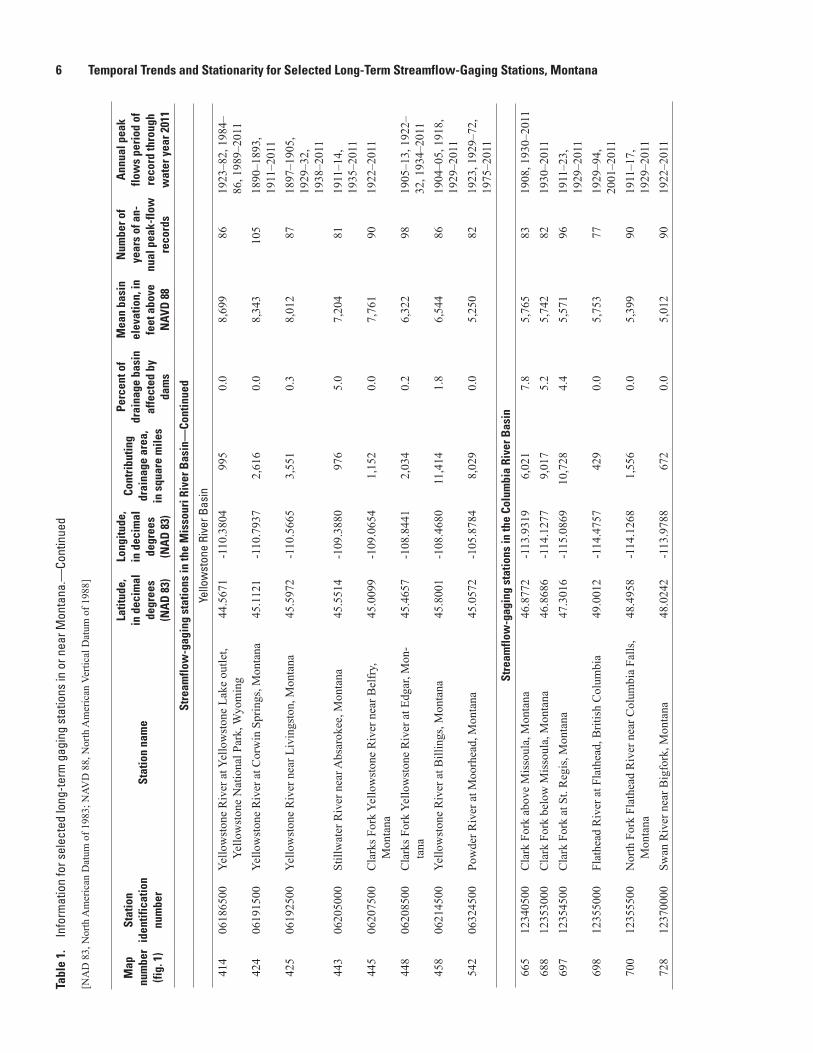
1. Information for selected long-term gaging stations in or near Montana ...........................5 2. Results of analysis of temporal trends in annual peak flow ................................................10 3. Results of analysis of temporal trends in peak-flow timing ................................................14 4. Statistical summaries of annual peak flow and peak-flow timing for summary
time periods .................................................................................................................................18
Appendix Tables
1–1. Documentation regarding analytical procedures for peak-flow frequency analyses for low-elevation streamflow-gaging stations in eastern Montana ..................................45
1–2. Peak-flow frequency results for low-elevation streamflow-gaging stations in eastern Montana ........................................................................................................................47
v
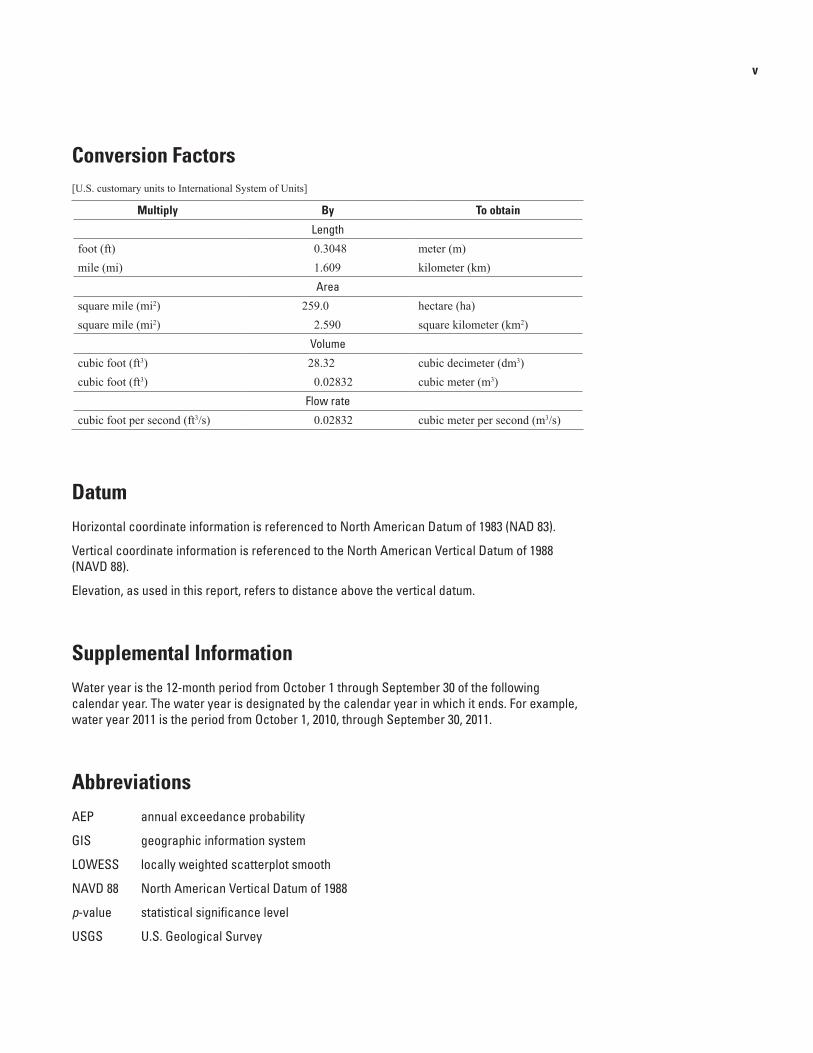
Conversion Factors[U.S. customary units to International System of Units]
Multiply By To obtain
Length
foot (ft) 0.3048 meter (m)mile (mi) 1.609 kilometer (km)
Area
square mile (mi2) 259.0 hectare (ha)square mile (mi2) 2.590 square kilometer (km2)
Volume
cubic foot (ft3) 28.32 cubic decimeter (dm3) cubic foot (ft3) 0.02832 cubic meter (m3)
Flow rate
cubic foot per second (ft3/s) 0.02832 cubic meter per second (m3/s)
DatumHorizontal coordinate information is referenced to North American Datum of 1983 (NAD 83).
Vertical coordinate information is referenced to the North American Vertical Datum of 1988 (NAVD 88).
Elevation, as used in this report, refers to distance above the vertical datum.
Supplemental InformationWater year is the 12-month period from October 1 through September 30 of the following calendar year. The water year is designated by the calendar year in which it ends. For example, water year 2011 is the period from October 1, 2010, through September 30, 2011.
AbbreviationsAEP annual exceedance probability
GIS geographic information system
LOWESS locally weighted scatterplot smooth
NAVD 88 North American Vertical Datum of 1988
p-value statistical significance level
USGS U.S. Geological Survey
vi
Acknowledgments
Thanks are given to Greg Pederson of the U.S. Geological Survey for providing information on climatic processes in Montana. The authors would like to recognize the U.S. Geological Sur-vey hydrologic technicians involved in the collection of the peak-flow data for their dedicated efforts. The authors also would like to recognize the valuable contributions to this report chapter from the insightful technical reviews by Dave Bender and Kirk Miller of the U.S. Geological Survey.
Special thanks are given to Mark Goodman and Dave Hedstrom of the Montana Department of Transportation, and Steve Story of the Montana Department of Natural Resources and Conserva-tion for their support of this study. Thanks also are given to Kelsey Jencson of the University of Montana for providing information on climatic processes in Montana.
Temporal Trends and Stationarity in Annual Peak Flow and Peak-Flow Timing for Selected Long-Term Streamflow-Gaging Stations in or near Montana through Water Year 2011
By Steven K. Sando, Peter M. McCarthy, Roy Sando, and DeAnn M. Dutton
AbstractA large-scale study by the U.S. Geological Survey, in
cooperation with the Montana Department of Transporta-tion and the Montana Department of Natural Resources and Conservation, was done to investigate general patterns in peak-flow temporal trends and stationarity through water year 2011 for 24 long-term streamflow-gaging stations (hereinafter referred to as gaging stations) in Montana. Hereinafter, all years refer to water years; a water year is the 12-month period from October 1 through September 30 and is designated by the year in which it ends. The primary focus of the study was to identify general patterns in peak-flow temporal trends and stationarity that are relevant to application of peak-flow fre-quency analyses within a statewide gaging-station network.
Temporal trends were analyzed for two hydrologic vari-ables: annual peak flow and peak-flow timing. Annual peak flow is the maximum instantaneous discharge, in cubic feet per second, recorded each year a gaging station was operated. Peak-flow timing is the day of the annual peak flow (herein-after referred to as day of peak), recorded each year a gaging station was operated.
Study results provide evidence that annual peak flow for most of the long-term gaging stations can be reasonably con-sidered as stationary for application of peak-flow frequency analyses within a statewide gaging station network. Upward trends in annual peak flow during 1930–76 generally were stronger than downward trends during 1967–2011 for most long-term gaging stations. Statistical distributions of annual peak flow generally were similar among three summary time periods (1930–78, 1979–2011, and the entire period of record). However, for two low-elevation gaging stations in eastern Montana (Poplar River at international boundary [gaging station 06178000] and Powder River at Moorhead, Montana [gaging station 06324500]), substantial downward trends in annual peak flow during 1967–2011 were of similar or stron-ger magnitude than the upward trends during 1930–76, and the annual-peak-flow medians for 1979–2011 were substantially lower than the medians for the entire period of record.
For peak-flow timing for most long-term gaging sta-tions, differences in trends between 1930–76 and 1967–2011
are variable and not particularly strong. Statistical distribu-tions generally are similar among the summary time periods. However, for two high-elevation gaging stations on a Mis-souri River headwater tributary (Gallatin River near Gallatin Gateway, Montana [gaging station 06043500] and Gallatin River at Logan, Montana [gaging station 06052500]) and for five high-elevation gaging stations in the Yellowstone River Basin (Yellowstone River at Corwin Springs, Montana [gag-ing station 06191500], Yellowstone River near Livingston, Montana [gaging station 06192500], Clarks Fork Yellowstone River near Belfry, Montana [gaging station 06207500], Clarks Fork Yellowstone River at Edgar, Montana [gaging station 06208500], and Yellowstone River at Billings, Montana [gag-ing station 06214500]) downward trends in peak-flow timing during 1967–2011 generally were stronger than upward trends during 1930–1976, and day-of-peak medians for 1979–2011 were considerably less than medians for 1930–78. The down-ward trends in peak-flow timing for 1967–2011 indicate that the timing of annual peak flows changed from later in the year to earlier in the year. For the seven high-elevation gaging sta-tions, the mean change during 1967–2011 was about 13 days (range of 8 to 22 days).
For most of the high-elevation gaging stations in the Missouri River headwaters, Yellowstone River Basin, and Columbia River Basin, there was general correspondence between trend patterns for annual peak flow and trend patterns for peak-flow timing; that is, during periods when there were upward trends in annual peak flow, there generally also were upward trends in peak-flow timing. Conversely, during periods when there were downward trends in annual peak flow, there generally also were downward trends in peak-flow timing.
The two low-elevation gaging stations in eastern Mon-tana (Poplar River at international boundary [gaging station 06178000] and Powder River at Moorhead, Montana [gaging station 06324500]) had considerable changes in annual-peak-flow characteristics after the mid-1970s, which might provide evidence of potential nonstationarity in the peak-flow records. The two low-elevation gaging stations that have potential nonstationarity are located in drainage basins that are strongly affected by agricultural activities that potentially affect the hydrologic regimes. Primary agricultural activities that might
2 Temporal Trends and Stationarity for Selected Long-Term Streamflow-Gaging Stations, Montana
alter natural hydrologic conditions include construction of small impoundments (primarily for stock-watering purposes) and irrigation diversions. Temporal variability in these activi-ties might contribute to the potential nonstationarity issues. Changes in climatic characteristics after the mid-1970s also possibly contribute to the potential nonstationarity issues. Lack of considerable indication of potential nonstationarity in annual peak flow for the other long-term gaging stations in this study might indicate that climatic changes have been more pronounced with respect to effects on peak flows in low-elevation areas in eastern Montana than in areas represented by the other long-term gaging stations. Another possibility is that climatic changes after the mid-1970s are exacerbated in low-elevation areas where small-impoundment development and potential effects of irrigation diversions might be more extensive.
IntroductionConcerns about increasing global temperatures since the
mid-1970s (National Aeronautics and Space Administration Goddard Institute for Space Studies, 2013) have prompted extensive research on environmental effects of climate change. Investigators have reported hydrologic effects (for example, Wahl, 1992; McCabe and Clark, 2005; Pederson and others, 2011) associated with reported changes in climatic conditions. Of particular note, several studies have reported declining trends in snowpack (Stewart and others, 2004; Mote and oth-ers, 2005; Pederson and others, 2013), earlier snowmelt runoff (Dettinger and Cayan, 1995; Cayan and others, 2001), and declining trends in some streamflow characteristics (West-macott and Burn, 1997; Aziz and Burn, 2006) in the western United States and Canada. The reported changes in hydro-logic regimes have the potential to affect the stationarity of annual peak-flow records. Hirsch (2011) noted the importance of repeated analysis of long-term datasets to assist in water-resources management and structure-design activities that are dependent on hydrologic variables.
Stationarity is an important issue in the statistical analysis of hydrologic characteristics. For a given streamflow-gaging station (hereinafter referred to as gaging station), stationarity of annual peak-flow requires that all of the data represent a consistent hydrologic regime within the same (albeit highly variable) fundamental climatic system. If the fundamental climatic system has substantially shifted such that a new fundamental system exists, appropriate statistical analysis of hydrologic characteristics might require restricting the analysis to the data that represent the new system.
The U.S. Geological Survey (USGS), in cooperation with the Montana Department of Transportation and the Montana Department of Natural Resources and Conservation, com-pleted an investigation of peak-flow frequency analyses for gaging stations in Montana (Sando and others, 2016). Peak-flow frequencies refer to peak-flow magnitudes, in cubic feet
per second associated with given annual exceedance prob-abilities (AEPs), in percent. Preliminary to the investigation of peak-flow frequency analyses, a large-scale study was done to investigate general patterns in peak-flow temporal trends and stationarity for Montana gaging stations. Temporal trends were analyzed for two hydrologic variables: annual peak flow and peak-flow timing. Annual peak flow is the annual series of maximum instantaneous discharge in cubic feet per second, which is recorded for each water year that a gaging station is operated. Peak-flow timing is the annual series of the day of the annual peak flow (hereinafter referred to as day of peak). The primary focus of the study was to identify general pat-terns in peak-flow temporal trends and stationarity through water year 2011 that are relevant to application of peak-flow frequency analyses within a statewide gaging-station network; a water year is the 12-month period from October 1 through September 30 and is designated by the year in which it ends. Emphasis is placed on annual peak flow because of direct rel-evance to peak-flow frequency analysis; however, peak-flow timing was included in the study because although peak-flow timing data are not directly relevant to peak-flow frequency analysis, peak-flow timing is of interest to many users of peak-flow frequency data.
Purpose and Scope
The study described in Chapter B of this Scientific Inves-tigations Report is part of a larger study to develop a Stream-Stats application for Montana, compute streamflow charac-teristics at streamflow-gaging stations, and develop regional regression equations to estimate streamflow characteristics at ungaged sites (as described fully in Chapters A through G of this Scientific Investigations Report). The primary purpose of Chapter B is to present the results of a large-scale study to investigate general patterns in peak-flow temporal trends and stationarity through water year 2011 for Montana gaging sta-tions; hereinafter, all references to specific years refer to water years in this report chapter. Temporal trends in annual peak flow and peak-flow timing for 24 long-term gaging stations are reported and described. The primary focus of the study was to identify general patterns in peak-flow temporal trends and stationarity that are relevant to application of peak-flow frequency analyses within a statewide gaging-station network.
Selection of Streamflow-Gaging Stations
More than 700 gaging stations with 10 or more years of annual peak-flow records have been operated by the USGS in Montana and for which peak-flow frequency analyses are reported. Initially, 725 gaging stations were screened for inclu-sion in this study based on the following selection criteria: (1) at least 75 years of annual peak-flow records with largely
Selection of Streamflow-Gaging Stations 3
unbroken series (that is, generally few missing years in the systematic record), (2) at least 5 years of data in the 1930s (a particularly dry period that can substantially affect the peak-flow characteristics of an individual gaging station), and (3) generally small effects from urbanization or large reservoir storage. The screening process resulted in selection of 24 long-term gaging stations (fig. 1, table 1; map numbers assigned according to McCarthy and others, 2016) for inclusion in the study of peak-flow temporal trends and stationarity. The selected 24 long-term gaging stations represent the only gag-ing stations out of the 725 screened gaging stations that met all of the selection criteria.
Several of the gaging stations with large drainage basins contain large urban areas that have substantially increased in size during the periods of data collection. Urbanization can affect hydrologic characteristics in several ways, with increases in impervious area and runoff potential being a primary factor. Geographic information system (GIS) analysis of the 2001 National Land Cover Dataset (Homer and others, 2007) was done to estimate the urban area (as determined by the area of high-intensity residential development) within the drainage basin for each of the gaging stations. In no case did the urban area account for more than about 3 percent of the drainage basin of an individual gaging station; therefore, it was presumed that temporal variability in urbanization within relatively small areas would have small effects on temporal trends in streamflow characteristics.
Reservoir storage and operations have the potential to affect temporal variability in streamflow characteristics. The current (2015) criterion used by the USGS in this study classi-fies a gaging station as affected by major dam regulation if the drainage area upstream from a single upstream dam exceeds 20 percent of the drainage area for the gaging station. Specific methods used to determine the regulation classification of a gaging station are described by McCarthy and others (2016). Based on the regulation-classification criterion, none of the 24 long-term gaging stations included in this study are con-sidered to be affected by major dam regulation. Furthermore, in previous peak-flow frequency studies for Montana (for example, Parrett and Johnson, 2004), all of the selected long-term gaging stations were considered to be unregulated.
The datasets of the 24 gaging stations are somewhat diverse, both with respect to the represented hydrologic regimes and the temporal data-collection characteristics. The study was restricted to long-term gaging stations to ensure representation of a substantial time period before and after the mid 1970s. This key breakpoint (the mid-1970s) was based on increasing global temperatures since the mid-1970s (National Aeronautics and Space Administration Goddard Institute for Space Studies, 2013) and various reported hydrologic effects (for example, Wahl, 1992; Westmacott and Burn, 1997; McCabe and Clark, 2005; Aziz and Burn, 2006; Pederson and others, 2011) associated with reported changes in climatic conditions. The key mid-1970s breakpoint also was generally identified as a transition point in large-scale temporal pat-terns of peak flows for long-term Montana gaging stations (as
further described in the section “Methods of Analysis”). The long record-length requirement allows thorough evaluation of potential changes in peak-flow characteristics after the mid-1970s in relation to temporal patterns in characteristics before the mid-1970s.
Although there is some hydrologic and topographic diversity among the 24 long-term gaging stations, they provide poor representation of the entirety of Montana. Most of the 24 gaging stations are high elevation (mean basin elevation greater than about 6,000 feet [ft]), whereas much of Montana is below 6,000 ft. Furthermore, most of the gaging stations have relatively large drainage basins (greater than about 1,000 square miles [mi2]). These large drainage basins serve as integrators of climatic effects over large areas but probably do not provide good representation of the larger variability in peak-flow characteristics that is typical for smaller drain-age basins. This study represents an initial effort to evaluate general patterns in peak-flow temporal trends and stationarity that are relevant to application of peak-flow frequency analy-ses within a statewide gaging-station network. As such, there was purposeful emphasis on long-term datasets to allow full temporal representation within the period of peak-flow record collection in Montana; however, the rigorous dataset require-ments result in poor representation of the entirety of Montana. Future studies on peak-flow temporal trends and stationarity might include relaxing the dataset requirements to provide representation of a broader range in areal, hydrologic, and topographic characteristics.
The 24 long-term gaging stations are grouped according to the following major river basins: Saskatchewan River Basin (2 gaging stations); Missouri River Basin (16 gaging stations); and Columbia River Basin (6 gaging stations). Gaging stations in the Missouri River are subgrouped according to the follow-ing descriptive classes: (1) Missouri River headwaters tributar-ies (three gaging stations); (2) upper Missouri River tributaries (two gaging stations); (3) Musselshell River Basin (one gaging station); (4) upper Milk River Basin (one gaging station); (4) lower Missouri River tributary (one gaging station); and (5) Yellowstone River Basin (eight gaging stations).
Several factors contribute to difficulties in making rigor-ous statistical comparisons among gaging stations and among groups of gaging stations. The 24 gaging stations represent somewhat of a diversity in hydrologic regimes that have relatively large variability in temporal patterns in peak-flow characteristics. The numbers of gaging stations vary substan-tially among groups. Within groups, there also is variation in the temporal data-collection characteristics among the gaging stations. In some cases, multiple gaging stations are located on the same channel. In most of these cases, there is at least a two-fold increase in drainage area between the gaging sta-tions; however, in a few cases, the increase in drainage area between the gaging stations is less than two fold and there is potential for introduction of redundant information. Given these factors, the datasets are not well suited for a rigorous statistical analysis focused on detailed definition and evalu-ation of temporal trends in peak-flow characteristics. Rather,
4 Temporal Trends and Stationarity for Selected Long-Term Streamflow-Gaging Stations, Montana
Cr
Fork
Two
Redwate
rRi
verSouth
Fork
River
Yaak
River
KootenaiRi
ver
Clark
Fork
Flathead Lake
North
Fork
Middle
CutBank
Creek
Medicine River MariasRiver
Birch
Milk
River
Lodge
Creek
BattleCreek
Frenchman
River
Milk
River
Poplar
River
Missouri River
Medicine Lake
River
Fort PeckReservoir
BigDry
CreekBoxelder
Creek
Rive
r
Judith
Missou
ri
River
Sun River
Smith
River
River
Teton
RiverSw
an
Flathead
Rive
rBi
tterr
oot
Rive
r
Blackfoot River
Creek
Rock
Clark
Fork Musselsh
ell
River
Yellowstone
Powde
r
Rive
r
River
Tong
ue
Bighor
n
Rive
r
Bighorn Lake
LittleBighorn
River
Yellowstone
Boul
der
Rive
r
Clar
ksFo
rk
Gal
latin
Rive
r
Mad
ison
Rive
r
Ruby
River
River
Jeffer
son
R
Beav
erhe
ad
Big
Hole
River
Yellowstone Lake
Dearborn River
LakeKoocanusa
Creek
Armells
St Mary River
Flat
head
R.
Milk River
Tenmile Cr.
Stillw
ater
River
9
88
8045
14
688
542
728
700
698
697
458
448
445
443425
424
414
386271
161
101
665
212
0 10 20 30 40 50 MILES
0 10 20 30 50 KILOMETERS40
Base modified from U.S. Geological Survey State base map, 1968North American Datum of 1983 (NAD 83)
EXPLANATION
Long-term streamflow-gaging station (number corresponds to map number in table 1)
14
Basin
Saskatchewan River
Missouri River
Columbia River
Glendive
Sidney
HavreShelby
Great Falls
Lewistown
Miles City
Billings
Butte
Dillon
Malta
DIVI
DE
CONTINENTALDIVIDE
Glasgow
Troy
Libby
Hamilton
Ashland
Broadus
Hardin
Livingston
Big Timber
Mosby
Jordan
Pryor
Harlowton
116o115°
113°49°
48°
47°
46°
45°
114°
Kalispell
Helena
Missoula
CONTINENTAL
Bozeman
112° 111° 110° 109° 108° 107° 106° 105°
Ro
ck
y
Mo
un
ta
in
s
°
CANADAUNITED STATES
WYOMING
IDAHO
NO
RT
H D
AK
OT
A
SASKATCHEWANALBERTAMONTANA
SOU
TH
DA
KO
TA
BRITISHCOLUMBIA
Figure 1. Location of selected long-term streamflow-gaging stations in or near Montana.
Selection of Streamflow-Gaging Stations 5Ta
ble
1.
Info
rmat
ion
for s
elec
ted
long
-term
gag
ing
stat
ions
in o
r nea
r Mon
tana
.
[NA
D 8
3, N
orth
Am
eric
an D
atum
of 1
983;
NAV
D 8
8, N
orth
Am
eric
an V
ertic
al D
atum
of 1
988]
Map
nu
mbe
r (fi
g. 1
)
Stat
ion
iden
tific
atio
n nu
mbe
rSt
atio
n na
me
Latit
ude,
in
dec
imal
de
gree
s (N
AD
83)
Long
itude
, in
dec
imal
de
gree
s (N
AD
83)
Cont
ribu
ting
drai
nage
are
a,
in s
quar
e m
iles
Perc
ent o
f dr
aina
ge b
asin
af
fect
ed b
y da
ms
Mea
n ba
sin
elev
atio
n, in
fe
et a
bove
N
AVD
88
Num
ber o
f ye
ars
of a
n-nu
al p
eak-
flow
re
cord
s
Ann
ual p
eak
flow
s pe
riod
of
reco
rd th
roug
h w
ater
yea
r 201
1
Stre
amflo
w-g
agin
g st
atio
ns in
the
Sask
atch
ewan
Riv
er B
asin
905
0145
00Sw
iftcu
rren
t Cre
ek a
t Man
y G
laci
er, M
onta
na48
.798
8-1
13.6
567
31.2
0.0
6,43
599
1913
–201
114
0502
0500
St. M
ary
Riv
er a
t int
erna
tiona
l bou
ndar
y49
.011
4-1
13.2
995
462
13.8
5,74
510
719
03–7
1, 1
973,
19
75–2
011
Stre
amflo
w-g
agin
g st
atio
ns in
the
Mis
sour
i Riv
er B
asin
Mis
sour
i Riv
er h
eadw
ater
s tri
buta
ries
4506
0255
00B
ig H
ole
Riv
er n
ear M
elro
se, M
onta
na45
.526
6-1
12.7
017
2,47
20.
67,
111
8719
24–4
0,
1942
–201
180
0604
3500
Gal
latin
Riv
er n
ear G
alla
tin G
atew
ay, M
onta
na45
.497
3-1
11.2
707
819
0.6
7,89
483
1890
–189
4,
1931
–81,
19
85–2
011
8806
0525
00G
alla
tin R
iver
at L
ogan
, Mon
tana
45.8
854
-111
.438
31,
789
1.5
6,63
592
1895
–190
0,
1902
–05,
192
9–33
, 193
5–20
11Up
per M
isso
uri R
iver
trib
utar
ies
101
0606
2500
Tenm
ile C
reek
nea
r Rim
ini,
Mon
tana
46.5
239
-112
.256
633
.03.
86,
541
9519
15–9
4,
1997
–201
116
106
0995
00M
aria
s Riv
er n
ear S
helb
y, M
onta
na48
.427
2-1
11.8
898
2,71
66.
84,
509
105
1902
–04,
190
6–07
, 191
1–46
, 19
48–2
011
Mus
sels
hell
Rive
r Bas
in
212
0612
0500
Mus
sels
hell
Riv
er a
t Har
low
ton,
Mon
tana
46.4
288
-109
.841
21,
108
5.5
5,71
310
319
09–2
011
Uppe
r Milk
Riv
er B
asin
271
0613
3000
Milk
Riv
er a
t wes
tern
cro
ssin
g of
inte
rnat
iona
l bo
unda
ry49
.007
5-1
12.5
453
405
0.0
4,73
480
1931
–38,
19
40–2
011
Low
er M
isso
uri R
iver
trib
utar
y
386
0617
8000
Popl
ar R
iver
at i
nter
natio
nal b
ound
ary
48.9
903
-105
.696
935
80.
02,
885
8019
31, 1
933–
2011
6 Temporal Trends and Stationarity for Selected Long-Term Streamflow-Gaging Stations, MontanaTa
ble
1.
Info
rmat
ion
for s
elec
ted
long
-term
gag
ing
stat
ions
in o
r nea
r Mon
tana
.—Co
ntin
ued
[NA
D 8
3, N
orth
Am
eric
an D
atum
of 1
983;
NAV
D 8
8, N
orth
Am
eric
an V
ertic
al D
atum
of 1
988]
Map
nu
mbe
r (fi
g. 1
)
Stat
ion
iden
tific
atio
n nu
mbe
rSt
atio
n na
me
Latit
ude,
in
dec
imal
de
gree
s (N
AD
83)
Long
itude
, in
dec
imal
de
gree
s (N
AD
83)
Cont
ribu
ting
drai
nage
are
a,
in s
quar
e m
iles
Perc
ent o
f dr
aina
ge b
asin
af
fect
ed b
y da
ms
Mea
n ba
sin
elev
atio
n, in
fe
et a
bove
N
AVD
88
Num
ber o
f ye
ars
of a
n-nu
al p
eak-
flow
re
cord
s
Ann
ual p
eak
flow
s pe
riod
of
reco
rd th
roug
h w
ater
yea
r 201
1
Stre
amflo
w-g
agin
g st
atio
ns in
the
Mis
sour
i Riv
er B
asin
—Co
ntin
ued
Yello
wst
one
Rive
r Bas
in
414
0618
6500
Yello
wst
one
Riv
er a
t Yel
low
ston
e La
ke o
utle
t, Ye
llow
ston
e N
atio
nal P
ark,
Wyo
min
g44
.567
1-1
10.3
804
995
0.0
8,69
986
1923
–82,
198
4–86
, 198
9–20
1142
406
1915
00Ye
llow
ston
e R
iver
at C
orw
in S
prin
gs, M
onta
na45
.112
1-1
10.7
937
2,61
60.
08,
343
105
1890
–189
3,
1911
–201
142
506
1925
00Ye
llow
ston
e R
iver
nea
r Liv
ings
ton,
Mon
tana
45.5
972
-110
.566
53,
551
0.3
8,01
287
1897
–190
5,
1929
–32,
19
38–2
011
443
0620
5000
Still
wat
er R
iver
nea
r Abs
arok
ee, M
onta
na45
.551
4-1
09.3
880
976
5.0
7,20
481
1911
–14,
19
35–2
011
445
0620
7500
Cla
rks F
ork
Yello
wst
one
Riv
er n
ear B
elfr
y,
Mon
tana
45.0
099
-109
.065
41,
152
0.0
7,76
190
1922
–201
1
448
0620
8500
Cla
rks F
ork
Yello
wst
one
Riv
er a
t Edg
ar, M
on-
tana
45.4
657
-108
.844
12,
034
0.2
6,32
298
1905
–13,
192
2–32
, 193
4–20
1145
806
2145
00Ye
llow
ston
e R
iver
at B
illin
gs, M
onta
na45
.800
1-1
08.4
680
11,4
141.
86,
544
8619
04–0
5, 1
918,
19
29–2
011
542
0632
4500
Pow
der R
iver
at M
oorh
ead,
Mon
tana
45.0
572
-105
.878
48,
029
0.0
5,25
082
1923
, 192
9–72
, 19
75–2
011
Stre
amflo
w-g
agin
g st
atio
ns in
the
Colu
mbi
a Ri
ver B
asin
665
1234
0500
Cla
rk F
ork
abov
e M
isso
ula,
Mon
tana
46.8
772
-113
.931
96,
021
7.8
5,76
583
1908
, 193
0–20
1168
812
3530
00C
lark
For
k be
low
Mis
soul
a, M
onta
na46
.868
6-1
14.1
277
9,01
75.
25,
742
8219
30–2
011
697
1235
4500
Cla
rk F
ork
at S
t. R
egis
, Mon
tana
47.3
016
-115
.086
910
,728
4.4
5,57
196
1911
–23,
19
29–2
011
698
1235
5000
Flat
head
Riv
er a
t Fla
thea
d, B
ritis
h C
olum
bia
49.0
012
-114
.475
742
90.
05,
753
7719
29–9
4,
2001
–201
170
012
3555
00N
orth
For
k Fl
athe
ad R
iver
nea
r Col
umbi
a Fa
lls,
Mon
tana
48.4
958
-114
.126
81,
556
0.0
5,39
990
1911
–17,
19
29–2
011
728
1237
0000
Swan
Riv
er n
ear B
igfo
rk, M
onta
na48
.024
2-1
13.9
788
672
0.0
5,01
290
1922
–201
1
Methods of Analysis 7
this study is intended to provide an initial assessment of general large-scale patterns in peak-flow temporal variability and stationarity for long-term gaging stations in Montana. Primary considerations in the study were whether the analyses for the long-term gaging stations indicate potential changes in peak-flow characteristics after the mid-1970s and whether the potential changes might be relevant to stationarity issues in the application of peak-flow frequency analyses within a statewide gaging-station network.
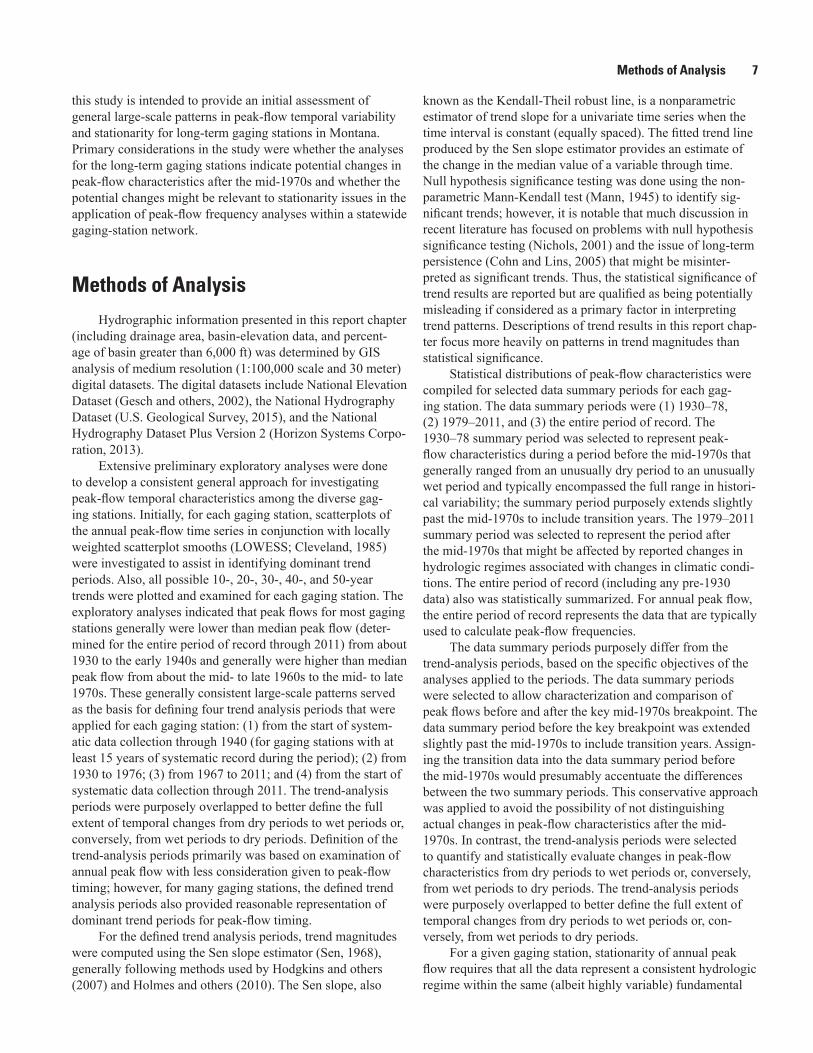
Methods of AnalysisHydrographic information presented in this report chapter
(including drainage area, basin-elevation data, and percent-age of basin greater than 6,000 ft) was determined by GIS analysis of medium resolution (1:100,000 scale and 30 meter) digital datasets. The digital datasets include National Elevation Dataset (Gesch and others, 2002), the National Hydrography Dataset (U.S. Geological Survey, 2015), and the National Hydrography Dataset Plus Version 2 (Horizon Systems Corpo-ration, 2013).
Extensive preliminary exploratory analyses were done to develop a consistent general approach for investigating peak-flow temporal characteristics among the diverse gag-ing stations. Initially, for each gaging station, scatterplots of the annual peak-flow time series in conjunction with locally weighted scatterplot smooths (LOWESS; Cleveland, 1985) were investigated to assist in identifying dominant trend periods. Also, all possible 10-, 20-, 30-, 40-, and 50-year trends were plotted and examined for each gaging station. The exploratory analyses indicated that peak flows for most gaging stations generally were lower than median peak flow (deter-mined for the entire period of record through 2011) from about 1930 to the early 1940s and generally were higher than median peak flow from about the mid- to late 1960s to the mid- to late 1970s. These generally consistent large-scale patterns served as the basis for defining four trend analysis periods that were applied for each gaging station: (1) from the start of system-atic data collection through 1940 (for gaging stations with at least 15 years of systematic record during the period); (2) from 1930 to 1976; (3) from 1967 to 2011; and (4) from the start of systematic data collection through 2011. The trend-analysis periods were purposely overlapped to better define the full extent of temporal changes from dry periods to wet periods or, conversely, from wet periods to dry periods. Definition of the trend-analysis periods primarily was based on examination of annual peak flow with less consideration given to peak-flow timing; however, for many gaging stations, the defined trend analysis periods also provided reasonable representation of dominant trend periods for peak-flow timing.
For the defined trend analysis periods, trend magnitudes were computed using the Sen slope estimator (Sen, 1968), generally following methods used by Hodgkins and others (2007) and Holmes and others (2010). The Sen slope, also
known as the Kendall-Theil robust line, is a nonparametric estimator of trend slope for a univariate time series when the time interval is constant (equally spaced). The fitted trend line produced by the Sen slope estimator provides an estimate of the change in the median value of a variable through time. Null hypothesis significance testing was done using the non-parametric Mann-Kendall test (Mann, 1945) to identify sig-nificant trends; however, it is notable that much discussion in recent literature has focused on problems with null hypothesis significance testing (Nichols, 2001) and the issue of long-term persistence (Cohn and Lins, 2005) that might be misinter-preted as significant trends. Thus, the statistical significance of trend results are reported but are qualified as being potentially misleading if considered as a primary factor in interpreting trend patterns. Descriptions of trend results in this report chap-ter focus more heavily on patterns in trend magnitudes than statistical significance.
Statistical distributions of peak-flow characteristics were compiled for selected data summary periods for each gag-ing station. The data summary periods were (1) 1930–78, (2) 1979–2011, and (3) the entire period of record. The 1930–78 summary period was selected to represent peak-flow characteristics during a period before the mid-1970s that generally ranged from an unusually dry period to an unusually wet period and typically encompassed the full range in histori-cal variability; the summary period purposely extends slightly past the mid-1970s to include transition years. The 1979–2011 summary period was selected to represent the period after the mid-1970s that might be affected by reported changes in hydrologic regimes associated with changes in climatic condi-tions. The entire period of record (including any pre-1930 data) also was statistically summarized. For annual peak flow, the entire period of record represents the data that are typically used to calculate peak-flow frequencies.
The data summary periods purposely differ from the trend-analysis periods, based on the specific objectives of the analyses applied to the periods. The data summary periods were selected to allow characterization and comparison of peak flows before and after the key mid-1970s breakpoint. The data summary period before the key breakpoint was extended slightly past the mid-1970s to include transition years. Assign-ing the transition data into the data summary period before the mid-1970s would presumably accentuate the differences between the two summary periods. This conservative approach was applied to avoid the possibility of not distinguishing actual changes in peak-flow characteristics after the mid-1970s. In contrast, the trend-analysis periods were selected to quantify and statistically evaluate changes in peak-flow characteristics from dry periods to wet periods or, conversely, from wet periods to dry periods. The trend-analysis periods were purposely overlapped to better define the full extent of temporal changes from dry periods to wet periods or, con-versely, from wet periods to dry periods.
For a given gaging station, stationarity of annual peak flow requires that all the data represent a consistent hydrologic regime within the same (albeit highly variable) fundamental
8 Temporal Trends and Stationarity for Selected Long-Term Streamflow-Gaging Stations, Montana
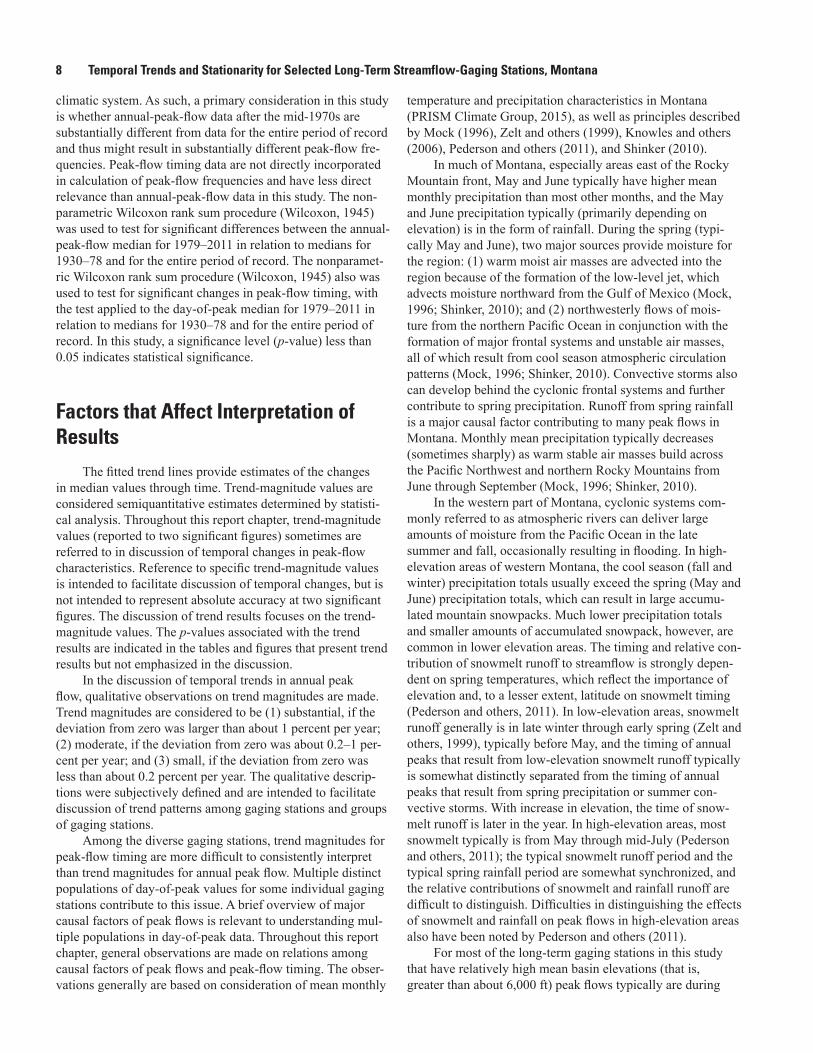
climatic system. As such, a primary consideration in this study is whether annual-peak-flow data after the mid-1970s are substantially different from data for the entire period of record and thus might result in substantially different peak-flow fre-quencies. Peak-flow timing data are not directly incorporated in calculation of peak-flow frequencies and have less direct relevance than annual-peak-flow data in this study. The non-parametric Wilcoxon rank sum procedure (Wilcoxon, 1945) was used to test for significant differences between the annual-peak-flow median for 1979–2011 in relation to medians for 1930–78 and for the entire period of record. The nonparamet-ric Wilcoxon rank sum procedure (Wilcoxon, 1945) also was used to test for significant changes in peak-flow timing, with the test applied to the day-of-peak median for 1979–2011 in relation to medians for 1930–78 and for the entire period of record. In this study, a significance level (p-value) less than 0.05 indicates statistical significance.
Factors that Affect Interpretation of Results
The fitted trend lines provide estimates of the changes in median values through time. Trend-magnitude values are considered semiquantitative estimates determined by statisti-cal analysis. Throughout this report chapter, trend-magnitude values (reported to two significant figures) sometimes are referred to in discussion of temporal changes in peak-flow characteristics. Reference to specific trend-magnitude values is intended to facilitate discussion of temporal changes, but is not intended to represent absolute accuracy at two significant figures. The discussion of trend results focuses on the trend-magnitude values. The p-values associated with the trend results are indicated in the tables and figures that present trend results but not emphasized in the discussion.
In the discussion of temporal trends in annual peak flow, qualitative observations on trend magnitudes are made. Trend magnitudes are considered to be (1) substantial, if the deviation from zero was larger than about 1 percent per year; (2) moderate, if the deviation from zero was about 0.2–1 per-cent per year; and (3) small, if the deviation from zero was less than about 0.2 percent per year. The qualitative descrip-tions were subjectively defined and are intended to facilitate discussion of trend patterns among gaging stations and groups of gaging stations.
Among the diverse gaging stations, trend magnitudes for peak-flow timing are more difficult to consistently interpret than trend magnitudes for annual peak flow. Multiple distinct populations of day-of-peak values for some individual gaging stations contribute to this issue. A brief overview of major causal factors of peak flows is relevant to understanding mul-tiple populations in day-of-peak data. Throughout this report chapter, general observations are made on relations among causal factors of peak flows and peak-flow timing. The obser-vations generally are based on consideration of mean monthly
temperature and precipitation characteristics in Montana (PRISM Climate Group, 2015), as well as principles described by Mock (1996), Zelt and others (1999), Knowles and others (2006), Pederson and others (2011), and Shinker (2010).
In much of Montana, especially areas east of the Rocky Mountain front, May and June typically have higher mean monthly precipitation than most other months, and the May and June precipitation typically (primarily depending on elevation) is in the form of rainfall. During the spring (typi-cally May and June), two major sources provide moisture for the region: (1) warm moist air masses are advected into the region because of the formation of the low-level jet, which advects moisture northward from the Gulf of Mexico (Mock, 1996; Shinker, 2010); and (2) northwesterly flows of mois-ture from the northern Pacific Ocean in conjunction with the formation of major frontal systems and unstable air masses, all of which result from cool season atmospheric circulation patterns (Mock, 1996; Shinker, 2010). Convective storms also can develop behind the cyclonic frontal systems and further contribute to spring precipitation. Runoff from spring rainfall is a major causal factor contributing to many peak flows in Montana. Monthly mean precipitation typically decreases (sometimes sharply) as warm stable air masses build across the Pacific Northwest and northern Rocky Mountains from June through September (Mock, 1996; Shinker, 2010).
In the western part of Montana, cyclonic systems com-monly referred to as atmospheric rivers can deliver large amounts of moisture from the Pacific Ocean in the late summer and fall, occasionally resulting in flooding. In high-elevation areas of western Montana, the cool season (fall and winter) precipitation totals usually exceed the spring (May and June) precipitation totals, which can result in large accumu-lated mountain snowpacks. Much lower precipitation totals and smaller amounts of accumulated snowpack, however, are common in lower elevation areas. The timing and relative con-tribution of snowmelt runoff to streamflow is strongly depen-dent on spring temperatures, which reflect the importance of elevation and, to a lesser extent, latitude on snowmelt timing (Pederson and others, 2011). In low-elevation areas, snowmelt runoff generally is in late winter through early spring (Zelt and others, 1999), typically before May, and the timing of annual peaks that result from low-elevation snowmelt runoff typically is somewhat distinctly separated from the timing of annual peaks that result from spring precipitation or summer con-vective storms. With increase in elevation, the time of snow-melt runoff is later in the year. In high-elevation areas, most snowmelt typically is from May through mid-July (Pederson and others, 2011); the typical snowmelt runoff period and the typical spring rainfall period are somewhat synchronized, and the relative contributions of snowmelt and rainfall runoff are difficult to distinguish. Difficulties in distinguishing the effects of snowmelt and rainfall on peak flows in high-elevation areas also have been noted by Pederson and others (2011).
For most of the long-term gaging stations in this study that have relatively high mean basin elevations (that is, greater than about 6,000 ft) peak flows typically are during
Temporal Trends and Stationarity in Annual Peak Flow and Peak-Flow Timing 9
the snowmelt runoff period and result from snowmelt only or a combination of rainfall on snowmelt. Peak flows that are outside of the snowmelt runoff period (May through mid-July) and result from rainfall only are somewhat infrequent. For the high-elevation gaging stations, the day-of-peak data typically are well (approximately continuously and normally) distrib-uted within the snowmelt period. Among the high-elevation gaging stations, trend magnitudes for peak-flow timing can be reasonably consistently interpreted and compared. Upward trends in peak-flow timing indicate that the timing of annual peak flows changed from earlier in the year to later in the year. Conversely, downward trends in peak-flow timing indicate that the timing of annual peak flows changed from later in the year to earlier in the year. In the discussion, trend magnitudes for peak-flow timing for high-elevation gaging stations are quali-tatively considered to be (1) substantial, if the deviation from zero was larger than about 0.20 percent per year; (2) moderate, if the deviation from zero was about 0.10–0.20 percent per year; and (3) small, if the deviation from zero was less than about 0.10 percent per year. The criteria for qualitative obser-vations on trend magnitudes for peak-flow timing purposely differ from the criteria for trend magnitudes for annual peak flow because of large differences in units of measurement and scaling between day of peak and annual peak flow.
Many of the long-term gaging stations in this study that have relatively low mean basin elevations (less than about 6,000 ft) have bimodal (and sometimes trimodal) distributions of day-of-peak data. The multiple populations of day-of-peak values for individual low-elevation gaging stations primarily result from the following major causal factors: low-elevation snowmelt (possibly with associated rainfall) and rainfall only outside of the snowmelt period. Furthermore, rainfall-only events can result from cyclonic storms (and convective storms that sometimes follow behind cyclonic systems) that typically are in May and June and intense convective and cyclonic sum-mer storms that typically are from July through September. Each of these causal factors might account for a considerable proportion of the day-of-peak values in the annual series. For some gaging stations, there is somewhat distinct and relatively large separation in the ranges of day-of-peak values between the various causal factors. Rigorous statistical analysis of day-of-peak data for gaging stations with multiple populations would involve segregating the data into the individual popula-tions for separate analysis; however, this detailed approach was beyond the scope of this study. In the simplified approach of this study, all day-of-peak data for an individual gaging station were treated as coming from a single population. The fitted trend lines generally are within or near the day-of-peak values representing the dominant causal factor population. The temporal changes in median peak flow indicated by the fitted trend lines might represent changes in timing within the dominant causal factor or shifts in dominance between causal factors. As such, trend magnitudes for peak-flow timing for low-elevation gaging stations are somewhat variable and more difficult to interpret than for high-elevation gaging stations. Discussion of trend magnitudes for peak-flow timing for
low-elevation gaging stations focuses on general patterns in directions of trends.
A detailed analysis of causal factors for individual peak flows was not done for this study; however, results are described based on principles that peak flows in high-elevation areas (greater than about 6,000 ft) generally occur during the high-elevation snowmelt runoff period (May through mid-July) and primarily are affected by snowmelt runoff. Peak flows in low-elevation areas (less than about 6,000 ft) some-what frequently occur outside of the low-elevation snowmelt runoff period (late winter through early spring, typically before May), and rainfall-only events account for a larger proportion of peak flows in low-elevation areas than in high-elevation areas. However, in both high- and low-elevation areas, a combination of rainfall and snowmelt events can occur within the snowmelt runoff period.
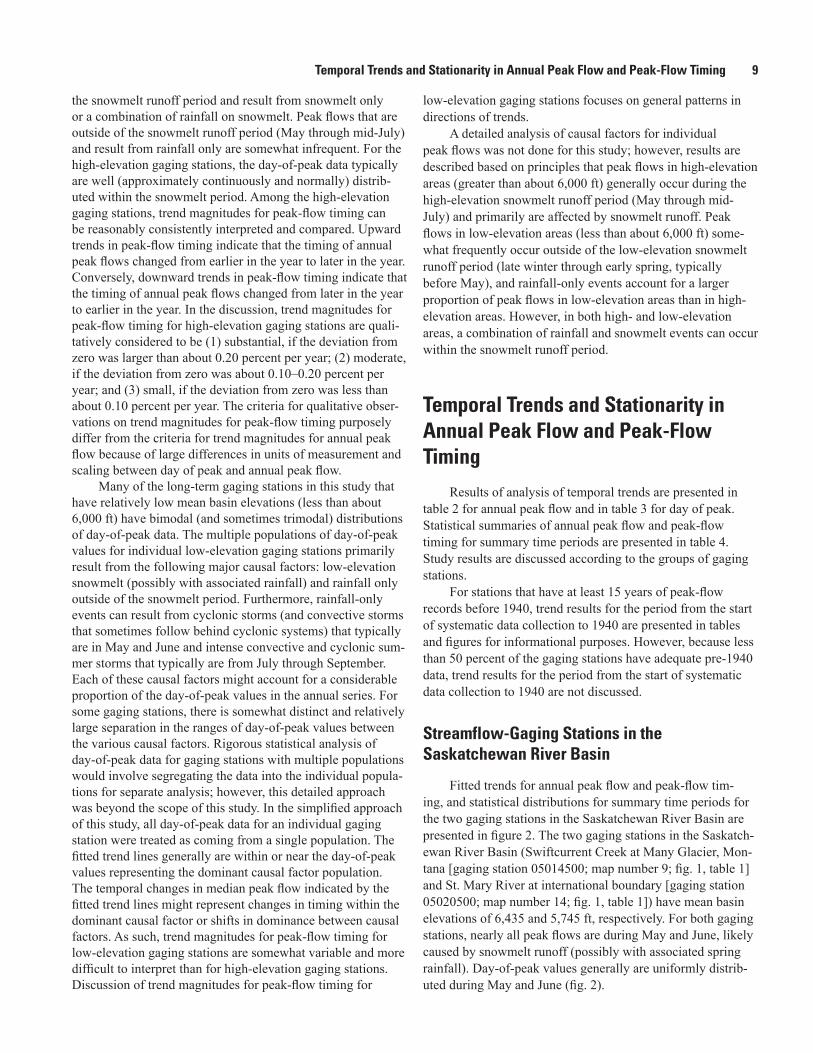
Temporal Trends and Stationarity in Annual Peak Flow and Peak-Flow Timing
Results of analysis of temporal trends are presented in table 2 for annual peak flow and in table 3 for day of peak. Statistical summaries of annual peak flow and peak-flow timing for summary time periods are presented in table 4. Study results are discussed according to the groups of gaging stations.
For stations that have at least 15 years of peak-flow records before 1940, trend results for the period from the start of systematic data collection to 1940 are presented in tables and figures for informational purposes. However, because less than 50 percent of the gaging stations have adequate pre-1940 data, trend results for the period from the start of systematic data collection to 1940 are not discussed.
Streamflow-Gaging Stations in the Saskatchewan River Basin
Fitted trends for annual peak flow and peak-flow tim-ing, and statistical distributions for summary time periods for the two gaging stations in the Saskatchewan River Basin are presented in figure 2. The two gaging stations in the Saskatch-ewan River Basin (Swiftcurrent Creek at Many Glacier, Mon-tana [gaging station 05014500; map number 9; fig. 1, table 1] and St. Mary River at international boundary [gaging station 05020500; map number 14; fig. 1, table 1]) have mean basin elevations of 6,435 and 5,745 ft, respectively. For both gaging stations, nearly all peak flows are during May and June, likely caused by snowmelt runoff (possibly with associated spring rainfall). Day-of-peak values generally are uniformly distrib-uted during May and June (fig. 2).
10 Temporal Trends and Stationarity for Selected Long-Term Streamflow-Gaging Stations, Montana
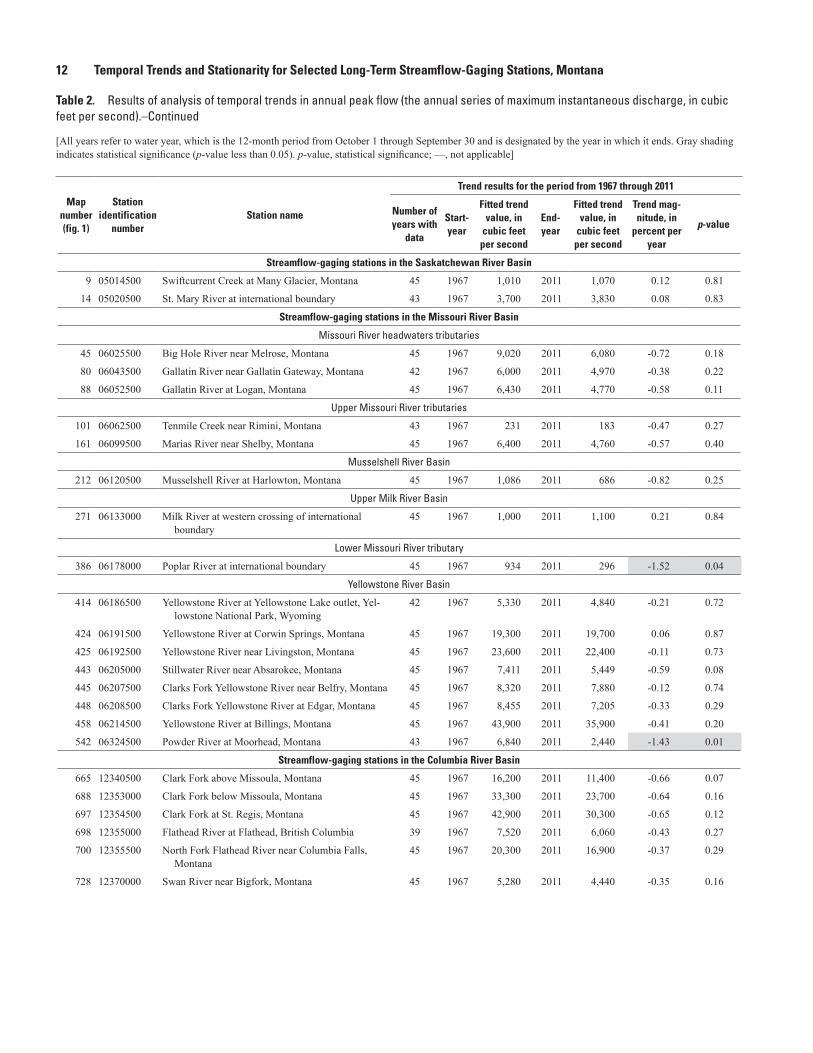
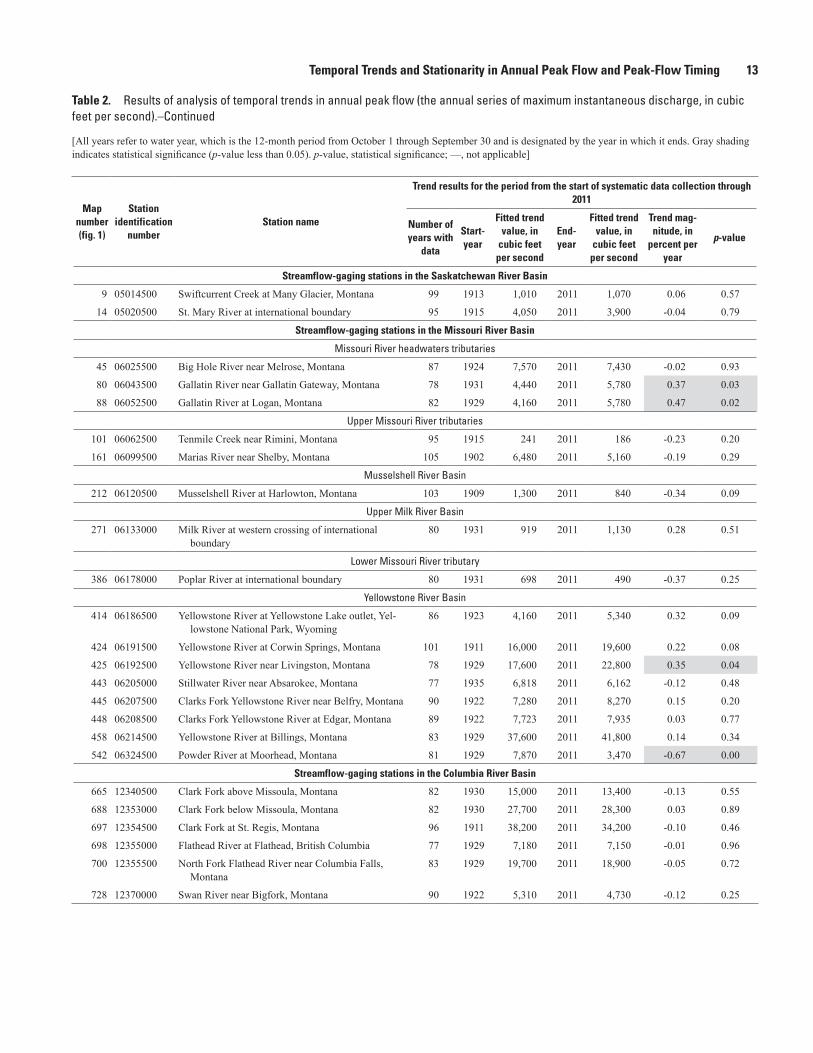
Table 2. Results of analysis of temporal trends in annual peak flow (the annual series of maximum instantaneous discharge, in cubic feet per second).
[All years refer to water year, which is the 12-month period from October 1 through September 30 and is designated by the year in which it ends. Gray shading indicates statistical significance (p-value less than 0.05). p-value, statistical significance; —, not applicable]
Map number (fig. 1)
Station identification
numberStation name
Trend results for the period from the start of systematic data collection through 1940 (for stations with at least 15 years of systematic record during the period)
Number of years
with data
Start-year
Fitted trend value, in
cubic feet per second
End-year
Fitted trend value, in
cubic feet per second
Trend magnitude, in percent per year
p-value
Streamflow-gaging stations in the Saskatchewan River Basin
9 05014500 Swiftcurrent Creek at Many Glacier, Montana 28 1913 1,050 1940 1,120 0.21 0.57
14 05020500 St. Mary River at international boundary 26 1915 5,460 1940 3,100 -1.66 0.06
Streamflow-gaging stations in the Missouri River Basin
Missouri River headwaters tributaries
45 06025500 Big Hole River near Melrose, Montana — — — — — — —
80 06043500 Gallatin River near Gallatin Gateway, Montana — — — — — — —
88 06052500 Gallatin River at Logan, Montana — — — — — — —
Upper Missouri River tributaries
101 06062500 Tenmile Creek near Rimini, Montana 26 1915 317 1940 78 -2.90 0.03
161 06099500 Marias River near Shelby, Montana 35 1902 8,300 1940 3,230 -1.57 0.01
Musselshell River Basin
212 06120500 Musselshell River at Harlowton, Montana 32 1909 1,712 1940 898 -1.49 0.14
Upper Milk River Basin
271 06133000 Milk River at western crossing of international boundary
— — — — — — —
Lower Missouri River tributary
386 06178000 Poplar River at international boundary — — — — — — —
Yellowstone River Basin
414 06186500 Yellowstone River at Yellowstone Lake outlet, Yel-lowstone National Park, Wyoming
18 1923 4,590 1940 3,800 -0.97 0.54
424 06191500 Yellowstone River at Corwin Springs, Montana 30 1911 19,100 1940 12,500 -1.15 0.09
425 06192500 Yellowstone River near Livingston, Montana — — — — — — —
443 06205000 Stillwater River near Absarokee, Montana — — — — — — —
445 06207500 Clarks Fork Yellowstone River near Belfry, Montana 19 1922 7,560 1940 7,900 0.24 0.86
448 06208500 Clarks Fork Yellowstone River at Edgar, Montana 18 1922 7,590 1940 7,410 -0.12 0.97
458 06214500 Yellowstone River at Billings, Montana — — — — — — —
542 06324500 Powder River at Moorhead, Montana — — — — — — —
Streamflow-gaging stations in the Columbia River Basin
665 12340500 Clark Fork above Missoula, Montana — — — — — — —
688 12353000 Clark Fork below Missoula, Montana — — — — — — —
697 12354500 Clark Fork at St. Regis, Montana 25 1911 41,100 1940 23,400 -1.43 0.04
698 12355000 Flathead River at Flathead, British Columbia — — — — — — —
700 12355500 North Fork Flathead River near Columbia Falls, Montana
— — — — — — —
728 12370000 Swan River near Bigfork, Montana 19 1922 5,860 1940 4,420 -1.29 0.10
Temporal Trends and Stationarity in Annual Peak Flow and Peak-Flow Timing 11
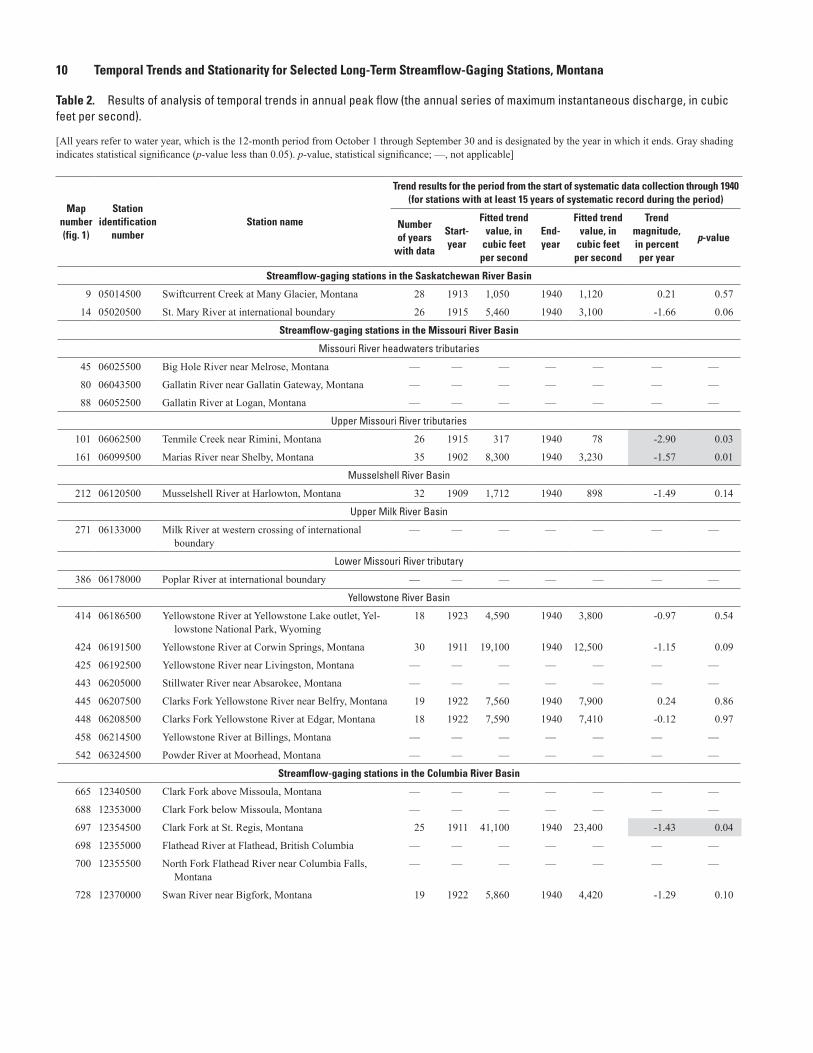
Table 2. Results of analysis of temporal trends in annual peak flow (the annual series of maximum instantaneous discharge, in cubic feet per second).–Continued
[All years refer to water year, which is the 12-month period from October 1 through September 30 and is designated by the year in which it ends. Gray shading indicates statistical significance (p-value less than 0.05). p-value, statistical significance; —, not applicable]
Map number (fig. 1)
Station identification
numberStation name
Trend results for the period from 1930 through 1976
Number of years with
data
Start-year
Fitted trend value, in
cubic feet per second
End-year
Fitted trend value, in
cubic feet per second
Trend mag-nitude, in
percent per year
p-value
Streamflow-gaging stations in the Saskatchewan River Basin
9 05014500 Swiftcurrent Creek at Many Glacier, Montana 47 1930 1,020 1976 1,060 0.06 0.80
14 05020500 St. Mary River at international boundary 45 1930 2,900 1976 4,660 1.29 0.05
Streamflow-gaging stations in the Missouri River Basin
Missouri River headwaters tributaries
45 06025500 Big Hole River near Melrose, Montana 46 1930 5,560 1976 10,100 1.73 0.01
80 06043500 Gallatin River near Gallatin Gateway, Montana 46 1931 3,350 1976 6,690 2.17 0.00
88 06052500 Gallatin River at Logan, Montana 46 1930 3,180 1976 6,400 2.15 0.00
Upper Missouri River tributaries
101 06062500 Tenmile Creek near Rimini, Montana 46 1931 161 1976 276 1.55 0.05
161 06099500 Marias River near Shelby, Montana 45 1931 4,980 1976 7,000 0.88 0.23
Musselshell River Basin
212 06120500 Musselshell River at Harlowton, Montana 47 1930 850 1976 1,310 1.15 0.24
Upper Milk River Basin
271 06133000 Milk River at western crossing of international boundary
45 1931 696 1976 1,290 1.86 0.12
Lower Missouri River tributary
386 06178000 Poplar River at international boundary 45 1931 496 1976 935 1.92 0.18
Yellowstone River Basin
414 06186500 Yellowstone River at Yellowstone Lake outlet, Yel-lowstone National Park, Wyoming
47 1930 3,370 1976 6,010 1.67 0.00
424 06191500 Yellowstone River at Corwin Springs, Montana 47 1930 14,100 1976 22,100 1.20 0.00
425 06192500 Yellowstone River near Livingston, Montana 42 1930 15,200 1976 24,800 1.34 0.00
443 06205000 Stillwater River near Absarokee, Montana 42 1935 6,105 1976 7,805 0.66 0.17
445 06207500 Clarks Fork Yellowstone River near Belfry, Montana 47 1930 6,840 1976 8,800 0.61 0.03
448 06208500 Clarks Fork Yellowstone River at Edgar, Montana 46 1930 6,921 1976 8,838 0.59 0.10
458 06214500 Yellowstone River at Billings, Montana 47 1930 33,200 1976 49,600 1.05 0.00
542 06324500 Powder River at Moorhead, Montana 45 1930 6,420 1976 8,050 0.54 0.41
Streamflow-gaging stations in the Columbia River Basin
665 12340500 Clark Fork above Missoula, Montana 47 1930 11,100 1976 20,500 1.82 0.01
688 12353000 Clark Fork below Missoula, Montana 47 1930 21,400 1976 39,600 1.80 0.00
697 12354500 Clark Fork at St. Regis, Montana 47 1930 28,700 1976 49,900 1.57 0.00
698 12355000 Flathead River at Flathead, British Columbia 47 1930 6,220 1976 9,840 1.24 0.01
700 12355500 North Fork Flathead River near Columbia Falls, Montana
47 1930 16,200 1976 25,200 1.19 0.01
728 12370000 Swan River near Bigfork, Montana 47 1930 4,470 1976 5,790 0.63 0.11
12 Temporal Trends and Stationarity for Selected Long-Term Streamflow-Gaging Stations, Montana
Table 2. Results of analysis of temporal trends in annual peak flow (the annual series of maximum instantaneous discharge, in cubic feet per second).–Continued
[All years refer to water year, which is the 12-month period from October 1 through September 30 and is designated by the year in which it ends. Gray shading indicates statistical significance (p-value less than 0.05). p-value, statistical significance; —, not applicable]
Map number (fig. 1)
Station identification
numberStation name
Trend results for the period from 1967 through 2011
Number of years with
data
Start-year
Fitted trend value, in
cubic feet per second
End-year
Fitted trend value, in
cubic feet per second
Trend mag-nitude, in
percent per year
p-value
Streamflow-gaging stations in the Saskatchewan River Basin
9 05014500 Swiftcurrent Creek at Many Glacier, Montana 45 1967 1,010 2011 1,070 0.12 0.81
14 05020500 St. Mary River at international boundary 43 1967 3,700 2011 3,830 0.08 0.83
Streamflow-gaging stations in the Missouri River Basin
Missouri River headwaters tributaries
45 06025500 Big Hole River near Melrose, Montana 45 1967 9,020 2011 6,080 -0.72 0.18
80 06043500 Gallatin River near Gallatin Gateway, Montana 42 1967 6,000 2011 4,970 -0.38 0.22
88 06052500 Gallatin River at Logan, Montana 45 1967 6,430 2011 4,770 -0.58 0.11
Upper Missouri River tributaries
101 06062500 Tenmile Creek near Rimini, Montana 43 1967 231 2011 183 -0.47 0.27
161 06099500 Marias River near Shelby, Montana 45 1967 6,400 2011 4,760 -0.57 0.40
Musselshell River Basin
212 06120500 Musselshell River at Harlowton, Montana 45 1967 1,086 2011 686 -0.82 0.25
Upper Milk River Basin
271 06133000 Milk River at western crossing of international boundary
45 1967 1,000 2011 1,100 0.21 0.84
Lower Missouri River tributary
386 06178000 Poplar River at international boundary 45 1967 934 2011 296 -1.52 0.04
Yellowstone River Basin
414 06186500 Yellowstone River at Yellowstone Lake outlet, Yel-lowstone National Park, Wyoming
42 1967 5,330 2011 4,840 -0.21 0.72
424 06191500 Yellowstone River at Corwin Springs, Montana 45 1967 19,300 2011 19,700 0.06 0.87
425 06192500 Yellowstone River near Livingston, Montana 45 1967 23,600 2011 22,400 -0.11 0.73
443 06205000 Stillwater River near Absarokee, Montana 45 1967 7,411 2011 5,449 -0.59 0.08
445 06207500 Clarks Fork Yellowstone River near Belfry, Montana 45 1967 8,320 2011 7,880 -0.12 0.74
448 06208500 Clarks Fork Yellowstone River at Edgar, Montana 45 1967 8,455 2011 7,205 -0.33 0.29
458 06214500 Yellowstone River at Billings, Montana 45 1967 43,900 2011 35,900 -0.41 0.20
542 06324500 Powder River at Moorhead, Montana 43 1967 6,840 2011 2,440 -1.43 0.01
Streamflow-gaging stations in the Columbia River Basin
665 12340500 Clark Fork above Missoula, Montana 45 1967 16,200 2011 11,400 -0.66 0.07
688 12353000 Clark Fork below Missoula, Montana 45 1967 33,300 2011 23,700 -0.64 0.16
697 12354500 Clark Fork at St. Regis, Montana 45 1967 42,900 2011 30,300 -0.65 0.12
698 12355000 Flathead River at Flathead, British Columbia 39 1967 7,520 2011 6,060 -0.43 0.27
700 12355500 North Fork Flathead River near Columbia Falls, Montana
45 1967 20,300 2011 16,900 -0.37 0.29
728 12370000 Swan River near Bigfork, Montana 45 1967 5,280 2011 4,440 -0.35 0.16
Temporal Trends and Stationarity in Annual Peak Flow and Peak-Flow Timing 13
Table 2. Results of analysis of temporal trends in annual peak flow (the annual series of maximum instantaneous discharge, in cubic feet per second).–Continued
[All years refer to water year, which is the 12-month period from October 1 through September 30 and is designated by the year in which it ends. Gray shading indicates statistical significance (p-value less than 0.05). p-value, statistical significance; —, not applicable]
Map number (fig. 1)
Station identification
numberStation name
Trend results for the period from the start of systematic data collection through 2011
Number of years with
data
Start-year
Fitted trend value, in
cubic feet per second
End-year
Fitted trend value, in
cubic feet per second
Trend mag-nitude, in
percent per year
p-value
Streamflow-gaging stations in the Saskatchewan River Basin
9 05014500 Swiftcurrent Creek at Many Glacier, Montana 99 1913 1,010 2011 1,070 0.06 0.57
14 05020500 St. Mary River at international boundary 95 1915 4,050 2011 3,900 -0.04 0.79
Streamflow-gaging stations in the Missouri River Basin
Missouri River headwaters tributaries
45 06025500 Big Hole River near Melrose, Montana 87 1924 7,570 2011 7,430 -0.02 0.93
80 06043500 Gallatin River near Gallatin Gateway, Montana 78 1931 4,440 2011 5,780 0.37 0.03
88 06052500 Gallatin River at Logan, Montana 82 1929 4,160 2011 5,780 0.47 0.02
Upper Missouri River tributaries
101 06062500 Tenmile Creek near Rimini, Montana 95 1915 241 2011 186 -0.23 0.20
161 06099500 Marias River near Shelby, Montana 105 1902 6,480 2011 5,160 -0.19 0.29
Musselshell River Basin
212 06120500 Musselshell River at Harlowton, Montana 103 1909 1,300 2011 840 -0.34 0.09
Upper Milk River Basin
271 06133000 Milk River at western crossing of international boundary
80 1931 919 2011 1,130 0.28 0.51
Lower Missouri River tributary
386 06178000 Poplar River at international boundary 80 1931 698 2011 490 -0.37 0.25
Yellowstone River Basin
414 06186500 Yellowstone River at Yellowstone Lake outlet, Yel-lowstone National Park, Wyoming
86 1923 4,160 2011 5,340 0.32 0.09
424 06191500 Yellowstone River at Corwin Springs, Montana 101 1911 16,000 2011 19,600 0.22 0.08
425 06192500 Yellowstone River near Livingston, Montana 78 1929 17,600 2011 22,800 0.35 0.04
443 06205000 Stillwater River near Absarokee, Montana 77 1935 6,818 2011 6,162 -0.12 0.48
445 06207500 Clarks Fork Yellowstone River near Belfry, Montana 90 1922 7,280 2011 8,270 0.15 0.20
448 06208500 Clarks Fork Yellowstone River at Edgar, Montana 89 1922 7,723 2011 7,935 0.03 0.77
458 06214500 Yellowstone River at Billings, Montana 83 1929 37,600 2011 41,800 0.14 0.34
542 06324500 Powder River at Moorhead, Montana 81 1929 7,870 2011 3,470 -0.67 0.00
Streamflow-gaging stations in the Columbia River Basin
665 12340500 Clark Fork above Missoula, Montana 82 1930 15,000 2011 13,400 -0.13 0.55
688 12353000 Clark Fork below Missoula, Montana 82 1930 27,700 2011 28,300 0.03 0.89
697 12354500 Clark Fork at St. Regis, Montana 96 1911 38,200 2011 34,200 -0.10 0.46
698 12355000 Flathead River at Flathead, British Columbia 77 1929 7,180 2011 7,150 -0.01 0.96
700 12355500 North Fork Flathead River near Columbia Falls, Montana
83 1929 19,700 2011 18,900 -0.05 0.72
728 12370000 Swan River near Bigfork, Montana 90 1922 5,310 2011 4,730 -0.12 0.25
14 Temporal Trends and Stationarity for Selected Long-Term Streamflow-Gaging Stations, Montana
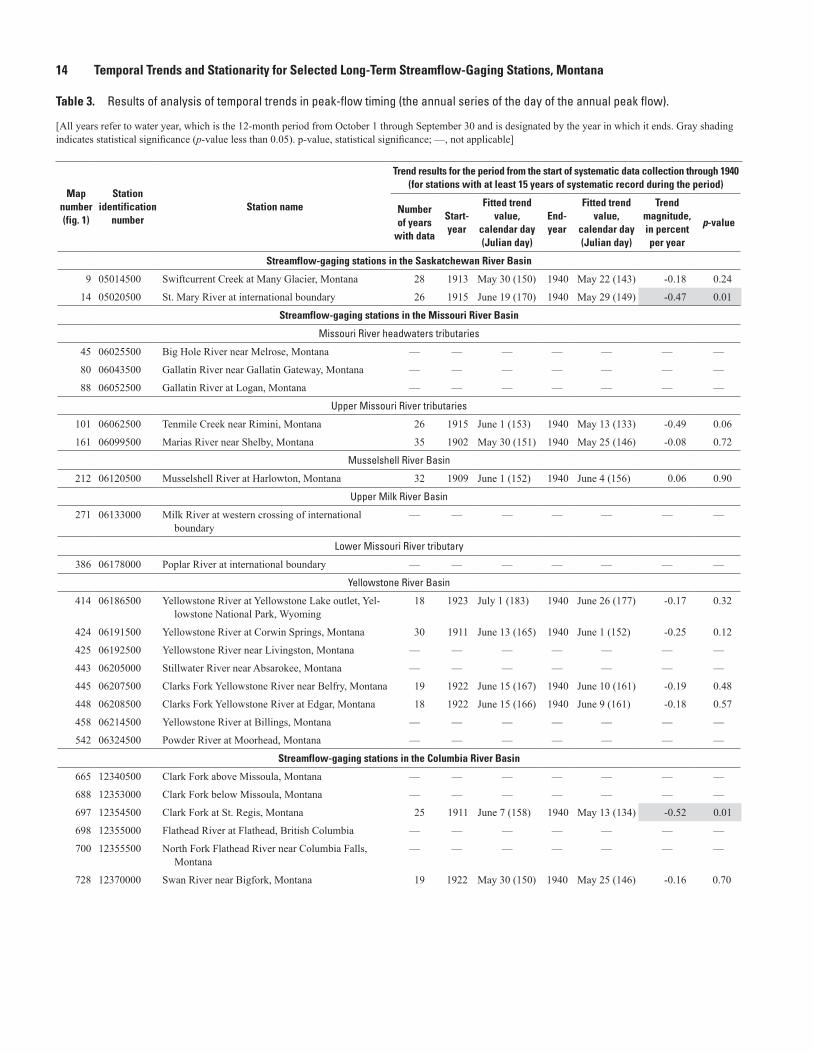
Table 3. Results of analysis of temporal trends in peak-flow timing (the annual series of the day of the annual peak flow).
[All years refer to water year, which is the 12-month period from October 1 through September 30 and is designated by the year in which it ends. Gray shading indicates statistical significance (p-value less than 0.05). p-value, statistical significance; —, not applicable]
Map number (fig. 1)
Station identification
numberStation name
Trend results for the period from the start of systematic data collection through 1940 (for stations with at least 15 years of systematic record during the period)
Number of years
with data
Start-year
Fitted trend value,
calendar day (Julian day)
End-year
Fitted trend value,
calendar day (Julian day)
Trend magnitude, in percent per year
p-value
Streamflow-gaging stations in the Saskatchewan River Basin
9 05014500 Swiftcurrent Creek at Many Glacier, Montana 28 1913 May 30 (150) 1940 May 22 (143) -0.18 0.24
14 05020500 St. Mary River at international boundary 26 1915 June 19 (170) 1940 May 29 (149) -0.47 0.01
Streamflow-gaging stations in the Missouri River Basin
Missouri River headwaters tributaries
45 06025500 Big Hole River near Melrose, Montana — — — — — — —
80 06043500 Gallatin River near Gallatin Gateway, Montana — — — — — — —
88 06052500 Gallatin River at Logan, Montana — — — — — — —
Upper Missouri River tributaries
101 06062500 Tenmile Creek near Rimini, Montana 26 1915 June 1 (153) 1940 May 13 (133) -0.49 0.06
161 06099500 Marias River near Shelby, Montana 35 1902 May 30 (151) 1940 May 25 (146) -0.08 0.72
Musselshell River Basin
212 06120500 Musselshell River at Harlowton, Montana 32 1909 June 1 (152) 1940 June 4 (156) 0.06 0.90
Upper Milk River Basin
271 06133000 Milk River at western crossing of international boundary
— — — — — — —
Lower Missouri River tributary
386 06178000 Poplar River at international boundary — — — — — — —
Yellowstone River Basin
414 06186500 Yellowstone River at Yellowstone Lake outlet, Yel-lowstone National Park, Wyoming
18 1923 July 1 (183) 1940 June 26 (177) -0.17 0.32
424 06191500 Yellowstone River at Corwin Springs, Montana 30 1911 June 13 (165) 1940 June 1 (152) -0.25 0.12
425 06192500 Yellowstone River near Livingston, Montana — — — — — — —
443 06205000 Stillwater River near Absarokee, Montana — — — — — — —
445 06207500 Clarks Fork Yellowstone River near Belfry, Montana 19 1922 June 15 (167) 1940 June 10 (161) -0.19 0.48
448 06208500 Clarks Fork Yellowstone River at Edgar, Montana 18 1922 June 15 (166) 1940 June 9 (161) -0.18 0.57
458 06214500 Yellowstone River at Billings, Montana — — — — — — —
542 06324500 Powder River at Moorhead, Montana — — — — — — —
Streamflow-gaging stations in the Columbia River Basin
665 12340500 Clark Fork above Missoula, Montana — — — — — — —
688 12353000 Clark Fork below Missoula, Montana — — — — — — —
697 12354500 Clark Fork at St. Regis, Montana 25 1911 June 7 (158) 1940 May 13 (134) -0.52 0.01
698 12355000 Flathead River at Flathead, British Columbia — — — — — — —
700 12355500 North Fork Flathead River near Columbia Falls, Montana
— — — — — — —
728 12370000 Swan River near Bigfork, Montana 19 1922 May 30 (150) 1940 May 25 (146) -0.16 0.70
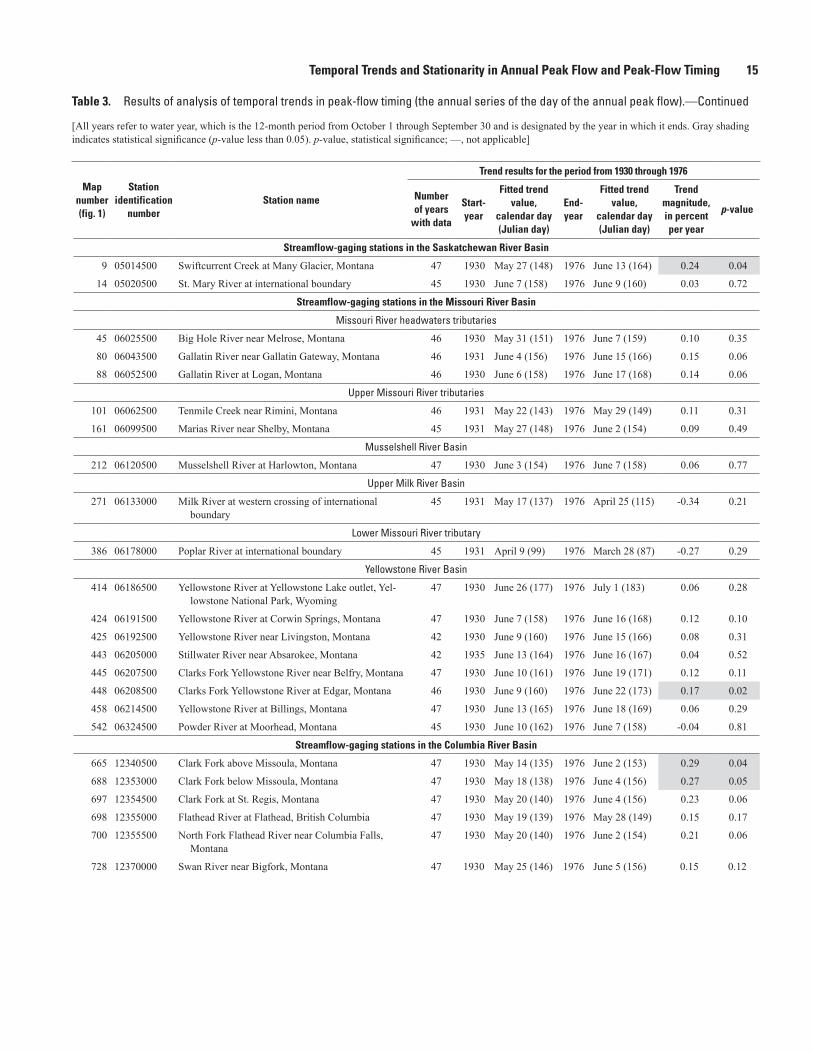
Temporal Trends and Stationarity in Annual Peak Flow and Peak-Flow Timing 15
Table 3. Results of analysis of temporal trends in peak-flow timing (the annual series of the day of the annual peak flow).—Continued
[All years refer to water year, which is the 12-month period from October 1 through September 30 and is designated by the year in which it ends. Gray shading indicates statistical significance (p-value less than 0.05). p-value, statistical significance; —, not applicable]
Map number (fig. 1)
Station identification
numberStation name
Trend results for the period from 1930 through 1976
Number of years
with data
Start-year
Fitted trend value,
calendar day (Julian day)
End-year
Fitted trend value,
calendar day (Julian day)
Trend magnitude, in percent per year
p-value
Streamflow-gaging stations in the Saskatchewan River Basin
9 05014500 Swiftcurrent Creek at Many Glacier, Montana 47 1930 May 27 (148) 1976 June 13 (164) 0.24 0.04
14 05020500 St. Mary River at international boundary 45 1930 June 7 (158) 1976 June 9 (160) 0.03 0.72
Streamflow-gaging stations in the Missouri River Basin
Missouri River headwaters tributaries
45 06025500 Big Hole River near Melrose, Montana 46 1930 May 31 (151) 1976 June 7 (159) 0.10 0.35
80 06043500 Gallatin River near Gallatin Gateway, Montana 46 1931 June 4 (156) 1976 June 15 (166) 0.15 0.06
88 06052500 Gallatin River at Logan, Montana 46 1930 June 6 (158) 1976 June 17 (168) 0.14 0.06
Upper Missouri River tributaries
101 06062500 Tenmile Creek near Rimini, Montana 46 1931 May 22 (143) 1976 May 29 (149) 0.11 0.31
161 06099500 Marias River near Shelby, Montana 45 1931 May 27 (148) 1976 June 2 (154) 0.09 0.49
Musselshell River Basin
212 06120500 Musselshell River at Harlowton, Montana 47 1930 June 3 (154) 1976 June 7 (158) 0.06 0.77
Upper Milk River Basin
271 06133000 Milk River at western crossing of international boundary
45 1931 May 17 (137) 1976 April 25 (115) -0.34 0.21
Lower Missouri River tributary
386 06178000 Poplar River at international boundary 45 1931 April 9 (99) 1976 March 28 (87) -0.27 0.29
Yellowstone River Basin
414 06186500 Yellowstone River at Yellowstone Lake outlet, Yel-lowstone National Park, Wyoming
47 1930 June 26 (177) 1976 July 1 (183) 0.06 0.28
424 06191500 Yellowstone River at Corwin Springs, Montana 47 1930 June 7 (158) 1976 June 16 (168) 0.12 0.10
425 06192500 Yellowstone River near Livingston, Montana 42 1930 June 9 (160) 1976 June 15 (166) 0.08 0.31
443 06205000 Stillwater River near Absarokee, Montana 42 1935 June 13 (164) 1976 June 16 (167) 0.04 0.52
445 06207500 Clarks Fork Yellowstone River near Belfry, Montana 47 1930 June 10 (161) 1976 June 19 (171) 0.12 0.11
448 06208500 Clarks Fork Yellowstone River at Edgar, Montana 46 1930 June 9 (160) 1976 June 22 (173) 0.17 0.02
458 06214500 Yellowstone River at Billings, Montana 47 1930 June 13 (165) 1976 June 18 (169) 0.06 0.29
542 06324500 Powder River at Moorhead, Montana 45 1930 June 10 (162) 1976 June 7 (158) -0.04 0.81
Streamflow-gaging stations in the Columbia River Basin
665 12340500 Clark Fork above Missoula, Montana 47 1930 May 14 (135) 1976 June 2 (153) 0.29 0.04
688 12353000 Clark Fork below Missoula, Montana 47 1930 May 18 (138) 1976 June 4 (156) 0.27 0.05
697 12354500 Clark Fork at St. Regis, Montana 47 1930 May 20 (140) 1976 June 4 (156) 0.23 0.06
698 12355000 Flathead River at Flathead, British Columbia 47 1930 May 19 (139) 1976 May 28 (149) 0.15 0.17
700 12355500 North Fork Flathead River near Columbia Falls, Montana
47 1930 May 20 (140) 1976 June 2 (154) 0.21 0.06
728 12370000 Swan River near Bigfork, Montana 47 1930 May 25 (146) 1976 June 5 (156) 0.15 0.12
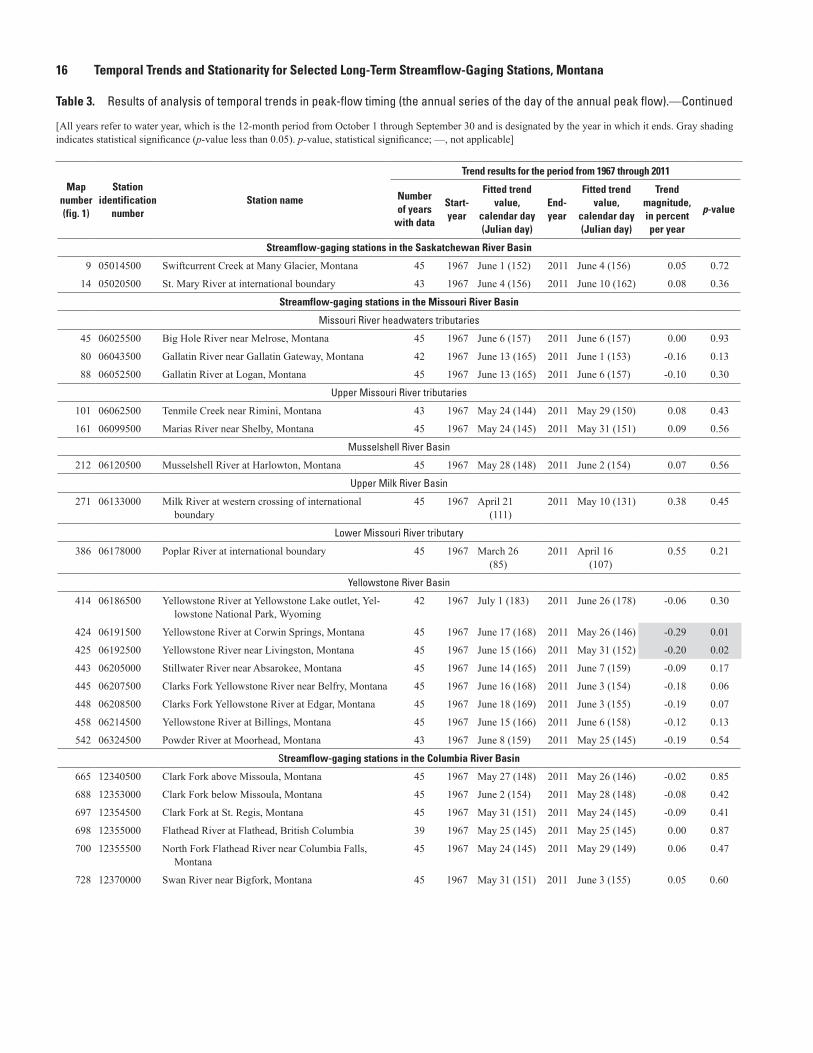
16 Temporal Trends and Stationarity for Selected Long-Term Streamflow-Gaging Stations, Montana
Table 3. Results of analysis of temporal trends in peak-flow timing (the annual series of the day of the annual peak flow).—Continued
[All years refer to water year, which is the 12-month period from October 1 through September 30 and is designated by the year in which it ends. Gray shading indicates statistical significance (p-value less than 0.05). p-value, statistical significance; —, not applicable]
Map number (fig. 1)
Station identification
numberStation name
Trend results for the period from 1967 through 2011
Number of years
with data
Start-year
Fitted trend value,
calendar day (Julian day)
End-year
Fitted trend value,
calendar day (Julian day)
Trend magnitude, in percent per year
p-value
Streamflow-gaging stations in the Saskatchewan River Basin
9 05014500 Swiftcurrent Creek at Many Glacier, Montana 45 1967 June 1 (152) 2011 June 4 (156) 0.05 0.72
14 05020500 St. Mary River at international boundary 43 1967 June 4 (156) 2011 June 10 (162) 0.08 0.36
Streamflow-gaging stations in the Missouri River Basin
Missouri River headwaters tributaries
45 06025500 Big Hole River near Melrose, Montana 45 1967 June 6 (157) 2011 June 6 (157) 0.00 0.93
80 06043500 Gallatin River near Gallatin Gateway, Montana 42 1967 June 13 (165) 2011 June 1 (153) -0.16 0.13
88 06052500 Gallatin River at Logan, Montana 45 1967 June 13 (165) 2011 June 6 (157) -0.10 0.30
Upper Missouri River tributaries
101 06062500 Tenmile Creek near Rimini, Montana 43 1967 May 24 (144) 2011 May 29 (150) 0.08 0.43
161 06099500 Marias River near Shelby, Montana 45 1967 May 24 (145) 2011 May 31 (151) 0.09 0.56
Musselshell River Basin
212 06120500 Musselshell River at Harlowton, Montana 45 1967 May 28 (148) 2011 June 2 (154) 0.07 0.56
Upper Milk River Basin
271 06133000 Milk River at western crossing of international boundary
45 1967 April 21 (111)
2011 May 10 (131) 0.38 0.45
Lower Missouri River tributary
386 06178000 Poplar River at international boundary 45 1967 March 26 (85)
2011 April 16 (107)
0.55 0.21
Yellowstone River Basin
414 06186500 Yellowstone River at Yellowstone Lake outlet, Yel-lowstone National Park, Wyoming
42 1967 July 1 (183) 2011 June 26 (178) -0.06 0.30
424 06191500 Yellowstone River at Corwin Springs, Montana 45 1967 June 17 (168) 2011 May 26 (146) -0.29 0.01
425 06192500 Yellowstone River near Livingston, Montana 45 1967 June 15 (166) 2011 May 31 (152) -0.20 0.02
443 06205000 Stillwater River near Absarokee, Montana 45 1967 June 14 (165) 2011 June 7 (159) -0.09 0.17
445 06207500 Clarks Fork Yellowstone River near Belfry, Montana 45 1967 June 16 (168) 2011 June 3 (154) -0.18 0.06
448 06208500 Clarks Fork Yellowstone River at Edgar, Montana 45 1967 June 18 (169) 2011 June 3 (155) -0.19 0.07
458 06214500 Yellowstone River at Billings, Montana 45 1967 June 15 (166) 2011 June 6 (158) -0.12 0.13
542 06324500 Powder River at Moorhead, Montana 43 1967 June 8 (159) 2011 May 25 (145) -0.19 0.54
Streamflow-gaging stations in the Columbia River Basin
665 12340500 Clark Fork above Missoula, Montana 45 1967 May 27 (148) 2011 May 26 (146) -0.02 0.85
688 12353000 Clark Fork below Missoula, Montana 45 1967 June 2 (154) 2011 May 28 (148) -0.08 0.42
697 12354500 Clark Fork at St. Regis, Montana 45 1967 May 31 (151) 2011 May 24 (145) -0.09 0.41
698 12355000 Flathead River at Flathead, British Columbia 39 1967 May 25 (145) 2011 May 25 (145) 0.00 0.87
700 12355500 North Fork Flathead River near Columbia Falls, Montana
45 1967 May 24 (145) 2011 May 29 (149) 0.06 0.47
728 12370000 Swan River near Bigfork, Montana 45 1967 May 31 (151) 2011 June 3 (155) 0.05 0.60
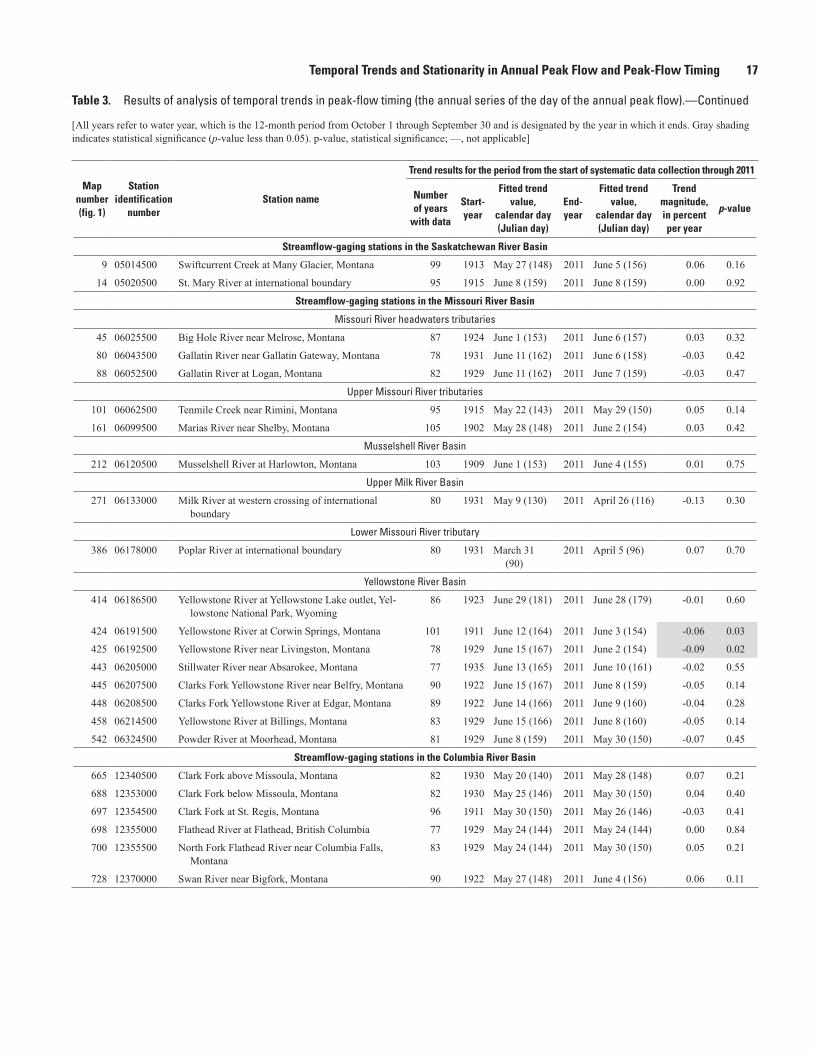
Temporal Trends and Stationarity in Annual Peak Flow and Peak-Flow Timing 17
Table 3. Results of analysis of temporal trends in peak-flow timing (the annual series of the day of the annual peak flow).—Continued
[All years refer to water year, which is the 12-month period from October 1 through September 30 and is designated by the year in which it ends. Gray shading indicates statistical significance (p-value less than 0.05). p-value, statistical significance; —, not applicable]
Map number (fig. 1)
Station identification
numberStation name
Trend results for the period from the start of systematic data collection through 2011
Number of years
with data
Start-year
Fitted trend value,
calendar day (Julian day)
End-year
Fitted trend value,
calendar day (Julian day)
Trend magnitude, in percent per year
p-value
Streamflow-gaging stations in the Saskatchewan River Basin
9 05014500 Swiftcurrent Creek at Many Glacier, Montana 99 1913 May 27 (148) 2011 June 5 (156) 0.06 0.16
14 05020500 St. Mary River at international boundary 95 1915 June 8 (159) 2011 June 8 (159) 0.00 0.92
Streamflow-gaging stations in the Missouri River Basin
Missouri River headwaters tributaries
45 06025500 Big Hole River near Melrose, Montana 87 1924 June 1 (153) 2011 June 6 (157) 0.03 0.32
80 06043500 Gallatin River near Gallatin Gateway, Montana 78 1931 June 11 (162) 2011 June 6 (158) -0.03 0.42
88 06052500 Gallatin River at Logan, Montana 82 1929 June 11 (162) 2011 June 7 (159) -0.03 0.47
Upper Missouri River tributaries
101 06062500 Tenmile Creek near Rimini, Montana 95 1915 May 22 (143) 2011 May 29 (150) 0.05 0.14
161 06099500 Marias River near Shelby, Montana 105 1902 May 28 (148) 2011 June 2 (154) 0.03 0.42
Musselshell River Basin
212 06120500 Musselshell River at Harlowton, Montana 103 1909 June 1 (153) 2011 June 4 (155) 0.01 0.75
Upper Milk River Basin
271 06133000 Milk River at western crossing of international boundary
80 1931 May 9 (130) 2011 April 26 (116) -0.13 0.30
Lower Missouri River tributary
386 06178000 Poplar River at international boundary 80 1931 March 31 (90)
2011 April 5 (96) 0.07 0.70
Yellowstone River Basin
414 06186500 Yellowstone River at Yellowstone Lake outlet, Yel-lowstone National Park, Wyoming
86 1923 June 29 (181) 2011 June 28 (179) -0.01 0.60
424 06191500 Yellowstone River at Corwin Springs, Montana 101 1911 June 12 (164) 2011 June 3 (154) -0.06 0.03
425 06192500 Yellowstone River near Livingston, Montana 78 1929 June 15 (167) 2011 June 2 (154) -0.09 0.02
443 06205000 Stillwater River near Absarokee, Montana 77 1935 June 13 (165) 2011 June 10 (161) -0.02 0.55
445 06207500 Clarks Fork Yellowstone River near Belfry, Montana 90 1922 June 15 (167) 2011 June 8 (159) -0.05 0.14
448 06208500 Clarks Fork Yellowstone River at Edgar, Montana 89 1922 June 14 (166) 2011 June 9 (160) -0.04 0.28
458 06214500 Yellowstone River at Billings, Montana 83 1929 June 15 (166) 2011 June 8 (160) -0.05 0.14
542 06324500 Powder River at Moorhead, Montana 81 1929 June 8 (159) 2011 May 30 (150) -0.07 0.45
Streamflow-gaging stations in the Columbia River Basin
665 12340500 Clark Fork above Missoula, Montana 82 1930 May 20 (140) 2011 May 28 (148) 0.07 0.21
688 12353000 Clark Fork below Missoula, Montana 82 1930 May 25 (146) 2011 May 30 (150) 0.04 0.40
697 12354500 Clark Fork at St. Regis, Montana 96 1911 May 30 (150) 2011 May 26 (146) -0.03 0.41
698 12355000 Flathead River at Flathead, British Columbia 77 1929 May 24 (144) 2011 May 24 (144) 0.00 0.84
700 12355500 North Fork Flathead River near Columbia Falls, Montana
83 1929 May 24 (144) 2011 May 30 (150) 0.05 0.21
728 12370000 Swan River near Bigfork, Montana 90 1922 May 27 (148) 2011 June 4 (156) 0.06 0.11
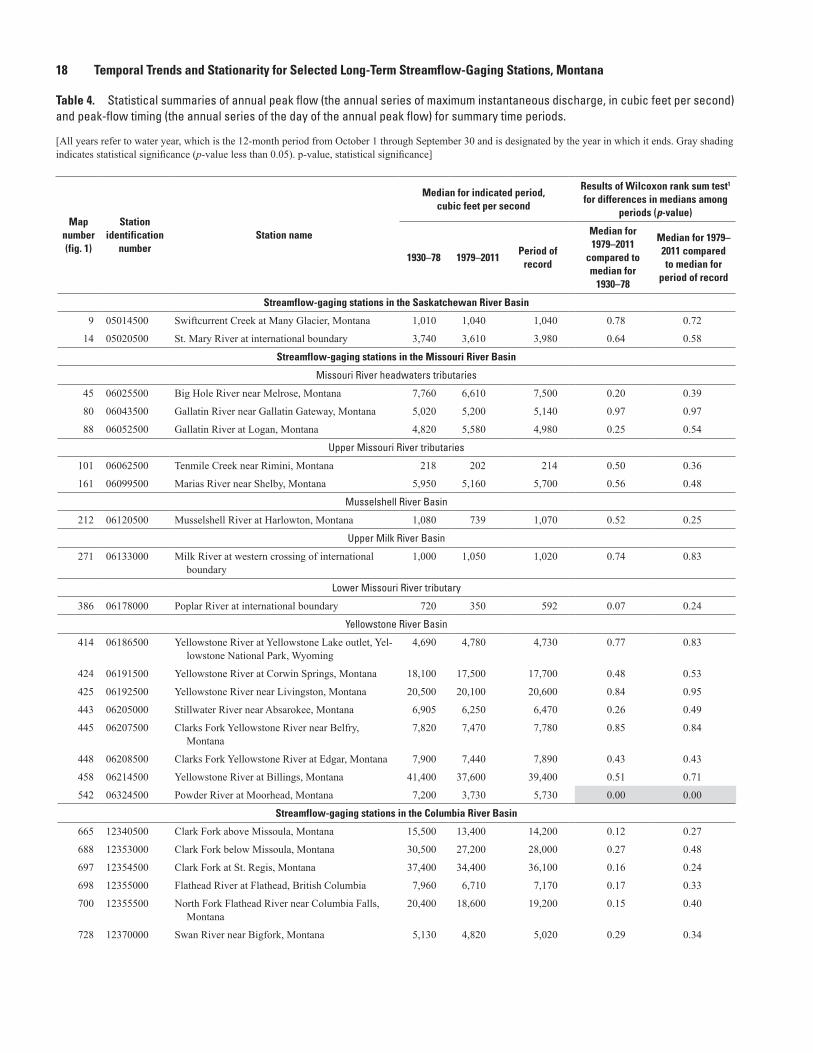
18 Temporal Trends and Stationarity for Selected Long-Term Streamflow-Gaging Stations, Montana
Table 4. Statistical summaries of annual peak flow (the annual series of maximum instantaneous discharge, in cubic feet per second) and peak-flow timing (the annual series of the day of the annual peak flow) for summary time periods.
[All years refer to water year, which is the 12-month period from October 1 through September 30 and is designated by the year in which it ends. Gray shading indicates statistical significance (p-value less than 0.05). p-value, statistical significance]
Map number (fig. 1)
Station identification
numberStation name
Median for indicated period,cubic feet per second
Results of Wilcoxon rank sum test1 for differences in medians among
periods (p-value)
1930–78 1979–2011Period of
record
Median for 1979–2011
compared to median for
1930–78
Median for 1979–2011 compared to median for
period of record
Streamflow-gaging stations in the Saskatchewan River Basin
9 05014500 Swiftcurrent Creek at Many Glacier, Montana 1,010 1,040 1,040 0.78 0.72
14 05020500 St. Mary River at international boundary 3,740 3,610 3,980 0.64 0.58
Streamflow-gaging stations in the Missouri River Basin
Missouri River headwaters tributaries
45 06025500 Big Hole River near Melrose, Montana 7,760 6,610 7,500 0.20 0.39
80 06043500 Gallatin River near Gallatin Gateway, Montana 5,020 5,200 5,140 0.97 0.97
88 06052500 Gallatin River at Logan, Montana 4,820 5,580 4,980 0.25 0.54
Upper Missouri River tributaries
101 06062500 Tenmile Creek near Rimini, Montana 218 202 214 0.50 0.36
161 06099500 Marias River near Shelby, Montana 5,950 5,160 5,700 0.56 0.48
Musselshell River Basin
212 06120500 Musselshell River at Harlowton, Montana 1,080 739 1,070 0.52 0.25
Upper Milk River Basin
271 06133000 Milk River at western crossing of international boundary
1,000 1,050 1,020 0.74 0.83
Lower Missouri River tributary
386 06178000 Poplar River at international boundary 720 350 592 0.07 0.24
Yellowstone River Basin
414 06186500 Yellowstone River at Yellowstone Lake outlet, Yel-lowstone National Park, Wyoming
4,690 4,780 4,730 0.77 0.83
424 06191500 Yellowstone River at Corwin Springs, Montana 18,100 17,500 17,700 0.48 0.53
425 06192500 Yellowstone River near Livingston, Montana 20,500 20,100 20,600 0.84 0.95
443 06205000 Stillwater River near Absarokee, Montana 6,905 6,250 6,470 0.26 0.49
445 06207500 Clarks Fork Yellowstone River near Belfry, Montana
7,820 7,470 7,780 0.85 0.84
448 06208500 Clarks Fork Yellowstone River at Edgar, Montana 7,900 7,440 7,890 0.43 0.43
458 06214500 Yellowstone River at Billings, Montana 41,400 37,600 39,400 0.51 0.71
542 06324500 Powder River at Moorhead, Montana 7,200 3,730 5,730 0.00 0.00
Streamflow-gaging stations in the Columbia River Basin
665 12340500 Clark Fork above Missoula, Montana 15,500 13,400 14,200 0.12 0.27
688 12353000 Clark Fork below Missoula, Montana 30,500 27,200 28,000 0.27 0.48
697 12354500 Clark Fork at St. Regis, Montana 37,400 34,400 36,100 0.16 0.24
698 12355000 Flathead River at Flathead, British Columbia 7,960 6,710 7,170 0.17 0.33
700 12355500 North Fork Flathead River near Columbia Falls, Montana
20,400 18,600 19,200 0.15 0.40
728 12370000 Swan River near Bigfork, Montana 5,130 4,820 5,020 0.29 0.34
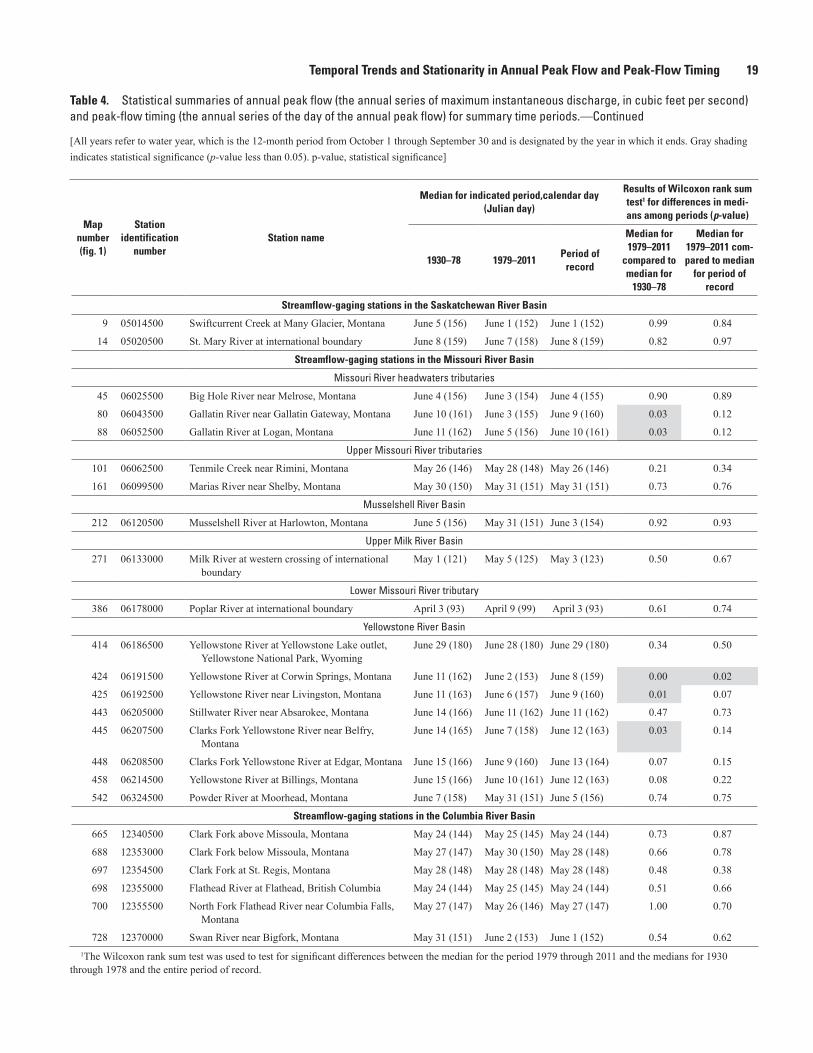
Temporal Trends and Stationarity in Annual Peak Flow and Peak-Flow Timing 19
Table 4. Statistical summaries of annual peak flow (the annual series of maximum instantaneous discharge, in cubic feet per second) and peak-flow timing (the annual series of the day of the annual peak flow) for summary time periods.—Continued
[All years refer to water year, which is the 12-month period from October 1 through September 30 and is designated by the year in which it ends. Gray shading indicates statistical significance (p-value less than 0.05). p-value, statistical significance]
Map number (fig. 1)
Station identification
numberStation name
Median for indicated period,calendar day (Julian day)
Results of Wilcoxon rank sum test1 for differences in medi-ans among periods (p-value)
1930–78 1979–2011Period of
record
Median for 1979–2011
compared to median for
1930–78
Median for 1979–2011 com-pared to median
for period of record
Streamflow-gaging stations in the Saskatchewan River Basin
9 05014500 Swiftcurrent Creek at Many Glacier, Montana June 5 (156) June 1 (152) June 1 (152) 0.99 0.84
14 05020500 St. Mary River at international boundary June 8 (159) June 7 (158) June 8 (159) 0.82 0.97
Streamflow-gaging stations in the Missouri River Basin
Missouri River headwaters tributaries
45 06025500 Big Hole River near Melrose, Montana June 4 (156) June 3 (154) June 4 (155) 0.90 0.89
80 06043500 Gallatin River near Gallatin Gateway, Montana June 10 (161) June 3 (155) June 9 (160) 0.03 0.12
88 06052500 Gallatin River at Logan, Montana June 11 (162) June 5 (156) June 10 (161) 0.03 0.12
Upper Missouri River tributaries
101 06062500 Tenmile Creek near Rimini, Montana May 26 (146) May 28 (148) May 26 (146) 0.21 0.34
161 06099500 Marias River near Shelby, Montana May 30 (150) May 31 (151) May 31 (151) 0.73 0.76
Musselshell River Basin
212 06120500 Musselshell River at Harlowton, Montana June 5 (156) May 31 (151) June 3 (154) 0.92 0.93
Upper Milk River Basin
271 06133000 Milk River at western crossing of international boundary
May 1 (121) May 5 (125) May 3 (123) 0.50 0.67
Lower Missouri River tributary
386 06178000 Poplar River at international boundary April 3 (93) April 9 (99) April 3 (93) 0.61 0.74
Yellowstone River Basin
414 06186500 Yellowstone River at Yellowstone Lake outlet, Yellowstone National Park, Wyoming
June 29 (180) June 28 (180) June 29 (180) 0.34 0.50
424 06191500 Yellowstone River at Corwin Springs, Montana June 11 (162) June 2 (153) June 8 (159) 0.00 0.02
425 06192500 Yellowstone River near Livingston, Montana June 11 (163) June 6 (157) June 9 (160) 0.01 0.07
443 06205000 Stillwater River near Absarokee, Montana June 14 (166) June 11 (162) June 11 (162) 0.47 0.73
445 06207500 Clarks Fork Yellowstone River near Belfry, Montana
June 14 (165) June 7 (158) June 12 (163) 0.03 0.14
448 06208500 Clarks Fork Yellowstone River at Edgar, Montana June 15 (166) June 9 (160) June 13 (164) 0.07 0.15
458 06214500 Yellowstone River at Billings, Montana June 15 (166) June 10 (161) June 12 (163) 0.08 0.22
542 06324500 Powder River at Moorhead, Montana June 7 (158) May 31 (151) June 5 (156) 0.74 0.75
Streamflow-gaging stations in the Columbia River Basin
665 12340500 Clark Fork above Missoula, Montana May 24 (144) May 25 (145) May 24 (144) 0.73 0.87
688 12353000 Clark Fork below Missoula, Montana May 27 (147) May 30 (150) May 28 (148) 0.66 0.78
697 12354500 Clark Fork at St. Regis, Montana May 28 (148) May 28 (148) May 28 (148) 0.48 0.38
698 12355000 Flathead River at Flathead, British Columbia May 24 (144) May 25 (145) May 24 (144) 0.51 0.66
700 12355500 North Fork Flathead River near Columbia Falls, Montana
May 27 (147) May 26 (146) May 27 (147) 1.00 0.70
728 12370000 Swan River near Bigfork, Montana May 31 (151) June 2 (153) June 1 (152) 0.54 0.621The Wilcoxon rank sum test was used to test for significant differences between the median for the period 1979 through 2011 and the medians for 1930
through 1978 and the entire period of record.
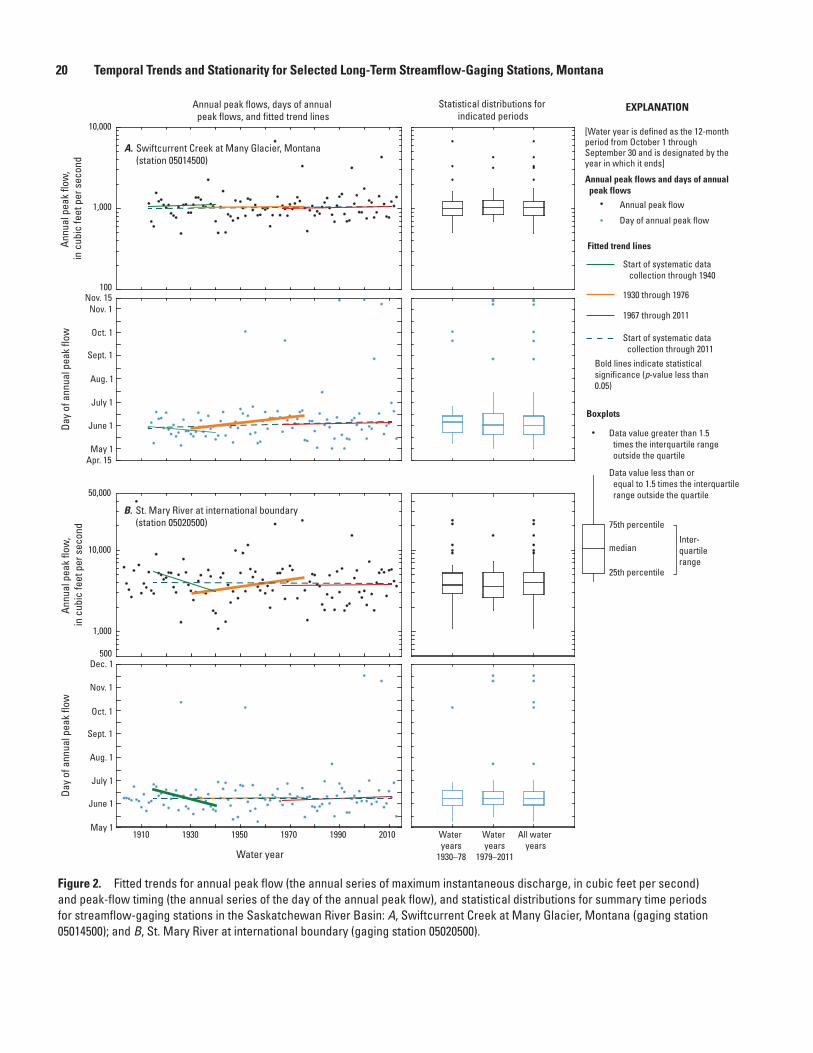
20 Temporal Trends and Stationarity for Selected Long-Term Streamflow-Gaging Stations, MontanaDa
y of
ann
ual p
eak
flow
Annu
al p
eak
flow
, in
cub
ic fe
et p
er s
econ
d
May 1Apr. 15
June 1
July 1
Aug. 1
Sept. 1
Oct. 1
Nov. 1Nov. 15
100
1,000
10,000
Day
of a
nnua
l pea
k flo
wAn
nual
pea
k flo
w,
in c
ubic
feet
per
sec
ond
May 1
June 1
July 1
Aug. 1
Sept. 1
Oct. 1
Nov. 1
Dec. 1500
1,000
10,000
50,000
Swiftcurrent Creek at Many Glacier, Montana(station 05014500)
St. Mary River at international boundary(station 05020500)
[Water year is defined as the 12-month period from October 1 through September 30 and is designated by the year in which it ends]
Annual peak flows and days of annual peak flows
Boxplots
Fitted trend lines
Start of systematic data collection through 1940
Start of systematic data collection through 2011
1930 through 1976
Annual peak flow
Day of annual peak flow
1967 through 2011
75th percentile
median
25th percentile
Data value less than or equal to 1.5 times the interquartile range outside the quartile
Data value greater than 1.5 times the interquartile range outside the quartile
Inter-quartilerange
Bold lines indicate statistical significance (p-value less than 0.05)
EXPLANATION
Water years
1930–78
Water years
1979–2011
All water years
1910 1930 1950 1970 1990 2010
Water year
A.
B.
Statistical distributions for indicated periods
Annual peak flows, days of annual peak flows, and fitted trend lines
Figure 2. Fitted trends for annual peak flow (the annual series of maximum instantaneous discharge, in cubic feet per second) and peak-flow timing (the annual series of the day of the annual peak flow), and statistical distributions for summary time periods for streamflow-gaging stations in the Saskatchewan River Basin: A, Swiftcurrent Creek at Many Glacier, Montana (gaging station 05014500); and B, St. Mary River at international boundary (gaging station 05020500).
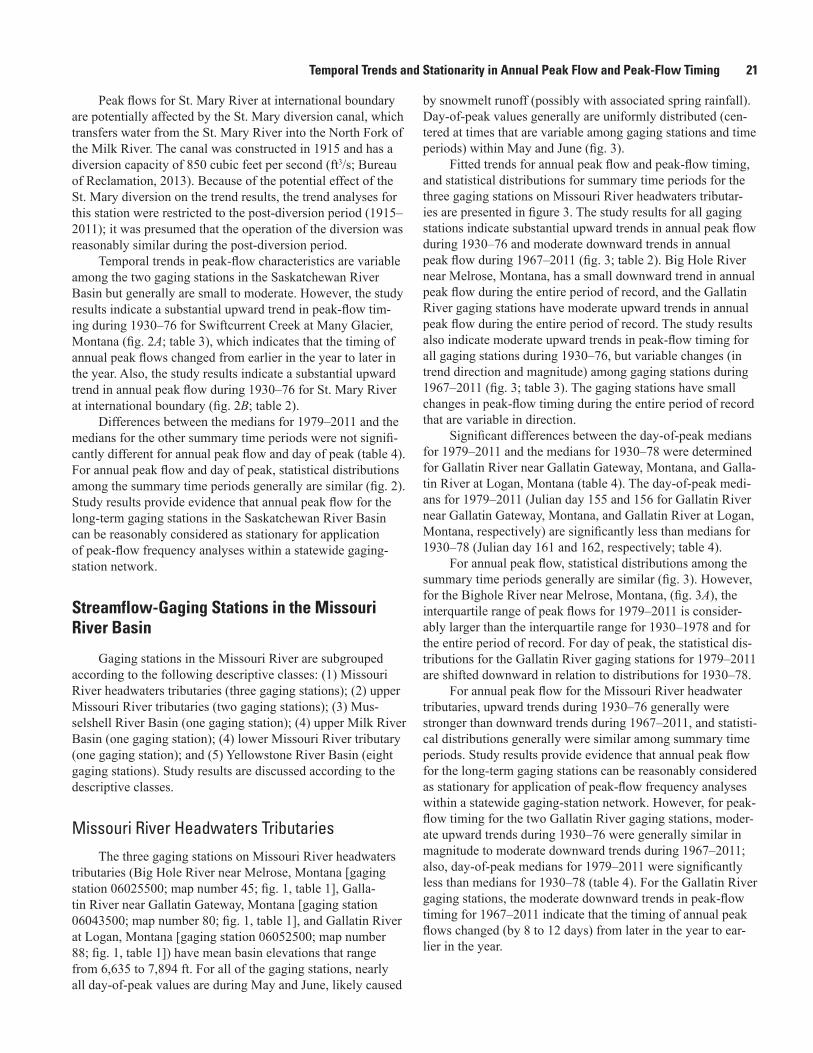
Temporal Trends and Stationarity in Annual Peak Flow and Peak-Flow Timing 21
Peak flows for St. Mary River at international boundary are potentially affected by the St. Mary diversion canal, which transfers water from the St. Mary River into the North Fork of the Milk River. The canal was constructed in 1915 and has a diversion capacity of 850 cubic feet per second (ft3/s; Bureau of Reclamation, 2013). Because of the potential effect of the St. Mary diversion on the trend results, the trend analyses for this station were restricted to the post-diversion period (1915–2011); it was presumed that the operation of the diversion was reasonably similar during the post-diversion period.
Temporal trends in peak-flow characteristics are variable among the two gaging stations in the Saskatchewan River Basin but generally are small to moderate. However, the study results indicate a substantial upward trend in peak-flow tim-ing during 1930–76 for Swiftcurrent Creek at Many Glacier, Montana (fig. 2A; table 3), which indicates that the timing of annual peak flows changed from earlier in the year to later in the year. Also, the study results indicate a substantial upward trend in annual peak flow during 1930–76 for St. Mary River at international boundary (fig. 2B; table 2).
Differences between the medians for 1979–2011 and the medians for the other summary time periods were not signifi-cantly different for annual peak flow and day of peak (table 4). For annual peak flow and day of peak, statistical distributions among the summary time periods generally are similar (fig. 2). Study results provide evidence that annual peak flow for the long-term gaging stations in the Saskatchewan River Basin can be reasonably considered as stationary for application of peak-flow frequency analyses within a statewide gaging-station network.
Streamflow-Gaging Stations in the Missouri River Basin
Gaging stations in the Missouri River are subgrouped according to the following descriptive classes: (1) Missouri River headwaters tributaries (three gaging stations); (2) upper Missouri River tributaries (two gaging stations); (3) Mus-selshell River Basin (one gaging station); (4) upper Milk River Basin (one gaging station); (4) lower Missouri River tributary (one gaging station); and (5) Yellowstone River Basin (eight gaging stations). Study results are discussed according to the descriptive classes.
Missouri River Headwaters TributariesThe three gaging stations on Missouri River headwaters
tributaries (Big Hole River near Melrose, Montana [gaging station 06025500; map number 45; fig. 1, table 1], Galla-tin River near Gallatin Gateway, Montana [gaging station 06043500; map number 80; fig. 1, table 1], and Gallatin River at Logan, Montana [gaging station 06052500; map number 88; fig. 1, table 1]) have mean basin elevations that range from 6,635 to 7,894 ft. For all of the gaging stations, nearly all day-of-peak values are during May and June, likely caused
by snowmelt runoff (possibly with associated spring rainfall). Day-of-peak values generally are uniformly distributed (cen-tered at times that are variable among gaging stations and time periods) within May and June (fig. 3).
Fitted trends for annual peak flow and peak-flow timing, and statistical distributions for summary time periods for the three gaging stations on Missouri River headwaters tributar-ies are presented in figure 3. The study results for all gaging stations indicate substantial upward trends in annual peak flow during 1930–76 and moderate downward trends in annual peak flow during 1967–2011 (fig. 3; table 2). Big Hole River near Melrose, Montana, has a small downward trend in annual peak flow during the entire period of record, and the Gallatin River gaging stations have moderate upward trends in annual peak flow during the entire period of record. The study results also indicate moderate upward trends in peak-flow timing for all gaging stations during 1930–76, but variable changes (in trend direction and magnitude) among gaging stations during 1967–2011 (fig. 3; table 3). The gaging stations have small changes in peak-flow timing during the entire period of record that are variable in direction.
Significant differences between the day-of-peak medians for 1979–2011 and the medians for 1930–78 were determined for Gallatin River near Gallatin Gateway, Montana, and Galla-tin River at Logan, Montana (table 4). The day-of-peak medi-ans for 1979–2011 (Julian day 155 and 156 for Gallatin River near Gallatin Gateway, Montana, and Gallatin River at Logan, Montana, respectively) are significantly less than medians for 1930–78 (Julian day 161 and 162, respectively; table 4).
For annual peak flow, statistical distributions among the summary time periods generally are similar (fig. 3). However, for the Bighole River near Melrose, Montana, (fig. 3A), the interquartile range of peak flows for 1979–2011 is consider-ably larger than the interquartile range for 1930–1978 and for the entire period of record. For day of peak, the statistical dis-tributions for the Gallatin River gaging stations for 1979–2011 are shifted downward in relation to distributions for 1930–78.
For annual peak flow for the Missouri River headwater tributaries, upward trends during 1930–76 generally were stronger than downward trends during 1967–2011, and statisti-cal distributions generally were similar among summary time periods. Study results provide evidence that annual peak flow for the long-term gaging stations can be reasonably considered as stationary for application of peak-flow frequency analyses within a statewide gaging-station network. However, for peak-flow timing for the two Gallatin River gaging stations, moder-ate upward trends during 1930–76 were generally similar in magnitude to moderate downward trends during 1967–2011; also, day-of-peak medians for 1979–2011 were significantly less than medians for 1930–78 (table 4). For the Gallatin River gaging stations, the moderate downward trends in peak-flow timing for 1967–2011 indicate that the timing of annual peak flows changed (by 8 to 12 days) from later in the year to ear-lier in the year.
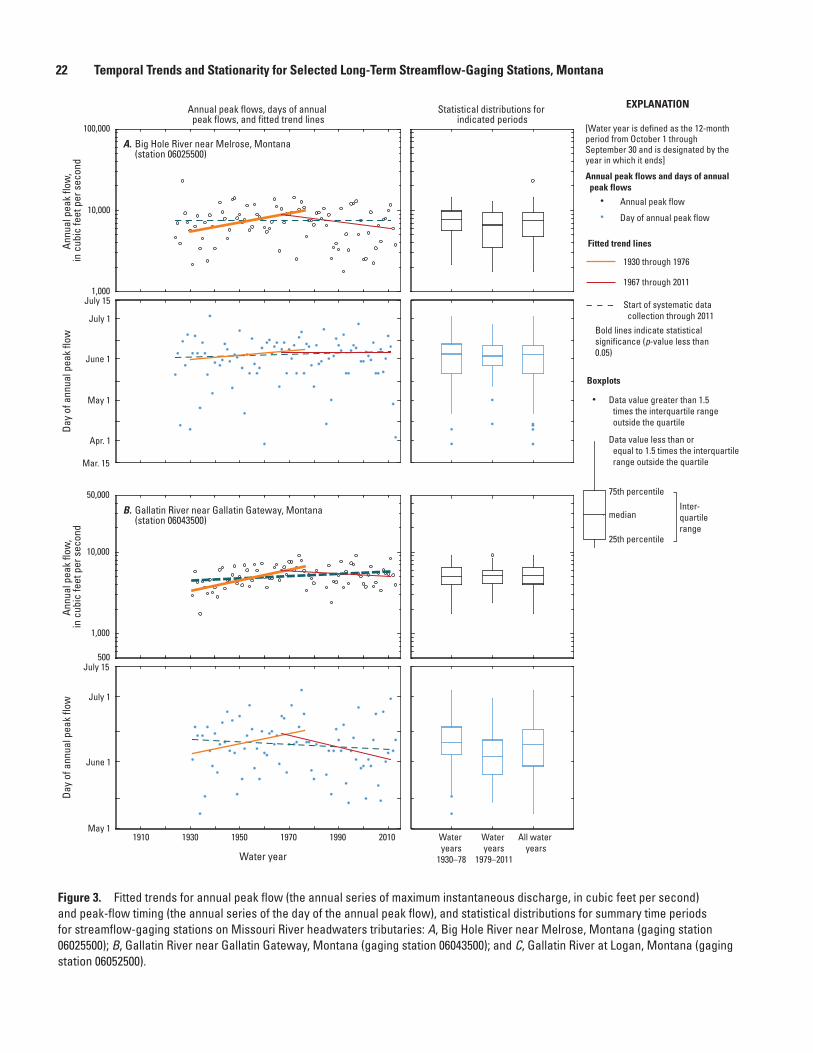
22 Temporal Trends and Stationarity for Selected Long-Term Streamflow-Gaging Stations, Montana
Water years
1930–78
Water years
1979–2011
All water years
1910 1930 1950 1970 1990 2010
Water year
Mar. 15
May 1
Apr. 1
June 1
July 1
July 151,000
10,000
100,000
May 1
June 1
July 1
July 15500
1,000
10,000
50,000
Day
of a
nnua
l pea
k flo
wAn
nual
pea
k flo
w,
in c
ubic
feet
per
sec
ond
Day
of a
nnua
l pea
k flo
wAn
nual
pea
k flo
w,
in c
ubic
feet
per
sec
ond
Big Hole River near Melrose, Montana(station 06025500)
A.
B. Gallatin River near Gallatin Gateway, Montana(station 06043500)
Statistical distributions for indicated periods
Annual peak flows, days of annual peak flows, and fitted trend lines
[Water year is defined as the 12-month period from October 1 through September 30 and is designated by the year in which it ends]
Annual peak flows and days of annual peak flows
Fitted trend lines
Annual peak flow
Day of annual peak flow
EXPLANATION
Boxplots
Start of systematic data collection through 2011
1930 through 1976
1967 through 2011
75th percentile
median
25th percentile
Data value less than or equal to 1.5 times the interquartile range outside the quartile
Data value greater than 1.5 times the interquartile range outside the quartile
Inter-quartilerange
Bold lines indicate statistical significance (p-value less than 0.05)
Figure 3. Fitted trends for annual peak flow (the annual series of maximum instantaneous discharge, in cubic feet per second) and peak-flow timing (the annual series of the day of the annual peak flow), and statistical distributions for summary time periods for streamflow-gaging stations on Missouri River headwaters tributaries: A, Big Hole River near Melrose, Montana (gaging station 06025500); B, Gallatin River near Gallatin Gateway, Montana (gaging station 06043500); and C, Gallatin River at Logan, Montana (gaging station 06052500).
Temporal Trends and Stationarity in Annual Peak Flow and Peak-Flow Timing 23Da
y of
ann
ual p
eak
flow
Annu
al p
eak
flow
, in
cub
ic fe
et p
er s
econ
d
May 1
June 1
July 1
July 15500
1,000
10,000
50,000
Water years
1930–78
Water years
1979–2011
All water years
1910 1930 1950 1970 1990 2010
Water year
C.
Statistical distributions for indicated periods
Annual peak flows, days of annual peak flows, and fitted trend lines
Gallatin River at Logan, Montana(station 06052500)
[Water year is defined as the 12-month period from October 1 through September 30 and is designated by the year in which it ends]
Annual peak flows and days of annual peak flows
Boxplots
Fitted trend lines
Start of systematic data collection through 2011
1930 through 1976
Annual peak flow
Day of annual peak flow
1967 through 2011
75th percentile
median
25th percentile
Data value less than or equal to 1.5 times the interquartile range outside the quartile
Data value greater than 1.5 times the interquartile range outside the quartile
Inter-quartilerange
Bold lines indicate statistical significance (p-value less than 0.05)
EXPLANATION
Figure 3. Graphs showing fFitted trends for annual peak flow (the annual series of maximum instantaneous discharge, in cubic feet per second) and peak-flow timing (the annual series of the day of the annual peak flow), and statistical distributions for summary time periods for streamflow-gaging stations on Missouri River headwaters tributaries: A, Big Hole River near Melrose, Montana (gaging station 06025500); B, Gallatin River near Gallatin Gateway, Montana (gaging station 06043500); and C, Gallatin River at Logan, Montana (gaging station 06052500).—Continued
Upper Missouri River TributariesThe two gaging stations on upper Missouri River tribu-
taries (Tenmile Creek near Rimini, Montana [gaging station 06062500; map number 101; fig. 1, table 1], and Marias River near Shelby, Montana [gaging station 06099500; map number 161; fig. 1, table 1]) have relatively large variability in mean basin elevations. For Tenmile Creek near Rimini, Montana (mean basin elevation 6,541 ft), nearly all peak flows are during May and June, likely caused by snowmelt runoff (possibly with associated spring rainfall). Day-of-peak values generally are uniformly distributed during May and June (fig. 4). For Marias River near Shelby, Montana (mean basin elevation 4,509 ft; range in elevation from 3,096–9,472 ft), most peak flows are during May and June, likely caused by high-elevation snowmelt runoff and spring rainfall. The few peak flows that are during March and April likely are caused by low-elevation snowmelt runoff. The few peak flows that are in November likely are caused by rainfall. Day-of-peak values that are outside of May and June account for less than
10 percent of peak flows; thus, most day-of-peak values are uniformly distributed during May and June (fig. 4).
Fitted trends for annual peak flow and peak-flow timing, and statistical distributions for summary time periods for the two gaging stations on upper Missouri River tributaries are presented in figure 4. The study results indicate moderate to substantial upward trends in annual peak flow for the gaging stations during 1930–76 and moderate downward trends in annual peak flow during 1967–2011 (fig. 4; table 2). The gag-ing stations have small downward trends in annual peak flow during the entire period of record. The study results also indi-cate small to moderate upward trends in peak-flow timing for the gaging stations during 1930–76 and small upward trends in peak-flow timing during 1967–2011 (fig. 4; table 3). The gaging stations have small upward trends in peak-flow timing during the entire period of record.
Differences between the medians for 1979–2011 and the medians for the other summary time periods were not signifi-cant for annual peak flow and day of peak (table 4). For both
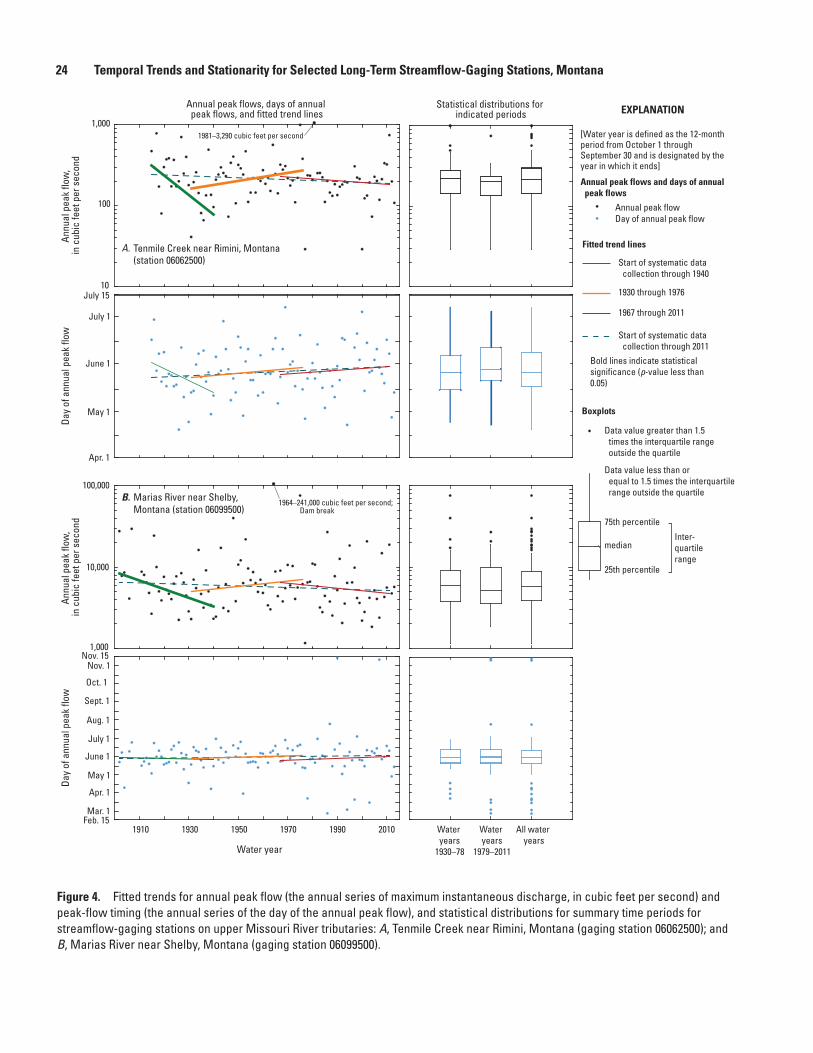
24 Temporal Trends and Stationarity for Selected Long-Term Streamflow-Gaging Stations, Montana
Water years
1930–78
Water years
1979–2011
All water years
1910 1930 1950 1970 1990 2010
Water year
Day
of a
nnua
l pea
k flo
wAn
nual
pea
k flo
w,
in c
ubic
feet
per
sec
ond
1,000
10,000
100,000
May 1
Mar. 1
Apr. 1
Feb. 15
June 1
July 1
Aug. 1
Sept. 1
Oct. 1
Nov. 1Nov. 15
Day
of a
nnua
l pea
k flo
wAn
nual
pea
k flo
w,
in c
ubic
feet
per
sec
ond
10
100
1,000
July 15
May 1
Apr. 1
June 1
July 1
A.
Statistical distributions for indicated periods
Annual peak flows, days of annual peak flows, and fitted trend lines
Tenmile Creek near Rimini, Montana(station 06062500)
Marias River near Shelby, Montana (station 06099500)
1964–241,000 cubic feet per second; Dam break
B.
1981–3,290 cubic feet per second [Water year is defined as the 12-month period from October 1 through September 30 and is designated by the year in which it ends]
Annual peak flows and days of annual peak flows
Boxplots
Fitted trend lines
Start of systematic data collection through 1940
Start of systematic data collection through 2011
1930 through 1976
Annual peak flowDay of annual peak flow
1967 through 2011
75th percentile
median
25th percentile
Data value less than or equal to 1.5 times the interquartile range outside the quartile
Data value greater than 1.5 times the interquartile range outside the quartile
Inter-quartilerange
Bold lines indicate statistical significance (p-value less than 0.05)
EXPLANATION
Figure 4. Fitted trends for annual peak flow (the annual series of maximum instantaneous discharge, in cubic feet per second) and peak-flow timing (the annual series of the day of the annual peak flow), and statistical distributions for summary time periods for streamflow-gaging stations on upper Missouri River tributaries: A, Tenmile Creek near Rimini, Montana (gaging station 06062500); and B, Marias River near Shelby, Montana (gaging station 06099500).
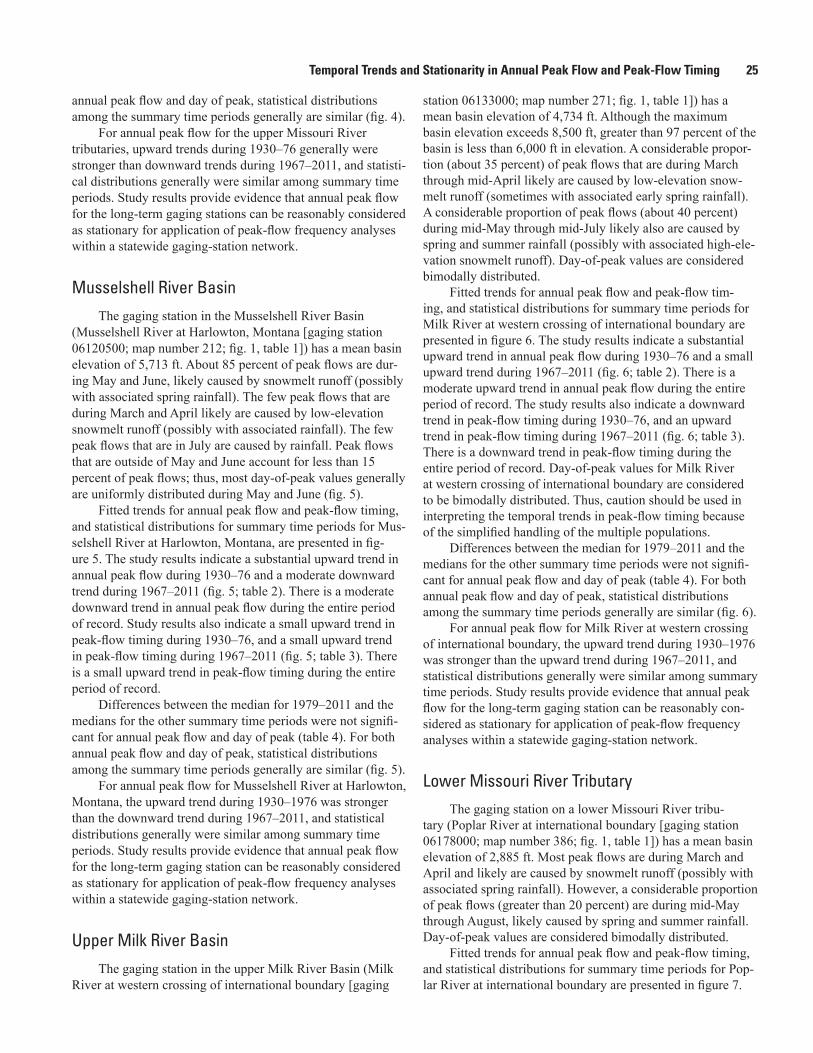
Temporal Trends and Stationarity in Annual Peak Flow and Peak-Flow Timing 25
annual peak flow and day of peak, statistical distributions among the summary time periods generally are similar (fig. 4).
For annual peak flow for the upper Missouri River tributaries, upward trends during 1930–76 generally were stronger than downward trends during 1967–2011, and statisti-cal distributions generally were similar among summary time periods. Study results provide evidence that annual peak flow for the long-term gaging stations can be reasonably considered as stationary for application of peak-flow frequency analyses within a statewide gaging-station network.
Musselshell River Basin
The gaging station in the Musselshell River Basin (Musselshell River at Harlowton, Montana [gaging station 06120500; map number 212; fig. 1, table 1]) has a mean basin elevation of 5,713 ft. About 85 percent of peak flows are dur-ing May and June, likely caused by snowmelt runoff (possibly with associated spring rainfall). The few peak flows that are during March and April likely are caused by low-elevation snowmelt runoff (possibly with associated rainfall). The few peak flows that are in July are caused by rainfall. Peak flows that are outside of May and June account for less than 15 percent of peak flows; thus, most day-of-peak values generally are uniformly distributed during May and June (fig. 5).
Fitted trends for annual peak flow and peak-flow timing, and statistical distributions for summary time periods for Mus-selshell River at Harlowton, Montana, are presented in fig-ure 5. The study results indicate a substantial upward trend in annual peak flow during 1930–76 and a moderate downward trend during 1967–2011 (fig. 5; table 2). There is a moderate downward trend in annual peak flow during the entire period of record. Study results also indicate a small upward trend in peak-flow timing during 1930–76, and a small upward trend in peak-flow timing during 1967–2011 (fig. 5; table 3). There is a small upward trend in peak-flow timing during the entire period of record.
Differences between the median for 1979–2011 and the medians for the other summary time periods were not signifi-cant for annual peak flow and day of peak (table 4). For both annual peak flow and day of peak, statistical distributions among the summary time periods generally are similar (fig. 5).
For annual peak flow for Musselshell River at Harlowton, Montana, the upward trend during 1930–1976 was stronger than the downward trend during 1967–2011, and statistical distributions generally were similar among summary time periods. Study results provide evidence that annual peak flow for the long-term gaging station can be reasonably considered as stationary for application of peak-flow frequency analyses within a statewide gaging-station network.
Upper Milk River Basin
The gaging station in the upper Milk River Basin (Milk River at western crossing of international boundary [gaging
station 06133000; map number 271; fig. 1, table 1]) has a mean basin elevation of 4,734 ft. Although the maximum basin elevation exceeds 8,500 ft, greater than 97 percent of the basin is less than 6,000 ft in elevation. A considerable propor-tion (about 35 percent) of peak flows that are during March through mid-April likely are caused by low-elevation snow-melt runoff (sometimes with associated early spring rainfall). A considerable proportion of peak flows (about 40 percent) during mid-May through mid-July likely also are caused by spring and summer rainfall (possibly with associated high-ele-vation snowmelt runoff). Day-of-peak values are considered bimodally distributed.
Fitted trends for annual peak flow and peak-flow tim-ing, and statistical distributions for summary time periods for Milk River at western crossing of international boundary are presented in figure 6. The study results indicate a substantial upward trend in annual peak flow during 1930–76 and a small upward trend during 1967–2011 (fig. 6; table 2). There is a moderate upward trend in annual peak flow during the entire period of record. The study results also indicate a downward trend in peak-flow timing during 1930–76, and an upward trend in peak-flow timing during 1967–2011 (fig. 6; table 3). There is a downward trend in peak-flow timing during the entire period of record. Day-of-peak values for Milk River at western crossing of international boundary are considered to be bimodally distributed. Thus, caution should be used in interpreting the temporal trends in peak-flow timing because of the simplified handling of the multiple populations.
Differences between the median for 1979–2011 and the medians for the other summary time periods were not signifi-cant for annual peak flow and day of peak (table 4). For both annual peak flow and day of peak, statistical distributions among the summary time periods generally are similar (fig. 6).
For annual peak flow for Milk River at western crossing of international boundary, the upward trend during 1930–1976 was stronger than the upward trend during 1967–2011, and statistical distributions generally were similar among summary time periods. Study results provide evidence that annual peak flow for the long-term gaging station can be reasonably con-sidered as stationary for application of peak-flow frequency analyses within a statewide gaging-station network.
Lower Missouri River TributaryThe gaging station on a lower Missouri River tribu-
tary (Poplar River at international boundary [gaging station 06178000; map number 386; fig. 1, table 1]) has a mean basin elevation of 2,885 ft. Most peak flows are during March and April and likely are caused by snowmelt runoff (possibly with associated spring rainfall). However, a considerable proportion of peak flows (greater than 20 percent) are during mid-May through August, likely caused by spring and summer rainfall. Day-of-peak values are considered bimodally distributed.
Fitted trends for annual peak flow and peak-flow timing, and statistical distributions for summary time periods for Pop-lar River at international boundary are presented in figure 7.
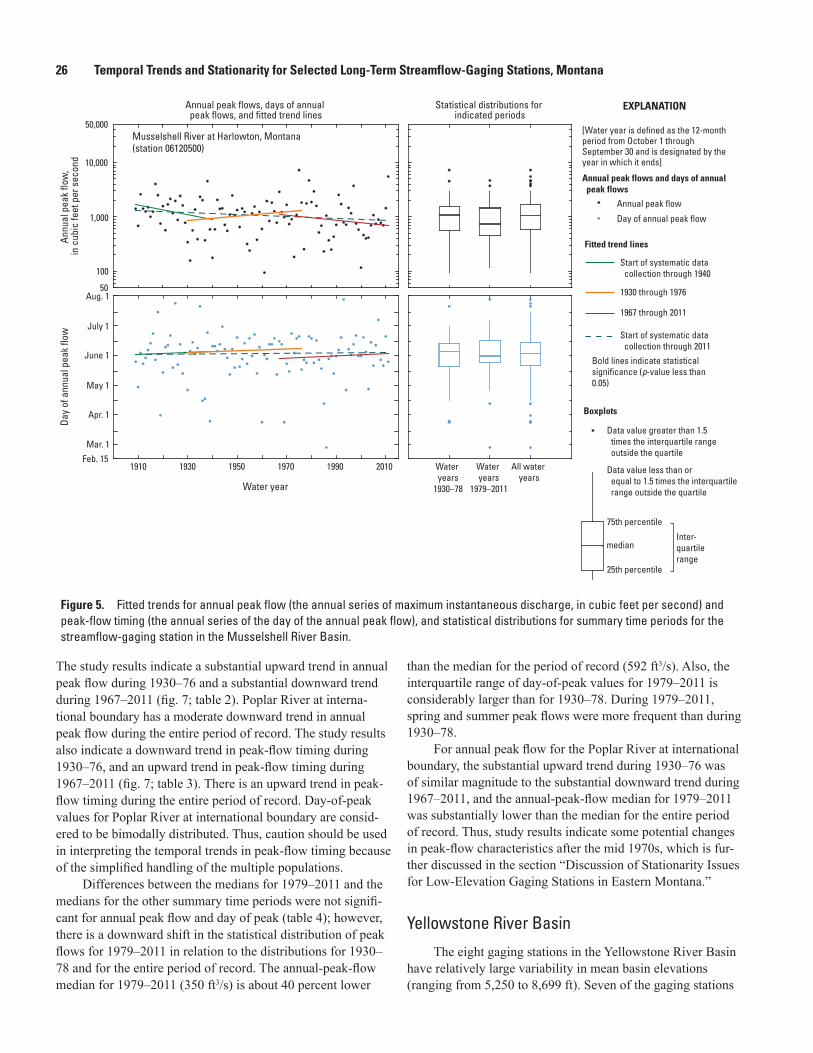
26 Temporal Trends and Stationarity for Selected Long-Term Streamflow-Gaging Stations, Montana
Water years
1930–78
Water years
1979–2011
All water years
1910 1930 1950 1970 1990 2010
Water year
Feb. 15
May 1
Apr. 1
Mar. 1
June 1
July 1
Aug. 1
Day
of a
nnua
l pea
k flo
wAn
nual
pea
k flo
w,
in c
ubic
feet
per
sec
ond
50
100
1,000
10,000
50,000Musselshell River at Harlowton, Montana(station 06120500)
Statistical distributions for indicated periods
Annual peak flows, days of annual peak flows, and fitted trend lines
[Water year is defined as the 12-month period from October 1 through September 30 and is designated by the year in which it ends]
Annual peak flows and days of annual peak flows
Boxplots
Fitted trend lines
Start of systematic data collection through 1940
Start of systematic data collection through 2011
1930 through 1976
Annual peak flow
Day of annual peak flow
1967 through 2011
75th percentile
median
25th percentile
Data value less than or equal to 1.5 times the interquartile range outside the quartile
Data value greater than 1.5 times the interquartile range outside the quartile
Inter-quartilerange
Bold lines indicate statistical significance (p-value less than 0.05)
EXPLANATION
Figure 5. Fitted trends for annual peak flow (the annual series of maximum instantaneous discharge, in cubic feet per second) and peak-flow timing (the annual series of the day of the annual peak flow), and statistical distributions for summary time periods for the streamflow-gaging station in the Musselshell River Basin.
The study results indicate a substantial upward trend in annual peak flow during 1930–76 and a substantial downward trend during 1967–2011 (fig. 7; table 2). Poplar River at interna-tional boundary has a moderate downward trend in annual peak flow during the entire period of record. The study results also indicate a downward trend in peak-flow timing during 1930–76, and an upward trend in peak-flow timing during 1967–2011 (fig. 7; table 3). There is an upward trend in peak-flow timing during the entire period of record. Day-of-peak values for Poplar River at international boundary are consid-ered to be bimodally distributed. Thus, caution should be used in interpreting the temporal trends in peak-flow timing because of the simplified handling of the multiple populations.
Differences between the medians for 1979–2011 and the medians for the other summary time periods were not signifi-cant for annual peak flow and day of peak (table 4); however, there is a downward shift in the statistical distribution of peak flows for 1979–2011 in relation to the distributions for 1930–78 and for the entire period of record. The annual-peak-flow median for 1979–2011 (350 ft3/s) is about 40 percent lower
than the median for the period of record (592 ft3/s). Also, the interquartile range of day-of-peak values for 1979–2011 is considerably larger than for 1930–78. During 1979–2011, spring and summer peak flows were more frequent than during 1930–78.
For annual peak flow for the Poplar River at international boundary, the substantial upward trend during 1930–76 was of similar magnitude to the substantial downward trend during 1967–2011, and the annual-peak-flow median for 1979–2011 was substantially lower than the median for the entire period of record. Thus, study results indicate some potential changes in peak-flow characteristics after the mid 1970s, which is fur-ther discussed in the section “Discussion of Stationarity Issues for Low-Elevation Gaging Stations in Eastern Montana.”
Yellowstone River Basin
The eight gaging stations in the Yellowstone River Basin have relatively large variability in mean basin elevations (ranging from 5,250 to 8,699 ft). Seven of the gaging stations
Temporal Trends and Stationarity in Annual Peak Flow and Peak-Flow Timing 27
Water years
1930–78
Water years
1979–2011
All water years
1910 1930 1950 1970 1990 2010
Water year
[Water year is defined as the 12-month period from October 1 through September 30 and is designated by the year in which it ends]
Annual peak flows and days of annual peak flows
Boxplots
Fitted trend lines
Start of systematic data collection through 2011
1930 through 1976
Annual peak flow
Day of annual peak flow
1967 through 2011
75th percentile
median
25th percentile
Data value less than or equal to 1.5 times the interquartile range outside the quartile
Data value greater than 1.5 times the interquartile range outside the quartile
Inter-quartilerange
Bold lines indicate statistical significance (p-value less than 0.05)
EXPLANATIONStatistical distributions for indicated periods
Annual peak flows, days of annual peak flows, and fitted trend lines
Day
of a
nnua
l pea
k flo
wAn
nual
pea
k flo
w,
in c
ubic
feet
per
sec
ond
100
1,000
10,000
May 1
Mar. 1
Apr. 1
Feb. 1
June 1
July 1July 15
Milk River at western crossing ofinternational boundary(station 06133000)
Figure 6. Fitted trends for annual peak flow (the annual series of maximum instantaneous discharge, in cubic feet per second) and peak-flow timing (the annual series of the day of the annual peak flow), and statistical distributions for summary time periods for the streamflow-gaging station in the upper Milk River Basin.
in the Yellowstone River Basin have mean basin elevations greater than 6,000 ft (fig. 1, table 1):
• Yellowstone River at Yellowstone Lake outlet, Yel-lowstone National Park, Wyoming (gaging station 06186500; map number 414);
• Yellowstone River at Corwin Springs, Montana (gaging station 06191500; map number 424);
• Yellowstone River near Livingston, Montana (gaging station 06192500; map number 425);
• Stillwater River near Absarokee, Montana (gaging sta-tion 06205000; map number 443);
• Clarks Fork Yellowstone River near Belfry, Montana (gaging station 06207500; map number 445);
• Clarks Fork Yellowstone River at Edgar, Montana (gaging station 06208500; map number 448); and
• Yellowstone River at Billings, Montana (gaging station 06214500; map number 458).
For all of these high-elevation gaging stations except Yel-lowstone River at Yellowstone Lake outlet, Yellowstone National Park, Wyoming, nearly all peak flows are during May and June, likely caused by snowmelt runoff (possibly with associated spring rainfall). Day-of-peak values generally are uniformly distributed (centered at times that are variable among gaging stations) within May and June (fig. 8). The high mean basin elevation (8,699 ft) for Yellowstone River at Yellowstone Lake outlet, Yellowstone National Park, Wyo-ming, results in day-of-peak values being generally uniformly distributed during mid-June through mid-July.
One of the gaging stations in the Yellowstone River Basin (Powder River at Moorhead, Montana [gaging station 06324500; map number 542; fig. 1, table 1]) has a mean basin elevation of 5,250 ft and less than 20 percent of the basin area is higher than 6,000 ft. Day-of-peak values for Powder River at Moorhead, Montana, are more variable than for the high-elevation gaging stations. Most peak flows are during May and June, likely caused by spring rainfall and high-elevation snow-melt runoff. A considerable proportion of peak flows (about 15–20 percent) are during March and probably are caused by low-elevation snowmelt runoff (possibly with associated
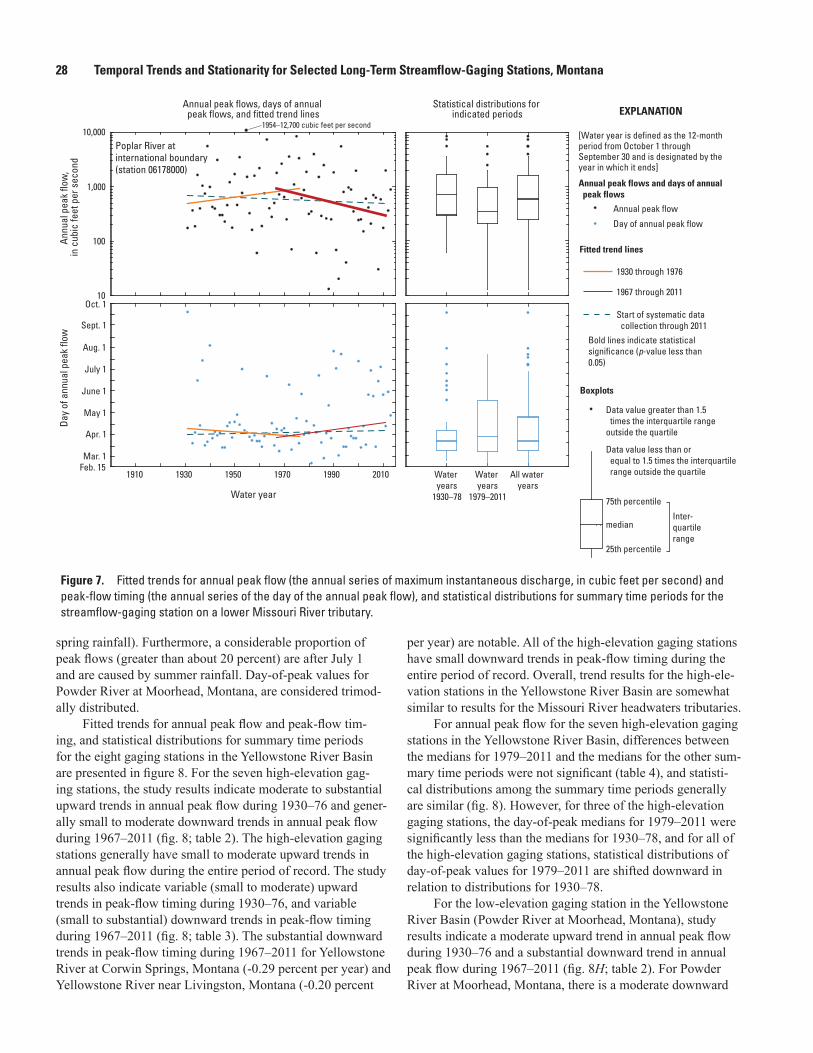
28 Temporal Trends and Stationarity for Selected Long-Term Streamflow-Gaging Stations, Montana
Water years
1930–78
Water years
1979–2011
All water years
1910 1930 1950 1970 1990 2010
Water year
May 1
Mar. 1Feb. 15
Apr. 1
June 1
July 1
Aug. 1
Sept. 1
Oct. 110
100
1,000
10,000
Day
of a
nnua
l pea
k flo
wAn
nual
pea
k flo
w,
in c
ubic
feet
per
sec
ond
Poplar River at international boundary(station 06178000)
1954–12,700 cubic feet per second
Statistical distributions for indicated periods
Annual peak flows, days of annual peak flows, and fitted trend lines
[Water year is defined as the 12-month period from October 1 through September 30 and is designated by the year in which it ends]
Annual peak flows and days of annual peak flows
Boxplots
Fitted trend lines
Start of systematic data collection through 2011
1930 through 1976
Annual peak flow
Day of annual peak flow
1967 through 2011
75th percentile
median
25th percentile
Data value less than or equal to 1.5 times the interquartile range outside the quartile
Data value greater than 1.5 times the interquartile rangeoutside the quartile
Inter-quartilerange
Bold lines indicate statistical significance (p-value less than 0.05)
EXPLANATION
Figure 7. Fitted trends for annual peak flow (the annual series of maximum instantaneous discharge, in cubic feet per second) and peak-flow timing (the annual series of the day of the annual peak flow), and statistical distributions for summary time periods for the streamflow-gaging station on a lower Missouri River tributary.
spring rainfall). Furthermore, a considerable proportion of peak flows (greater than about 20 percent) are after July 1 and are caused by summer rainfall. Day-of-peak values for Powder River at Moorhead, Montana, are considered trimod-ally distributed.
Fitted trends for annual peak flow and peak-flow tim-ing, and statistical distributions for summary time periods for the eight gaging stations in the Yellowstone River Basin are presented in figure 8. For the seven high-elevation gag-ing stations, the study results indicate moderate to substantial upward trends in annual peak flow during 1930–76 and gener-ally small to moderate downward trends in annual peak flow during 1967–2011 (fig. 8; table 2). The high-elevation gaging stations generally have small to moderate upward trends in annual peak flow during the entire period of record. The study results also indicate variable (small to moderate) upward trends in peak-flow timing during 1930–76, and variable (small to substantial) downward trends in peak-flow timing during 1967–2011 (fig. 8; table 3). The substantial downward trends in peak-flow timing during 1967–2011 for Yellowstone River at Corwin Springs, Montana (-0.29 percent per year) and Yellowstone River near Livingston, Montana (-0.20 percent
per year) are notable. All of the high-elevation gaging stations have small downward trends in peak-flow timing during the entire period of record. Overall, trend results for the high-ele-vation stations in the Yellowstone River Basin are somewhat similar to results for the Missouri River headwaters tributaries.
For annual peak flow for the seven high-elevation gaging stations in the Yellowstone River Basin, differences between the medians for 1979–2011 and the medians for the other sum-mary time periods were not significant (table 4), and statisti-cal distributions among the summary time periods generally are similar (fig. 8). However, for three of the high-elevation gaging stations, the day-of-peak medians for 1979–2011 were significantly less than the medians for 1930–78, and for all of the high-elevation gaging stations, statistical distributions of day-of-peak values for 1979–2011 are shifted downward in relation to distributions for 1930–78.
For the low-elevation gaging station in the Yellowstone River Basin (Powder River at Moorhead, Montana), study results indicate a moderate upward trend in annual peak flow during 1930–76 and a substantial downward trend in annual peak flow during 1967–2011 (fig. 8H; table 2). For Powder River at Moorhead, Montana, there is a moderate downward
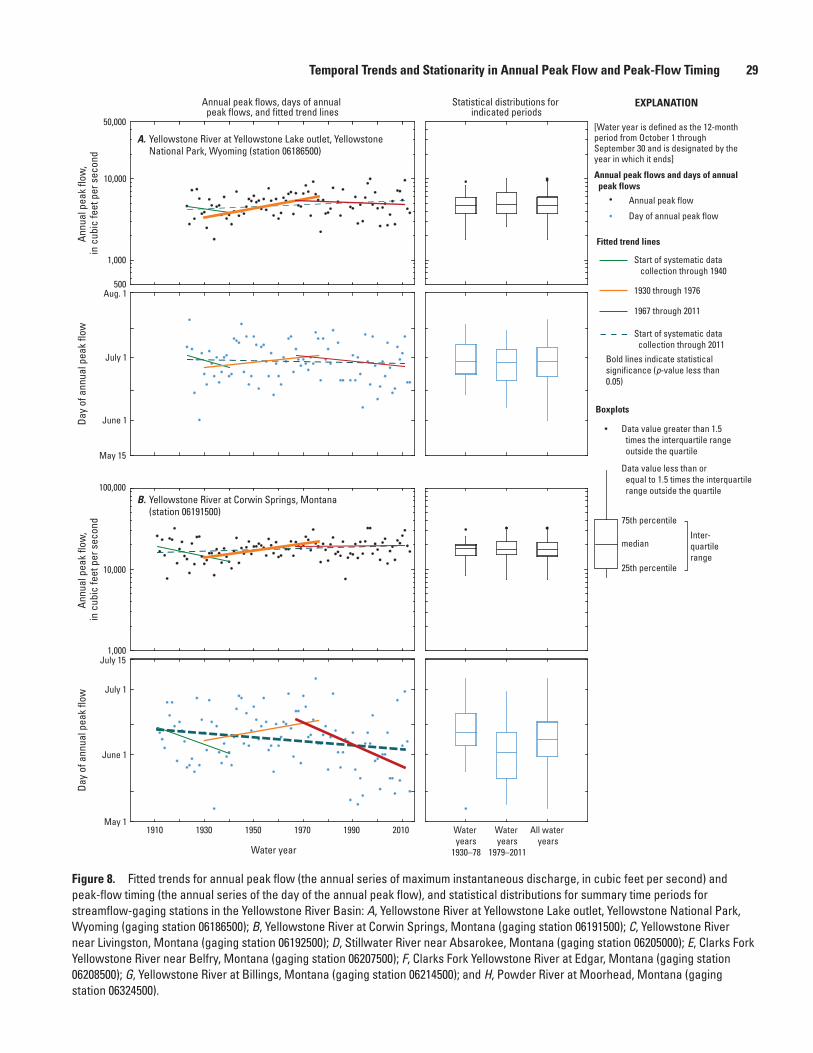
Temporal Trends and Stationarity in Annual Peak Flow and Peak-Flow Timing 29
Water years
1930–78
Water years
1979–2011
All water years
1910 1930 1950 1970 1990 2010
Water year
A.
B.
Statistical distributions for indicated periods
Annual peak flows, days of annual peak flows, and fitted trend lines
Day
of a
nnua
l pea
k flo
wAn
nual
pea
k flo
w,
in c
ubic
feet
per
sec
ond
May 15
June 1
July 1
Aug. 1500
1,000
10,000
50,000
Day
of a
nnua
l pea
k flo
wAn
nual
pea
k flo
w,
in c
ubic
feet
per
sec
ond
May 1
June 1
July 1
July 151,000
10,000
100,000
Yellowstone River at Yellowstone Lake outlet, Yellowstone National Park, Wyoming (station 06186500)
Yellowstone River at Corwin Springs, Montana(station 06191500)
[Water year is defined as the 12-month period from October 1 through September 30 and is designated by the year in which it ends]
Annual peak flows and days of annual peak flows
Boxplots
Fitted trend lines
Start of systematic data collection through 1940
Start of systematic data collection through 2011
1930 through 1976
Annual peak flow
Day of annual peak flow
1967 through 2011
75th percentile
median
25th percentile
Data value less than or equal to 1.5 times the interquartile range outside the quartile
Data value greater than 1.5 times the interquartile range outside the quartile
Inter-quartilerange
Bold lines indicate statistical significance (p-value less than 0.05)
EXPLANATION
Figure 8. Fitted trends for annual peak flow (the annual series of maximum instantaneous discharge, in cubic feet per second) and peak-flow timing (the annual series of the day of the annual peak flow), and statistical distributions for summary time periods for streamflow-gaging stations in the Yellowstone River Basin: A, Yellowstone River at Yellowstone Lake outlet, Yellowstone National Park, Wyoming (gaging station 06186500); B, Yellowstone River at Corwin Springs, Montana (gaging station 06191500); C, Yellowstone River near Livingston, Montana (gaging station 06192500); D, Stillwater River near Absarokee, Montana (gaging station 06205000); E, Clarks Fork Yellowstone River near Belfry, Montana (gaging station 06207500); F, Clarks Fork Yellowstone River at Edgar, Montana (gaging station 06208500); G, Yellowstone River at Billings, Montana (gaging station 06214500); and H, Powder River at Moorhead, Montana (gaging station 06324500).
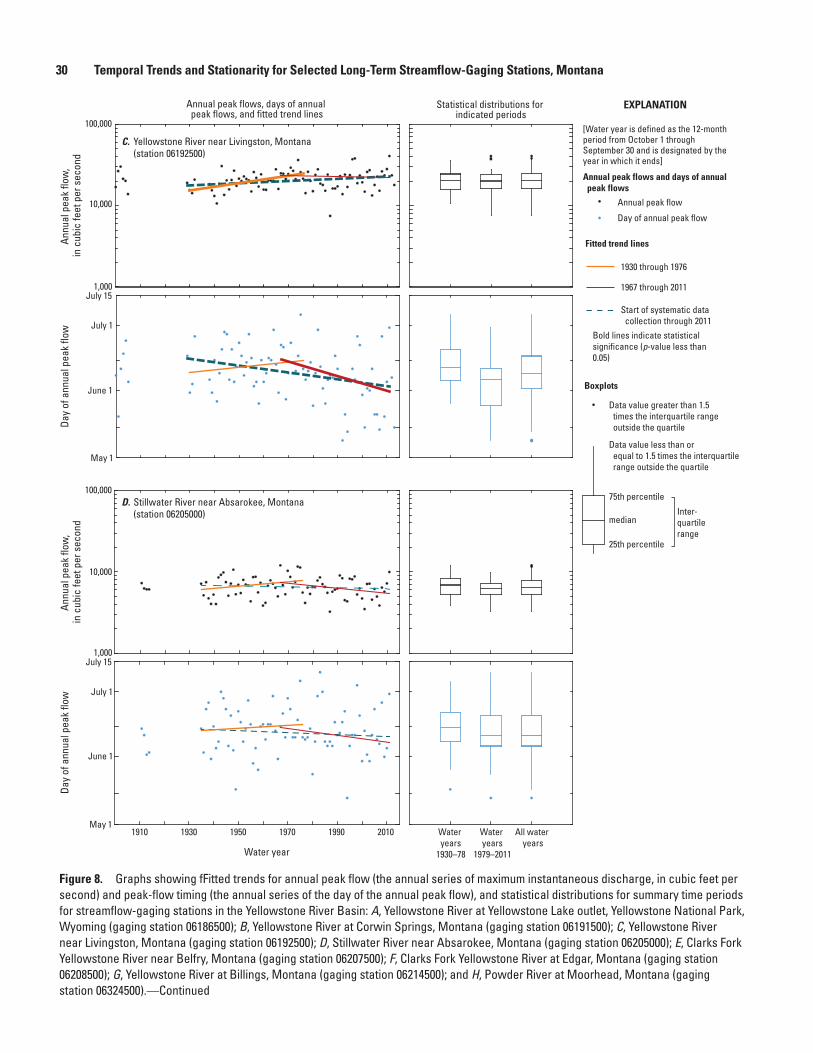
30 Temporal Trends and Stationarity for Selected Long-Term Streamflow-Gaging Stations, Montana
Water years
1930–78
Water years
1979–2011
All water years
1910 1930 1950 1970 1990 2010
Water year
May 1
June 1
July 1
July 151,000
10,000
100,000D. Stillwater River near Absarokee, Montana
(station 06205000)
[Water year is defined as the 12-month period from October 1 through September 30 and is designated by the year in which it ends]
Annual peak flows and days of annual peak flows
Boxplots
Fitted trend lines
Start of systematic data collection through 2011
1930 through 1976
Annual peak flow
Day of annual peak flow
1967 through 2011
75th percentile
median
25th percentile
Data value less than or equal to 1.5 times the interquartile range outside the quartile
Data value greater than 1.5 times the interquartile range outside the quartile
Inter-quartilerange
Bold lines indicate statistical significance (p-value less than 0.05)
EXPLANATION
C.
Statistical distributions for indicated periods
Annual peak flows, days of annual peak flows, and fitted trend lines
Day
of a
nnua
l pea
k flo
wAn
nual
pea
k flo
w,
in c
ubic
feet
per
sec
ond
May 1
June 1
July 1
July 15
Day
of a
nnua
l pea
k flo
wAn
nual
pea
k flo
w,
in c
ubic
feet
per
sec
ond
1,000
10,000
100,000
Yellowstone River near Livingston, Montana(station 06192500)
Figure 8. Graphs showing fFitted trends for annual peak flow (the annual series of maximum instantaneous discharge, in cubic feet per second) and peak-flow timing (the annual series of the day of the annual peak flow), and statistical distributions for summary time periods for streamflow-gaging stations in the Yellowstone River Basin: A, Yellowstone River at Yellowstone Lake outlet, Yellowstone National Park, Wyoming (gaging station 06186500); B, Yellowstone River at Corwin Springs, Montana (gaging station 06191500); C, Yellowstone River near Livingston, Montana (gaging station 06192500); D, Stillwater River near Absarokee, Montana (gaging station 06205000); E, Clarks Fork Yellowstone River near Belfry, Montana (gaging station 06207500); F, Clarks Fork Yellowstone River at Edgar, Montana (gaging station 06208500); G, Yellowstone River at Billings, Montana (gaging station 06214500); and H, Powder River at Moorhead, Montana (gaging station 06324500).—Continued
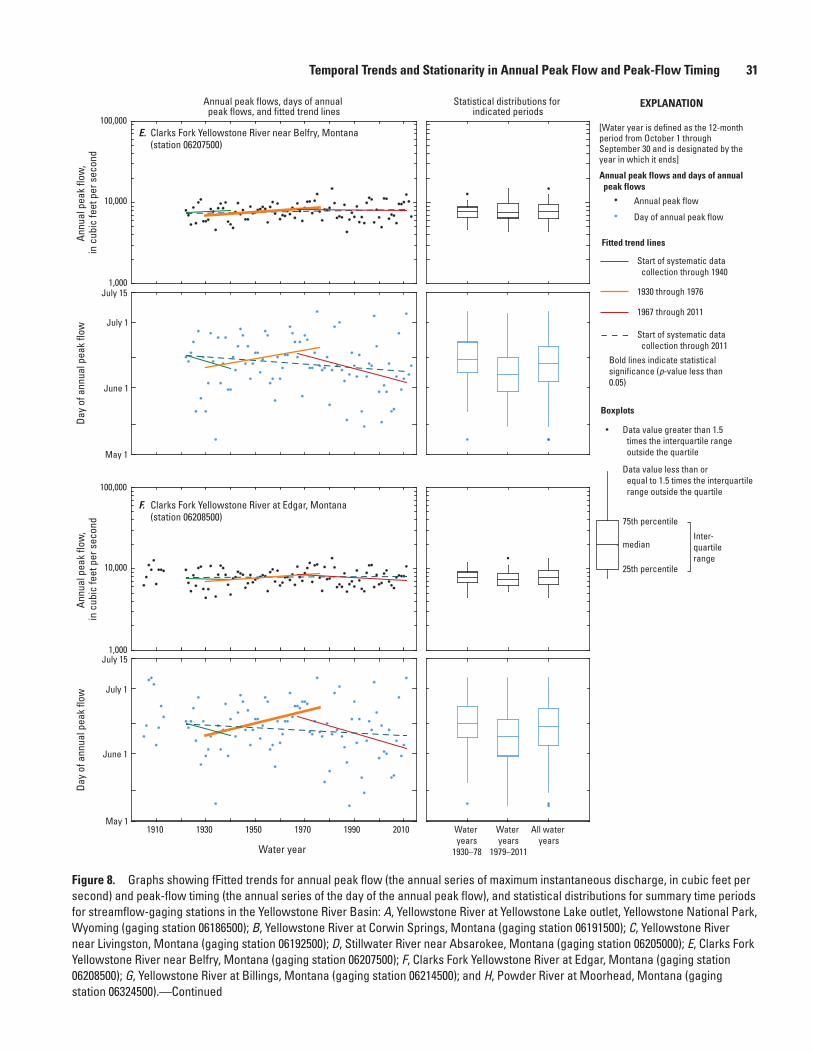
Temporal Trends and Stationarity in Annual Peak Flow and Peak-Flow Timing 31
Water years
1930–78
Water years
1979–2011
All water years
1910 1930 1950 1970 1990 2010
Water year
Day
of a
nnua
l pea
k flo
wAn
nual
pea
k flo
w,
in c
ubic
feet
per
sec
ond
Day
of a
nnua
l pea
k flo
wAn
nual
pea
k flo
w,
in c
ubic
feet
per
sec
ond
May 1
June 1
July 1
July 15
May 1
June 1
July 1
July 15
1,000
10,000
100,000
1,000
10,000
100,000
Statistical distributions for indicated periods
Annual peak flows, days of annual peak flows, and fitted trend lines
E. Clarks Fork Yellowstone River near Belfry, Montana(station 06207500)
F. Clarks Fork Yellowstone River at Edgar, Montana(station 06208500)
[Water year is defined as the 12-month period from October 1 through September 30 and is designated by the year in which it ends]
Annual peak flows and days of annual peak flows
Boxplots
Fitted trend lines
Start of systematic data collection through 1940
Start of systematic data collection through 2011
1930 through 1976
Annual peak flow
Day of annual peak flow
1967 through 2011
75th percentile
median
25th percentile
Data value less than or equal to 1.5 times the interquartile range outside the quartile
Data value greater than 1.5 times the interquartile range outside the quartile
Inter-quartilerange
Bold lines indicate statistical significance (p-value less than 0.05)
EXPLANATION
Figure 8. Graphs showing fFitted trends for annual peak flow (the annual series of maximum instantaneous discharge, in cubic feet per second) and peak-flow timing (the annual series of the day of the annual peak flow), and statistical distributions for summary time periods for streamflow-gaging stations in the Yellowstone River Basin: A, Yellowstone River at Yellowstone Lake outlet, Yellowstone National Park, Wyoming (gaging station 06186500); B, Yellowstone River at Corwin Springs, Montana (gaging station 06191500); C, Yellowstone River near Livingston, Montana (gaging station 06192500); D, Stillwater River near Absarokee, Montana (gaging station 06205000); E, Clarks Fork Yellowstone River near Belfry, Montana (gaging station 06207500); F, Clarks Fork Yellowstone River at Edgar, Montana (gaging station 06208500); G, Yellowstone River at Billings, Montana (gaging station 06214500); and H, Powder River at Moorhead, Montana (gaging station 06324500).—Continued
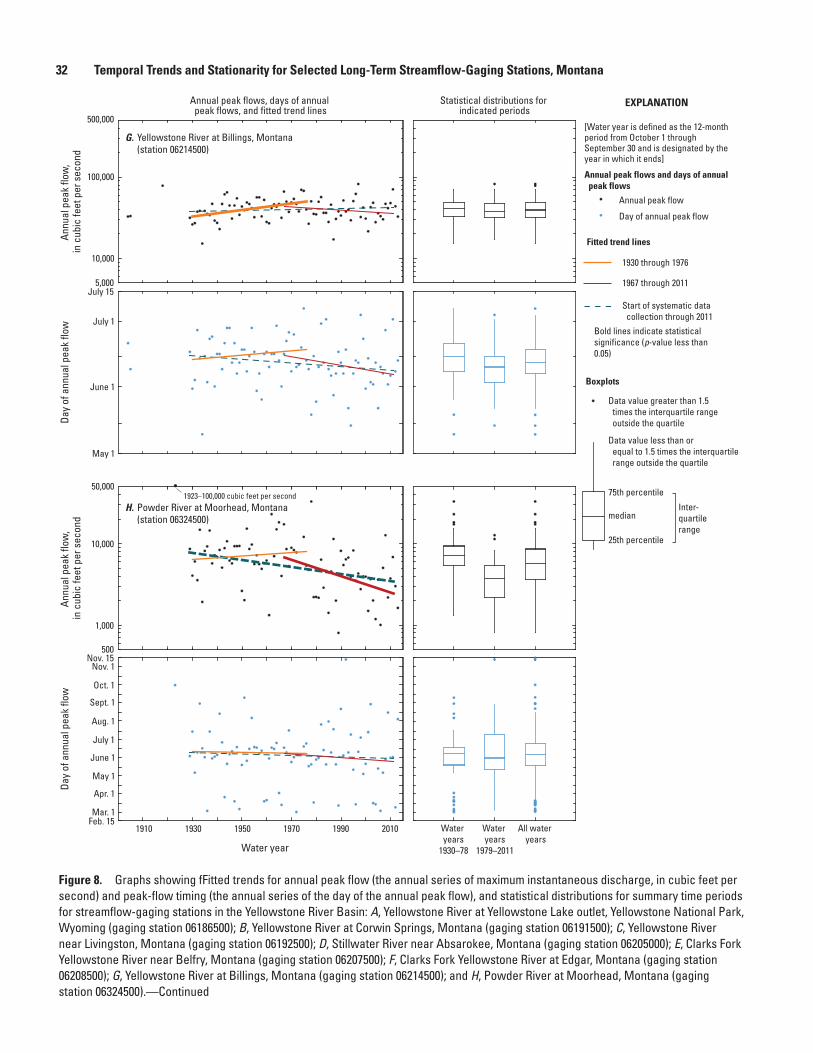
32 Temporal Trends and Stationarity for Selected Long-Term Streamflow-Gaging Stations, Montana
Water years
1930–78
Water years
1979–2011
All water years
1910 1930 1950 1970 1990 2010
Water year
Day
of a
nnua
l pea
k flo
wAn
nual
pea
k flo
w,
in c
ubic
feet
per
sec
ond
5,000
10,000
100,000
500,000
May 1
June 1
July 1
July 15
Day
of a
nnua
l pea
k flo
wAn
nual
pea
k flo
w,
in c
ubic
feet
per
sec
ond
May 1
Mar. 1
Apr. 1
Feb. 15
June 1
July 1
Aug. 1
Sept. 1
Oct. 1
Nov. 1Nov. 15
500
1,000
10,000
50,000
G. Yellowstone River at Billings, Montana(station 06214500)
H. Powder River at Moorhead, Montana(station 06324500)
1923–100,000 cubic feet per second
Statistical distributions for indicated periods
Annual peak flows, days of annual peak flows, and fitted trend lines
[Water year is defined as the 12-month period from October 1 through September 30 and is designated by the year in which it ends]
Annual peak flows and days of annual peak flows
Boxplots
Fitted trend lines
Start of systematic data collection through 2011
1930 through 1976
Annual peak flow
Day of annual peak flow
1967 through 2011
75th percentile
median
25th percentile
Data value less than or equal to 1.5 times the interquartile range outside the quartile
Data value greater than 1.5 times the interquartile range outside the quartile
Inter-quartilerange
Bold lines indicate statistical significance (p-value less than 0.05)
EXPLANATION
Figure 8. Graphs showing fFitted trends for annual peak flow (the annual series of maximum instantaneous discharge, in cubic feet per second) and peak-flow timing (the annual series of the day of the annual peak flow), and statistical distributions for summary time periods for streamflow-gaging stations in the Yellowstone River Basin: A, Yellowstone River at Yellowstone Lake outlet, Yellowstone National Park, Wyoming (gaging station 06186500); B, Yellowstone River at Corwin Springs, Montana (gaging station 06191500); C, Yellowstone River near Livingston, Montana (gaging station 06192500); D, Stillwater River near Absarokee, Montana (gaging station 06205000); E, Clarks Fork Yellowstone River near Belfry, Montana (gaging station 06207500); F, Clarks Fork Yellowstone River at Edgar, Montana (gaging station 06208500); G, Yellowstone River at Billings, Montana (gaging station 06214500); and H, Powder River at Moorhead, Montana (gaging station 06324500).—Continued
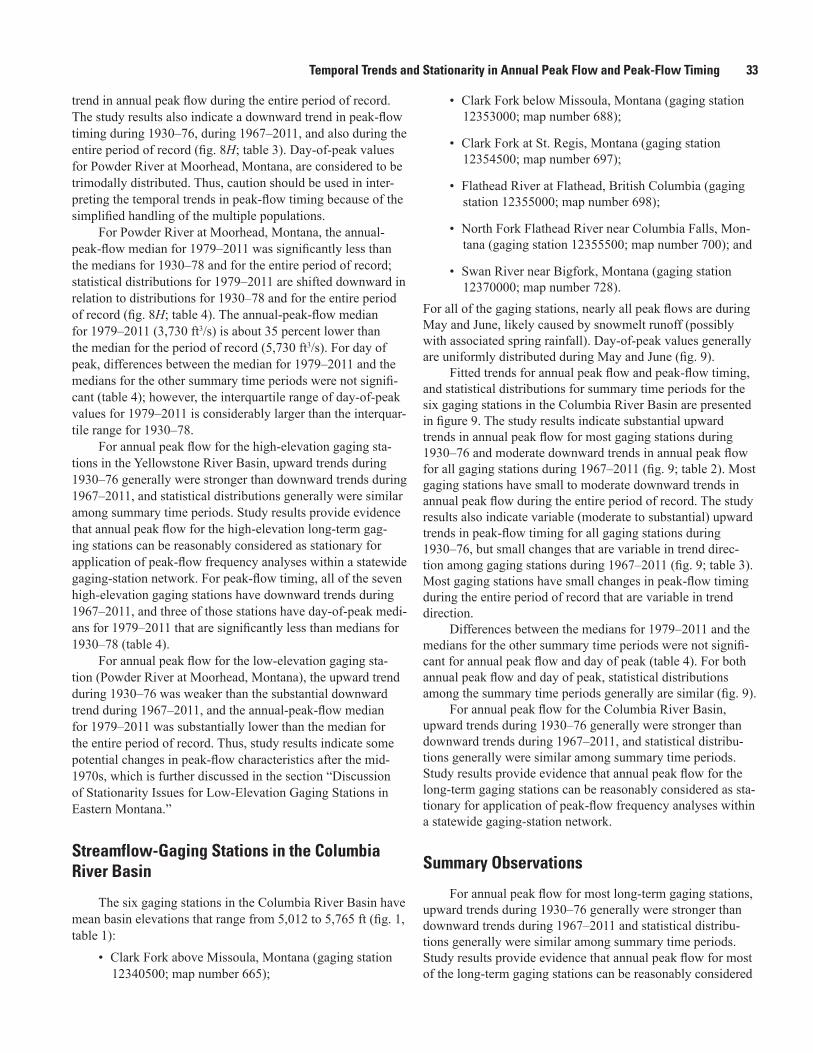
Temporal Trends and Stationarity in Annual Peak Flow and Peak-Flow Timing 33
trend in annual peak flow during the entire period of record. The study results also indicate a downward trend in peak-flow timing during 1930–76, during 1967–2011, and also during the entire period of record (fig. 8H; table 3). Day-of-peak values for Powder River at Moorhead, Montana, are considered to be trimodally distributed. Thus, caution should be used in inter-preting the temporal trends in peak-flow timing because of the simplified handling of the multiple populations.
For Powder River at Moorhead, Montana, the annual-peak-flow median for 1979–2011 was significantly less than the medians for 1930–78 and for the entire period of record; statistical distributions for 1979–2011 are shifted downward in relation to distributions for 1930–78 and for the entire period of record (fig. 8H; table 4). The annual-peak-flow median for 1979–2011 (3,730 ft3/s) is about 35 percent lower than the median for the period of record (5,730 ft3/s). For day of peak, differences between the median for 1979–2011 and the medians for the other summary time periods were not signifi-cant (table 4); however, the interquartile range of day-of-peak values for 1979–2011 is considerably larger than the interquar-tile range for 1930–78.
For annual peak flow for the high-elevation gaging sta-tions in the Yellowstone River Basin, upward trends during 1930–76 generally were stronger than downward trends during 1967–2011, and statistical distributions generally were similar among summary time periods. Study results provide evidence that annual peak flow for the high-elevation long-term gag-ing stations can be reasonably considered as stationary for application of peak-flow frequency analyses within a statewide gaging-station network. For peak-flow timing, all of the seven high-elevation gaging stations have downward trends during 1967–2011, and three of those stations have day-of-peak medi-ans for 1979–2011 that are significantly less than medians for 1930–78 (table 4).
For annual peak flow for the low-elevation gaging sta-tion (Powder River at Moorhead, Montana), the upward trend during 1930–76 was weaker than the substantial downward trend during 1967–2011, and the annual-peak-flow median for 1979–2011 was substantially lower than the median for the entire period of record. Thus, study results indicate some potential changes in peak-flow characteristics after the mid-1970s, which is further discussed in the section “Discussion of Stationarity Issues for Low-Elevation Gaging Stations in Eastern Montana.”
Streamflow-Gaging Stations in the Columbia River Basin
The six gaging stations in the Columbia River Basin have mean basin elevations that range from 5,012 to 5,765 ft (fig. 1, table 1):
• Clark Fork above Missoula, Montana (gaging station 12340500; map number 665);
• Clark Fork below Missoula, Montana (gaging station 12353000; map number 688);
• Clark Fork at St. Regis, Montana (gaging station 12354500; map number 697);
• Flathead River at Flathead, British Columbia (gaging station 12355000; map number 698);
• North Fork Flathead River near Columbia Falls, Mon-tana (gaging station 12355500; map number 700); and
• Swan River near Bigfork, Montana (gaging station 12370000; map number 728).
For all of the gaging stations, nearly all peak flows are during May and June, likely caused by snowmelt runoff (possibly with associated spring rainfall). Day-of-peak values generally are uniformly distributed during May and June (fig. 9).
Fitted trends for annual peak flow and peak-flow timing, and statistical distributions for summary time periods for the six gaging stations in the Columbia River Basin are presented in figure 9. The study results indicate substantial upward trends in annual peak flow for most gaging stations during 1930–76 and moderate downward trends in annual peak flow for all gaging stations during 1967–2011 (fig. 9; table 2). Most gaging stations have small to moderate downward trends in annual peak flow during the entire period of record. The study results also indicate variable (moderate to substantial) upward trends in peak-flow timing for all gaging stations during 1930–76, but small changes that are variable in trend direc-tion among gaging stations during 1967–2011 (fig. 9; table 3). Most gaging stations have small changes in peak-flow timing during the entire period of record that are variable in trend direction.
Differences between the medians for 1979–2011 and the medians for the other summary time periods were not signifi-cant for annual peak flow and day of peak (table 4). For both annual peak flow and day of peak, statistical distributions among the summary time periods generally are similar (fig. 9).
For annual peak flow for the Columbia River Basin, upward trends during 1930–76 generally were stronger than downward trends during 1967–2011, and statistical distribu-tions generally were similar among summary time periods. Study results provide evidence that annual peak flow for the long-term gaging stations can be reasonably considered as sta-tionary for application of peak-flow frequency analyses within a statewide gaging-station network.
Summary Observations
For annual peak flow for most long-term gaging stations, upward trends during 1930–76 generally were stronger than downward trends during 1967–2011 and statistical distribu-tions generally were similar among summary time periods. Study results provide evidence that annual peak flow for most of the long-term gaging stations can be reasonably considered
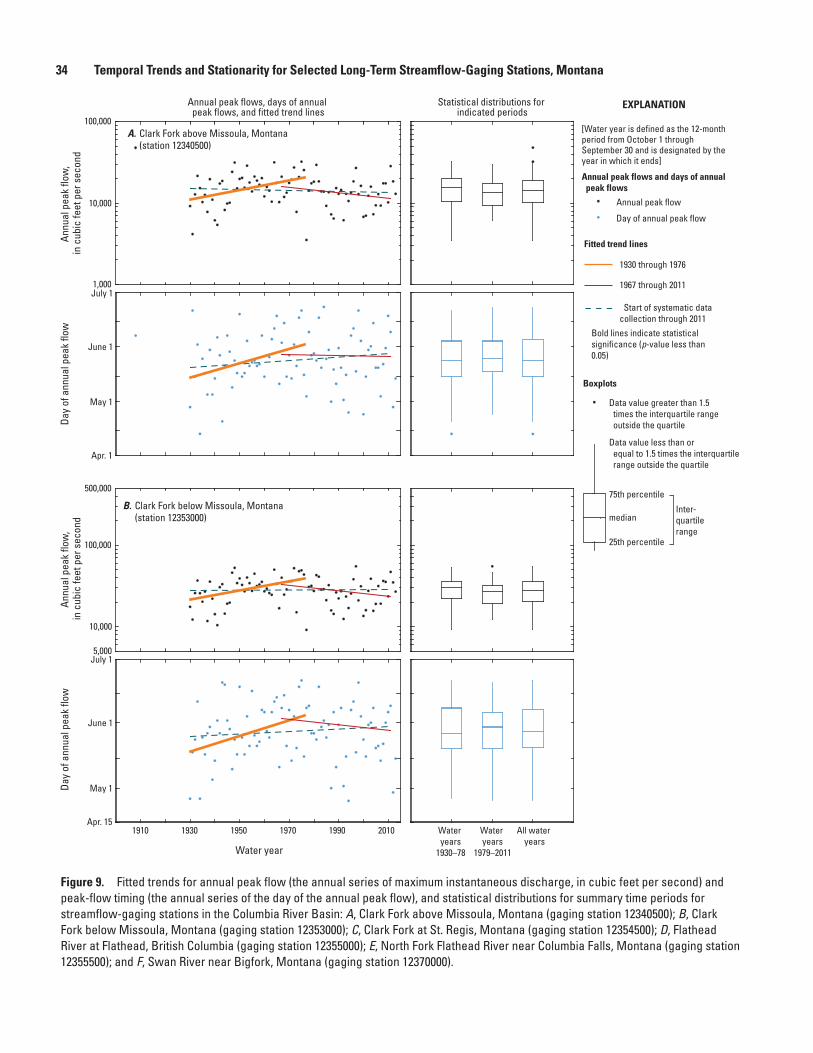
34 Temporal Trends and Stationarity for Selected Long-Term Streamflow-Gaging Stations, Montana
Water years
1930–78
Water years
1979–2011
All water years
1910 1930 1950 1970 1990 2010
Water year
May 1
Apr. 1
June 1
July 1
Day
of a
nnua
l pea
k flo
wAn
nual
pea
k flo
w,
in c
ubic
feet
per
sec
ond
1,000
10,000
100,000
Day
of a
nnua
l pea
k flo
wAn
nual
pea
k flo
w,
in c
ubic
feet
per
sec
ond
May 1
Apr. 15
June 1
July 15,000
10,000
100,000
500,000
Statistical distributions for indicated periods
Annual peak flows, days of annual peak flows, and fitted trend lines
A. Clark Fork above Missoula, Montana(station 12340500)
B. Clark Fork below Missoula, Montana(station 12353000)
[Water year is defined as the 12-month period from October 1 through September 30 and is designated by the year in which it ends]
Annual peak flows and days of annual peak flows
Boxplots
Fitted trend lines
Start of systematic data collection through 2011
1930 through 1976
Annual peak flow
Day of annual peak flow
1967 through 2011
75th percentile
median
25th percentile
Data value less than or equal to 1.5 times the interquartile range outside the quartile
Data value greater than 1.5 times the interquartile range outside the quartile
Inter-quartilerange
Bold lines indicate statistical significance (p-value less than 0.05)
EXPLANATION
Figure 9. Fitted trends for annual peak flow (the annual series of maximum instantaneous discharge, in cubic feet per second) and peak-flow timing (the annual series of the day of the annual peak flow), and statistical distributions for summary time periods for streamflow-gaging stations in the Columbia River Basin: A, Clark Fork above Missoula, Montana (gaging station 12340500); B, Clark Fork below Missoula, Montana (gaging station 12353000); C, Clark Fork at St. Regis, Montana (gaging station 12354500); D, Flathead River at Flathead, British Columbia (gaging station 12355000); E, North Fork Flathead River near Columbia Falls, Montana (gaging station 12355500); and F, Swan River near Bigfork, Montana (gaging station 12370000).
Temporal Trends and Stationarity in Annual Peak Flow and Peak-Flow Timing 35
Water years
1930–78
Water years
1979–2011
All water years
1910 1930 1950 1970 1990 2010
Water year
Day
of a
nnua
l pea
k flo
wAn
nual
pea
k flo
w,
in c
ubic
feet
per
sec
ond
May 1
Apr. 15
June 1
July 15,000
10,000
100,000
500,000
Day
of a
nnua
l pea
k flo
wAn
nual
pea
k flo
w,
in c
ubic
feet
per
sec
ond
500
1,000
10,000
50,000
May 1
Apr. 15
June 1
July 1
Statistical distributions for indicated periods
Annual peak flows, days of annual peak flows, and fitted trend lines
C. Clark Fork at St. Regis, Montana(station 12354500)
D. Flathead River at Flathead, British Columbia(station 12355000)
November 7, 2007
[Water year is defined as the 12-month period from October 1 through September 30 and is designated by the year in which it ends]
Annual peak flows and days of annual peak flows
Boxplots
Fitted trend lines
Start of systematic data collection through 1940
Start of systematic data collection through 2011
1930 through 1976
Annual peak flow
Day of annual peak flow
1967 through 2011
75th percentile
median
25th percentile
Data value less than or equal to 1.5 times the interquartile range outside the quartile
Data value greater than 1.5 times the interquartile range outside the quartile
Inter-quartilerange
Bold lines indicate statistical significance (p-value less than 0.05)
EXPLANATION
Figure 9. Fitted trends for annual peak flow (the annual series of maximum instantaneous discharge, in cubic feet per second) and peak-flow timing (the annual series of the day of the annual peak flow), and statistical distributions for summary time periods for streamflow-gaging stations in the Columbia River Basin: A, Clark Fork above Missoula, Montana (gaging station 12340500); B, Clark Fork below Missoula, Montana (gaging station 12353000); C, Clark Fork at St. Regis, Montana (gaging station 12354500); D, Flathead River at Flathead, British Columbia (gaging station 12355000); E, North Fork Flathead River near Columbia Falls, Montana (gaging station 12355500); and F, Swan River near Bigfork, Montana (gaging station 12370000).—Continued
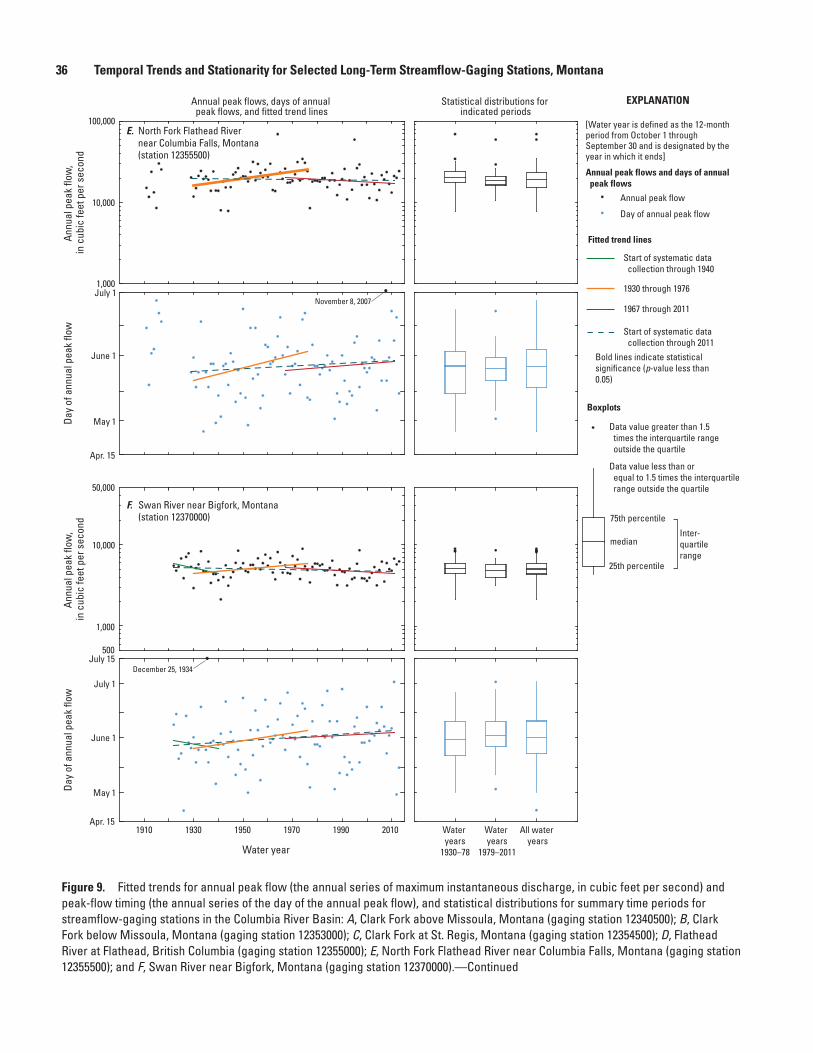
36 Temporal Trends and Stationarity for Selected Long-Term Streamflow-Gaging Stations, Montana
Water years
1930–78
Water years
1979–2011
All water years
1910 1930 1950 1970 1990 2010
Water year
Day
of a
nnua
l pea
k flo
wAn
nual
pea
k flo
w,
in c
ubic
feet
per
sec
ond
May 1
Apr. 15
June 1
July 11,000
10,000
100,000
Day
of a
nnua
l pea
k flo
wAn
nual
pea
k flo
w,
in c
ubic
feet
per
sec
ond
July 15
May 1
Apr. 15
June 1
July 1
500
1,000
10,000
50,000
Statistical distributions for indicated periods
Annual peak flows, days of annual peak flows, and fitted trend lines
E. North Fork Flathead River near Columbia Falls, Montana(station 12355500)
F. Swan River near Bigfork, Montana(station 12370000)
November 8, 2007
December 25, 1934
[Water year is defined as the 12-month period from October 1 through September 30 and is designated by the year in which it ends]
Annual peak flows and days of annual peak flows
Boxplots
Fitted trend lines
Start of systematic data collection through 1940
Start of systematic data collection through 2011
1930 through 1976
Annual peak flow
Day of annual peak flow
1967 through 2011
75th percentile
median
25th percentile
Data value less than or equal to 1.5 times the interquartile range outside the quartile
Data value greater than 1.5 times the interquartile range outside the quartile
Inter-quartilerange
Bold lines indicate statistical significance (p-value less than 0.05)
EXPLANATION
Figure 9. Fitted trends for annual peak flow (the annual series of maximum instantaneous discharge, in cubic feet per second) and peak-flow timing (the annual series of the day of the annual peak flow), and statistical distributions for summary time periods for streamflow-gaging stations in the Columbia River Basin: A, Clark Fork above Missoula, Montana (gaging station 12340500); B, Clark Fork below Missoula, Montana (gaging station 12353000); C, Clark Fork at St. Regis, Montana (gaging station 12354500); D, Flathead River at Flathead, British Columbia (gaging station 12355000); E, North Fork Flathead River near Columbia Falls, Montana (gaging station 12355500); and F, Swan River near Bigfork, Montana (gaging station 12370000).—Continued
Temporal Trends and Stationarity in Annual Peak Flow and Peak-Flow Timing 37
as stationary for application of peak-flow frequency analyses within a statewide gaging-station network; however, for two low-elevation gaging stations (Poplar River at international boundary [gaging station 06178000; map number 386; fig. 1, table 1] and Powder River at Moorhead, Montana [gaging sta-tion 06324500; map number 542; fig. 1, table 1]), substantial downward trends in annual peak flow during 1967–2011 were of similar or stronger magnitude than the upward trends during 1930–76, and the annual-peak-flow medians for 1979–2011 were substantially lower than the medians for the entire period of record. These issues are further discussed in the section “Discussion of Stationarity Issues for Low-Elevation Gaging Stations in Eastern Montana.”
For peak-flow timing for most long-term gaging sta-tions, differences in trends between the periods 1930–76 and 1967–2011 are variable and not particularly strong, and sta-tistical distributions generally are similar among the summary time periods. However, for two gaging stations on a Mis-souri River headwater tributary (Gallatin River near Gallatin Gateway, Montana [gaging station 06043500; map number 80; fig. 1, table 1] and Gallatin River at Logan, Montana [gaging station 06052500; map number 88; fig. 1, table 1]), and for five of the seven high-elevation gaging stations in the Yel-lowstone River Basin (Yellowstone River at Corwin Springs, Montana [gaging station 06191500; map number 424; fig. 1, table 1], Yellowstone River near Livingston, Montana [gaging station 06192500; map number 425; fig. 1, table 1], Clarks Fork Yellowstone River near Belfry, Montana [gaging station 06207500; map number 445; fig.1, table 1], Clarks Fork Yel-lowstone River at Edgar, Montana [gaging station 06208500; map number 448; fig. 1, table 1], Yellowstone River at Bill-ings, Montana [gaging station 06214500; map number 458; fig. 1, table 1]), downward trends in peak-flow timing during 1967–2011 generally were stronger than upward trends during 1930–1976 and day-of-peak medians for 1979–2011 were considerably less than day-of-peak medians for 1930–78. The downward trends in peak-flow timing for 1967–2011 indicate that the timing of annual peak flows changed from later in the year to earlier in the year. For the seven high-elevation gaging stations, the mean change during 1967–2011 was about 13 days (range of 8 to 22 days).
For most of the high-elevation gaging stations on the Missouri River headwaters tributaries and in the Yellowstone River and Columbia River Basins, there was general corre-spondence between trend patterns for annual peak flow and trend patterns for peak-flow timing. That is, during periods when there were upward trends in annual peak flow, there also generally were upward trends peak-flow timing. Conversely, during periods when there were downward trends in annual peak flow, there generally were downward trends in peak-flow timing. Moore and others (2007) also reported general correspondence between trend patterns in runoff variables and timing variables.
Discussion of Stationarity Issues for Low-Elevation Streamflow-Gaging Stations in Eastern Montana
The two low-elevation gaging stations in eastern Mon-tana (Poplar River at international boundary [gaging station 06178000; map number 386; fig. 1, table 1] and Powder River at Moorhead, Montana [gaging station 06324500; map number 542; fig. 1, table 1]) had considerable changes in annual peak-flow characteristics after the mid-1970s, which might provide evidence of potential nonstationarity in the peak-flow records. Although a small number of stations are represented, addi-tional investigation was considered to be warranted.
Peak-flow frequencies for the two gaging stations based on data collected during 1979–2011 were compared to peak-flow frequencies based on the entire period of record. Docu-mentation concerning development of the peak-flow frequen-cies is presented in appendix 1 (at the back of this report chapter). Documentation regarding analytical procedures for the peak-flow frequency analyses is presented in table 1–1. Peak-flow frequency results are presented in table 1-2 and figure 1–1.
For Poplar River at international boundary, peak-flow frequencies for the period 1979–2011 were somewhat lower than peak-flow frequencies for the entire period of record (fig. 1–1A, table 1–2). For individual annual exceedance probabili-ties (AEPs), peak-flow frequencies for the period 1979–2011 ranged from 19 to 50 percent lower than peak-flow frequen-cies for the entire period of record. For most AEPs, the peak-flow frequencies for the period 1979–2011 were lower than the lower 95-percent confidence level of the peak-flow frequency curve for the entire period of record.
For Powder River at Moorhead, Montana, peak-flow frequencies for the period 1979–2011 were substantially lower than peak-flow frequencies for the entire period of record (fig. 1–1B, table 1–1). For individual AEPs, peak-flow frequencies for the period 1979–2011 ranged from 32 to 65 percent lower than peak-flow frequencies for the entire period of record (table 1–2). For all AEPs, the peak-flow frequencies for the period 1979–2011 were lower than the lower 95-percent con-fidence level of the peak-flow frequency curve for the entire period of record. Furthermore, for all AEPs, the upper 95-per-cent confidence level for the period 1979–2011 was lower than the lower 95-percent confidence level of the peak-flow frequency curve for the entire period of record.
The differences between peak-flow frequencies based on 1979–2011 data and peak-flow frequencies based on the entire period of record provide additional information on potential nonstationarity in annual peak flow for the two low-elevation gaging stations in eastern Montana. The observed differences could have large effects on some uses of peak-flow frequency information.
It is difficult to accurately determine the possible causes of the potential nonstationarity in annual peak flow. Con-sequently, it also is difficult to develop a clear approach for
38 Temporal Trends and Stationarity for Selected Long-Term Streamflow-Gaging Stations, Montana
handling this potential nonstationarity issue within the context of application of peak-flow frequency analyses within a state-wide gaging-station network.
The two low-elevation gaging stations that exhibit potential nonstationarity are located in drainage basins that are strongly affected by agricultural activities that potentially affect the hydrologic regimes. Primary agricultural activities that might alter natural hydrologic conditions include con-struction of small impoundments (primarily for stock-watering purposes) and irrigation diversions. Because of the extensive data requirements of the trend analysis, a small number of stations in low-elevation agriculture-dominated basins are represented; however, the potential nonstationarity issues rep-resented by the two low-elevation gaging stations might have application to a large number of gaging stations in Montana.
As previously discussed in the section “Selection of Streamflow-Gaging Stations,” the current (2015) criterion used by the USGS classifies a gaging station as affected by major dam regulation if the drainage area upstream from a single upstream dam exceeds 20 percent of the drainage area for the gaging station. Additionally, the USGS classifies a gag-ing station as affected by minor dam regulation if the drainage area upstream from all upstream dams exceeds 20 percent of the drainage area for the gaging station (McCarthy and oth-ers, 2016). According to these criteria, the two low-elevation gaging stations are not classified as affected by major or minor regulation. However, for the two low-elevation gaging sta-tions, additional considerations might affect their regulation status.
Much of the drainage basins of the two low-elevation gaging stations are located in either Saskatchewan, Canada (for Poplar River at international boundary) or Wyoming (for Powder River at Moorhead, Montana). The geospatial data for small impoundments used by the USGS for regulation clas-sification (McCarthy and others, 2016) were not available for Canada and Wyoming, and quantitative assessment of poten-tial effects of small-impoundment development was difficult. However, some qualitative information might be relevant to evaluating potential effects of small-impoundment develop-ment for the two gaging stations.
For Poplar River at international boundary, a second gaging station (Poplar River near Bredette, Montana [gaging station 06180500]) is downstream. Within the intervening drainage area in Montana between the two gaging stations, there was small-impoundment development during about 1950–65 that affects about 13 percent of the intervening drain-age area. The somewhat small amount of small-impoundment development in the intervening drainage area might indicate that small-impoundment development was not a large contrib-utor to nonstationarity issues for Poplar River at international boundary.
For Powder River at Moorhead, a second gaging sta-tion (Powder River near Locate, Montana [gaging station 06326500]) is downstream. Within the intervening drainage area in Montana between the two gaging stations, there was small-impoundment development during about 1940–61 that
affects about 20 percent of the intervening drainage area. Also, small-impoundment development probably was extensive in the Powder River Basin in Wyoming during about 1997–2010 when coalbed methane extraction activities were extensive (National Research Council, 2010); therefore, small-impound-ment development might be a contributor to nonstationarity issues for Powder River at Moorhead, Montana.
The criteria used by the USGS for regulation classifica-tion do not incorporate assessment of irrigation diversions. Datasets for irrigation diversions are not readily available at sufficient scale and coverage for assessing effects on the application of peak-flow frequency analyses within a statewide gaging-station network. Compilation of a statewide dataset of locations and capacities of irrigation canals would be impor-tant for better definition of regulation effects on streamflow characteristics. Lacking suitable data, it is difficult to assess potential effects of irrigation diversions on the potential non-stationarity issues for the two low-elevation gaging stations.
Changes in climatic characteristics after the mid-1970s possibly contributed to the potential nonstationarity issues. Lack of considerable indication of potential nonstationarity in annual peak flow for the other long-term gaging stations in this study might indicate that climatic changes have been more pronounced with respect to effects on peak flows in low-elevation areas in eastern Montana than in areas represented by the other long-term gaging stations. Another possibility is that climatic changes after the mid-1970s are exacerbated in low-elevation areas where small-impoundment development and potential effects of irrigation diversions might be more extensive.
Potential nonstationarity issues for peak flows have been considered in other parts of the United States. Increasing peak flows have been observed in recent years (after the 1970s) in Maine (Hodgkins, 2010) and North Dakota (Williams-Sether, 2015). In Maine, Hodgkins (2010) suggested a conservative approach of computing peak-flow frequencies from datasets restricted to recent years and also datasets that include the entire period of record and then selecting the higher computed peak-flow frequencies. In North Dakota, peak-flow frequen-cies have been calculated using generalized skew values determined from the truncated period 1960–2009 (Williams-Sether, 2015). For the two low-elevation gaging stations in eastern Montana with indication of decreasing peak flows after the mid-1970s, a conservative approach would be to compute peak-flow frequencies based on the entire period of record.
The issue of potential nonstationarity of annual peak flow in low-elevation areas of eastern Montana might be clari-fied by additional future research. Research activities might include (1) detailed analysis of effects of changes in climatic characteristics after the mid-1970s on hydrologic regimes in eastern Montana; (2) detailed documentation of locations and capacities of irrigation diversion canals in eastern Montana; (3) detailed documentation of locations, storage capacities, and operations of small impoundments in eastern Montana; (4) analysis of effects of irrigation diversion canals and small impoundments on peak-flow characteristics; and (5) analysis
Summary and Conclusions 39
of the combined effects of changes in climatic characteristics, diversions, and small impoundments on peak-flow character-istics in eastern Montana. A possible initial follow-up study might involve relaxing the rigorous dataset requirements that were used in this study to include additional low-elevation gaging stations in eastern Montana. This expanded study might provide information on the areal extent of the observed trend patterns for the two low-elevation gaging stations.
Summary and ConclusionsThe primary purpose of Chapter B of this Scientific
Investigations Report is to present the results of a large-scale study by the U.S. Geological Survey, in cooperation with the Montana Department of Transportation and the Mon-tana Department of Natural Resources and Conservation to investigate general patterns in peak-flow temporal trends and stationarity through water year 2011 for 24 long-term stream-flow-gaging stations (hereinafter referred to as gaging sta-tions) in Montana. Hereinafter, all years refer to water years; a water year is the 12-month period from October 1 through September 30 and is designated by the year in which it ends. Temporal trends were analyzed for two hydrologic variables: annual peak flow and peak-flow timing. Annual peak flow is the annual series of maximum instantaneous discharge in cubic feet per second. Peak-flow timing is the annual series of the day of the annual peak flow (hereinafter referred to as day of peak).
The 24 long-term gaging stations are grouped according to the following major river basins: Saskatchewan River Basin (2 gaging stations); Missouri River Basin (16 gaging stations); and Columbia River Basin (6 gaging stations). Gaging stations in the Missouri River are subgrouped according to the follow-ing descriptive classes: (1) Missouri River headwaters tributar-ies (three gaging stations); (2) upper Missouri River tributaries (two gaging stations); (3) Musselshell River Basin (one gaging station); (4) upper Milk River Basin (one gaging station); (4) lower Missouri River tributary (one gaging station); and (5) Yellowstone River Basin (eight gaging stations).
Exploratory analyses indicated that peak flows for most sites generally were lower than median peak flow (determined for the entire period of record through 2011) from about 1930 to the early 1940s and generally were higher than median peak flow from the mid- to late 1960s to the mid- to late 1970s. These generally consistent large-scale patterns served as the basis for defining four trend analysis periods that were applied for each gaging station: (1) from the start of systematic data collection through 1940 (for gaging stations with at least 15 years of systematic record during the period); (2) from 1930 to 1976; (3) from 1967 to 2011; and (4) from the start of system-atic data collection through 2011.
For the defined trend analysis periods, trend magnitudes were computed using the Sen slope estimator. Statistical distributions of peak-flow characteristics were compiled for
selected data summary periods for each gaging station. The data summary periods were (1) 1930–78, (2) 1979–2011, and (3) the entire period of record. The 1930–78 summary period was selected to represent peak-flow characteristics during a period before the mid-1970s that generally ranged from an unusually dry period to an unusually wet period and typically encompassed the full range in historical variability; the sum-mary period purposely extends slightly past the mid-1970s to include transition years. The 1979–2011 summary period was selected to represent the period after the mid 1970s that might be affected by reported changes in hydrologic regimes associ-ated with changes in climatic conditions. The entire period of record (including any pre-1930 data) also was statistically summarized. For annual peak flow, the entire period of record represents the data that are typically used to calculate peak-flow frequencies. For a given gaging station, stationarity of annual peak flow requires that all of the data represent a con-sistent hydrologic regime within the same (albeit highly vari-able) fundamental climatic system. As such, a primary consid-eration in this study is whether annual peak flow data after the mid-1970s are substantially different from data for the entire period of record and thus might result in substantially different peak-flow frequencies. The nonparametric Wilcoxon rank sum procedure was used to test for significant differences between the annual-peak-flow median for 1979–2011 in relation to medians for 1930–78 and for the entire period of record. The nonparametric Wilcoxon rank sum procedure also was used to test for significant changes in peak-flow timing, with the test applied to the day-of-peak median for 1979–2011 in relation to medians for 1930–78 and for the entire period of record. In this study, a significance level (p-value) less than 0.05 indi-cates statistical significance.
For annual peak flow for most long-term gaging stations, upward trends during 1930–76 generally were stronger than downward trends during 1967–2011, and statistical distribu-tions generally were similar among summary time periods. Study results provide evidence that annual peak flow for most of the long-term gaging stations can be reasonably considered as stationary for application of peak-flow frequency analyses within a statewide gaging-station network. However, for two low-elevation gaging stations in eastern Montana (Poplar River at international boundary [gaging station 06178000] and Powder River at Moorhead, Montana [gaging station 06324500]), substantial downward trends in annual peak flow during 1967–2011 were of similar or stronger magnitude than the upward trends during 1930–76, and the annual-peak-flow medians for 1979–2011 were substantially lower than the medians for the entire period of record.
For peak-flow timing for most long-term gaging sta-tions, differences in trending between the periods 1930–76 and 1967–2011 are variable and not particularly strong, and statistical distributions generally are similar among the sum-mary time periods. However, for two gaging stations on a Mis-souri River headwater tributary (Gallatin River near Gallatin Gateway, Montana [gaging station 06043500] and Gallatin River at Logan, Montana [gaging station 06052500]) and for
40 Temporal Trends and Stationarity for Selected Long-Term Streamflow-Gaging Stations, Montana
five high-elevation gaging stations in the Yellowstone River Basin (Yellowstone River at Corwin Springs, Montana [gag-ing station 06191500], Yellowstone River near Livingston, Montana [gaging station 06192500], Clarks Fork Yellowstone River near Belfry, Montana [gaging station 06207500], Clarks Fork Yellowstone River at Edgar, Montana [gaging station 06208500], and Yellowstone River at Billings, Montana [gag-ing station 06214500]), downward trends in peak-flow timing during 1967–2011 generally were stronger than upward trends during 1930–76, and day-of-peak medians for 1979–2011 were considerably less than medians for 1930–78.
For most of the high-elevation gaging stations on the Missouri River headwaters tributaries and in the Yellowstone River and Columbia River Basins, there was general corre-spondence between trend patterns for annual peak flow and trend patterns for peak-flow timing. That is, during periods when there were upward trends in annual peak flow, there also generally were upward trends in peak-flow timing. Con-versely, during periods when there were downward trends in annual peak flow, there generally were downward trends in peak-flow timing.
The two low-elevation gaging stations in eastern Mon-tana (Poplar River at international boundary [gaging station 06178000] and Powder River at Moorhead, Montana [gaging station 06324500]) have had considerable changes in annual-peak-flow characteristics after the mid-1970s, which might provide evidence of potential nonstationarity in the peak-flow records. Peak-flow frequencies for the two gaging stations based on data collected during 1979–2011 were compared to peak-flow frequencies based on the entire period of record. For Poplar River at international boundary, peak-flow frequen-cies for the period 1979–2011 were somewhat lower than peak-flow frequencies for the entire period of record. For individual annual exceedance probabilities (AEPs), peak-flow frequencies for the period 1979–2011 ranged from 19 to 50 percent lower than peak-flow frequencies for the entire period of record. For most AEPs, the peak-flow frequencies for the period 1979–2011 were lower than the lower 95-percent con-fidence level of the peak-flow frequency curve for the entire period of record. For Powder River at Moorhead, Montana, peak-flow frequencies for the period 1979–2011 were substan-tially lower than peak-flow frequencies for the entire period of record. For individual AEPs, peak-flow frequencies for the period 1979–2011 ranged from 32 to 65 percent lower than peak-flow frequencies for the entire period of record. For all AEPs, the peak-flow frequencies for the period 1979–2011 were lower than the lower 95-percent confidence level of the peak-flow frequency curve for the entire period of record. Fur-thermore, for all AEPs the upper 95-percent confidence level for the period 1979–2011 was lower than the lower 95-percent confidence level of the peak-flow frequency curve for the entire period of record. The differences between peak-flow frequencies based on 1979–2011 data and peak-flow frequen-cies based on the entire period of record provide additional information on potential nonstationarity in annual peak flow
for the two low-elevation gaging stations in eastern Montana. The observed differences could have large effects on some uses of peak-flow frequency information.
It is difficult to accurately determine the possible causes of the potential nonstationarity in annual peak flow. Conse-quently, it also is difficult to develop a clear approach for han-dling this potential nonstationarity issue within the context of application of peak-flow frequency analyses within a statewide gaging-station network. The two low-elevation gaging stations that exhibit potential nonstationarity are located in drainage basins that are strongly affected by agricultural activities that potentially affect the hydrologic regimes. Primary agricul-tural activities that might alter natural hydrologic conditions include construction of small impoundments (primarily for stock-watering purposes) and irrigation diversions. Temporal variability in these activities might contribute to the potential nonstationarity issues. Changes in climatic characteristics after the mid-1970s also possibly contribute to the potential nonsta-tionarity issues. Lack of considerable indication of potential nonstationarity in annual peak flow for the other long-term gaging stations in this study might indicate that climatic changes have been more pronounced with respect to effects on peak flows in low-elevation areas in eastern Montana than in areas represented by the other long-term gaging stations. Another possibility is that climatic changes after the mid-1970s are exacerbated in low-elevation areas where small-impoundment development and potential effects of irrigation diversions might be more extensive.
References
Aziz, O.I., and Burn, D.H., 2006, Trends and variability in the hydrological regime of the Mackenzie River Basin: Journal of Hydrology, v. 319, p. 282–294. [Also available at http://dx.doi.org/10.1016/j.jhydrol.2005.06.039.]
Cayan, D.R., Kammerdiener, S.A., Dettinger, M.D., Caprio, J.M., and Peterson, D.H., 2001, Changes in the onset of spring in the western United States: Bulletin of the American Meteorological Society, v. 82, no. 3, p. 399–415. [Also available at http://dx.doi.org/10.1175/1520-0477(2001)082<0399:CITOOS>2.3.CO;2.]
Bureau of Reclamation, 2013, St. Mary diversion dam: accessed January 2, 2015, at http://www.usbr.gov/projects/Facility.jsp?fac_Name=St.+Mary+Diversion+Dam.
Cleveland, W.S., 1985, The elements of graphing data: Mon-terey, Calif., Wadsworth Books, 323 p.
Cohn, T.A., and Lins, H.F., 2005, Nature’s style—Naturally trendy: Geophysical Research Letters, v. 32, L23402, 5 p. [Also available at http://dx.doi.org/10.1029/2005GL024476.]
References 41
Dettinger, M.D., and Cayan, D.R., 1995, Large-scale atmo-spheric forcing of recent trends toward early snowmelt in California: Journal of Climate, v. 8, no. 3, p. 606–623. [Also available at http://dx.doi.org/10.1175/1520-0442(1995)008<0606:LSAFOR>2.0.CO;2.]
Gesch, D., Oimoen, M., Greenlee, S., Nelson, C., Steuck, M., and Tyler, D., 2002, The National Elevation Dataset: Photogrammetric Engineering and Remote Sensing, v. 68, p. 5–11.
Helsel, D.R., and Hirsch, R.M., 2002, Statistical methods in water resources: Techniques of Water-Resources Investiga-tions, book 4, chap. A3, 510 p. [Also available at http://pubs.usgs.gov/twri/twri4a3/.]
Hirsch, R.M., 2011, A perspective on nonstationarity and water management: Journal of the American Water Resources Association, v. 47, no. 3, p. 436–446. [Also avail-able at http://dx.doi.org/10.1111/j.1752-1688.2011.00539.x.]
Homer, Collin, Dewitz, Jon, Fry, Joyce, Coan, Michael, Hos-sain, Nazmul, Larson, Charles, Herold, Nate, McKerrow, Alexa, VanDriel, J.N., and Wickham, James, 2007, Comple-tion of the 2001 National Land Cover Database for the conterminous United States: Photogrammetric Engineering and Remote Sensing, v. 73, p. 337–341.
Hodgkins, G.A., 2010, Historical changes in annual peak flows in Maine and implications for flood-frequency analy-sis: U.S. Geological Survey Scientific Investigations Report 2010–5094, 38 p. [Also available at http://pubs.usgs.gov/sir/2010/5094/.]
Hodgkins, G.A., Dudley, R.W., and Aichele, S.S., 2007, His-torical changes in precipitation and streamflow in the U.S. Great Lakes Basin, 1915–2004: U.S. Geological Survey Scientific Investigations Report 2007–5118, 31 p. [Also available at http://pubs.usgs.gov/sir/2007/5118/.]
Holmes, R.R., Jr., Koenig, T.A., and Karstensen, K.A., 2010, Flooding in the United States Midwest, 2008: U.S. Geologi-cal Survey Professional Paper 1775, 64 p. [Also available at http://pubs.usgs.gov/pp/1775/.]
Horizon Systems Corporation, 2013, NHDPlus Version 2: accessed January 16, 2014, at http://www.horizon-systems.com/NHDPlus/NHDPlusV2_home.php.
Knowles, Noah, Dettinger, M.D., and Cayan, D.R., 2006, Trends in snowfall versus rainfall in the western United States: Journal of Climate, v. 19, p. 4545–4559. [Also avail-able at http://dx.doi.org/10.1175/JCLI3850.1.]
Mann, H.B., 1945, Nonparametric test against trend: Econo-metrica, v. 13, no. 3, p. 245–259. [Also available at http://dx.doi.org/10.2307/1907187.]
McCabe, G.J., and Clark, M.P., 2005, Trends and variability in snowmelt runoff in the western United States: Journal of Hydrometeorology, v. 6, p. 476–482. [Also available at http://dx.doi.org/http://dx.doi.org/10.1175/JHM428.1.]
McCarthy, P.M., Dutton, D.M., Sando, S.K., and Sando, Roy, 2016, Montana StreamStats—A method for retrieving basin and streamflow characteristics in Montana: U.S. Geological Survey Scientific Investigations Report 2015–5019–A, 16 p. [Also available at http://dx.doi.org/10.3133/sir20155019A.]
Mock, C.J., 1996, Climatic controls and spatial variations of precipitation in the western United States: Journal of Climate, v. 9, no. 5, p. 1111–1125. [Also available at http://dx.doi.org/10.1175/1520-0442(1996)009<1111:CCASVO>2.0.CO;2.]
Moore, J.N., Harper, J.T., and Greenwood, M.C., 2007, Sig-nificance of trends toward earlier snowmelt runoff, Colum-bia and Missouri Basin headwaters, western United States: Geophysical Research Letters, v. 34, 5 p. [Also available at http://dx.doi.org/10.1029/2007GL031022.]
Mote, P.W., Hamlet, A.F., Clark, M.P., and Lettenmaier, D.P., 2005, Declining mountain snowpack in western North America: Bulletin of the American Meteorological Soci-ety, v. 86, no. 1, p. 39–49. [Also available at http://dx.doi.org/10.1175/BAMS-86-1-39.]
National Research Council, 2010, Management and effects of coalbed methane development and produced water in the western United States: Washington, D.C., National Acad-emies Press, 217 p.
Nichols, Neville, 2001, The insignificance of significance testing: Bulletin of the American Meteorological Society, v. 82, no. 5, p. 981–986. [Also available at http://dx.doi.org/10.1175/1520-0477(2001)082<0981:CAATIO>2.3.CO;2.]
National Aeronautics and Space Administration Goddard Insti-tute for Space Studies, 2013, Long-term global warming trend continues: accessed January 8, 2014, at http://earthob-servatory.nasa.gov/IOTD/view.php?id=80167.
Parrett, Charles, and Johnson, D.R., 2004, Methods for esti-mating flood frequency in Montana based on data through water year 1998: U.S. Geological Survey Water-Resources Investigations Report 03–4308, 101 p. [Also available at http://pubs.usgs.gov/wri/wri03-4308/.]
Pederson, G.T., Betancourt, J.L., and McCabe, G.J., 2013, Regional patterns and proximal causes of the recent snow-pack decline in the Rocky Mountains, U.S.: Geophysical Research Letters, v. 40, p. 1811–1816. [Also available at http://dx.doi.org/10.1002/grl.50424.]
42 Temporal Trends and Stationarity for Selected Long-Term Streamflow-Gaging Stations, Montana
Pederson, G.T., Gray, S.T., Ault, Toby, Marsh, Wendy, Fagre, D.B., Bunn, A.G., Woodhouse, C.A., and Graumlich, L.J., 2011, Climatic controls on the snowmelt hydrology of the northern Rocky Mountains: Journal of Climate, v. 24, no. 6, p. 1666–1687. [Also available at http://dx.doi.org/10.1175/2010JCLI3729.1.]
PRISM Climate Group, 2015, 30-year normal: Oregon State University, accessed February 24, 2015, at http://www.prism.oregonstate.edu/normals/.
Sando, S.K., McCarthy, P.M., and Dutton, D.M., 2016, Peak-flow frequency analyses and results based on data through water year 2011 for selected streamflow-gaging stations in or near Montana: U.S. Geological Survey Scientific Investi-gations Report 2015–5019–C, 27 p. [Also available at http://dx.doi.org/10.3133/sir20155019C.]
Sen, P.K., 1968, Estimates of the regression coefficient based on Kendall’s tau: Journal of American Statistical Associa-tion, v. 63, no. 324, p. 1379–1389. [Also available at http://dx.doi.org/10.2307/2285891.]
Shinker, J.J., 2010, Visualizing spatial heterogeneity of western U.S. climate variability: Earth Interactions, v. 14, no. 10, p. 1–15. [Also available at http://dx.doi.org/10.1175/2010EI323.1.]
Stewart, I.T., Cayan, D.R., and Dettinger, M.D., 2004, Changes in snowmelt runoff timing in western North Amer-ica under a ‘Business as Usual’ climate change scenario: Climatic Change, v. 62, no. 1, p. 217–232. [Also available at http://dx.doi.org/10.1023/B%3ACLIM.0000013702.22656.e8.]
U.S. Geological Survey, 2015b, The National Map hydrogra-phy: accessed March 5, 2015, at http://nhd.usgs.gov/index.html.
U.S. Interagency Advisory Council on Water Data, 1982, Guidelines for determining flood flow frequency: Hydrol-ogy Subcommittee, Bulletin 17B, appendixes 1–14, 28 p.
Wahl, K.L., 1992, Evaluation of trends in runoff in the west-ern United States, in Hermann, R., ed., Managing water resources during global change: American Water Resources Association, p. 701–710.
Westmacott, J.R., and Burn, D.H., 1997, Climate change effects on the hydrologic regime within the Churchill-Nel-son River Basin: Journal of Hydrology, v. 202, p. 263–279. [Also available at http://dx.doi.org/10.1016/S0022-1694(97)00073-5.]
Wilcoxon, Frank, 1945, Individual comparisons by ranking methods: Biometric Bulletin, v. 1, p. 80–83.
Williams-Sether, Tara, 2015, Regional regression equations to estimate peak-flow frequency at sites in North Dakota using data through 2009: U.S. Geological Survey Scientific Investigations Report 2015–5096, 12 p., accessed December 16, 2015, at http://dx.doi.org/10.3133/sir20155096.
Zelt, R.B., Boughton, Greg, Miller, K.A., Mason, J.P., and Gianakos, L.M., 1999, Environmental setting of the Yellow-stone River Basin, Montana, North Dakota, and Wyoming: U.S. Geological Survey Water-Resources Investigations Report 98–4269, 113 p. [Also available at http://pubs.usgs.gov/wri/wri984269/.]

Appendix 1
44 Temporal Trends and Stationarity for Selected Long-Term Streamflow-Gaging Stations, Montana
Appendix 1. Information on Peak-Flow Frequency Analyses for Low-Elevation Streamflow-Gaging Stations in Eastern Montana
Peak-flow frequency analyses for Poplar River at international boundary (streamflow-gaging station 06178000; map num-ber 386; fig. 1, table 1) and Powder River at Moorhead, Montana (streamflow-gaging station 06324500; map number 542; fig. 1, table 1) were done using procedures described by Sando and others (2016). Estimates of peak-flow magnitudes for 66.7-, 50-, 42.9-, 20-, 10-, 4-, 2-, 1-, 0.5-, and 0.2-percent annual exceedance probabilities (AEPs) are reported. These AEPs correspond to 1.5-, 2-, 2.33-, 5-, 10-, 25-, 50-, 100-, 200-, and 500-year recurrence intervals.
For each of the streamflow-gaging stations, peak-flow frequency analyses were done on two of the data summary periods: (1) 1979–2011, and (2) the entire period of record. Documentation regarding analytical procedures for the peak-flow frequency analyses is presented in table 1–1. Peak-flow frequency results are presented in table 1–2 and figure 1–1.
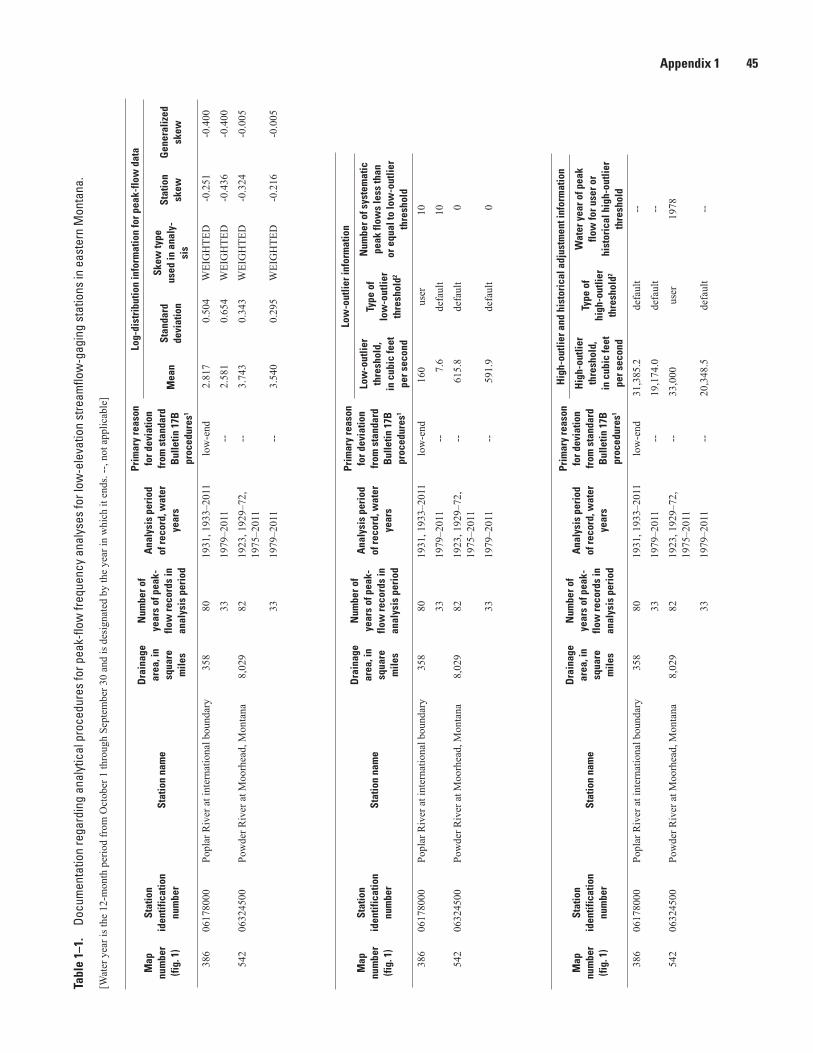
Appendix 1 45Ta
ble
1–1.
Do
cum
enta
tion
rega
rdin
g an
alyt
ical
pro
cedu
res
for p
eak-
flow
freq
uenc
y an
alys
es fo
r low
-ele
vatio
n st
ream
flow
-gag
ing
stat
ions
in e
aste
rn M
onta
na.
[Wat
er y
ear i
s the
12-
mon
th p
erio
d fr
om O
ctob
er 1
thro
ugh
Sept
embe
r 30
and
is d
esig
nate
d by
the
year
in w
hich
it e
nds.
--, n
ot a
pplic
able
]
Map
nu
mbe
r (fi
g. 1
)
Stat
ion
id
entif
icat
ion
num
ber
Stat
ion
nam
e
Dra
inag
e ar
ea, i
n sq
uare
m
iles
Num
ber o
f ye
ars
of p
eak-
flow
reco
rds
in
anal
ysis
per
iod
Ana
lysi
s pe
riod
of
reco
rd, w
ater
ye
ars
Prim
ary
reas
on
for d
evia
tion
from
sta
ndar
d B
ulle
tin 1
7B
proc
edur
es1
Log-
dist
ribu
tion
info
rmat
ion
for p
eak-
flow
dat
a
Mea
nSt
anda
rd
devi
atio
n
Skew
type
us
ed in
ana
ly-
sis
Stat
ion
skew
Gen
eral
ized
sk
ew
386
0617
8000
Popl
ar R
iver
at i
nter
natio
nal b
ound
ary
358
8019
31, 1
933–
2011
low
-end
2.81
70.
504
WEI
GH
TED
-0.2
51-0
.400
3319
79–2
011
--2.
581
0.65
4W
EIG
HTE
D-0
.436
-0.4
00
542
0632
4500
Pow
der R
iver
at M
oorh
ead,
Mon
tana
8,02
982
1923
, 192
9–72
, 19
75–2
011
--3.
743
0.34
3W
EIG
HTE
D-0
.324
-0.0
05
3319
79–2
011
--3.
540
0.29
5W
EIG
HTE
D-0
.216
-0.0
05
Map
nu
mbe
r (fi
g. 1
)
Stat
ion
id
entif
icat
ion
num
ber
Stat
ion
nam
e
Dra
inag
e ar
ea, i
n sq
uare
m
iles
Num
ber o
f ye
ars
of p
eak-
flow
reco
rds
in
anal
ysis
per
iod
Ana
lysi
s pe
riod
of
reco
rd, w
ater
ye
ars
Prim
ary
reas
on
for d
evia
tion
from
sta
ndar
d B
ulle
tin 1
7B
proc
edur
es1
Low
-out
lier i
nfor
mat
ion
Low
-out
lier
thre
shol
d,
in c
ubic
feet
pe
r sec
ond
Type
of
low
-out
lier
thre
shol
d2
Num
ber o
f sys
tem
atic
pe
ak fl
ows
less
than
or
equ
al to
low
-out
lier
thre
shol
d
386
0617
8000
Popl
ar R
iver
at i
nter
natio
nal b
ound
ary
358
8019
31, 1
933–
2011
low
-end
1
60us
er10
3319
79–2
011
--7.
6de
faul
t10
542
0632
4500
Pow
der R
iver
at M
oorh
ead,
Mon
tana
8,02
982
1923
, 192
9–72
, 19
75–2
011
--61
5.8
defa
ult
0
3319
79–2
011
--59
1.9
defa
ult
0
Map
nu
mbe
r (fi
g. 1
)
Stat
ion
id
entif
icat
ion
num
ber
Stat
ion
nam
e
Dra
inag
e ar
ea, i
n sq
uare
m
iles
Num
ber o
f ye
ars
of p
eak-
flow
reco
rds
in
anal
ysis
per
iod
Ana
lysi
s pe
riod
of
reco
rd, w
ater
ye
ars
Prim
ary
reas
on
for d
evia
tion
from
sta
ndar
d B
ulle
tin 1
7B
proc
edur
es1
Hig
h-ou
tlier
and
his
tori
cal a
djus
tmen
t inf
orm
atio
n
Hig
h-ou
tlier
th
resh
old,
in
cub
ic fe
et
per s
econ
d
Type
of
high
-out
lier
thre
shol
d2
Wat
er y
ear o
f pea
k flo
w fo
r use
r or
hist
oric
al h
igh-
outli
er
thre
shol
d
386
0617
8000
Popl
ar R
iver
at i
nter
natio
nal b
ound
ary
358
8019
31, 1
933–
2011
low
-end
31,3
85.2
defa
ult
--
3319
79–2
011
--19
,174
.0de
faul
t--
542
0632
4500
Pow
der R
iver
at M
oorh
ead,
Mon
tana
8,02
982
1923
, 192
9–72
, 19
75–2
011
-- 3
3,00
0us
er19
78
3319
79–2
011
--20
,348
.5de
faul
t--
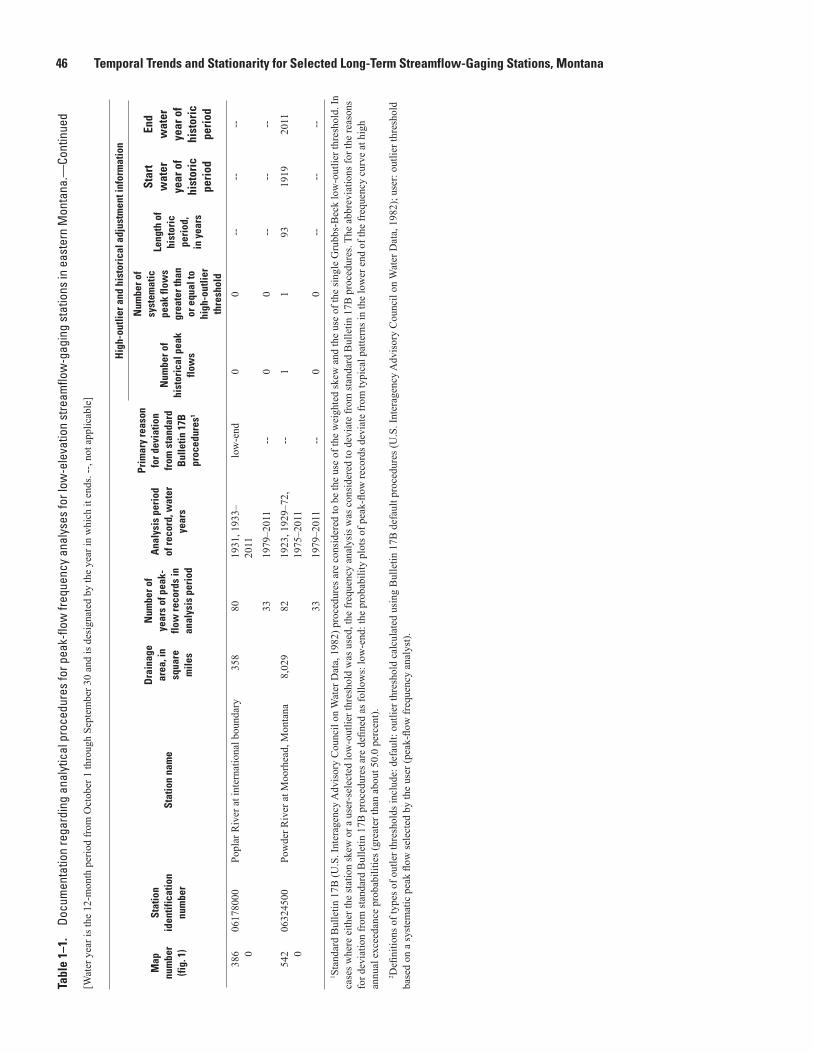
46 Temporal Trends and Stationarity for Selected Long-Term Streamflow-Gaging Stations, MontanaTa
ble
1–1.
Do
cum
enta
tion
rega
rdin
g an
alyt
ical
pro
cedu
res
for p
eak-
flow
freq
uenc
y an
alys
es fo
r low
-ele
vatio
n st
ream
flow
-gag
ing
stat
ions
in e
aste
rn M
onta
na.—
Cont
inue
d
[Wat
er y
ear i
s the
12-
mon
th p
erio
d fr
om O
ctob
er 1
thro
ugh
Sept
embe
r 30
and
is d
esig
nate
d by
the
year
in w
hich
it e
nds.
--, n
ot a
pplic
able
]
Map
nu
mbe
r (fi
g. 1
)
Stat
ion
id
entif
icat
ion
num
ber
Stat
ion
nam
e
Dra
inag
e ar
ea, i
n sq
uare
m
iles
Num
ber o
f ye
ars
of p
eak-
flow
reco
rds
in
anal
ysis
per
iod
Ana
lysi
s pe
riod
of
reco
rd, w
ater
ye
ars
Prim
ary
reas
on
for d
evia
tion
from
sta
ndar
d B
ulle
tin 1
7B
proc
edur
es1
Hig
h-ou
tlier
and
his
tori
cal a
djus
tmen
t inf
orm
atio
n
Num
ber o
f hi
stor
ical
pea
k flo
ws
Num
ber o
f sy
stem
atic
pe
ak fl
ows
grea
ter t
han
or e
qual
to
high
-out
lier
thre
shol
d
Leng
th o
f hi
stor
ic
peri
od,
in y
ears
Star
t w
ater
ye
ar o
f hi
stor
ic
peri
od
End
wat
er
year
of
hist
oric
pe
riod
386 0
0617
8000
Popl
ar R
iver
at i
nter
natio
nal b
ound
ary
358
8019
31, 1
933–
2011
low
-end
00
----
--
3319
79–2
011
--0
0--
----
542 0
0632
4500
Pow
der R
iver
at M
oorh
ead,
Mon
tana
8,02
982
1923
, 192
9–72
, 19
75–2
011
--1
193
1919
2011
3319
79–2
011
--0
0--
----
1 Sta
ndar
d B
ulle
tin 1
7B (U
.S. I
nter
agen
cy A
dvis
ory
Cou
ncil
on W
ater
Dat
a, 1
982)
pro
cedu
res a
re c
onsi
dere
d to
be
the
use
of th
e w
eigh
ted
skew
and
the
use
of th
e si
ngle
Gru
bbs-
Bec
k lo
w-o
utlie
r thr
esho
ld. I
n ca
ses w
here
eith
er th
e st
atio
n sk
ew o
r a u
ser-s
elec
ted
low
-out
lier t
hres
hold
was
use
d, th
e fr
eque
ncy
anal
ysis
was
con
side
red
to d
evia
te fr
om st
anda
rd B
ulle
tin 1
7B p
roce
dure
s. Th
e ab
brev
iatio
ns fo
r the
reas
ons
for d
evia
tion
from
stan
dard
Bul
letin
17B
pro
cedu
res a
re d
efine
d as
follo
ws:
low
-end
: the
pro
babi
lity
plot
s of p
eak-
flow
reco
rds d
evia
te fr
om ty
pica
l pat
tern
s in
the
low
er e
nd o
f the
freq
uenc
y cu
rve
at h
igh
annu
al e
xcee
danc
e pr
obab
ilitie
s (gr
eate
r tha
n ab
out 5
0.0
perc
ent).
2 Defi
nitio
ns o
f typ
es o
f out
ler t
hres
hold
s inc
lude
: def
ault:
out
lier t
hres
hold
cal
cula
ted
usin
g B
ulle
tin 1
7B d
efau
lt pr
oced
ures
(U.S
. Int
erag
ency
Adv
isor
y C
ounc
il on
Wat
er D
ata,
198
2); u
ser:
outli
er th
resh
old
base
d on
a sy
stem
atic
pea
k flo
w se
lect
ed b
y th
e us
er (p
eak-
flow
freq
uenc
y an
alys
t).
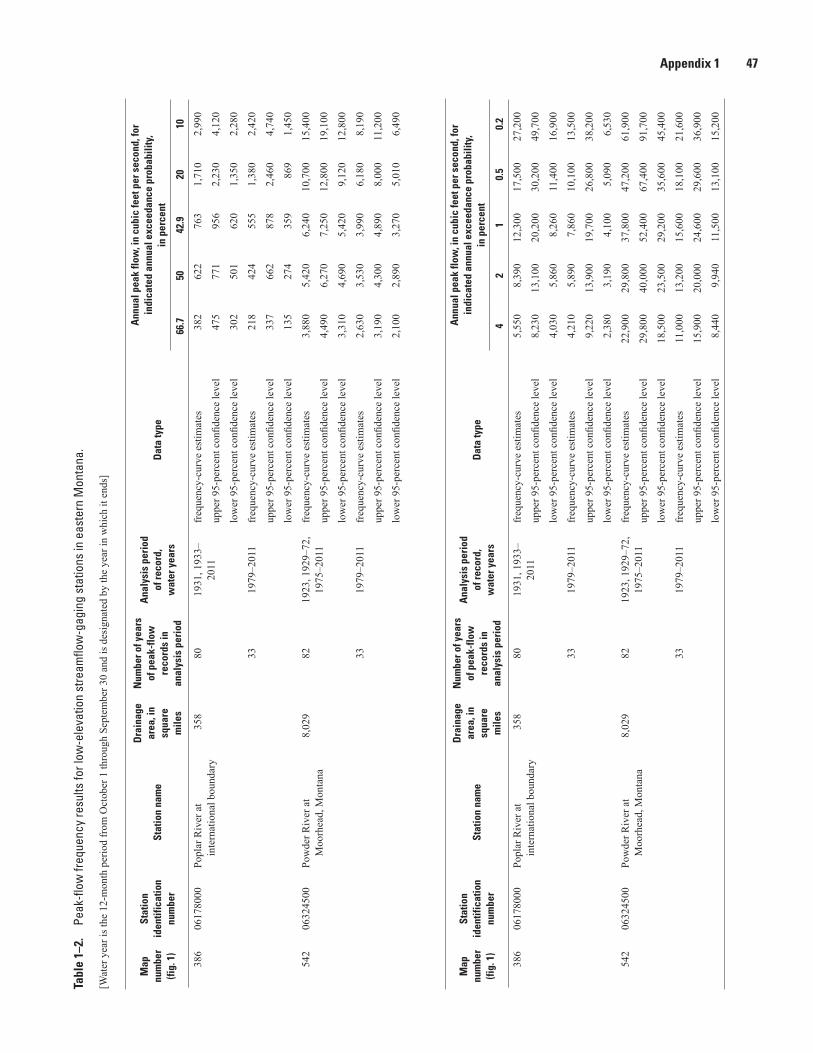
Appendix 1 47Ta
ble
1–2.
Pe
ak-fl
ow fr
eque
ncy
resu
lts fo
r low
-ele
vatio
n st
ream
flow
-gag
ing
stat
ions
in e
aste
rn M
onta
na.
[Wat
er y
ear i
s the
12-
mon
th p
erio
d fr
om O
ctob
er 1
thro
ugh
Sept
embe
r 30
and
is d
esig
nate
d by
the
year
in w
hich
it e
nds]
Map
nu
mbe
r (fi
g. 1
)
Stat
ion
id
entif
icat
ion
num
ber
Stat
ion
nam
e
Dra
inag
e ar
ea, i
n sq
uare
m
iles
Num
ber o
f yea
rs
of p
eak-
flow
re
cord
s in
an
alys
is p
erio
d
Ana
lysi
s pe
riod
of
reco
rd,
wat
er y
ears
Dat
a ty
pe
Ann
ual p
eak
flow
, in
cubi
c fe
et p
er s
econ
d, fo
r in
dica
ted
annu
al e
xcee
danc
e pr
obab
ility
, in
per
cent
66.7
5042
.920
10
386
0617
8000
Popl
ar R
iver
at
inte
rnat
iona
l bou
ndar
y35
880
1931
, 193
3–20
11fr
eque
ncy-
curv
e es
timat
es38
262
276
31,
710
2,99
0
uppe
r 95-
perc
ent c
onfid
ence
leve
l47
577
195
62,
230
4,12
0
low
er 9
5-pe
rcen
t con
fiden
ce le
vel
302
501
620
1,35
02,
280
3319
79–2
011
freq
uenc
y-cu
rve
estim
ates
218
424
555
1,38
02,
420
uppe
r 95-
perc
ent c
onfid
ence
leve
l33
766
287
82,
460
4,74
0
low
er 9
5-pe
rcen
t con
fiden
ce le
vel
135
274
359
869
1,45
0
542
0632
4500
Pow
der R
iver
at
Moo
rhea
d, M
onta
na8,
029
8219
23, 1
929–
72,
1975
–201
1fr
eque
ncy-
curv
e es
timat
es3,
880
5,42
06,
240
10,7
0015
,400
uppe
r 95-
perc
ent c
onfid
ence
leve
l4,
490
6,27
07,
250
12,8
0019
,100
low
er 9
5-pe
rcen
t con
fiden
ce le
vel
3,31
04,
690
5,42
09,
120
12,8
00
3319
79–2
011
freq
uenc
y-cu
rve
estim
ates
2,63
03,
530
3,99
06,
180
8,19
0
uppe
r 95-
perc
ent c
onfid
ence
leve
l3,
190
4,30
04,
890
8,00
011
,200
low
er 9
5-pe
rcen
t con
fiden
ce le
vel
2,10
02,
890
3,27
05,
010
6,49
0
Map
nu
mbe
r (fi
g. 1
)
Stat
ion
id
entif
icat
ion
num
ber
Stat
ion
nam
e
Dra
inag
e ar
ea, i
n sq
uare
m
iles
Num
ber o
f yea
rs
of p
eak-
flow
re
cord
s in
an
alys
is p
erio
d
Ana
lysi
s pe
riod
of
reco
rd,
wat
er y
ears
Dat
a ty
pe
Ann
ual p
eak
flow
, in
cubi
c fe
et p
er s
econ
d, fo
r in
dica
ted
annu
al e
xcee
danc
e pr
obab
ility
, in
per
cent
42
10.
50.
2
386
0617
8000
Popl
ar R
iver
at
inte
rnat
iona
l bou
ndar
y35
880
1931
, 193
3–20
11fr
eque
ncy-
curv
e es
timat
es 5
,550
8,3
90 1
2,30
0 1
7,50
0 2
7,20
0
uppe
r 95-
perc
ent c
onfid
ence
leve
l 8
,230
13,
100
20,
200
30,
200
49,
700
low
er 9
5-pe
rcen
t con
fiden
ce le
vel
4,0
30 5
,860
8,2
60 1
1,40
0 1
6,90
0
3319
79–2
011
freq
uenc
y-cu
rve
estim
ates
4,2
10 5
,890
7,8
60 1
0,10
0 1
3,50
0
uppe
r 95-
perc
ent c
onfid
ence
leve
l 9
,220
13,
900
19,
700
26,
800
38,
200
low
er 9
5-pe
rcen
t con
fiden
ce le
vel
2,3
80 3
,190
4,1
00 5
,090
6,5
30
542
0632
4500
Pow
der R
iver
at
Moo
rhea
d, M
onta
na8,
029
8219
23, 1
929–
72,
1975
–201
1fr
eque
ncy-
curv
e es
timat
es 2
2,90
0 2
9,80
0 3
7,80
0 4
7,20
0 6
1,90
0
uppe
r 95-
perc
ent c
onfid
ence
leve
l 2
9,80
0 4
0,00
0 5
2,40
0 6
7,40
0 9
1,70
0
low
er 9
5-pe
rcen
t con
fiden
ce le
vel
18,
500
23,
500
29,
200
35,
600
45,
400
3319
79–2
011
freq
uenc
y-cu
rve
estim
ates
11,
000
13,
200
15,
600
18,
100
21,
600
uppe
r 95-
perc
ent c
onfid
ence
leve
l 1
5,90
0 2
0,00
0 2
4,60
0 2
9,60
0 3
6,90
0
low
er 9
5-pe
rcen
t con
fiden
ce le
vel
8,4
40 9
,940
11,
500
13,
100
15,
200
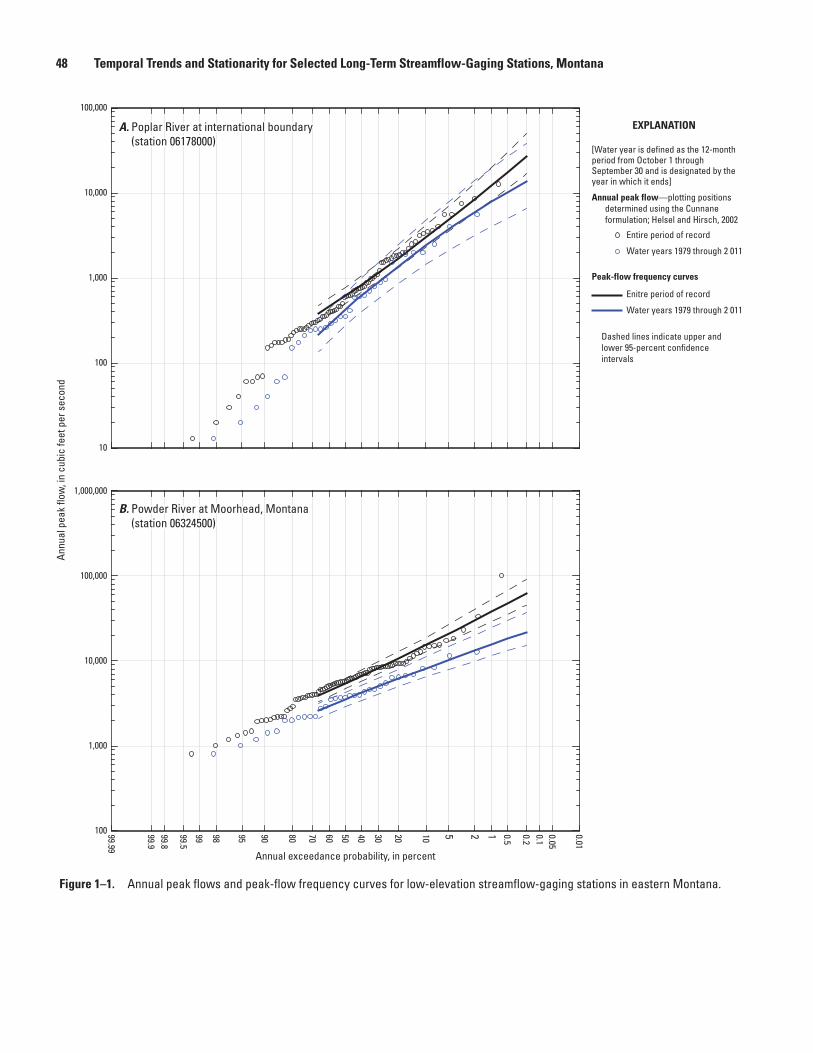
48 Temporal Trends and Stationarity for Selected Long-Term Streamflow-Gaging Stations, Montana
Annual exceedance probability, in percent
99.9
99.99
99.8
99.5
99 98 95 90 80 70 60 50 40 30 20 10 5 2 1 0.5
0.20.10.05
0.01
Annu
al p
eak
flow
, in
cubi
c fe
et p
er s
econ
d
1,000
100
10
10,000
100,000
100
1,000
10,000
100,000
1,000,000
Poplar River at international boundary(station 06178000)
Powder River at Moorhead, Montana(station 06324500)
Poplar River at international boundary(station 06178000)
A.
B. Powder River at Moorhead, Montana(station 06324500)
[Water year is defined as the 12-month period from October 1 through September 30 and is designated by the year in which it ends]
Annual peak flow—plotting positionsdetermined using the Cunnaneformulation; Helsel and Hirsch, 2002
Peak-flow frequency curves
Entire period of record
Water years 1979 through 2 011
Enitre period of record
Water years 1979 through 2 011
Dashed lines indicate upper andlower 95-percent confidence intervals
EXPLANATION
Figure 1–1. Annual peak flows and peak-flow frequency curves for low-elevation streamflow-gaging stations in eastern Montana.

Publishing support provided by: Rolla Publishing Service Center
For more information concerning this publication, contact: Director, Wyoming-Montana Water Science Center U.S. Geological Survey 3162 Bozeman Ave Helena, MT 59601 (406) 457–5900
Or visit the Wyoming-Montana Water Science Center Web site at: http://wy-mt.water.usgs.gov/
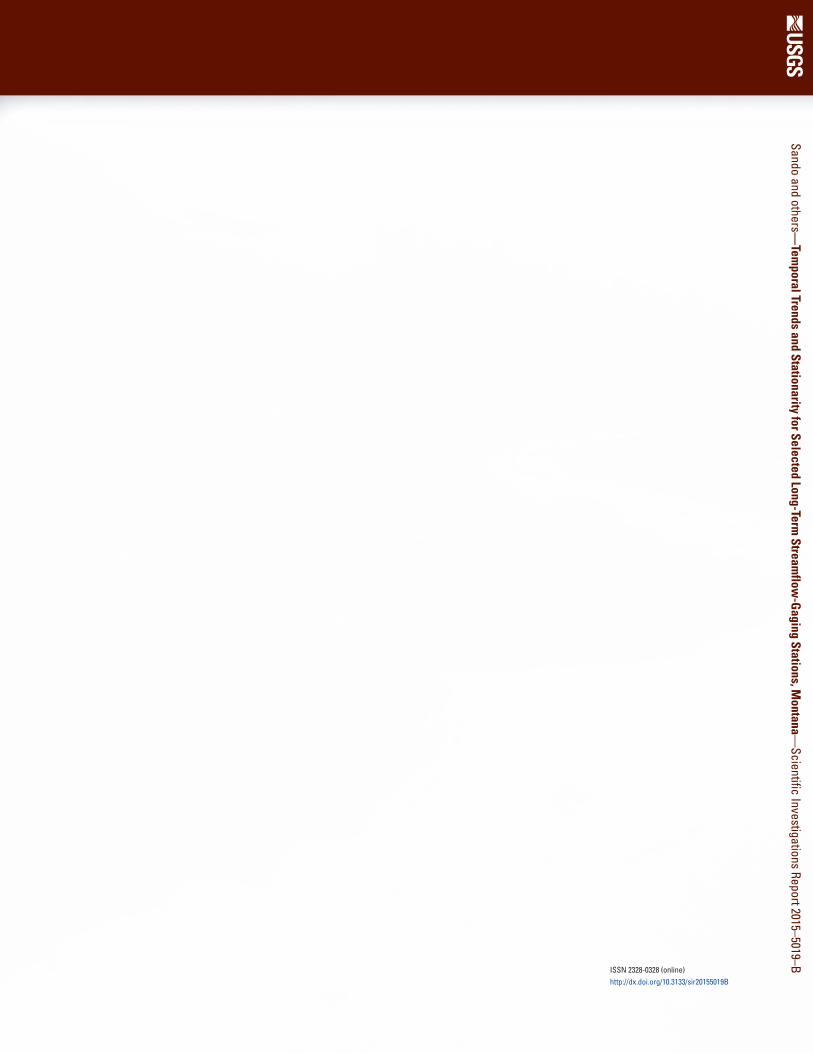
Sando and others—Tem
poral Trends and Stationarity for Selected Long-Term Stream
flow-G
aging Stations, Montana—
Scientific Investigations Report 2015–5019–B
ISSN 2328-0328 (online)http://dx.doi.org/10.3133/sir20155019B


![A spectral domain test for stationarity of spatio-temporal ... · For spatial data, Fuentes [2006] generalizes the test proposed in Priestley and Subba Rao [1969] to spatial data](https://img.pdfslide.us/doc/110x75/5f224a97fd140e09c8373a04/a-spectral-domain-test-for-stationarity-of-spatio-temporal-for-spatial-data.jpg)