Embed Size (px)
Citation preview
1
Temporal Specificity and Task Alignment: Evidence from Patient Care*
Guy David The Wharton School, University of Pennsylvania and NBER
Evan Rawley The Wharton School, University of Pennsylvania
Daniel Polsky University of Pennsylvania
January 2011
We show how integration solves temporal specificity problems that arise from the misalignment of tasks between organizations and test the predictions of the model, using a large and rich patient-level dataset on hospital discharges to nursing homes and home health care. As predicted by the theory, we find that vertical integration allows hospitals to shift patient recovery tasks downstream to lower cost delivery systems by discharging patients earlier and in poorer health; and integration leads to greater post-hospitalization service intensity. While integration facilitates a shift in the allocation of tasks, health outcomes are no worse when patients receive care from an integrated provider. The evidence suggests that by improving the alignment of tasks to assets, integration solves temporal specificity problems that arise in market exchange.
1. Introduction
This paper examines how integration solves temporal specificity problems that arise from the misalignment of
tasks between organizations. Temporal specificity refers to the value lost when an open market transaction is not
performed in a timely manner, compared to the value of the same transaction when performed within an
integrated firm (Masten, Meehan and Snyder 1991). Prior research on temporal specificity focused on the
potential for counterparty opportunism to create disruptions in the supply chain by shifting the timing of exchange
away from the technologically optimal point. For example, Nickerson and Silverman (2003) demonstrate how the
disruption of closely coordinated breakbulk operations in the less-than-truckload (LTL) segment of the trucking
industry can lead to costly ripple effects throughout the LTL network. As a result, in the presence of temporal
specificity, firms are more likely to vertically integrate to internalize the externality associated with the timing of
exchange. We build on the temporal specificity literature by examining how the timing of exchange influences
* We are grateful to Iwan Barankay, Silke Forbes, Vit Henisz, Mireille Jacobson, Raffaella Sadun, Brian Silverman, Tim Simcoe, Pai-Ling Yin as well as participants at the Foundations of Business Strategy Conference at Washington University, the Third Biennial Conference of the American Society of Health Economists at Cornell University, the NYU Economics of Strategy Conference, the Institutions and Innovation Conference at Harvard Business School, and the Bowman Seminar at Wharton for helpful comments and suggestions. Mike Punzalan and Jianing Yang provided excellent research assistance.
2
transaction costs, and extend the literature by highlighting how task alignment, as opposed to ex post
opportunism, influences firm boundaries.
We formalize the intuition behind the idea that task misalignment can be a determinant of temporal
specificity, and test the predictions of the model in the context of the patient care continuum, where patients
transition from acute care facilities (hospitals) into post-acute care (nursing homes and home health). The
empirical application demonstrates the role of task alignment in transactions and firm boundary decisions. Taking
the sequence of clinical interventions (or tasks) along the care continuum as fixed—patients need a well defined
set of clinical interventions to address their health care needs—exchange is characterized solely by the timing of
the transition across settings. Systematic variation in cost structures between hospitals and post-acute care
providers and contractual incompleteness in their exchange relationships ensures that tasks will not be efficiently
assigned unless the hospital and downstream providers are vertically integrated.1 However, integration costs are
non-trivial such that there is substantial heterogeneity in governance regimes: about half of all hospitals are
vertically integrated into post-acute care.
One major advantage of our empirical design is that we can track patients across organizations, which allows
us to pinpoint how integration influences tasks on both sides of the exchange relationship. The ability to observe
the clinical procedures patients receive in post-acute care at a high-level of detail is particularly important to our
empirical assessment of patient health at the time of discharge. The evidence shows that, on average, vertical
integration leads to shorter hospital stays for one out of every two patients who are discharged to a skilled nursing
facility or home health agency. We also find that patients received higher intensity of care from vertically
integrated home health providers. The results support the central thesis of the paper: integration solves task
misalignment problems. Notably, while we find striking differences in the organization of services across sites,
vertical integration does not lead to a decline in patient health outcomes, suggesting that different allocations of
tasks across assets (or sites) produces similar (or higher) levels of care quality. 2
1 We focus on Medicare transitions where parties cannot influence the price of exchange and side payments are illegal. 2 We use the terms assets and sites interchangeably throughout this paper. In health care, as in most service industries, tasks may be performed in multiple physical settings. These settings can be thought of as assets, as traditionally defined in the literature. However, it is perhaps more natural to refer to the location of service provision as a “site.”
3
The contributions of this research are twofold. First, we develop a tractable model that extends the conceptual
basis for temporal specificity to include the role of task alignment. Second, we demonstrate empirically how
vertical integration changes the alignment of tasks to assets and, thereby, solves temporal specificity problems
that arise in market exchange.
2. Theory and related literature
In this section, we describe and then formalize the intuition for task misalignment as a basis for temporal
specificity, showing that when contracts are incomplete (for any reason), and counterparties’ profit functions are
heterogeneous with respect to a focal task, market exchange will fail to generate the optimal allocation of tasks.
Therefore, even when hierarchical governance creates incentive and bureaucratic costs, task misalignment can
lead to temporal specificity.
The prior literature on temporal specificity locates the source of contracting problems in the timely production
or delivery of goods or services, an argument that rests on the idea that production takes a sequential form in
which a sequence of tasks leads to production of an output. For example, Pirrong (1993) finds evidence that
inefficiencies associated with haggling over quasi-rents that arise due to time-sensitive matching of shipments to
carriers leads to long-term contracting and vertical integration in the bulk shipping market. In the bulk shipping
context, shipping must follow production and precede sales in a pre-determined sequence, and contracting over
the timing of shipments can lead to inefficiencies because capacity “spoils” if it is not filled when a ship leaves
the harbor. Given a technologically determined sequence of production, and the risks of opportunistic
interruptions or delays amidst the sequence of tasks, the extant literature analyzes how the timing of exchange can
be affected by ex post maladaptation.
In this paper, we acknowledge the fundamental insight that temporal considerations influence the efficiency
of exchange in a way that creates asset specificity, but shift the problem back before the emergence of ex post
maladaptation in exchange by studying temporal specificity in terms of task misalignment. Instead of considering
the timing of exchange as the choice variable, or threat point, of interest in a given transaction, we endogenize the
timing of exchange by analyzing how the partitioning of the sequence of tasks across organizations (or sites or
4
assets) influences production efficiencies. Thus, we propose that temporal specificity need not always arise from
opportunistic behavior, but can also be due to production inefficiencies in market-based task alignment.
In transaction cost economics (TCE) and the property rights theory (PRT) of the firm, firms solve
inefficiencies in market exchange arising from incomplete contracts and asset specificity by replacing market
exchange with hierarchical governance (Williamson 1985, Grossman and Hart 1986, Hart and Moore 1990).
Though task alignment, where tasks are defined as production activities (Jacobides and Winter 2005), is rarely
explicitly discussed in TCE and PRT, the logic behind these theories would seem to imply that if market exchange
led to task misalignment, firms could solve the externality by suppressing market mechanisms through
integration.
Building on the idea that task misalignment could influence transaction costs and the timing of transactions,
we analyze the allocation of tasks to assets in the case of a two-way vertical exchange relationship, using a
framework where contracts are inherently incomplete. As is standard in the literature, we define integration as the
joining of assets under unified management (Klein, Crawford and Alchian 1978; Williamson 2010). Transactions
are characterized by exchanges between assets (or sites), and tasks are production activities used in conjunction
with assets to produce outputs for exchange, where, for tractability, the sequence of tasks needed to achieve an
outcome is technologically pre-determined. Further, we assume that integration results in increased bureaucratic
costs, arising from the management of different lines of business, as is common in the theory of the firm
literature. We do not, however, impose exogenous costs of market exchange. Instead, by distinguishing between
two types of tasks—general and site-dedicated tasks—we express the cost of market exchange through the
misalignment of tasks to sites. The introduction of two types of distinct tasks is crucial because if all tasks are
site-dedicated—if all tasks are performed in conjunction with a particular site—tasks and assets are redundant
constructs and task misalignment has no substantive meaning beyond the standard TCE/PRT models. In our
framework, however, when some tasks are general, that is, when they are not site-specific, then task misalignment
can be the basis for temporal specificity and integration will influence the efficiency of the allocation of tasks
across sites.
5
From these foundations, we propose a model where the allocation of tasks to sites shapes firm boundaries by
influencing production costs. To develop this result, we divide tasks into two groups: tasks dedicated to a
particular site and tasks that can be performed at multiple sites. The first class of tasks—site-dedicated tasks—
represent the focal source of hierarchical governance costs, as the management of heterogeneous site-task pairs
within a single firm requires costly managerial oversight (Penrose 1959, Schoar 2002). In our model, site-
dedicated tasks are efficiently aligned, as these tasks never cross the boundaries of their corresponding sites. Our
second class of tasks, general tasks, are of particular interest, as they may span sites—that is, in an exchange
relationship between two sites, both sites are technologically capable of performing the general tasks—and,
therefore, may be allocated to sites differently under integration versus market exchange. Thus, in the presence of
incomplete contracts, vertical integration represents a tradeoff between incurring administrative inefficiencies
from governing additional heterogeneous site-specific tasks against the production benefits of aligning general
tasks optimally to sites.
General tasks are the key driver of temporal specificity problems in our model, as non-cooperative equilibria
may distort the allocation of these tasks to sites under market exchange. Ultimately, we show how the
misallocation of general tasks across sites under market exchange creates temporal specificity that can be solved
through integration. We begin with the simpler benchmark case where all tasks are site-dedicated and, hence,
assets fully partition the task space. For simplicity, we normalize transaction costs from other potential sources to
be zero. Under this assumption, when all tasks are site-dedicated, market-based exchange is always superior to
vertical integration; however, once general tasks are introduced, this result may reverse.
The tension between the bureaucratic costs of integration and the cost of production inefficiencies associated
with market exchange leads to two alternative second best solutions to the problem of exchange. When contracts
are incomplete and tasks cannot be assigned to maximize total surplus, market exchange can distort the efficient
allocation of general tasks because firms will choose how to allocate general tasks to their own sites without
internalizing the externality imposed on their exchange partners. By contrast, integration allows the firm to
correct production inefficiencies associated with market exchange by shifting general tasks either downstream or
upstream. On the other hand, integration dampens incentives and creates bureaucracy costs that are avoided under

6
market exchange. Thus, while our theory is consistent with transaction cost economics models, which highlight
the tension between transaction costs and hierarchical governance costs (Williamson 1985), we explicitly model
transaction costs in terms of production inefficiencies associated with task misalignment.
In the simplest case, there are two assets (or sites): Ai and Aj. These assets correspond to two tasks: i and j,
such that, task i is dedicated to the asset Ai, whereas task j is dedicated to the asset Aj. i and j are a mapping from
the importance of the task to the value of their corresponding assets, Ai and Aj. The “size” of tasks is fixed
technologically; therefore, in this case, the value of the two assets is fixed and trivially dependent on matching the
specialized assets to their corresponding tasks, with 0iA and .0jA Note that i and j do not cross the
boundaries of their corresponding assets (sites), and under no integration, do not cross the boundaries of their
corresponding firms. Assets can contribute differently to production and therefore can generate different payoffs
to the firm that owns them. Each asset, A, generates a payoff π(A), which is increasing in the value of the asset,
while the marginal payoff is decreasing in the value of the asset, i.e. .0)(
,0)(
2
2
A
A
A
A
The payoffs to vertical integration are characterized by: ijji pAA )()( , where ijp is a fixed penalty
that depends on characteristics of the two tasks i and j. When integrating i and j is costless (i.e. 0ijp ), both
transactions across firms and transaction within firms produce the first best efficient solution.
As discussed above, when there are no transaction costs, all tasks are site-dedicated, and 0ijp , vertical
integration will not take place in equilibrium. On the other hand, in the presence of general tasks, task
misalignment creates temporal specificities, and as a result vertical integration may constitute a superior way to
organize transactions. To see this, we introduce a third task, k, which is a general one (i.e. can be performed by
either Ai or Aj). We further assume that a certain predetermined level of k is needed for technological reasons and
can be split across the two assets, Ai and Aj, such that: ji kkk .3
3 For simplicity we treat the level of k as fixed and discuss inefficiencies that arise from its misallocation across assets. In a less parsimonious model, the level of k could vary as well, such that market exchange leads to under-performance or over-performance of k. This would create an additional source of inefficiency, arising from market exchange.
7
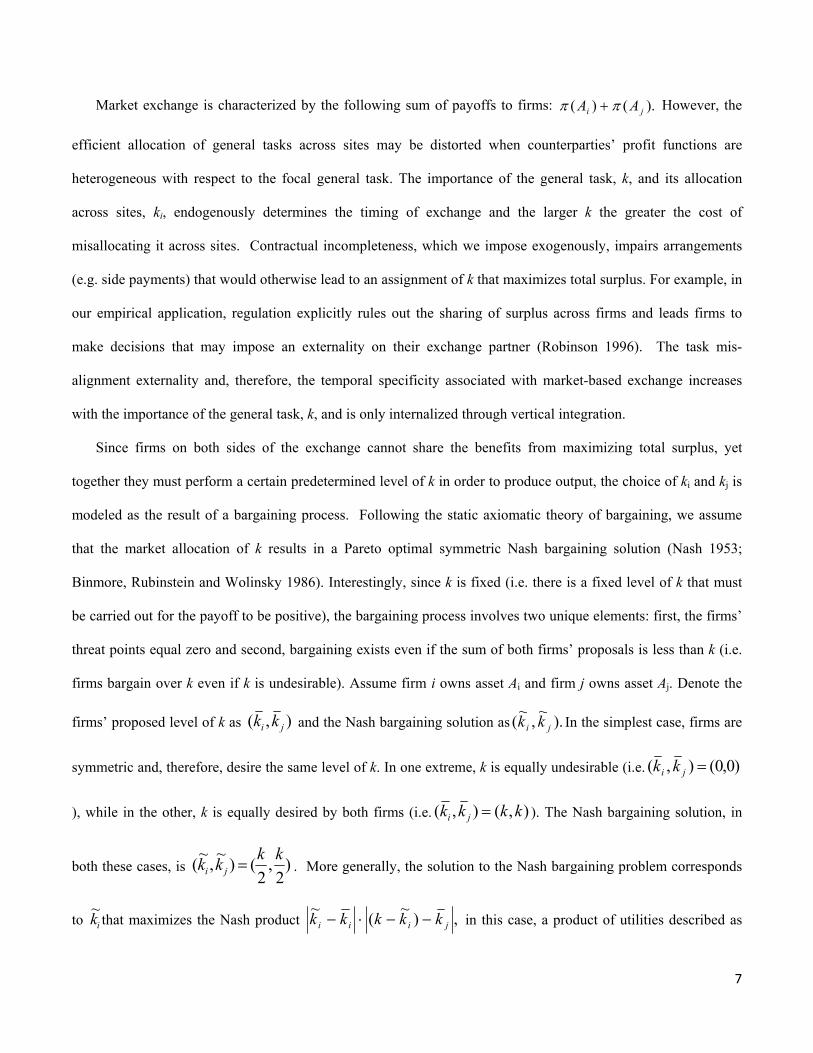
Market exchange is characterized by the following sum of payoffs to firms: ).()( ji AA However, the
efficient allocation of general tasks across sites may be distorted when counterparties’ profit functions are
heterogeneous with respect to the focal general task. The importance of the general task, k, and its allocation
across sites, ki, endogenously determines the timing of exchange and the larger k the greater the cost of
misallocating it across sites. Contractual incompleteness, which we impose exogenously, impairs arrangements
(e.g. side payments) that would otherwise lead to an assignment of k that maximizes total surplus. For example, in
our empirical application, regulation explicitly rules out the sharing of surplus across firms and leads firms to
make decisions that may impose an externality on their exchange partner (Robinson 1996). The task mis-
alignment externality and, therefore, the temporal specificity associated with market-based exchange increases
with the importance of the general task, k, and is only internalized through vertical integration.
Since firms on both sides of the exchange cannot share the benefits from maximizing total surplus, yet
together they must perform a certain predetermined level of k in order to produce output, the choice of ki and kj is
modeled as the result of a bargaining process. Following the static axiomatic theory of bargaining, we assume
that the market allocation of k results in a Pareto optimal symmetric Nash bargaining solution (Nash 1953;
Binmore, Rubinstein and Wolinsky 1986). Interestingly, since k is fixed (i.e. there is a fixed level of k that must
be carried out for the payoff to be positive), the bargaining process involves two unique elements: first, the firms’
threat points equal zero and second, bargaining exists even if the sum of both firms’ proposals is less than k (i.e.
firms bargain over k even if k is undesirable). Assume firm i owns asset Ai and firm j owns asset Aj. Denote the
firms’ proposed level of k as ),( ji kk and the Nash bargaining solution as ).~
,~
( ji kk In the simplest case, firms are
symmetric and, therefore, desire the same level of k. In one extreme, k is equally undesirable (i.e. )0,0(),( ji kk
), while in the other, k is equally desired by both firms (i.e. ),(),( kkkk ji ). The Nash bargaining solution, in
both these cases, is )2
,2
()~
,~
(kk
kk ji . More generally, the solution to the Nash bargaining problem corresponds
to ik~
that maximizes the Nash product ,)~
(~
jiii kkkkk in this case, a product of utilities described as

8
the distance between the Nash bargaining solution and the desired amounts of k. The general solution is given by:
2
)(~ kkkkk ji
ii
and
2
)(~ kkkkk ji
jj
.
It is easy to see that when ji kk , the symmetric Nash bargaining solution
)2
,2
()~
,~
(kk
kk ji is achieved.
Under the model assumptions, there is a single efficient combination (exchange point) that maximizes the joint
profits across firms, such that ))(())(())(())(( **jjiijjii kAkAkAkA for all kkk ji ),( , and, in
particular when )~
,~
(),( jiji kkkk , such that: ))~
(())~
(())(())(( **jjiijjii kAkAkAkA . (See Figure 1
for a graphical illustration). The pair ),( **ji kk , chosen by the integrated firm, is not the result of market exchange.
Firms, in our model, will decide to vertically integrate when:
(1) MEjjiiijjjiiVI kAkApkAkA ))(())(())(())(( **.
This decision depends on the composition of i, j, and k. In particular, the greater k is and the smaller pij is, the
more likely it is that the firms would vertically integrate (see Figure 2). Note, that since both market exchange and
vertical integration involve cost, the first best payoff ))(())(( **jjii kAkA is not attainable.
The interaction between site-dedicated and general tasks is crucial for the allocation of general tasks across
sites. When site-dedicated and general tasks are complements (an increase in one task raises the marginal value of
the other task), firms would benefit from concentrating general tasks in sites to maximize payoff. Alternatively,
there can be diseconomies of scope in tasks. In the case of economies of scope (or task complementarily)
0)(
,0)(
j
jj
i
ii
k
kA
k
kA
the allocation of the general task to a single site will raise the marginal value of the
site-dedicated tasks performed using that site. In this case, the integrated firm would maximize total surplus by
performing the entire general task at the site that provides it with the greatest return. On the other hand, when
firms make decisions in isolation and are precluded from sharing any surplus from cooperation, bargaining over k
will lead both firms to inefficiently perform non-zero amounts of k. If tasks are technologically determined to be
9
performed sequentially, this inefficiency is properly defined as a temporal specificity problem since the
misallocation of tasks leads to a timing problem in exchange. Task alignment influences the cost of market
exchange, in our model, by creating production inefficiencies that are due to temporal specificity, a problem that
exists when there are economies of scope as well as diseconomies of scope, as illustrated in Appendix A.
Given contractual incompleteness and divergent preferences over the allocation of general tasks to sites, task
misalignment will lead to temporal specificity and integration will sometimes be superior to market exchange
even in the presence of positive bureaucratic costs of joint ownership, pij. Thus, our simple model advances the
idea that vertical integration and the allocation of (general) tasks to sites is jointly determined, which has a
number of testable implications. In particular, when contracts are incomplete and performing a general task is
costly to both exchange partners, as in our empirical application, vertical integration will lead to a shift in the
allocation of general tasks, such that the low-cost site performs the bulk (or all) of the undesirable general task.
We believe our model is the first to explicitly consider the role of task alignment and temporal specificity,
but, of course, the model is not completely novel. Indeed, our approach follows in the spirit of Grossman and
Hart (1986) and Hart and Moore (1990) in that the owners of the upstream and the downstream assets/sites have
the residual rights to control all aspects of production, in particular, the timing of exchange, which cannot be
explicitly given away by contract. While their work focuses on vertical integration as a solution to ex ante
noncontractible investments, which are ex post contractible, we focus on task misalignment problems that occur
even when the state of the world is realized and there is no ex post opportunism. In our model, exogenous factors
(e.g., regulatory restrictions) preclude efficient rent sharing ex post, which means efficient outcomes can only be
achieved through integration. Corts’s (2006) formal analysis of the allocation of tasks to assets in a stylized model
of the tracking industry is also similar to ours in some important respects. In Corts’s (2006) model a single asset
(a truck) and a potentially delegable task (maintenance) are allocated between a principal (a firm) and an agent (a
driver). When the principal delegates the maintenance task downstream, efficiency dictates asset ownership by
the agent, which in turn results in greater effort in performing the delegated task. As in our model, Corts links
task allocation and asset ownership, but in his model principal asset ownership hinders the delegation of tasks to
10
the agent. In contrast, our analysis relies on the notion that asset (or site) ownership facilitates task delegation to
achieve an efficient allocation of tasks.
3. Empirical context: From hospitals to post-acute-care settings
In order to focus our predictions, we map the theoretical constructs developed in section 2 (above) to our
empirical setting. Broadly speaking, we test the predictions of the model by comparing practice patterns between
vertically integrated (i.e., hospitals with home health agencies and hospitals with skilled nursing facilities) and
non-integrated providers along the continuum of care from acute to post-acute care settings. The empirical
context is appealing for a number of reasons. First, the health care industry of considerable size: in 2007,
national expenditures were $190 billion in nursing homes and home health care and $696 billion in hospitals.
Second, contracts are inherently incomplete between hospitals and post-acute care providers because they are
subject to fixed prices set by Medicare with strict prohibitions on side payments between hospitals and post-acute
providers. Fixed price exchanges are particularly likely to give rise to incomplete contracting because the
counterparties cannot use price to adjust for supply and demand imbalances in bilateral exchange. Limitations on
side payments make it difficult for relational contracts to remedy the rigidities of fixed price exchange. Third,
there is substantial cross-sectional variation in vertical integration into both skilled nursing facilities and home
health across hospitals, which suggests that the costs and benefits of integration vary meaningfully in our setting.
While patients’ low responsiveness to price may induce firms to integrate to capture additional downstream
revenue, this effect cannot by itself explain cross-sectional variation in vertical integration. Fourth, there are
clear cut site-dedicated and general tasks in this setting, and the timing of exchange influences the efficiency of
care in a direct and important way. Hospitals perform specialized hospital-dedicated acute care tasks, such as
surgery, but once patients are stabilized, post-operative care rapidly becomes a task that need not necessarily be
bundled with the physical infrastructure of a hospital (i.e. post-operative care becomes a general task once the
patient is stabilized).4 Home health agencies and skilled nursing facilities also deliver site-dedicated and general
4 We use “surgery” to include any high intensity specialized post-operative care that can only be delivered in the hospital, such as recovery immediately following surgeries.
11
tasks, providing care services that are only performed in patients’ homes5 or in the skilled nursing facility,6 and
assisting patients with recuperating in a manner that is customized to the living environment, but also offering a
range of services that could be provided in a hospital setting, particularly monitoring, therapy, and recovery
services. These general tasks are produced at much higher cost in a hospital setting compared with a post-acute
setting, which, when coupled with incomplete contracts, creates temporal specificity and the impetus for vertical
integration. On the other hand, hospital integration with skilled nursing facilities and/or home health providers
creates bureaucratic oversight costs for the integrated entity. Fifth, the health services industry is a collection of
hundreds of distinct local markets that produce roughly homogenous outputs. We exploit the variation in local
market conditions in our empirical design to overcome the effect of selection on unobservables to identify the
impact of vertical integration on health outcomes; yet, the homogenous nature of outputs across markets
facilitates an accurate comparison of the effects of vertical integration on hospitals across markets. Finally, we
have access to a large and novel dataset on hundreds of thousands of patients’ medical history records that tracks
their care across facilities, allowing us to measure the impact of vertical integration on the allocation of tasks to
sites at an unusual level of detail.
Medicare reimburses care delivered by home health agencies and skilled nursing facilities through a
Prospective Payment System (PPS). Under PPS for home care, a fixed reimbursement is given for a 60-day
episode independent of the number of visits during the episode. Reimbursement is fixed and prospective as the
amount is set at admission, according to the observable severity of the patient's condition, and is not altered based
on the intensity of care delivered.7 In the case of skilled nursing facilities, reimbursement is given for each day of
stay (up to 100 days) independent of the intensity of care while at the facility. Each episode payment is adjusted
5 Home health care is skilled health care services provided in the home, for a limited duration; most often by registered nurses, rehabilitative therapists, social workers, or home health aides. An episode of home health care is a set of visits over a limited number of weeks in which each visit lasts approximately 1-2 hours. 6 Skilled nursing facilities (also called long-term care facilities or nursing homes) are establishments that house chronically ill, often elderly patients, and provide post-acute and long-term nursing care. In this study, we focus on the post-acute care function provided by skilled nursing facilities. Post-acute care in nursing homes is covered by Medicare for up to 100 days for beneficiaries who require skilled nursing care services following a hospitalization of at least three consecutive days. (Medicaid may cover continued stays in nursing home for eligible individuals. However, patients may have to deplete their life savings first.) Importantly, for the purposes of this study, skilled nursing facility services are offered by free-standing and hospital-based facilities. (A freestanding facility is generally part of a nursing home that covers skilled nursing facility services as well as long-term care services.) 7 There are occasional exceptions. For example, certain extremely high-cost episodes will receive outlier payments.
12
for differences in labor costs across geographic areas. Within this reimbursement strategy, skilled nursing
facilities and home health agencies are free to provide the intensity of care that they deem appropriate for their
patient. In general, the amount of service provided does not change the amount of reimbursement, which
strengthens the foundation for our assumption that contracts are incomplete in our empirical context. 8
Given that the key assumptions of the model are met in the exchange relationships between hospitals and
post-acute care providers—contracts are incomplete and general tasks at either hospital or post-acute care sites—
the predictions of the model apply immediately to the empirical context. In particular, we examine whether
hospitals that are vertically integrated discharge their patients to skilled nursing facilities and home health
agencies sooner and when the patients are in poorer health compared to non-integrated hospitals. The two
predictions arise directly from the idea that vertical integration allows hospitals to allocate general tasks (i.e.,
recovery tasks) to their own skilled nursing facility and home health agency in a manner that is more efficient
than under market exchange, subject to a bureaucratic cost penalty for integrating acute and post-acute
organizations. Taking the integration penalty to be positive—the integrated entities are qualitatively dissimilar—
but of a magnitude that varies by upstream firm-downstream firm pair based on exogenous factors, we can infer
the nature of the benefits of vertical integration by studying the behavior of efficiency maximizing hospitals. The
model predicts that vertically integrated firms will solve the temporal specificity problem by shifting the general
task to the low-cost provider sooner, here the skilled nursing facility or home health agency. Thus, it follows that
vertically integrated hospitals, while maintaining the same overall quality of care, will allocate recovery tasks to
the downstream firm by shifting patients to it sooner in the recovery process and when the patient requires more
extensive monitoring (i.e., when they are in worse health). Therefore, the three predictions of the model that we
test in our context are:
Hypothesis 1: Vertically integrated hospitals will transition patients to skilled nursing facilities
and home health agencies faster than non-integrated hospitals.
8 There is still some relationship between intensity and reimbursement. Home health episodes can be recertified for additional 60-day episodes. This happens for about 10 percent of home health admissions. The reimbursement for a nursing home stay is fixed per-diem, increasing linearly with length of stay.
13
Hypothesis 2: Vertically integrated hospitals will transition patients to their own home health
agencies when the patients are in need of more intensive monitoring and recovery services.9
Hypothesis 3: Overall quality of care need not be lower for patients transitioning faster and in
worse health within vertically integrated hospitals compared to market-based transitions.
While our key predictions are formally derived from a general model of task alignment, they are consistent
with an informal health economics literature on vertical integration in hospitals, which notes that patients can be
expected to be discharged to post-acute care in poorer health and faster when transitioning to post-acute care
within an integrated hospital system since integration eliminates opportunism (Robinson 1996, Lehrman and
Shore 1998). Yet, opportunism is unlikely to drive temporal specificity problems in the context of patient care
since hospitals tend to have market power versus post-acute care providers and are not tied to bilateral exchange
relationships with any particular post-acute care provider. If a post-acute care provider tried to hold-up the
hospital, the hospital could discharge patients to another provider, especially if the problem were systematic. The
reality of the situation is that hospitals cannot discharge patients at the optimal time because care providers will
not accept patients on whom they will lose money. Therefore, in the patient care setting, inefficiencies are more
likely to be due to non-cooperative equilibria that stem from restrictions on rent sharing. Thus, the temporal
specificity problem is not due to hold-up, but rather to contractual incompleteness and task misalignment.
4. Data and samples
Having shown how our model of temporal specificity and task alignment applies, in the context of patient
care, we now turn to the empirical analysis. Our core data come from the Medicare Provider and Analysis
Review (MEDPAR) Files for 2005. The MEDPAR is a research file compiled by the Center for Medicare and
9 Ideally, we would test all three hypotheses developed for patients that transition to either skilled nursing facilities (SNF) or home health agencies. Unfortunately, there is no observable measure of care intensity (to the econometrician) in SNFs, so we confine our analyses in the SNF setting to tests of Hypotheses 1 and 3.

14
Medicaid Services, based on the billing claims of facility stays for fee-for-service Medicare beneficiaries. Each
MEDPAR record represents a facility stay including acute-care-hospital stays and skilled nursing facility stays. It
summarizes services provided to a beneficiary from time of admission to a facility through discharge. Each record
includes: date of admission and discharge; codes for up to 5 procedures and 10 diagnoses (DRG); socioeconomic
information; and a unique identification number that is specific to a beneficiary and the hospital. This is a near-
complete record of health care facility encounters for Americans over 65.10
To identify and characterize post-acute care home health care episodes that follow hospitalizations, we link
the MEDPAR file acute-care-hospital stays to the Medicare claims for skilled nursing facilities and home health
services by the scrambled identifier of the Medicare beneficiary. Home health services are recorded on the
Medicare Home Health Agency Standard Analytical Files. We identify admissions to skilled nursing facilities
and home health care agencies as those occurring within 3 days of the hospital discharge. Because all qualifying
skilled nursing facility and home health care episodes of Medicare beneficiaries are paid by Medicare, these
claims files are a complete record of home health use for the beneficiaries with MEDPAR hospitalizations. We
also capture data on home health care services provided, including number of home health visits, the dates and
types of visits as well as unique home health agency identifiers.
We augment the claims data with survey data on hospital organization from the American Hospital
Association (2005) and with data from regulatory reports: for hospitals from the 2005 Hospital Cost Reports and
for skilled nursing facilities and home health agencies from the 2005 Provider of Service Files. We use these
three sources of data to determine whether hospitals are vertically integrated into skilled nursing facilities and into
home health. We conservatively code hospitals as being vertically integrated when all three sources agree, though
our results are robust to other criteria.
Our analysis focuses on MEDPAR hospitalizations for new health events that resulted in post-acute care
admissions either directly into skilled nursing facilities or into home health. To exclude hospitalizations of
existing health events from our sample, MEDPAR hospitalizations that were preceded in the 90 days prior to
admission by a hospitalization or by post-acute care with a home health agency or in a skilled nursing or
10 10% of beneficiaries in Medicare Advantage plans do not have MEDPAR records and are not included in this study.
15
rehabilitation facility were excluded. By following the care of only those patients initiating an episode of care, our
sample is less likely to be influenced by unobservable (to the econometrician) practice patterns. For example,
hospitals might systematically discharge re-hospitalized patients to home health at a different rate compared to
patients who were newly admitted.11 We then eliminate all hospitals with indeterminate vertical integration status
(20% of the sample), leaving us with 399,368 discharges to home health and 460,597 discharges to skilled nursing
facilities from 2,571 hospitals.12
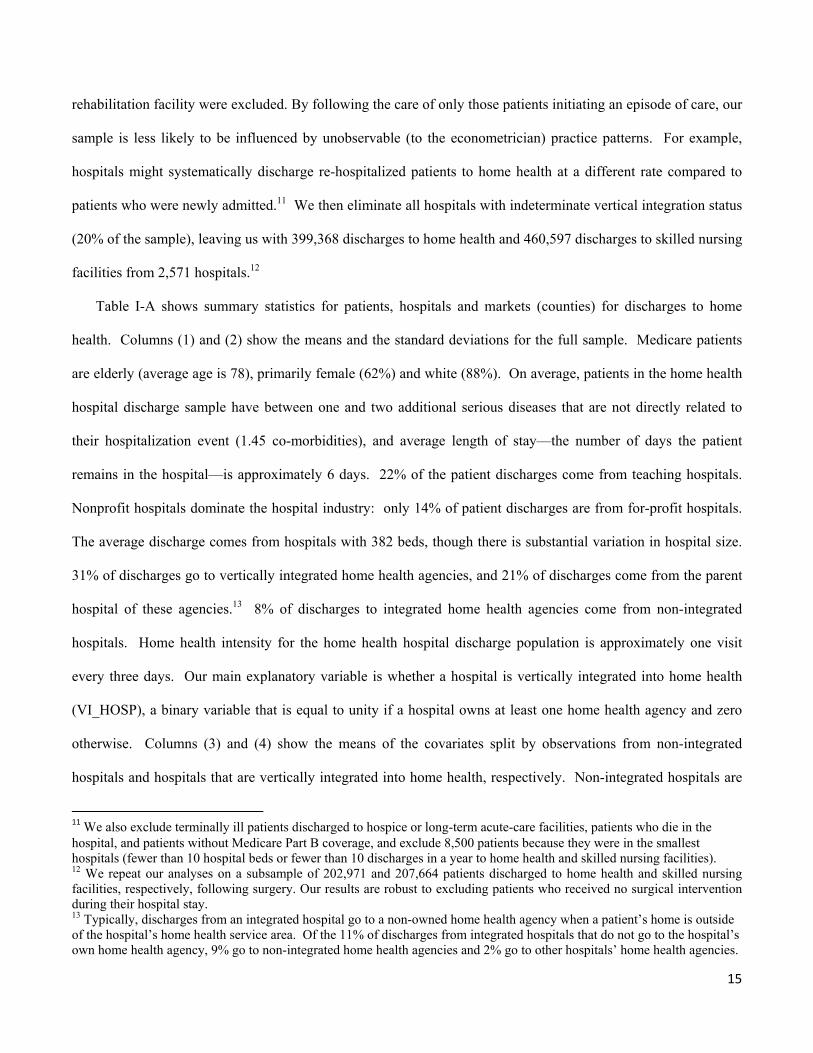
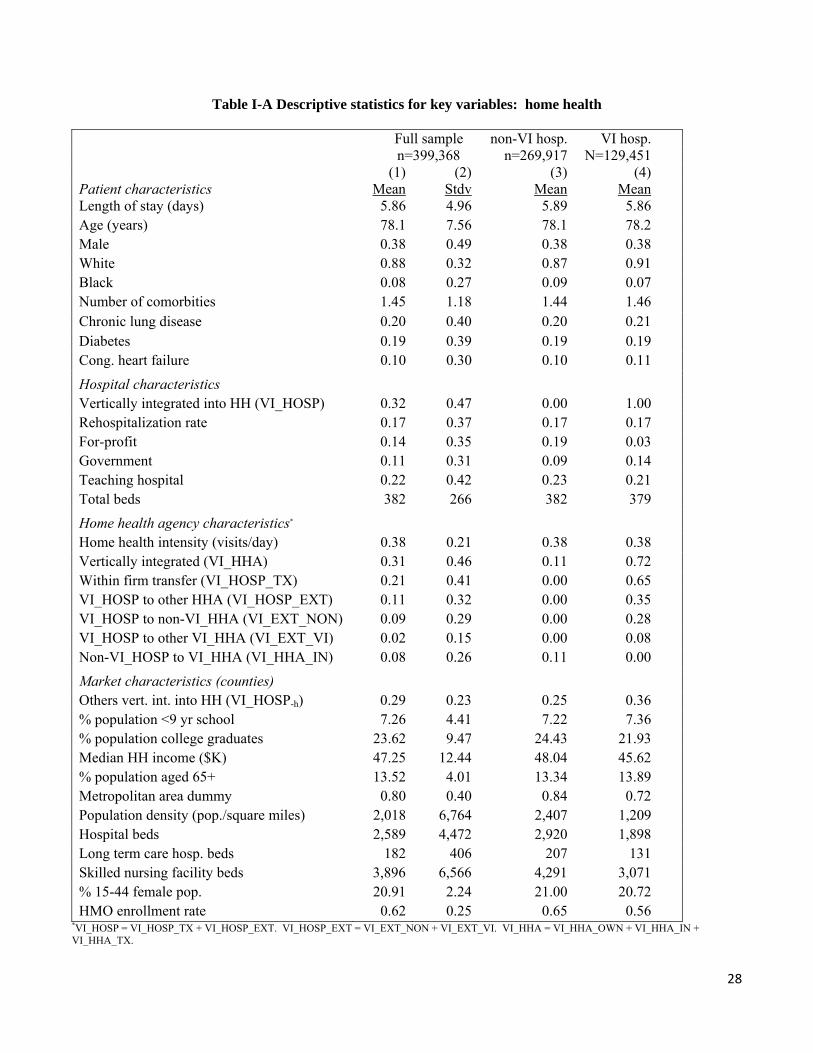
Table I-A shows summary statistics for patients, hospitals and markets (counties) for discharges to home
health. Columns (1) and (2) show the means and the standard deviations for the full sample. Medicare patients
are elderly (average age is 78), primarily female (62%) and white (88%). On average, patients in the home health
hospital discharge sample have between one and two additional serious diseases that are not directly related to
their hospitalization event (1.45 co-morbidities), and average length of stay—the number of days the patient
remains in the hospital—is approximately 6 days. 22% of the patient discharges come from teaching hospitals.
Nonprofit hospitals dominate the hospital industry: only 14% of patient discharges are from for-profit hospitals.
The average discharge comes from hospitals with 382 beds, though there is substantial variation in hospital size.
31% of discharges go to vertically integrated home health agencies, and 21% of discharges come from the parent
hospital of these agencies.13 8% of discharges to integrated home health agencies come from non-integrated
hospitals. Home health intensity for the home health hospital discharge population is approximately one visit
every three days. Our main explanatory variable is whether a hospital is vertically integrated into home health
(VI_HOSP), a binary variable that is equal to unity if a hospital owns at least one home health agency and zero
otherwise. Columns (3) and (4) show the means of the covariates split by observations from non-integrated
hospitals and hospitals that are vertically integrated into home health, respectively. Non-integrated hospitals are
11 We also exclude terminally ill patients discharged to hospice or long-term acute-care facilities, patients who die in the hospital, and patients without Medicare Part B coverage, and exclude 8,500 patients because they were in the smallest hospitals (fewer than 10 hospital beds or fewer than 10 discharges in a year to home health and skilled nursing facilities). 12 We repeat our analyses on a subsample of 202,971 and 207,664 patients discharged to home health and skilled nursing facilities, respectively, following surgery. Our results are robust to excluding patients who received no surgical intervention during their hospital stay. 13 Typically, discharges from an integrated hospital go to a non-owned home health agency when a patient’s home is outside of the hospital’s home health service area. Of the 11% of discharges from integrated hospitals that do not go to the hospital’s own home health agency, 9% go to non-integrated home health agencies and 2% go to other hospitals’ home health agencies.
16
clearly different from integrated hospitals; for example, they are more likely to be for-profit, presumably to avoid
the bureaucratic costs of integration. Non-integrated hospitals are also less likely to be government hospitals, and
operate primarily in dense urban areas; the latter correlation suggests that market thickness may also play a role of
in a hospital’s decision to integrate, and in areas with higher HMO penetration and lower prevalence of
integration into home health.
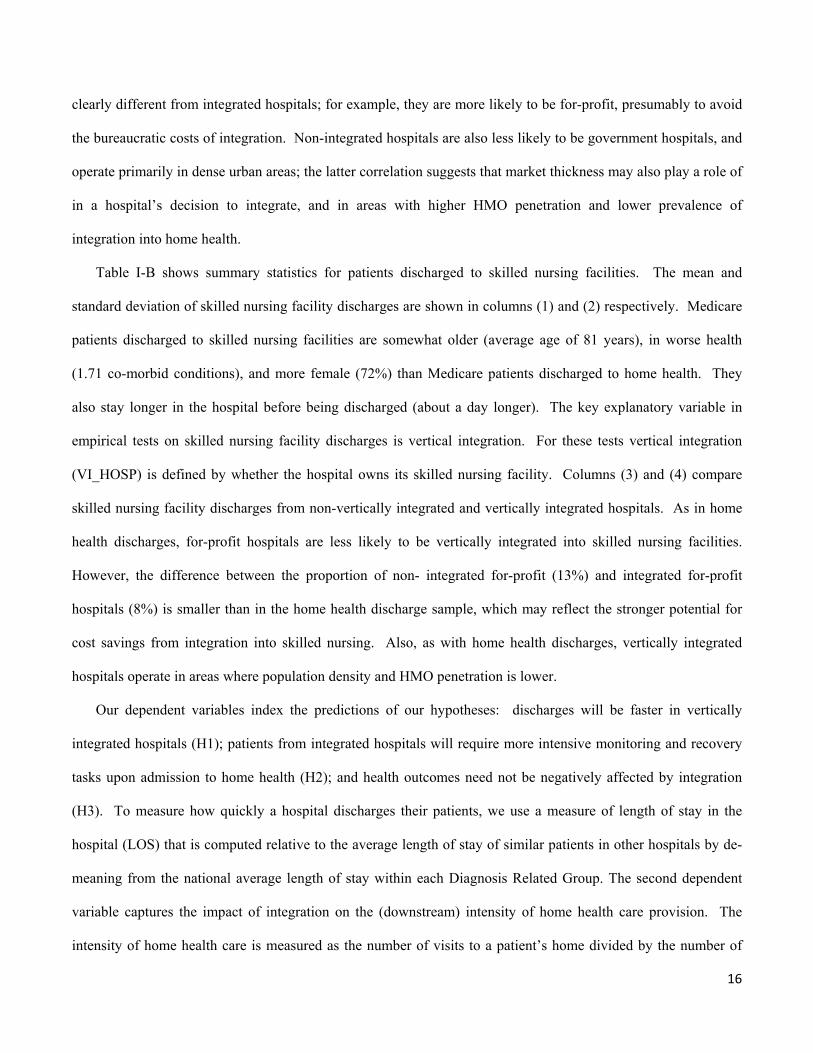
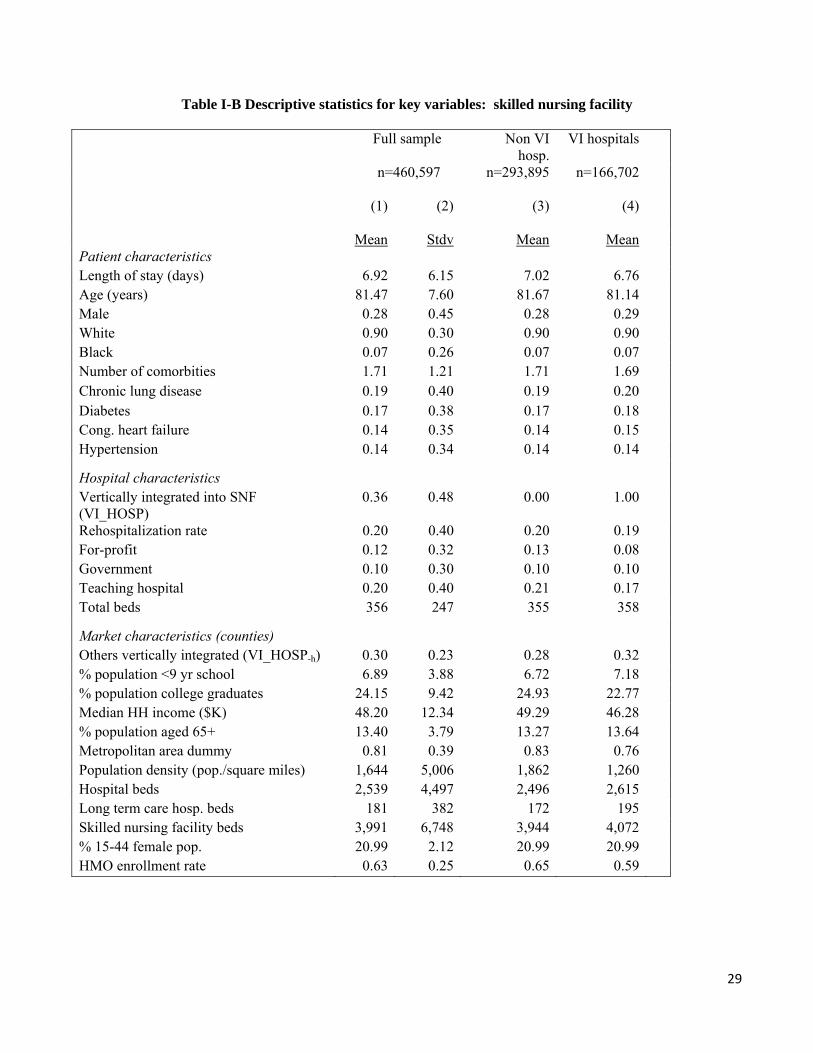
Table I-B shows summary statistics for patients discharged to skilled nursing facilities. The mean and
standard deviation of skilled nursing facility discharges are shown in columns (1) and (2) respectively. Medicare
patients discharged to skilled nursing facilities are somewhat older (average age of 81 years), in worse health
(1.71 co-morbid conditions), and more female (72%) than Medicare patients discharged to home health. They
also stay longer in the hospital before being discharged (about a day longer). The key explanatory variable in
empirical tests on skilled nursing facility discharges is vertical integration. For these tests vertical integration
(VI_HOSP) is defined by whether the hospital owns its skilled nursing facility. Columns (3) and (4) compare
skilled nursing facility discharges from non-vertically integrated and vertically integrated hospitals. As in home
health discharges, for-profit hospitals are less likely to be vertically integrated into skilled nursing facilities.
However, the difference between the proportion of non- integrated for-profit (13%) and integrated for-profit
hospitals (8%) is smaller than in the home health discharge sample, which may reflect the stronger potential for
cost savings from integration into skilled nursing. Also, as with home health discharges, vertically integrated
hospitals operate in areas where population density and HMO penetration is lower.
Our dependent variables index the predictions of our hypotheses: discharges will be faster in vertically
integrated hospitals (H1); patients from integrated hospitals will require more intensive monitoring and recovery
tasks upon admission to home health (H2); and health outcomes need not be negatively affected by integration
(H3). To measure how quickly a hospital discharges their patients, we use a measure of length of stay in the
hospital (LOS) that is computed relative to the average length of stay of similar patients in other hospitals by de-
meaning from the national average length of stay within each Diagnosis Related Group. The second dependent
variable captures the impact of integration on the (downstream) intensity of home health care provision. The
intensity of home health care is measured as the number of visits to a patient’s home divided by the number of
17
days the patient remains in the care of a home health agency, where visits are weighted by the average wages by
occupation of the home health provider as determined from the 2004 Current Population Survey. While most
visits are by registered nurses (RN), many visits are by home health aides who are paid considerably less than
RNs, while some visits are by specialized therapists who earn more. Our third dependent variable is one of the
crucial observable measures of the quality of care patients’ receive along the care continuum and the center of
policy debates: patient rehospitalization rate.
5. Empirical design
We test the predictions of the model by focusing on how length of stay, home health intensity, and
rehospitalization rates (within 60 days of a discharge) vary between patients from non-integrated and hospitals
that are vertically integrated into home health care and skilled nursing facilities. Since general tasks—monitoring
and recovery activities—are costly to perform in our empirical setting, the model predicts that vertically
integrated hospitals will use fiat to force its downstream facilities to accept patients (i) faster and (ii) in poorer
health compared to in an arm’s length exchange, but that vertically integrated hospitals will manage the cost
savings opportunities such that (iii) rehospitalization rates are no greater than in non-integrated settings.
While we are concerned with the endogeneity of vertical integration, we first test these predictions using the
simple OLS model (2):
(2) Yl = a + β1VIh + Xcβc + ei,
where l indexes patients, h indexes hospitals, and Y measures three outcomes: length of stay in the hospital
(LOS), intensity of care in home health, and rehospitalization rates. VI is an indicator variable that is equal to
unity when the hospital is vertically integrated into home health and zero otherwise, X is a vector of patient,
hospital, home health agency and market controls that might plausibly shift hospital practice patterns. Patient
level controls include variables that capture the health of the patient at admission, measured by 28 comorbidities
as well as patients’ demographic characteristics, such as age, gender and race. Hospital controls include a set of
dummies for ownership (for-profit, not-for-profit, and government), teaching status, and the number of licensed
18
beds. Market controls include demographic variables such as the average years of schooling of the local
population, median income, the percentage of the population over age 65, the percentage of the population of
childbearing age (females aged 15-44), population density, and a categorical variable for metropolitan areas;
supply shifters including the total number of hospital beds, skilled nursing facility beds, and the number of long-
term care beds in the market; and the strength of insurance companies, measured by HMO enrollment rate.
Our basic tests are OLS cross-sectional regressions of vertical integration on hospital and home health
practice patterns. Although we include a large number of detailed controls, the cross-sectional nature of the
analysis precludes us from making strong causal inferences from the OLS results, particularly in tests of the first
hypothesis that vertical integration leads to shorter length of stay. Since both vertical integration and length of
stay are choice variable for hospitals, our results are vulnerable to selection biases that lead to heterogeneous
treatment effects and omitted variable bias. While it is possible that our OLS estimates could be biased downward
due to selection into vertical integration based on (high) quality, it seems more plausible that the OLS estimates of
vertical integration on length of stay will be biased toward zero as vertically integrated hospitals tend to be
institutions with care management philosophies that emphasize more extensive care delivery over management of
financial objectives. For example, non-profit hospitals are sometimes thought to “over deliver” services, at least
compared to a for-profit benchmark. We find some evidence for this concern in the raw data. In home health,
for-profit hospitals represent 19% of non-integrated hospitals, but only 3% of vertically integrated hospitals.
While profit status is observable, the hospital’s care management philosophy is not, and we must therefore be
concerned that our OLS estimates will confound the causal effect of vertical integration with selection effects.
We deal with the endogeneity of vertical integration using two approaches. First, we adjust for selection on
observable differences between patient populations, by matching post-acute care patients from integrated
hospitals to patients from non- integrated hospitals, based on all observable characteristics of patients, hospitals
and markets. To do so, we use the Coarsened Exact Matching (CEM) procedure described by Iacus, King and
Porro (2009), which facilitates multi-dimensional exact matching. CEM is similar to standard two-stage matching
teccniques in that it controls for selection bias by eliminating non-analogous observations in the treatment (i.e.
19
integrated) and control (i.e., non- integrated) populations. 14 CEM has some advantages over standard matching
approaches: it requires fewer ad-hoc post-estimation assumptions about how to define a match; automatically
balances treatment and control populations; has superior computational properties for large data sets, and is
particularly well suited for applications where most regressors are discrete. However, no matching method can
control for sources of heterogeneity that arise from unobservable characteristics of hospitals.
To adjust for selection on unobservables, we exploit variation in local market conditions in the health services
industry, using the rate of vertical integration into home health or skilled nursing facilities by other hospitals in
the same market (weighted by patient volume) as an instrument for the focal hospital’s decision to vertically
integrate into home health (VI_HOSP-h). Other hospitals’ integration decisions should not have any direct effect
on a focal hospital’s practice patterns, particularly given the extensive patient, hospital and market controls in
specification (1); yet, interviews with industry leaders and experts suggest that hospital integration decisions are
often determined by idiosyncratic local market conditions. Thus, our instrument satisfies the exclusion restriction
and has the potential to be a powerful explanatory variable in the first stage of a two-stage procedure that adjusts
for selection on unobservables. A practical drawback of our instrumental variable is that it only generates market-
level variation; we could not identify any hospital-level shifters of the costs or benefits of diversification that
would satisfy the exclusion restriction. However, we find that our instrument generates substantial between-
hospital variation in practice, since the 2,571 hospitals in our sample operate in hundreds of different local
markets. For the purposes of measuring the instrument, we define the competitive hospital markets based on the
306 Hospital Referral Regions (HRRs) as defined by the Dartmouth Health Atlas (1999).15 Because the HRRs
boundaries are defined based on patient referral patterns for tertiary care, they closely represent the competitive
market for hospitals when making decisions regarding vertical integration.
Because our main concern is with the endogeneity of hospital decisions, our key tests of Hypotheses 1 and 3
apply the instrument VI_HOSP-h to correct for selection on unobservables at the hospital-level. Specifically, we
14 To manage the “curse of dimensionality,” we create a single discrete measure of propensity to vertically integrate, using all secondary controls in (2), which we include in the CEM procedure along with our key controls: age group quartiles, gender, number of comorbidities, diagnostic related group type, hospital bed quartiles, and a metropolitan market dummy. 15 Although county boundaries offer a less precise market definition, we treat counties as markets for measuring market-level controls as demographic data are more readily available at the county level.
20
use the two-stage residual inclusion (2SRI) method first proposed by Hausman (1978) and more recently by
Terza, Basu and Rathouz (2008). The first stage of our 2SRI procedure is a logit model predicting hospital
vertical integration into home health or skilled nursing facilities (VI_HOSP),including all of the controls in (1)
aggregated to the hospital level, where the integration rate of other hospitals in the same market is the source of
exogenous variation in each hospital’s vertical integration decision. The second stage of the 2SRI procedure
includes the residual from the first stage, which by definition is uncorrelated with the covariates in X in (1), and
controls for selection into vertical integration based on unobservables. 2SRI estimators have econometric
properties that are similar to other two-stage estimators, like two-stage least squares (2SLS), but are particularly
well suited for our application; importantly, they are consistent when endogenous regressors are non-linear and
have correct asymptotic standard errors in the first stage, which facilitates a two-stage instrumental variables
approach at two different levels of analysis (i.e., hospital and patient) without manually adjusting the standard
errors. As a robustness check, we perform a similar analysis, using the more familiar 2SLS estimator, which
predicts vertical integration with a first stage linear probability model, replacing the explanatory variable
(VI_HOSP) in the second stage with the predicted probability of vertical integration into home health. We also
verify that our results are robust to matching using CEM prior to 2SRI estimation.
Tests of our second hypothesis—that vertically integrated hospitals will discharge patients to their own
(vertically integrated) home health agencies when the patients require more intensive care—compare the outcome
resulting from the choice of home health intensity by vertically integrated hospitals with the outcome from market
exchanges between non-integrated hospitals and home health agencies, using OLS on the full and matched
samples. Ideally, we would want to isolate the causal effect of vertical integration on home health intensity;
however, a valid instrument that would generate exogenous variation in the choice of discharge outlet is difficult
to identify. Given that endogeneity should bias our results on intensity toward zero due to selection effects—the
effect of moral hazard would suggest that hospitals want to keep the healthiest patients for themselves while
sending the sickest patients to other agencies—we can test Hypothesis 2 by recovering the cost of the decision to
vertically integrate, conditional on the hospital’s choice to vertically integrate. Nevertheless, we want to ensure
that the treatment and control groups are comparable along all observable dimensions, so that our results are not
21
being driven by unusual observations or model specification issues. To do so, we use CEM as above to match
control observations to treatment observations. The impact of hospital vertical integration on practice patterns are
then estimated on the matched sample, using OLS model (1).
6. Results
Table II Panel A shows the relationship between hospitals vertically integrated into home health and average
length of stay at the patient-level. Column 1 reports a -0.12 raw correlation between vertically integration and
length of stay, which means that vertical integration is associated with shaving one day off a hospital stay for one
out of every eight patients. Including the full set of patient, hospital and market controls reduces the point
estimate to -0.06, and the coefficient estimate becomes indistinguishable from zero (column 2). However, the
results in Column 3 demonstrate that patient-level selection effects bias the OLS results toward zero as the
coefficient estimate on VI_HOSP in the matched sample increases to -0.08. Columns 4-I and 4-II reveal the
strength of our instrument and the influence of omitted variable bias on the OLS estimates. Column 4-I is the first
stage instrumental variables regression predicting vertical integration at the hospital level. The instrument
VI_HOSP-h—other hospitals’ rate of vertical integration in the same market (weighted by patient volume)—is
very strong: the F-statistic on VI_HOSP-h in the first stage is 63, and a 1% increase in the market vertical
integration rate leads to a 0.31% increase in a focal hospital’s propensity to vertically integrate. The second stage
of our instrumental variables approach includes the residual from the first stage to adjust for the effects of
unobservable hospital-specific factors that might influence vertical integration decisions. The, result is a point
estimate on the coefficient on vertical integration that is three times larger than the OLS estimate at -0.19—
approximately a one day reduction in length of stay for every five patients discharged—but continues to be only
on the margin of statistical significance.16 The interpretation of Table II Panel A is that hospital vertical
16 We obtained qualitatively similar results, using 2SLS with first stages at the patient and hospital level.
22
integration allows hospitals to discharge patients to home health sooner relative to non-integrated hospitals, but
the effect is small—representing savings of only about 3% of bed-days17—and imprecisely estimated.
Table II Panel B shows that the results on length of stay effects for hospital vertically integrated into skilled
nursing facilities are larger and more precise compared to vertical integration into home health. Without controls,
the correlation between vertical integration and length of stay is -0.20, (column 1), and is precisely estimated.
The full set of patient, hospital and market controls soak up more variation in the data, but have only a small
impact on the coefficient on vertical integration (column 2). Column 3 shows the matched sample estimate.
Matching exactly based on all observable characteristics of patients, hospitals, and markets yields a precisely
estimated point estimate of -0.18. Finally, columns 4-I and 4-II show the two stages of our instrumental variables
analysis. Column 4-I shows that increasing the extent of vertical integration in a local market by 1% increases the
probability that a focal hospital will be vertically integrated by 0.32%. As with home health, the second stage
estimate on vertical integration is approximately three times the OLS estimate. The interpretation of the point
estimate of -0.73 on vertical integration is: hospitals that are vertically integrated into skilled nursing facilities are
able to reduce patient length of stay in the hospital by one day for three out of every four patients who eventually
receive post-acute care at a skilled nursing facility, a reduction in total bed-days of about 11%.18
Putting the economic effects in perspective, if the average hospital could shift one hospital bed-day to a
skilled nursing facility for three out of every four patients that go to skilled nursing facilities they could profitably
incur up to $100,000 per year of additional administrative costs associated with vertical integration. The
magnitude of the gross savings from vertical integration before bureaucratic are striking because they suggest that
vertical integration is worthwhile if the savings exceed the cost of managing the additional burdens of internal
exchange compared to market exchange. Of course, establishing break-even points for the average hospital with
crude averages can be misleading, particularly because bureaucratic costs vary across institutions.
17 At an average length of stay of six days, five patients would need 30 bed-days in a non-integrated hospital. In a vertically integrated hospital, the same five patients would require only 29 bed-days. (30-29)/30=3% 18 At an average length of stay of seven days, four patients would need 28 bed-days in a non-integrated hospital. In a vertically integrated hospital, the same four patients would require only 25 bed-days. (28-25)/28=11%
23
Table III summarizes the tests of the relationship between integration and the intensity of home health care
provided to patients who are admitted to home health.19 Discharges from vertically integrated hospitals to their
own home health agencies (“within firm transition”) receive an additional 0.008 visits/day, relative to the baseline
rate for patients discharged from non-integrated hospitals, while patients discharged from integrated hospitals to
external non-affiliated home health agencies had 0.002 fewer visits per day compared to the baseline (column 1).
The F-test on the difference between within firm transitions and external transitions from vertically integrated
hospitals is significant at the 1% level, which suggests that within firm transitions are more demanding on the
downstream organization relative to market transitions. Controlling for whether external discharges go to other
integrated agencies or to non-integrated agencies and for discharges from non-integrated hospitals to vertically
integrated agencies with a more refined set of interactions has little effect on the main result. After matching and
including the full set of interactions, the point estimate on within firm transitions is 0.01 or one additional home
health visit per 100 day episode.20 With an average length of a home health episode around 33 days, this suggests
that one of every three patients experiencing a within firm transition gets an extra home health visit. Increasing
one home health visit for one of every 3 of the 400,000 home health admissions per year that come directly from
hospitals would have increased total costs by about $13 million, assuming the average home health visit costs
approximately $100. Under prospective payment, these costs are borne by the agencies rather than by Medicare.
The higher speed with which integrated hospitals discharge patients and the relatively greater severity of
patients’ health at admission to their home health agency raises an important public policy question. Are
vertically integrated hospitals delivering lower quality care by discharging their patients sicker and quicker? Or
do hospitals use integration to increase their efficiency while holding quality of care constant as we predict in our
third hypothesis? To answer this question, we test in Table IV whether health outcomes differ between integrated
and non-integrated hospitals for patients discharged to post-acute care by regressing integration on incidence of
rehospitalization. We find that in home health the correlation between integration and rehospitalization is
19 The data for Table III are generated using linked Medicare claims data from the MEDPAR file used in Table II. Although these files are linked, 124 patients (out of 399,368 patients) are without valid home health claims information. These observations are dropped from the home health intensity regressions. 20 We obtained similar results using propensity score matching.
24
indistinguishable from zero in full-sample OLS regressions (column 1), as well as in matched sample (not shown)
and 2SRI tests (column 2), suggesting that under integration into home health, patient recovery tasks are shifted
downstream without meaningfully affecting quality of care. Put differently, the integrated entity substitutes
between inputs along the health care continuum, while staying on the same iso-quality curve.
Column (3) shows that rehospitalization rates for patients discharged to skilled nursing facilities within a
vertically integrated system are 0.6% lower compared to patients discharged to skilled nursing facilities from non-
integrated hospitals. While the coefficient is precisely estimated, the effect is small economically compared to a
baseline rehospitalizaiton rate of approximately 20%. However, after adjusting for the endogeneity of vertical
integration using 2SRI the point estimate on vertical integration increases to -2.1%. The interpretation is that
integration actually leads to improved health outcomes. The results suggests that while integration enables
quicker and sicker discharges, the savings obtained are not the result of lowering the quality of care received by
patients. Hence, the costs of vertical integration are (presumably) borne administratively.
We close our empirical analysis with two caveats. Although there are substantial unobserved administrative
costs associated with vertical integration into home health, our interest, in this paper, is to identify the direct
medical costs and benefits of vertical integration while allowing heterogeneous costs of integration, which we
proxy for using local market conditions, to generate variation in the data. Our empirical approach relies on
interpreting the revealed preferences of hospitals, based on the assumption that hospital organizational decisions
are made with efficiency criteria in mind. Though our reveled preference approach is standard in the empirical
literature on vertical integration (Joskow 1985, Hortaçsu and Syverson 2007), we caution that we cannot estimate
the costs and benefits of vertical integration directly in our analysis. Second, while the unique features of the
health services industry make it a particularly appealing context for testing our theory of task alignment and
temporal specificity, it is reasonable to question the external validity of our findings. We believe that the
allocation of tasks to assets is a fundamental determinant of temporal specificity whenever the timing of exchange
is important, but leave the issue open as an opportunity for future research.
These caveats aside, the results suggest that vertical integration creates economically meaningful
opportunities for hospitals to discharge patients earlier and in worse health to home health agencies following
25
hospitalization. We interpret the results as evidence that integration allows firms to solve temporal specificity
problems by aligning tasks with assets more efficiently. Our findings do not dispute the idea that vertical
integration increases administrative costs, such that, it may be superior to market exchange only for some
hospitals (i.e., the ones that choose to become integrated). Nevertheless, the results point to one of the heretofore
underappreciated advantages of vertical integration—control over the allocation of tasks to sites or assets.
7. Conclusion
This paper proposes and tests a simple theory where integration addresses temporal specificity problems by
solving task misalignment problems. In our framework, we demonstrate how the allocation of general tasks to
assets (or sites) influences the efficiency of an economic system by determining the timing of exchange. The
model offers a step toward integrating the powerful idea that tradeoffs between discrete structural alternatives
define the boundary of the firm in equilibrium, as in transaction cost economics (Williamson 1985), with the
intuitively appealing idea that firms are defined by tasks or routines, which shape firm boundaries by influencing
the efficiency of production (Nelson and Winter 1985).
We test the predictions of the model in the context of patient care along the care continuum, from
hospitalization to home health agencies and skilled nursing facilities and find a strong relationship between
vertical integration and practice patterns. Controlling for the endogeneity of vertical integration, patient
characteristics, as well as a host of hospital and market factors, we find hospitals that are vertically integrated tend
to discharge patients to their own home health agencies and skilled nursing facilities sooner and in poorer health
compared with non-integrated hospitals; yet, health outcomes are actually better for patients who transition to
hospitals’ own skilled nursing facilities and no worse for patients who transition to hospital’s own home health
agencies. The variation in practice patterns and health outcomes reflects the integrated entity’s ability to use fiat
to shift patients in need of recovery and monitoring services (general tasks) from the hospital setting to post-acute
care settings. Thus, the evidence suggests that vertical integration reduces temporal specificity problems that
arise due to the misalignment of tasks under market exchange.

26
References Binmore, Ken, Ariel Rubinstein and Asher Wolinsky. 1986. The Nash Bargaining Solution in Economic
Modeling. RAND Journal of Economics, 17(2), 176-188. Corts, Ken. 2006. The Interaction of Task and Asset Allocation. International Journal of Industrial
Organization 24 887-906. The Dartmouth Atlas of Health Care. 1999. Appendix on the Geography of Health Care in the United States.
289-307. Grossman, Sanford, and Oliver Hart. 1986. The Costs and Benefits of Ownership: A Theory of Vertical and
Lateral Integration. Journal of Political Economy 94(4) 691-719. Hart, Oliver and Jon Moore. 1990. Property Rights and the Nature of the Firm. Journal of Political Economy
98(6) 1119-1158. Hausman, Jerry A. 1978. Specification Tests in Econometrics. Econometrica 46 1251-1271. Holmstrom, Bengt, and Paul Milgrom. 1991. Multitask Principal-Agent Analyses: Incentive Contracts, Asset
Ownership and Job Design. Journal of Law, Economics and Organization 7 24-52. Hortaçsu, Ali, and Chad Syverson. 2007. Cementing Relationships: Vertical Integration, Foreclosure,
Productivity and Prices. Journal of Political Economy 115(2) 250-301. Iacus, Stefano M., Gary King, and Giuseppe Porro. 2009. Causal Inference Without Balance Checking:
Coarsened Exact Matching. Working Paper. Jacobides, Michael, and Sidney G. Winter. 2005. The Co-evolution of Capabilities and Transaction Costs:
Explaining the Institutional Structure of Production. Strategic Management Journal 26(5) 395-413. Joskow, Paul. 1985. Vertical Integration and Long-Term Contracts: The Case of Coal-Burning Electric
Generating Plants. Journal of Law, Economics and Organization 1(1) 33-80. Klein, Benjamin, Robert A. Crawford and Armen A. Alchian. 1978. Vertical Integration, Appropriable Rents
and the Competitive Contracting Process. Journal of Law and Economics 21(2) 297-326. Lehrman, Susan, Karen K. Shore. 1998. Hospitals’ Vertical Inegration into Silled Nursing: A Rational
Approach to Controlling Transaction Costs. Inquiry-Blue Cross and Blue Shield Association 35(3): 303-314. Masten, Scott E., James W. Meehan, and Edward A. Snyder. 1991. The Costs of Organization. Journal of Law,
Economics and Organization 7(1): 1-25. Nash, John. 1953. “Two-person Cooperative Games,” Econometrica, 21, 128-140. Nelson, Richard and Sidney G. Winter. 1985. An Evolutionary Theory of Economic Change. Cambridge, MA.
Harvard Press. Nickerson, Jack A., Brian S. Silverman. 2003. Why Firms Want to Organize Efficiently and What Keeps Them
from Doing So: Inappropriate Governance, Performance, and Adaptation in a Deregulated Industry. Administrative Science Quarterly 48(3) 433-465.
Penrose, Edith. 1959. The Theory of the Growth of the Firm. New York, NY. Oxford University Press. Pirrong, Stephen Craig. 1993. Contracting Practices in Bulk Shipping Markets: A Transactions Cost
Explanation. Journal of Law and Economics 36(2) 937-976. Robinson, James C. 1996. Administered Pricing and Vertical Integration in the Hospital Industry. Journal of
Law and Economics 39(1) 357-378. Schoar, Antoinette. 2002. Effects of Corporate Diversification on Productivity. Journal of Finance 57(2) 2379-
2403. Terza, Joseph.V., Anirban Basu, and Paul J. Rathouz. 2008. Two-stage Residual Inclusion Estimation:
Addressing Endogeneity in Health Econometric Modeling. Journal of Health Economics 27 531-543. Williamson, Oliver E. 1985. The Economic Institutions of Capitalism: Firms, Markets, Relational Contracting.
New York, NY. Free Press. Williamson, Oliver E. 1991. Comparative Economic Organization: The Analysis of Discrete Structural
Alternatives. Administrative Science Quarterly 36(2) 269-296. Williamson, Oliver E. 2010. Transaction Cost Economics: The Natural Progression. American Economic
Review 100(3) 673-690.
27
Figure 1 General tasks and efficient exchange
ki
VI - ME
Choose Vertical
Integration
-pij
0
Choose Market
Exchange
k
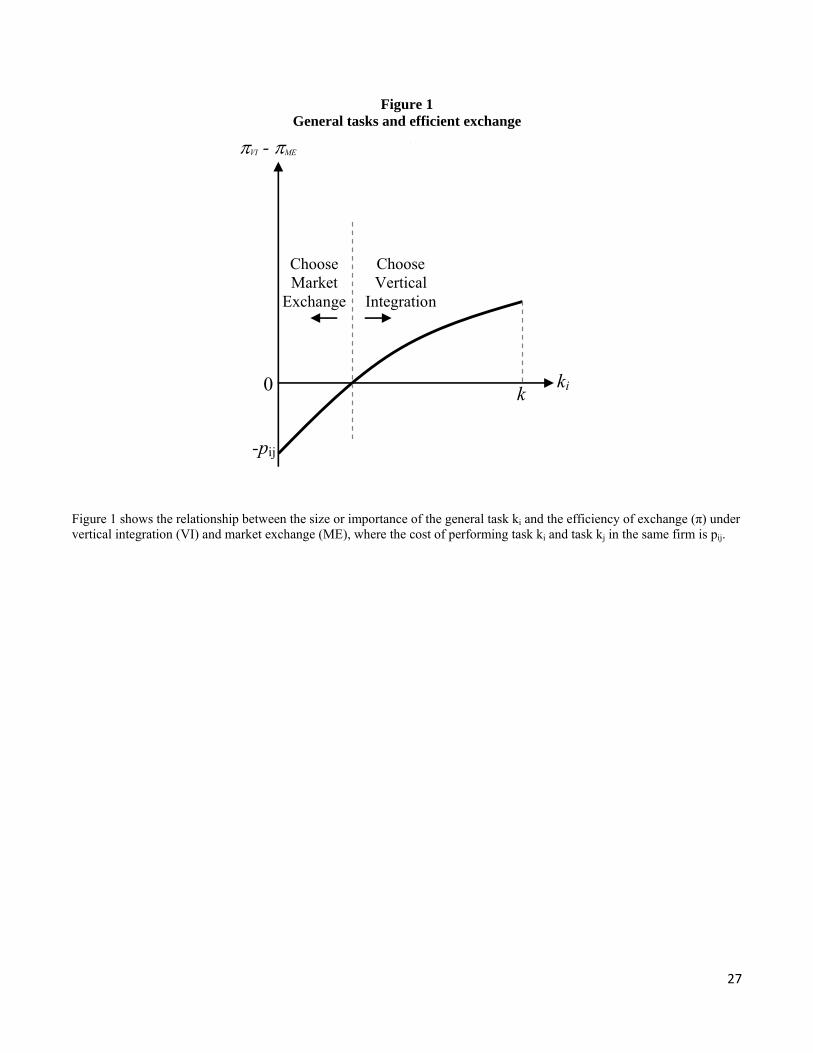
Figure 1
Figure 1 shows the relationship between the size or importance of the general task ki and the efficiency of exchange (π) under vertical integration (VI) and market exchange (ME), where the cost of performing task ki and task kj in the same firm is pij.
28
Table I-A Descriptive statistics for key variables: home health
Full sample non-VI hosp. VI hosp. n=399,368 n=269,917 N=129,451 (1) (2) (3) (4) Patient characteristics Mean Stdv Mean Mean Length of stay (days) 5.86 4.96 5.89 5.86 Age (years) 78.1 7.56 78.1 78.2 Male 0.38 0.49 0.38 0.38 White 0.88 0.32 0.87 0.91 Black 0.08 0.27 0.09 0.07 Number of comorbities 1.45 1.18 1.44 1.46 Chronic lung disease 0.20 0.40 0.20 0.21 Diabetes 0.19 0.39 0.19 0.19 Cong. heart failure 0.10 0.30 0.10 0.11
Hospital characteristics Vertically integrated into HH (VI_HOSP) 0.32 0.47 0.00 1.00 Rehospitalization rate 0.17 0.37 0.17 0.17 For-profit 0.14 0.35 0.19 0.03 Government 0.11 0.31 0.09 0.14 Teaching hospital 0.22 0.42 0.23 0.21 Total beds 382 266 382 379
Home health agency characteristics* Home health intensity (visits/day) 0.38 0.21 0.38 0.38 Vertically integrated (VI_HHA) 0.31 0.46 0.11 0.72 Within firm transfer (VI_HOSP_TX) 0.21 0.41 0.00 0.65 VI_HOSP to other HHA (VI_HOSP_EXT) 0.11 0.32 0.00 0.35 VI_HOSP to non-VI_HHA (VI_EXT_NON) 0.09 0.29 0.00 0.28 VI_HOSP to other VI_HHA (VI_EXT_VI) 0.02 0.15 0.00 0.08 Non-VI_HOSP to VI_HHA (VI_HHA_IN) 0.08 0.26 0.11 0.00
Market characteristics (counties) Others vert. int. into HH (VI_HOSP-h) 0.29 0.23 0.25 0.36 % population <9 yr school 7.26 4.41 7.22 7.36 % population college graduates 23.62 9.47 24.43 21.93 Median HH income ($K) 47.25 12.44 48.04 45.62 % population aged 65+ 13.52 4.01 13.34 13.89 Metropolitan area dummy 0.80 0.40 0.84 0.72 Population density (pop./square miles) 2,018 6,764 2,407 1,209 Hospital beds 2,589 4,472 2,920 1,898 Long term care hosp. beds 182 406 207 131 Skilled nursing facility beds 3,896 6,566 4,291 3,071 % 15-44 female pop. 20.91 2.24 21.00 20.72 HMO enrollment rate 0.62 0.25 0.65 0.56
*VI_HOSP = VI_HOSP_TX + VI_HOSP_EXT. VI_HOSP_EXT = VI_EXT_NON + VI_EXT_VI. VI_HHA = VI_HHA_OWN + VI_HHA_IN + VI_HHA_TX.
29
Table I-B Descriptive statistics for key variables: skilled nursing facility
Full sample Non VI hosp.
VI hospitals
n=460,597 n=293,895 n=166,702
(1) (2) (3) (4) Mean Stdv Mean Mean Patient characteristics Length of stay (days) 6.92 6.15 7.02 6.76 Age (years) 81.47 7.60 81.67 81.14 Male 0.28 0.45 0.28 0.29 White 0.90 0.30 0.90 0.90 Black 0.07 0.26 0.07 0.07 Number of comorbities 1.71 1.21 1.71 1.69 Chronic lung disease 0.19 0.40 0.19 0.20 Diabetes 0.17 0.38 0.17 0.18 Cong. heart failure 0.14 0.35 0.14 0.15 Hypertension 0.14 0.34 0.14 0.14
Hospital characteristics Vertically integrated into SNF (VI_HOSP)
0.36 0.48 0.00 1.00
Rehospitalization rate 0.20 0.40 0.20 0.19 For-profit 0.12 0.32 0.13 0.08 Government 0.10 0.30 0.10 0.10 Teaching hospital 0.20 0.40 0.21 0.17 Total beds 356 247 355 358
Market characteristics (counties) Others vertically integrated (VI_HOSP-h) 0.30 0.23 0.28 0.32 % population <9 yr school 6.89 3.88 6.72 7.18 % population college graduates 24.15 9.42 24.93 22.77 Median HH income ($K) 48.20 12.34 49.29 46.28 % population aged 65+ 13.40 3.79 13.27 13.64 Metropolitan area dummy 0.81 0.39 0.83 0.76 Population density (pop./square miles) 1,644 5,006 1,862 1,260 Hospital beds 2,539 4,497 2,496 2,615 Long term care hosp. beds 181 382 172 195 Skilled nursing facility beds 3,991 6,748 3,944 4,072 % 15-44 female pop. 20.99 2.12 20.99 20.99 HMO enrollment rate 0.63 0.25 0.65 0.59
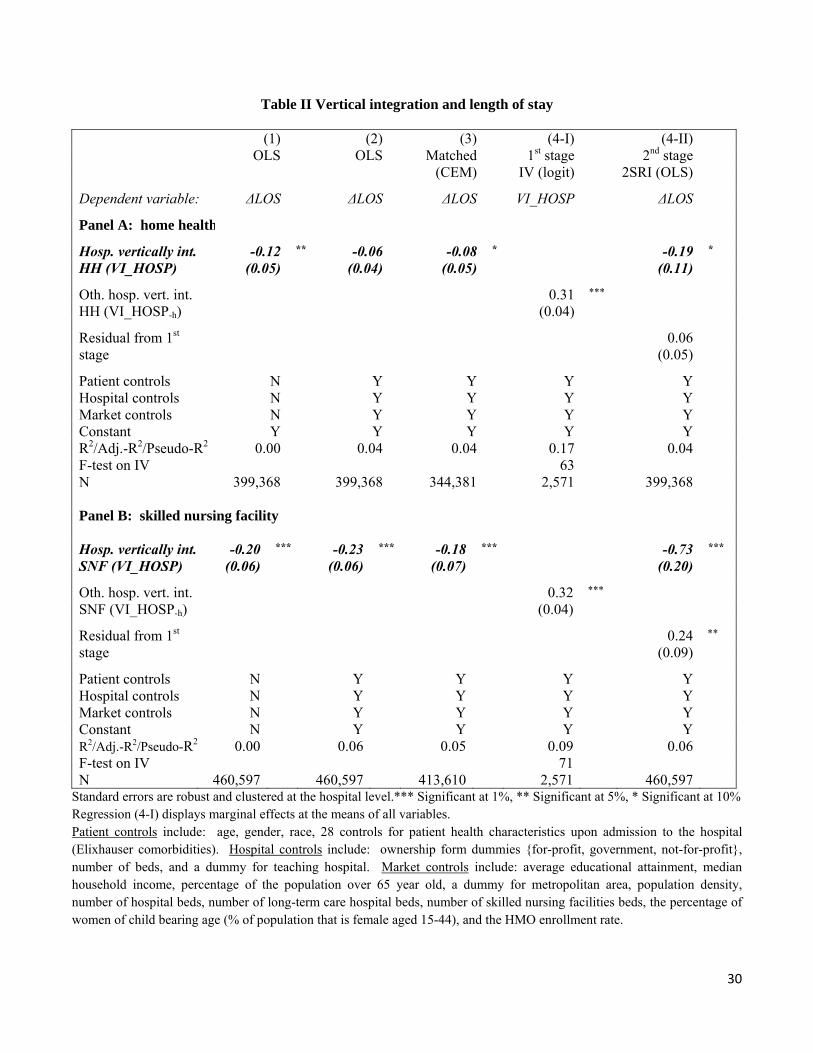
30
Table II Vertical integration and length of stay
(1) (2) (3) (4-I) (4-II) OLS OLS Matched 1st stage 2nd stage (CEM) IV (logit) 2SRI (OLS)
Dependent variable: ΔLOS ΔLOS ΔLOS VI_HOSP ΔLOS
Panel A: home health
Hosp. vertically int. -0.12 ** -0.06 -0.08 * -0.19 *
HH (VI_HOSP) (0.05) (0.04) (0.05) (0.11)
Oth. hosp. vert. int. 0.31 ***
HH (VI_HOSP-h) (0.04)
Residual from 1st 0.06
stage (0.05)
Patient controls N Y Y Y YHospital controls N Y Y Y YMarket controls N Y Y Y YConstant Y Y Y Y YR2/Adj.-R2/Pseudo-R2 0.00 0.04 0.04 0.17 0.04F-test on IV 63 N 399,368 399,368 344,381 2,571 399,368 Panel B: skilled nursing facility Hosp. vertically int. -0.20 *** -0.23 *** -0.18 *** -0.73 ***
SNF (VI_HOSP) (0.06) (0.06) (0.07) (0.20)
Oth. hosp. vert. int. 0.32 ***
SNF (VI_HOSP-h) (0.04)
Residual from 1st 0.24 **
stage (0.09)
Patient controls N Y Y Y Y Hospital controls N Y Y Y Y Market controls N Y Y Y Y Constant N Y Y Y Y R2/Adj.-R2/Pseudo-R2 0.00 0.06 0.05 0.09 0.06 F-test on IV 71 N 460,597 460,597 413,610 2,571 460,597
Standard errors are robust and clustered at the hospital level.*** Significant at 1%, ** Significant at 5%, * Significant at 10% Regression (4-I) displays marginal effects at the means of all variables. Patient controls include: age, gender, race, 28 controls for patient health characteristics upon admission to the hospital (Elixhauser comorbidities). Hospital controls include: ownership form dummies {for-profit, government, not-for-profit}, number of beds, and a dummy for teaching hospital. Market controls include: average educational attainment, median household income, percentage of the population over 65 year old, a dummy for metropolitan area, population density, number of hospital beds, number of long-term care hospital beds, number of skilled nursing facilities beds, the percentage of women of child bearing age (% of population that is female aged 15-44), and the HMO enrollment rate.
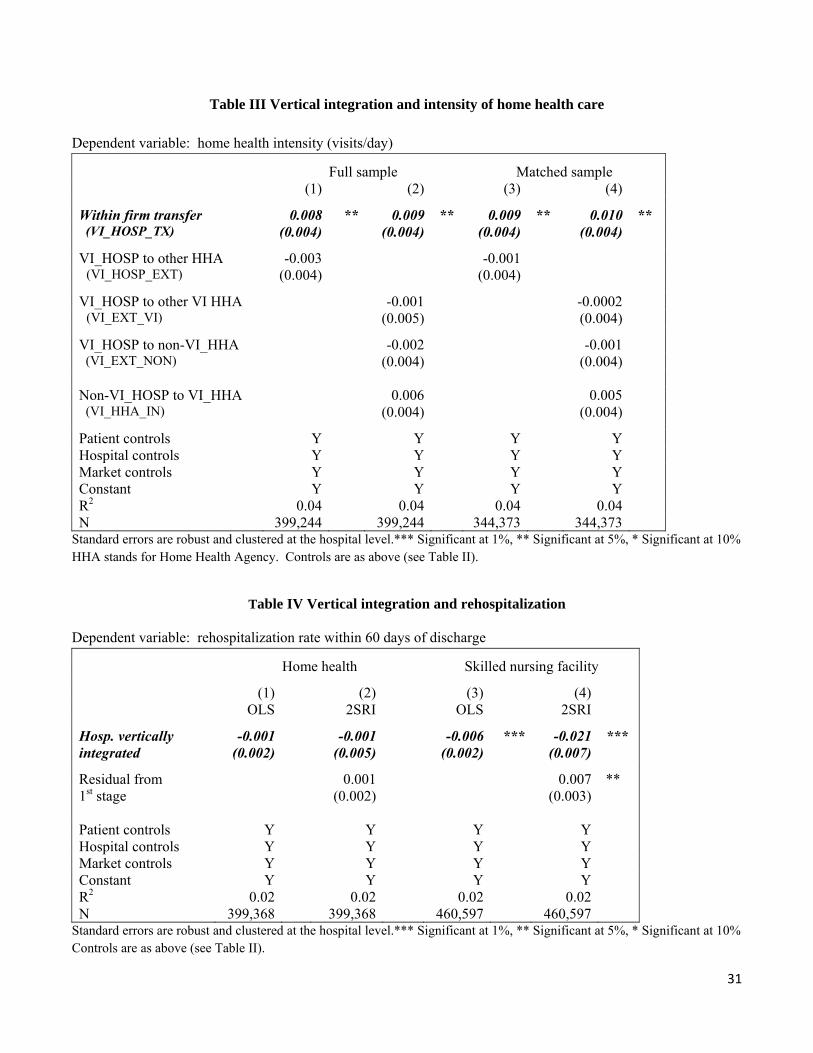
31
Table III Vertical integration and intensity of home health care
Dependent variable: home health intensity (visits/day)
Full sample Matched sample (1) (2) (3) (4)
Within firm transfer 0.008 ** 0.009 ** 0.009 ** 0.010 ** (VI_HOSP_TX) (0.004) (0.004) (0.004) (0.004)
VI_HOSP to other HHA -0.003 -0.001 (VI_HOSP_EXT) (0.004) (0.004)
VI_HOSP to other VI HHA -0.001 -0.0002 (VI_EXT_VI) (0.005) (0.004)
VI_HOSP to non-VI_HHA -0.002 -0.001 (VI_EXT_NON) (0.004) (0.004) Non-VI_HOSP to VI_HHA 0.006 0.005 (VI_HHA_IN) (0.004) (0.004)
Patient controls Y Y Y Y Hospital controls Y Y Y Y Market controls Y Y Y Y Constant Y Y Y Y R2 0.04 0.04 0.04 0.04 N 399,244 399,244 344,373 344,373
Standard errors are robust and clustered at the hospital level.*** Significant at 1%, ** Significant at 5%, * Significant at 10% HHA stands for Home Health Agency. Controls are as above (see Table II).
Table IV Vertical integration and rehospitalization
Dependent variable: rehospitalization rate within 60 days of discharge
Home health Skilled nursing facility
(1) (2) (3) (4) OLS 2SRI OLS 2SRI
Hosp. vertically -0.001 -0.001 -0.006 *** -0.021 *** integrated (0.002) (0.005) (0.002) (0.007)
Residual from 0.001 0.007 ** 1st stage (0.002) (0.003) Patient controls Y Y Y Y Hospital controls Y Y Y Y Market controls Y Y Y Y Constant Y Y Y Y R2 0.02 0.02 0.02 0.02 N 399,368 399,368 460,597 460,597
Standard errors are robust and clustered at the hospital level.*** Significant at 1%, ** Significant at 5%, * Significant at 10% Controls are as above (see Table II).

32
Appendix A: Task allocation and economies of scope
Example 1: Economies of scope in tasks
Assume jijjjjj skkskskA )(),( and iiiii ksksA ),( . The penalty in the case of integration
is given by ijp . In addition, assume that the value of assets is the product of the general task, k, to the site-
dedicated tasks, si or sj.
The payoff from asset Ai is given by iiiiiiii ksksAksA ),()),(( and the payoff from asset Aj is
given by jijjjjj skkskskA )()),(( . The resulting payoff under vertical integration is given by
ijjiiiVI pskkks )( . The optimal pair ),( **ji kk is:
ji
jj
ji
ii ss
ksk
ss
ksk
** , (i.e. *ik is increasing
in si and decreasing in sj).
On the other hand, the payoff under market exchange is given by jiiiME skkks )~
(~ . Note
that market exchange leads to the allocation )2
,2
()~
,~
(kk
kk ji .
The difference between payoff under vertical integration, πVI, and under market exchange, πME, is given
by the following equation:
22),(
22 ksksp
ss
ks
ss
kspk ji
ijji
j
ji
iijMEVI , with this
difference increasing in the magnitude of the general task, k, and decreasing in the cost of vertical integration, pij:
0),(
k
pk ij, and 0
),(
ij
ij
p
pk.
The difference between payoff under vertical integration, πVI, and under market exchange, πME, is given
by the following equation:
22),(
22 ksksp
ss
ks
ss
kspk ji
ijji
j
ji
iijMEVI , with this
difference increasing in the magnitude of the general task, k, and decreasing in the cost of vertical integration, pij:
0),(
k
pk ij, and 0
),(
ij
ij
p
pk. Figure A.1 illustrates the tradeoff between vertical integration and
market exchange when there are economies of scope in tasks. *******************************
Figure A.1 about here *******************************
Example 2: Diseconomies of scope in tasks In this example, the partials of Ai and Aj satisfy the following conditions: (1) the marginal product of si
and sj are strictly positive, and (2) the cross derivatives for (si, ki) and (sj, kj) are negative. The following functional form satisfy both conditions: and . The parameters , are meant to capture the intensity of the diseconomies fo scope. As before, the total amount of the general task is fixed and the division of the general task must satisfy (where , 0 . Furthermore, to ensure that both assets have strictly positive value and that the marginal product of the site-dedicated tasks are also strictly positive, we assume 1/ and 1/ . Finally, we assume that the payoff function has the form
√ .

33
The vertically integrated firm solves log log .
The first order condition is ∗ ∗. The optimal value of is given by ∗ .
Note that the general task is divided evenly between the assets if and only if αi = αj are equal. Therefore, the allocation of the general task is determined by the relative levels of , .
Under market exchange, each firm owning only one of the assets prefers to have none of the general task.
For example, if a firm owns asset i, 1 0. The inequality is implied by the assumption: 1/ .
Since payoffs are increasing in A, the firm prefers to avoid doing the general task. A similar task holds for a firm owning the other asset. So, no matter the relative intensities of diseconomies of scope, market exchange will lead to an equal division of the general task across firms and the first-best payoff will not be attained.
The difference between payoffs under vertical integration and market exchange is similar to the expression of the previous example. The difference in payoffs decreases in the value of the penalty function. However, the change in relative payoffs due to changes in the size of the general task depends on the values of
, and , . Example 3: Firms desiring a general task allocation such that, (0,0) < (ki,kj) < (1,1)
Assume 2222 )()(),( ijijjjjjjjj kkskksksksskA and
22),( iiiiiii kkssksA .
The penalty, in the case of integration, is given by ijp . In addition, assume that the value of assets is the product
of the general task, k, to the site-dedicated tasks, si or sj.
The pair )2
,2
(),( jiji
sskk represents the desired amount of k for each firm/asset. But more importantly,
note that as long as ji ss ji kk . Note that 242
)(~ ksskkkkk jiji
ii
and
242
)(~ ksskkkkk ijji
jj
.
Figure A.1 Task allocation and efficient exchange
Firms’ choose vertical integration Firms’ choose market exchange
ME VI
k ik~ *
ik
ijp
ME
k ik~ *
ik
VIijp