Embed Size (px)
Citation preview
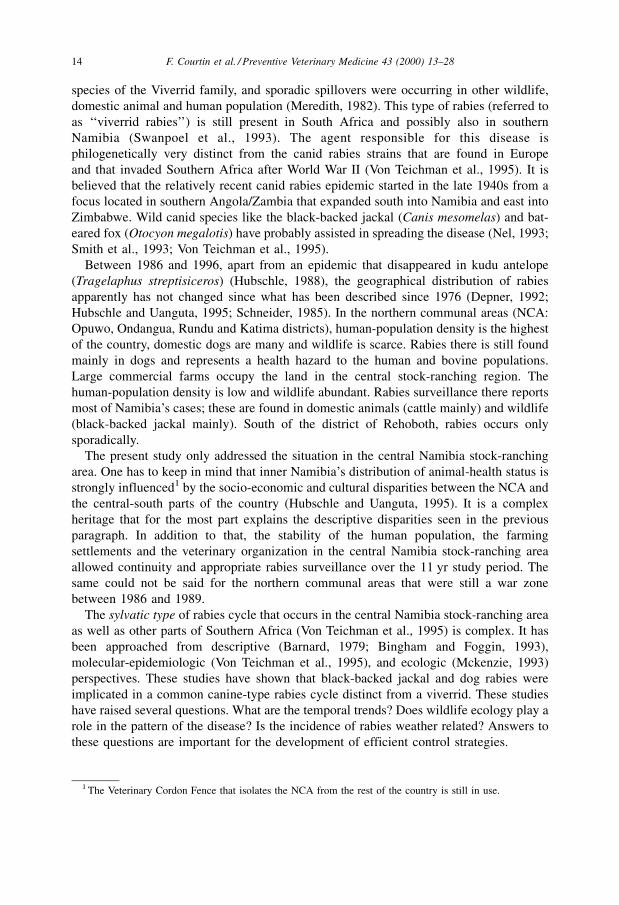
Temporal patterns of domestic and wildlife rabies in
central Namibia stock-ranching area, 1986±1996
F. Courtina, T.E. Carpenterb, R.D. Paskinc, B.B. Chomela,*
aDepartment of Population Health and Reproduction, School of Veterinary Medicine, Davis, CA 95616, USAbDepartment of Medicine and Epidemiology, School of Veterinary Medicine, Davis, CA 95616, USA
cEpidemiology unit, Directorate of Veterinary Services, Private Bag 12022, Auspansplatz, Windhoek, Namibia
Accepted 23 July 1999
Abstract
Eleven years (1986±1996) of wildlife- and domestic-rabies data from the agriculture stock-
ranching area of central Namibia were studied using time-series analysis. Nine hundred and sixty
three rabies cases were observed in domestic ruminants (5.4 cases/mo), black-backed jackals (Canis
mesomelas, 1.3 cases/mo), domestic dogs (0.5 case/mo), and bat-eared foxes (Otocyon megalotis,
0.1 case/mo). The incidence of rabies for all species did not change significantly over the whole
study period. However, seasonal variations with an increase in the number of cases between June
and November of each year, as well as 3±4 yr cyclical fluctuations were identified in domestic
ruminants and black-backed jackals. The black-backed jackal time-series variable was a significant
predictor of the domestic-ruminant and dog time-series variables. The rainfall seasonality combined
with the seasonal reproductive pattern of the black-backed jackal appeared to be plausible
explanations for the seasonal variations of rabies. However, there was no overall significant
correlation between the cyclical weather fluctuations and the 3±4 yr cyclical rabies variations.
# 2000 Elsevier Science B.V. All rights reserved.
Keywords: Rabies virus; Time-series analysis; Black-backed jackal; Canis mesomelas; Namibia; Southern
Africa
1. Introduction
Rabies must have been present in the highveld plateau of Southern Africa since at least
the beginning of the 20th century. The disease was mainly affecting endogenous wild
Preventive Veterinary Medicine 43 (2000) 13±28
* Corresponding author. Tel.: 1-916-752-8112; fax: 1-916-752-2377.
E-mail address: [email protected] (B.B. Chomel)
0167-5877/00/$ ± see front matter # 2000 Elsevier Science B.V. All rights reserved.
PII: S 0 1 6 7 - 5 8 7 7 ( 9 9 ) 0 0 0 8 3 - 5
species of the Viverrid family, and sporadic spillovers were occurring in other wildlife,
domestic animal and human population (Meredith, 1982). This type of rabies (referred to
as `̀ viverrid rabies'') is still present in South Africa and possibly also in southern
Namibia (Swanpoel et al., 1993). The agent responsible for this disease is
philogenetically very distinct from the canid rabies strains that are found in Europe
and that invaded Southern Africa after World War II (Von Teichman et al., 1995). It is
believed that the relatively recent canid rabies epidemic started in the late 1940s from a
focus located in southern Angola/Zambia that expanded south into Namibia and east into
Zimbabwe. Wild canid species like the black-backed jackal (Canis mesomelas) and bat-
eared fox (Otocyon megalotis) have probably assisted in spreading the disease (Nel, 1993;
Smith et al., 1993; Von Teichman et al., 1995).
Between 1986 and 1996, apart from an epidemic that disappeared in kudu antelope
(Tragelaphus streptisiceros) (Hubschle, 1988), the geographical distribution of rabies
apparently has not changed since what has been described since 1976 (Depner, 1992;
Hubschle and Uanguta, 1995; Schneider, 1985). In the northern communal areas (NCA:
Opuwo, Ondangua, Rundu and Katima districts), human-population density is the highest
of the country, domestic dogs are many and wildlife is scarce. Rabies there is still found
mainly in dogs and represents a health hazard to the human and bovine populations.
Large commercial farms occupy the land in the central stock-ranching region. The
human-population density is low and wildlife abundant. Rabies surveillance there reports
most of Namibia's cases; these are found in domestic animals (cattle mainly) and wildlife
(black-backed jackal mainly). South of the district of Rehoboth, rabies occurs only
sporadically.
The present study only addressed the situation in the central Namibia stock-ranching
area. One has to keep in mind that inner Namibia's distribution of animal-health status is
strongly influenced1 by the socio-economic and cultural disparities between the NCA and
the central-south parts of the country (Hubschle and Uanguta, 1995). It is a complex
heritage that for the most part explains the descriptive disparities seen in the previous
paragraph. In addition to that, the stability of the human population, the farming
settlements and the veterinary organization in the central Namibia stock-ranching area
allowed continuity and appropriate rabies surveillance over the 11 yr study period. The
same could not be said for the northern communal areas that were still a war zone
between 1986 and 1989.
The sylvatic type of rabies cycle that occurs in the central Namibia stock-ranching area
as well as other parts of Southern Africa (Von Teichman et al., 1995) is complex. It has
been approached from descriptive (Barnard, 1979; Bingham and Foggin, 1993),
molecular-epidemiologic (Von Teichman et al., 1995), and ecologic (Mckenzie, 1993)
perspectives. These studies have shown that black-backed jackal and dog rabies were
implicated in a common canine-type rabies cycle distinct from a viverrid. These studies
have raised several questions. What are the temporal trends? Does wildlife ecology play a
role in the pattern of the disease? Is the incidence of rabies weather related? Answers to
these questions are important for the development of efficient control strategies.
1 The Veterinary Cordon Fence that isolates the NCA from the rest of the country is still in use.
14 F. Courtin et al. / Preventive Veterinary Medicine 43 (2000) 13±28
The objectives of this study were to identify and quantify the temporal distribution of
rabies cases in central Namibia over the period 1986±1996.
2. Materials and methods
2.1. Surveillance data
Data were obtained from computer records of the Veterinary Services of Namibia for
the period 1986±1996. Rabies is a notifiable disease in Namibia and it is required that all
occurrences of this disease be reported (and should therefore appear in the database).
During the 11 yr study period, no significant change in human population, farming
settlements and operation of veterinary organization that could have affected the level of
cases discoveries and reporting from the field was noted. The records contained
information on species, place, time, clinical signs and laboratory confirmation of cases.
Laboratory work was performed primarily at the Central Veterinary Laboratory of
Windhoek, Namibia, but a limited number of samples were tested at the Grootfontein
Diagnostic Laboratory or the Onderstepoort Veterinary Institute, South Africa. Annual
stock census and vaccination numbers of cattle for the five districts of Grootfontein,
Otjiwarongo, Windhoek, Omaruru and Okahandja were also collected from the
Veterinary Services.
2.2. Weather data
Monthly total precipitation data for the weather stations of Grootfontein, Otjiwarongo,
Windhoek and Gobabis were obtained from the Namibian National Weather Bureau
(Windhoek, Namibia).
2.3. Case definition and other study restrictions
A case was defined as a temporal (day) and spatial (farm premises or any other location
of discovery) cluster of one or more animals of the same species clinically diagnosed as
rabid or carcass discoveries with rabies suspicion. In other words, if on a certain day at a
certain location, one or more animals of the same species were clinically diagnosed as
rabid or one or more carcasses of the same species were discovered and rabies was the
suspected cause of death, it constituted a case. If at least one sample from this cluster
were confirmed by immunofluorescent direct test or histopathologic examination, then
the cluster became a confirmed case. Only laboratory-confirmed cases (963/1,146; 84%
of total cases) in black-backed jackals, dogs, bat-eared foxes and domestic ruminants
(bovine, ovine and caprine) for the following 13 districts of central Namibia:
Grootfontein, Tsumeb, Outjo, Khorixas, Otjiwarongo, Otjinene, Okakarara, Gobabis,
Omaruru, Okahandja, Karibib, Windhoek and Rehoboth were used. Confirmed cases in
other animal species (viverrids, rodents, wild ungulates and other domestics) which
accounted for less than 1% of total confirmed cases were excluded. Because this study
F. Courtin et al. / Preventive Veterinary Medicine 43 (2000) 13±28 15
focused on the situation in stock-ranching areas, cases that occurred in the wildlife-
conservation reserve of Etosha were also excluded.
2.4. Monitoring of surveillance level during study period
Possible changes in the level of surveillance of the disease between 1986 and 1996,
which could be a source of bias, were evaluated using two indices: percentage submission
and percentage confirmation of submitted cases
1. The percentage submission is an indicator of change in the logistical organization of
veterinary laboratory submission of cases. It is calculated as 100�S/T, with S being the
number of submissions of rabies suspects and T the total number of reported suspected
rabies cases.
2. The percentage confirmation of submitted cases, under the hypothesis that laboratory
quality (test sensitivity) and submission percentage together have been stable, is an
indicator of the accuracy of rabies suspicion in the field by farmers and vets. It is
calculated as 100�C/S, with C being the number of confirmed cases and S the number
of submissions of rabies suspects.
3. Correlations between these annual indices and the annual rabies incidence data were
examined using Pearson's r. The null hypotheses for the two correlations (r � 0) were
examined with 2-tailed t-tests (Altman, 1991).
2.5. Temporal components of time series
Confirmed cases were grouped by species and month (t) of clinical diagnosis or carcass
discovery and formed 132 periods (months) for the time series (Yt) for each species.
Initial time-series analysis was performed using Minitab 11.1 (MTB Inc., State College,
PA 16801, USA) to identify the four components of the temporal additive model for each
species: long-term trend (Tt), seasonality (St), cyclicity (Ct), and irregularity (It):
Yt � Tt � St � Ct � It: (1)
The decomposition consisted of three steps. First, Tt was analyzed by fitting a least-
squares regression line to the time series. Second, St was identified using a ratio-to-
moving-average method (Lapin, 1973) with a length of 12 periods. Third, deseasonalized
(has trend and error components; season effect removed) and detrended (has season and
error components; trend effect removed) data were smoothed with a single exponential
process to remove It and identify Ct. During this process, the program identified the best
weight of the exponential average by minimizing the sum of squared errors.
The autocorrelation function (ACF) (Minitab, 1996) calculated the correlation
coefficient rk, a measure of linear relationship (Daniel, 1991) of the ratio between a
species-specific time series and itself lagged by k time periods. The default number of
lags, 33 (i.e. n/4, where n � the number of observations in the series) was selected. This
function gave a way to test for the significance of seasonality in a time series by
examining the ACF at seasonal lags of 12 mo intervals. Correlation coefficients from the
ACF were tested by Z-tests (Daniel, 1991).
16 F. Courtin et al. / Preventive Veterinary Medicine 43 (2000) 13±28
2.6. Temporal associations between species time series
Cross-correlations (Minitab, 1996) Ð measures of linear relationships (Daniel, 1991)
between two different species-specific time series lagged by k periods Ð were run for
lags �10 mo (sufficient to cover large incubation periods for rabies) using Minitab. The
significance of these cross-correlations was calculated with a Z test for the correlation
coefficient (Daniel, 1991).
When the result of this analysis indicated association between the time series of two
different species, the nature of this association was investigated further with a dynamic
regression approach using Forecast Pro software (BFS, Belmont, MA 02178, USA). A
dynamic regression time-series model evaluates the relationship between a dependent
variable and both lagged values of itself and other explanatory variables. This method
allowed construction of a model for prediction of a dependent time-series variable (Y)
with explanatory time-series variables (X1, X2, ..., Xn) and an error term based on past
error autocorrelations e(t) :
Y � �0 � �1X1 � �2X2 � � � � � �nXn � e�t�: (2)
Model selection was performed by including variables in a forward stepwise manner.
First, the variables of interest (time series of the two species for which an association was
found) were forced into the model. Improved models were evaluated as follows:
additional variables (such as cattle population numbers and vaccination coverage) were
selected for entry based on statistical significance (p < 0.05) of the coefficient. Overall
goodness-of-fit of the model was tested with a Ljung-Box goodness-of-fit test
(Stellwagen and Goodrich, 1994):
Q � T�T � 2�Xp
1
�r2i =�Tÿi�� (3)
in which p is the number of parameters, T is the number of time periods in the series,
ri is the autocorrelation at lag i month. Q is a weighted sum of squared correlations
that has approximately a chi-square distribution with Lÿp degrees of freedom, where
L is the lag. This statistic was used to test for overall autocorrelation of the fitted errors
of the model. If there is significant autocorrelation, then future errors can be predicted
from past errors. If this is true, Q is significant and the model is not valid and needs
improvement.
Finally, the Bayesian Information Criterion (BIC) (Stellwagen and Goodrich, 1994)
was used to discriminate among the (typically several) satisfactory models that were
found:
BIC � MSE � T �p=2T�: (4)
The BIC rewards goodness-of-fit (as measured by the mean squared error; MSE), and
penalizes for complexity (Stellwagen and Goodrich, 1994). Reducing the MSE implies
both better fit and (as can be seen in Eq. (4)) reduces the BIC; clearly, smaller BIC is
preferred. The BIC is used to avoid poor forecasting often seen when a model is very
complex (several parameters).
F. Courtin et al. / Preventive Veterinary Medicine 43 (2000) 13±28 17
2.6.1. Effects of weather, stock numbers and vaccinations of domestic animals
Independence between cumulative yearly rainfall (September through August) and
cumulative yearly rabies cases (all 4 species combined; January through December) was
tested with a two-tailed Spearman rank test (Hajek, 1969). Analyses were conducted for
the period 1986±1995 and the study area as a whole, using mean annual rainfall from all
regions. It was also done individually for Grootfontein, Otjiwarongo and Windhoek
districts where complete rainfall data were available.
Yearly cattle population numbers and vaccination coverage over the study period were
examined for possible variations and potential confounding. These two variables were
offered to each of the four species-specific models (Eq. (2)).
3. Results
3.1. Overall results and monitoring of surveillance level
Totals of 713 confirmed cases in domestic ruminants (5.4 cases/mo) Ð 169 in black-
backed jackals (1.3 cases/mo), 65 in dogs (0.5 case/mo) and 16 in bat-eared foxes (0.1
case/mo) Ð were reported during 1986±1996. Epidemio-surveillance indices (% of total
cases that were submitted and % of laboratory submitted cases that were confirmed) were
consistently high (�79%) throughout the study period (Table 1). However no substantial
bias was believed to exist because the correlations between confirmed cases and the
surveillance indices were small (0.11, 0.24, and 0.23) and non-significant (P > 0.3).
3.2. Long-term trend
Long-term trend was almost negligible. Over the 11 yr period it amounted to �0.9,
ÿ0.5, �0.3 and �0.1 cases in domestic ruminants, black-backed jackals, dogs and bat-
eared foxes, respectively.
Table 1
Indices of rabies surveillance level in central Namibia, 1986±1996
Year Total
reported
cases
Total
confirmed
cases
% of total reported
cases that were
submitted
% of laboratory-
submitted cases
that were confirmed
1986 90 65 79 91
1987 114 86 86 88
1988 151 113 94 80
1989 115 104 92 98
1990 101 89 95 93
1991 79 65 95 86
1992 111 106 97 98
1993 56 50 98 91
1994 81 71 98 89
1995 145 131 95 95
1996 95 83 99 88
18 F. Courtin et al. / Preventive Veterinary Medicine 43 (2000) 13±28
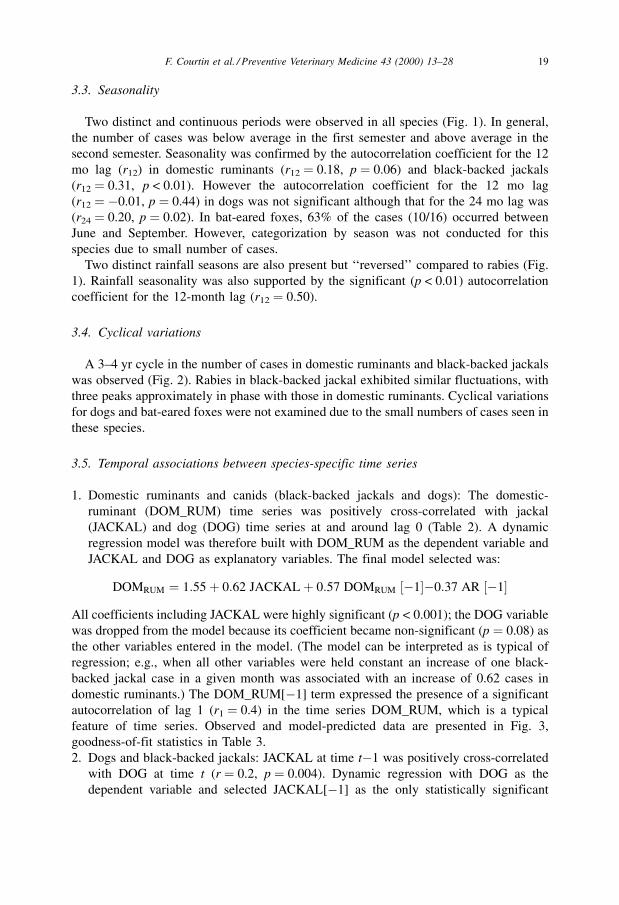
3.3. Seasonality
Two distinct and continuous periods were observed in all species (Fig. 1). In general,
the number of cases was below average in the first semester and above average in the
second semester. Seasonality was confirmed by the autocorrelation coefficient for the 12
mo lag (r12) in domestic ruminants (r12 � 0.18, p � 0.06) and black-backed jackals
(r12 � 0.31, p < 0.01). However the autocorrelation coefficient for the 12 mo lag
(r12 � ÿ0.01, p � 0.44) in dogs was not significant although that for the 24 mo lag was
(r24 � 0.20, p � 0.02). In bat-eared foxes, 63% of the cases (10/16) occurred between
June and September. However, categorization by season was not conducted for this
species due to small number of cases.
Two distinct rainfall seasons are also present but `̀ reversed'' compared to rabies (Fig.
1). Rainfall seasonality was also supported by the significant (p < 0.01) autocorrelation
coefficient for the 12-month lag (r12 � 0.50).
3.4. Cyclical variations
A 3±4 yr cycle in the number of cases in domestic ruminants and black-backed jackals
was observed (Fig. 2). Rabies in black-backed jackal exhibited similar fluctuations, with
three peaks approximately in phase with those in domestic ruminants. Cyclical variations
for dogs and bat-eared foxes were not examined due to the small numbers of cases seen in
these species.
3.5. Temporal associations between species-specific time series
1. Domestic ruminants and canids (black-backed jackals and dogs): The domestic-
ruminant (DOM_RUM) time series was positively cross-correlated with jackal
(JACKAL) and dog (DOG) time series at and around lag 0 (Table 2). A dynamic
regression model was therefore built with DOM_RUM as the dependent variable and
JACKAL and DOG as explanatory variables. The final model selected was:
DOMRUM � 1:55� 0:62 JACKAL� 0:57 DOMRUM �ÿ1�ÿ0:37 AR �ÿ1�All coefficients including JACKAL were highly significant (p < 0.001); the DOG variable
was dropped from the model because its coefficient became non-significant (p � 0.08) as
the other variables entered in the model. (The model can be interpreted as is typical of
regression; e.g., when all other variables were held constant an increase of one black-
backed jackal case in a given month was associated with an increase of 0.62 cases in
domestic ruminants.) The DOM_RUM[ÿ1] term expressed the presence of a significant
autocorrelation of lag 1 (r1 � 0.4) in the time series DOM_RUM, which is a typical
feature of time series. Observed and model-predicted data are presented in Fig. 3,
goodness-of-fit statistics in Table 3.
2. Dogs and black-backed jackals: JACKAL at time tÿ1 was positively cross-correlated
with DOG at time t (r � 0.2, p � 0.004). Dynamic regression with DOG as the
dependent variable and selected JACKAL[ÿ1] as the only statistically significant
F. Courtin et al. / Preventive Veterinary Medicine 43 (2000) 13±28 19
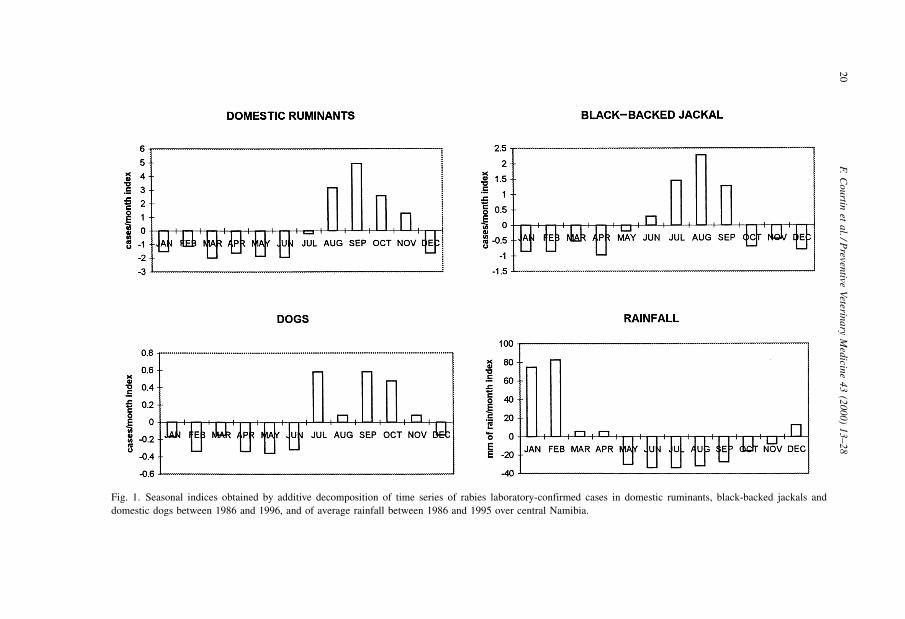
Fig. 1. Seasonal indices obtained by additive decomposition of time series of rabies laboratory-confirmed cases in domestic ruminants, black-backed jackals and
domestic dogs between 1986 and 1996, and of average rainfall between 1986 and 1995 over central Namibia.
20
F.
Co
urtin
eta
l./Preven
tiveV
eterina
ryM
edicin
e43
(2000)
13±28
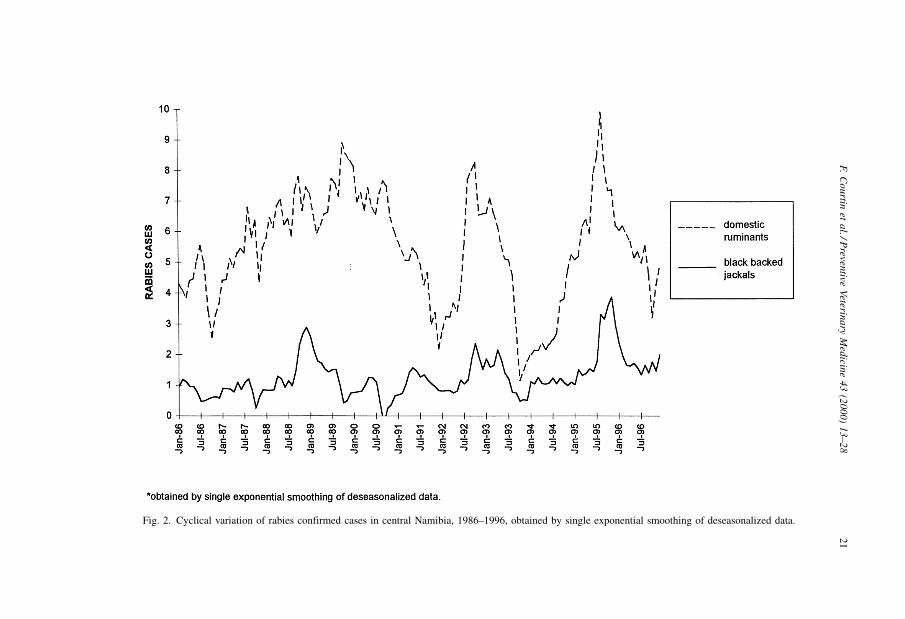
Fig. 2. Cyclical variation of rabies confirmed cases in central Namibia, 1986±1996, obtained by single exponential smoothing of deseasonalized data.
F.
Co
urtin
eta
l./Preven
tiveV
eterina
ryM
edicin
e43
(2000)
13±28
21
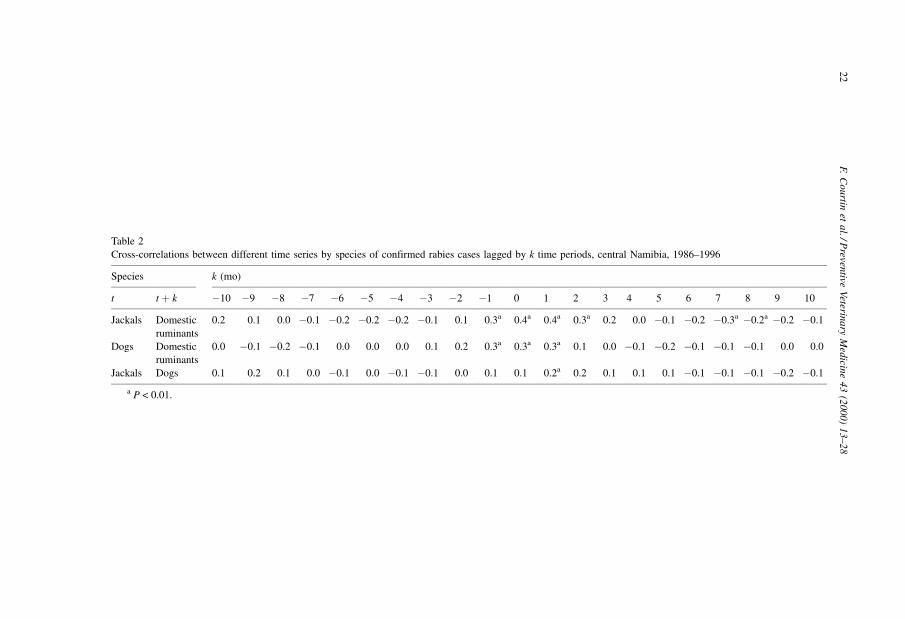
Table 2
Cross-correlations between different time series by species of confirmed rabies cases lagged by k time periods, central Namibia, 1986±1996
Species k (mo)
t t � k ÿ10 ÿ9 ÿ8 ÿ7 ÿ6 ÿ5 ÿ4 ÿ3 ÿ2 ÿ1 0 1 2 3 4 5 6 7 8 9 10
Jackals Domestic
ruminants
0.2 0.1 0.0 ÿ0.1 ÿ0.2 ÿ0.2 ÿ0.2 ÿ0.1 0.1 0.3a 0.4a 0.4a 0.3a 0.2 0.0 ÿ0.1 ÿ0.2 ÿ0.3a ÿ0.2a ÿ0.2 ÿ0.1
Dogs Domestic
ruminants
0.0 ÿ0.1 ÿ0.2 ÿ0.1 0.0 0.0 0.0 0.1 0.2 0.3a 0.3a 0.3a 0.1 0.0 ÿ0.1 ÿ0.2 ÿ0.1 ÿ0.1 ÿ0.1 0.0 0.0
Jackals Dogs 0.1 0.2 0.1 0.0 ÿ0.1 0.0 ÿ0.1 ÿ0.1 0.0 0.1 0.1 0.2a 0.2 0.1 0.1 0.1 ÿ0.1 ÿ0.1 ÿ0.1 ÿ0.2 ÿ0.1
a P < 0.01.
22
F.
Co
urtin
eta
l./Preven
tiveV
eterina
ryM
edicin
e43
(2000)
13±28
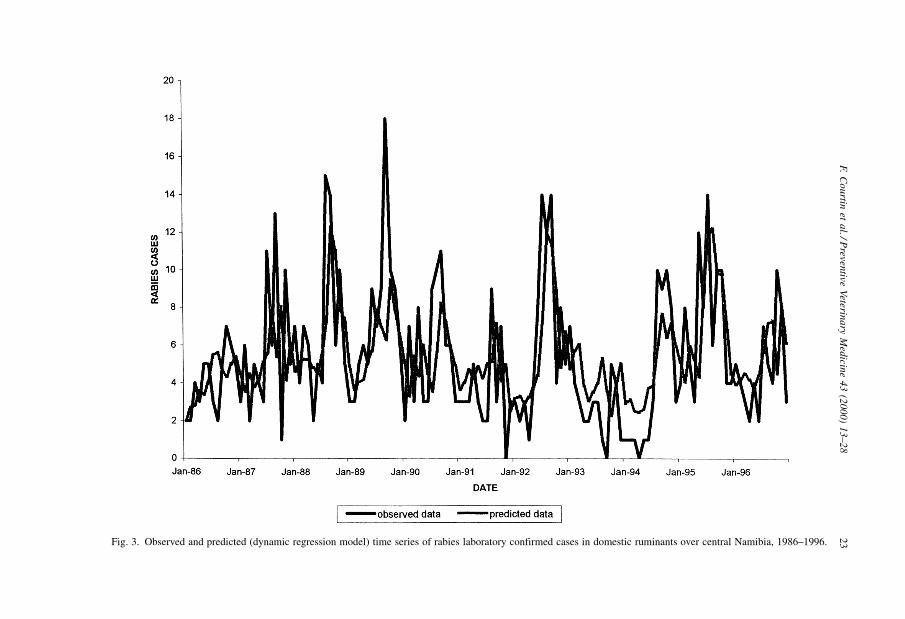
Fig. 3. Observed and predicted (dynamic regression model) time series of rabies laboratory confirmed cases in domestic ruminants over central Namibia, 1986±1996.
F.
Co
urtin
eta
l./Preven
tiveV
eterina
ryM
edicin
e43
(2000)
13±28
23
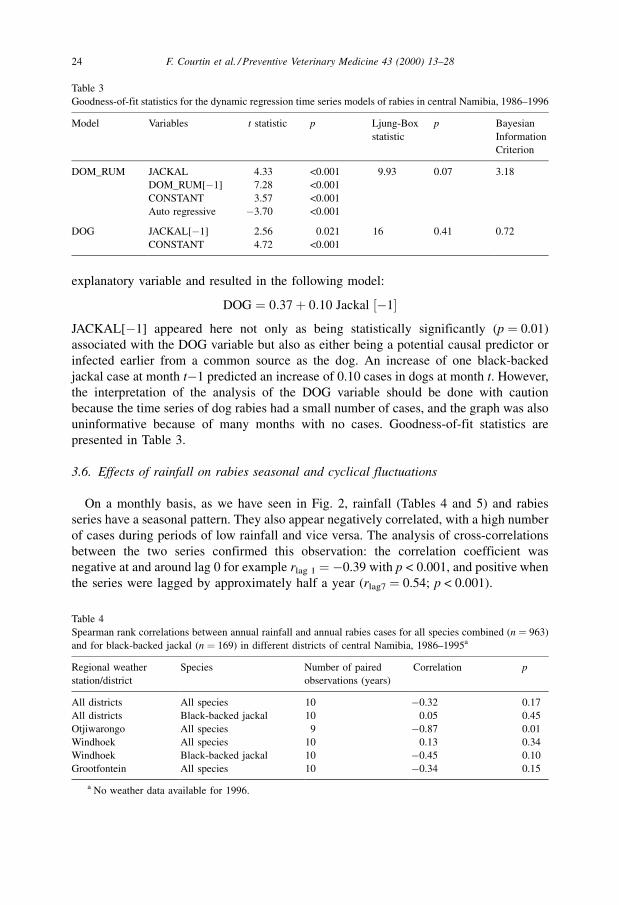
explanatory variable and resulted in the following model:
DOG � 0:37� 0:10 Jackal �ÿ1�JACKAL[ÿ1] appeared here not only as being statistically significantly (p � 0.01)
associated with the DOG variable but also as either being a potential causal predictor or
infected earlier from a common source as the dog. An increase of one black-backed
jackal case at month tÿ1 predicted an increase of 0.10 cases in dogs at month t. However,
the interpretation of the analysis of the DOG variable should be done with caution
because the time series of dog rabies had a small number of cases, and the graph was also
uninformative because of many months with no cases. Goodness-of-fit statistics are
presented in Table 3.
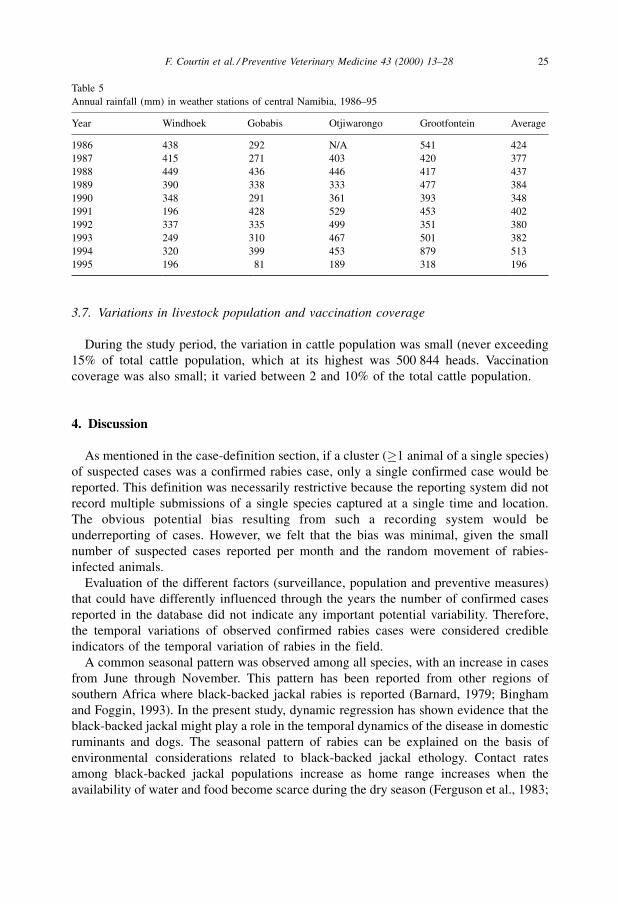
3.6. Effects of rainfall on rabies seasonal and cyclical fluctuations
On a monthly basis, as we have seen in Fig. 2, rainfall (Tables 4 and 5) and rabies
series have a seasonal pattern. They also appear negatively correlated, with a high number
of cases during periods of low rainfall and vice versa. The analysis of cross-correlations
between the two series confirmed this observation: the correlation coefficient was
negative at and around lag 0 for example rlag 1 � ÿ0.39 with p < 0.001, and positive when
the series were lagged by approximately half a year (rlag7 � 0.54; p < 0.001).
Table 3
Goodness-of-fit statistics for the dynamic regression time series models of rabies in central Namibia, 1986±1996
Model Variables t statistic p Ljung-Box
statistic
p Bayesian
Information
Criterion
DOM_RUM JACKAL 4.33 <0.001 9.93 0.07 3.18
DOM_RUM[ÿ1] 7.28 <0.001
CONSTANT 3.57 <0.001
Auto regressive ÿ3.70 <0.001
DOG JACKAL[ÿ1] 2.56 0.021 16 0.41 0.72
CONSTANT 4.72 <0.001
Table 4
Spearman rank correlations between annual rainfall and annual rabies cases for all species combined (n � 963)
and for black-backed jackal (n � 169) in different districts of central Namibia, 1986±1995a
Regional weather
station/district
Species Number of paired
observations (years)
Correlation p
All districts All species 10 ÿ0.32 0.17
All districts Black-backed jackal 10 0.05 0.45
Otjiwarongo All species 9 ÿ0.87 0.01
Windhoek All species 10 0.13 0.34
Windhoek Black-backed jackal 10 ÿ0.45 0.10
Grootfontein All species 10 ÿ0.34 0.15
a No weather data available for 1996.
24 F. Courtin et al. / Preventive Veterinary Medicine 43 (2000) 13±28
3.7. Variations in livestock population and vaccination coverage
During the study period, the variation in cattle population was small (never exceeding
15% of total cattle population, which at its highest was 500 844 heads. Vaccination
coverage was also small; it varied between 2 and 10% of the total cattle population.
4. Discussion
As mentioned in the case-definition section, if a cluster (�1 animal of a single species)
of suspected cases was a confirmed rabies case, only a single confirmed case would be
reported. This definition was necessarily restrictive because the reporting system did not
record multiple submissions of a single species captured at a single time and location.
The obvious potential bias resulting from such a recording system would be
underreporting of cases. However, we felt that the bias was minimal, given the small
number of suspected cases reported per month and the random movement of rabies-
infected animals.
Evaluation of the different factors (surveillance, population and preventive measures)
that could have differently influenced through the years the number of confirmed cases
reported in the database did not indicate any important potential variability. Therefore,
the temporal variations of observed confirmed rabies cases were considered credible
indicators of the temporal variation of rabies in the field.
A common seasonal pattern was observed among all species, with an increase in cases
from June through November. This pattern has been reported from other regions of
southern Africa where black-backed jackal rabies is reported (Barnard, 1979; Bingham
and Foggin, 1993). In the present study, dynamic regression has shown evidence that the
black-backed jackal might play a role in the temporal dynamics of the disease in domestic
ruminants and dogs. The seasonal pattern of rabies can be explained on the basis of
environmental considerations related to black-backed jackal ethology. Contact rates
among black-backed jackal populations increase as home range increases when the
availability of water and food become scarce during the dry season (Ferguson et al., 1983;
Table 5
Annual rainfall (mm) in weather stations of central Namibia, 1986±95
Year Windhoek Gobabis Otjiwarongo Grootfontein Average
1986 438 292 N/A 541 424
1987 415 271 403 420 377
1988 449 436 446 417 437
1989 390 338 333 477 384
1990 348 291 361 393 348
1991 196 428 529 453 402
1992 337 335 499 351 380
1993 249 310 467 501 382
1994 320 399 453 879 513
1995 196 81 189 318 196
F. Courtin et al. / Preventive Veterinary Medicine 43 (2000) 13±28 25
Mckenzie, 1993). The dry season (May±November) in central Namibia immediately
precedes the dispersal (April) and includes the mating season (June±July) of the black-
backed jackals when new pairs are being formed and new territories established
(Bingham and Foggin, 1993; Ferguson et al., 1983; Mckenzie, 1993). This combination
of factors results in favorable conditions for yearly rabies epidemics after an appropriate
incubation period following exposure. The dry season appears to be a risk factor for
rabies exposure. However, we were not able to differentiate between the individual effects
of absence of rain on the one hand and the behavioral ecology of black-backed jackals on
the other hand because they were seasonally confounded.
The 3±4 yr cyclical patterns found in domestic-ruminant rabies as well as in black-
backed jackal rabies are consistent with prior reports of peaks in 1982 and 1985 for the
same species in the whole country (Hubschle, 1988; Veterinary Services Namibia,
unpublished). A subjective impression was reported that relatively dry years were
associated with high incidence of rabies and vice versa in other words, a negative
correlation with rainfall (Hubschle and Uanguta, 1995). However, our investigation found
no strong statistical evidence of this type of association: out of 6 tests, only one
significant negative correlation was found. In Europe, the cyclical variations of sylvatic
rabies have been explained by variations through time of the population dynamics in the
red-fox reservoir species (Chomel, 1993).
Although developed for the analysis of economic data, time-series analysis is a fruitful
analytical tool for understanding temporal patterns of infectious diseases like rabies
(Childs et al., 1997; Curk and Carpenter, 1994). There are various time-series-analysis
methods available. One could make the reasonable assumption that the merit of a
particular method could be based on its ability to forecast. On a large-scale study
involving the forecasting of 1001 different time series data sets, Makridakis et al. (1982)
found that when confronted with irregular, monthly seasonal data like ours,
decomposition of the time series followed by single exponential smoothening of the
deseasonalized data (such as conducted in this study) outperformed more-complicated
commonly used methods like ARIMA or Holt-Winters. As an example to illustrate the
extent of variation in our data, the irregular component of the domestic ruminant rabies
variable accounted for 56% of the time series variability.
In their work on rabies in rodents and lagomorphs in the eastern United States, Childs
et al. (1997) used cross-correlations between the different species time series to
investigate possible disease interaction between species. Those authors found associa-
tions among the different species studied; however, those relationships were more
complex than were ours Ð involving longer lags (3 mo) and sometimes biseasonal (6 mo)
cross-correlations. In central Namibia, the rabies temporal shape appears homogeneously
centered on the time series of the black-backed jackal.
In the temporal analysis the domestic-dog variable was of secondary importance. We
believe it likely that the cycle is self-maintained in the jackal population and that dog
cases may be the consequence of fights with rabid black-backed jackals. In Europe, the
rabies cycle appears to be self maintained in the red fox population and rare canine cases
originate from spillovers (Aubert, 1995). This would have consequences on the choice of
control strategies. Strain identification using bio-molecular techniques would offer a
valuable means to further investigate the genetic relatedness of cases between jackals and
26 F. Courtin et al. / Preventive Veterinary Medicine 43 (2000) 13±28
dogs found in spatial-temporal clusters of disease (Smith et al., 1993; Von Teichman
et al., 1995).
Cyclical forecast is predicting the next rise in rabies cases in central Namibia in 1998
or 1999. Therefore, a major vaccination effort should be considered for these 2 yr. Based
on the seasonal pattern and a conservative mean incubation period in cattle of 2±3 mo,
domestic animals should be immunized before May.
In the long-term, vaccination of dogs alone appears unlikely to solve the problem and
oral vaccination of the black-backed jackal should be considered (Bingham and Foggin,
1993; Bingham et al., 1995). Baits could be strategically deposited at the beginning of
April when the dry season and the dispersal of young jackals start. In southern Texas,
encouraging results have been obtained after three oral vaccination campaigns (1995,
1996 and 1997) with dropping of 30 baits/km2 to immunize coyotes (Canis latrans)
(Fearneyhough et al., 1997). The semi-arid acacia savanna of southern Texas (Department
of the Interior, 1970) is rather similar to the one of central Namibia (Istituto Geografica
de Agostini, 1976). Coyotes and black-backed jackals have very similar ethology
(Foggin, 1992; Mckenzie, 1993), therefore these vaccination campaigns offer good
background information on how a control plan could successfully be implemented in
central Namibia. However, the area to be covered in central Namibia is substantially
larger (200 000 km2) than the one in Texas (85 264 km2) Ð making the economic and
practical feasibility of such a project more difficult. Further studies would also have to be
conducted to estimate how the population dynamics in the black-backed jackal would
react to the removal of rabies infection, and how it would affect the ecological balance in
the central stock-ranching areas of Namibia.
Acknowledgements
The authors thank Bertchen Kohrs from the Directorate of Veterinary Services of
Namibia and James Case from the California Veterinary Diagnostic Laboratory, Davis,
CA, for their help in conducting this study. This study was supported by the 96±97
Lavoisier grant from the French Ministry of Foreign Affairs, as well as a grant from the
Merial company, Department of Preventive Strategies, Lyon, France.
References
Altman, D.G., 1991. Practical Statistics for Medical Research. Chapman & Hall, London, pp. 293±4.
Aubert, M., 1995. Rabies in Europe: evolution and outlook. Point Vet. 27, 13±22.
Barnard, B.J.H., 1979. The role played by wildlife in the epizootiology of rabies in South Africa and South-West
Africa. Ond. J. Vet. Res. 40, 155±162.
Bingham, J., Foggin, C.M., 1993. Jackal rabies in Zimbabwe. Ond. J. Vet. Res. 60, 365±366.
Bingham, J., Kappeler, A., Hill, F.W.G., King, A., Perry, B.D., Foggin, C.M., 1995. Efficacy of SAD (Berne)
rabies vaccine given by the oral route in two species of jackal. J. Wild. Dis. 31, 416±419.
Childs, J.E., Lesley, C., Krebs, J.W., Strine, T., Feller, M., Noah, D., Drenzek, C., Smith, J.S., Rupprecht, C.E.,
1997. Surveillance and spatiotemporal associations of rabies in rodents and lagomorphs in the United States
1985±1994. J. Wild. Dis. 33, 20±27.
F. Courtin et al. / Preventive Veterinary Medicine 43 (2000) 13±28 27
Chomel, B.B., 1993. The modern epidemiological aspects of rabies in the world. Comp. Immun. Microbiol.
Infect. Dis. 16, 11±20.
Curk, A., Carpenter, T.E., 1994. Efficacy of the first oral vaccination against fox rabies in Slovenia. Rev. sci.
tech. Off. Int. Epiz. 13, 763±775.
Daniel, W.W., 1991. Biostatistics: A Foundation for Analysis in the Health Sciences, 5th ed. Wiley, New York,
pp. 138±139 and 399±407.
Department of the Interior, 1970. In: The National Atlas of the United States of America. Geological Survey,
Washington DC, USA, p. 90.
Depner, K., 1992. Rabies in Namibia. In: Bingham, Bishop, King (Eds.), Proceedings of the second international
conference of the southern and eastern African rabies group. Fondation Merieux, Lyon, France, pp. 39±42.
Fearneyhough, G., Clark, K.A., Smith, D.R., 1997. Texas oral rabies vaccination program. In: Colloque
international sur la rage 13±14 mars 1997. Institut Pasteur, Paris, chapter 5.03.
Ferguson, J.W.H., Nel, J.A.J., De Wet, M.J., 1983. Social organization and movement patterns of black-backed
jackals, Canis mesomelas in South Africa. J. Zool. 199, 487±502.
Foggin, C.M., 1992. Ecology of jackals and the epidemiology of jackal rabies with special reference to
Zimbabwe. In: Wildlife rabies control. Wells Medical Ltd, Turnbridge Wells, UK, pp. 52 and 53.
Hajek, J., 1969. The Spearman test. In: A Course in Non Parametric Statistics. Holde-Day, San Fransisco, USA,
pp. 119±124.
Hubschle, O.J.B., 1988. Rabies in the kudu antelope. Rev. Inf. Dis. 10 S629±S633.
Hubschle, O.J.B., Uanguta, M., 1995. Rabies in Namibia. In: Bingham, Bishop, King (Eds.), Proceedings of the
third international conference of the Southern and Eastern African Rabies Group. Fondation Merieux, Lyon,
France, pp. 47±49.
Istituto Geografica de Agostini, 1976. In: World Atlas of Agriculture. vol. 4 (Africa, Novara, Italy), pp. 591±592.
Lapin, L.L., 1973. Ratio to moving average method. In: Statistics for Modern Business Decisions. 1st ed.
Harcourt Brace, Jovanovich Inc., New York, Chapter 15-4.
Makridakis, S., Andersen, A., Carbone, R., Fildes, R., Hibon, M., Lewandowski, R., Newton, J., Parzen, E.,
Winkler, R., 1982. The accuracy of extrapolation (time series) methods: results of a forecasting competition.
J. Forecast 1, 111±153.
Mckenzie, A.A., 1993. Biology of the black-backed jackal with reference to rabies. Ond. J. Vet. Res. 60, 367±
371.
Meredith, C.D., 1982. Wildlife rabies: past and present in South Africa. S. Afr. J. Sci. 78, 409±415.
MINITAB, 1996 Autocorrelation and cross-correlation. In: Minitab Reference Manual Version 11.1. Chapter 14,
pp. 36±39 and 42.
Nel, J.A.J., 1993. The bat eared fox: a prime candidate for rabies vector? Ond. J. Vet. Res. 60, 367±371.
Schneider, H.P., 1985. Rabies in South Western Africa/Namibia. In: Kuwert, Merieux, Koprowski, Bogel (eds.),
Rabies in the Tropics. Springer, Berlin, Germany, pp. 520±535.
Smith, J.S., Yager, P.A., Orcini, C.A., 1993. Rabies in wild and domestic carnivores of Africa: epidemiological
and historical associations determined by limited sequence analysis. Ond. J. Vet. Res. 60, 307±314.
Stellwagen, E.A., Goodrich, R.L., Dynamic regression diagnostics. In: Forecast Pro for Windows, version 2.0.
Business Forecast Systems, Inc., Belmont MA, USA, pp. 169±173.
Swanpoel, R., Barnard, B.J.H., Meredith, C.D., Bishop, G.K., Bruckner, G.K., Foggin, C.M., Hubschle, O.J.B.,
1993. Rabies in southern Africa. Ond. J.Vet. Res. 60, 325±346.
Von Teichman, B.F., Thomson, G.R., Meredith, C.D., Nel, L.H., 1995. Molecular epidemiology of rabies viruses
in South Africa: evidence of two distinct groups. J. Gen. Vir. 76, 73±82.
28 F. Courtin et al. / Preventive Veterinary Medicine 43 (2000) 13±28