Embed Size (px)
Citation preview

European Foulbrood
igating control measures
the Rural Industries Research t Corporation
y ussell Goodman
ee
May 2004 RIRDC Web Publication No 04/092 RIRDC Project No DAV 157A
– invest
A report for and Developmen bRBen McKPeter Kaczynski

© 2002 Rural Industries Research and Development Corporation. All rights reserved. ISBN 1 74151 001 5 ISSN 1440-6845 European Foulbrood – investigating control measures Publication No. 04/092 Project No. DAV 157A The views expressed and the conclusions reached in this publication are those of the author and not necessarily those of persons consulted. RIRDC shall not be responsible in any way whatsoever to any person who relies in whole or in part on the contents of this report. Disclaimer: The advice provided in this publication is intended as a source of information only. Always read the label before using any of the products mentioned. The State of Victoria and its employees do not guarantee that the publication is without flaw of any kind or is wholly appropriate for your particular purposes and therefore disclaims all liability for any error, loss or other consequence which may arise from you relying on any information in this publication. This publication is copyright. However, RIRDC encourages wide dissemination of its research, providing the Corporation is clearly acknowledged. For any other enquiries concerning reproduction, contact the Publications Manager on phone 02 6272 3186. Researcher Contact Details Russell Goodman Research and Development Division Department of Primary Industries Private Bag 15 Ferntree Gully Delivery Centre Victoria 3156 Phone: (03) 9210 9222 Fax: (03) 9800 3521 Email: [email protected]
In submitting this report, the researcher has agreed to RIRDC publishing this material in its edited form. RIRDC Contact Details Rural Industries Research and Development Corporation Level 1, AMA House 42 Macquarie Street BARTON ACT 2600 PO Box 4776 KINGSTON ACT 2604 Phone: 02 6272 4539 Fax: 02 6272 5877 Email: [email protected]. Website: http://www.rirdc.gov.au Published on the web in May 2004
ii

FOREWORD In 2002, RIRDC produced a five year research and development plan for the Honeybee Program. This plan was formulated in consultation with industry to provide the research direction necessary for the current best practice and preparation for future development in the honey industry. The use of the antibiotic oxytetracycline hydrochloride for the control of the honey bee brood disease, European foulbrood, occurs in all Australian states except Western Australia. The potential for oxytetracycline residues to occur in honey poses a serious threat to the future marketability of domestic and export honey. This publication considers the application of oxytetracycline hydrochloride to honey bee colonies, the degradation of the antibiotic in honey after extraction from hives, plus the efficacy of lower doses to control European foulbrood and reduce the occurrence of residues in honey. Studies on Melissococcus pluton, the causal organism of European foulbrood and the development of a modified hemi-nested polymerase chain reaction (PCR) to detect M. pluton in bees and honey bee products are also presented. This project was funded from honeybee industry revenue which is matched by funds provided by the Australian Government. This report, a new addition to RIRDC’s diverse range of over 1000 research publications, forms part of our Honeybee R&D program, which aims to contribute to the productivity and profitability of the Australian beekeeping industry. Most of our publications are available for viewing, downloading or purchasing online through our website:
• downloads at www.rirdc.gov.au/reports/Index.htm • purchases at www.rirdc.gov.au/eshop
Simon Hearn Managing Director Rural Industries Research and Development Corporation
iii

Acknowledgements The project was financially supported by the Rural Industries Research and Development Corporation (RIRDC), Department of Primary Industries and the National Residue Survey (NRS) of Agriculture Fisheries and Forestry Australia. We thank Dr Heloisa Mariath, NRS; Phil Reeves, Australian Pesticides and Veterinary Medicines Authority (formerly National Registration Authority for Agricultural and Veterinary Chemicals); Keith McIlvride, Chairman, RIRDC Honeybee R & D Committee; Graham Kleinschmidt and Dr Jeff Davis, former and present RIRDC Honeybee Program Research Managers respectively, for their support. We thank the Australian Honey Bee Industry Council and Federal Council of Australian Apiarists’ Associations for helpful advice. Appreciation is extended to Max Cane, apiarist, Ararat, for the provision of apiary sites, honeybee colonies, honey extraction facilities and valuable time, expertise, support and advice he gave the research team throughout the project. We also thank Bob McDonald, apiarist, Castlemaine, who kindly supplied apiary sites, honeybee colonies, and advice for some of the oxytetracycline hydrochloride (OTC) trials. Trevor Richards, Amphitheatre; Dale Richards, Bendigo and Robert Kilpatrick, Joel Joel, provided apiary sites and advice for the management of hives. Apiarists Ian Fanselau, Bendigo; Ken Gell, Maryborough; Ray Hall, Dunolly and Ron Rich, Maryborough loaned hives for Melissococcus pluton and OTC dose response trials. The authors wish to acknowledge the apiarists and honey packing companies who supplied honey for the OTC spiking experiments and hemi-nested polymerase chain reaction (PCR) studies. These included apiarists, Harold Ayton, Tasmania; Ailsa J Collins, Ravenshoe; Margaret Mikits and Richard West, Mareeba and Capilano Honey, Richlands, Queensland. We thank Drs Michael Hornitzky and Steven Djordjevic, Senior Research Scientists, Elizabeth Macarthur Agricultural Institute (EMAI), NSW Agriculture, and Dr Peter Taylor, The University of Melbourne, Parkville, Victoria, for helpful advice throughout the project and for their role as co-supervisors of Ben McKee, PhD candidate and co-author of this report. We thank Bruce Abaloz and David Paul, Department of Zoology, The University of Melbourne for assistance with histology sections of honey bee larvae. We thank Fiona Cooper, Brendan Rodoni, and Kerry Paice, Research and Development Division, Department of Primary Industries, Knoxfield, for counts of Nosema apis spores in samples of adult honey bees and assistance with PCR and culture assays for detection of Melissococcus pluton respectively. Dr Michael Hornitzky, EMAI, arranged for culture of honey samples for presence of M. pluton. Analyses of honey to determine OTC concentrations were conducted by Hugh Mawhinney, Stephen Were and Warwick Turner, Chemical Residues Laboratory, Animal and Plant Health Service, Queensland Department of Primary Industries; Christian Saywell and Heather Lindsay, State Chemistry Laboratory, Department of Primary Industries. We appreciate the efforts of Christian Saywell in the development of assays to determine OTC concentrations in honey bee larvae and development of methodologies and technical assistance with the spiking of honey for OTC degradation trials. Paul Lawicki and Phil Zeglinski, State Chemistry Laboratory, analysed adult bees and larvae for crude protein and honey for hydroxymethylfurfural content respectively. We thank Drs Stephen Tate, Senior Veterinary Officer; Jenny Turton, Veterinary Officer and John Galvin, Manager, Animal Health Operations, Department of Primary Industries, for prescribing OTC products. We thank Drs Graham Hepworth and Nam-ky Nguyen, former and present biometricians respectively, of the Research and Development Division, Department of Primary Industries, Knoxfield. We also
iv

thank Drs Jane Moran, Jo Luck and Stephen Doughty, Knoxfield for helpful comments and suggestions on this manuscript. The large proportion of the work described in this report was conducted by Ben McKee, co-author and PhD candidate, Institute of Land and Food Resources, The University of Melbourne.
v

CONTENTS
FOREWORD .......................................................................................................................................... iii Acknowledgements.............................................................................................................................. iv Abbreviations...................................................................................................................................... viii Executive Summary ............................................................................................................................. ix 1. Introduction and objectives....................................................................................................... 1
1.1 Introduction ............................................................................................................................... 1 1.2 Objectives ................................................................................................................................. 2
2. Oxytetracycline hydrochloride in honey.................................................................................. 3 2.1 Introduction ............................................................................................................................... 3 2.2 Objectives ................................................................................................................................. 4 2.3 Experiment 1 - OTC residues in honey extracted from hives treated in December 1998 ........ 4 2.4 Experiment 2 - OTC residue trial late winter 2001.................................................................... 9 2.5 Experiment 3 - OTC residue trial late spring 2001.................................................................. 10 2.6 Experiment 4 - Degradation of oxytetracycline hydrochloride in honey extracted from hives
treated with OTC.................................................................................................................... 12 2.7 Experiment 5 - Degradation of oxytetracycline hydrochloride in selected spiked floral honeys
............................................................................................................................................... 17 2.8 CONCLUSIONS FOR ALL EXPERIMENTS........................................................................... 20 2.9 RECOMMENDATIONS........................................................................................................... 20 2.10 APPENDICES......................................................................................................................... 21
3. Oxytetracycline hydrochloride in larvae of treated honey bee colonies............................ 25 3.1 Introduction ............................................................................................................................. 25 3.2 OBJECTIVE ............................................................................................................................ 25 3.3 Analysis of honey bee larvae for OTC .................................................................................... 26 3.4 Experiment 1 – Confirmation of methodologies...................................................................... 27 3.5 Experiment 2 – Concentration of OTC in whole honey bee larvae and larval guts ................ 28 3.6 Experiment 3 – Concentration of OTC in honey bee larvae following application of the
antibiotic in summer............................................................................................................... 30 3.7 Experiment 4 – Concentration of OTC in honey bee larvae following application of the
antibiotic in spring.................................................................................................................. 31 3.8 Experiment 5 – Concentration of OTC in honey bee larvae following application of the
antibiotic in water ................................................................................................................... 34 3.9 DISCUSSION.......................................................................................................................... 35 3.10 Conclusion .............................................................................................................................. 37 3.11 Recommendation.................................................................................................................... 37
4. Efficacy of low doses of OTC applied to honey bee colonies to control European Foulbrood disease.................................................................................................................... 38
4.1 Introduction ............................................................................................................................. 38 4.2 Objective ................................................................................................................................. 38 4.3 Experiment 1 ........................................................................................................................... 38 4.4 Experiment 2 ........................................................................................................................... 41 4.5 Discussion............................................................................................................................... 42 4.6 Recommendations .................................................................................................................. 42
5. Incidence of European Foulbrood in commercially managed honey bee colonies fed a dietary supplement................................................................................................................... 44
5.1 Introduction ............................................................................................................................. 44 5.2 Objective ................................................................................................................................. 45 5.3 Methodology............................................................................................................................ 45 5.4 Results .................................................................................................................................... 49 5.5 Discussion............................................................................................................................... 57 5.6 Conclusions............................................................................................................................. 58 5.7. Recommendations .................................................................................................................. 59
vi

6. The influence of pH in the honey bee larval midgut on Melissococcus pluton ................. 60 6.1 Introduction ............................................................................................................................. 60 6.2 Objectives ............................................................................................................................... 61 6.3 Methodology............................................................................................................................ 61 6.4 RESULTS................................................................................................................................ 61 6.5 DISCUSSION.......................................................................................................................... 62 6.6 Recommendation.................................................................................................................... 63
7. An improved hemi-nested PCR assay for detection of Melissococcus pluton in honey bees and their products........................................................................................................... 64
7.1 Introduction ............................................................................................................................. 64 7.2 Objectives ............................................................................................................................... 65 7.3. Methodolog y........................................................................................................................... 65 7.4 Results .................................................................................................................................... 69 7.5 Discussion............................................................................................................................... 75 7.6 Conclusions............................................................................................................................. 75
8. Laboratory rearing of honey bee larvae for European foulbrood studies.......................... 77 8.1 Introduction ............................................................................................................................. 77 8.2 Objectives ............................................................................................................................... 78 8.3 Methodology............................................................................................................................ 78 8.4 Results .................................................................................................................................... 81 8.5 Discussion............................................................................................................................... 88 8.6 Conclusion .............................................................................................................................. 89 8.7 Recommendation.................................................................................................................... 90
9. A study of apiarists’ use of oxytetracycline hydrochloride and management of European foulbrood ................................................................................................................................... 91
9.1 Introduction ............................................................................................................................. 91 9.2 Methodology............................................................................................................................ 91 9.3 Results .................................................................................................................................... 91 9.4 Discussion............................................................................................................................. 105 9.5 Recommendations ................................................................................................................ 107
10. REFERENCES ......................................................................................................................... 108
vii

Abbreviations
APVMA -.Australian Pesticides and Veterinary Medicines Authority EFB - European foulbrood disease HBRDC - Honeybee Research and Development Committee HPLC - high performance liquid chromatography <LOR - less than the level of reporting for oxytetracycline using HPLC mg/kg - parts per million (ppm) (1,000 mg = 1 gram) MIT - microbial inhibition test mL - millilitre (1,000 mL = 1 litre) OTC - oxytetracycline hydrochloride PCR - polymerase chain reaction P1-W - OTC from product No. 1 applied in sugar syrup (wet treatment) P1-D - OTC from product No. 1 applied in caster sugar (dry treatment) P2-W - OTC from product No. 2 applied in sugar syrup (wet treatment) P2-D - OTC from product No. 2 applied in caster sugar (dry treatment) P3-W - OTC from product No. 3 applied in sugar syrup (wet treatment) P3-D - OTC from product No. 3 applied in caster sugar (dry treatment) RIRDC - Rural Industries Research and Development Corporation µg - microgram (1,000,000µg = 1 gram)
viii

Executive Summary Introduction The endemic, bacterial honey bee brood disease, European Foulbrood (EFB) (Melissococcus pluton) can seriously affect honey bee colonies and reduce honey production. The disease may be controlled by the antibiotic, oxytetracycline hydrochloride (OTC). This report describes field and laboratory studies that investigated OTC residues in honey, efficacy of reduced doses of OTC to inhibit development of M. pluton and, control of EFB through altered honey bee nutrition and pH of honey bee larval guts. An improved hemi-nested polymerase chain reaction (PCR) for detection of M. pluton is also described. Antibiotic residues in honey extracted from hives treated with oxytetracycline hydrochloride Field trials were conducted to investigate the extent of OTC residues in honey extracted from hives treated with the antibiotic. Thirty-six hives with no history of OTC treatment during the previous thirteen months were randomly allocated to treatment and control groups. OTC was applied to each treatment group using one of three OTC products in either sugar syrup or caster sugar. Prior to treatment, honey from individual hives was sampled and tested by microbial inhibition test (MIT) for OTC residues. Antibiotic activity was identified in honey from 67% of individual hives. However, OTC was not detected when pre-treatment honey samples from all hives of each treatment group were combined and then tested by HPLC. This was considered to be a result of dilution of the antibiotic caused by the combination of the samples. OTC treatments were applied on 16 December 1998 and the hives moved to a tea-tree (Leptospermum obovatum) and messmate (Eucalyptus obliqua) nectar flow at Moyston, Victoria, on 9 January 1999. Extraction of honey occurred on three occasions when the combs in the super above the queen excluder had filled with honey. For the first two extractions, honey from the supers of all the hives of a treatment group was blended, sampled and tested for OTC. For the third extraction, honey from all treated hives was blended and tested. Residues were detected in honey in all treatment groups at the first extraction but not at the second and third extractions. Residues were higher in honey derived from sugar syrup treatments (mean 0.34 mg/kg OTC; range 0.28-0.41) than that of the caster sugar treatments (mean 0.065 mg/kg OTC; range 0.05-0.093). OTC degradation studies First extraction honey from each treatment group was stored in pails in a shed at ambient temperature to mimic customary industry storage practices. OTC residues were present in honey of all treatment groups sampled exactly twelve months from the date of application of the OTC (mean of 0.19 mg/kg OTC - sugar syrup treatments and mean of 0.03 mg/kg OTC - caster sugar treatments). There was greater degradation of OTC in the same six lines of honey stored at 22ºC than those stored at ambient temperature. At the twelve month sampling point for honey stored at 22ºC, OTC was below the level of detection in two of the three caster sugar treatments but present in all sugar syrup treatments (mean of 0.12 mg/kg). In a separate laboratory trial, six floral type honeys spiked with OTC were placed in constant temperatures of 22ºC and 35ºC. HPLC analysis of these honeys, sampled 70 days post-spiking, confirmed a greater rate of degradation of OTC at the higher temperature. In another trial, residues were detected by MIT in OTC contaminated honey stored at 25ºC for almost 18 months. OTC was not detected at the post-treatment sampling points of approximately 13, 8.5 and 3.5 months for the same line of honey stored at 30ºC, 35ºC and 40ºC respectively. Apart from the 25ºC honey, the concentration of hydroxymethylfurfural at these sampling points exceeded the maximum level of 40 mg/kg permitted by the Codex Alimentarius Commission. This confirmed that long term heating of honey to accelerate degradation of OTC would render the product unacceptable to markets.
ix

OTC in larvae of colonies treated with the antibiotic A successful HPLC assay was developed for determining the concentration of OTC in larvae sampled from honey bee colonies treated with the antibiotic. The assay proved advantageous over conventional MIT screens but only when the antibiotic was at relatively high levels. Experiments were conducted in autumn and spring 2000 to determine the concentration of OTC in larvae sampled from honey bee colonies treated with various doses of the antibiotic in caster sugar. On each of six days immediately after treatment of colonies, mean concentrations of OTC in larvae were significantly greater (P < 0.05) for the 1.0g OTC double-storey hive treatments than for the 0.5g OTC double-storey hive treatments, usually by a factor of 2 to 3. In another experiment conducted in late spring 2000 0.3g and 0.5g OTC treatments dissolved in 200 mL of distilled water were applied to double-storey hives. Although the mean level of OTC in larvae was generally higher for the 0.5g treatment, the difference was not significant (at P < 0.05) on any day after treatment of the colonies. The estimated levels of OTC immediately after treatment (day=0) were 55.7 and 38.5 mg/kg respectively, which were not significant (approximate l.s.r. = 10.1). The 0.3g and 0.5g OTC treatments also gave higher estimated levels of OTC at the time of treatment (day=0) and equal or higher OTC levels on the first two days post-treatment when compared with the same doses applied in caster sugar to two-storey colonies. However, by day 3 the concentration of OTC in larvae treated with OTC in water was considerably lower than that in larvae fed with medicated caster sugar. The results indicated that 0.3g, 0.5g and 1.0g doses of OTC in cater sugar or water, delivered sufficient antibiotic to exceed the 1-2 µg/mL minimum inhibitory concentration of OTC to Melissococcus pluton by a minimum of 4 times on the day immediately after treatment. However, because the results of the three above experiments were based on the assay of whole honey bee larvae, it is suggested that further work be conducted to confirm their validity relating to the concentration of OTC in the honey bee larval guts. Efficacy of low doses of OTC for control of European Foulbrood Field trials were also conducted to determine if doses of OTC lower than those stipulated on OTC product labels, could reduce the incidence of clinical symptoms of EFB in honey bee colonies. Single-storey colonies infected with EFB, many with advanced disease, were treated with either a standard 0.5g dose or a reduced dose of 0.3g or 0.4g. All treatments had statistically significantly less diseased and dead larvae than the controls at the 12 and 22 day post-treatment observations, but not at the 41 day post treatment observation. Neither dose enabled all colonies to totally clean up the disease. Adult bees consumed very little, if any, of OTC antibiotic extender patties, possibly due to the inclusion of hydrogenated cotton oil rather than the Crisco® vegetable oil normally used as an ingredient of USA patties. It was concluded that until the efficacy of low doses of OTC for control of EFB are further investigated using laboratory reared honey bee larvae and subsequent field trials, the current 0.5g and 1.0g doses administered to single-storey and double-storey colonies respectively were appropriate for control of EFB in Australia. Effect of nutrition and environmental factors on incidence of the brood disease European Foulbrood in commercially managed honey bee colonies In a major field trial conducted during 2000 and 2001, commercially managed honey bee colonies were fed either 1.0g OTC; protein dietary supplement, or, left as untreated controls to determine the effect on the incidence of EFB. The application of OTC resulted in total protection against EFB for all 27 treated colonies in 2000 and for 12 of 13 treated colonies in 2001. Over all the observations during 2001, the mean incidence of EFB in colonies fed protein supplement was 9% lower than the controls, but this was not statistically significant. However, significant differences (P<0.05) in the incidence of EFB occurred between colonies treated with OTC and colonies fed protein. Significant differences (P<0.05) also occurred between control and OTC treated colonies on 10 October and 28 October
x

2001. The percentage of colonies infected with EFB at any one observation was as high as 24% in protein supplemented colonies and 43% in control colonies. The mean number of combs of adult bees and brood in colonies of the three treatment groups did not differ significantly at any of the eleven observation dates over the two years of the trial. This suggests that regardless of antibiotic treatment or supplementary feeding of colonies, other factors such as nectar and pollen resources may have influenced the number of combs of brood and adult bees. There was a significant relationship (P<0.05) between the mean number of days with rain per month and the increased incidence of EFB in colonies given protein supplement (r=0.583) and control colonies (r=0.590). No relationship was found between temperature and the incidence of EFB in supplemented colonies and control colonies (r=-0.121, P=0.632) even though maximum temperatures were on average lower in spring 2001 than those of 2000. The experiment illustrated the devastating impact EFB can have on colony size and honey production. The mean number of combs of adult bees in infected colonies at the completion of spring 2001 was 7.9. This was 5.6 combs (41.5%) lower than the trial average of 13.5 combs. The average honey production of diseased colonies was 2.63 kg, which was 8.67 kg (77%) lower than the trial average of 11.3 kg per colony. However, these differences, were not significant (P>0.05) due to the small data set associated with each treatment. There was no significant difference (P>0.05) in spring honey production between the three treatment groups. There was no significant difference in the incidence of Nosema apis spores in adult bees sampled from colonies fed protein supplement and adult bees sampled from the other two treatments. The mean crude protein levels of adult bees collected from colonies of the 3 treatments at the completion of the trial in 2001 were 16.34, 16.22 and 15.86 g/100g, respectively and were not significantly different (P=0.815). In another separate small trial conducted in autumn 2002, there were no significant differences in the crude protein levels of adult bees and larvae sampled from untreated control colonies and colonies fed protein supplement. Honey bee larval midgut pH Honey bee larvae, approximately 4-5 days old, were sampled from randomly selected colonies at five commercially managed apiaries in central and western Victoria. The grand mean of pH of gut contents of all larvae sampled from all five apiaries was 6.329. In addition, the mean pH varied significantly (P<0.05) between apiary locations (range 6.258 to 6.506). This variation may be a result of honey bee foragers having access to different pollen and nectar resources at these apiaries. Interestingly, two apiaries had the same plant species and even though they were approximately 100 km apart, the mean pH of larval guts was similar at 6.277 and 6.258 respectively. In laboratory studies, M. pluton grew well on culture medium of pH 6.6. Adjustment of the same medium to pH 4.0 and pH 8.0 resulted in no growth of M. pluton indicating the sensitivity of the organism to pH. The studies also indicated that honey bee larvae have a capacity to buffer their diet and consequently may not be adversely affected by changes in pH of larval food, as previously suggested by other researchers. Development of an improved hemi-nested PCR assay for detection of M. pluton in honey bees and their products An improved hemi-nested PCR assay capable of detecting M. pluton in honey bees and their products was developed and found to be more sensitive than the standard culture assay. The improved PCR detected M. pluton in 55 (70%) of 80 samples of extracted honey while culture assay detected the organism in only 22 (30%) of the same samples. In epidemiological studies, the PCR confirmed that honey bee larvae, individual body components of adult bees, pollen, brood comb cells that contained a freshly laid egg, and broodnest honey sampled from infected honey bee colonies were contaminated with M. pluton. The bacterium was detected in larvae, adult bee digestive tracts and rectums, plus broodnest honey sampled from healthy colonies,
xi

confirming the existence of sub-clinical populations of the bacterium. However, M. pluton was not detected on adult bee mouthparts and legs, pollen or brood comb cells containing eggs sampled from healthy colonies. The Australian States with the highest percentage of samples of apiarist extracted honey infected with M. pluton were South Australia (100%), Victoria (89%) and New South Wales (67%). The improved hemi-nested PCR was considered to be extremely useful for conduct of further epidemiological studies of EFB and efficacy of potential new EFB control measures. Laboratory rearing of honey bee larvae Honey bee larvae were successfully reared in the laboratory from an age of less than 24 hours to the stage of defecation and commencement of pupation. Successful inoculation of laboratory reared larvae with suspensions of M. pluton derived from naturally diseased larvae proved to be very effective in causing disease. These procedures will enable fast, relatively inexpensive studies to be conducted on the effect of nutrition and other potential treatments for control of honey bee larval diseases under fully controlled laboratory conditions. Such studies will largely replace costly field and cage trials that are invariably affected by uncontrollable factors such as variable pollen and nectar resources, weather conditions and other honey bee diseases. The studies showed that larvae inoculated with M. pluton, contained substantial bacterial populations within the gut contents (food) and peritrophic membrane. They exhibited clinical symptoms of EFB identical to those of naturally infected larvae. Defecation and subsequent pupation in laboratory reared larvae occurred 24 to 48 hours later in those infected with M. pluton than in control larvae. There was a clear relationship between the number of M. pluton organisms present in the food fed to larvae and the mortality of larvae. Mean lethal doses of M. pluton were extrapolated with an LD50 = 1.08x10⁵ and LD100= 2.31x10⁵ organisms/mL. Survey of apiarists A survey of Victorian apiarists indicated that 62% of respondents treated colonies with OTC only when EFB symptoms were present in the brood while the remaining respondents treated colonies prophylatically before symptoms were evident. Forty-nine percent of respondents chose to spot treat only colonies infected with EFB rather than blanket treat all colonies in an infected apiary. There was a strong indication that ‘good conditions’ (as provided by good nectar and pollen flows) were very important as a means of minimising or preventing the incidence of EFB. However, most respondents indicated that the feeding of protein supplements to improve nutrition did not appear to prevent the occurrence of EFB. Keeping colonies on sunny, warm, sheltered over-wintering and spring apiary sites was also important. Most respondents practiced regular replacement of aging broodnest combs in an attempt to lower the population of M. pluton in the hive. Regular queen replacement was viewed as an important management tool and some automatically requeened EFB infected colonies.
xii

1. Introduction and objectives 1.1 Introduction Honey bee (Apis mellifera) larvae (brood) are subject to the following diseases:
• European foulbrood (Melissococcus pluton) • American foulbrood (Paenibacillus larvae subspecies larvae) • Chalkbrood (Ascosphaera apis) • Sacbrood (Sacbrood virus).
European foulbrood (EFB) is a serious economic bacterial disease of honey bee brood and is widely distributed throughout many of the world’s beekeeping countries. In Australia, the disease was first confirmed in honey bee colonies in South Australia and Victoria in 1977 and has since spread to all Australian States except Western Australia. When honey bee larvae die as a result of EFB infection there is a reduction of adult bees in the colony and a subsequent loss of honey production depending on the degree of infection. In severe cases where many larvae die, the colony may decline and eventually die. However, many colonies although seriously weakened by the disease can slowly recover when good nectar and pollen flows occur (Shiminuki et al. 1969). In such conditions, a colony with only a light infection (a small number of diseased larvae) will not be noticeably affected. EFB primarily occurs in spring and its incidence and the intensity of infections across apiaries varies from year to year (Wootton et al. 1981). In Australia, the incidence of EFB appears greatest in districts that have inclement, changeable spring weather that interrupts honey bee foraging and the collection of nectar and pollen (Hornitzky et al. 1996). In Victoria, where such weather is typical, the incidence of EFB appears greatest in the southern, cooler parts of the State. M. pluton may be present in honey bee colonies even though symptoms are not evident in the brood. The bacterium is able to remain dormant on combs for several years (Bailey and Ball, 1991) and may also be found in honey bee larvae that show no obvious signs of disease. Infection in larvae occurs after they have swallowed M. pluton contaminated food. The death of individual larvae is ultimately dependant on the numbers of M. pluton in the larval gut, the site where the organism multiplies, and the amount of glandular food supplied by nurse bees. Larvae that are well fed may survive infection although they may enter pupation a little below normal weight. The disease is usually readily diagnosed in honey bee brood by several characteristic symptoms. Infected larvae may occupy unusual positions in their cells. They mostly die when they are aged 4-5 days. The diseased larvae change from their normal pearly white colour and turn off-white, light brown and then brown. They become soft in texture and begin to decompose, eventually drying to a firm scale. Laboratory diagnosis using a compound light microscopic (1000x using an oil immersion lens) is relatively simple. The gut is removed from the infected larva, smeared on a microscope slide and after heat fixing is stained with Carbol fuchsin. Individual M. pluton are lanceolate and may be seen arranged in clusters, chains or occurring singly. Apiarists use a number of apiary management techniques to lessen the impact of EFB in their colonies. These may include:
• regular requeening of colonies to ensure a queen capable of prolific egg laying • keeping colonies warm and compact • placing colonies on apiary sites with good nectar and pollen yielding flora • feeding of dietary supplement to colonies to ensure optimum honey bee nutrition.
1

The antibiotic oxytetracycline hydrochloride (OTC) is registered by the Australian Pesticides and Veterinary Medicines Authority (APVMA) (formerly National Registration Authority for Agricultural and Veterinary Chemicals) as a control measure for EFB. Apiarists who use this treatment, apply it to colonies when symptoms of EFB are present in the brood, or as a prophylactic before symptoms are evident.
Goodman and Azuolas (1994) alluded to potential repercussions in the Australian honey industry including the possible loss of export and domestic honey markets if OTC residues were detected in extracted honey. The project described in this report was developed in 1998 following detection by the Australian National Residue Survey of OTC residues in commercially produced honey. Several experiments were conducted to provide comprehensive information on the occurrence of OTC residues in honey. In 1999, the project was modified and enlarged to include a range of studies on EFB and M. pluton in addition to further investigations on the usage of OTC. A large proportion of the work described in this report was conducted by Ben Mckee, PhD candidate, Institute of Land and Food Resources, The University of Melbourne. Each of the following chapters addresses a specific issue concerning EFB and/or application of OTC to honey bee colonies. An introduction to each chapter provides more detailed objectives and comprehensive background information on the issue being investigated.
1.2 Objectives The modified project had the following objectives:
* To protect the apiary industry’s continued access to domestic and export honey markets by reducing or eliminating industry’s dependence on oxytetracycline hydrochloride (OTC) for the control of the bacterial honey bee brood disease, European Foulbrood (EFB) (Melissococcus pluton)
* To determine the efficacy of reduced doses of OTC and use of OTC extender patties for the control of EFB and to determine if these measures reduce or eliminate the occurrence of OTC residues in honey
* To identify and develop alternative, non-antibiotic measures for control of EFB by investigating, primarily, the effect of enhanced honeybee colony nutrition and changed pH of honey bee larval guts
* To obtain a greater understanding of active and latent infections of M. pluton and Paenibacillus alvei (a common secondary invader) in honeybee larvae and to develop new Polymerase Chain Reaction (PCR) methodologies for detection of M. pluton as a necessary prerequisite and support of the preceding aim.
2

2. Oxytetracycline hydrochloride in honey 2.1 Introduction Oxytetracycline hydrochloride (OTC) is the only antibiotic registered in Australia for control of the honey bee brood disease, European Foulbrood (EFB) which is caused by the bacterium Melissococcus pluton. In countries where EFB occurs, OTC may be administered to honey bee colonies mixed in caster sugar, sugar syrup or antibiotic extender patties (Gilliam & Argauer 1981a & b). All treatments are applied only to the broodnest of the hive and not to the honey supers (boxes). The caster sugar and sugar syrup treatments are sprinkled or poured onto the adult bees and top bars of the frames that hold the brood combs within the broodnest. Patties are placed on the top bars of the broodnest frames. The use of patties in Australia has never been approved. Recent overseas research indicates development of resistance to OTC by the bacterium Paenibacillus larvae, the causal organism of the notifiable and economic honey bee brood disease American Foulbrood. This is a result of OTC in antibiotic extender patties being available to honey bee colonies in low concentrations over an extended period of time. A number of researchers have investigated the occurrence of OTC residues in honey. Wilson (1974) found residues in honey stored in broodnest combs but not in honey stored in supers above the broodnest. Studies by Lehnert and Shimanuki (1981) and Gilliam and Argauer (1982) indicated that OTC in honey would fully degrade within 4 weeks. The quantitative estimations of OTC in these experiments, using microbiological assays and a fluorometric method, were surpassed by the development of more sensitive high performance liquid chromatography (HPLC) by Sporns et al in 1986. Using HPLC, Matsuka and Nakamura (1990) concluded that it took 6 to 8 weeks for OTC to fully degrade in a hive at 35oC and at least 10 weeks in honey samples stored at 25oC. Gilliam et al (1979) demonstrated a rapid degradation of OTC in honey during the first 8 weeks and a much slower degradation beyond 8 weeks from the date of application of the antibiotic to the hive. Currently the literature lacks data on the persistence of OTC residues beyond approximately 8-10 weeks. The concentration of OTC residues in honey depend principally on the type of treatment used (Matsuka & Nakamura 1990; Goodman and Azoulas 1994). For example, residues in broodnest honey are greater when OTC is applied in sugar syrup than when it is applied in caster sugar (Gilliam & Argauer 1981a & b). Similarly, Goodman and Azoulas (1994) extracted honey from the supers of hives treated with OTC and using HPLC analysis found that caster sugar treatment resulted in significantly lower residues than the sugar syrup treatment. The rate of degradation of OTC is influenced by a number of factors such as temperature and moisture. In graphs of OTC concentration against time in water at 100oC, 80oC and 62oC, Rose et al (1996) showed that the approximate half-life for OTC was 2, 15 and 120 minutes respectively. The breakdown of OTC is a hydrolysis reaction and the antibiotic is less stable in an aqueous medium. It may be possible that OTC degrades at a faster rate in honeys with high moisture content than those with a low moisture content. The degradation of OTC in honey is also influenced by the low (acidic) pH, viscosity, hypertonicity and buffering power of the organic acids, all of which increase the persistence of the residue (Chambonnaud 1968, Gilliam et al. 1979). The concentration of OTC in honey obtained from any one part of the hive will vary according to the floral type, degree of crystallisation and the amount of antibiotic in the localised area (Gilliam et al. 1979; Rousseau and Tabarly 1962). Goodman and Azuolas (1994) alluded to potential repercussions in the Australian honey industry including the possible loss of export and domestic honey markets if OTC residues were detected extracted honey. This project was developed in 1998 following detection by the Australian National
3

Residue Survey of OTC residues in commercially produced honey. The following experiments were designed to determine how such residues occurred and to identify possible means of avoiding their occurrence in the future so that the clean, and ‘green’ image of Australian honey could be maintained. Introductory note: All OTC treatments mentioned in the following experiments were prescribed by registered veterinary surgeons and some were applied to hives as an “off-label” use. Off-label use of an OTC product in these experiments does not imply endorsement by the authors, Department of Primary Industries or the Rural Industries Research and Development Corporation. Oxytetracycline hydrochloride is an S4 drug and must be prescribed and used in accordance with the relevant regulations of the particular State or Territory.
2.2 Objectives 2.2.1 To identify causes for the occurrence of OTC residues in honey by conduct of field trials
which mimic and reflect current apiarist OTC application practices. 2.2.2 To obtain and present data relating to the occurrence and degradation of OTC residues in
honey to enable consideration for: adjustment of current OTC use patterns to prevent the occurrence of residues in honey that threaten industry’s continued access to Australian domestic and export honey markets
•
• establishment of a Maximum Residue Limit (MRL) by the Australian Pesticides and Veterinary Medicines Authority for OTC in honey.
2.3 Experiment 1 - OTC residues in honey extracted from hives treated in December 1998
2.3.1 Aim To determine the level of residues in honey extracted from hives treated with OTC according to doses stipulated on labels of OTC products and apiary industry practice.
2.3.2 Methodology 2.3.2.1 Preparation of colonies Forty-six hives with no history of OTC treatment since November 1997 were selected, and the colonies standardised in terms of adult bee populations and brood. A hive mat was placed immediately above the first super (box) of those hives that had more than two supers. This enabled us to simulate a two-storey hive environment and was done at the apiarist’s request to enable sufficient honey stores to be kept on each hive to allow for contingencies resulting from the failure of anticipated honey flows. Forty-two hives were then numbered and allocated to one of the seven treatment groups detailed in 1.3.2.3 and arranged in a row-column design. The hives were positioned into 3 rows containing 14 hives each, with the six hives on each end containing one hive of each treatment. This was done to account for any drift that may have resulted in large bee numbers in hives at the end of the rows. Four hives were kept as spares. The hives were positioned at Ararat on a Yellow box (Eucalyptus melliodora) nectar flow that provided enough honey for the colonies to only maintain themselves. These conditions mimicked those commonly found at the time of the year when apiarists would normally treat hives with OTC. 2.3.2.2 Pre-treatment sampling of honey for OTC residues Pre-treatment samples were taken to determine if OTC was present in the hives prior to treatment. Samples were taken by scraping honey from two outer combs of the brood nest and four combs of the super. Samples from each hive were bioassayed for anti-microbial activity. Six of these samples which showed anti-microbial activity were then analysed by HPLC to confirm that OTC was present. Later composite samples comprising honey from the six hives of each treatment group were analysed by HPLC. For these six samples only, preparation of sample clean-up involved addition steps to those
4

routinely employed in HPLC assays. This was done to provide greater sensitivity and improved level of quantification. 2.3.2.3 Treatment of colonies with OTC Colonies were treated with OTC on 16 December, 1998 according to the following points: (i) OTC treatments were applied in either sugar syrup or caster sugar as follows:
1. OTC from product No. 1 - wet treatment (P1-W) 1 g equivalent active OTC in 500 ml of sugar syrup (1:1 sugar:water by volume)
2. OTC from product No. 1 - dry treatment (P1-D) 1 g equivalent active OTC in caster sugar to make a total mixture of 100 g
3. OTC from product No. 2 - wet treatment (P2-W) 1 g equivalent active OTC in 500 ml of sugar syrup (1:1 sugar:water by volume)
4. OTC from product No. 2 dry treatment (P2-D) 1 g equivalent active OTC in caster sugar to make a total mixture of 100 g
5. OTC from product No. 3 - wet treatment (P3-W) 1 g equivalent active OTC in 500 ml of sugar syrup (1:1 sugar:water by volume)
6. OTC from product No. 3 - dry treatment (P3-D) 1 g equivalent active OTC in caster sugar to make a total mixture of 100 g
(ii) doses were weighed according to directions on the product in label
(iii) all treatments were applied to the brood nest after the queen excluder and supers were temporarily removed
(iv) all wet treatments were dissolved in syrup in the apiary immediately prior to application
(v) hives treated with medicated sugar syrup were tilted from front to back to prevent any loss of the solution out of the hive entrance
(vi) all dry preparations were shaken vigorously immediately before application to ensure the even dispersion of the antibiotic throughout the mixture
(vii) all products were weighed by electronic balance to three decimal places
(viii) OTC products were purchased just prior to treatment.
Six hives were selected as controls and were not treated with OTC. Honey from these hives was only used to determine if any cross-contamination occurred between extraction of honey from the various treatment groups. 2.3.2.4 Active constituent in OTC products The OTC products used to treat the colonies were analysed using HPLC to confirm their percentage OTC active constituent content. 2.3.2.5 Modification of extracting plant prior to honey extraction To prevent any possibility of cross-contamination between treatments the extraction plant was modified to allow honey to be bucketed from the extractor outlet rather than have it run through honey pumps and lines. A hand held uncapping knife was used to uncap combs because it was more easily cleaned than the blades of an automatic uncapping machine. 2.3.2.6 Placement of hives on a honey flow On 9 January 1999 colonies were placed on a site at Moyston at the base of the Grampians in western Victoria where River tea-tree (Leptospermum obovatum) and Messmate (Eucalyptus obliqua) were flowering.
5

2.3.2.7 Procedures associated with the first extraction of honey Under-supering of hives Under-supering of all hives occurred on 19 January 1999. The super full of honey above the queen excluder was lifted and a super containing 4 frames of beeswax foundation sheet and 4 frames of drawn dry comb in the centre, was placed beneath it (for storage of honey for the second extraction). The dry combs were sourced from hives with a history of no OTC treatment after November 1997. Removal of supers and first extraction The full super that was lifted up at under-supering was removed from the hives for extraction on 27 January 1999. Boxes from each treatment were placed together after removal from the hive to ensure no cross-contamination was possible before extraction. On 28 January 1999, the six supers belonging to each treatment group were extracted in one batch. Procedures followed Australian Pesticides and Veterinary Medicines Authority Residue Guideline No. 28. The extracted honey was bucketed from the extractor overflow pipe to a small holding tank, vigorously stirred and a sample was taken for OTC analysis by HPLC. The extractor, uncapping knife, honey tank, bucket and pipe beneath the extractor were thoroughly cleaned using a high-pressure water cleaner. They were then washed with hot water, wiped and dried using an absorbent cloth and hot air. This was done before and after extracting the honey of each treatment group. Following the extraction of honey of each treatment group, and the cleaning of the extracting materials, the honey from eight frames of an untreated control hive was extracted. This honey was then drained from the extractor into a bucket and a sample was taken. The honey in the pail was then poured over the internal sides of the previously washed holding tank and another sample was taken. These samples were taken to determine if OTC remained on the surface of the equipment to contaminate the next batch of honey. The honey was drained from the holding tank into a labelled pail. The extracting materials were then cleaned again as described above in preparation for the next treatment group. 2.3.2.8 Procedures associated with the second extraction of honey The supers and combs emptied in the first extraction were firstly placed on other hives not involved in the trial to allow the bees to clean up the sticky combs. The supers of cleaned dry combs were then used to under-super the same hive from which they originated (for storage of honey for the third extraction). Under-supering was done on 1 February 1999. The second supers were removed on 10 February 1999 and were extracted on the 15 February 1999 using the identical extraction and sampling procedures as detailed in 2.3.2.7. 2.3.2.9 Procedures associated with the third extraction of honey In view of the fact that OTC residues were not detected in the second extraction honey, the research team decided not to proceed with extraction of honey from the third super. However, the cooperating apiarist extracted the honey and collected a composite sample. The extraction equipment was thoroughly cleaned as previously described. On 24 April 1999 all supers of combs were extracted as one batch to form a blend of all OTC treatment groups. During extraction four sub-samples were taken at intervals to form a composite sample. 2.3.2.10 Post-treatment sampling of broodnest honey for OTC residues On 7 May 1999, we obtained samples of broodnest honey to determine if active OTC remained in the hive. Honey was scraped from capped cells of the four inner broodnest combs of each hive and combined to form a composite sample for each of the wet and dry P1-Dry treatments.
6

2.3.2.11 Storage and transport of honey samples Samples were sent on the day of sampling or frozen at -20°C and sent in batches by overnight courier to the Animal Research Institute, Department of Primary Industries, Yeerongipilly, Queensland, for analysis.
2.3.3 Results 2.3.3.1 Active constituent in OTC products The percentage active constituent as stated on the label of each of the three OTC products and the active constituent determined by HPLC are shown in Table 1. Table 1. Active constituent of OTC products according to product label and HPLC analysis Treatment product Active constituent OTC on
product label (%) Active constituent according
to HPLC (%)
OTC product No. 1 (P1) 9.25 9.0 OTC product No. 2 (P2) 1.0 1.2 OTC product No. 3 (P3) 92.6 100
2.3.3.2 Pre-treatment and first, second and third extraction honey samples Results of the analyses of pre-treatment, first and second extraction samples are presented in Table 2. Microbial inhibition bioassays of the pre-treatment samples indicated anti-microbial activity in honey sampled from 67% of the forty-six hives (Appendix 1). Six of these samples were then tested by an improved HPLC method and the presence of OTC was confirmed in each (Appendix 1). Table 2. Results of HPLC analyses for pre- and post-treatment sampling: composite samples of the
six hives in each treatment Treatment and OTC application method
Pre-treatment First extraction(27/1/99) (mg/kg)
Second extraction (15/2/99)
Third extraction (24/4/99)
OTC product No. 1 - Wet < LOR 0.34 < LOR < LOR OTC product No. 1 - Dry < LOR 0.053 < LOR < LOR OTC product No. 2 - Wet < LOR 0.41 < LOR < LOR OTC product No. 2 - Dry < LOR 0.093 < LOR < LOR OTC product No. 3 - Wet < LOR 0.28 < LOR < LOR OTC product No. 3 - Dry < LOR 0.050 < LOR < LOR
<LOR = less than the level of reporting for oxytetracycline (0.05 mg/kg). Residues were not found in any of the extracted control honeys, demonstrating effective cleaning of the extraction equipment and absence of cross-contamination between treatments. 2.3.3.3 Post-treatment sampling of broodnest honey for OTC residues The analysis of composite honey samples taken on 7 May 1999 from the broodnests of the hives belonging to the two OTC product No.1 treatments, indicated residues of 0.17 mg/kg OTC for the dry treatment. Residues were not confirmed in the OTC product No. 1 wet treatment sample.
2.3.4 DISCUSSION 2.3.4.1 Pre-treatment sampling for OTC residues The cooperating apiarist had not treated the trial hives with OTC since late November 1997 and yet the pre-treatment bioassays showed residues of up to 0.048 mg/kg OTC in 67% of the trial hives. Some of these bioassay results were later confirmed by HPLC using extra sample clean-up steps. The level of OTC in these samples was low and we believe that this had little effect on results of this experiment. This was confirmed by routine HPLC testing of pre-treatment composite samples of
7

honey taken from all hives of a treatment group showed no presence of OTC (Table 2). The results of the routine HPLC also indicated that the concentration of OTC can be lowered below the level of detection by blending of contaminated honey with uncontaminated honey. Our findings clearly dispel myths of complete OTC degradation within current 8 week withholding periods stated on OTC product labels. The results of the preceding paragraph clearly indicate that OTC residues can persist at low levels in honey within the hive for up to 13 months after application of the antibiotic. The findings also support Gillian et al. (1979) who believed there was a much slower degradation and persistence of OTC beyond 8 weeks. Residues were detected in the composite sample of broodnest honey taken from hives belonging to the OTC product No. 1 dry treatment (caster sugar) approximately 20 weeks after treatment, while residues were not detected in the corresponding sugar syrup treatment. The differences in residues may be attributable to the sampling method or possible longer persistence of OTC when it is applied in caster sugar. However, the latter is not demonstrated by data obtained by the analysis of stored honey over time (Table 3). Our trial has not demonstrated movement of OTC contaminated honey from the broodnest to the super immediately above the queen excluder for the second and third extractions. However, we hypothesise that in some situations bees may lift contaminated honey into the super. 2.3.4.2 The first extraction The application of OTC in sugar syrup resulted in greater residues than occurred when OTC was applied in caster sugar. Data arising from the application of the three product treatments show a mean increase of 0.28 mg/kg OTC or 80.8% by using sugar syrup rather than caster sugar. 2.3.4.3 The second extraction In this experiment, OTC residues were not detected in the honey of the second extraction. If this were true for every scenario, apiarists would have confidence that honey of the second extraction would be free of OTC residues provided no further medication had been applied. 2.3.4.4 Active oxytetracycline according to product labels OTC products No. 2 and No. 3 had higher OTC active constituents than that stated on the product label. If these discrepancies are representative of OTC products, beekeepers may unknowingly overdose their hives. This may have ramifications for apiarists who must accurately measure the amount of OTC to be applied to hives.
8

2.4 Experiment 2 - OTC residue trial late winter 2001 2.4.1 Aim To determine if application of OTC to hives early in the beekeeping season when bees usually consume much of their honey stores might reduce the occurrence of residues in first extraction honey following treatment. 2.4.2 Methodology 2.4.2.1 Preparation of colonies and pre-treatment procedures Twenty, two-storey colonies located at Boundary Bend, northern Victoria, were selected after confirming that each had a queen and some brood. Collection of pre-treatment honey samples to determine presence of possible existing OTC residues and assessment of colonies for the number of frames of brood could not be conducted due to the prevailing cold weather and possible damage to brood and bees. However, the colonies were assessed and categorised according to the number of frames of adult bees. The colonies in each category were distributed to the treatment groups detailed in Table 3. 2.4.2.2 Allocation and treatment of colonies with OTC The colonies were allocated in equal numbers to the treatment groups detailed in Table 3. Table 3. OTC treatment and number of hives per treatment. Treatment No of hives
0.3 g OTC active ingredient in 30g caster sugar 5
0.5 g OTC active ingredient in 45g caster sugar 5
1.0 g OTC active ingredient in 90g caster sugar 5
Control – no OTC treatment 6 Note: The above OTC treatments are expressed as actual active ingredient (ai) OTC. To achieve this, the amount of OTC product stipulated by the product label was adjusted to provide a true 0.3 g, 0.5 g and 1.0 g ai dose. OTC treatments were applied to colonies on 13 August 2001 during early almond bloom, according to the method of application detailed in Experiment 1. 2.4.2.3 Post treatment management of colonies The dates of relocation of the hives, district and flora targeted following the cessation of almond flowering are detailed below: • 7 September 2001, Corowa, NSW, - canola • 17 September 2001, Shepparton, Victoria, - nashi fruit pollination • 28 September 2001, Corowa, NSW, - canola. 2.4.2.4 Procedures associated with extraction and sampling of honey On 3 October 2001 the super of honey was removed from each hive and extracted the following day according to the method described in Experiment 1. To determine if cross-contamination had occurred between treatment groups, honey from 16 combs derived from control hives was extracted and sampled prior to extracting each OTC treatment. Control honey was not poured into the small holding tank as per Experiment 1, however the tank was thoroughly scrubbed and washed three times between treatments. The extracted honey, in pails, was then allowed to settle overnight. In the following morning, the layer of scum and other debris was removed from the top of the honey to permit sampling of honey that was free of physical contaminants (particles of beeswax and bees). Four samples of honey were then collected from each treatment and stored in a -20°C freezer.
9
2.4.2.5 Analysis of honey All samples of honey were analysed by the Chemical Residues laboratory, Queensland, using HPLC.
2.4.3 Results The number of frames of bees per hive ranged from seven to ten. OTC residues were not found in any of the control honeys, demonstrating effective cleaning of the extraction equipment and absence of cross-contamination between treatments. Residues were not found in any of the samples derived from the 0.3 g and 0.5 g (ai) treatment groups. All four samples collected from the 1.0 g OTC treatment had 0.07 mg/kg residues (level of reporting = 0.05 mg/kg).
2.4.4 Discussion In this experiment, treatment of colonies with 1.0 g OTC early in the beekeeping season produced residues of 0.7 mg/kg OTC in extracted honey. While it is invalid to compare results of experiments that are conducted at different times and under different conditions, readers are invited to consider the results of Experiment 3 in which the same OTC treatment was also applied to hives. Readers should also consider Chapter 3 – ‘3.10 Conclusions’ and Chapter 4 – ‘4.6 Recommendations’.
2.5 Experiment 3 - OTC residue trial late spring 2001 2.5.1 Aim To determine the concentration of residues in extracted honey following application of 0.5g and 1.0g OTC in caster sugar and water.
2.5.2 Methodology 2.5.2.1 Preparation of colonies and pre-treatment sampling of honey Forty-two hives with no history of OTC treatment in the two previous seasons were selected on the basis of each having 6-7 combs of brood and similar populations of adult bees (range 14-16 combs/hive). Supers on these hives originated from hives not previously treated with OTC and which had been extracted 5-6 times during the previous season. A pre-treatment sample was obtained from each hive on 21 November 2001 by scraping honey from at least two brood nest combs. In a few cases, honey was not present in the brood nest and was therefore taken from combs in the super. On 23 November 2001, much of the larger particles of beeswax and other debris was removed from these samples prior to their storage in -20°C freezer. These samples were assayed for OTC residues by microbial inhibition test. The hives were moved in the early morning of 22 November 2001 to an apiary site which offered maintenance nectar and pollen resources for the bees. 2.5.2.2 Hive placement and treatment of colonies with OTC The hives were allocated to the five treatment groups detailed in Table 4 and arranged in a row-column design. The hives were positioned in 5 rows, with one hive of each treatment situated at an end of a row to account for any drift of adult bees that may have occurred.
10

Table 4. OTC treatment and number of hives per treatment. Treatment No of hives
1.0g OTC active ingredient in caster sugar 5 1.0g OTC active ingredient in caster sugar 5 1.0g OTC active ingredient in caster sugar 5 1.0g OTC active ingredient in distilled water 5 0.5g OTC active ingredient in caster sugar 5 0.5g OTC active ingredient in distilled water 5 Control – no OTC treatment 12
Note: The above OTC treatments are expressed as actual active ingredient. To achieve this, the amount of OTC product stipulated by the product label was adjusted to provide a true 0.3g, 0.5g and 1.0g ai dose. OTC treatments were applied to colonies, according to the procedures detailed in Experiment 1, at midday, 22 November 2001 when the bees were foraging well and bringing pollen to the hive. 2.5.2.3 Post treatment management of colonies The colonies were moved to a Yellow box nectar flow on 4 December 2001. On 2 January 2002, a super of empty combs and a honey bee clearer (escape) board was inserted beneath each super of honey to allow the bees to clear from the combs before extraction of the honey. The supers of honey were removed from the hives on 7 January 2002. 2.5.2.4 Procedures associated with extraction, sampling and analysis of honey On 7 January 2002, the honey was extracted according to the method described in Experiment 1. Prior to extracting honey from the combs of each OTC treatment, honey from 8 combs removed from untreated control hives was extracted, poured into the small holding tank, stirred and sampled to determine if cross-contamination had occurred between treatment groups during extracting. For each treatment, the extracted honey was placed in a pail, stirred, allowed to settle overnight and sampled after removal of froth and other debris from the top of the honey. The samples were placed in a -20°C freezer on 9 January 2002 and later analysed by the Chemical Residues laboratory, Queensland, using HPLC.
2.5.3 Results The microbial inhibition tests confirmed the absence of OTC in all pre-treatment samples. HPLC analysis of post-treatment samples confirmed absence of OTC residues in all the control samples, demonstrating absence of cross-contamination between treatments. Results of the assays of samples of honey derived from the OTC treatments are presented in Table 5.
11

Table 5. Treatment, concentration of OTC in four replicate honey samples and mean OTC residue per treatment group by HPLC.
Treatment Concentration of OTC residuein 4 replicate samples
(mg/kg)
Concentration of OTC residueMean of 4 samples
(mg/kg)
1.0g OTC (ai) caster sugar 0.25; 0.22; 0.22; 0.23 0.23 1.0g OTC (ai) in caster sugar 0.13; 0.13; 0.14; 0.12 0.13 1.0g OTC (ai) in caster sugar 0.14; 0.16; 0.15; 0.13 0.145 1.0g OTC (ai) in distilled water 0.28; 0.24; 0.23; 0.26 0.253 0.5g OTC (ai) in caster sugar 0.07; 0.07; 0.08; <0.05 0.073*
0.5g OTC (ai) in distilled water 0.05; 0.05; 0.05; 0.05 0.05 * Mean of three samples.
2.5.4 Discussion Samples of honey derived from the group of hives treated with 0.5 g OTC in distilled water had lower levels of OTC than samples obtained from hives treated with the same dose of OTC in caster sugar. In contrast, honey from the 1.0 g OTC dose in distilled water had higher concentrations of OTC than honey extracted from hives treated with 1.0 g OTC in caster sugar. It is suggested that additional trials be conducted to provide more data to confirm the appropriateness of applying OTC in water to hives.
2.6 Experiment 4 - Degradation of oxytetracycline hydrochloride in honey extracted from hives treated with OTC
2.6.1 Aim 2.4.1.1 To determine the degradation of OTC in honey stored at ambient temperature and a range of constant temperatures over time.
2.6.2 Methodology 2.6.2.1 Honey stored at ambient temperature Source of honey Honey derived from the first extraction of each of the six groups of hives treated with 1g OTC in Experiment 1 (See 2.3) was placed in 30 kg labelled plastic pails. Storage and sampling The honey was stored in a shed to mimic customary storage practices. The pails were placed on upturned hive covers situated on a concrete floor. Ambient temperature was recorded on a Lambrecht thermograph placed on a migratory hive cover adjacent to the pails. Samples of honey were taken for analysis at 6, 8, 10, 12, 15, 18, 21, 24 weeks from the date of OTC application and thereafter at approximate monthly intervals. The honey in each pail was thoroughly stirred before a sample was taken. Samples were placed in a -20oC freezer immediately after collection and later analysed by HPLC and microbial inhibition test. 2.6.2.2 Honey stored at 22oC Source of honey and sampling Honey from the first extraction (Experiment 1. See 2.3) of each of the six groups of hives treated with 1g OTC in Experiment 1 (See 2.3) was stored in a constant temperature room at 22oC, sampled on 16 December 1999 as per the method as per 2.6.2.1 and analysed by HPLC. 2.6.2.3 Honey stored at 25oC, 30oC, 35oC and 40oC constant temperatures Source and treatment of honey A 1 g dose of OTC (ai) in 500 mL of sugar syrup was applied to each of two 2-storey hives on 19 October 2000. Honey from the super of each hive was extracted on 1 November 2000, homogenized,
12

allowed to settle and then filtered to remove particles of beeswax and other debris. On 3 November 2000, after further stirring, the honey was decanted into 290 vials and kept at room temperature (approximately 21oC) until their placement in 25oC, 30oC, 35oC and 40oC incubators in approximately equal numbers on 14 November 2000. Sampling Two vials collected at the time of decanting, were analysed by HPLC to confirm presence and concentration of OTC residues. Two vials were removed from each incubator generally at 14 day intervals commencing on 30 November 2000 for 35oC and 40oC treatments, and 14 December 2000 for 25oC and 30oC treatments. Samples were placed in a -20oC freezer immediately after collection. Hydroxymethylfurfural A sample of honey was removed from each incubator on the following dates and analysed to determine the concentration of hydroxymethylfurfural that might result from prolonged heating of the honeys: 25 January and 22 February 2001 - 40ºC; 10 January 2002 - 35ºC, 30ºC and 25ºC. The following analytical method was used: A weighed sample of honey was dissolved in water and made up to a known volume. The sample was then centrifuged at high speed under refrigeration prior to filtering through a 0.45 um filter. The resulting solution was then analysed by reversed phase gradient HPLC using diode array detection.
2.6.3 Results 2.6.3.1 First extraction honey stored at ambient temperature The mean weekly maximum and minimum ambient temperatures recorded in the apiarist’s shed are presented in Appendix 2. Figure 1 and Table 6 show the concentration of OTC residues in honey derived from the first extraction, stored at ambient temperature and sampled at various time intervals. The data clearly demonstrates the higher OTC residues that result from a syrup application (wet treatment) compared to those of caster sugar (dry treatment). At each time of measurement the difference between the wet and dry treatments was significant at P<0.01.
0
0.1
0.2
0.3
0.4
0.5
0.6
5 10 15 20 25 30 35 40 45 50Weeks from date of application of OTC to hives
OTC
resi
dues
(mg/
kg) (
HPL
C)
P1-W P1-D P2-W P2-D P3-W P3-D
Figure 1. - OTC residues in honey derived from the first extraction and stored at ambient temperature (data shown in Appendix 2).
Key: P1-W OTC from product No. 1 applied in sugar syrup P1-D OTC from product No. 1 applied in caster sugar P2-W OTC from product No. 2 applied in sugar syrup
13

P2-D OTC from product No. 2 applied in caster sugar P3-W OTC from product No. 3 applied in sugar syrup P3-D OTC from product No. 3 applied in caster sugar. Table 6. OTC concentration in honey derived from the first extraction from hives treated with OTC
on 16 December 1998 and stored at ambient temperature OTC concentration (mg/kg) (HPLC) OTC
Treatment Date of sampling and approximate weeks from day of treatment of honey bee colonies
28/1/99* 10/2/99 24/2/99 7/3/99 31/3/99 21/4/99 7/6/99 16/12/99 23/6/200 6 8 10 12 15 18 24 52 79
P1-W 0.34 0.38 0.32 0.28 0.36 0.36 0.28 0.17 <0.02 P1-D 0.053 0.058 0.056 0.05 0.068 0.058 0.041 0.035 <0.02 P2-W 0.41 0.42 0.47 0.35 0.41 0.4 0.3 0.21 <0.02 P2-D 0.093 0.085 0.11 0.085 0.11 0.1 0.066 0.031 <0.02 P3-W 0.28 0.33 0.38 0.32 0.41 0.37 0.23 0.19 <0.02 P3-D 0.05 0.065 0.072 0.05 0.068 0.068 0.049 0.024 <0.02 Note: * = date of extraction. The results of microbial inhibition tests (MIT) of samples of the six honeys taken on 19 May 2000 are presented in Table 7.
14

Table 7. OTC concentration in first extraction honey stored at ambient temperature, sampled on 19 May 2000 and analysed by MIT.
OTC treatment OTC concentration (mg/kg) (MIT)
OTC treatment OTC concentration (mg/kg) (MIT)
P1-W P1-D P2-W
0.02 <0.02 0.06
P2-D P3-W P3-D
<0.02 0.06 0.01
2.6.3.2 First extraction honey stored at 22oC Figure 2 and Table 8 show the concentration of OTC residues in honey derived from the first extraction, stored in a 22oC constant temperature room and sampled at 24 and 52 weeks from the date of OTC treatment.
0
0.1
0.2
0.4
0 10 20 30 40 50 60Weeks from date of application of OTC to hives
P1-W0.5 P1-D
OTC
resi
dues
(mg/
kg)
0.3
P2-W P2-D P3-W P3-D
Figure 2. - OTC residues in honey derived from the first extraction and stored at 22oC constant temperature.
Key: P1-W OTC from product No. 1 applied in sugar syrup P1-D OTC from product No. 1 applied in caster sugar P2-W OTC from product No. 2 applied in sugar syrup P2-D OTC from product No. 2 applied in caster sugar P3-W OTC from product No. 3 applied in sugar syrup P3-D OTC from product No. 3 applied in caster sugar.
15

Table 8. OTC concentration in honey derived from the first extraction from hives treated with OTC on 16 December 1998 (Experiment 1) and stored at 22ºC; analysis by HPLC and MIT.
OTC treatment OTC concentration (mg/kg) HPLC MIT Date of sampling and approximate weeks from day of treatment of honey bee colonies 28/1/99* 7/6/99 16/12/99 16/3/2000 23/6/2000 6 24 52 65 79 P1-W 0.34 0.16 0.12 0.05 <0.02 P1-D 0.053 <0.02 <0.02 - - P2-W 0.41 0.17 0.095 0.04 0.04 P2-D 0.093 0.045 0.021 0.02 0.01 P3-W 0.28 0.16 0.14 0.05 0.05 P3-D 0.05 0.03 <0.02 - - * Date of extraction. 2.6.3.3 Honey stored at 25oC, 30oC, 35oC and 40oC Appendix 3 presents the dates that vials of honey were removed from the four incubators together with the results of microbial inhibition tests. OTC was still detectable in honey stored at 25ºC almost 18 months after treatment of the colonies but was not detectable in honey stored at 40ºC and sampled 14 weeks after treatment of the colonies.
0
0.05
0.1
0.15
0.2
0.25
0 100 200 300 400 500Number of days in incubation
OTC
(mg/
kg)
25°C30°C35°C40°C
Figure 3. - Microbial inhibition tests (MITs) for OTC in contaminated honey stored at various temperatures over time. The concentration of hydroxymethylfurfural (HMF) in honey stored at 25oC, 30oC, 35oC and 40oC is presented in Table 9.
16

Table 9. Concentration of hydroxymethylfurfural in honey stored at 25oC, 30oC, 35oC and 40oC Concentration of HMF (mg/kg) Date of sampling Number of days from
date of placement inincubator
25oC 30oC 35oC 40oC
25 January 2001 72 ns ns ns 45 22 February 2001 100 ns ns ns 75 10 January 2002 422 12 84 210 ns
ns = Sample not collected.
2.6.4 DISCUSSION 2.6.4.1 First extraction honey stored at ambient temperature Analysis of stored honey demonstrated some gradual increase in OTC residues for all treatments except P1 and P3, which stayed at approximately the same level (Figure 1). These increases can be primarily attributed to the dispersion of OTC within the honey samples not being homogenous and variations in the method of analysis, taken to be ±10%. In comparing the OTC residues at 6 and 18 weeks, very little degradation of the antibiotic had taken place as demonstrated by the near flat lines of the dry treatments in Figure 1. The fact that OTC residues were still present in first extraction honey sampled 12 months after the date of OTC treatment indicates that the antibiotic degrades only slowly in honey held at ambient temperature. High levels of OTC were present at this sampling point and this indicates that honey from treated hives may need a very long withholding period for the antibiotic to fully degrade. This finding is contrary to OTC product labels which generally indicate a withholding period of 8 weeks from the date of treatment. Gilliam et al (1979) demonstrated a rapid degradation of OTC in honey during the first 8 weeks and a much slower degradation beyond 8 weeks from the date of application of the antibiotic to the hive. The lack of data about persistence of OTC residues beyond a period of 8-10 weeks referred to in the introduction to this chapter has been addressed by this experiment. The apparent discrepancy between withholding periods detailed on OTC product labels and our results may be explained by an improvement of analytical methods (eg extraction of OTC from honey samples) developed by chemists over the years. 2.6.4.2 First extraction honey stored at 22ºC The data clearly demonstrates a higher rate of degradation of OTC in the honey stored at 22oC when compared to the same honey stored at ambient temperature. OTC residues were below the level of reporting in honey from two of the dry treatments at the twelve month sampling point. 2.6.4.3 Honey stored at 25oC, 30oC, 35oC and 40oC The data from this experiment confirms the slow rate of degradation of OTC at 25oC and a faster rate of degradation at higher temperatures. Apart from the 25ºC honey, the honeys exceeded the permitted maximum level of 40 mg/kg of hydroxymethylfurfural permitted by the standards of the Food and Agriculture Organisation - World Health Organisation Codex Alimentarius Commission. This indicates that long term heating of honey to accelerate the degradation of OTC would render the honey unacceptable to markets.
2.7 Experiment 5 - Degradation of oxytetracycline hydrochloride in selected spiked floral honeys
2.7.1 Aim To determine the degradation of OTC in honey in relation to time, pH, temperature and moisture content.
17

2.7.2 Methodology 2.7.2.1 Selection of honey Six distinct honey floral type honeys were selected for spiking with OTC on the basis of their pH and moisture content characteristics, ensuring a wide pH range. A sample of each honey was analysed by HPLC to confirm freedom from contamination by OTC. 2.7.2.2 Determination of moisture content and pH The moisture content of each floral honey was determined using the refractometric method of Chataway (1932) as revised by Wedmore (1955). The refractive index of the sample was determined using a refractometer at a temperature of 20oC and the reading was then converted to moisture content (percent m/m). Each honey was analysed for pH by electrode at the State Chemistry Laboratory, Victoria. 2.7.2.3 Spiking of honey with OTC On 29 March 1999, each floral honey was heated to 40oC using a waterbath to liquefy any crystals and to lower the viscosity. OTC from the OTC product No. 3 (refer to notes in Experiment 1.) was added to each honey using a pipette to obtain a concentration of 20 ppm. Honey was then thoroughly stirred for three minutes to ensure it was homogenous. Following inoculation, the honey was refrigerated until it reached a temperature of 25oC to reduce any degradation of the OTC that may have resulted from the heating. 2.7.2.4 Pre-storage honey sampling and testing to confirm homogenous OTC To confirm that the OTC was homogenous in the honey, two samples of each honey were taken immediately the inoculated honey had returned to 25˚C and later analysed by HPLC. 2.7.2.5 Storage and sampling of honey The inoculated honey was stored at temperatures of 22oC and 35oC in constant temperature rooms. Samples for HPLC analysis were obtained on 7 June 1999. Samples for microbial inhibition test (MIT) were generally taken at four to six weekly intervals.
2.7.3 Results The HPLC analysis confirmed freedom of OTC residues in the six honeys prior to spiking. Analysis of the two samples taken from each of the spiked honeys indicated that inoculation of the honeys with OTC and thorough stirring was sufficient in dissolving the OTC to homogenous levels. The pH, moisture content and mean post-spiking OTC concentration for each honey is shown in Table 10. A weak correlation was determined between honey pH and degradation of OTC at 22ºC (r2=0.20) and at 35ºC (r2=0.35). The correlation between moisture content of honey and degradation of OTC at 35ºC (r2=0.38). However, a stronger correlation occurred at 22ºC (r2=0.74). Samples of spiked honeys taken at various intervals were subject to microbial inhibition tests to determine the concentration of OTC (Tables 11 and 12).
18

Table 10. Moisture and pH characteristics of the floral type honeys; concentration of OTC post spiking OTC (mg/kg) (HPLC)
7/6/99 Honey pH Moisture
(%) 29/3/99 Immediate post-spiking* 22ºC 35ºC
Messmate (E. obliqua) 5.94 13.8 18.0 7.47 0.21 Red Gum (E. camaldulensis) 4.72 12.0 18.3 11.0 0.1 Grey Box (E. microcarpa) 4.49 12.8 18.8 12.9 0.32 Bimble Box (E. populnea) 4.35 14.1 19.1 11.1 0.13 Stringybark (E. youmanii) 4.05 13.0 17.6 10.2 0.082 Clover and thistle 3.66 17.0 18.7 8.09 0.096 Note: * mean of 2 samples. The results of analyses by HPLC and MIT of spiked floral honeys stored at 22ºC and 35ºC are presented in Table 11 and 12. Table 11. Concentration of OTC in six floral honeys stored 22ºC, date of sampling and type of analysis.
OTC concentration (mg/kg) HPLC MIT
29/3/99 7/6/99 12/1/00 15/3/00 12/5/00 23/6/00
Honey
Immediate post-spiking*
Storage at 22ºC
Messmate 18.0 7.47 0.19 0.18 0.13 0.13 Red Gum 18.3 11.0 0.2 0.12 0.14 0.16 Grey Box 18.8 12.9 0.26 0.17 0.16 0.14 Bimble Box 19.1 11.1 0.2 0.17 0.13 0.12 Stringybark 17.6 10.2 0.2 0.16 0.17 0.13 Clover/thistle 18.7 8.09 0.14 0.1 0.11 0.1 Note: * mean of 2 samples. Table 12. Concentration of OTC in six floral honeys stored 35ºC, date of sampling and type of analysis.
OTC concentration (mg/kg) HPLC MIT
29/3/99 7/6/99 4/8/99 2/9/99 4/10/99
Honey
Immediate post-spiking*
Storage at 22ºC
Messmate 18.0 0.21 0.11 0.08 0.05 Red Gum 18.3 0.1 0.06 0.08 0.04 Grey Box 18.8 0.32 0.06 0.03 0.03 Bimble Box 19.1 0.13 0.08 0.09 0.03 Stringybark 17.6 0.082 0.02 0.08 0.04 Clover/thistle 18.7 0.096 0.04 0.08 0.05
19
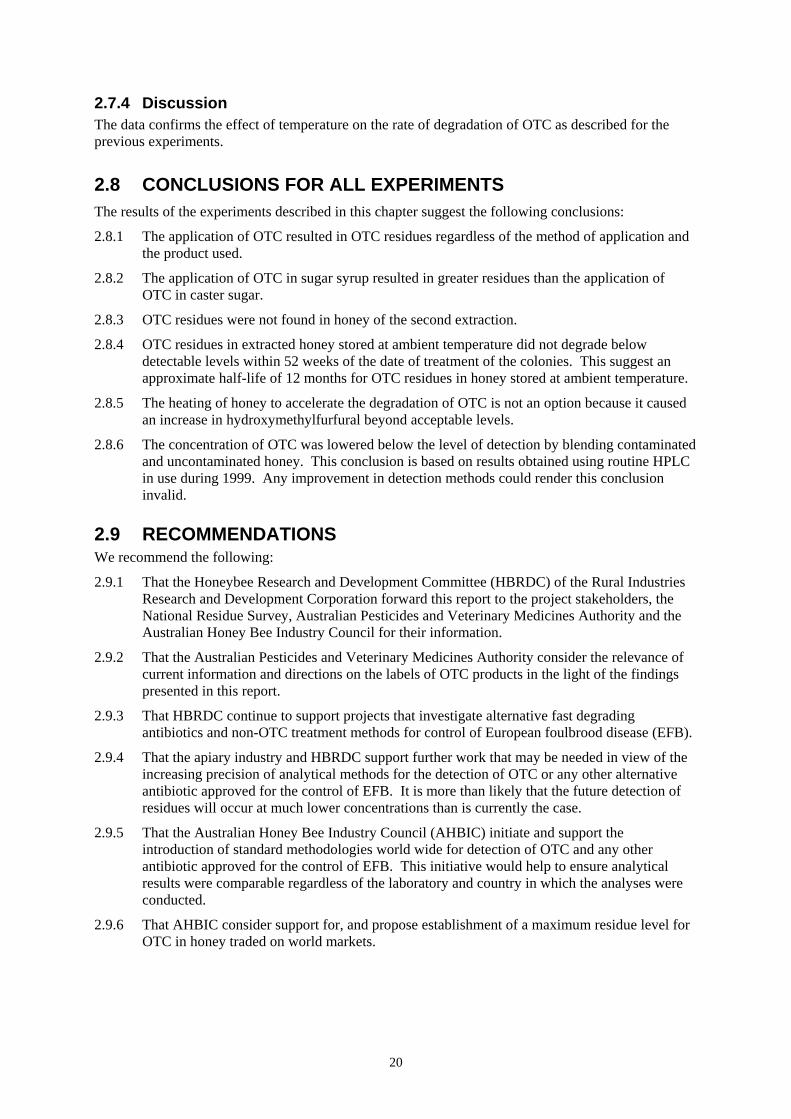
2.7.4 Discussion The data confirms the effect of temperature on the rate of degradation of OTC as described for the previous experiments.
2.8 CONCLUSIONS FOR ALL EXPERIMENTS The results of the experiments described in this chapter suggest the following conclusions:
2.8.1 The application of OTC resulted in OTC residues regardless of the method of application and the product used.
2.8.2 The application of OTC in sugar syrup resulted in greater residues than the application of OTC in caster sugar.
2.8.3 OTC residues were not found in honey of the second extraction.
2.8.4 OTC residues in extracted honey stored at ambient temperature did not degrade below detectable levels within 52 weeks of the date of treatment of the colonies. This suggest an approximate half-life of 12 months for OTC residues in honey stored at ambient temperature.
2.8.5 The heating of honey to accelerate the degradation of OTC is not an option because it caused an increase in hydroxymethylfurfural beyond acceptable levels.
2.8.6 The concentration of OTC was lowered below the level of detection by blending contaminated and uncontaminated honey. This conclusion is based on results obtained using routine HPLC in use during 1999. Any improvement in detection methods could render this conclusion invalid.
2.9 RECOMMENDATIONS We recommend the following:
2.9.1 That the Honeybee Research and Development Committee (HBRDC) of the Rural Industries Research and Development Corporation forward this report to the project stakeholders, the National Residue Survey, Australian Pesticides and Veterinary Medicines Authority and the Australian Honey Bee Industry Council for their information.
2.9.2 That the Australian Pesticides and Veterinary Medicines Authority consider the relevance of current information and directions on the labels of OTC products in the light of the findings presented in this report.
2.9.3 That HBRDC continue to support projects that investigate alternative fast degrading antibiotics and non-OTC treatment methods for control of European foulbrood disease (EFB).
2.9.4 That the apiary industry and HBRDC support further work that may be needed in view of the increasing precision of analytical methods for the detection of OTC or any other alternative antibiotic approved for the control of EFB. It is more than likely that the future detection of residues will occur at much lower concentrations than is currently the case.
2.9.5 That the Australian Honey Bee Industry Council (AHBIC) initiate and support the introduction of standard methodologies world wide for detection of OTC and any other antibiotic approved for the control of EFB. This initiative would help to ensure analytical results were comparable regardless of the laboratory and country in which the analyses were conducted.
2.9.6 That AHBIC consider support for, and propose establishment of a maximum residue level for OTC in honey traded on world markets.
20

2.10 APPENDICES
Appendix 1 OTC in pre-treatment honey samples Experiment 1. Results of bioassays of pre-treatment honey samples and HPLC analysis of some
selected samples for verification of OTC
Hive No. Treatment Bioassay* HPLC Hive No. Treatment Bioassay HPLC
1 P3-W No Response 24 P2-W 20 2 P2-D No Response 25 P2-D 17 0.018 mg/kg3 P1-W No Response 26 P1-D 23 0.048 mg/kg4 P2-W 18 27 P3-W 20 0.02 mg/kg 5 Control 18 28 Control No Response 6 P1-D 18 29 P3-D 17 0.015 mg/kg7 P3-D 20 30 P1-W 23 8 Control 20 31 Spare No Response 9 P1-W 20 32 P1-D No Response
10 P3-D 17 33 P3-W No Response 11 P1-D 17 34 P2-D 18 12 P3-W 17 35 Control 18 13 P2-W No Response 36 P3-D 18 14 P2-D 21 0.02 mg/kg 37 P2-W 16 15 Spare 18 0.017 mg/kg 38 P1-W 16 16 Spare No Response 39 P2-D 16 17 P2-W No Response 40 P2-W No Response 18 Control No Response 41 P1-W No Response 19 P3-D 19 42 P3-W No Response 20 P2-D 19 43 Control 16 21 PG1-D 19 44 P1-D 16 22 P3-W 20 45 P3-D 16 23 P1-W 20 46 Spare No Response
* Bioassay results refer to the zone of anti-microbial activity.
21

Appendix 2 Environmental conditions for honey stored at ambient temperatures Experiment 1. Mean weekly ambient air temperatures recorded on a thermograph placed adjacent to
pails of honey obtained from the first extraction of 28 January 1999 and stored in an enclosed shed
Time from date of honey extraction (weeks)
1 2 3 4 5 6 7 8 9 10 11 12 Mean Max (oC) 30.9 27.5 25.9 28.0 25.8 24.0 22.6 17.8 19.3 22.0 20.0 19.3 Mean Min (oC) 21.0 17.5 18.2 16.8 16.0 14.3 14.3 12.9 11.1 12.5 11.6 11.5
13 14 15 16 17 18 19 20 21 22 23 24 Mean Max (oC) 17.0 15.8 15.4 12.2 13.7 11.4 12.7 8.8 10.6 12.4 13.7 14.0 Mean Min (oC) 7.0 8.3 9.7 8.5 10.7 8.4 8.5 5.9 7.1 8.0 10.3 9.7 25 26 27 28 29 30 31 32 33 34 35 36 Mean Max (oC) 13.0 12.9 12.5 12.8 12.6 14.6 16.2 16.4 14.8 16.2 19.2 18.3 Mean Min (oC) 9.0 8.8 9.1 9.5 9.3 10.7 13.3 11.9 11.1 11.5 13.2 12.3 37 38 39 40 41 42 43 44 45 46 47 48 Mean Max (oC) 21.2 20.7 19.8 20.9 17.4 19.2 21.2 26.3 27.3 22.8 25.4 23.2 Mean Min (oC) 14.6 13.9 12.9 15.0 15.0 13.3 14.5 17.3 19.7 16.9 15.9 19.6 49* 50 51 52 Mean Max (oC) 19.3 24.9 28.5 22.8 Mean Min (oC) 15.8 18.7 22.4 18.3
Note: * Week 49 - mean of 3 days data only.
22

Appendix 3 Degradation of OTC in honey extracted from hives treated with the antibiotic Experiment 4. Results of microbial inhibition test (screen tests) on honey stored at various
temperatures over time.
Sampling Date Number of days fromdate of placement in OTC concentration (mg/kg) *
incubator 25°C 30°C 35°C 40°C 30 November 2000 16 ns ns 0.19 0.17 14 December 2000 30 0.20 0.14 0.19 0.06 28 December 2000 44 0.19 0.14 0.14 0.06 11 January 2001 58 0.19 0.12 0.08 0.06 25 January 2001 72 0.20 0.07 0.07 0.06 22 February 2001 100 0.17 0.14 0.08 no zone 8 March 2001 114 0.17 0.14 0.09 no zone 22 March 2001 128 0.17 0.09 0.10 no zone 5 April 2001 142 0.17 0.06 0.08 no zone 19 April 2001 156 0.17 0.06 <0.02 3 May 2001 170 0.09 0.07 <0.02 18 May 2001 185 0.08 0.06 0.03 31 May 2001 198 0.08 0.06 0.02 13 June 2001 211 0.05 0.05 0.01 28 June 2001 226 0.05 0.02 <0.02 12 July 2001 240 0.07 <0.02 <0.02 26 July 2001 254 0.08 0.01 <0.02 9 August 2001 268 0.03 0.01 <0.02 23 August 2001 282 0.05 0.01 <0.02 6 September 2001 296 0.05 0.05 <0.02 20 September 2001 310 0.05 0.02 no zone 5 October 2001 325 0.05 0.07 no zone 18 October 2001 338 0.05 0.05 no zone 1 November 2001 352 0.06 <0.02 <0.02 15 November 2001 366 0.08 0.02 <0.02 29 November 2001 380 0.05 <0.02 <0.02 13 December 2001 394 0.05 <0.02 <0.02 27 December 2001 408 0.05 <0.02 <0.02 10 January 2002 422 0.06 No zone no zone 25 January 2002 437 0.07 0.01 no zone 8 February 2002 451 0.02 0.01 no zone 21 February 2002 464 0.05 No zone no zone 7 March 2002 478 0.06 No zone 21 March 2002 492 0.09 No zone 4 April 2002 506 0.07 No zone Notes: ns = no sample
Samples were not collected on 8 February 2001.
Appendix 4 Degradation of OTC in honey extracted from hives treated with the antibiotic Experiment 4. Maximum and minimum air temperatures recorded each month in 4 incubators used in
OTC degradation studies.
23

Minimum and maximum temperatures recorded in incubators Year and Month
25ºC incubator 30ºC incubator 35ºC incubator 40ºC incubator
2000 November 25.0 – 26.0 30.5 – 30.7 34.0 – 34.6 39.7 – 40.9 December 25.0 – 26.5 30.5 – 31.3 34.3 – 35.0 39.3 – 40.6 2001 January 25.7 – 26.4 29.7 – 31.3 34.6 – 35.3 39.0 – 40.7 February 25.1 – 26.3 29.6 – 29.9 34.5 – 35.0 39.3 – 40.5 March 25.4 – 25.4 29.3 – 29 .9 34.5 – 35.5 39.2 – 40.4 April 25.1 – 26.0 28.9 – 29.9 35.0 – 35.4 39.3 – 40.4 May 25.1 – 26.0 29.9 – 30.2 35.0 – 35.0 June ND ND ND July 23.5 – 25.1 29.6 – 30.3 35.2 – 35.9 August 20.0 – 20.5 25.5 – 24.3 35.4 – 36.4 September 24.4 – 25.5 29.8 – 30.3 35.5 – 39.0 October 24.6 – 25.2 29.8 – 30.2 34.8 – 35.1 November 24.3 – 26.4 29.8 – 30.3 34.7 – 35.6 December 24.8 – 26.4 30.1 – 30.5 24.4 – 35.6 2002 January 25.4 – 28.0 30.1 – 30.9 34.1 – 34.8 February 24.6 – 26.9 30.1 – 30.5 33.6 – 34.8 March 23.8 – 26.9 29.9 – 30.3 33.5 – 34.5 April 23.8 – 24.6 29.8 – 30.5 32.7 – 34.0
Notes: Due to absence of OTC residues, use of the 40ºC incubator was discontinued after April 2001. ND = Data not available.
24

3. Oxytetracycline hydrochloride in larvae of treated honey bee colonies
3.1 Introduction Oxytetracycline hydrochloride (OTC) is a bacteriostatic antibiotic that inhibits the multiplication of M. pluton, the causal bacterium of the honey bee brood disease European Foulbrood (EFB). In many countries, OTC is administered to honey bee colonies for the control of EFB in either caster sugar or sugar syrup (Gilliam and Argauer, 1981a & b). In Australia, label directions of OTC products registered for the control of EFB stipulate the following doses:
single-storey colonies (8 combs covered with bees) - 0.5 g OTC (active ingredient) two-storey colonies (15-16 combs covered with bees) - 1.0 g OTC (active ingredient)
• •
There is a potential for OTC residues to occur in extracted honey (Matsuka and Nakamura, 1990; Goodman and Azoulas 1994) even when the antibiotic is applied according to label directions (See also 2.4.3). The occurrence of OTC residues in honey threaten industry’s continued access to domestic and export markets. To try to lower the potential for the occurrence of OTC residues in honey, some Australian apiarists have reduced the amount of OTC they apply to their colonies. Doses of 0.5 g or 0.3 g OTC (active ingredient) to two-storey honey bee colonies and have been reported as effective disease measures. Rather than use caster sugar as a carrier, some apiarists apply OTC in water in the belief that bees do not store water and consequently residues are unlikely to be found in extracted honey. To determine the effectiveness of a particular OTC dose, it is necessary to establish the concentration of the antibiotic in the gut of the honey bee larva which is the site where M. pluton lives and multiplies. The dose must deliver sufficient antibiotic to meet or exceed the minimum inhibitory concentration (MIC) of OTC to M. pluton. The MIC is the minimum dose capable of inhibiting development of M. pluton. Hornitzky et al. (1988) treated 2-storey hives with either 1 g or 0.5 g OTC (active ingredient) and found that the period of detectable OTC in larvae ranged from 1 to 9 days following treatment. He also found the 1 g and 0.5 g doses provided a peak concentration of OTC in larvae above the MIC of OTC for M. pluton, which they determined to be 3.8 µg/mL. Hornitzky & Smith (1999), conducted OTC sensitivity assays on 104 M. pluton isolates obtained from four Australian States and determined the MIC for all isolates to be 1-2 µg/mL. Note: All OTC treatments used in the following experiments were prescribed by registered veterinary surgeons and some were applied to hives as an “off-label” use. Off-label use of an OTC product in these experiments does not imply endorsement by the authors, Department of Primary Industries or the Rural Industries Research and Development Corporation. Oxytetracycline hydrochloride is an S4 drug and must be prescribed and used in accordance with the relevant regulations of the particular State or Territory.
3.2 OBJECTIVE 3.2.1 To determine if doses of OTC, lower than 1 g active, applied in caster sugar or water to different sized hives and colonies can deliver sufficient antibiotic to honey bee larvae to meet or exceed the upper level of the MIC of OTC for M. pluton (ie. 2 µg/ml) established by Hornitzky & Smith (1999).
25

3.3 Analysis of honey bee larvae for OTC 3.3.1 Introduction All samples obtained in Experiments 1 and 2 were analysed by high performance liquid chromatography (HPLC). The concentrations of OTC in larvae obtained in Experiments 3, 4 and 5 were lower than those of Experiment 1 and microbial inhibition tests (MITs) were found to provide more accurate analytical results than high performance liquid chromatography (HPLC) when concentrations of OTC were lower than 8 mg/kg (data not shown).
3.3.2 Analytical methods 3.3.2.1 Microbial inhibition test Samples were firstly prepared for MIT by homogenising the larvae of each individual sample and placing a 1.0 g ± 0.05 g aliquot in a 15 ml centrifuge tube with MilliQ water to make a total volume of 4 ml. This was then blended using a probe blender and centrifuged at 4000 rpm and 4°C for 10 minutes. The resulting liquid was now prepared for the diffusion assay. A sterile 13mm antibiotic disc was dipped into the liquid and placed on a Bacillus cereus disc diffusion assay plate (spore suspension supplied by Difco Laboratories) and incubated overnight at 37°C. B. cereus plates were prepared by dissolving 6.4 g of antibiotic medium #2 in 250mL of MilliQ water. This was autoclaved for 15 minutes and then held in a water bath at 55°C for at least 30 minutes. After adjustment of the pH to 5.6 ± 0.05 using 1M HCl, 0.1 mL of B. cereus was added to the media which was then stirred and poured into sterile petri dishes. A standard curve was determined using the above method with three known concentrations of OTC (0.02, 0.05 & 0.1 mg/kg), which was replicated three times. The diameters of the zones of inhibition were measured and the means calculated and converted to mg/kg to form a standard curve. The error was estimated by determining the mean standard deviation of the three controls and expressing them as a percentage error. 3.3.2.2 High Performance Liquid Chromatography For HPLC, 20 µL of 75% w/v trichloroacetic acid was added to the remainder of the solution prepared for MIT and blended for 10 seconds. This was then centrifuged at 4,000 rpm and 4°C for 10 minutes. The clear supernatant was poured into a 3 ml syringe and filtered though a 0.45 micron filter for HPLC analysis. HPLC was conducted using a Waters 2690 separation module and 996 Photo Diode Array (Waters Australia). The analytical column used was a Zorbax C-8 XDB, 150 x 4.6 mm, particle size 5 micron, with an equivalent C-8 guard column. The mobile phase comprised 0.1% trifluoroacteic acid, 85% MilliQ water and 14.9% acetonitrile. The flow rate was 1 ml per minute. Duplicate analysis was conducted in every tenth sample with the mean %RSD less than 8%. Spiked control values were in the range of 75-110%. Data was collected between 300 nm and 400 nm and the concentration of OTC was calculated at 357.3 nm, the wavelength maximum of OTC.
3.3.3 Results 3.3.3.1 Microbial inhibition test The level of sensitivity for the MIT detection of OTC from homogenised larval samples was 0.1 mg/kg. The relationship between the concentration of OTC and the zone of inhibition of Bacillus cereus is shown in Figure 1.
26

35
00 0.02 0
5
1
15
30
.04 0.06 0.08 0.1 0.12Oxytetracycline concentration (mg/kg)
0
20
Zone
of i
nhib
ition
(mm
)
25
3.4 thodologies 3.4.1 Aim To test thodol honey b y of HPLC analysis of hone
3.4.2 ethodThree honeybee colonies were allocated to the treatments d C on 7 January 2000. iments nts were sprinkled or poured between and on the top bars of th ter the honey supers
able 1. OTC treatment, honey bee colonies and hives used in pilot trial
Figure 1. – Relationship between OTC concentration and the zone of inhibition of Bacillus cereus. 3.3.3.2 High Performance Liquid Chromatography The level of sensitivity for the HPLC detection of OTC from homogenised larval samples was 6
g/kg. m
Experiment 1 – Confirmation of me
me ogies associated with sampling ofy bee larvae.
ee larvae and to confirm the sensitivit
M ology etailed in Table 1 and treated with OT described in this chapter. The treatmee broodnest frames af
Soluble OTC was used in all exper
and queen excluder had been temporarily removed from the hive. T
Treatment number
OTC Treatment Size of hive and honey bee colony
1 1 g OTC in 90 g of caster sugar Single storey hive; 6 combs of brood and 4 combs of bees
2 1 g OTC in 500 ml of water only (refer to note below)
Double storey hive; 6 combs of brood and 14 combs of bees
3 0.3 g OTC in 97 g of caster sugar Single storey hive; 5 combs of brood and 7 combs of bees
Note: OTC products contain sugars as a carrier of the active ingredient. The estimated sugar content of used i Samples of fifty larvae were taken at 72, 114 and 116 hours after application of OTC. Larvae were selected at random fro ombs that contained unsealed brood and analysed for OTC by High Performance Liquid C tography (HP ) at the State Chemistry Laboratory, Werribee, Victoria.
2.4.3 Results On the first day after treatment in Experiment 1, some bee flight was possible although approximately 40mm of rain fell and the maximum temperature was 22.5°C. The concentration of OTC for each treatment is presented in Table 2.
the solution n treatment 2 was approximately 1.8%.
m all chroma LC
27

Table 2. Concentration of OTC of honey bee larvae
OTC concentration in larvae post treatment Treatment number 72 Hours 114 hours 162 hours
1 29.0 0 0 2 3
2.3 3.0
0 0
0 0
3.5 Experiment 2 – Concentration of OTC in whole honey bee larvae and larval guts
ut.
ount of whole larvae rather than dissection of larvae and
rood area and honey were selected. The colonies had access to an extreme g . On 25 January 2000, 1 g active ingredient OTC in caster sugar made up to 100 g the method described in Experiment 1.
.5.2.2
l in size
after sampling, one larva from each pair was set aside, and the other had its entire gut dissected. This resulted in the following three types of larval material or “treatments”:
(i) whole larva (ii) entire gut dissected from second larva (iii) remainder of second larva.
Dissections of larvae were conducted by the one person using the method of Dade (1962). For each treatment, the larval material from the ten pairs within each sample was pooled, and the OTC concentration determined on the pooled material.
3.5.1 Aim To establish a relationship between OTC concentrations in whole honey bee larva and the larval g In large scale field trials, dissection of larvae in order to remove the gut to enable determination of theconcentration of OTC is impractical. This trial sought to establish a relationship between OTC oncentrations in the gut and whole larva. Such a relationship could in future trials enable the amc
of OTC in the gut to be determined by analysis analysis of their guts.
3.5.2 Methodology 3.5.2.1 Selection and treatment of colonies Two populous, 8-frame double-storey honey bee colonies, each with a single box broodnest, and similar numbers of adult bees, b
ly li ht nectar flow of mixture was applied to each hives using
3 Sampling techniques and treatmentsLarvae, aged approximately 4-5 days, were sampled from the middle two combs in each hive on day 1, 3 and 6 post treatment. Each sample comprised ten pairs of larvae, each of which was identicaand situated in adjacent cells of a brood comb. Five such samples were taken from each hive on each day, resulting in a total of 300 pairs of larvae. Immediately
28

3.5.2.3 Statistical analysis of data The mean OTC concentrations for each treatment were compared using analysis of variance (ANOVA) with ‘not detectable’ coded as 0. For the day 1 readings, a logarithmic transformation was applied to account for the positive skewness in the data. The day 3 readings were not very skewed, and no transformation was necessary. No analysis was performed on the day 6 readings, as most were ‘not detectable’. To measure the association between the OTC concentrations for the three types of larval material within a pair of larvae, correlation coefficients were calculated, and scatterplots examined. All analyses from this experiment, and from the other experiments described in this paper, were performed using the statistical package Genstat for Windows (Lawes Agricultural Trust, IACR-Rothamsted).
3.5.3 Results The mean concentration of OTC in the treatments averaged across both hives used in the experiment is presented in Table 3. On day 1, whole larvae had over twice the OTC concentration of larval guts, this difference being significant at P < 0.05. Larvae with guts removed also had a higher concentration than larval guts, though the difference was not significant at P = 0.05. The lowest concentration of OTC detected in the larval guts sampled on day 1, was 11.0 µg/mL. This exceeded the MIC of 2 µg/ml established by Hornitzky and Djordjevic (1998) and based on bioassays of whole honey bee larvae. On day 3, OTC was detected in only one of the two hives in whole larvae and larval guts (i.e. in only half the samples), and in only one sample out of 10 in larvae with guts removed. On day 6, only 4 of 30 samples had detectable OTC (all in larvae with guts removed). The mean OTC concentrations on days 3 and 6 were therefore very low. Table 3. Mean concentration of OTC in whole larvae, larval guts and larvae with gut removed on day
1, 3 and 6 following honey bee colony medication
Treatment OTC concentration (mg/kg)
Day 1† Day 3 Day 6
Whole larvae 98.4a‡ 7.1a 0 Larval guts 42.9b 5.1ab 0 Larvae with gut removed 83.8ab 0.8b 3.3
† Means are back-transformed from the log scale. ‡ Means within a column having the same letter are not significantly different at P = 0.05. There was very little association (r2 = -0.07) between the concentration of OTC in larval guts and larvae with guts removed, even though they arose from the same larvae. The other associations (whole larvae and larval guts; whole larvae and larvae with guts removed) were stronger, but were heavily influenced in each case by one observation, and were not significant at P = 0.05. The following provisional formula was established to enable calculation of the concentration of OTC in larval guts from known concentrations of OTC in whole larvae: OTC concentration in larval guts = OTC concentration in whole larvae 2.3 Due to the variation of data obtained in this trial, the research team suggests some caution in the application of the formula. Further repeat trials are necessary to obtain additional data and confirm the accuracy of the formula.
29

3.6 Experiment 3 – Concentration of OTC in honey bee larvae following application of the antibiotic in summer
3.6.1 Aim To determine the concentration of OTC in honey bee larvae following application of OTC in caster sugar to honey bee colonies in summer.
3.6.2 Methodology 3.6.2.1 Preparation of colonies and pre-treatment samples Thirty hives of bees with no previous antibiotic treatment were randomly allocated to one of 6 treatment groups (Table 1) using a row-column design of 3 rows of 10 hives. The hives of each treatment group and the honey bee colonies they contained were manipulated to ensure similar numbers of adult bees, brood and honey according to the group parameters. A very light nectar flow was in progress during the experiment. Pre-treatment samples of at least 20 larvae were taken from all colonies were analysed to confirm freedom from OTC contamination. 3.6.2.2 Treatment of colonies with OTC OTC was applied to the hives on 15 February 2000, according to the doses listed in Table 4 and method of application detailed in Experiment 1. Table 4. Oxytetracycline treatment, number of combs of brood and adult bees for each treatment
group Treatment Number of combs of brood and bees, and hive size
OTC (g active)
Caster sugar (g)
6 combs of brood and 8 combs of bees
(single storey)
6 combs of brood and 16 combs of bees (two storey)
0.3 33.3 5 colonies 5 colonies 0.5 50 5 colonies 5 colonies 1.0 100 5 colonies 5 colonies
3.6.2.3 Sampling of larvae Larvae were selected from a minimum of two brood combs and ranged in age from those recently hatched to those about to be capped. Larvae were removed from comb cells using tweezers. After collection of each sample of larvae all tweezers were thoroughly cleaned, flamed, washed in distilled water and dried to remove any residual OTC and larval material to prevent cross-contamination of the next sample. Samples were then placed in a -20oC freezer. In this experiment and Experiments 4 and 5, post-treatment samples consisted of 75 larvae, except where otherwise noted. Post-treatment samples were collected from all hives daily for 8 days commencing 24 hours after treatment. On days 9 and 10, samples were taken only from hives treated with 1 g OTC. The following exceptions applied to these arrangements: • on day 1, samples were not collected from 3 hives (1 g single storey, 0.5 g and 1 g double storey
hives) because medication was observed in open cells and larvae may have been externally contaminated with OTC
• on days 4 and 7, only 50 larvae from two combs were collected from all hives due to extreme weather conditions considered likely to adversely affect the colonies
• one single storey hive treated with 1 g active OTC was withdrawn from the trial because the brood died immediately after treatment.
3.6.2.4 Field observations The effect of OTC treatments on the honey bee colonies, plus unusual weather affecting honey bee foraging and possible clean-up of OTC treatments in the hives was recorded.
30

3.6.3 Results Data from this experiment was combined with data from Experiment 4 for statistical analysis because the procedures and treatments were essentially the same for both experiments.
3.7 Experiment 4 – Concentration of OTC in honey bee larvae following application of the antibiotic in spring
3.7.1 Aim To determine the concentration of OTC in honey bee larvae following application of antibiotic in caster sugar to honey bee colonies in spring, the season when colonies are usually treated with the antibiotic.
3.7.2 Methodology 3.7.2.1 Preparation and treatment of colonies This experiment was essentially a repetition of Experiment 3. Procedures and treatments were the same as those used in Experiment 3 (Table 4) except that there were only four replications per treatment group and the number of combs of adult bees per hive ranged from 14 to 16. Treatment of hives occurred on 30 September 2000; little if any nectar was available to the bees on that day. 3.7.2.2 Sampling of larvae Due to extreme inclement weather on the first day after treatment, half of the 2-storey hives treated with 0.3 g or 0.5 g OTC and all hives treated with 1 g OTC were not sampled. One single storey hive treated with 1 g OTC was withdrawn from the trial because larvae were not available; sampling from another hive in this treatment group did not occur on days 2 or 4 due to lack of suitably aged larvae and included only 25 larvae on day 5. As a result of deteriorating weather on day 7, only 50 larvae were sampled from hives treated with 0.3 g or 0.5 g OTC and none were sampled from hives treated with 1 g OTC. On days 10 and 11, only hives treated with 1 g OTC were sampled. 3.7.2.3 Statistical analysis of data Because the procedures and treatments were the same for Experiments 3 and 4, the data were combined for statistical analysis. However, the effects of the two experiments were not ignored, but accounted for in each model fitted, and a treatment group by experiment interaction term included where appropriate. A logarithmic transformation was applied to OTC concentrations, because (i) plots of residuals against fitted values indicated that it stabilised the variance, and (ii) it produced relationships between OTC concentration and time, which were more linear. Results from days 1 to 6 only were analysed; from day 7 onwards, there were too many zero readings for comparisons between treatment groups to be of any consequence. For each of days 1 to 6, the means for each treatment group were compared using ANOVA. A least significant difference (l.s.d.) at P = 0.05 was calculated for comparing any pair of means. For presentation purposes, the means were back-transformed to the natural scale, and this converted the l.s.d. into a least significant ratio (l.s.r.). For example, an l.s.r. of 1.6 implies that one mean must be at least 1.6 times larger than another mean in order to be significantly different at P < 0.05. Scatterplots of OTC concentration vs time (days since treatment) for each treatment group indicated an approximately exponential decrease in OTC. A linear regression of the logarithm of OTC concentration vs time was therefore fitted for each hive in the experiment. The fitted slope in the regression, back-transformed, estimates the rate of change of OTC concentration per day; a rate larger than 1 represents an increase, and a rate smaller than 1 a decrease. The intercept in the regression estimates the OTC concentration at day 0, immediately following treatment. ANOVAs were used to compare the mean slopes and intercepts for the six treatment groups. An l.s.r. at P = 0.05 was calculated for paired comparisons.
31

3.7.3 Results Experiments 3 and 4. Concentration of OTC in larvae following summer and spring application of the antibiotic in caster sugar. 3.7.3.1 Effect of OTC treatment on honey bee colonies In both experiments, death of larvae and cessation of egg-laying occurred in one of the single storey hives treated with 1 g OTC. In Experiment 3, some sick and dead brood were evident in one single storey hive treated with 0.5 g OTC and two hives treated with 1.0 g OTC. 3.7.3.2 Weather During Experiment 3, weather on the first 6 days after treatment was suitable for bee foraging although day 4 was hot and windy; rain fell on day 7. For Experiment 4, bees foraged during warm and windy conditions that occurred immediately prior to and during treatment of the hives. Shortly after treatment, an approaching cold front caused rapid deterioration of the weather and very little foraging was possible for the next 72 hours. 3.7.3.3 Clean-up of OTC treatments in hives On post-treatment day 1 in Experiment 3, two single storey hives treated with 1 g OTC and a double storey hive treated with 0.5 g OTC had not removed medication from the top bars of frames and in some cases had medication in open brood cells; samples were not taken from these hives. On post-treatment day 1 in Experiment 4, all single storey hives treated with 1 g OTC, a double storey hive treated with 0.5 g OTC and a double storey hive treated with 1 g OTC had not removed medication from all of the top bars of frames. It is possible that more hives could have been included in this category had weather not prevented inspection of every hive. 3.7.3.4 Concentration of OTC Table 5 and Figure 2 give details of the mean concentration of OTC in larvae for each treatment group for six days immediately following medication of the hives. On day 1, the mean concentration of OTC in larvae sampled from 0.5 g OTC single-storey hives was significantly greater (P < 0.05) than that in 0.3 g OTC single-storey hives. The same trend continued after day 1, but the differences were not significant at P = 0.05. On each of the six days, mean concentrations of OTC were significantly greater (P < 0.05) for the 1 g OTC double-storey hive treatments than for the 0.5 g OTC double-storey hive treatments, usually by a factor of 2–3.
32

Table 5. Mean concentration of OTC in larvae for each treatment group over six days from medication (Experiments 3 and 4)
OTC concentration (mg/kg) for each treatment and size of colony
0.3 g OTC 0.5 g OTC 1.0 g OTC
Days post medication
(1)* (2)* (1) (2) (1) (2) approx.
l.s.r.
1 2 3 4 5 6
12.6 6.1 1.2 1.6 1.0 0.2
8.2 3.0 1.0 0.3 0.2 0
25.1 7.6 2.2 1.7 1.6 1.0
10.5 6.4 1.4 1.0 0.5 0.3
41.9 19.2 12.3 11.3 2.6 3.8
29.0 11.1 5.1 2.7 1.2 0.8
1.5 1.6 1.8 1.7 2.0 2.1
* denotes size of colony in storeys
Degradation of oxytetracycline in larvae post medication
0
5
10
15
20
25
30
35
40
45
1 2 3 4 5 6Days post medication
Oxy
tetr
acyc
line
(mg/
kg)
0.3g OTC single0.3g OTC double0.5g OTC single0.5g OTC double1.0g OTC single1.0g OTC double
Figure 2 - Mean concentration of OTC in larvae for each treatment group over six days from medication (Experiments 3 and 4). Table 6 shows the mean rate of change of OTC concentration per day for each treatment group. These means are presented for the two experiments separately because the ANOVA showed that there was a significant treatment group by experiment interaction. An example of the meaning of these figures is that for Experiment 4, for single-storey hives given a dose of 0.3 g OTC, the rate of change of OTC concentration per day is estimated to be 0.512, i.e. the concentration approximately halves each day after treatment. The only significant difference of note occurred between 0.5 g and 1 g OTC double-storey hives in spring (Experiment 3). Table 6. Mean rate of change of OTC concentration in larvae for each treatment group in
Experiments 3 and 4
33

Mean rate of change of OTC in larvae Experiment OTC Dose (g active) Single-storey hive Double-storey hive
approx. l.s.r.
0.3 0.512 0.423
0.5 0.587 0.470
Experiment 3 (Summer)
1.0 0.672 0.527
1.3
0.3 0.554 0.563
0.5 0.543 0.578
Experiment 4 (Spring)
1.0 0.471 0.425
1.3
Table 7 shows the estimated level of OTC in larvae immediately after treatment using the mean intercept at day 0 (i.e. time of medication) from the regressions of the logarithm of OTC concentration against the number of days. The only significant difference of note occurred between 0.5 g and 1 g OTC double-storey hives in spring (Experiment 3). Table 7. Estimated level of OTC at the time of treatment (day=0) for each treatment group in
Experiments 3 and 4 Level of OTC at time of treatment
(mg/kg) Experiment OTC dose
(g active)
Single-storey hive Double-storey hive
approx. l.s.r.
0.3 26.4 19.9
0.5 23.4 25.1
Experiment 3 (Summer)
1.0 40.7 41.9
2.6
0.3 13.3 8.0
0.5 28.6 13.7
Experiment 4 (Spring)
1.0 172.2 104.4
2.9
In addition to the above, we combined the results of Tables 6 and 7 and concluded that: (i) there was not much evidence of a clear difference between 0.5 g and 0.3 g OTC single-storey hives in terms of how OTC concentration changed over time following treatment; (ii) there was some evidence of a difference between 0.5 g and 1 g OTC double-storey hives. In summer, OTC concentration started at a lower level for the 0.5 g treatment and decreased at a faster rate, though neither the starting levels nor the rates were significantly different. In spring, OTC concentration started at a much lower level for the 0.5 g treatment, but it decreased at a slower rate. In summer, OTC continued to be detected on day 10, (post treatment) in one 1 g OTC single storey-colonies (mean 11.85; range 1.2 - 43.0 mg/kg) and two 1 g OTC double-storey colonies (mean 1.0; range 0.8 – 1.2 mg/kg). Similarly, In spring (Experiment 4), OTC was detected on day 11 (post treatment) in three 1 g OTC single-storey colonies (mean 0.93; range 0.8 – 1.2 mg/kg) and one 1 g OTC double-storey colony (0.8 mg/kg).
3.8 Experiment 5 – Concentration of OTC in honey bee larvae following application of the antibiotic in water
3.8.1 Aim To determine the concentration of OTC in honey bee larvae following application of the antibiotic in water.
34

3.8.2 Methodology 3.8.2.1 Preparation and treatment of colonies This experiment was conducted in late spring during the honey bee colony build-up period. A very light nectar flow was available to the bees. Ten double-storey eight frame hives were standardised to contain 6 combs of brood, 15-16 combs of adult bees and similar quantities of honey. The hives were randomly allocated to either 0.3 g or 0.5 g OTC dissolved in 200 mL of distilled water, using a randomised block design. The concentration of sugar in each treatment, resulting from the carrier contained in the OTC product, was calculated. Treatments were applied to hives on 20 November 2000 by pouring the medication between and on the top bars of the broodnest frames beneath the queen excluder. Hives were elevated at the front to ensure the liquid did not flow out the entrances. Post-treatment samples were collected from each hive daily for 9 days immediately after treatment. 3.8.2.2 Statistical analysis The mean OTC concentrations in larvae for the 0.3 g and 0.5 g treatments were compared using ANOVA, for days 1, 2 and 3 (by day 4, all except two hives had no detectable OTC). A linear regression of the logarithm of OTC concentration vs days since treatment was fitted for each hive, for days 1, 2 and 3. ANOVAs were used to compare the mean slopes and intercepts for the treatments.
3.8.3 Results The 0.3 g and 0.5 g OTC treatments dissolved in 200 mL of distilled water contained 1.46% and 2.45% sugar respectively. Although the mean level of OTC in larvae was generally higher for the 0.5g treatment, the difference was not significant (at P < 0.05) on any day (Table 8). The estimated rates of change of OTC concentration per day for the 0.3 g and 0.5 g OTC treatments were 0.186 and 0.275 respectively, but these were not significantly different (approximate l.s.r. = 2.3). The estimated levels of OTC immediately after treatment (day=0) were 55.7 and 38.5 mg/kg respectively, which were again not significant (approximate l.s.r. = 10.1). Table 8. Mean concentration of OTC in larvae for each water treatment for three days from
medication Concentration of OTC in larvae (mg/kg) Days post
medication 0.3 g OTC/hive 0.5 g OTC/hive l.s.d.
(P = 0.05)
1 2 3
11.0 4.3
0.24
11.3 6.4
0.48
9.0 2.4
0.41
3.9 DISCUSSION This work expands on that of Hornitzky et al. (1988), and developed a successful HPLC method for the detection of OTC in honey bee larvae. However, HPLC only proved advantageous over conventional MIT screens in determining an accurate OTC concentration in larvae when at the antibiotic was at relatively high levels. This was due to the level of sensitivity for the HPLC detection of OTC from homogenised larval samples being 6 mg/kg. M. pluton multiplies within the mid-gut of the honey bee larva (Bailey & Ball 1991). Assay of the gut and its contents for OTC would provide meaningful data in determining if a particular dose could deliver sufficient antibiotic to meet the MIC for M. pluton at the site where the bacterium multiplies. However, accurate dissection of larvae to remove the gut, Experiment 1, was found to be extremely difficult, and some contamination between gut, haemolymph and larval tissue may have occurred. Consequently, we suggest that dissection of larvae is not practical as a routine technique and therefore whole larvae should be analysed to determine the concentration of OTC in honey bee larvae. The high concentration of OTC in whole larvae sampled on post treatment day 1 in Experiment 2 (Table 2), may have been caused by medication adhering to the external surface of larvae. However,
35

similar levels of OTC were not detected in Experiments 3 and 4 when identical treatment was applied to two-storey colonies. Absorption of OTC from the gut to body tissue may have also occurred. By day 3, the amount of OTC in whole larvae was much reduced, possibly as a consequence of metabolism and degradation. Unfortunately, statistical analysis demonstrated little association between “treatments”, and although we developed a provisional equation to predict OTC levels in the midgut further work to establish its validity was not pursued. However, the data obtained in Experiment 2 strongly indicated a lower concentration of OTC in the gut as opposed to whole larvae (Table 2). Detection of OTC in larvae sampled eleven and ten days post treatment (Experiments 3 and 4 respectively), from single and double-storey colonies treated with 1 g OTC, indicated a longer period of OTC activity than that of up to nine days demonstrated by Hornitzky et al. (1988). On the third day following treatment, only single storey colonies treated with either 0.5g or 1.0g OTC, and double storey colonies treated with 1.0g OTC had mean concentrations of OTC above the 2 µg/mL MIC for M. pluton (Hornitzky & Smith, 1999). On day four, only 1 g OTC single and double storey colonies met the MIC. These results illustrate a very quick degradation or metabolism of OTC in larvae. Thus the bacteriostatic action of OTC only inhibits M. pluton growth in the larval gut for a short period and for only one generation of larvae. The only noteworthy rate of change of OTC concentration in larvae over time in Experiments 3 and 4 that was significantly different was between the 0.5 g and 1 g OTC doses given to double-storey colonies in spring. Otherwise, the rate of change in OTC over time appeared to have no consistent relationship with the dose administered (Table 6), with the mean rate of change for all treatments for both experiments being 0.527 mg/kg for each day of treatment. The estimated level of OTC at the time of treatment (day=0) increased with the initial OTC dose (Table 7) in all cases except for the 0.3 g and 0.5 g OTC single-storey doses of Experiment 3, where the level was similar. This result was unexpected and was not repeated in the replicate trial of Experiment 4. The inclusion of the water treatment, (Experiment 5, Table 8) was requested by some Australian apiarists who had been trialing this treatment. Both 0.3 g and 0.5 g OTC water applications delivered antibiotic above the MIC for M. pluton for 2 days (Table 8). These treatments also gave higher estimated levels of OTC at the time of treatment (day=0) and equal or higher OTC levels on the first two days post-treatment when compared with the same doses applied in caster sugar to two-storey colonies. However, by day 3 the concentration of OTC in larvae treated with OTC in water was considerably lower than that in larvae fed with medicated caster sugar. We suggest that this may be the result of increased degradation or metabolism of the antibiotic. Medication of single-storey colonies with 1 g OTC is not normal industry practice and this treatment was included in these experiments to obtain information only. In Experiments 3 and 4, a reluctance by bees to quickly ‘clean-up’ this treatment, plus mortality of larvae and cessation of or reduced egg-laying by the queen demonstrated the effects of over dosing. In human and veterinary medicine, medicinal doses are given to ensure a concentration in the blood of 4 or even 8 times higher than the MIC for a specific medication and organism (P Reeves, National Registration Authority for Agricultural and Veterinary Chemicals pers. comm). The amount for which the level of OTC in honey bee larvae should exceed the MIC of 1-2 µg/mL established by Hornitzky and Smith (1999) is not known. Our results, based on whole larval assays, show that all treatments in Experiments 3, 4 and 5 delivered sufficient antibiotic to exceed the MIC by a minimum of 4 times on day 1 after treatment and a minimum of about 10 times at the time of treatment (day=0). However, we suggest some caution in interpreting these data on the basis that Experiment 2 indicated a lower concentration of OTC in the gut compared to whole larvae (Table 3).
36

3.10 Conclusion The 1 g dose of OTC for double storey colonies has proven effective in controlling EFB in Australia since the disease became a problem in 1997. On that basis the 1 g dose must provide sufficient antibiotic to meet or exceed the MIC. The ability of 0.5 g and 0.3 g doses (administered to double storey colonies) to deliver sufficient OTC to the larval gut (the site where M. pluton develops) to meet the MIC has not been confirmed by this work.
3.11 Recommendation We suggest that until the efficacy of these doses for control of EFB can be demonstrated by trials using laboratory reared honey bee larvae and back-up field trials, the 1g dose should not be reduced. In addition, any reduction in OTC may also encourage M. pluton to develop resistance to the antibiotic. The current 0.5 g and 1 g doses administered to single-storey and double-storey colonies respectively are therefore appropriate for control of EFB in Australia.
37
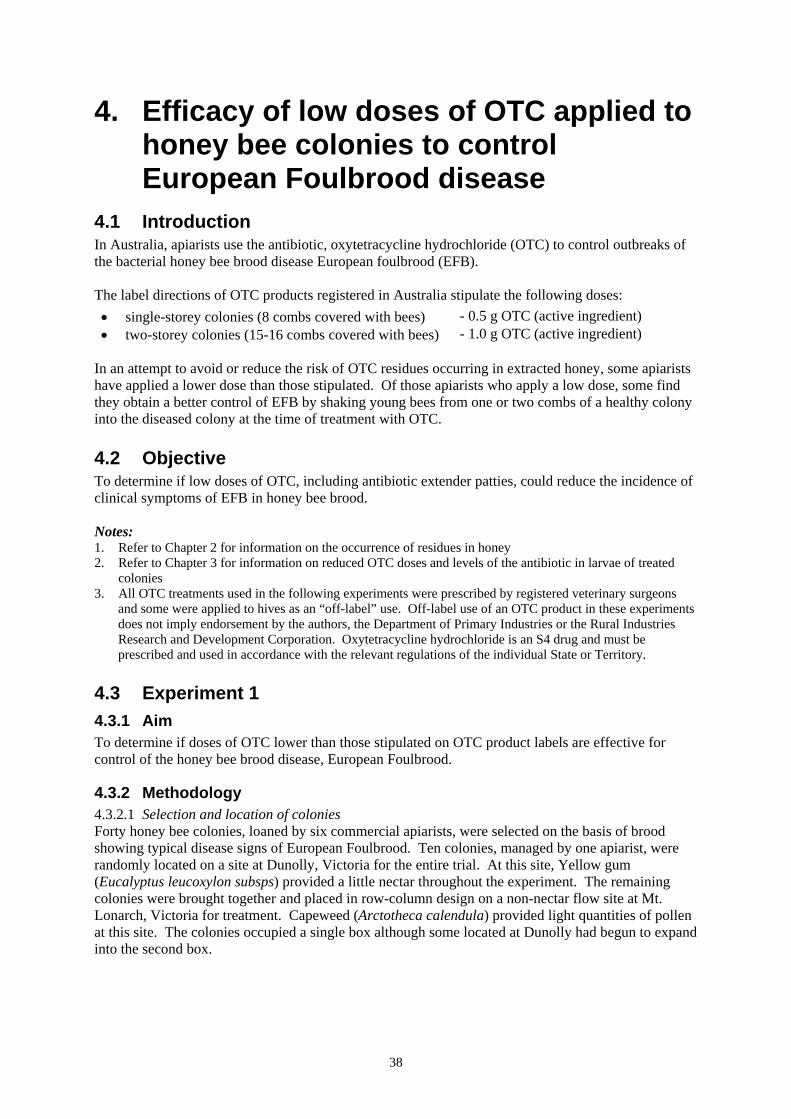
4. Efficacy of low doses of OTC applied to honey bee colonies to control European Foulbrood disease
4.1 Introduction In Australia, apiarists use the antibiotic, oxytetracycline hydrochloride (OTC) to control outbreaks of the bacterial honey bee brood disease European foulbrood (EFB). The label directions of OTC products registered in Australia stipulate the following doses:
single-storey colonies (8 combs covered with bees) - 0.5 g OTC (active ingredient) two-storey colonies (15-16 combs covered with bees) - 1.0 g OTC (active ingredient)
• •
In an attempt to avoid or reduce the risk of OTC residues occurring in extracted honey, some apiarists have applied a lower dose than those stipulated. Of those apiarists who apply a low dose, some find they obtain a better control of EFB by shaking young bees from one or two combs of a healthy colony into the diseased colony at the time of treatment with OTC.
4.2 Objective To determine if low doses of OTC, including antibiotic extender patties, could reduce the incidence of clinical symptoms of EFB in honey bee brood. Notes: 1. Refer to Chapter 2 for information on the occurrence of residues in honey 2. Refer to Chapter 3 for information on reduced OTC doses and levels of the antibiotic in larvae of treated
colonies 3. All OTC treatments used in the following experiments were prescribed by registered veterinary surgeons
and some were applied to hives as an “off-label” use. Off-label use of an OTC product in these experiments does not imply endorsement by the authors, the Department of Primary Industries or the Rural Industries Research and Development Corporation. Oxytetracycline hydrochloride is an S4 drug and must be prescribed and used in accordance with the relevant regulations of the individual State or Territory.
4.3 Experiment 1 4.3.1 Aim To determine if doses of OTC lower than those stipulated on OTC product labels are effective for control of the honey bee brood disease, European Foulbrood.
4.3.2 Methodology 4.3.2.1 Selection and location of colonies Forty honey bee colonies, loaned by six commercial apiarists, were selected on the basis of brood showing typical disease signs of European Foulbrood. Ten colonies, managed by one apiarist, were randomly located on a site at Dunolly, Victoria for the entire trial. At this site, Yellow gum (Eucalyptus leucoxylon subsps) provided a little nectar throughout the experiment. The remaining colonies were brought together and placed in row-column design on a non-nectar flow site at Mt. Lonarch, Victoria for treatment. Capeweed (Arctotheca calendula) provided light quantities of pollen at this site. The colonies occupied a single box although some located at Dunolly had begun to expand into the second box.
38

4.3.2.2 Pre-treatment measurements The number of sick and dead honey bee larvae, including scale (dried remains of larvae) exhibiting typical EFB disease signs were counted, using a specially made frame comprising 5 cm grids as a guide, and recorded for each colony. 4.3.2.3 Application of OTC and allocation to treatments Colonies were treated on 2 October 1999. As far as possible, colonies were allocated to the following treatment groups to ensure that each group had similar numbers of colonies from each apiarist and that the size of colonies and the variation of diseased larvae in individual colonies was evenly distributed across all treatment groups:
a. 0.3 g OTC in 19 g of icing sugar b. 0.4 g OTC in 46 g of caster sugar c. 0.5 g OTC in 45 g of caster sugar (standard dose for single storey colonies and
therefore a positive control) d. 0.8 g OTC in antibiotic extender patties made from 150 g hydrogenated cotton oil and
300 g caster sugar (Delaplane and Lozano, 1994) e. control – no OTC treatment.
The ten colonies at Dunolly were randomly allocated to treatments. The thirty hives at Mt Lonarch were arranged in a row-column design with each row containing hives from a single apiarist. At least one hive of each treatment was positioned at the end of a row. This was done to allow for any drift that may have resulted in large bee numbers in hives at the end of a row. All powdered sugar treatments were sprinkled on the top bars of frames of the hive brood nest and on the adult bees positioned between the top bars. Queen excluders, where fitted, and su0ers if present, were temporarily removed from the hive immediately before treatment and replaced after completion of the task. The antibiotic extender patties were oval and about 10 mm thick. These were placed on a sheet of paper of identical size and shape on the top bars of the brood nest frames and positioned centrally between the ends and sides of the box. A 12 mm wooden riser (rim) was placed on the brood nest box to accommodate the thickness of the patty when the excluder or upper box was replaced on the hive. 4.3.2.4 Post-treatment management of colonies and confirmation of EFB On the night of 5 October 1999, the colonies at Mt Lonarch were moved to a Yellow gum (Eucalyptus leucoxylon sp) nectar flow near Maryborough, Victoria. All colonies at Maryborough and Dunolly were inspected as per 4.3.2.2 on 14, 24 October and 12 November 1999 (12, 22 and 41 days post-treatment respectively) and the number of EFB diseased individuals and any dead colonies recorded. Confirmation of Melissococcus pluton in colonies showing symptoms of EFB was obtained by examination of smears of diseased larvae (Hornitzky and Wilson 1989) prepared during the last inspection, using a light microscope (1,000 magnifications). 4.3.2.4 Statistical analysis Restricted maximum likelihood (REML) analysis was used to correct for unbalanced data that resulted from unequal numbers of colonies for each treatment and each beekeeper, and to account for missing values resulting from the death of 2 and a further 3 colonies at 22 and 41 day observations respectively. The variable analysed was the number of dead larvae per brood comb thereby accounting for variation in colony size. This variable was highly skewed and a logarithmic transformation was applied to make the assumption of constant variance more valid. The necessity of this transformation was confirmed by the residual plots produced by the analysis. The pre-treatment measurements of diseased larvae per brood comb, referred to as ‘initial disease indicator’ or ‘covariate’ were corrected
39

for in the analysis. The treatment means are back-transformed, covariate-centred means. The analysis of the log-transformed data produced means which were based on an average initial level of disease, and these were then given an exponential, or antilog transformation to bring them back to the natural scale.
4.3.3 Results 4.3.3.1 Incidence of EFB and OTC The mean numbers of diseased honey bee larvae and scale per brood comb at each observation are presented in Table 1 and Figure 1. The 0.3 g, 0.4 g and 0.5 g doses of OTC were not significantly different from each other, although there was an indication that the 0.5 g dose resulted in slightly less diseased larvae that the 0.3 g dose. At 12 days post treatment, all three doses produced significantly less dead larvae than the extender patties or controls. At 22 days post treatment, the differences were of a similar magnitude, but they were not as significant statistically because of the greater variability in the data. At 41 days post treatment, there was even more variability in the data and differences between the five treatments were not significant. The patties were of no benefit in reducing numbers of diseased larvae. Patties were unattractive to bees and virtually remained untouched; the greatest consumption per hive being 0.97 g for the duration of the experiment. Table 1. Mean number of diseased larvae per brood comb following treatment with various
OTC doses and antibiotic extender patties.
OTC treatment Observation and mean number of diseased honey bee larvae per brood comb
Post-treatment (day) Pre-treatment (day 0) 12 22 41
0.3 g 59.7 2.61a 3.40a 3.79a 0.4 g 39.8 1.48a 3.74ab 2.72a 0.5 g 73.0 0.88a 2.53a 1.97a Extender patties 40.0 9.82b 16.39bc 12.20a Control 35.9 12.16b 11.83b 8.64a
Note: Means with different letters are significantly different at P < 0.05. The five dead colonies belonged to Treatments 1, 3, 4 (2 colonies) and 5. Microscopic examination of 26 larval smears obtained on 12 November 1999 confirmed the presence of M. Pluton in 24 of the remaining 35 live colonies. The presence of Paenibacillus alvei in these smears was taken as presumptive evidence of the presence of EFB (Bailey and Ball 1991).
40

0
2
4
6
8
10
12
14
16
18
12 days 22 days 41 daysDays post treatment
Mea
n nu
mbe
r of
dis
ease
d la
rvae
per
co
mb
0.3g OTC0.4g OTC0.5g OTCExtender pattiesControl
Figure 1. Effect of OTC treatment on incidence of European Foulbrood in honey bee colonies.
4.4 Experiment 2 4.4.1 Aim To determine the efficacy of late winter/early spring prophylactic application of OTC to control European Foulbrood (EFB).
4.4.2 Methodology 4.4.2.1 Allocation and treatment of colonies with OTC The colonies were allocated in equal numbers to the treatment groups detailed in Table 2. Table 2. OTC treatment and number of hives per treatment
Treatment number
OTC treatment No of colonies
1 0.3 g OTC active ingredient in 30 g caster sugar 5 2 0.5 g OTC active ingredient in 45 g caster sugar 5 3 1.0 g OTC active ingredient in 90 g caster sugar 5 4 Control – no OTC treatment 6
Note: The above OTC treatments are expressed as actual active ingredient OTC. To achieve this, the amount of OTC product stipulated by the product label was adjusted to provide a true 0.3 g, 0.5 g and 1.0 g active ingredient dose. OTC treatments were applied to colonies on 13 August 2001 during early almond bloom, according to the method of application detailed in Experiment 1.
41

4.4.2.2 Post treatment management of colonies and inspection for EFB The dates of relocation of the hives, district and flora targeted following the cessation of almond flowering are detailed below:
7 September 2001, Corowa, NSW, canola • • •
17 September 2001, Shepparton, Victoria, nashi fruit pollination 28 September 2001, Corowa, NSW, canola.
During routine checking of hives, at approximate monthly intervals, the co-operating apiarist examined all colonies for symptoms of EFB. A final observation for presence of EFB was conducted on 23 October 2001 by the research team.
4.4.3 Results 1.2.3.1 Incidence of EFB In all treatments, brood was free of symptoms of EFB at every inspection.
4.5 Discussion The antibiotic extender patties proved to be unattractive to bees. Because the bees consumed only an insignificant amount of patty, the uptake of OTC into the food chain was negligible and there was no effect on the incidence of EFB. The unattractiveness of the patties may be partly due to the fact that we used hydrogenated cotton oil in our patties. Crisco® vegetable oil used in USA patties was unavailable in Australia and after considering expert advice provided by a chemist employed by an Australian firm trading in vegetable oils, we chose cotton oil. Experiment 1 was essentially a pilot trial and preceded the work described in the previous chapter ‘Oxytetracycline hydrochloride in larvae of treated honey bee colonies’. The colonies treated with either a 0.3 g, 0.4 g or 0.5 g dose had statistically significantly less diseased and dead larvae than the controls at the 12 and 22 day post-treatment observations, but not at the 41 day post treatment observation. Our results may have been clearer had the data obtained on post treatment days 22 and 41 not been so variable. We also point out, that at the beginning of the trial, EFB was well established in some of the colonies as indicated by the number of diseased individuals. If OTC had been applied at an earlier time when the disease was not so advanced, we may have had a better clean up of disease. It was interesting to note that the 0.5 g dose (the standard dose for single storey colonies) did not enable the colonies to totally clean up the disease. We chose colonies with well established EFB because colonies with only a light infection (a few diseased larvae) can often spontaneously clear up. A spontaneous clear-up of disease symptoms may have wrongly attributed success to one or more of our treatments. Experiment 1 confirmed the observations of a few apiarists that doses of OTC lower than the standard dose of 1 g active ingredient for two-storey colonies could reduce symptoms of EFB. We suggest that the rate of clean up may be influenced by a number of factors including, the degree of infection at the time of OTC treatment, the number of adult bees in the colony, weather conditions that influence honey bee foraging and the available nectar and pollen resources. It is interesting to note that in a survey of apiarists described later in this report, some apiarists applied a combination of a reduced dose of OTC and the addition of adult nurse bees from one or two brood combs sourced from a healthy donor colony.
4.6 Recommendations 4.6.1 That until further investigations are conducted, Australian apiarists should continue to use 0.5
g and 1.0 g doses of OTC for single-storey and double-storey colonies respectively. This is in line with our conclusions of the previous chapter. Until the efficacy of low doses of OTC for control of EFB can be demonstrated by trials that use M. pluton infected laboratory reared honey bee larvae and back-up field investigations, these doses should not be reduced.
42

4.62 The research team strongly urges apiarists not to feed OTC to colonies using antibiotic extender patties. The team is aware that a small number of Australian apiarists have experimented with a variety of these patties. Antibiotic extender patties provide a prolonged exposure of OTC in low concentrations over the period of consumption by hive bees and a potential exists for the development of antibiotic resistance in bacteria (Delapane 1997) associated with EFB and American Foulbrood (AFB). It is believed that strains of Paenibacillus larvae sub-species larvae (the causal bacterium of AFB) in the USA have resulted from use of OTC extender patties.
43

5. Incidence of European Foulbrood in commercially managed honey bee colonies fed a dietary supplement
5.1 Introduction In nature, pollen is the sole source of protein for honey bees. Protein is necessary for growth of honey bee larvae and for body maintenance of adult bees. Pollen also supplies bees with minerals, vitamins, amino acids and lipids (oils/fats) which include fatty acids and sterols (Manning 2001). Where possible, honey bees usually gather pollen from a number of types of flowering plants. The various pollens deliver different amounts of protein, amino acids and other components helping to ensure an adequate, balanced and nutritional diet for the honey bee colony (Herbert et al. 1977). Anecdotal evidence and observations by apiarists and researchers have shown that the incidence of the honey bee brood disease, EFB, is generally greatest in colder districts where frequent inclement weather can restrict honey bee foraging and the collection of nectar and pollen. To date, there have been no formal scientific trials to confirm these observations. There is much speculation that stress of colonies is a primary factor in the incidence and severity of the disease (Herbert & Shimanuki 1982). Inadequate nutrition induces stress on honey bee colonies and increases their susceptibility to diseases such as EFB (Herbert & Shimanuki 1982; Hornitzky 1990). The characteristic behaviour of EFB to appear, sometimes as a severe outbreak, and then to spontaneously disappear (Bailey 1983) suggests the disease may be related to an environmental impact such as climatic conditions or nutrition (Rousseau et al. 1957; Herbert & Shimanuki 1982). Specific pollens may influence the incidence of EFB. This may be caused by composition and pH (Wardall 1982) or antimicrobial activity (Shimanuki et al. 1992). In contrast, Herbert & Shimanuki (1982) using caged colonies, showed that pollen was not a predisposing factor for the occurrence of EFB in New Jersey, USA, where outbreaks are common. However, firstly their study relied on the natural occurrence of the disease and secondly on the inoculation of colonies with diseased material. This can be unreliable because firstly the occurrence of the disease in colonies is unpredictable and secondly, inoculation techniques at that time were inadequate (Tarr 1936; Bailey 1960, 1963). In Australia, apiarists believe that the location of colonies near high quality pollen and nectar resources will decrease the potential for outbreaks of EFB. Some also choose to feed colonies with a high protein dietary supplement to reduce the risk of outbreaks. If optimum availability of food fed to individual larvae can lessen the intensity of EFB infections in a colony (Bailey 1960) it may be extrapolated that feeding of high nutritional supplement food to colonies could also decrease the incidence or intensity of the disease. Additionally, supplementary feeding may decrease the stress of colonies associated with climatic conditions and the reduction of foraging for pollen during adverse weather. The identification of one or more environmental factors that might trigger outbreaks of EFB would be helpful to apiarists. Sound evidence would provide the basis for alteration of apiary management practices to reduce the occurrence and impact of outbreaks. Such management practices might involve avoidance of certain types of flora or regular feeding of protein supplements to colonies. A change in management practices that could significantly lower the impacts of EFB would reduce apiarists’ need to apply the antibiotic oxytetracycline hydrochloride to their honey bee colonies.
44

5.2 Objective To determine the effect of environmental factors and nutritional supplements fed to honey bee colonies on the incidence of EFB in spring.
5.3 Methodology 5.3.1 Preparation of colonies and treatment of colonies One hundred and twenty commercially managed honey bee colonies with no history of antibiotic treatment or severe outbreaks of disease were selected for the trial. The hives had a single box, 8-frame broodnest with wire queen excluder. All colonies were requeened with sister queens to ensure standard genetic lines throughout the apiary. All colonies were assessed for adult bee populations and were allocated in equal numbers into one of the following treatment groups:
Group 1 OTC treatment (positive control) • • •
• • • • •
Group 2 dietary supplementation Group 3 control - no treatment.
Each treatment group commenced with 40 colonies in the 2000 season and 31 during the 2001 season. Details of the treatments applied to Groups 1 and 2 are provided below: Group 1 – OTC treatment OTC was applied prophylactically on 17 August 2000 and 13 August 2001 before EFB symptoms were evident in the brood, to reduce or prevent the population build-up of M. pluton. The antibiotic was applied in caster sugar to the hive broodnest at a rate of 0.5 g (active ingredient) per single and 1g (ai) per two-storey hive, according OTC product label directions. Group 2 –Dietary supplementation In consultation with the Australian honey bee industry, animal nutrionalists, entomologists and honey bee scientists, a supplement comprising the following ingredients was developed:
Red gum (Eucalyptus camaldulenis) pollen obtained from Western Australia (53.6%) torula yeast (8.9%) soyabean flour (8.9%) honey (28.4%) vitamin-mineral supplement (Roche, Australia) (0.2%).
The honey and pollen ingredients were sterilised by gamma radiation (15 Kilogray; Steritech, Australia) to ensure that any honey bee bacterial pathogens, including M. pluton were rendered non-viable. The mixture was made into flattened cakes of 100g, each measuring approximately 11.25 x 5 x 1.25 cm and then stored at -20oC until required. Cakes were thawed before placement in the hives under the queen excluder and between the two outer frames on each side of the broodnest. The dates of application and amount of cakes (grams) given to hives are presented in Table 1.
5.3.2 Apiary site location and hive management The location of each apiary site used in this trial and the nectar and pollen resources available to bees at each site is presented in Table 1. At each site, hives were randomly distributed in 4 parallel rows. Relocation of colonies to apiary sites was achieved by single truck load overnight and with hive entrances open. Any queenless colonies removed from the trial during 2000 were re-introduced to the same treatment group in the winter of 2001, only if they were viable and headed by a laying queen.
5.3.3 Observations and measurements Individual larvae with EFB disease signs were counted to determine the degree of infection in each colony. Larval smears of diseased larvae were examined in the laboratory to confirm the presence of M. pluton, the causal bacterium of EFB, or Paenibacillus alvei a bacterium associated with EFB.
45

The number of combs of adult bees and brood, plus the incidence of honey bee brood diseases in each colony were measured approximately every month, except in autumn and winter (Table 2). Surplus honey production during spring was determined by weighing the combs of the super (box) positioned above the excluder, at the beginning and end of spring. Queenless colonies removed from the trial were excluded from these observations, however supplement feeding of such colonies (Treatment 2) was continued. Daily temperature and rainfall data for each apiary site was obtained from data recorded at the closest Bureau of Meteorology weather recording station (Table 1).
46

Table 1. Apiary site over time and the date of nutritional supplement feeding Period at apiary site
Site location Distance from weather recording
station (km)
Date of feeding and weight of
supplement**
Nectar and pollen resource at apiary site
17 May – 10 July 2000
Moyston 9 17 May, 200 g Longleaf box (Eucalyptus goniocalyx)
11 July – 30 August, 2000
Roses Gap 21 17 August, 200 g Thryptomene (Thryptomene calycina), Correa (Correa reflexa), Wattle (Acacia sp.)
31 August – 1 October, 2000
Beulah 4 12 September, 200 g Canola (Brassica napus)
2 October – 27 October, 2000
Callawadda 19 3 October, 200 g 21 October, 200 g
Canola (B. napus), Capeweed (Arctotheca calendula)
28 October –15 November, 2000
Lexton 4 6 November, 200 g Canola (B. napus), Capeweed (A. calendula), Thistle (Cirsium vulgare)
16 November 2000 – 1 January 2001
Guildford 13 17 November, 200 g Dandelion (Taraxacum officinale), Yellow box (E. mellidora)
2 January – 16 January, 2001
Grampians 22 None Tea-tree (Leptospermum sp.), Messmate (E. obliqua)
17 January – 17 February, 2001
Hastings 9 None Messmate (E. obliqua)
18 February – 19 March, 2001
Violet Town 19 None Stringy bark (E. macrorhynhca)
20 March – 9 May, 2001
Rushworth 23 2 May, 200 g Grey box (E. microcarpa), Ironbark (E. sideroxylon)
10 May – 5 August, 2001
Nhill 5 15 May, 300 g 27 June, 300 g 5 August, 300 g
Banksia (Banksia ornata), Yellow Gum (E. leucoxylon)
6 August – 31 August, 2001
Robinvale 7 13 August, 300 g Almond orchard (Amygdalus communis), Turnip (Brassica tourneforti)
1 September – 16 October, 2001
Stawell 6 6 September, 300 g 18 September, 300 g 2 October, 300 g 11 October, 300 g
Capeweed (A. calendula), Onion weed (Asphodelus fistulosus), Yellow Gum (E. leucoxylon), Salvation Jane (Echium lycopsis))
17 October – 30 November, 2001
Duneworthy 18 20 October, 200 g 31 October, 300 g 15 November, 300 g
Capeweed (A. calendula), Onion weed (A. fistulosus), Yellow Box (E. mellidora), Dandelion (T. officinale)
* Bureau of Meterology registered weather recording station for precipitation and temperature ** Treatment group 2 only
47

5.3.4 Incidence of Nosema apis and M. pluton in adult bees In the second year of the experiment, samples of thirty adult bees were taken from the same 10 randomly selected colonies of each treatment group on 24 August, 14 September and 9 October 2001, and frozen at –20oC. However, for Treatment 1, only 9 and 8 samples were taken on 14 September and 9 October respectively due to colony deaths. The number of spores of the protozoan Nosema apis per bee was determined using the method of Cantwell (1970) to ascertain if nutritional supplement might effect the level of nosema disease in adult bees. Following this, 200 µl extracts of the macerated bees of each sample were subject to hemi-nested polymerase chain reaction (PCR) to determine presence of M. pluton.
5.3.5 Effect of nutritional supplement on crude protein of bees 5 3.5.1 Crude protein in adult bees in treatment groups On 30 November, 2001, at the completion of the trial, samples of 30 adult bees were taken from five randomly selected colonies, each with 14-16 combs of adult bees, of Treatment groups 2 and 3 for crude protein analysis. Samples were frozen at -20ºC until analysed. 5.3.5.2 Effect of nutritional supplement on crude protein in adult bees and larvae – Trial 2 In a separate trial conducted in autumn 2002, ten healthy colonies each with 14-16 frames of bees were selected to determine the effect of feeding nutritional supplement (as per 5.3.5.2) on crude protein of adult bees and larvae. The colonies were located at a site where maintenance nectar and pollen supplies were available from Tea tree (Leptospermum sp), Scent bark (Eucalyptus aromaphloia) and Messmate (E. obliqua). Pre-treatment samples of 50 larvae and 30 adult nurse bees were taken from each colony. The colonies were then randomly but evenly allocated to the following treatment groups:
supplement fed at a rate of 350 g/week • • controls - no treatment. Samples of 50 larvae and 30 nurse bees were taken from each colony at days 8, 16, 24 and 32 after the commencement of supplementation. All samples were stored at -20oC until analysed. 5.3.5.3 Crude protein analysis method The protein content of larvae and adult bees was determined using an adaptation of the standard Kjeldahl method. Each sample was digested with concentrated acid using a catalyst to reduce the organic nitrogen to ammonium ions. The solution was then made alkaline to convert the ammonium ions to ammonia which was then steamed off. The resulting ammonia solution was then titrated with a standardised acid solution and the amount of ammonia was determined and multiplied by 6.25 to give the crude protein content.
5.3.6 Weather Monthly means of weather data (maximum and minimum temperatures, and days with precipitation) and incidence of EFB in each treatment were statistically analysed to determine possible correlations.
48

5.4 Results 5.4.1 Adult bees, brood, queenless and dead colonies There was no significant difference in the amount of brood between treatments at any time during the trial. The mean number of combs of bees per colony in each treatment is presented in Table 3. Figure 3 depicts the mean number of combs of adult bees and brood at each observation. Significant differences (P<0.05) in the number of combs of adult bees occurred only between Treatments 1 and 2, and Treatments 1 and 3 during the four observations between 10 October and 30 November 2001. This result was due to considerable variability between the number of dead and queenless colonies in treatment group 1 during spring 2001 (Figure 1). At the completion of spring 2001, colonies infected with EFB in Treatments 1, 2 and 3 had means of 6.0, 7.0 and 10.7 combs of bees respectively. The incidence of dead and queenless colonies at each observation period is presented in Figures 1 and 2 respectively.
0
4
8
12
16
23/06/2000 1/10/2000 9/01/2001 19/04/2001 28/07/2001 5/11/2001 13/02/2002
Date
Num
ber
of d
ead
colo
nies
Treatment 1 Treatment 2Treatment 3
Figure 1. – Incidence of dead colonies for Treatment 1 (OTC), Treatment 2 (nutritional supplement) and Treatment 3 (control).
49

50
0
4
8
12
16
23/06/2000 1/10/2000 9/01/2001 19/04/2001 28/07/2001 5/11/2001 13/02/2002Date
Num
ber o
f que
enle
ss c
olon
ies
Treatment 1Treatment 2Treatment 3
Figure 2. – Incidence of queenless colonies for Treatment 1 (OTC), Treatment 2 (nutritional supplement) and Treatment 3 (control). 5.4.2 Disease incidence Data on the incidence of brood disease is presented in Table 2. EFB was not detected in Treatment 1 (OTC application) colonies at any observation. The incidence of EFB was significantly different (P<0.05) only between Treatments 1 and 2, and Treatments 1 and 3 on both observations of 10 October and 28 October 2001 (Table 2).

024681012
23/0
6/20
001/
10/2
000
9/01
/200
119
/04/
2001
28/0
7/20
01
1416
5/11
/
Dat
e of
obs
erva
tion
Combs of brood and adult bees
Figu
re 3
. – M
ean
num
ber o
f com
bs o
f adu
lt be
es a
nd b
rood
for e
ach
treat
men
t gro
up

gp
20
00
2001
Dis
ease
15
Aug
12 S
ep
1*
2
3
1
2
3
13 O
ct
1
2
3
06 N
ov
1
2
3
15 A
pr
1
2
3
23 A
ug
1
2
3 14
Sep
1
2
3
10
Oc
1
2
Euro
pean
foul
broo
d (M
elis
soco
ccus
plu
ton)
<2
50 la
rvae
-
-
-
-
-
- -
-
-
-
-
1
-
-
- -
-
-
-
1
-
-
5
25
0-50
0 la
rvae
-
-
-
-
-
- -
-
-
-
-
- -
-
-
-
-
- -
-
-
-
2
50
0-75
0 la
rvae
-
-
-
-
-
- -
-
-
-
-
- -
-
-
-
-
- -
-
-
-
-
>1
000
larv
ae
-
-
- -
-
-
-
-
- -
1
-
-
-
- -
-
-
-
-
- -
-
Per c
ent c
olon
ies i
nfec
ted
with
Eur
opea
n fo
ulbr
ood
in e
ach
treat
men
t gro
up
0
0
0
0
0
0
0
0
0
0
3
3
0
0
0
0
0
0
0
3
0
0 2
4
Cha
lkbr
ood
(Asc
osph
aera
ap
is)
-
-
- 2
1
-
1
1
1
-
2
- -
-
-
-
-
- 4
3
3
1
2
Sacb
rood
viru
s -
-
-
-
-
- -
-
-
-
-
- -
-
-
-
-
-
1
1
-
-
-
Hon
ey b
ee c
olon
ies p
er
treat
men
t gro
up a
t the
tim
e of
obs
erva
tion
37 4
0 3
7 34
38
36
30 3
2 3
0 27
26
28
26 2
4 2
9 31
31
31
28 3
0 3
0 17
29
* N
ote:
trea
tmen
t 1=
OTC
app
licat
ion;
trea
tmen
t 2 =
nut
ritio
nal s
uppl
emen
tatio
n; tr
eatm
ent 3
= c
ontro
l.

5.4.3 Spring honey production The production of honey and mean number of combs of bees in each colony was determined at the completion of each spring (Table 3). There were no significant differences (P>0.05) in honey production between the treatments. The adult bee to honey ratio (Table 3) is a measure of the mean number of combs of adult bees and the weight of honey produced. Colonies having the lower ratio were more efficient honey producers than colonies than those colonies with a high ratio. Mean honey production in diseased colonies was 0, 1.5 and 6.39 kg for Treatments 1, 2 and 3 respectively. Differences between diseased colonies and healthy colonies in all treatments were not significant (P>0.05). The differences in the number of combs of adult bees or production of honey in diseased colonies (EFB) compared to healthy colonies within each treatment group were also not significant. Table 3. Spring honey production for each year of the experiment
Treatment Year and attribute
Group 1 (OTC)
Group 2 (supplement)
Group 3 (control)
Spring 2000 Number of colonies in treatment group 27 26 28
Mean number of combs of adult bees 11.9 8.96 9.80 Mean weight of honey per colony (kg) 9.87 8.73 9.31 Adult bee to honey ratio 1.21 1.03 1.05 Total honey production for all hives (kg) 266.5 227.0 260.7
Spring 2001 Number of colonies in treatment group 13 23 23
Mean number of combs of adult bees 13.1 13.7 13.8 Mean weight of honey per colony (kg) 11.6 11.7 10.7 Adult bee to honey ratio 1.13 1.17 1.29
Total honey production for all hives (kg) 150.4 268.3 247.0 5.4.4 Nosema apis and M. pluton infection of adult bees The mean number of Nosema apis spores in adult bees are contained in Figure 4. Statistical analysis of data confirmed a significant difference (P<0.05) between Treatments 1 and 3 on 2 October 2002 sampling only.
53

0
2
4
6
8
spo
res
per b
ee (m
illio
n) 10
Aug-02 Sep-02 Oct-02mpling
Nos
ema
apis
Treatment 1 (OTC application)
Treatment 2 (Supplement)
Treatment 3 (Control)
Sa date
F Nosema apis spore dult be g late r to m 200
. pluton in samples
sted PCR.
percentage of samples of adult bees with M. d
igure 4. – s in a es durin winte id spring 1.
The results of the hemi-nested PCR assays conducted to determine presence of Mf adult bees collected from 10 hives of each treatment group are presented in Table 4. o
Table 4. Number of adult bee samples in which M. pluton was detected by hemi-ne
Date of sampling, number andpluton positive first generation PCR products (486 bp) and secon
generation PCR products (276 bp)
24
Treatment
August 2001 14 September 2001 9 October 2001
486 bp 276 bp 486 bp 276 bp 486 bp 276 bp
OTC* 0/10 2/10 0/9 3/9 0/8 4/(20%) (33%)
8 (50%)
Nutritional supplement 0/10 3/10 (30%)
0/10 0/10 2/10 (20%)
0/10
Control 0/10 1/10 (10%)
0/10 1/10 (10%)
2/10 (20%)
6/10 (60%)
* led on 14 September and 9 October respectively 5 fect of nutritional supplement on crude protein of bees 5 ult bees in treatment groups T evels of adult bee samples collected from Treatments 1, 2 and 3 at the co re 16.34, 16.22 and 15.86 g/100 erences w
rotein in adult bees and larvae – Trial 2
Nine and eight colonies samp .
.4.5 Ef 4.5.1 Crude protein in adhe mean crude protein lmpletion of the trial in 2001 weere not significant (P=0.815).
g, respectively. These diff
5.4.5.2 Effect of nutritional supplement on crude pThere were no significant differences in crude protein levels of adult bees or larvae sampled from colonies fed nutritional supplement and untreated control colonies (Table 5).
54

Table 5. Mean crude protein levels of samples of adult bees and larvae – Trial 2, 2002
Mean protein content of sample (g/100g) for each sampling day
Sample and treatment
0 8 16 24 32
Adult bees from nutritionally supplemented colonies
14.7 14.4 15.2 17.4 17.1
Adult bees from control colonies
14.3 14.9 15.2 18.3 18.0
Larvae from nutritionally supplemented colonies
8.6 9.1 8.1 8.9 8.9
Larvae from control colonies 8.9 9.1 8.6 8.9 9.22 5.4.6 Weather at each apiary location Figure 5 presents daily temperature and rainfall data recorded at the Australian Bureau of Meteorology weather station closest to each apiary site during for the trial. Table 6 presents the mean minimum and maximum temperatures, and days with precipitation for each month during winter and spring in each year of the trial.
55

Dai
ly p
reci
pita
tion
and
tem
pera
ture
at n
earb
y w
eath
er s
tati
ons
354045 -5051015202530
1/05/00
1/06/00
1/07/00
1/08/00
1/09/00
1/10/00
1/11/00
1/12/00
1/01/01
1/02/01
1/03/01
1/04/01
1/05/01
1/06/01
1/07/01
Dat
e
Temperature (°C) / Rainfall (mm)
Figu
re 5
. – D
aily
pre
cipi
tatio
n an
d te
mpe
ratu
re a
t wea
ther
stat
ions
clo
sest
to a
piar
y si
tes.

Table 6. Monthly mean temperatures and days with rainfall during winter and spring for each year of the trial
Year and weather attribute Month 2000 June July Aug Sept Oct Nov Maximum temperature (oC) 13.2 12.6 14.7 18.3 19.6 23.4
Minimum temperature (oC) 4.98 4.79 2.94 5.25 5.76 11.5
Days with precipitation 6 16 14 8 7 4
2001 Maximum temperature (oC) 15.2 14.3 17.7 18.1 16.7 19.09
Maximum temperature (oC) 5.74 3.66 5.8 6.89 6.7 6.83
Days with precipitation 15 12 10 11 21 14 No relationship was found between temperature and the incidence of EFB in Treatments 2 and 3 (r=-0.121, P=0.632) even though maximum temperatures were on average lower in spring 2001 than those of 2000 (Table 6). However, there was a significant relationship (P<0.05) between the mean monthly number of days with rain and the increased incidence of EFB in Treatments 2 (r=0.583) and 3 (r=0.590). Application of OTC to Treatment 1 colonies resulted in a very low incidence of EFB and consequently it was not possible to determine a relationship between weather conditions and EFB for this group of colonies.
5.5 Discussion In spring 2000, EFB occurred in only one colony in each of Treatments 2 and 3 and because of this no statistical conclusion was reached. The mean number of combs of adult bees and brood in colonies of each treatment group did not differ significantly at any of the eleven observation dates over the two years of the trial (Figure 3). This suggests that regardless of antibiotic treatment or supplementary feeding of colonies, other factors such as nectar and pollen resources influenced the number of combs of brood and adult bees in colonies of this trial. During spring 2001, the incidence of EFB was much higher than that of the previous year. In 2001, the percentage of colonies infected with EFB was as high as 24% in Treatment 2 and 43% in Treatment 3. Over all the observations in 2001, the mean incidence of EFB in colonies fed nutritional supplement (Treatment 2) was 9% lower than the controls, but this was not statistically significant. For the two disease observations conducted during October 2001, significant differences (P<0.05) occurred between Treatments 1 and 2, and 1 and 3 and these were the result of a zero incidence of EFB in Treatment 1. Therefore, the incidence of EFB in colonies fed the dietary supplement was not significantly lower than control colonies. The results illustrate the devastating impact EFB can have on colony size and honey. The mean number of combs of adult bees in infected colonies at the completion of spring 2001 was 7.9, which was 5.6 combs (41.5%) lower than the trial average of 13.5 combs. Average honey production of diseased colonies was 2.63 kg, which is 8.67 kg (77%) lower than the trial average of 11.3 kg per colony. These differences, however were not significant (P>0.05) due to the small data set associated with each treatment. The application of OTC to Treatment 1 colonies resulted in total protection against EFB in 2000 and only one colony exhibiting symptoms in 2001 (Table 2). It is interesting to note that during 2001, EFB occurred commonly throughout Victoria. In 2001, all Treatment 1 colonies were given 0.5 g OTC (because they had approximately 8 frames of bees) once in early August and this gave near complete protection against EFB throughout the spring. During October and November 2001, Treatment 1 colonies had a higher degree of swarming than other colonies and consequently had
57

significantly (P<0.05) higher incidences of queenless and dead colonies compared to Treatments 2 and 3. The feeding of nutritional supplement did not result in a statistical difference in the incidence of Nosema apis when compared to the other treatments. Although in 2001, only one of the colonies administered OTC (Treatment 1) had disease symptoms, M. pluton was detected by hemi-nested PCR in up to 50% of adult bee samples derived from these colonies (Table 4). PCR tests confirmed an increased presence of the pathogen in adult bees from all treatments as spring progressed, which is expected as the incidence of clinical symptoms of EFB in colonies also increased. Interestingly, adult bees from the supplemented colonies (Treatment 2) contained a decreased incidence of M. pluton at all samplings, when compared to the other treatments. Adult bee protein levels were very similar between treatments at the completion of the trial. Interestingly, the supplemented colonies from Treatment 2, which had been fed 4.8 kg over the trial period, did not have the highest average protein content on the trial completion. In the separate Trial 2 designed to examine the effect of supplementary feeding on protein levels of adult bees and larvae, differences between treated and control colonies were not significant (P>0.05) even though the supplement was fed at a rate of 350 g/week. Protein levels in larvae remained relatively constant over the sampling period but those of adult bees rose towards the end of the trial (Table 5). Weather conditions were more erratic in spring 2001 than in the previous year (Table 6). The relationship between the number of days with rain per month and the incidence of EFB in Treatments 2 and 3 was significant (P<0.05). The rain could restrict yield of pollen and nectar and would certainly restrict the capacity of colonies to forage for nectar and pollen. We also suggest that rainfall may affect flower structure and therefore the attractiveness of flowers to bees. All these factors could effect the nutrition of honey bee larvae and induce stress on the colonies. Although we have no proof, we also suggest that while our colonies had ample pollen and honey stores in their hives, a shortage of fresh nectar and pollen supplies caused by a restriction of foraging by inclement weather seems to have facilitated the onset of EFB symptoms. Rain, wind and low temperatures unsuitable for honey bee flight are common in southern Victoria, an area in which EFB appears to be more common than warmer areas of south-eastern Australia. In Trial 1, the low incidence of EFB in 2000 may be attributed to the: • young age of the queens, recognised by apiarists as helpful in minimising the severity of EFB • good supplies of nectar and pollen yielded by canola (B. napus) crops • favourable weather conditions for honey bee foraging and low, if any, colony stress. Rosseau et al. (1957) and Bailey (1960; 1983) stated that EFB was a seasonal disease whose incidence was sporadic and unpredictable from year to year. They and others (Phillips 1926; Shimanuki et al. 1969) have reported spontaneous recovery of colonies partly brought on by nectar flows. By the completion of the trial in 2001 and despite the occurrence of a nectar flow in late spring 2001, EFB resulted in the loss of some colonies. Colonies that did not die required antibiotic treatment to ensure they retained viability.
5.6 Conclusions 5.6.1 In this trial, OTC proved to be the most effective treatment for the control of EFB. 5.6.2 The feeding of nutritional supplements to honey bee colonies in this trial did not result in a
statistically significant reduction in the incidence of EFB when compared to untreated controls. This may be due to the prevailing conditions under which the trial was conducted.
5.6.3 The results do not imply that the feeding of nutritional supplements could not significantly
reduce the incidence of EFB in honey bee colonies situated under different conditions (eg
58

other districts, species of flora and/or years) even though our finding corresponds with observations made by a number of Australian apiarists and apicultural advisers.
5.6.4 The incidence of EFB was significantly related to the number of days of precipitation. Such
weather could be expected to restrict honey bee foraging.
5.7. Recommendations 5.7.1 That laboratory trials, using honey bee larvae, be conducted to ascertain the potential of
various dietary additives to control or prevent EFB. The procedures described in Chapter 86 enable researchers to conduct such trials under controlled conditions without the influence of a range of pollens and micro-climatic conditions.
5.7.2 That formal surveys be conducted over a number of years to obtain information on the
incidence of EFB and the interaction between environmental factors including weather/climate and apiarist management of colonies.
59

6. The influence of pH in the honey bee larval midgut on Melissococcus pluton
6.1 Introduction There has been some disagreement over the actual pH of the contents of the honey bee larval gut. Wardall (1982) showed that gut pH fluctuated between 5.0 and 7.2, while Bignell & Heath (1985) thought the pH was 7.5. Both Wigglesworth (1953) and Bailey (1961) indicated that gut pH ranged between 6.6 and 6.8. Nurse bees feed larvae with an acidic jelly that has a pH of 4.0. The jelly consists of secretions from both the mandibular and hypopharyngeal glands of nurse bees (Herbert & Shimanuki, 1983). Wigglesworth (1953) indicated that the natural buffering systems of honey bee larva maintained gut pH to ensure the catalytic activity of enzymes. The gut of the honey bee larva is the primary site where the bacterium Melissococcus pluton, the causative agent of European foulbrood (EFB) multiplies and causes infection. Variations in pH of the larval gut could influence the multiplication of M. pluton and therefore its pathogenic virulence on larvae. A possible link between the incidence of EFB and pH of the larval gut was recognised by Wardall (1982). He studied the high incidence of the disease in honey bee colonies pollinating blueberries (Vaccinium corymbosum L.) in Michigan, USA. He found that increased susceptibility to EFB was due to the relatively high pH of the blueberry pollen. He also demonstrated that the alkaline pH of blueberry pollen increased the midgut pH from the normal range of 5.0-5.5 to a higher range of 6.2-7.2. This higher range was similar to the pH of 6.5 which is the ideal culture media for the growth of M. pluton in vitro (Bailey 1957 and 1961). Wardall also demonstrated that bacterial populations in the larval gut fluctuated in response to pH and he effectively controlled EFB by feeding larvae with low pH pollen substitutes during critical periods in the disease cycle. Enthused by the work of Wardall (1982), Herbert and Shimanuki (1983) conducted trials and found the pH of incoming pollen and the resultant pH of worker jelly were not good indicators for predicting the occurrence of EFB. Their results agreed with similar experiments that showed that bees were able to buffer diets of a wide range of pH (4.1 to 8.0) and produce worker jelly with a narrow pH range of 4.0 to 4.3). Herbert & Shimanuki (1983) were unable to demonstrate significant differences between the pH of pollen and worker jelly in diseased colonies as opposed to healthy colonies. The comparison between the two major pH studies of Wardall (1982), Herbert and Shimanuki (1983) is difficult. Herbert and Shimanuki (1983) did not determine pH of the midgut but only the pH of honey bee worker jelly. In addition, the range of pH they studied was not as high as that studied by Wardall (1982). It is possible that the pH of bee collected pollen may vary according to the species of source plant or perhaps vary from plant to plant of the same species. Other factors such as soil type, pH, moisture and fertility may influence the pH of pollen. These factors may ultimately induce changes of pH in the larval gut and thereby influence multiplication of M. pluton. This chapter describes investigations designed to determine the pH of the midgut of honey bee larvae and the possible influence of pH on the growth of Melissococcus pluton.
60

6.2 Objectives 6.2.1 To determine the gut pH of honey bee larvae of honey bee colonies foraging on different flora.
6.2.2 To determine the influence of pH on the growth of M. pluton.
6.3 Methodology 6.3.1 pH of honey bee larval midgut contents 6.3.1.1 Location and selection of apiaries In autumn 2001, five commercial apiaries situated in central and western Victoria were selected. The location of each apiary and the flora on which bees were foraging are listed below:
Grampians Tea-tree (Leptospermum species) Messmate (Eucalyptus obliqua) Apple box (E. bridgesiana)
Lismore Sugar gum (E. cladocalyx) Pyrenees Ranges Longleaf box (E. goniocalyx) Trentham Manna gum (E. viminalis) Mount Cole Manna gum (E. viminalis)
6.3.1.2 Sampling of larvae Ten larvae, aged approximately 4-5 days, were sampled from each of 5 randomly selected colonies at each location. The gut was dissected from each larva and the pH of its contents was measured using a HI 8314 pH meter (Hanna, Australia) with a MI 413 combination pH electrode (Microelectrodes, USA). 6.3.1.3 Statistical analysis A fully nested or hierarchical ANOVA model was used to analyse results. This enabled the estimation of variance in the components and the expected means squares.
6.3.2 Effect of pH on the growth of M. pluton in-vitro M. pluton was cultured as described by Hornitzky & Smith (1998), except that 7% citrated sheep blood was added to the medium. M. pluton suspensions were prepared and streaked onto plates having the following pH:
• 4.0 - adjusted medium • 6.6 - conventional medium (Hornitzky & Smith, 1998) • 8.0 - adjusted medium.
6.3.3 Mortality associated with pH adjusted food fed to laboratory reared larvae Five groups of ten honey bee larvae were reared in the laboratory using the basic larval diet (BLD) described by Peng et al. (1992) and methodology described in Chapter 8. BLD fed to control larvae had a pH of 4.1. Sodium hydroxide and lactic acid was used to adjust the usual pH of BLD to form four feeding treatments of pH 3.1, 3.6, 4.6 and 5.1. The mortality of larvae attributed to each treatment was statistically analysed using a one-way ANOVA.
6.4 RESULTS 6.4.1 pH of honey bee larval midgut contents The grand mean of pH for all larval gut contents sampled at all five sites was 6.329. The mean pH of larval guts varied from site to site and ranged from 6.258 to 6.506 (Table 1).
61

Table 1. Mean pH of honey bee larval gut contents sampled from five colonies at various Victorian locations in autumn 2001
Honey bee colony number and mean gut pH Site number and location 1 2 3 4 5
Mean pH for each location
1. Grampians 6.556 6.419 6.197 6.205 6.177 6.311 2. Lismore 6.448 6.244 6.226 6.255 6.279 6.290 3. Pyrenees 6.651 6.474 6.497 6.434 6.476 6.506 4. Trentham 6.451 6.165 6.238 6.229 6.302 6.277 5. Mt. Cole 6.315 6.212 6.273 6.262 6.230 6.258
The difference in pH between all five sites was statistically significant (P=0.009). The variance component estimates indicated that site location, honey bee colony and replication of larvae made up 14.6, 13.7 and 71.7% respectively of the total variability. The main difference in the variability of the data was a result of the 10 replications of individual honey bee larvae sampled from each individual colony.
6.4.2 Effect of pH on the growth of M. pluton in vitro M. pluton grew well on culture at pH 6.6 but did not grow on pH 4.0 or pH 8.0 adjusted culture media.
6.4.3 Mortality associated with pH adjusted food fed to laboratory reared larvae Mortality of laboratory reared larvae fed pH adjusted food was pH 3.1, 0/10; pH 3.6, 0/10; pH 4.6, 1/10; pH 5.1, 0/10 and control pH 4.1, 1/10. The difference in mortality between treatment groups was not significant (P>0.05). Defecation was not delayed in larvae fed pH adjusted BLD when compared to control larvae. Microscopic examination of larvae that died during rearing indicated the absence of bacteria and confirmed that death resulted from natural causes.
6.5 DISCUSSION The grand mean pH of larval gut contents (pH 6.329) for all 5 locations was similar to the pH 6.5 of culture media used in M. pluton studies (Bailey 1957 and 1961). The greatest difference of pH measured at the 5 sites was 0.248 and occurred between sites 3 and 5. The pH of gut contents of honey bee larvae varied significantly (P<0.05) between apiary locations and we suggest that this was a result of honey bee foragers having access to different pollen and nectar resources at sites 1-4. Interestingly, sites 4 and 5 had the same nectar and pollen yielding plant species and even though they were approximately 100 km apart, the mean pH of larval guts was similar at 6.277 and 6.258 respectively (Table 1). We found a high variability between the pH of guts removed from larvae of a given colony (71.7%). The variability may have resulted from sampling larvae of different age (4 days versus 5 days of age); difficulty in obtaining sufficient volume of gut contents for pH determination and/or slight differences in the constituent of food fed to larvae by the nurse bees of the colony. If the results of Wardall (1986) illustrating the influences of pH on M. pluton growth in the larval gut are considered true, the high variability in the pH of larval gut contents within a hive and between apiary locations would render some larvae or colonies more susceptible to EFB. The laboratory studies demonstrated that M. pluton was sensitive to changes in pH of the culture medium. The bacterium grew well at pH 6.6 but adjustment of the medium to pH 4.0 and pH 8.0 resulted in no growth. The in vitro larval rearing studies illustrated that changes in pH of 1 base unit in the BLD did not result in significantly different (P>0.05) mortality of larvae between treatments. However, we point out that the number of larvae that died in each of the pH adjusted treatments was very low. Our results
62

indicate that larvae have a capacity to buffer their diet and consequently may not be adversely affected by changes in pH of larval food, as previously suggested by Wigglesworth (1953) and Herbert & Shimanuki (1983).
6.6 Recommendation That the influence of pH changes on the viability and growth of M. pluton within the larval gut be pursued using the larval assay described in Chapter 8. Laboratory rearing of honey bee larvae for European foulbrood studies.
63

7. An improved hemi-nested PCR assay for detection of Melissococcus pluton in honey bees and their products
7.1 Introduction European foulbrood (EFB), a serious disease of honey bee (Apis mellifera) larvae, is caused by the bacterium Melissococcus pluton. The disease mostly occurs in spring when the honey bee colony broodnest and adult bee populations are expanding. EFB is widespread in most honey producing countries of the world, but at the time of writing it had not been detected in Western Australia or New Zealand (Hornitzky and Wilson 1989). In most cases, apiarists are able to diagnose EFB in their hives with relative ease based on the presence of specific clinical symptoms. However, there are odd occasions where symptoms in the brood do not provide a clear indication of the presence the disease. When this happens, apiarists usually forward diseased honey bee larvae to a laboratory for confirmation of the presence of M. pluton. The following laboratory procedures have been used to detect M. pluton: • microscopic examination of carbol fuchsin stained smears of diseased larvae (Hornitzky and
Wilson 1989) • culture of infected larvae or honey (Hornitzky and Smith 1998) • scanning electron microscopy (Alippi 1991) • enzyme-linked immunosorbent assay (Pinnock and Featherstone 1984) • polymerase chain reaction (PCR) (Govan et al. 1998; Djordjevic et al. 1998a).
Although the above procedures are useful for routine laboratory diagnosis of EFB in diseased honey bee larvae, the detection of M. pluton in adult honey bees, honey and other honey bee products has proven to be extremely difficult. Epidemiological studies of M. pluton require an improved, more sensitive method for the detection of the organism in these items. Hornitzky and Smith (1998) considered the culture procedure to be both ineffective and inefficient for diagnostic purposes due to the fastidious growth requirements of M. pluton, the probability of culture contamination and the time involved with the procedure. They cultured M. pluton from 27 (6.2%) of 434 honey samples and 33 (94.3%) of 35 infected larval smears from eastern Australia. They stated that the procedure recovered 0.2% or less of M. pluton organisms present in the samples. Two polymerase chain reaction (PCR) protocols were developed for the detection of M. pluton in honey, honey bee larvae and pure cultures of the organism by Djordjevic et al. (1998a) and Govan et al. (1998). Govan et al. (1998) tested three bacterial species (Escherichia coli, Paenibacillus alvei, Staphylococcus aureus) to determine primer specificity but did not determine the sensitivity of the assay. Djordjevic et al. (1998a) described a hemi-nested PCR for which the amplification of the first generation product (primers MP1 and MP2) was shown to be specific for M. pluton when tested against 27 bacterial species, which were phylogenetically closely related to M. pluton or commonly cultured from honey bee hives. The first generation PCR was capable of detecting 1-10 organisms/ml, a level of detection considerably more sensitive than any other method. Djordjevic et al. (1998a) developed hemi-nested primers so they could be used to confirm the identity of the first generation amplification product and to enhance the assay sensitivity, especially when crude DNA templates were used for PCR. However, the sensitivity of the hemi-nested reaction (primers MP1 and MP3) was not determined. Furthermore, neither report examined the use of PCR for the detection of M. pluton in adult bees or bee products.
64
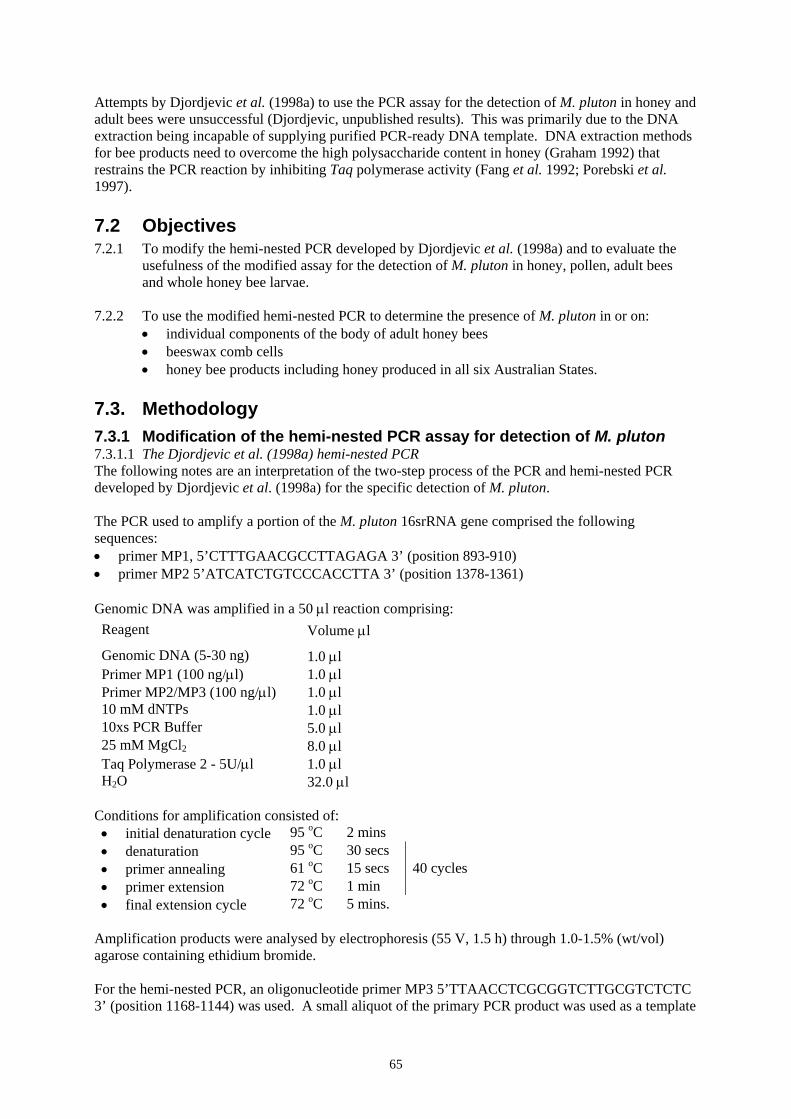
Attempts by Djordjevic et al. (1998a) to use the PCR assay for the detection of M. pluton in honey and adult bees were unsuccessful (Djordjevic, unpublished results). This was primarily due to the DNA extraction being incapable of supplying purified PCR-ready DNA template. DNA extraction methods for bee products need to overcome the high polysaccharide content in honey (Graham 1992) that restrains the PCR reaction by inhibiting Taq polymerase activity (Fang et al. 1992; Porebski et al. 1997).
7.2 Objectives 7.2.1 To modify the hemi-nested PCR developed by Djordjevic et al. (1998a) and to evaluate the
usefulness of the modified assay for the detection of M. pluton in honey, pollen, adult bees and whole honey bee larvae.
7.2.2 To use the modified hemi-nested PCR to determine the presence of M. pluton in or on:
• individual components of the body of adult honey bees • beeswax comb cells • honey bee products including honey produced in all six Australian States.
7.3. Methodology 7.3.1 Modification of the hemi-nested PCR assay for detection of M. pluton 7.3.1.1 The Djordjevic et al. (1998a) hemi-nested PCR The following notes are an interpretation of the two-step process of the PCR and hemi-nested PCR developed by Djordjevic et al. (1998a) for the specific detection of M. pluton. The PCR used to amplify a portion of the M. pluton 16srRNA gene comprised the following sequences: • primer MP1, 5’CTTTGAACGCCTTAGAGA 3’ (position 893-910) • primer MP2 5’ATCATCTGTCCCACCTTA 3’ (position 1378-1361) Genomic DNA was amplified in a 50 µl reaction comprising: Reagent Volume µl
Genomic DNA (5-30 ng) 1.0 µl Primer MP1 (100 ng/µl) 1.0 µl Primer MP2/MP3 (100 ng/µl) 1.0 µl 10 mM dNTPs 1.0 µl 10xs PCR Buffer 5.0 µl 25 mM MgCl2 8.0 µl Taq Polymerase 2 - 5U/µl 1.0 µl H2O 32.0 µl
Conditions for amplification consisted of: • initial denaturation cycle 95 oC 2 mins • denaturation 95 oC 30 secs • primer annealing 61 oC 15 secs 40 cycles • primer extension 72 oC 1 min • final extension cycle 72 oC 5 mins.
Amplification products were analysed by electrophoresis (55 V, 1.5 h) through 1.0-1.5% (wt/vol) agarose containing ethidium bromide. For the hemi-nested PCR, an oligonucleotide primer MP3 5’TTAACCTCGCGGTCTTGCGTCTCTC 3’ (position 1168-1144) was used. A small aliquot of the primary PCR product was used as a template
65

for the second generation reaction using the primers MP1 and MP3. An annealing temperature of 56
oC was used. 7.3.1.2 Modified Djordjevic et al. (1998a) hemi-nested PCR The hemi-nested PCR was carried out according to the protocol of Djordjevic et al. (1998a) with the following modifications. In each reaction the enzyme used was 1 Unit of Taq DNA polymerase (Roche Diagnostics, Germany) with 5 µl of its accompanying 10 x PCR buffer (100 mM Tris-HCl, 15 mM MgCl2, 500 mM KCL). The MgCl2 concentration of the first generation PCR was 3mM, and the nested reaction concentration was lowered to 1.5 mM MgCl2 to increase the sensitivity of the assay. All PCR amplifications were performed in a PCRExpress thermal cycler (Hybaid, UK). Amplification products were electrophoresed (80 V, 1.5 h) through 1-1.5% (wt/vol) agarose gel containing ethidium bromide and visualised using UV light. Both positive (M. pluton crude DNA) and water controls (DNA-free reactions) were included in every PCR experiment. In order to eliminate amplicon contamination, DNA extractions were conducted in a physically separated laboratory to that used to perform gel electrophoresis and aliquoting of PCR reagents. PCR reagents were prepared in a DF44 air-flow cabinet (Clemco, Australia) and separate pipettes fitted with aerosol tips were used for DNA extraction, electrophoresis and aliquoting reagents. UV lights were routinely used after reagent manipulations and different latex gloves were worn for each process. 7.3.1.3 Hemi-nested PCR specificity To test the specificity of the nested primers (MP1 and MP3) PCR amplification was attempted with DNA from a range of bacterial species (Table 1), including species phylogenetically related to M. pluton or commonly found in bee larvae (Cai and Collins 1994; Djordjevic et al. 1998a). The concentration of purified DNA was determined spectrophotometrically (Eppendorf biophotometer, Germany). To examine the DNA preparation for the evidence of degradation, an aliquot was electrophoresed through 1.0% agarose (55 V, 1 h). Purified DNA (70 ng) from each isolate listed in Table 1 was used as template DNA in the hemi-nested PCR. Water controls (DNA-free reactions) and positive controls (containing M. pluton DNA extracted from culture) were included in all reactions.
66

Table 1. Bacteria and DNA extraction protocols used to determine the specificity of primers (MP1 and MP3) used for the nested Melissococcus pluton PCR assay.
Bacteria DNA extraction method
Gram-positive bacteria
Melissococcus pluton Instagene matrix (BioRad, USA)
Paenebacillus larvae Djordjevic et al. (1998a)
Paenibacillus alvei Djordjevic et al. (1998a)
Spiroplasma melliferum Djordjevic et al. (1998b)
Enterococcus faecium Djordjevic et al. (1998a)
Enterococcus faecalis Djordjevic et al. (1998a)
Enterococcus faecalis (NTCC 775) Instagene matrix (BioRad, USA)
Enterococcus faecalis (ATCC 25619) Instagene matrix (BioRad, USA)
Erysipelothrix rhusiopathiae Djordjevic et al. (1998a)
Actinobacillus pleuropneumoniae Instagene matrix (BioRad, USA)
Bacillus laterosporus (ATCC 64) Instagene matrix (BioRad, USA)
Pseudomonas aeruginasa (NTC 10322) Instagene matrix (BioRad, USA)
Gram-negative bacteria
Pasteurella multocida Djordjevic et al. (1998b)
Pasteurella multocida (1096) Djordjevic et al. (1998b) 7.3.1.4 Sensitivity of the hemi-nested PCR A 1 in 10 serial dilution series from 10 ng/µl to 10 ag/µl (attogram/µl) (1x101 ng/µl - 1x10⁻⁸ ng/µl) was prepared using purified M. pluton DNA diluted in TE buffer (10 mM Tris-HCl, pH 8.0, 1 mM EDTA). From each of the ten tubes in the dilution series, 2 µl was used as template for the first generation PCR (primers MP1 and MP2). Using a 1 µl aliquot from the first generation reaction, a hemi-nested PCR assay was performed using primers MP1 and MP3.
7.3.2 Samples 7.3.2.1 Comparison of DNA extraction protocols for honey bee larvae and honey Fifteen, 4-5 day old larvae showing clinical symptoms of EFB and 25 ml of broodnest honey were collected from the one diseased colony (colony one, Table 4) using a sterile spatula. 7.3.2.2 Epidemiological studies Samples of adult honey bees, broodnest honey, broodnest pollen, larvae, plus brood comb cell wash samples were collected from one colony with EFB symptoms and nine apparently healthy colonies in areas where EFB was endemic (Table 4). The following sampling method was used: • larvae, broodnest honey and pollen were collected from comb cells using sterile spatulas • brood comb cell wash samples were obtained by soaking a sterile swab in sterile distilled water
(SDW) and rotating it in a single cell that contained a freshly laid egg. The swab was then agitated in 1 ml of SDW for 30 seconds to provide the sample
• adult bees were collected using sterile forceps and dissected according to the method of Dade (1962) to enable assay of individual body tissue (Table 4).
A total of 134 samples derived from the above procedures were assayed. In addition, 20 adult bees were obtained from one colony in Western Australia, a State in which EFB is not known to occur. These bees were dissected and only the digestive tracts were assayed (Table 4).
67

7.3.2.3 Prevalence of M. pluton in Australian honey A total of 86 samples of honey collected from all States (Table 4), primarily from bulk honey drums at commercial packing plants, were subject to PCR and culture for M. pluton. The 13 samples from Queensland were sourced from central and northern Queensland. This was done at the request of the RIRDC Honeybee R & D Committee to determine if M. pluton was present in honey produced in districts where EFB was not common unlike southern Australian States. A 25 ml sample of Western Australian honey was used as a negative control. A positive control was prepared by inoculating a duplicate honey sample with approximately 2.5x10⁴ cultured M. pluton organisms (Hornitzky and Smith 1998).
7.3.3 Confirmation of EFB and culture of M. pluton from honey samples EFB was confirmed in honey bee colonies by microscopic examination (mag. 1000x) of smears of diseased brood stained with carbol fuchsin (Hornitzky and Wilson 1989). Honey samples were cultured by the Elizabeth Macarthur Agricultural Institute, NSW, according to the method of Hornitzky and Smith (1998) except that the culture medium contained 7% citrated sheep blood.
7.3.4 DNA extraction protocols 7.3.4.1 Methods to extract DNA from honey For comparative DNA extraction studies, broodnest honey was heated in a water bath at 40oC and then thoroughly mixed with an equal volume of phosphate buffered saline (PBS). Fifteen 1.5 ml aliquots were pelleted by centrifugation (16,000 g, 20 m), then allocated evenly to the following three DNA extraction treatments:
a. Instagene protocol (BioRad, USA) as described by Djordjevic et al. (1998a) b. one chloroform:isoamyl alcohol extraction (CIAE) c. two CIAEs.
To perform the CIAE, samples were placed in individual eppendorf tubes that contained 200 µl of 2% CTAB buffer (hexadecyltrimethylammonium bromide, 1.4 M NaCl, 1% polyvinylpyrrolidone, 0.02 M ethylenediaminetetraacetic acid, 0.1 M Tris-HCl, pH 8.0) and incubated for 5 min at 65oC in a dry block heater (Xtron, Australia). CTAB extracts were purified using chloroform:isoamyl alcohol (24:1, v/v) (Goodwin et al. 1994). The nucleic acids were precipitated with 25 µl of sodium acetate (3 M, pH 5.2) and 400 µl of ice-cold ethanol (100%). The suspension was incubated at –20oC (20 m) and then centrifuged (16,000 g, 20 mins). The resultant supernatant was discarded and the pellet was washed twice with ethanol (70%), air dried and resuspended in 50 µl of TE buffer. DNA samples were then stored at –20oC and 2 µl was used in the PCR. For the honey samples, 25 ml of honey was heated to 40oC in a water-bath and then thoroughly mixed with an equal volume of PBS and centrifuged (27,000 g, 20 m). The supernatant was discarded and the pellet was resuspended in 2 ml of SDW. Of this solution, 1.5 ml was treated as described in the preceding paragraph and subjected to two CIAEs. 7.3.4.2 Methods to extract DNA from adult honey bee tissue Each individual sample of adult bee tissue (digestive tracts, hind legs, front legs, wings, mouthparts and rectums) was placed in an eppendorf tube with a small quantity of sterile acid washed sand (Unilab, Australia). Each sample of tissue was macerated with a sterile plastic micropestle in 200 µl of CTAB buffer and briefly vortexed (5 sec) followed by a single CIAE, except for adult bee digestive tracts which received a second CIAE. 7.3.4.3 Methods to extract DNA from honey bee larvae and pollen Whole larvae were prepared as for adult bee tissue, except that no acid wash sand was added. For comparative DNA extraction studies, fifteen whole larvae showing symptoms of EFB were collected from the one infected colony. Individual larval smears were prepared from 5 larvae and processed for PCR using Instagene as described by Djordjevic et al. (1998a). Five larvae were prepared using a single CIAE and 5 were subjected to a second CIAE.
68

DNA was extracted from pollen samples using the method for larval samples except that the samples were subjected to two CIAEs.
7.4 Results 7.4.1 Djordjevic et al. (1998a) hemi-nested PCR 7.4.1.1 Hemi-nested PCR specificity DNA extracted from the non-target bacteria listed in Table 1 (except for M. pluton) did not act as templates for the amplification of the 276bp (MP 1 and MP3) nested product, confirming the specificity of the nested primers for the M. pluton 16S rRNA gene. Patel et al. (1998) published the 16S rRNA genes from a diverse collection of Enterococcal species, but these sequences were not available at the time the MP1 and MP3 primers were designed by Djordjevic et al. (1998a). The alignment of our primers with Enterococcal sequences was undertaken as this species is the most closely related to M. pluton (Cai and Collins 1994). Therefore, if primers were likely to amplify DNA template from another bacterium it would be most likely to be an Enterococcal species. Alignment of the MP1 and MP3 primers with Enterococcal sequences demonstrated that these primers would not be capable of amplifying enterococcal 16S rRNA gene sequences using the PCR cycling conditions adopted in this study. This is a result of at least four nucleotide mismatches observed in the 3’ end of each of these primers with enterococcal templates (Table 2). Table 2. Alignment of the 16S rRNA gene sequences of enterococci with the hemi-nested primer
sequences (MP1 & MP3) for Melissococcus pluton Primers MP1 5’ CTTTGA ACGCCTTAGA GA 3’ MP3 5’TTAACCT CGCGGTCTTG CGTCTCTC 3’§ 893 910 1168 1144
M. pluton .CTTTGA ACGCCTTAGA GATAAGGTT. .TGCTTAACCT CGCGGTCTTG CGTCTCTCTG TA. E. dispar .CCTGGG GAGTACGACC GCAAGGTTG. .CGGCATCTCG CTAGAGTGCC CAACTAAATG AT. . E. pseudoavium .CCTGGG GAGTACGACC GCAAGGTTG. .GGCAGTCTCG CTAGAGTGCC CAACTAAATG AT. E. sulfureus .CCTGGG GAGTACGACC GCAAGGTTG. .GGCAGTCTCG CTAGAGTGCC CAACTAAATG AT. E. malodoratus .CCTGGG GAGTACGACC GCAAGGTTG. .GGCAGTCTCG CTAGAGTGCC CAACTAAATG AT. E. raffinosus .CCTGGG GAGTACGACC GCAAGGTTG. .GGCAGTCTCG CTAGAGTGCC CAACTAAATG AT. E. cecorum .CCTGGG GAGTACGACC GCAAGGTTG. .GGCAGTCTCG CTAGAGTGCC CAACTGAATG AT. E. casseliflavus .CCTGGG GAGTACGACC GCAAGGTTG. .GGCAGTCTCG CTAGAGTGCC CAACTAAATG AT. E. mundtii .CCTGGG GAGTACGACC GCAAGGTTG. .GGCAGTCTTG CTAGAGTGCC CAACTAAATG AT. E. hirae .CCTGGG GAGTACGACC GCAAGGTTG. .GGCAGTCTTG CTAGAGTGCC CAACTAAATG AT. E. saccharolyticus .CCTGGG GAGTACGACC GCAAGGTTG. .GGCAGTCTCG CTAGAGTGCC CAACTAAATG AT. E. seriolicidia .CCTGGG GAGTACGACC GCAAGGTTG. .GGCAGTCTCA CTAGAGTGCC CAACTTAATG AT. E. avium .CCTGGG GAGTACGACC GCAAGGTTG. .GGCAGTCTCG CTAGAGTGCC CAACTAAATG AT. E. durans .CCTGGG GAGTACGACC GCAAGGTTG. .GGCAGTCTTG CTAGAGTGCC CAACTGAATG AT. E. faecium .CCTGGG GAGTACGACC GCAAGGTTG. .GGCAGTCTTG CTAGAGTGCC CAACTGAATG AT. E. faecalis .CCTGGG GAGTACGACC GCAAGGTTG. .GGCAGTCTCG CTAGAGTGCC CAACTAAATG AT. E. gallinarum .CCTGGG GAGTACGACC GCAAGGTTG. .GGCAGTCTCG CTAGAGTGCC CAACTGAATG AT. E. columbae .CCTGGG GAGTACGACC GCAAGGTTG. .GGCAGTCTCG CTAGAGTGCC CAACTCAATG CT. E. solitarius .CCTGGG GAGTACGACC GCAAGGTTG. .GGCAGTCTTG CTAGAGTGCC CAACTAAATG AT.
§ MP3 primer sequence mapped against the reverse strand sequence.
7.4.1.2 Sensitivity of the hemi-nested PCR The 486 bp product was successfully amplified in serial dilutions of M. pluton DNA down to 200 fg. Sensitivity was increased 10-fold by the nested reaction, with the 276 bp product observed in the 20 fg dilution of template DNA (Figure 1). Lane 1 2 3 4 5 6 7 8 9 10 11 12 13
69

500 – 250 –
Figure 1 – Agarose gel electrophoresis (1.5%) of the second generation 276 bp PCR product using primers MP1 and MP3 from product of the first generation PCR (primers MP1 & MP2). The 276 bp hemi-nested product was amplified in lanes 2-8, which contained 20 ng, 2 ng, 200 pg, 20 pg, 2 pg, 200 fg and 20 fg of M. pluton DNA respectively. The hemi-nested PCR did not amplify detectable product when 2 fg, 200 ag and 20 ag of DNA was added (lanes 9-11). Lanes 12 and 13 being water controls contained no DNA.
7.4.2 Comparison of three DNA extraction protocols for larvae and honey The Instagene extraction protocol (Djordjevic et al. 1998a) was outperformed by the one CIAE and two CIAE protocols (Table 3). The two CIAE protocol yielded first generation product for all five larval (one faint product) and five honey samples. The one CIAE protocol yielded first generation product in four of five diseased larvae, but two of these products were faint.
70

Table 3. Results of comparative studies of three DNA extraction protocols for larvae and honey DNA extraction protocol Sample First generation
product1Second generation
product2
Djordjevic et al (19998a) (Lanes 12-16, Figure 2)
Larvae 1 Larvae 2 Larvae 3 Larvae 4 Larvae 5 Honey 1 Honey 2 Honey 3 Honey 4 Honey 5
-ve -ve -ve -ve -ve -ve -ve -ve -ve -ve
+ve +ve +ve +ve +ve -ve -ve -ve -ve -ve
One CIAE (Lanes 2-6, Figure 2)
Larvae 1 Larvae 2 Larvae 3 Larvae 4 Larvae 5 Honey 1 Honey 2 Honey 3 Honey 4 Honey 5
+ve +ve +ve +ve -ve +ve +ve +ve +ve +ve
+ve
Two CIAEs (Lanes 7-11, Figure 2)
Larvae 1 Larvae 2 Larvae 3 Larvae 4 Larvae 5 Honey 1 Honey 2 Honey 3 Honey 4 Honey 5
+ve +ve +ve +ve +ve +ve +ve +ve +ve +ve
1 First generation 486 bp M. pluton PCR product (primers MPI and MP2) 2 Second generation 276 bp M. pluton PCR product (primers MPI and MP3)
Lane 1 2 3 4 5 6 7 8 9 10 11 12 13 14 15 16 17 18 19 20
500 –
250 –
Figure 2 – Agarose gel electrophoresis (1.5%) of the first generation 486 bp PCR M pluton product using primers MP1 and MP2. The DNA fragment was amplified from DNA extractions from larvae and honey from a confirmed EFB infected colony. Lane 1, 50 bp molecular markers. Lanes 2-6, template amplified from larvae using chloroform extraction. Lanes 7-11, template amplified from larvae with two chloroform extractions. Lanes 12-16, no template amplified from larvae using Instagene (BioRad, USA) for DNA extraction. Lane 17, no template amplified from honey with template extracted using Instagene. Lane 18, template amplified from honey extracted using chloroform. Lane 19, 20 ng M. pluton DNA (positive control). Lane 20, water control (genomic DNA-free). 7.4.3 Epidemiological studies 7.4.3.1 Infected honey bee colony M. pluton template was amplified at the first generation PCR from 23 (63.9%) of 36 of the samples of larvae and honey collected from the infected colony. All 36 samples produced the second generation
71

product (Table 4). Figure 4 provides the results of a first generation PCR (primers MP1 and MP2) on individual body components of a single adult bee sampled from an infected colony. The first generation PCR amplified M. pluton template from the front and rear legs, wings, proboscis, ventriculus, rectum and honey crop. All bee components were positive in the second generation PCR (primers MP1 and MP3) except for digestive tracts of adult bees sourced from Western Australian. 7.4.3.2 Healthy honey bee colonies Thirteen (13.3%) of 98 samples yielded the first generation PCR product and 49 (50%) of the same samples yielded the second generation product (Table 4). M. pluton was not detected in adult bee mouthparts and legs, fresh cell washes or pollen. The digestive tracts of all 20 Western Australian honey bees were also all negative.
72

Table 4. Amplification of the M. pluton first and second generation PCR products from samples derived from honey bee colonies with differing EFB histories from endemic or EFB-free areas.
Colony number(s)
EFB disease status of colony
Type of sample (and number assayed)
486 bp M. pluton product present
276 bp M. plutonproduct present
1 Positive Brood comb cell wash (5) 2/5 5/5 (Endemic) Adult bee mouthparts (2) 2/2 2/2 Adult bee legs (2) 2/2 2/2 Adult bee rectum (2) 2/2 2/2 Broodnest honey (5) 5/5 5/5 Pollen (5) 3/5 5/5 Larval gut only (5) 2/5 5/5 Whole larva (10) 5/10 10/10
2, 3, 4 Negative (Endemic)
Adult bee digestive tract (12) 0/12 4/12
5 Larva (10) 2 /10 2/10 Broodnest honey (5) 5/5 5/5
Negative but adjacent to EFB infected colony Adult bee mouthparts (5) 0/5 0/5
(Endemic) Adult bee legs (5) 0/5 0/5 Adult bee rectum (5) 1/5 1/5 Brood comb cell wash (5) 0/5 0/5 Pollen (5) 0/5 0/5
6 Negative but positive three months prior (Endemic)
Broodnest honey (4) 2/4 4/4
7, 8, 9 Negative Larva (9) 0/9 9/9 (Endemic) Adult bee rectum (15) 0/15 8/15 Broodnest honey (3) 0/3 2/3
10 Larva (5) 0/5 5/5 Adult bee rectum (5) 0/5 4/5
Negative but previously treated
with antibiotic when positive
(Endemic)
Broodnest honey (5) 3 /5 5/5
11 Negative (EFB-free area, Western
Australia)
Adult bee digestive tract (20) 0/20 0/20
73

Figure 3. – Agarose gel electrophoresis (1.5%) of products of the first generation M. pluton PCR product using primers MP1 and MP2. The DNA fragments (Lanes 2-5, 7-9) were amplified from DNA extractions of components of a single adult honey bee sampled from a colony infected with EFB. Lane 1, 50 bp molecular markers. Lane 2, front legs. Lane 3, rear legs. Lane 4, wings. Lane 5proboscis. Lane 6, mandibles. Lane 7, ventriculus. Lane 8, rectum. Lane 9, honey crop. Lane 10,
igestiv
,
e tract of an adult bee sourced from Western Australia (DNA fragments not amplified). Lane
7 ey saT CR ass . p pl eas culture only yielded M. plut 2 (2 (Table 4). Most culture positive s elded a sparse growth of M. pluton ded a profuse f M. pluton a nly two s les that were pos e first generation P 4 Western A y samples were negative. Ho e first generation pr as amplified f ontrol (see 7.3.2.3) developed u ern Australian hon ulated with M. p T d PCR and honey culture results of bulk honey samples from rious Australian
p fragment) culture
d11, 20ng M. pluton DNA (positive control). Lane 12, negative controls (genomic DNA-free).
.4.4 Bulk honhe hemi-nested P
mples ay detected M
on from 2luton in 59 (68.6%) of sam
7.9%) of the same samples . Two s yiel
es of bulk honey, wher
amples yi sample growth ollnd these were the o
ustralian bulk honeamp itive in th
wever, thCR. Aoduct w
rom the positive cluton.
sing West ey inoc
able 4. Hemi-neStates.
ste va
Source of honey sample
Number of samples
No. and % M. pluton positive samples by PCR
(276 b
No. and % M. pluton positive samples by
Victoria New South Wales Queensland South Australia Tasmania Western Australia Total (number)
27 24 13 11 7 4
86
24 (89) 16 (67) 6 (46)
11 (100) 2 (29)
0 59
11 (40) 9 (39) 2 (15) 2 (17)
0 0
24 M. pluton was confirmed by PCR in honey samples sourced from Queensland beekeepers resident in Emerald, Clermont, Rockhampton and Townsville.
Lane 1 2 3 4 5 6 7 8 9 10 11 12
500 -
250 -
74

7.5 Discussion The additional stringency used in this protocol provided a reliable hemi-nested PCR assay for the specific detection of M. pluton in honey, pollen, honey bee larvae and individual body components of adult bees. The modified PCR was more sensitive for the detection of M. pluton in honey than the honey culture assay. The PCR detected M. pluton in 59 (69%) of 86 samples of honey obtained from Australian States, excluding Western Australia, but culture of the same samples resulted in the organism being detected in only 22 (28%) of the samples. The PCR confirmed the presence of M. pluton in 46% of honey samples sourced from central and northern Queensland honey producing districts. This indicated a wide spread distribution of M. pluton in these areas even though the disease is not generally as great a problem as it is in southern States. The use of a CIAE protocol for the recovery of DNA facilitated the detection of M. pluton in bee products and various bee components. However, a single CIAE produced a yellowish extract when used on bulk honey samples, pollen and adult bee digestive tracts due to the content of the sample. A second CIAE removed the discolouration and thus decreased PCR inhibitors by further removing impurities in the sample prior to the precipitation of DNA. This extra step resulted in more efficient amplification of the M. pluton PCR product. The common visualisation of the 486 bp first generation PCR product from broodnest honey (Table 4) suggests that the DNA extraction protocol used does effectively remove PCR inhibitors from honey samples. Increased amplification of M. pluton from honey may be achieved by increasing the sample size, PBS dilution factor and/or the centrifugation speed or time to produce a better formed pellet for CIAE. The oligonucleotide primers of the first generation (MP1 and MP2 based on the 16S rRNA gene) were shown to be specific for M. pluton by Djordjevic et al. (1998a). However, previous researchers were unable to compare 16S rRNA gene sequences from many of the enterococci since they had not been sequenced at the time of publication of their work. M. pluton is most closely related phylogenetically to the genus Enterococcus (Cai and Collins, 1994). The 16S rRNA genes from 18 different Enterococcus species were sequenced by Patel et al. (1998). Sequence analysis of enterococcal 16S rRNA gene sequences with primers MP1 and MP3 indicated that amplification of 16S rRNA gene sequences from enterococcal species is unlikely. Our data show that no product was amplified from E. faecalis and E. faecium templates (7.4.1.1). Consequently, the modified hemi-nested PCR is specific for M. pluton. All individual body components of adult bees, and pollen, brood comb cell washes and broodnest honey from the colony expressing EFB symptoms (Colony 1, Table 4) were shown to contain M. pluton. This occurred usually in the first generation PCR, which indicates that bees and bee products as well as diseased brood are a source of infection in diseased colonies. This work demonstrates that these same samples from healthy hives, except for brood comb cell washes and pollen, can also contain M. pluton and that apparently healthy hives may be a source of EFB. This however, did not apply to samples sourced from Western Australia where EFB has not been reported. Honey was also commonly infected with M. pluton and hence, is a constant supply of the organism to infect larvae in which the organism reproduces to later contaminate adult bees, comb cells and honey.
7.6 Conclusions 7.6.1 The detection of M. pluton in larvae, adult bee digestive tracts and rectums, and broodnest
honey sampled from healthy colonies confirmed the existence of sub-clinical populations of the bacterium (Table 4).
7.6.2 The Australian States with the highest percentage of samples of apiarist extracted honey infected with M. pluton were South Australia (100%), Victoria (89%) and New South Wales (67%) (Table 4).
75

7.6.3 Amplification products were not obtained from the samples of honey and adult bee digestive tracts sourced from Western Australia thereby supporting the assertion that this State is free of EFB.
7.6.4 This improved hemi-nested PCR being a more sensitive assay than culture for the detection of M. pluton, will be extremely useful for: • conduct of further epidemiological studies of EFB • determination of the efficacy of potential new EFB control measures • detection of M. pluton in bees and bee products where certification is required by export
markets.
76

8. Laboratory rearing of honey bee larvae for European foulbrood studies
8.1 Introduction Honey bees freely forage on a variety of nectar and pollen plants within their general flight range of 5-6 kilometres from their hive. This foraging behaviour is extremely beneficial to the health of the honey bee colony because it facilitates a balanced diet through a supply of various pollens, each contributing different amino acids, fatty acids, vitamins and minerals. However, the same free flying honey bee behaviour can make it difficult for some scientific experiments to deliver reliable information. For example, studies investigating supplementary diets for commercially managed honeybee colonies may be adversely influenced by various pollens which foraging bees bring to the hive. To alleviate this problem, some scientists have conducted experiments in insect proof enclosures to prevent bees gaining access to food sources that may adversely influence the outcomes of their research. There are other examples of external factors that can influence experiments. Studies on European foulbrood disease (EFB) in beehives may be somewhat hindered because it is not possible to guarantee that the disease will occur in an apiary or in any given year. In attempts to get around this problem, honey bee colonies have been inoculated with the causal organism of EFB, Melissococcus pluton. However, this approach has met with little success and as yet no reliable technique for transmission of EFB that causes clinical symptoms in honey bee larvae in laboratory or hive reared larvae has been developed. Laboratory reared larvae have been used in pathological studies of the honey bee brood diseases, chalkbrood and American foulbrood (Patel and Gouchnauer 1959 and Gilliam et al. 1978). A number of scientists investigating honey bee caste differentiation developed methodologies for rearing larvae in the laboratory (Weaver 1974; Shuel et al. 1978; Shuel & Dixon 1986). At the time of writing, there were no published reports indicating that laboratory reared larvae have been used in EFB studies. The majority of artificial diets for laboratory reared honey bee larvae are based on the components of royal jelly which is a combination of glandular secretions produced by nurse worker bees for feeding to larvae. Peng et al. (1992) developed a method for rearing larvae in American Foulbrood disease studies, and a basic larval diet (BLD) that contained protein (10.5%), solids (22%) and had a physical consistency to maintain moisture content while placed in incubation. The consistency enabled larvae to float on the BLD without drowning and this reduced the likelihood of mechanical damage that might have resulted from excessive handling and feeding. Peng et al (1992) reported an average larval mortality of 9.5% associated with their method. At present, there is no reliable method for introducing or causing EFB in honey bee colonies or laboratory reared larvae. Inoculation of honey bee colonies with M. pluton leads to variable infection results and is hampered by ejection of infected larvae from the hive by adult bees. The removal of larvae removes much of the pathogen from the disease cycle and may lead to the recovery of the colony (Bailey 1960). In addition, inoculated colonies often require artificial manipulation such as the removal of foraging adult bees (Bailey 1961), to increase their susceptibility to the disease. When honey bee larvae ingest food contaminated with M. pluton, the bacterium multiplies in the anaerobic conditions of the larval midgut where it causes disease and the proliferation of opportunistic bacteria. Although a number of studies on the virulence and pathogenicity of M. pluton have been conducted, mechanisms of pathogenesis and the role of secondary invaders in the development of the disease are not fully understood. Tarr (1938) conducted the first histopathology studies well before later studies determined the etiological agent of the disease and its culture requirements. He
77

determined that EFB was a purely intestinal infection that was localised in the food mass and within the peritrophic membrane interface. Bailey (1957) was the first to culture M. pluton despite the fastidious growth requirements of the bacterium. He demonstrated a quick decrease of M. pluton virulence in vitro, but also showed an increase in virulence following passage of the bacterium through a larval cycle or when the bacterium was grown in mixed culture (Bailey 1957, 1963; Bailey and Lochner 1968). Infectivity tests have confirmed that cultured M. pluton is capable of producing some pathological effects in larvae (Bailey 1957 and 1963; Bailey and Lochner 1968; Heimpel and Angus 1963) but greater pathological effects may occur when M. pluton obtained directly from naturally infected larvae is used (Tarr 1936; Bailey 1960 and 1963). This chapter describes a method for laboratory rearing of honey bee larvae that will allow researchers to have full control of the larval diet and environment in which the larvae develop without unwanted external influences. Histology studies are also described.
8.2 Objectives 8.2.1 To establish a reliable method for the inoculation of M. pluton in laboratory reared honey bee
larvae which would facilitate studies designed to: • improve understanding of M. pluton and EFB • investigate virulence of cultured M. pluton • determine M. pluton dose-mortality relationships in larvae • determine the role and influence of opportunistic bacteria associated with EFB.
8.2.2 To develop an assay for the evaluation of potential EFB control measures in M. pluton
inoculated laboratory reared honey bee larvae.
8.3 Methodology 8.3.1 Diagnosis of EFB in diseased colonies EFB was confirmed in honey bee colonies by microscopic examination (mag. 1000x) of diseased brood smears stained with carbol fuschin, as described by Hornitzky & Wilson (1989).
8.3.2 Culture of bacteria associated with European foulbrood M. pluton was cultured as described by Hornitzky & Smith (1998), except that the culture medium contained 7% citrated sheep blood.
8.3.3 Diet preparation, rearing larvae and observations 8.3.3.1 Preparation of basic larval diet (BLD) In all experiments, larvae were fed BLD according to the method of Peng et al. (1992). The diet was made with the following ingredients: 4.2 g freeze-dried royal jelly, 0.6 g glucose, 0.6 g fructose, 0.2 g yeast extract (difco) and 14.4 g sterile distilled water (SWD). BLD was prepared shortly before grafting and stored at 4oC until required. 8.3.3.2 Rearing and feeding honey bee larvae In all experiments, larvae, less than 24 hrs of age, were grafted from the same healthy colony using a specialised beekeeper grafting tool into a 3.5 cm diameter sterile cell culture plate (Nunclon, Denmark) that contained 3ml of BLD heated to 35OC. At 72 hrs of age, each larva was transferred by grafting tool to an individual concave bottomed cell (7 mm diameter, 0.3 ml volume) of a 96-well sterile serological plate (Nunclon, Denmark), containing 20 µl of BLD pre-heated to 35OC. Individual larva were then fed 5 µl of BLD at 84 and 96hrs, 10 µl at 108 and 120 hrs and then 25 µl every 12 hrs until defecation. BLD was heated to 35oC and then fed to larvae by pipette fitted with aerosol tips that were changed between each treatment. Immediately after the initial graft, larvae were placed in an incubator (Thermoline, Australia) at 35oC, with humidity provided by a tray of water for rearing.
78

8.3.3.3 Observations and confirmation of M. pluton Larvae were examined every 24 hrs for mortality and defecation. In all experiments, larvae that died were smeared on slides for examination by light microscope to determine presence and type of any bacteria. M. pluton was also confirmed in larval guts and food culture where necessary. 8.3.3.4 Confirmation of methodology Seven groups of 20 larvae were reared to the defecation stage using sterile BLD to determine potential problems associated with the rearing protocol that might result in injury of death of the larvae. In all experiments, batches of 16 control larvae, fed sterile BLD were included in each rearing period (Treatments 7, 14, 29, 30, 31 and 41; Table 1). 8.3.3.5 Estimating intake of BLD by in vitro larvae Twenty individual larvae were each grafted directly into their own individual cell of a serology plate. Each cell contained 10 µl of BLD. At 72 hours after grafting, each larva was transferred to another cell in a new sterile serology plate. Immediately after transference of a larva, excess BLD was removed from the vacated cell of the first plate using a known weight of warm SDW. The combined BLD and SDW was weighed and the amount of BLD consumed was calculated. The quantity of BLD fed to individual larvae as required from 72 hours after grafting was recorded to determine the total amount of BLD needed to successfully rear larvae to the stage of defecation.
8.3.4 Experiment 1. - Preliminary studies, inoculation of BLD with unknown concentrations of M. pluton derived from diseased material
Live larvae showing clinical symptoms of EFB and less than 4 days old were sampled from an EFB confirmed colony and their midguts smeared on glass microscope slides. The smears were stored for at least one month at ambient temperature to reduce the population and viability of any secondary bacteria, such as P. alvei. Then, using a sterile swab (IASA Spain), the contents of 45 slides were washed into 30ml of SDW to make a suspension containing M. pluton. Various quantities of this suspension were then added to SDW to form concentrations of 10, 20, 40, 60, 80 and 100%. These concentrations were then incorporated directly into the SDW component of the BLD, without altering the composition of the diet, to form six inoculation treatments (Treatments 1-6, Table 1) fed to batches of 16 larvae.
8.3.5 Experiment 2 - Mortality of larvae fed known concentrations of cultured M. pluton
M. pluton was transferred from culture to 2.5 ml of SDW using a bacteriologists’ loop prior to incorporation into BLD. M. pluton suspensions initially were made using saline, however as this resulted in the death of both control and treated larvae SDW was used instead. The number of M. pluton organisms in the suspensions was determined by hemocytometer (improved Neubauer, BS 748, England). Six individual treatment groups of 20 larvae (Treatments 8-13, Table 1) were each fed a BLD containing a specific concentration of M. pluton from grafting of the larvae to defecation. The BLD used in Treatments 10 and 12 was diluted (1:5) with SDW to increase stress on larvae and encourage their susceptibility to infection.
8.3.6 Experiment 3 - Mortality of larvae fed known concentrations of M. pluton derived from diseased material
Duplicate smears of 30 individual larvae exhibiting clinical symptoms of EFB were obtained. One smear of each duplicate was examined microscopically to determine the type and extent of bacterial populations. Six smears that appeared to contain high M. pluton monoculture populations were selected and their contents washed into 20ml of SDW, which was then thoroughly stirred. Serial dilutions (1:9) were then taken of the original inocula and the concentration of M. pluton in each was determined using a hemocytometer. The inoculations were used to prepare BLD to formulate Treatments 15-28 and 36-40 (Table 1). All treatment groups comprised 16 larvae.
79

8.3.7 Experiment 4 - Relationship between length of feeding of contaminated BLD and mortality of larvae
M. pluton obtained from diseased larvae was inoculated into BLD (2x10⁵ organisms/ml) and fed to larvae for 48, 72, 96 and 120 hrs post-grafting (Treatments 31,32, 33, 34; Table 1). Each treatment group comprised 16 larvae.
8.3.8 Histology of larvae Different aged larvae were taken from a colony that was naturally infected with EFB, a healthy colony and in vitro reared control and M. pluton infected larvae (2x10⁵ M. pluton organisms/ml in BLD). Larvae were taken by first flooding the individual comb cell with SDW that contained 10% formaldehyde and carefully extracting the larva to avoid physiological damage. Larvae were stored in the formaldehyde solution until required for sectioning. Vertical and horizontal sections of larvae were obtained. Larval sections were fixed using a general fixative containing HgCl2, then deparaffinised and hydrated with water to remove HgCl2. Sections were stained with Mallory I (1% acid fuchsin, C.I. 42685) for 15 seconds and rinsed in H20 for 10 or more seconds, then treated with 1% phosphomolybdic acid for 1-5 minutes and rinsed in distilled water.
80

Table 1. Source and number of M. pluton organisms in BLD fed to laboratory reared larvae – Experiments 1, 2,3 and 4.
Rearing Period Treatment number
Source of M. pluton used in inoculation
Concentration of M pluton in BLD (organisms/ml)
Experiment 1. Inoculation of BLD with unknown concentrations of M. pluton from diseased material 1 1 Diseased larvae Unknown 1 2 Diseased larvae Unknown 1 3 Diseased larvae Unknown 1 4 Diseased larvae Unknown 1 5 Diseased larvae Unknown 1 6 Diseased larvae Unknown 1 7* Control -
Experiment 2. Mortality of larvae fed known concentrations of cultured M. pluton 2 8 Culture 1.7 x 10⁴
2 9 Culture 1.3 x 10⁶
2 10** Culture 1.3 x 10⁶
2 11 Culture 6.4 x 10⁵
2 12** Culture 6.4 x 10⁵
2 13 Culture 1.1 x 10⁹
2 14 Control -
Experiment 3. Mortality of larvae fed known concentrations of M. pluton derived from diseased material 3 15 Diseased larvae 2.0 x 10⁷
3 16 Diseased larvae 2.0 x 10⁶
3 17 Diseased larvae 1.1 x 10⁶
3 18 Diseased larvae 2.0 x 10⁵
3 19 Diseased larvae 1.1 x 10⁵
3 20 Diseased larvae 2.0 x 10⁴
3 21 Diseased larvae 2.0 x 10³
3 22 Diseased larvae 2.0 x 10²
3 23 Diseased larvae 2.0 x 10²
3 24 Diseased larvae 2.0 x 101
3 25 Diseased larvae 2.0 3 26 Diseased larvae 2.0 3 27 Diseased larvae 0.2 3 28 Diseased larvae 0.2 3 29 Control - 3 30 Control - 5 36 Diseased larvae 5.0 x 10⁴
5 37 Diseased larvae 7.5 x 10⁴
5 38 Diseased larvae 1.2 x 10⁵
5 39 Diseased larvae 1.5 x 10⁵
5 40 Diseased larvae 1.7 x 10⁵
5 41 Control -
Experiment 4. Relationship between length of feeding contaminated BLD and mortality of larvae 4 31 Control - 4 32 Diseased larvae 2.0 x 10⁵ (<48hrs) 4 33 Diseased larvae 2.0 x 10⁵ (<72hrs) 4 34 Diseased larvae 2.0 x 10⁵ (<96hrs) 4 35 Diseased larvae 2.0 x 10⁵ (<120hrs)
* all control treatments fed a sterile diet ** denotes treatments whose BLD was diluted 1:5 with SDW.
8.4 Results 8.4.1 Diet preparation, rearing larvae and observations 8.4.1.1 Confirmation of methodology
81

Larvae were successfully reared to the defecation stage using the BLD of Peng et al. (1992) and the protocol outlined in 8.3.3.2. Mortality in the seven groups (1-7) of twenty larvae reared to the defecation stage was 5, 10, 5, 0, 5, 10 and 10% respectively. Examination of the midgut contents of these dead larvae indicated the absence of bacteria. 8.4.1.2 Examination of control treatments – Experiments 1-5 Microscopic examination of midgut smears of control in vitro reared larvae in Experiments 1-4 (Treatments 7, 14, 29, 30, 31 and 41; Table 1) indicated the absence of bacteria. 8.4.1.3 Estimation of intake of BLD by in-vitro larvae Larvae were estimated to consume 164 µl of BLD from the time of grafting until the stage of defecation.
8.4.2 Experiment 1. - Preliminary studies, inoculation of BLD with M. pluton derived from diseased material
High mortalities occurred in all treatment groups fed BLD inoculated with M. pluton suspensions (Treatments 1-6, Table 2). All treated larvae that died contained substantial populations of M. pluton that occurred predominantly in natural clusters of singular bacteria. Paenibacillus alvei was also present in all larvae that died post 72 hrs after grafting and in 68.8, 68.8, 66.7, 50.0, 60.0 and 54.5% of larval smears of Treatments 1, 2, 3, 4, 5 and 6 respectively. Defecation by control larvae occurred around 168 hrs, while surviving larvae that were fed inoculated BLD did not defecate until after 192 hrs.
8.4.3 Experiment 2. - Mortality of larvae fed known concentrations of cultured M. pluton
Table 2 presents data on the mortality of laboratory reared larvae fed cultured M. pluton (Treatments 8-13, Table 1). Microscopic examination of larval midguts confirmed the existence of M. pluton in all inoculated treatments. The numbers of M. pluton appeared proportional to the numbers of organisms in the inoculation suspensions. The characteristic cultured M. pluton chains decreased in length over the larval rearing period. In this experiment, M. pluton not observed in its natural clusters of singular lanceolate bacteria, as often seen in smears of 2-3 day old diseased larvae sampled from naturally infected colonies (Bailey and Ball, 1991).
8.4.4 Experiment 3. - Mortality of larvae fed known concentrations of M. pluton derived from diseased material
Table 2 provides data on the mortality of larvae fed different concentrations of M. pluton that was obtained from diseased material (Treatments 15-28, Table 2). Table 3 contains data on the concentration of M. pluton in BLD, age of larvae at the time of defecation and number of surviving larvae per treatment group. Microscopic examination of the midgut contents of larvae that died confirmed the presence of M. pluton in all larvae except the following: (i) one larva that died at 168 hrs in treatment 22, (ii) one larva that died at 192 hrs in treatment 24, and (iii) the only larvae that died in treatments 25 and 26. It is presumed these larvae died from other causes than EFB. P. alvei was not observed microscopically in any of the larvae in Treatments 15-28 or 36-40. Data obtained from treatment groups 18-23 and 36-40 were used to establish the following linear relationship between the inoculation concentration of M. pluton and larval mortality (Figure 1, Table 2).
Mortality (%) = 4.05x10⁻⁴(concentration M. pluton) + 6.32 The high correlation coefficient (r=0.96) of the above linear relationship confirms the existence of a clear dose-relationship between number of M. pluton organisms in the BLD and the mortality of larvae (Figure 1). From the above equation, mean lethal doses can be extrapolated, with LD50 = 1.08x10⁵ and LD100= 2.31x10⁵ M. pluton organisms/ml.
82

Table 2. Mortality of laboratory reared larvae; treatment number, age and number of dead larvae each 24hrs from grafting until defecation
Age and number of dead larvae Treatment Number
24 hours
48 hours
72 hours
96 hours
120 hours
144 hours
168 hours
192 hours
216 hours
Mortality (%)
1 1 9 3 3 100 2 1 3 5 3 2 2 100 3 1 1 3 4 3 3 93.8 4 2 2 1 5 62.5 5 2 1 2 2 1 2 62.5 6 1 2 4 4 68.8
7* 1 1 1 18.8 8 1 1 10.0 9 3 1 20.0
10 2 10.0 11 1 5.0 12 1 1 10.0 13 1 2 1 20.0
14* 1 5.0 15 1 12 2 93.8 16 1 12 2 93.8 17 1 7 2 3 81.3 18 1 3 2 9 93.8 19 2 2 2 37.5 20 2 12.5 21 3 18.8 22 1 1 1** 18.8 23 2 12.5 24 1 1** 12.5 25 1** 6.3 26 1** 6.3 27 0 28 0
29* 1 6.3 30* 0 31* 1 6.3 32 3 18.8 33 2 3 1 37.5 34 3 4 43.8 35 4 5 5 87.5 36 4 4 50.0 37 2 4 37.5 38 2 1 1 2 2 50.0 39 4 3 2 2 68.8 40 2 4 1 3 2 75.0 41 1 1 12.5
* denotes control treatment groups fed sterile BLD ** denotes larvae that died from causes other than European foulbrood. Table 3. Treatment number, concentration of M. pluton in BLD, age at time of defecation and
number of surviving larvae
Treatment Concentration of Number of larvae and age at defecation Number of
83

Number M. pluton in BLD (organisms/ml)
168 hours 192 hours 216 hours surviving larvae
15 2.0 x 10⁷ 1 1 16 2.0 x 10⁶ 1 1 17 1.1 x 10⁶ 3 3 18 2.0 x 10⁵ 1 1 40 1.7 x 10⁵ 4 4 39 1.5 x 10⁵ 5 5 38 1.2 x 10⁵ 1 7 8 19 1.1 x 10⁵ 10 10 37 7.5 x 10⁴ 4 1 10 36 5.0 x 10⁴ 6 2 8 20 2.0 x 10⁴ 3 4 7 14 21 2.0 x 10³ 7 6 13 22 2.0 x 10² 4 6 3 13 23 2.0 x 10² 2 6 5 13 24 2.0 x 101 7 7 14 25 2.0 14 1 15 26 2.0 13 2 15 27 0.2 16 16 28 0.2 16 16 29 Control 16 16 30 Control 16 16 31 Control 15 15 32 2.0 x 10⁵
(<48hrs) 8 5 13 33 2.0 x 10⁵
(<72hrs) 5 5 10 34 2.0 x 10⁵ (<96hrs) 2 7 9 35 2.0 x 10⁵ (<120hrs) 2 2
84

Figure 1. – Relationship between the concentration of Melissococcus pluton in the basic larval diet and mortality of larvae (Treatments 15-28 and 36-40).
8.4.5 Experiment 4. - Relationship between the period of feeding of contaminated BLD and mortality of larvae
Substantial populations of M. pluton were observed in larvae that died during Experiment 4 (Treatments 32-35, Table 2). M. pluton infection delayed the time of defecation by 24-48 hours (Table 3).
85
A clear relationship existed between the number of hours of feeding of M. pluton inoculated BLD (2x10⁵ organisms/ml) to larvae and larval mortality (r=0.92), as demonstrated by Figure 2 and the following linear relationship:
Mortality (%) = 0.62 (hours of feeding of contaminated BLD) – 2.86
0
20
40
60
80
100
0 20 40 60 80 100 120 140Period of time (hrs)
Mor
talit
y (%
)
0102030405060708090
100
0 50000 100000 150000 200000Concentration of M. pluton (organisms/ml)
Mor
talit
y (%
)
Figure 2. - Relationship between the number of hours of feeding of M. pluton inoculated BLD (2x10⁵ organisms/ml) and mortality of laboratory reared larvae.

8.4.6 Histology of larvae 8.4.6.1 Larvae derived from honey bee colonies Examination using a compound light microscope of all histological sections of larvae sampled from the healthy colony indicated absence of bacteria. The peritrophic membrane (gut lining) of these larvae was distinct and intact (Figures 3 & 4). Larvae sampled from an EFB diseased colony contained substantial populations of bacteria in the food mass and within the food mass/gut-peritrophic membrane interface (Figure 4). 8.4.6.2 Laboratory (in vitro) reared larvae Control larvae were free of bacteria. The anatomical and physiological structure of control larvae appeared identical to those sampled from a healthy colony. Larvae fed BLD with M. pluton, contained substantial bacterial populations within the larval food mass and peritrophic membrane (Figures 4 & 5) and exhibited clinical symptoms of EFB identical to those of naturally infected larvae. Figure 4 (a and b) illustrates a similar effect resulting from M. pluton infection in a naturally infected hive larvae and an in vitro reared larva fed BLD containing the bacterium.
Figure 3. – The pertitrophic membrane of the gut of a healthy larva of about 3 days old (mag. 1000x). Note the absence of bacteria from the food mass and the intact and distinct internal lining of the peritrophic membrane of the gut.
Peritrophic membrane
Food mass
86

(a)
(b)
(c)
Figure 4. - (a). Healthy larva. A 3 day old longitudinal sectioned larva sampled from a healthy colony. ote the well formed peritrophic membrane. (b). EFB infected larva. A 3 day old longitudinal
sectioned larva sampled from an EFB-confirmed colony. Note the disintegrating peritrophic mbrane that has been invaded by bacteria. (c). In vitro reared larva. A 3 day old in vitro reared
5
Head
Peritrophic membrane
Food mass
Mid intestine
Head
N
melongitudinal sectioned larva that had been fed an M. pluton contaminated diet (2x10 organisms/ml). Note the infected and disintegrated peritrophic membrane, which is similar to the naturally infected larva of (b).
Peritrophic membrane
Food and bacterial mass
Mid intestine
Head
Peritrophic membrane
Food and bacterial mass
Mid intestine
87

88
Gut contents
Peritrophic membrane
Melissococcus pluton
Figure 5. – The peritrophic membrane (mag. 1000x) of a 3 day old in vitro reared larva fed aontaminated diet (2x10
M. pluton pluton along and within
essfully reared in the laboratory from an age of less than 24 hrs ntil defecation and the onset of pupation. Fully grown larvae, although reared in plastic cells, were
an be very susceptible to M. pluton derived iseased material.
mortality of .5% obtained by Peng et al. (1992). The unusually high mortality of control group 7 (Table 2) is
ations in
bles
econdary infection by this organism was possible in laboratory reared larvae. This may be due to the substantial reduction in diseased smears used to prepare inoculations in Treatments 15-28 and 32-40
5 organisms/ml). Note the presence of the cocci M.cthe peritrophic membrane, which is disintegrating as a result of infection.
8.5 Discussion In these experiments, larvae were succuobserved spinning cocoons. Laboratory reared larvae were successfully inoculated with M. pluton obtained from naturally infectedlarvae; they exhibited clinical symptoms of EFB identical to those of naturally infected larvae. This was proven by the histological sectioning, culture and microscopy of both natural and in vitro reared larvae that were infected with M. pluton. The results obtained by these experiments were similar to those of Tarr (1936) and showed that honey bee larvae cd In designing our experimental methodology, the mean mortality of laboratory reared larvae fed sterile BLD (7.3.2.2) was 8.1% (range 0-18.8%). This figure was a little lower than the average 9attributed to deaths that resulted from mechanical damage and/or drowning of larvae in the BLD. Microscopic examination of midguts of control larvae confirmed the absence of bacteria and confirmed freedom of cross-contamination between treatment groups and high bacterial popullarvae from the donor colony. The inoculation of laboratory reared larvae with suspensions of M. pluton derived from naturally diseased larvae (Experiment 1) proved to be very effective in causing disease (Treatments 1-6, Ta1 and 3). Substantial M. pluton populations were observed in these larvae. In addition, bacterial populations appeared identical in terms of numbers and physiological arrangements in the gut of naturally infected larvae sampled from a colony with EFB. P. alvei was only observed in midgut smears of Treatments 1-6 (Experiment 1) confirming that s

and the lower numbers of M. pluton in the larval diet of these latter treatments. It may also be possiblethat the level of M. pluton infection in larvae of treatments 15-28 and 32-40 may have been insufficient for the development of opportunistic bacteria such as P. alvei. Inoculation of BLD with a maximum of 1.1x10
) ough substantial populations of M.
pluton were confirmed in larval gut smears. Examination of these smears indicated that cultured M. d consequently had little virulence. These results agree with Bailey
und M. pluton may have contributed
al ne with increases in the
Som the infection to reach defecation and pupation even though they e variability in M. pluton multiplication or henhasso on of food resources between larva and bacteria and the consequent starvation of larvae. At all times in these experiments, larvae were provided with food
nd this limited or negated the effect suggested by Bailey.
y ical
s.
Defecation and subsequent pupation occurred 24 to 48 hours later in laboratory reared larvae infected with M. pluton than in control larvae (Table 3). This indicates that M. pluton can cause a delay in the growth and developmental of larvae. In addition to the death of larvae in an infected colony, a longer than normal larval development period would also contribute to a slower than normal adult bee population build-up which commonly occurs in spring. It could also result in a requirement for additional food resources to be supplied to larvae by the colony.
8.6 Conclusion The procedures described in this chapter form an exciting new assay that will enable fully controlled experiments involving honey bee larvae to be conducted in the laboratory. Such studies can include the effect of nutrition and other potential treatments identified for the control of diseases affecting larvae. The assay removes the necessity for field or caged trials. The honey bee colonies used in these trials have invariably been adversely influenced by uncontrollable factors such as variable pollen and nectar resources, weather conditions and other honey bee diseases. In comparison to field trials the assay can also deliver results more quickly and at less cost. The successful rearing of honey bee larvae and the inoculation of larvae in vitro also eliminates the necessity for inoculations of honey bee colonies in the field, a method that is fraught with variable infection results and influenced by ejection of diseased larvae (Bailey 1960).
9 cultured M. pluton organisms/ml (Experiment 2resulted in low mortality. The highest mortality was 20% even th
pluton was not multiplying an(1963) and Bailey & Lochner (1968). Of those larvae that died during rearing, 50% of those fed 20 organisms/ml and 80% fed 200 organisms/ml contained substantial populations of M. pluton and their death is attributed to EFB infection. This result suggests a very low minimum infectious dose or a high susceptibility of larvae to EFB in vitro. Although the honey bee colonies that supplied larvae for grafting appeared healthy, based on examination of the brood and microscopic examination of larval smears, the presence of M.pluton in grafted larvae cannot be fully ruled out. Such backgroto the infection and development of EFB in the larvae. A relationship (r=0.92) between the duration (length) of feeding BLD containing M. pluton and larvmortality was established. As expected in both cases, mortality increased in lidose of M. pluton or duration of feeding BLD containing M. pluton.
e larvae in Treatments 15-18 survived were fed high numbers of M. pluton. This suggests somost susceptibility that may result from genetic differences in M. pluton, and/or its host, or anced defence mechanisms in some larvae. Bailey (1983) suggested that the pathogenic effect ciated with EFB was caused by the competiti
supplies surplus to their requirements aBecause larvae had sufficient food, it is suggested that the pathogenic effect may be a result of other mechanisms, such as invasion of the peritrophic membrane by M. pluton as confirmed by the histologof infected larvae in these experiments. Invasion of this membrane by M. pluton causes physiologdamage that may lead to an incapacity for larvae to uptake adequate nutrition from their food mas
89

The new assay can now be implemented for conduct of additional and prec• pathogenic mechanisms of M. pluton
uence of secondary organisms associated with EFB ssment of new EFB control measures including alternative antibiotics and fatty acids. T
s would involve application of new control measures to honey bee larvae infected with a rmined number of M. pluton organisms.
ise scientific studies on:
• infl• asse hese
test pre-dete
tion ffect
8.7 RecommendaThe research team recommends that in the future, research projects designed to investigate the eof nutrition and other potential treatments for the control of diseases affecting honey bee larvae include initial studies based on this assay followed by additional field studies where appropriate.
90

9. A s
st confirmed in South
ride (OTC) became widely used as a control measure and at the time of writing was the only chemical registered for control of the
inated honey, some apiarists have experiment with: • honey bee colony management techniques to reduce the incidence of EFB and t id the
need to apply OTC • OTC to avoid or lower the risk of residues occurring in extracted
hone While so documented in industry journals and presented at various industry conferences, it was considered that a formal, comprehensive survey would help to
control of EFB, and in addition, indicate areas for further
9.2 Two que• apiar ine hydrochloride (OTC) • non- A pilot su api sts w n dments were made to the questionnaires and the final version of each was then w nter 1999 to 190 Vict o owne 00 or more hives and were registe t Natural Resources and Environm lian Honey Bee Indu ki ly arranged for copies of the two questionnaires to be distributed to selected Tasmanian apiarists in
ing 1
Data obtained from manian responses was collatState basis. A small number of responses received from w ts following distribution of a limited number of questionnaires to those States by AHB t included was to too small to represent m
9.3 RThe two questionnaires and responses are presented on the following pages. Responses for a
articular question are found immediately below the question. The percentage and number of respondents for each question or option of a multiple choice question is provided on a State basis. Some questions relating to quantity, type of antibiotic carrier and OTC doses failed to deliver precise and useful information. Consequently, these questions and accompanying responses are not included in this report.
tudy of apiarists’ use of oxytetracycline hydrochloride and management of European foulbrood
9.1 Introduction European Foulbrood (EFB), a bacterial honey bee brood disease, was firAustralia and Victoria in 1997. The disease spread quickly and caused serious losses of honey beecolonies and honey production. The antibiotic, oxytetracycline hydrochlo
disease. In response to the demand of world honey markets for supply of uncontam
hereby avo
applications and doses in ordery.
me of this information has already been
identify various industry practices for the earchres .
Methodology ped: stionnaires were develo
ists’ use of oxytetracyclantibiotic management of European Foulbrood disease.
rvey using draft questionnaires and several ari as co ducted. Some amen mailed during i
orian apiarists wh d 1 red with the Departmen ofent. The Austra stry Council (AHBIC) nd
spr 999.
Victorian and Tas ed and presented on an individual Queensland and Ne South Wales apiaris
IC were noin the Results section because their number anagement trends.
esults
p
91

Department of Natural Resources and Environment
A SURVEY OF APIARISTS’ USE OF OXYTETRACYCLINE (OTC) Introduction This surv y som on’t have residues in their honey wh The inform o determindustry’ turn dustry to avoid OTC residues in the fut omestic and export markets.
te: T al. ividu
Use o1. hives?
No. of respondenVictoria
Tasmania
ey is being conducted to identify reasons when they use
e apiarists d oxytetracycline hydrochloride.
s current ‘Best Practice’ use of OTC. This inure and thereby protect valuable d
ation will help tmay help in
ine
No he information you provide is “Commercial-in Confidence” and will be kept strictly confidentiInd al apiarists will not be identified in any report arising from this survey.
f OTC Do you use OTC to prevent or control Foulbrood in your ts No. of respondents
Yes. Plea rocse p eed with thee
54 (79%) 0%) questionnair
12 (10
No. The ain rem ing questions there is no need to p
14 (21%) do not apply to you; roceed
0
Time of OTC treatment of hives2. What are the approximate months y y treat your hives with OTC?
The number of respondents by State and month in which the primary application of OTC for
Tasmanian respondents
ou would usuall
the beekeeping season was applied are presented in the following table. Victorian respondents
July 4 July-August 2
tember 7
September-OctSeptember-Novemb
y-S August-Se 1 August-O 3 September 1 September-October 5 October-Novem er 1
August 11 August-Sep
October
August-October 1 September 9
ober 4 er 4
Jul
3
eptember 1 ptember
ctober
b
3. At the beginning of the season in late winter or earlyyour hives with OTC?
spring, when would you usually treat
Tasmania No. of respondents
Victoria No. of respondents
Before EFB disease signs (symptoms) are seen in your hives
19 (38%) 5 (42%)
Only when EFB disease signs (symptoms) are present in your hives
31 (62%) 7 (58%)
92

4. At the beginning of the season, during late winter or early spring, when you observe EFB disease signs (symptoms) in any one load or ya u t No. o ents No. nts
Tasmania
rd, what hives do yof respond
reat with OTC? of responde
Victoria
Spot treat only those hi s showing EFB vesymptoms
24 (49%) 0
Blanket tre ther symptoms are present hive?
at all hives whe or not in every
2 12 ( %) 5 (51%) 100
5. What is the approximate average period of time from date of treatment of hives at the extraction of honey?
The number of respondents by State and period atm st extraction of honey are presented in the followi
Tasmanian respondents
beginning of the season in late winter or early spring to the first
(weeks) between treng table.
ent of hives and fir
Victorian respondents
4-8 weeks 1 5-6 weeks 2 6 weeks 6 6-7 weeks 1 6-8 weeks
10-12 weeks 1 11 weeks 1
8-10 weeks 3 12 weeks 3
4 -9 weeks 1
7 weeks 2
8 weeks 9 8-10 weeks 5
12 weeks 3 12-16 weeks 15-20 weeks 1
ks 2 eks 1
7 weeks 8 weeks 1
16 weeks 1 eek
1
6
7-8 weeks 1 7-10 weeks 1
16 wee16+ w
7-17 weeks 1 e
1 18 w s 1
6. When there is a need to treat hives with OTC at any other time of the year (that is, apart from late winter or early spring) what hives do you treat? No. of respondents
Victoria No. of respondents
Tasmania
Spot treat only those hives showing EFBsymptoms
45 (94%) 10 (100%)
Blanket treat all hivesare present or not in ev
whether symptoms ery hive?
5 (6%) 0
Method of feeding OTC 7. When you treated your hives with OTC in late you in
a single feed or did you divide the dose and ap s? No. of respon No. of respondents
Tasmania
winter or spring did ply it over three feed
apply the antibiotic
dents Victoria
One feed - single dose 39 (83%) 3 (25%) Three feeds - multiple dose 8 (17%) 9 (75%)
93

8. How did you feed OTC to your hives? No. of respondents
Victoria No. of respondents
Tasmania
Liquid - wet treatment Go to question 9 16 (31%) 1 (8%) Powder - dry treatment Go to question 14 34 (65%) 11 (92%) In pollen supplement Go to question 18 1 (2%) 0 In a patty Go to question 18 1 (2%) 0
Feeding OTC in liquid ‘wet treatment’ form 9. How did you mix and apply OTC as a liquid “wet treatment”?
No. of respondents No. of respondents Victoria Tasmania
Dissolved in sugar syrup 12 (75%) 1 (100%) Dissolved in water 4 (25%) 0
10. I hives in sugar syrup how mu nd water did make t
No. of respondents Victoria
No. of respondents Tasmania
f you fed OTC to your ch sugar a you use tohe syrup?
One part sugar, one part water (1:1) 6 (76%) 1 (100%) Two parts sugar, one part water (2:1) 1 (12%) 0
One part sugar, four parts water (1:4) 1 (12%) 0
11. Where did you pour or sprinkle the liquid ‘wet’ treatment in the hive. (See also next question). No. nts
Victoria No. of respondents
Tasmania of responde
On the bees and top bars of the frames inthe broodnest
11 (85%) 1 (100%)
In the honey super(s) 0 0 Into brood combs 2 (15%) 0
12. I ox broodnest, into which box did you app No. of respondents
Victoria No. of respondents
Tasmania
f you treated a hive that had a double b
ly the liquid?
Lower box 9 (69%) 0 Lower and second box 1 (8%) 0 Second box 3 (23%) 1 (100%)
94

13. Did you lift the queen excluder before you put the liquid into the broodnest?
Victoria Tasmania No. of respondents No. of respondents
Yes, lifted queen excluder and replaced it immediately after treatment
8 (53%) 0
Queen excluder not lifted 0 0 Queen excluder not used 1 (100%) 7 (47%)
P
No. of respondents No. of respondents
roceed to question 18
Feeding OTC in powder ‘dry treatment’ form 14. How did you mix and apply OTC as a powder (dry treatment)?
Victoria Tasmania
Mixed in caster sugar 18 (51%) 5 (45%) Mixed in plain sugar 2 (6%) 0 Mixed in icing sugar 5 (14%) 6 (55%) Commercia
rl OTC product that required ixin
10 (29%) no furthe m g
0
15. W place m ure or comm x product the b
No. of respondents Victoria
No. of respondents Tasmania
here did you sprinkle or the dry OTC ixt ercial pre-miroodnest?
On the top bars of all the broodnest frames
6 (19%) 1 (10%)
Between the combs and on the top bars of all the broodnest frames
10 (31%) 0
On the top bars of the broodnest frames containing brood only
13 (41%) 7 (70%)
At the ends (lugs) of the frame top bars only
1 (3%) 2 (20%)
On top of the queen excluder 2 (6%) 0
In or on frames/combs in the honey super(s)
0 0
16. Did you lift the queen excluder before putting dry OTC mixture or commercial pre-mixed product in the broodnest? No. of respondents
Victoria No. of respondents
Tasmania
Yes, lifted excluder and replaced it immediately after treatment
24 (86%) 0
No, queen excluder left in position 4 (14%) 0 Queen excluder not used (Data not included in percentage calculations)
4 11
95

17. If you he dry OTC mixtu
No. of respondents No. of respondents
treated a hive that had a double box broodnest, into which box did you put tre or commercial pre-mixed product?
Victoria Tasmania
Lower box 2 (50%) 3 (60%) Second box 1 (25%) 0 Lower and second box 1 (25%) 2 (40%)
Withholding periods and residues 18. Please answer this question if you observed a withholding period before selling the honey that
es treated with OTC. How long was this withholding period e hives?
T pondents by State and period we and sale or delivery of honey to a packing plant are presented in the following
Tasmanian respondents
was removed and extracted hivfrom the date of treatment of th
he number of res (weeks/months) bet en treatment of hivestable.
Victorian respondents
3-4 weeks 1 4-6 weeks 2 5 weeks 1
8-10 week8-12 wee12 weeks
6 weeks 5 6-12 weeks 1 6-8 weeks 3 8 weeks 19
6-12 months 1
s 2 ks 5 3
12-16 weeks 1 16-26 weeks 4
6 weeks 8 weeks 8-10 weeks 2 12 weeks 3 1-12 months 1
2 2
Thank you from Russell Goodman, Department of Natural Resources and Environment and Ben
McKee, I Resources, The University elbourne. nstitute of Food and Land of M
96

Department of Natural Resources and Environment
Introduction This su provide a better understanding of European Foulbro
• • •
Note: TIndividu
Total number of res No. of respondents
Victoria No. of respondents
Tasmania
A SURVEY OF EUROPEAN FOULBROOD DISEASE
rvey is designed to gather information that may od disease (EFB). We hope the information will help to explain: why EFB is more prevalent in Victoria than in other Australian States possible links between EFB, honeybee nutrition and various pollen plants how EFB can be a better controlled without using oxtetracycline (OTC).
he information you provide is “Commercial-in Confidence” and will be kept strictly confidential. al apiarists will not be identified in any report arising from this survey.
pondents
EFB disease signs present in one or more hives managed by respondent
58 (94%) 9 (90%)
No EFB disease signs present in one or more hives managed by respondent
4 (6%) 1 (10%)
Frequency of EFB outbreaks 1. In which years did you find disease signs (symptoms) of EFB in any of your hives? (You may
tick one or more boxes). No. of respondents
Victoria No. of respondents
Tasmania
1999-2000 (this season) 38 5 1998-99 (last season) 47 5 1997-98 43 5 1996-97 44 6 1995-96 47 6 No EFB in any of these years 4 1
2. What month of the beekeeping season do you usually observe the first sym No. of respondents No
ptoms of EFB?. of respondents
Victoria Tasmania
July 3 (5%) 0 August 1 307 ( %) 3 (33%) September 2 42 (67%4 ( %) 6 ) October 1 19 0 1 ( %) November 1 (2%) 0 February 1 (2% 0 )
97

Location of apiary site and pollen/nectar flora targeted by bees 3. what district was the apiary site that you used for pollen and nectar in the autumn prior to
er, Lakes Entrance,
andsborough, Mt Cole, Mafeking, Menindee, Mildura, Mornington Peninsular, Muckleford, udgegonga, Nhill, Nyah, Red Cliffs, Rheola, Rushworth, Skipton, Smeaton, St Arnaud, St
Leonards, Stawell, Swan Hill, Tarnagulla, Tatong, Tawonga, Trentham, Tooan, Wangaratta, Wedderburn, Wehla and Yarram
Inthe spring outbreak of EFB? Respondents indicated the following districts: Arnold, Avoca, Baringhup, Barkly, Bealiba, Beechworth, Benalla, Bendigo, Blackwood, Broadford, Bullarto, Castlemaine, Chiltern, Cowwarr, Daylesford, Big and Little Desert, Echuca, Edenhope, Eldorado, South and East Gippsland, Goulburn Valley, Lower GoulburnValley, Grampians, Heathcote, Henty, Howlong, Inglewood, KingowLM
Figure 1. - Districts in which respondents’ apiary sites were located during the autumn prior to the spring outbreak of EFB.
Nectar and pollen flora targeted by bees in autumn prior to the spring outbreak of EFB
Victoria Tasmania
Apple Box 4 Banksia 3 Black Box 2 Blue Mallee 5 Flatweed 6 Gorse 2 Grey Box 16 Red Ironbark 5 Longleaf Box 2 Manna Gum 4
np*
np np np np np np n np np
Mallee 1 Messmate 5 Prickly Moses 1 Red Stringybark 1 Silver Banksia 1 Sugar Gum 1 Stringybark 4 Swamp Gum 1 Tea Tree 1
N Np N Np Np Np Np Np N
Leatherwood 6 Prickly box 1 Stringybark 1 Banksia 1 Snow gum* 1
np
One respondent indicated no incidence of EFB when bees were foraging on Capeweed. * n = nectar; p = pollen
98

99
4. In what district was the apiary site that you used for pollen and nectar in the winter/early spring prior to the spring outbreak of EFB? Respondents indicated the following districts: Avoca, Bairnsdale, Baringhup, Barkly, Benalla, Bendigo, Boundary Bend, Castlemaine, Dimboola, Edenhope, Echuca, South and East Gippsland, Goulburn Valley, Heathcote, Howlong, Inglewood, Jeparit, Kingower, Landsborough, Little Desert, Mt Cole, Mallee, Mildura, Mornington Peninsular, Mudgegonga, Murrayville, North -east Victoria, Newstead, Ouyen, Rheola, Rushworth, St Arnaud, St Leonards, Samaria, Sea Lake, Smeaton, Stawell, Sunraysia, Swan Hill, Tatong, Underbool, Wangaratta and Yungera
Figure 2. - Districts in which respondents’ apiary sites were located in the winter/early spring prior to the spring outbreak of EFB.
Nectar and pollen flora targeted by bees in winter and early-mid spring prior to the
spring outbreak of EFB
Victoria Tasmania
Almonds 3 Canola 14 Capeweed 20 Banksia 4 Eggs and bacon 1 Faba Beans 1 Fruit trees 1 Gorse 2 Paterson’s Curse 6 Onion grass 2 Onion weed 8 Orange blossom 1
np*
np np np np np np np np p np np
Red Ironbark 2 Red Box 1 Shrubs general 2 Turnip weed 10 Wattle 5 Wattle (black) 1 Wattle (Golden) 1 Wattle (silver) 1 Willow 1 White Mallee 2 Yellow Gum 5
N N Np Np P P P P Np N N
Capeweed 1 Fruit trees 1 Heath 2 Tea Tree 1 Wattle 1 Wildflowers 1
p np n p np
* n = nectar; p = pollen

100
5. When you noticed EFB, in what district was the apiary site and hives located?
Respondents indicated the following districts: Bairnsdale, Baringhup, Barkly, Benalla, Bendigo, Boundary Bend, Castlemaine, Edenhope, Echuca, Geelong, South and East Gippsland, Goulburn Valley, Heathcote, Howlong, Inglewood, Jeparit, Kingower, Landsborough, Little Desert, Mt Cole, Mallee, Mildura, Mornington Peninsular, Mudgegonga, North-east Victoria, Natte Yallock, Newstead, Ouyen Rheola, Rushworth, St Arnaud, St Leonards, Sea Lake, Stawell, Swan Hill, Wangaratta and Yungera.
Figure 3. Districts in which respondents’ apiary sites were located when EFB was detected.
Nectar and pollen flora targeted by bees at the site where EFB was first noticed in the honey bee colonies
Victoria Tasmania
Almond 2 Canola 18 Capeweed 22 Coast Tee Tree 1 Faba beans 1 Fruit trees 1 Gorze 2 Onion grass 2 Onion Weed 8
np*
np np n np np np p np
Orange Blossom 1 Paterson’s Curse 6 Red Box 2 Scrub/ground flora 5 Turnip Weed 7 Yellow Gum 8 Wattle 9 White Mallee 1 Willow 2
np np n np np n p n n
Cape weed 1 Fruit trees 1 Heath Tea Tree 1 Wattle 3 Wildflowers 2 Willow 1
np np n np p np p
* n = nectar; p = pollen
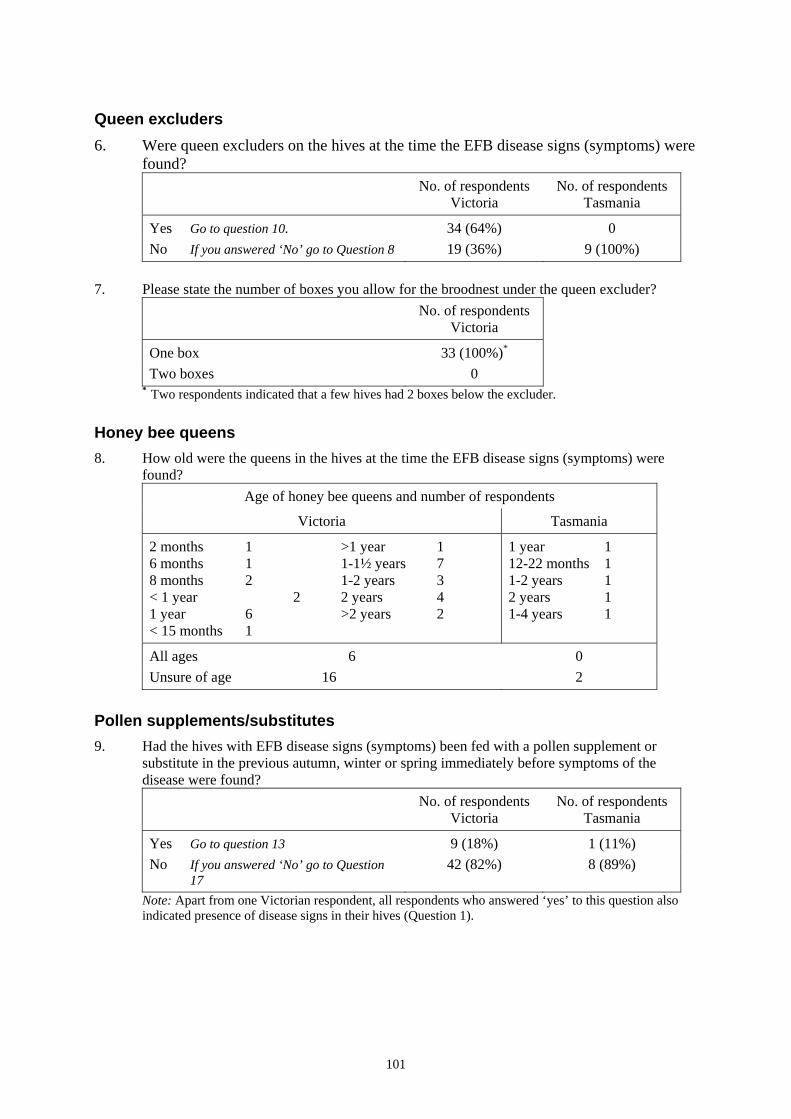
Queen excluders 6. Were queen excluders on the hives at the time the EFB disease signs (symptoms) were
found? No. of respondents
Victoria No. of respondents
Tasmania
Yes Go to question 10. 34 (64%) 0 No If you answered ‘No’ go to Question 8 19 (36%) 9 (100%)
7. Please state the number of boxes you allow for the broodnest under the queen excluder? No. of respondents
Victoria
One box 33 (100%)*
Two boxes 0 * Two respondents indicated that a few hives had 2 boxes below the excluder.
Honey bee queens 8. How old were the queens in the hives at the time the EFB disease signs (symptoms) were
found? Age of honey bee queens and number of respondents
Victoria Tasmania
2 months 1 6 months 1 8 months 2 < 1 year 2 1 year 6 < 15 months 1
>1 year 1 1-1½ years 7 1-2 years 3 2 years 4 >2 years 2
1 year 1 12-22 months 1 1-2 years 1 2 years 1 1-4 years 1
All ages 6 0 Unsure of age 16 2
Pollen supplements/substitutes 9. Had the hives with EFB disease signs (symptoms) been fed with a pollen supplement or
substitute in the previous autumn, winter or spring immediately before symptoms of the disease were found? No. of respondents
Victoria No. of respondents
Tasmania
Yes Go to question 13 9 (18%) 1 (11%) No If you answered ‘No’ go to Question
17 42 (82%) 8 (89%)
Note: Apart from one Victorian respondent, all respondents who answered ‘yes’ to this question also indicated presence of disease signs in their hives (Question 1).
101

10. When did you feed the colonies with a pollen supplement/substitute? (You may tick more then one box). No. of respondents
Victoria No. of respondents
Tasmania
Spring only 3 1 Winter only 4* 0 Autumn only 0 0 Autumn, winter and spring 2 0
* Two respondents indicated that the winter feed of pollen supplement was given prior to moving hives to almond pollination.
11. Where did you obtain the pollen supplement or substitute?
12. If you mixed your pollen supplement or substitute, please provide details of the ingredients and the amount (or weight) of each ingredient used in the mixture. • Pollen, soy flour, Torula yeast, honey and sugar • Irradiated pollen-½ litre, soy flour-5 litres and sugar syrup-4 litres (1:1 sugar/water) • Soy flour-3kilograms, Torula yeast-1kilogram, Kalavit 50 grams and sugar syrup • Soy flour, Torula yeast, Kalavit, sugar and mountain honey • Soy flour, pollen, sugar and some yeast.
Comb replacement 13. Did the hives with EFB disease symptoms have some or all of the old combs in the brood nest
replaced with foundation or newly drawn comb within the last 12 months? No. of respondents
Victoria No. of respondents
Tasmania
Yes Go to Question 18 48 (83%) 4 (44%) No If you answered ‘No’ go to Question
20 10 (17%) 5 (56%)
No. of respondentsVictoria
No. of respondentsTasmania
Mixed your own Go to question 16 6 (67%) 0 Purchased a pre-mixed powder, patty or cake. Go to next question
3 (33%) 1 (100%)
102

14. How old were the combs that you removed from the brood nest? (An average age will do). Age of combs removed from the brood nest and number of respondents
Victoria Tasmania
1 year 1 1-1½ years 1 2 years 3 2-3 years 2 2-4 years 1 3 years 4 3-4 years 5 4 years 4 4-5 years 3
5 years 2 5-6 years 1 5+ years 1 5-10 years 2 6-8 years 1 7-8 years 1 7-10 years 1 15 years 1 Until worn out 1
4 years 2 4-6 Years 1
All ages 3 0 Unsure of age 3 1
15. Did you put foundation or newly drawn combs in the brood nest to replace the old combs? No. of respondents
Victoria No. of respondents
Tasmania
Newly drawn combs 15 (33%) 2 (50%)
Comb foundation 10 (22%) 0
Combination of comb foundation and newly drawn combs
20 (45%) 2 (50%)
Treatment of colonies with oxytetracycline (OTC) Questions 20 and 21 refer to the time you last saw EFB in your hives. 16. Did you treat your hives with OTC some time before EFB disease signs (symptoms) were
evident? No. of respondents
Victoria No. of respondents
Tasmania
Yes. Go to question 21. 20 (36%) 3 (38%) No If you answered ‘No’ go to question
22. 35 (64%) 5 (62%)
17. Please indicate when the colonies were treated with OTC. No. of respondents
Victoria No. of respondents
Tasmania
Previous autumn 4 0 Previous Late winter/early spring 8 2 Previous autumn and late winter/early spring
7 0
Spot fed throughout the season as EFB disease signs became evident in individual hives
4 1
Note: Three respondents indicated that after a blanket feed was given to all hives, spot treatment was also practiced throughout the season whenever diseased colonies were detected.
103

Management of EFB
18. What do you find is the best method to control EFB without using OTC? Please describe. This question refers to methods, other than OTC treatment, that you have used to prevent or control EFB.
Responses detailing use of management practices for control EFB The number of apiarists who responded to this question by indicating use of one or more
management practices to minimise or prevent EFB outbreaks are presented in the table below. It should be noted that these practices may be used in addition to the application of OTC. No. of respondents
Victoria No. of respondents
Tasmania
Apiarists indicating (in Question 1) presence of EFB in hives
38 (90%) 2 (66%)
Apiarists indicating (in Question 1) absence of EFB in hives
4 (10%) 1 (34%)
Management practices for control of EFB Responses provided by Victorian and Tasmanian respondents have been combined unless otherwise indicated. • requeen colonies regularly to ensure presence of young queens (23)
Some of the above respondents also indicated that: - queens were no older than 2 years of age (4) - some colonies were requeened twice a year (1) - failing queens and drone layers were immediately replaced (1) - individual EFB infected colonies were immediately requeened when the disease was
detected (5) - infected colonies were requeened by introducing a young nucleus colony headed by a
new queen (1) - a break in the brood cycle caused by requeening enabled colonies to overcome EFB (3)
• replace some broodnest combs annually, generally with comb foundation or newly drawn comb were used (22) - one respondent stated that replacement of combs was not a total disease control measure
• maintain healthy, strong colonies (ie colonies that were populous with adult bees) (6) - infected hives were given combs of sealed or emerging (hatching) brood to increase the
numbers of adult bees (2) • ensure good honey bee nutrition (4) and feeding of pollen supplements to colonies (2)
- one respondent believed that EFB resulted from poor queens rather than poor nutrition • good conditions (honey and pollen flows) (13)
- avoid tail end of flowering (for example, conditions deteriorate when capeweed dries off and no longer flowers) (1)
- avoid wintering on sites with sloppy nectar, (eg, blue mallee and/or ironbark) (1) - feed sugar syrup to colonies during spring (3 Tasmania only)
• keep hives compact (5), warm (4) and avoid over supering (2) - use queen excluders to confine the queen to a one box broodnest (1) - provide good hive ventilation (1 Tasmania only) - provide sheltered winter apiary sites (1) and dry sunny spring sites (1) - EFB was considered to be a problem in cooler climates (3). One apiarist indicated that
there was less EFB in the north of Victoria (eg Mallee) when compared to southern districts in that State. Another respondent indicated that the disease was initiated more
104

105
easily by the cold wet windy weather of Gippsland than any other factor) • avoid shifting hives in spring immediately prior to a weather change (1) • avoid colony stress (4) • sterilise using gamma irradiation, those hive components that had housed dead or sick
colonies (3). Thank you from: Russell Goodman, Department of Natural Resources and Environment.
Ben McKee, Institute of Food and Land Resources, The University of Melbourne.
9.4 Discussion The percentage of Victorian apiarists responding to the OTC and EFB surveys was 36% and 33% respectively. The number of individual apiarists who responded to both surveys could not be determined because some respondents chose to remain anonymous. Consequently, a comparison of similar data derived from the two surveys may not be useful. An example of this would be a comparison of the month of primary application of OTC to hives (OTC survey) and the month of the beekeeping season when EFB symptoms were usually observed (EFB survey).
9.4.1 OTC survey Sixty-two percent of Victorian respondents and 58% of Tasmanian respondents treated colonies with OTC only when EFB symptoms were present in the brood. This may reflect a trend to minimise production costs and/or an awareness that application of OTC to hives has a potential to cause residues in honey and consequently its use should be avoided unless it was absolutely necessary to treat EFB. Forty-nine percent of Victorian respondents chose to spot treat only hives infected with EFB rather than blanket treat all hives in an infected apiary. All Tasmanian respondents and the remaining 51% of Victorian respondents treated all hives in the apiary. When there was a need to apply a secondary treatment later in the season, all Tasmanian apiarists and 94% of Victorian apiarists indicated they spot treated infected hives only. This may suggest an awareness of the need to minimise application of OTC to lower the risk of occurrence of residues. Thirty-one percent of Victorian respondents indicated their preference for application of OTC in sugar syrup or water. It is possible that at the time of writing this report, the number of respondents using wet-treatment could be much lower than at the time of the survey. This conclusion is suggested because a preliminary report for this project indicating a potential for wet-treatment to cause greater OTC residues in extracted honey than dry-treatment had not been widely disseminated to industry at the time the survey was conducted. Only 1 (8%) Tasmanian respondent used wet treatment. One quarter of Victorian respondents using wet treatment chose to apply the antibiotic in water. Anecdotal evidence indicates a preference for this method on the basis that OTC will quickly degrade in water and the solution will not be stored in the honey supers boxes of the hive. Approximately one third of respondents using dry treatment preferred a commercial pre-mix product. The research team suggests that possible future development and use of OTC portion control packs that contain a single hive dose would help to ensure that colonies receive the correct dose. A small number of apiarists indicated their failure to observe usual industry practice by removal of the queen excluder prior to application of a dry treatment. The application of dry treatment onto an excluder often results in the powder adhere to the bottom bars of frames in the honey super above. During honey extracting powder may dislodge to contaminate the honey. Readers will note a

discrepancy in the responses to questions 15 and 16 concerning application of dry treatments and queen excluders. Of 48 Victorian respondents to question 18, 13 (37%) did not observe the 8 week withholding period stipulated on labels of OTC products available at the time of the survey. Of the 10 Tasmanian respondents, 1 (20%) failed to observe the 8 week withholding period.
9.4.2 European Foulbrood disease survey The majority of Victorian respondents observed the first symptoms of EFB in the months of August, September and October. Tasmanian respondents first detected EFB in August and September. Nine respondents (18%) fed their hives with protein supplement and all but one also indicated that EFB was present in their colonies (the one failed to indicate if EFB was present or absent). This suggests that for these apiarists, the feeding of supplement did not prevent an outbreak of EFB. The degree of control of the disease, if any, was not indicated by the respondents. Most respondents practiced regular replacement of aging broodnest combs to assist in the reduction of Melissococcus pluton organisms. While it was usual for some combs to be replaced each year, the majority of apiarists who indicated a comb replacement program endeavored to renew all broodnest combs during a cycle not exceeding five years. There was a strong indication provided by written comment (question 18) of the importance of maintaining colonies with young queens. It was interesting to note that a small number of respondents requeened infected colonies and it is assumed by the research team that this indicated a means of successful disease reduction. Consequently, it is recommended that research be conducted to determine the incidence of EFB in colonies headed by young and old queens. Although there was a strong indication that ‘good conditions’ (as provided by good nectar and pollen flows) were very important as a means of minimising or preventing the incidence of EFB, the feeding of protein supplements to improve nutrition did not prevent the occurrence of EFB. Keeping colonies compact (avoidance of over-supering of the hive) on a warm, sheltered over-wintering apiary site and sunny springs sites were indicated by 14 respondents as important EFB management strategies. Respondents indicated the districts in Victoria where EFB outbreaks had occurred. The responses indicate a higher incidence of EFB in the central and western districts than elsewhere (Figure 3.). However, this may simply demonstrate that the majority of respondents had located their colonies to target flora in these areas. On the other hand, 4 respondents indicated that they considered the disease to be a greater problem in the cooler areas of Victoria when compared to the warmer, northern districts of the State. Other beekeepers (apart from this survey) have stated this latter point to the authors. It was not possible to confirm a relationship between the flora on which bees foraged and outbreaks of EFB. However, many respondents placed their colonies in stands of Grey box (Eucalyptus microcarpa), a late summer-autumn nectar and pollen yielding tree. In some seasons, the health of colonies may deteriorate after foraging on Grey box, the exact reason for this condition is not known. In spring, canola (Brassica napus cv) and capeweed (Arctotheca calendula) were commonly targeted by respondents. Manning (2001) reviewed the literature on fatty acids in pollen and their importance to honey bees. He stated that linoleic acid had antimicrobial properties which inhibited the growth of M. pluton. Linoleic acid formed approximately 50% and less than 10% of the total lipid of capeweed and Brassica species pollen respectively. Manning (2001) also indicated that there was a need for more research to obtain a full understanding of the role that fatty acids in pollen play in inhibiting honey bee pathogens. In Victoria, any relationship between these two plants and spring outbreaks of EFB may be entirely coincidental, but it is possible that the majority of districts in which these two plants grow have cool and frequently changing weather. Such weather restricts honey bee foraging
106

and impacts on the ability of colonies to access uninterrupted supplies of nectar and fresh pollen (as opposed to pollen stored in the hive). The results of Chapter 5 – ‘Incidence of European Foulbrood in commercially managed honey bee colonies fed a dietary supplement’ also indicate this.
9.5 Recommendations We recommend that further studies be conducted to determine the role of: • inclement weather, restricted honey bee foraging and the collection of nectar and pollen on the
incidence of EFB • fatty acids on the incidence of EFB and possible application to honey bee colonies to prevent
and/or control the disease • young honey bee queens on the incidence of EFB.
107

10. REFERENCES Alippi A M (1991) A comparison of laboratory techniques for the detection of significant bacteria of
the honey bee, Apis mellifera, in Argentina. J. Apic. Res. 30(2), 75-80.
Bailey L (1957) The isolation and cultural characteristics of Streptococcus pluton and further observations on Bacterium eurydice. J. Gen. Micro. 31, 147-150.
Bailey L (1960) The epizootiology of European foulbrood of the larval honey bee, Apis mellifera Linnaeus. J. Insect Pathol. 1, 80-85.
Bailey L (1961) An improved method for the isolation of Streptococcus pluton (White). J. Insect. Pathol. 3, 100.
Bailey L (1963) The habitat of ‘Bacterium eurydice’. J. Gen. Micro. 31, 147-150.
Bailey L (1983) Melissococcus pluton, the cause of European foulbrood of honey bees (Apis spp.). J. App. Bact. 55, 65-69.
Bailey L and Ball BV (1991) Honey bee pathology. Academic Press, London.
Bailey L and Lochner N (1968) Experiments on the etiology of European foulbrood of the honey bee. J. Apic. Res. 7, 103-107.
Bignell DE and Heath LA (1985) Electropositive redox state of the fifth-instar larval gut of Apis mellifera. J. Apic. Res. 24(4), 211-213.
Cai J and Collins MD (1994) Evidence for a close phylogenetic relationship between Melissococcus pluton, the causative agent of European foulbrood disease, and the genus Enterococcus. Int. J. Sys. Bact. 44(2), 365-367.
Cantwell GE (1970) Standard methods for counting Nosema spores. Am. Bee J. 101, 222-3.
Chambonnaud JP (1968) Contribution a la recherche des antibiotiques dans le miel. Bull. Apic. Doc. Sci. Tech. Inf. 11, 133-198.
Dade HA (1962) Anatomy and dissection of the honeybee. Published by the Bee Research Association, London.
Delaplane KS (1997) Beekeeping medications and pesticides. Am. Bee J. 137(12), 859-861.
Delaplane KS and Lozano LF (1994) Using Terramycin® in honey bee colonies. Am. Bee J. 134(4), 259-261.
Djordjevic SP, Noone K, Smith L and Hornitzky MAZ (1998a) Development of a hemi-nested PCR assay for the specific detection of Melissococcus pluton. J. Apic. Res. 37(3), 165-174.
Djordjevic SP, Eamens GJ, Ha H, Walker MJ and Chin JC (1998b) Demonstration that Australian Pasteurella multocida isolates from sporadic outbreaks of porcine pneumonia are non-toxigenic (toxA-) and display heterogeneous DNA restriction endonuclease profiles compared with toxigenic isolates from herds with progressive atrophic rhinitis J. Med. Micriobiol. 47, 679-688.
Gilliam M and Argauer RJ (1981a) Oxytetracycline residues in surplus honey, brood nest honey, and larvae after medication of colonies of honey bees, Apis mellifera, with antibiotic extender patties, sugar dusts, and syrup sprays. Environ. Entomol. 10, 479-482.
Gilliam M and Argauer RJ (1981b) Terramycin residues in surplus and brood nest honey after medication of honeybee colonies by three different methods (1). Gleamings in Bee Culture. 109, 545-551.
Gilliam M and Argauer RJ (1982) Terramycin in diets, bees and stores. Honeybee Sci. 3, 55-62.
Gilliam M, Taber S III and Bray Rose J (1978) Chalkbrood disease of honey bees, Apis mellifera L.: A progress report. Apidologie. 9, 75-89.
108

Gilliam M, Taber S and Argauer RJ (1979) Degradation of oxytetracycline in sugar syrup and honey stored by honeybee colonies. J. Apic. Res. 18(3), 208-211.
Goodman RD and Azuolas JK (1994) Oxytetracycline hydrochloride in Australian honey and the storage of oxytetracycline hydrochloride in beehives. A report produced for the Honeybee Research and Development Council.
Goodwin PH, Xue BG, Kuske CR and Sears MK (1994) Amplification of plasmid DNA to detect plant pathogenic mycoplasmalike organisms. Annals of Applied Biol. 124, 27-36.
Govan VA, Brozel V, Allsopp MH and Davison S (1998) A PCR method for the rapid identification of Melissococcus pluton. App. Environ. Micro. 64(5), 1983-1985.
Graham J (1992) The hive and the honey bee. Dadant and Sons, Hamilton, Ill.
Heimpel AM and Angus TA (1963) Diseases caused by certain spore-forming bacteria. Chapter 2 (pg. 21-74) from Insect Pathology ed., E.A. Steinhaus.
Herbert EW and Shimanuki H (1982) Influence of pollen and a pollen substitute on the development of European foulbrood. Am. Bee J. 122 (12), 814-816.
Herbert EW and Shimanuki H (1983) Effect of pH of pollen and worker jelly on the incidence of European foulbrood in honey bee colonies in New Jersey. Am. Bee J. 124(2): 135-136.
Herbert EW, Shimanuki H and Caron D (1977) Optimum protein levels required by honeybees (Hymenoptera, Apidae), to initiate and maintain brood rearing. Apidologie. 8(2), 141-146.
Hornitzky MAZ (1990) Honeybee diseases workshop. A report for the Australian Honey Research Council.
Hornitzky MAZ and Djordjevic SP (1998) Oxytetracycline sensitivity, diversity and study of Melissococcus pluton (European foulbrood) A report prepared for the Rural Industries Research and Development Corporation, Australia.
Hornitzky MAZ and Smith L (1998) Procedures for the culture of Melissococcus pluton from diseased brood and bulk honey samples. J. Apic. Res. 37(4), 293-294.
Hornitzky MAZ and Smith L (1999) Sensitivity of Australian Melissococcus pluton isolates to oxytetracycline hydrochloride. Aust.J. Exp. Agr. 39(4), 881-883.
Hornitzky MAZ and Wilson S (1989) A system for the diagnosis of the major bacterial brood diseases. J. Apic. Res. 28, 191-195.
Hornitzky MAZ, Karlovskis S and Hallstrom AL (1988) Oxytetracycline activity in honeybee larvae following hive treatment with various oxytetracycline prepaparations. J. Apic. Res. 27(4), 293-244.
Lehnert T and Shimanuki H (1981) Oxytetracycline residues in honey following three different methods of administering the antibiotic. Apidologie. 12(2), 133-136.
Manning R (2001) Fatty acids in pollen: a review of their importance for honey bees. Bee World. 82(2), 60-75.
Matsuka M and Nakamura J (1990) Oxytetracycline residues in honey and royal jelly. J. Apic. Res. 29(2), 112-117.
Patel NG and Gochnauer TA (1959) The toxicity of extracts from foulbrood scale residues for honey bee larvae maintained in vitro. J. Invertebr. Pathol. 1, 190-192.
Patel R, Piper KE, Rouse MS, Steckelberg JR, Kohner P, Hopkins MK, Cockerill FR and Kline BC (1998) Determination of 16S rRNA sequences of Enterococci and application to species identification of nonmotile Enterococcus gallinarum isolates. J. Clinical Micro. 36(11), 3399-3407.
109

110
Peng CY, Mussen E, Fong A, Montague MA and Tyler T (1992) Effects of chlortetracycline of honey bee worker larvae reared in vitro. J. Invert. Pathol. 60, 127-133.
Pinnock DE and Featherstone NE (1984) Detection and quantification of Melissococcus pluton infection in honeybee colonies by means of enzyme-linked immunosorbent assay. J. Api. Res. 23 (3): 168-170.
Porebski S, Bailey GL and Baum BR (1997) Modification of a CTAB DNA extraction protocol for plants containing high polysaccharide and polyphenol components. Plant Molecular Biology reporter. 15(1): 8-15.
Rose MD, Bygrave J, Farrington WHH and Shearer G (1996) The effect of cooking on veterinary drug residues in food: 4. Oxytetracycline. Food Additives & Contaminants. 13(3), 276-286.
Rosseau M, Babier E and Valin J (1957) The influence of pollen on the development of European foulbrood. Abeille Fr. 36, 397-399.
Rosseau M and Tabarly O (1962) L.’ emploiu des antibiotiques en apiculture: leur presence dans le miel. Bull. Apic. Doc. Sci. Tech. Inf. 5, 155-176.
Shimanuki H, Lehnert T, Knox DA and Herbert EW (1969) Control of European foulbrood disease of the honey bee. J. Econ. Entomol. 62, 813-814.
Shimanuki H, Knox DA, Furgala B, Caron DM and Williams JL (1992) Diseases and pests of honeybees, p. 1083-1151. The hive and the honeybee. Graham (ed.), Dadant and Sons, Hamilton, Ill.
Shuel RW and Dixon SE (1986) An artificial diet for laboratory rearing of honeybees. J. Apic. Res. 25, 35-43.
Shuel R, Dixon SE and Kinoshita GB (1978) Growth and development of honeybees in the laboratory on altered queen and worker diets. J. Apic. Res. 17, 57-68.
Sporns P, Kwan S and Roth LA (1986) HPLC analysis of oxytetracycline residues in honey. J. Fd Protect. 49(5), 383-8.
Tarr HLA (1936) Studies on European foulbrood of bees II. The production of the disease experimentally. Ann. Appl. Biol. 23, 558-584.
Wardall GI (1982) European foulbrood: Association with Michigan blueberry pollination, and control. A PhD Thesis submitted to Michigan State University.
Weaver N (1974) Control of dimorphism in the female honeybee. 2. Methods of rearing larvae in the laboratory and of preserving royal jelly. J. Apic. Res. 13, 3-14.
Wigglesworth GI (1953) The principles of insect physiology. E.P. Dutton & Co. Inc. p. 546.
Wilson WT (1974) Residues of oxytetracycline in honey stored by Apis mellifera. Environ. Entomol. 3(4), 674-676.
Wootton M, Hornitzky M and Ryland R (1981) Thermal destruction of Streptococcus pluton in Australian honeys and its effect on honey quality. J. Apic. Res. 20(2), 115-120.