Embed Size (px)
Citation preview

Temperature management in ventilated adults admitted to Australian and New Zealand
ICUs following out of hospital cardiac arrest: statistical analysis plan.
Ryan Salter, Michael Bailey, Rinaldo Bellomo, Glenn Eastwood, Niklas Nielsen, David Pilcher,
Alistair Nichol, Manoj Saxena, Yahya Shehabi, Paul Young
Version 1
29th September 2017
Chief Investigator:
Dr Paul Young
This document outlines the statistical analysis plan for a study evaluating knowledge
translation in relation to temperature management and associated clinical outcomes in
adults admitted to Australian and New Zealand Intensive Care Units (ICUs) following out of
hospital cardiac arrest.
The statistical analysis plan was developed by the study’s Chief Investigator (PY) and Ryan
Salter (RS) in consultation with the study statistician (MB), and was approved by the writing
group. This statistical plan was posted online on 03/10/2017.
The study team will consider modifying the statistical analysis plan in response to
suggestions from the wider critical care community until 31/10/2017 after which point the
final analysis will be undertaken. Suggestions or questions can be emailed to the Chief
Investigator. If the statistical analysis plan is modified in response to feedback from the
critical care community or for any other reason an updated version will be posted online.
Study design
Retrospective observational study.
Study setting

Data for this study will be obtained from the Australian and New Zealand Intensive Care
Centre for Outcome and Resource Evaluation Adult Patient Database (ANZICS-CORE APD),
which contains more than 2 million Intensive Care Unit (ICU) admission episodes from 186
ICUs from Australia and New Zealand[1]. ANZICS-CORE APD data are independently
collected by multiple trained data collectors for the purpose of audit. Data in the ANZICS-
CORE APD include details related to individual ICU admissions as well as vital status at
hospital discharge and hospital discharge destination. Details related to cardiac arrests
such as the time until return of spontaneous circulation, the initial rhythm, whether the
arrest was witness, and whether bystander CPR was initiated are not included in the
ANZICS-CORE APD. Data fields that are included in the ANZICS-CORE APD can be found
online:
http://www.anzics.com.au/Downloads/ANZICS%20APD%20Dictionary%20Programmers%2
0V5.4.pdf
Data for all ICU admission episodes between January 2005 and December 2016 will be
evaluated to obtain the study population of interest.
Study population
Patients will be eligible for inclusion if they fulfil all of the following inclusion criteria:
1. Mechanically ventilated adults (aged 18 years or older)
2. Admitted to ICU from an emergency department within 24 hours of hospital
admission
3. With either an admission ANZICS-CORE APD diagnostic code of ‘cardiac arrest’
(diagnostic code 102) OR a documented cardiac arrest within 24 hours prior to ICU
admission.
Patients will be excluded if they are admitted to ICU for palliative care or with limitations of
treatment in place.
The study population will divided be into the following cohorts based on ICU admission
date in relation to publication of the Targeted Temperature Management at 33°C vs. 36°C
After Cardiac Arrest trial (the TTM trial) in December 2013[2]:

1. The pre-TTM cohort will be defined as patients admitted in the 3 years prior to
publication of the TTM trial (January 2011 until December 2013 inclusive)
2. The post-TTM cohort will be defined as patients admitted in the 3 years post
publication of the TTM trial (January 2014 until December 2016 inclusive)
3. The extended pre-TTM cohort will be defined as patients admitted to ICU from
January 2005 until December 2013
Aims
Primary aims
To evaluate the translation of knowledge into practice in relation to temperature
management in adults admitted to Australian and New Zealand ICUs following out-of-
hospital cardiac arrest (OHCA) following the publication of the TTM trial we aim to:
1. Describe temperature management in the pre-TTM cohort vs. the post-TTM cohort.
2. Compare in-hospital mortality rates of patients in the pre-TTM cohort vs. the post-
TTM cohort.
3. Describe temporal trends for hospital mortality in the extended pre-TTM cohort and
post-TTM cohort.
Secondary aims
To compare the incidence of fever, defined as a temperature of greater than 38°C in
the first 24 hours in ICU, in the pre-TTM cohort vs. the post-TTM cohort.
To compare the ICU length of stay in the pre-TTM cohort vs. the post TTM cohort
overall, and for survivors and non-survivors separately.
To compare the hospital length of stay in the pre-TTM cohort vs. the post TTM
cohort overall, and for survivors and non-survivors separately.
To compare the proportion of patients discharged home in the pre-TTM cohort vs.
the post-TTM cohort.
To describe temporal trends for the proportion of patients discharged home in the
extended pre-TTM cohort and post-TTM cohort.
To compare the proportion of patients discharged to a rehabilitation facility in the
pre-TTM cohort.

To describe temporal trends for the proportion of patients discharged to a
rehabilitation facility in the extended pre-TTM cohort and post-TTM cohort.
Definitions of variables
Outcome variables
The primary outcome variable of interest to evaluate knowledge translation in relation to
temperature management is the lowest body temperature in the 1st 24 hours in ICU.
Additional analyses will also be conducted evaluating the highest temperature and the
difference in temperature (highest temperature in the 1st 24 hours minus lowest
temperature in the 1st 24 hours).
The primary clinical outcome variable of interest is in-hospital mortality. Other clinical
outcome variables of interest are:
1. The proportion of patients with a body temperature of greater than 38°C in the first
24 hours in ICU.
2. The ICU length of stay overall and for survivors and non-survivors separately.
3. The hospital length of stay overall and for survivors and non-survivors separately.
4. The proportion of patients discharged home. That is, the number of patients
discharged home divided by the total number of patients.
5. The proportion of survivors discharged home. That is, the number of patients
discharged home divided by the total number of patients who survived until hospital
discharge.
6. The proportion of survivors discharged to a rehabilitation facility. That is, the number
of patients discharged a rehabilitation facility divided by the total number of patients
who survived until hospital discharge.
Exposures of interest
The primary exposure of interest is admission to ICU before vs. after publication of the TTM
trial in December 2013.
Baseline variables of interest, effect modifiers, and confounders

Age, gender, chronic comorbidities, location of ICU (Australia vs. New Zealand), type of ICU
(rural, metropolitan, tertiary, and private), and Australian and New Zealand Risk of Death
(ANZROD) will be reported as baseline variables. ANZROD is a mortality prediction model
specifically calibrated for use in ANZ ICUs that has been derived from components of the
APACHE II and III scoring systems with additional diagnostic variables and has been shown
to have significantly better calibration and discrimination than APACHE III[3, 4]. Because
inducing hypothermia will directly alter the patients’ body temperature in the first 24 hours
in ICU the ANZROD score will also be reported with the contribution to the score from the
temperature component removed. In addition, because arterial blood gas measurements
of partial pressure of oxygen (PaO2) and blood pH may be affected by blood temperature[5]
and cooling to 33°C would be expected to directly alter heart rate, urine output, and
respiratory rate without necessarily altering illness severity, an ANZROD score with
temperature, PaO2, pH, heart rate, urine output, and respiratory rate components removed
will also be reported. We have chosen to report the ANZROD in this way because
physiological variables which are altered either directly or indirectly by targeted
temperature management may confound the association between these variables and the
patients’ illness severity as reflected by the ANZROD score.
Subgroups
To further establish the extent of knowledge translation into practice the following
subgroups will be considered:
1. Patients admitted to tertiary ICUs vs. non tertiary ICUs
2. Patients admitted to NZ ICUs vs. Australian ICUs
3. Patients less than the median age vs. greater than or equal to the median age
Statistical analysis
As outlined above the main groups for comparison will be the pre-TTM and post-TTM
cohorts. We have chosen to compare these cohorts because a comparison of data from
three years before and three years after publication of the TTM trial may be less subject to
confounding due to temporal changes than a comparison between the extended pre-TTM
cohort and the post-TTM cohort. Longer term temporal trends will be evaluated by
examining outcomes over time in the extended pre-TTM and post-TTM cohorts.

All data will initially be assessed for normality. Comparisons will be performed using chi-
square tests for equal proportion, student t-tests for normally distributed data and
Wilcoxon rank sum tests otherwise, with results reported as frequency (%), mean (standard
deviation) and median (interquartile range) respectively. Multivariable comparisons will be
performed using hierarchial logistic regression with patients nested within site and sites
treated as a random effect with results reported as odds ratio (95%CI). To test the
robustness of any findings and as a form of sensitivity analysis three risk-adjustment models
will be used:
1. Adjusting for ANZROD score.
2. Adjusting for ANZROD score with the temperature component removed.
3. Adjustment for ANZROD score with temperature affected components removed
(temperature, respiratory rate, heart rate, urine output, pH, and PaO2).
Duration variables for ICU and hospital length of stay will be log-transformed and analysed
using hierarchial mixed linear modelling using the same three models outlined above. To
further account for survival bias, duration variables will be further stratified by survival
status. Results will be presented as geometric means (95% CI).
Temporal trends will be evaluated using segmented linear regression analysis with data
aggregated at a monthly level. This technique will evaluate whether there is
a step-wise change in the value of an outcome at the interface of the two pre-defined time
intervals (extended pre-TTM vs. post-TTM) and whether there is a difference in the slope or
rate of change between the two pre-defined time intervals (extended pre-TTM vs. post-
TTM). Autocorrelation between consecutive months will be tested for by a Durban Watson
test and where there is evidence of significant autocorrelation (P<0.05), auto regressive
techniques will be used instead of linear regression. Temporal mortality trends will also be
examined from 2005 until 2016 without any pre-defined time transition by plotting a locally
weighted smoothing graph (loess).
The temporal trends in temperature management based on the lowest temperature in the
first 24 hours in ICU by month will be evaluated from Jan 2005 until Dec 2016. Temporal

trends in in-hospital mortality rates, proportion of patients discharged home, proportion of
survivors discharged home, and proportion of patients discharged to rehabilitation will be
evaluated from Jan 2005 until Dec 2016. To further quantify the relationship between
temperature management and mortality, an additional sensitivity analysis will be
performed on the subset of ICUs that had an increase in lowest temperature between pre-
TTM vs. post-TTM periods.
To determine if the translation of knowledge into practice differs between subgroups,
temperature between periods (min, max, difference) will be analysed using hierarchical
mixed modelling fitting main effects for period and subgroup and an interaction between
the two. A similar analysis will be undertaken to evaluate associated mortality changes in
pre-specified subgroups. All analyses will be performed using SAS version 9.4 (SAS Institute
Inc., Cary, USA). To increase the robustness of the analysis, a two sided p-value of 0.01 will
be used to indicate statistical significance.
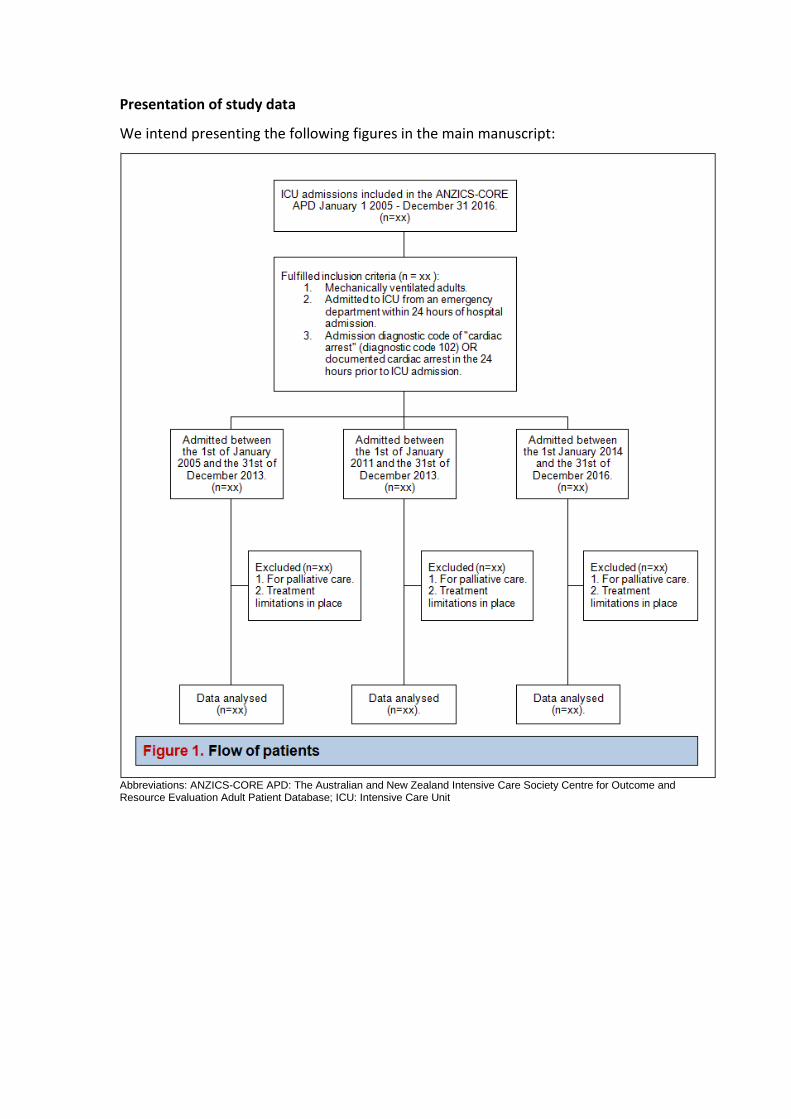
Presentation of study data
We intend presenting the following figures in the main manuscript:
Abbreviations: ANZICS-CORE APD: The Australian and New Zealand Intensive Care Society Centre for Outcome and Resource Evaluation Adult Patient Database; ICU: Intensive Care Unit

* Data points will represent the average lowest body temperature in the first 24 hours in ICU for eligible patients by month from the 1st
of January 2005 until the 31st of December 2016. The shaded area will indicate months prior to publication of the Targeted
Temperature Management (TTM) study; the un-shaded area will indicate months after the publication of the TTM study.
Figure 2. Lowest body temperature in the first 24 hours in ICU by month*
Figure 3. In-hospital mortality by month*
* Data points will represent the in-hospital mortality rates for eligible patients by month from the 1
st of January 2005 until the 31
st of
December 2016. The shaded area will indicate months prior to publication of the Targeted Temperature Management (TTM) study; the un-shaded area will indicate months after the publication of the TTM study.
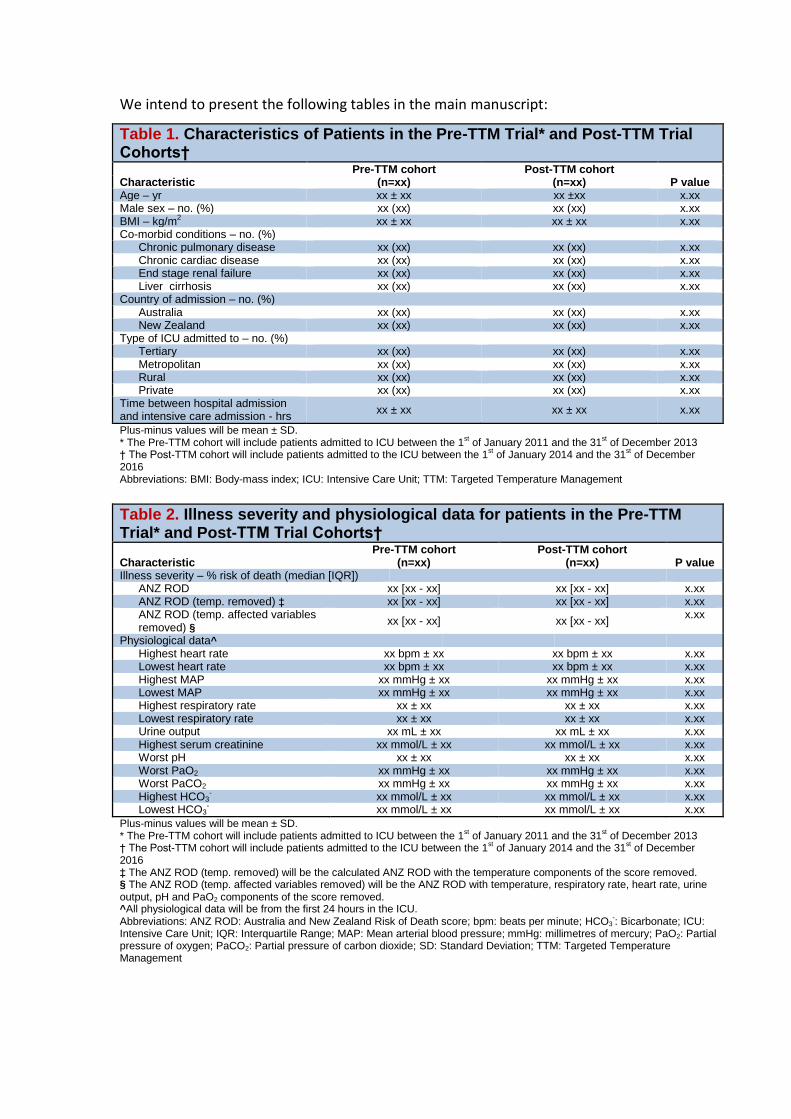
We intend to present the following tables in the main manuscript:
Table 1. Characteristics of Patients in the Pre-TTM Trial* and Post-TTM Trial Cohorts† Pre-TTM cohort Post-TTM cohort Characteristic (n=xx) (n=xx) P value Age – yr xx ± xx xx ±xx x.xx Male sex – no. (%) xx (xx) xx (xx) x.xx BMI – kg/m2 xx ± xx xx ± xx x.xx Co-morbid conditions – no. (%)
Chronic pulmonary disease xx (xx) xx (xx) x.xx Chronic cardiac disease xx (xx) xx (xx) x.xx End stage renal failure xx (xx) xx (xx) x.xx Liver cirrhosis xx (xx) xx (xx) x.xx
Country of admission – no. (%) Australia xx (xx) xx (xx) x.xx New Zealand xx (xx) xx (xx) x.xx
Type of ICU admitted to – no. (%) Tertiary xx (xx) xx (xx) x.xx Metropolitan xx (xx) xx (xx) x.xx Rural xx (xx) xx (xx) x.xx Private xx (xx) xx (xx) x.xx
Time between hospital admission and intensive care admission - hrs
xx ± xx xx ± xx x.xx
Plus-minus values will be mean ± SD. * The Pre-TTM cohort will include patients admitted to ICU between the 1
st of January 2011 and the 31
st of December 2013
† The Post-TTM cohort will include patients admitted to the ICU between the 1st of January 2014 and the 31
st of December
2016 Abbreviations: BMI: Body-mass index; ICU: Intensive Care Unit; TTM: Targeted Temperature Management
Table 2. Illness severity and physiological data for patients in the Pre-TTM Trial* and Post-TTM Trial Cohorts† Pre-TTM cohort Post-TTM cohort Characteristic (n=xx) (n=xx) P value Illness severity – % risk of death (median [IQR])
ANZ ROD xx [xx - xx] xx [xx - xx] x.xx ANZ ROD (temp. removed) ‡ xx [xx - xx] xx [xx - xx] x.xx ANZ ROD (temp. affected variables removed) §
xx [xx - xx] xx [xx - xx] x.xx
Physiological data^ Highest heart rate xx bpm ± xx xx bpm ± xx x.xx Lowest heart rate xx bpm ± xx xx bpm ± xx x.xx Highest MAP xx mmHg ± xx xx mmHg ± xx x.xx Lowest MAP xx mmHg ± xx xx mmHg ± xx x.xx Highest respiratory rate xx ± xx xx ± xx x.xx Lowest respiratory rate xx ± xx xx ± xx x.xx Urine output xx mL ± xx xx mL ± xx x.xx Highest serum creatinine xx mmol/L ± xx xx mmol/L ± xx x.xx Worst pH xx ± xx xx ± xx x.xx Worst PaO2 xx mmHg ± xx xx mmHg ± xx x.xx Worst PaCO2 xx mmHg ± xx xx mmHg ± xx x.xx Highest HCO3
- xx mmol/L ± xx xx mmol/L ± xx x.xx Lowest HCO3
- xx mmol/L ± xx xx mmol/L ± xx x.xx
Plus-minus values will be mean ± SD. * The Pre-TTM cohort will include patients admitted to ICU between the 1
st of January 2011 and the 31
st of December 2013
† The Post-TTM cohort will include patients admitted to the ICU between the 1st of January 2014 and the 31
st of December
2016 ‡ The ANZ ROD (temp. removed) will be the calculated ANZ ROD with the temperature components of the score removed. § The ANZ ROD (temp. affected variables removed) will be the ANZ ROD with temperature, respiratory rate, heart rate, urine output, pH and PaO2 components of the score removed. ^All physiological data will be from the first 24 hours in the ICU. Abbreviations: ANZ ROD: Australia and New Zealand Risk of Death score; bpm: beats per minute; HCO3
-: Bicarbonate; ICU:
Intensive Care Unit; IQR: Interquartile Range; MAP: Mean arterial blood pressure; mmHg: millimetres of mercury; PaO2: Partial pressure of oxygen; PaCO2: Partial pressure of carbon dioxide; SD: Standard Deviation; TTM: Targeted Temperature Management
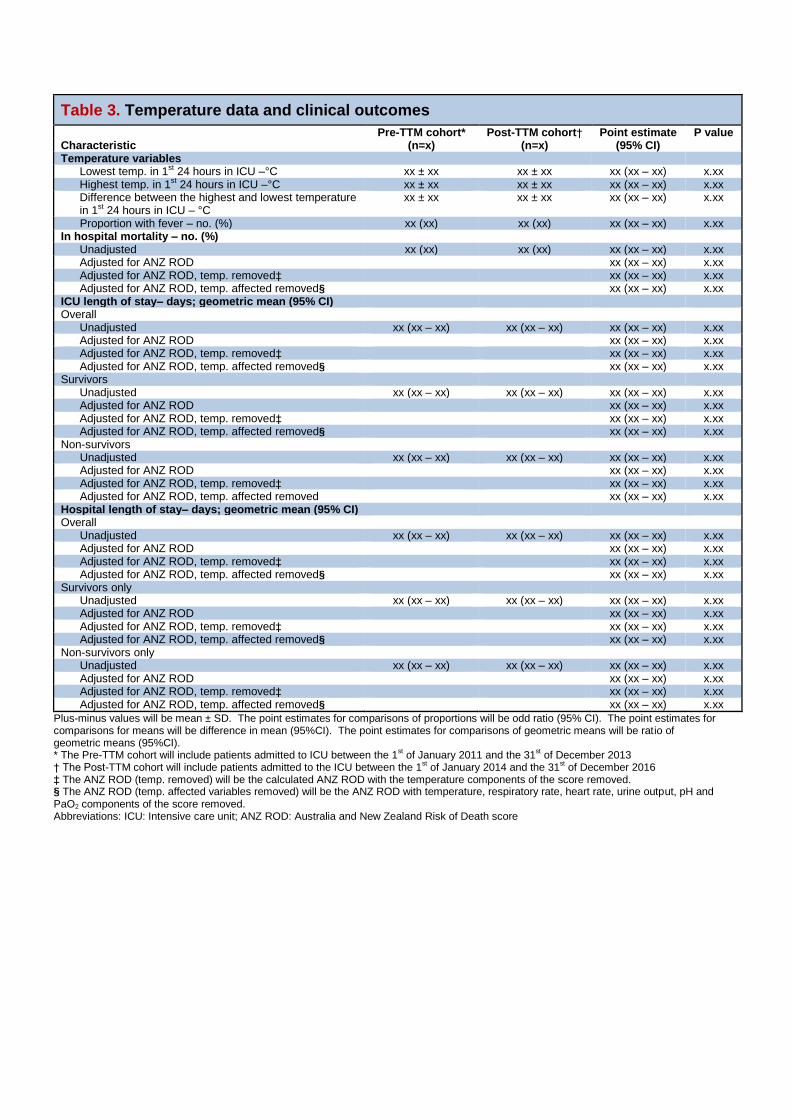
Table 3. Temperature data and clinical outcomes
Pre-TTM cohort* Post-TTM cohort† Point estimate P value Characteristic (n=x) (n=x) (95% CI) Temperature variables
Lowest temp. in 1st 24 hours in ICU –°C xx ± xx xx ± xx xx (xx – xx) x.xx Highest temp. in 1st 24 hours in ICU –°C xx ± xx xx ± xx xx (xx – xx) x.xx Difference between the highest and lowest temperature in 1st 24 hours in ICU – °C
xx ± xx xx ± xx xx (xx – xx) x.xx
Proportion with fever – no. (%) xx (xx) xx (xx) xx (xx – xx) x.xx In hospital mortality – no. (%)
Unadjusted xx (xx) xx (xx) xx (xx – xx) x.xx Adjusted for ANZ ROD xx (xx – xx) x.xx Adjusted for ANZ ROD, temp. removed‡ xx (xx – xx) x.xx Adjusted for ANZ ROD, temp. affected removed§ xx (xx – xx) x.xx
ICU length of stay– days; geometric mean (95% CI) Overall
Unadjusted xx (xx – xx) xx (xx – xx) xx (xx – xx) x.xx Adjusted for ANZ ROD xx (xx – xx) x.xx Adjusted for ANZ ROD, temp. removed‡ xx (xx – xx) x.xx Adjusted for ANZ ROD, temp. affected removed§ xx (xx – xx) x.xx
Survivors Unadjusted xx (xx – xx) xx (xx – xx) xx (xx – xx) x.xx Adjusted for ANZ ROD xx (xx – xx) x.xx Adjusted for ANZ ROD, temp. removed‡ xx (xx – xx) x.xx Adjusted for ANZ ROD, temp. affected removed§ xx (xx – xx) x.xx
Non-survivors Unadjusted xx (xx – xx) xx (xx – xx) xx (xx – xx) x.xx Adjusted for ANZ ROD xx (xx – xx) x.xx Adjusted for ANZ ROD, temp. removed‡ xx (xx – xx) x.xx Adjusted for ANZ ROD, temp. affected removed xx (xx – xx) x.xx Hospital length of stay– days; geometric mean (95% CI) Overall Unadjusted xx (xx – xx) xx (xx – xx) xx (xx – xx) x.xx Adjusted for ANZ ROD xx (xx – xx) x.xx Adjusted for ANZ ROD, temp. removed‡ xx (xx – xx) x.xx Adjusted for ANZ ROD, temp. affected removed§ xx (xx – xx) x.xx Survivors only Unadjusted xx (xx – xx) xx (xx – xx) xx (xx – xx) x.xx Adjusted for ANZ ROD xx (xx – xx) x.xx Adjusted for ANZ ROD, temp. removed‡ xx (xx – xx) x.xx Adjusted for ANZ ROD, temp. affected removed§ xx (xx – xx) x.xx Non-survivors only Unadjusted xx (xx – xx) xx (xx – xx) xx (xx – xx) x.xx Adjusted for ANZ ROD xx (xx – xx) x.xx Adjusted for ANZ ROD, temp. removed‡ xx (xx – xx) x.xx Adjusted for ANZ ROD, temp. affected removed§ xx (xx – xx) x.xx
Plus-minus values will be mean ± SD. The point estimates for comparisons of proportions will be odd ratio (95% CI). The point estimates for comparisons for means will be difference in mean (95%CI). The point estimates for comparisons of geometric means will be ratio of geometric means (95%CI). * The Pre-TTM cohort will include patients admitted to ICU between the 1
st of January 2011 and the 31
st of December 2013
† The Post-TTM cohort will include patients admitted to the ICU between the 1st of January 2014 and the 31
st of December 2016
‡ The ANZ ROD (temp. removed) will be the calculated ANZ ROD with the temperature components of the score removed. § The ANZ ROD (temp. affected variables removed) will be the ANZ ROD with temperature, respiratory rate, heart rate, urine output, pH and PaO2 components of the score removed. Abbreviations: ICU: Intensive care unit; ANZ ROD: Australia and New Zealand Risk of Death score

We intend to present the following tables in an online supplement:
Table S1. Characteristics of Patients in the Extended Pre-TTM Trial Cohort*
Extended Pre-TTM cohort Characteristic (n=xx) Age – yr xx ± xx Male sex – no. (%) xx (xx) BMI – kg m-2 xx ± xx Co-morbid conditions – no. (%)
Chronic pulmonary disease xx (xx) Chronic cardiac disease xx (xx) End stage renal failure xx (xx) Liver cirrhosis xx (xx) Australia xx (xx) New Zealand xx (xx)
Type of ICU admitted to – no. (%) Tertiary xx (xx) Metropolitan xx (xx) Rural xx (xx) Private xx (xx)
Time between hospital admission and intensive care admission - hrs
xx ± xx
Plus-minus values are means ± SD. * The Extended Pre-TTM cohort includes patients admitted to ICU between the 1
st of January 2005 and the 31
st of December
2013 Abbreviations: BMI: Body-mass index; ICU: Intensive Care Unit; TTM: Targeted Temperature Management
Table S2. Illness severity and physiological data for patients in the Extended Pre-TTM Trial Cohort* Pre-TTM cohort Characteristic (n=xx) Illness severity – % risk of death (median [IQR])
ANZ ROD xx [xx - xx] ANZ ROD (temp. removed)† xx [xx - xx] ANZ ROD (temp. affected variables removed)‡ xx [xx - xx]
Physiological data§ Highest heart rate xx bpm ± xx Lowest heart rate xx bpm ± xx Highest MAP xx mmHg ± xx Lowest MAP xx mmHg ± xx Highest respiratory rate xx ± xx Lowest respiratory rate xx ± xx Urine output xx mL ± xx Highest serum creatinine xx mmol/L ± xx Worst pH xx ± xx Worst PaO2 xx mmHg ± xx Worst PaCO2 xx mmHg ± xx Highest HCO3
- xx mmol/L ± xx Lowest HCO3
- xx mmol/L ± xx
Plus-minus values will be mean ± SD. * The Extended Pre-TTM cohort includes patients admitted to ICU between the 1
st of January 2005 and the 31
st of December
2013 † The ANZ ROD (temp. removed) will be the calculated ANZ ROD with the temperature components of the score removed. ‡ The ANZ ROD (temp. affected variables removed) will be the ANZ ROD with temperature, respiratory rate, heart rate, urine output, pH and PaO2 components of the score removed. § All physiological data will be from the first 24 hours in the ICU. Abbreviations: ANZ ROD: Australia and New Zealand Risk of Death score; bpm: beats per minute; HCO3
-: Bicarbonate; ICU:
Intensive Care Unit; IQR: Interquartile Range; MAP: Mean arterial blood pressure; mmHg: millimetres of mercury; PaO2: Partial pressure of oxygen; PaCO2: Partial pressure of carbon dioxide; SD: Standard Deviation; TTM: Targeted Temperature Management

Table S3. Temperature data and clinical outcomes in the Extended Pre-TTM Trial Cohort*
Extended Pre-TTM cohort* Characteristic (n=x)
Lowest temp. in 1st 24 hours in ICU –°C xx ± xx Highest temp. in 1st 24 hours in ICU –°C xx ± xx In ICU difference in 1st 24 hours – °C xx ± xx Proportion with fever – no. (%) xx (xx)
In hospital mortality – no. (%) xx (xx) ICU length of stay– days; geometric mean (95% CI)
Overall xx (xx – xx) Survivors xx (xx – xx) Non-survivors xx (xx – xx)
Hospital length of stay– days; geometric mean (95% CI) Overall xx (xx – xx) Survivors only xx (xx – xx) Non-survivors only xx (xx – xx)
Plus-minus values will be mean ± SD. * The Extended Pre-TTM cohort includes patients admitted to ICU between the 1
st of January 2005 and the 31
st of December
2013
Table S4. Subgroup analyses
Pre-TTM cohort (n=x)
Post-TTM cohort (n=x)
Estimate of difference (95% CI) P value for
Point estimate
Interaction
Lowest temperature in the first 24 hours
Country of admission x.xx Australia xx ± xx xx ± xx xx (xx – xx) x.xx New Zealand xx ± xx xx ± xx xx (xx – xx) x.xx
Type of intensive care x.xx Tertiary xx ± xx xx ± xx xx (xx – xx) x.xx Metropolitan xx ± xx xx ± xx xx (xx – xx) x.xx Rural xx ± xx xx ± xx xx (xx – xx) x.xx Private xx ± xx xx ± xx xx (xx – xx) x.xx
Patient age x.xx <median age xx ± xx xx ± xx xx (xx – xx) x.xx ≥median age xx ± xx xx ± xx xx (xx – xx) x.xx
In-hospital mortality
Country of admission x.xx Australia xx ± xx xx ± xx xx (xx – xx) x.xx New Zealand xx ± xx xx ± xx xx (xx – xx) x.xx
Type of intensive care x.xx Tertiary xx ± xx xx ± xx xx (xx – xx) x.xx Metropolitan xx ± xx xx ± xx xx (xx – xx) x.xx Rural xx ± xx xx ± xx xx (xx – xx) x.xx Private xx ± xx xx ± xx xx (xx – xx) x.xx
Patient age x.xx <median age xx ± xx xx ± xx xx (xx – xx) x.xx ≥median age xx ± xx xx ± xx xx (xx – xx) x.xx
Plus-minus values will be mean ± SD. The point estimates for comparisons of proportions will be odd ratio (95% CI). The point estimates for comparisons for means will be difference in mean (95%CI).
We intend to present the following figures in an online supplement. These figures will be
presented in a similar manner to Figure 3 shown above:
1. The proportion of patients discharged home by month
2. The proportion of survivors discharged home by month
3. The proportion of survivors discharged to rehabilitation by month
4. The mortality rate by month (limited to ICUs where the average lowest temperature
increased after the publication of the TTM trial)
5. Locally weighted smoothing graph (loess) showing temporal trends in hospital
mortality in OHCA patients in ANZ from 2005 until 2016.
References:
1. Stow PJ, Hart GK, Higlett T, George C, Herkes R, McWilliam D, Bellomo R, Committee ADM, (2006) Development and implementation of a high-quality clinical database: the Australian and New Zealand Intensive Care Society Adult Patient Database. J Crit Care 21: 133-141
2. Nielsen N, Wetterslev J, Cronberg T, Erlinge D, Gasche Y, Hassager C, Horn J, Hovdenes J, Kjaergaard J, Kuiper M, Pellis T, Stammet P, Wanscher M, Wise MP, Aneman A, Al-Subaie N, Boesgaard S, Bro-Jeppesen J, Brunetti I, Bugge JF, Hingston CD, Juffermans NP, Koopmans M, Kober L, Langorgen J, Lilja G, Moller JE, Rundgren M, Rylander C, Smid O, (2013) Targeted temperature management at 33 degrees C versus 36 degrees C after cardiac arrest. N Engl J Med 369
3. Pilcher D, Paul E, Bailey M, Huckson S, (2014) The Australian and New Zealand Risk of Death (ANZROD) model: getting mortality prediction right for intensive care units. Crit Care Resusc 16: 3-4
4. Paul E, Bailey M, Pilcher D, (2013) Risk prediction of hospital mortality for adult patients admitted to Australian and New Zealand intensive care units: development and validation of the Australian and New Zealand Risk of Death model. J Crit Care 28: 935-941
5. Burnett RW, Noonan DC, (1974) Calculations and correction factors used in determination of blood pH and blood gases. Clin Chem 20: 1499-1506