Embed Size (px)
Citation preview
1Ploen, May 10th 2011
Temperature effectson Microarrays
Arnaud BuhotSPrAM, INAC, CEA Grenoble
2Ploen, May 10th 2011
Outlook of the presentation
• Experimental Set Up
– Grafting chemistry (electro-polymerization or SAMs)
– Hybridization detection : Surface Plasmons Resonance Imaging – Temperature control (equilibrium and out-of-equilibrium scans)
• Electrostatic penalty
– Equilibrium melting curves– Salt concentration effects
– Confrontation to the model
• Potential applications– Single Nucleotide Polymorphism (SNP) genotyping
• Homozygous case (pure targets)
• Heterozygous case (mixed targets)– Low abundant somatic point mutation detection
• Low temperature cooling hybridization
• Temperature cycles • Conclusion

3Ploen, May 10th 2011
Microarray fabrication : Grafting chemistries
• Substrate : Gold surface on a glass prism for SPR imaging
• Spot Fabrication: Two grafting chemistries
– Self Assembled Monolayer (SAM) of DNA-thiols– Electro-polymerization of pyrrole and DNA-pyrrole
• Relative advantages and drawbacks
– Better accessibility of targets and SPR signal for thiol SAMs– Better stability (temperature and time) for poly-pyrrole
4Ploen, May 10th 2011
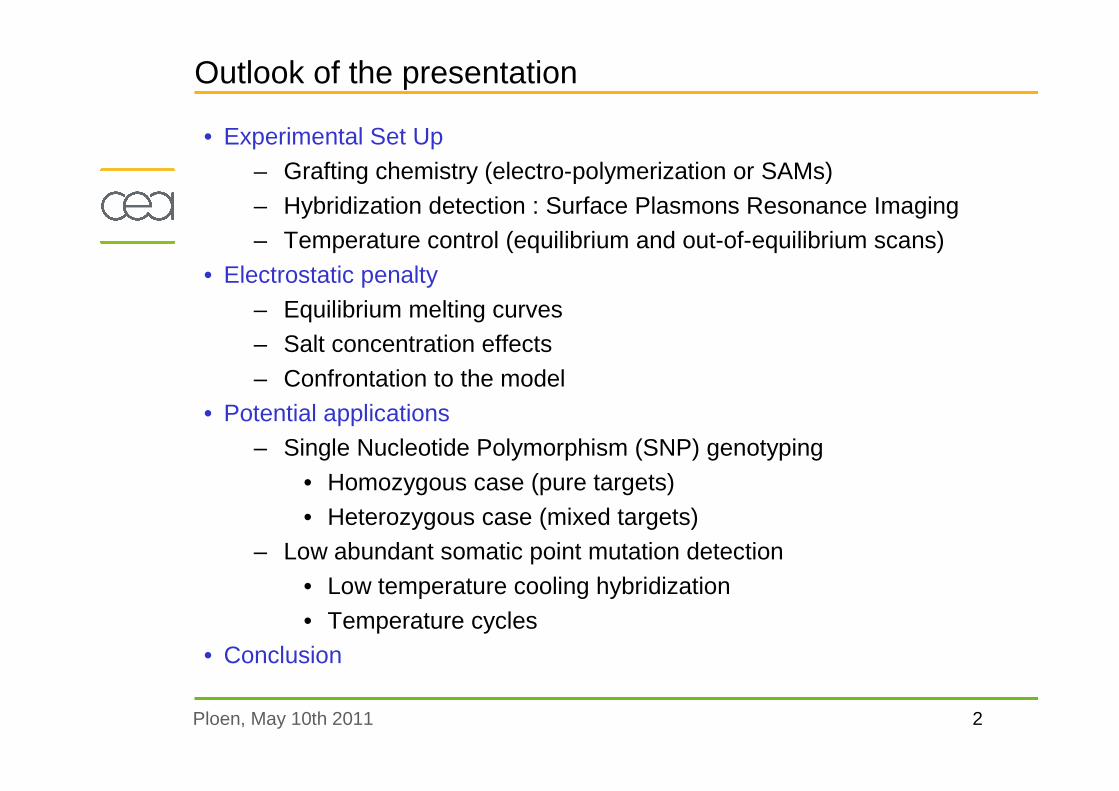
Signal detection : Surface Plasmon Resonance imaging
• Multi-spots detection : parallel (from few tens to thousands)
• Real time kinetics without label
• Hybridization cell of 4µL with fluidics• Precise temperature control from 15 to 85°C (home-made)
• Commercial apparatus by Genoptics (Horiba Jobin Yvon)

5Ploen, May 10th 2011
Kinetics of hybridization and denaturation
J.B. Fiche et al. Biophys. J. 92 , 935 (2007)
-0.1
0.1
0.3
0.5
0.7
0.9
0 2 4 6 8 10 12 14 16 18 20
Time (min)
Ref
lect
ed In
tens
ity
6.25 nM
12.5 nM
25 nM
50 nM100 nM200 nM400 nM
Controls
Ref
lect
ivity
(%)
Time (min)
Buffer Hybridization Buffer
Targetconcentration

6Ploen, May 10th 2011
Experimental set up : Temperature scan
-20
-15
-10
-5
0
5
0 10 20 30 40 50 60
Ref
lect
ivity
(%
)
Time (min)
Probe injection
Temperaturescan starts
Temperaturescan ends
Temperature dependence of the water index leads to change of reflectivity
∆T=1°C ⇔ ∆R=0.35%
Temperature effects on plasmon curves
1: Reference scan
2: Hybridization
3: Detection scan∆Tm
t
1
2
3
T
Subtraction of a reference scan (1) from the detection scan (3) on each spot of the microarray:
Condition: Precise control of the temperature
Applications: Melting curve analysis, SNP and/or somatic point mutation detection,…
Measurement protocol
Melting curves
7Ploen, May 10th 2011
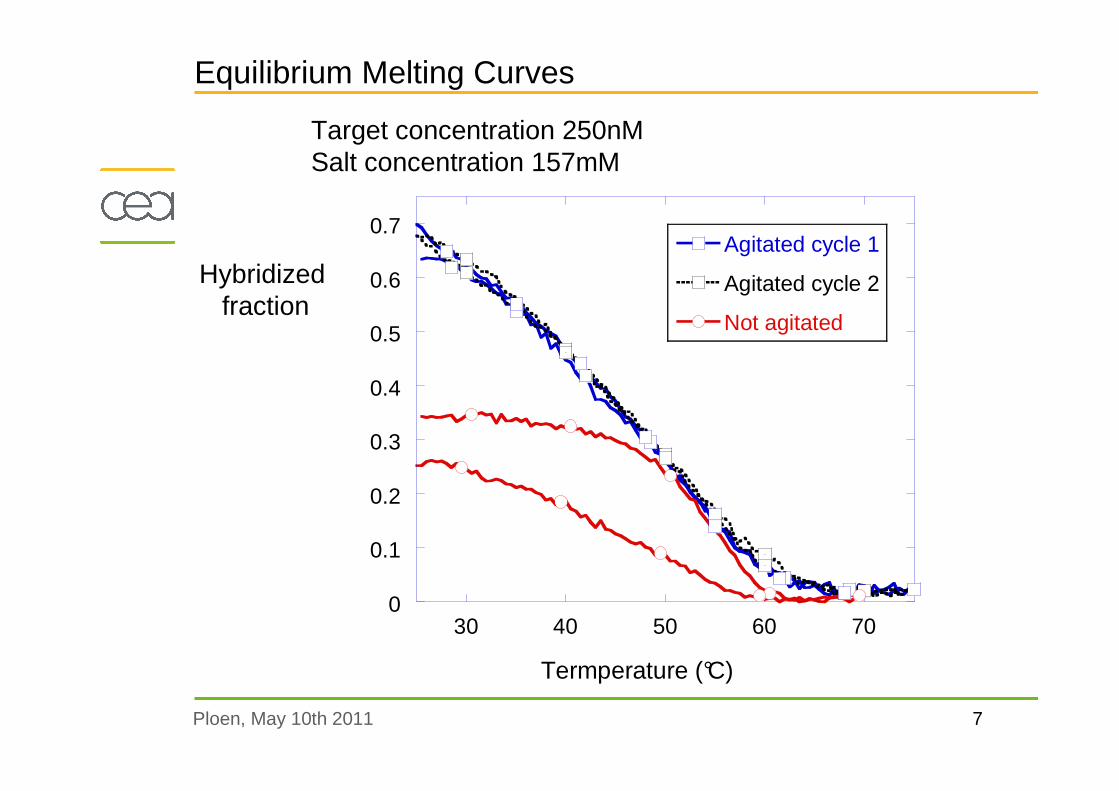
Equilibrium Melting Curves
Target concentration 250nM Salt concentration 157mM
0
0.1
0.2
0.3
0.4
0.5
0.6
0.7
30 40 50 60 70
Agitated cycle 1
Agitated cycle 2
Not agitated
Termperature (°C)
Hybridized fraction

8Ploen, May 10th 2011
Model for electrostatic interactions
• DNA = Highly charged polymer– One charge per base
– Spot = Charged surface
• Importance of Electrostatic Interactions
– Effect of probe density σ– Effect of salt concentration cs
• Hybridization
– Increasing charge : (Np+Ntθ) σ• Salt concentration
– Screening effect increases with salt concentration cs
• Hyp: Uniformly charged width H and Np=Nt
• Modified Langmuir Model
θθ−1
tc
Γ=0
Γ>0
)1(
1θ
θθ +Γ−=−
eKc ptt withs
p
s
p
c
c
Hc
N==Γ
σNote : at high salt 0≈Γ
Competition Free Experiment
HNt bases Np
bases
cp probe base concentration
A. Halperin et al., Biophys. J. 86 , 718 (2004)

9Ploen, May 10th 2011
Electrostatic interactions on microarrays
0
0.2
0.4
0.6
0.8
1
30 40 50 60 70
157mM Na+ (1)
157mM Na+ (2)
220mM Na+
320mM Na+
420mM Na+
520mM Na+
620mM Na+
Hyb
ridiz
ed fr
actio
n θθ θθ
Temperature T(°C)
Salt concentration dependence of the melting curves
Collapse following the modelwith a single parameter
-2
-1
0
1
2
3
4
3.05 3.1 3.15 3.2 3.25 3.3
157nM
220nM
320nM
420nM
520nM
620nM
Fit
logθ
/(1-
θ)+
Γ(1+
θ)1000/T (1/K)
3035404550
Temperature (°C)
)1(
1θ
θθ +Γ−=−
eKc ptt
J. Fuchs et al. Biophys. J. 99 , 1886 (2010)
10Ploen, May 10th 2011
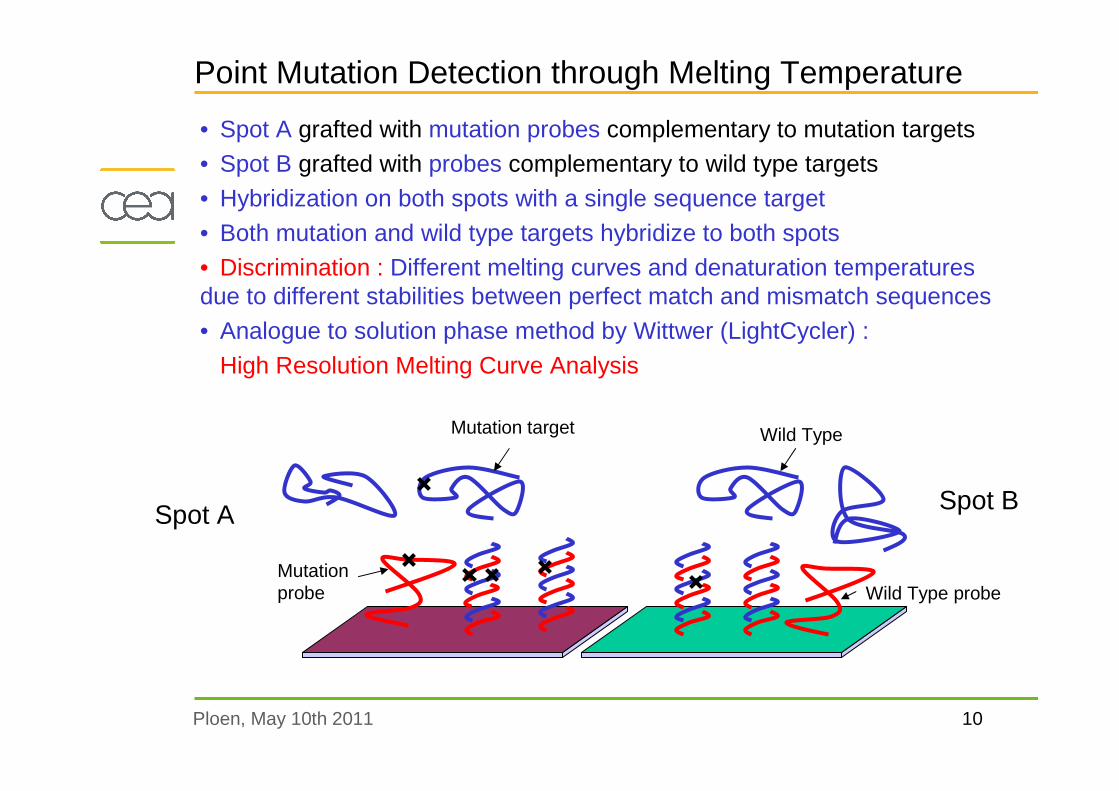
Point Mutation Detection through Melting Temperature
• Spot A grafted with mutation probes complementary to mutation targets• Spot B grafted with probes complementary to wild type targets
• Hybridization on both spots with a single sequence target
• Both mutation and wild type targets hybridize to both spots • Discrimination : Different melting curves and denaturation temperatures due to different stabilities between perfect match and mismatch sequences
• Analogue to solution phase method by Wittwer (LightCycler) :
High Resolution Melting Curve Analysis
Spot B
Wild Type
Wild Type probeMutationprobe
Spot A
Mutation target
11Ploen, May 10th 2011
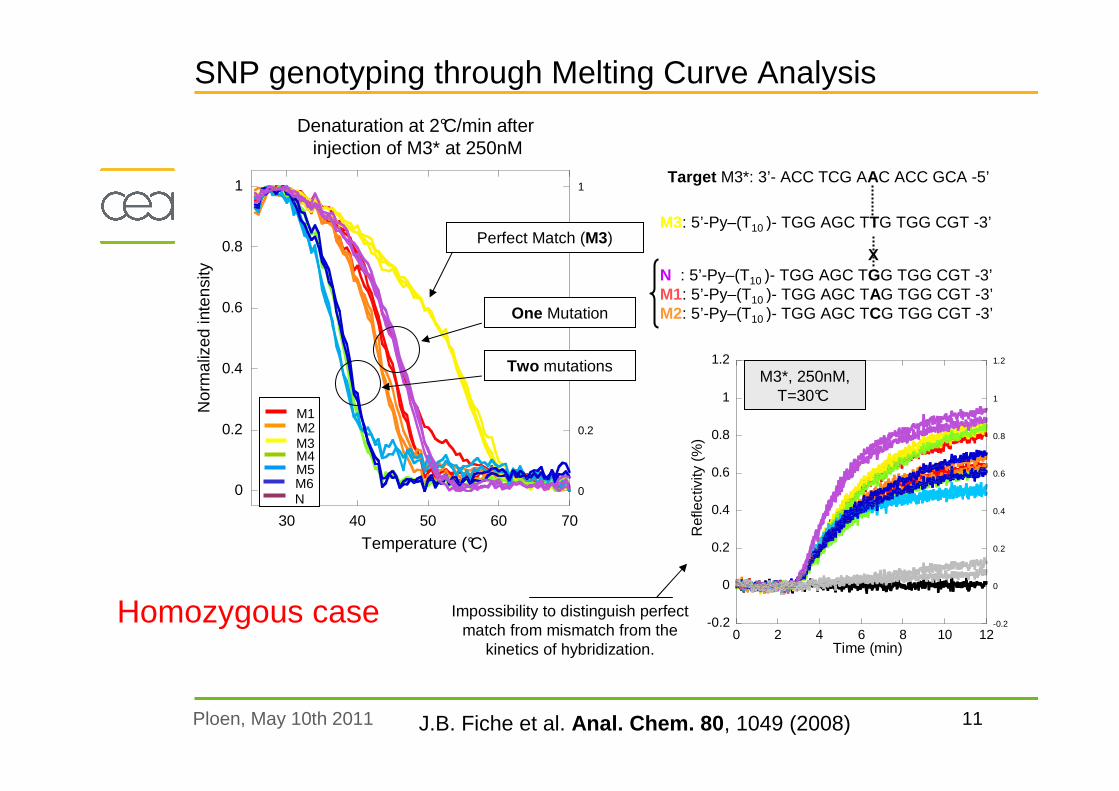
SNP genotyping through Melting Curve Analysis
0 2 4 6 8 10 12-0.2
0
0.2
0.4
0.6
0.8
1
1.2
-0.2
0
0.2
0.4
0.6
0.8
1
1.2
Ref
lect
ivity
(%
)
Time (min)
X
Target M3*: 3’- ACC TCG AAC ACC GCA -5’
M3: 5’-Py–(T10 )- TGG AGC TTG TGG CGT -3’
N : 5’-Py–(T10 )- TGG AGC TGG TGG CGT -3’M1: 5’-Py–(T10 )- TGG AGC TAG TGG CGT -3’M2: 5’-Py–(T10 )- TGG AGC TCG TGG CGT -3’
0
0.2
0.4
0.6
0.8
1
30 40 50 60 70
0
0.2
0.4
0.6
0.8
1
Temperature (°C)
Nor
mal
ized
inte
nsity
Perfect Match (M3)
One Mutation
Two mutations
Denaturation at 2°C/min afterinjection of M3* at 250nM
M1M2M3M4M5M6N
M3*, 250nM, T=30°C
Impossibility to distinguish perfectmatch from mismatch from the
kinetics of hybridization.
J.B. Fiche et al. Anal. Chem. 80 , 1049 (2008)
Homozygous case
12Ploen, May 10th 2011
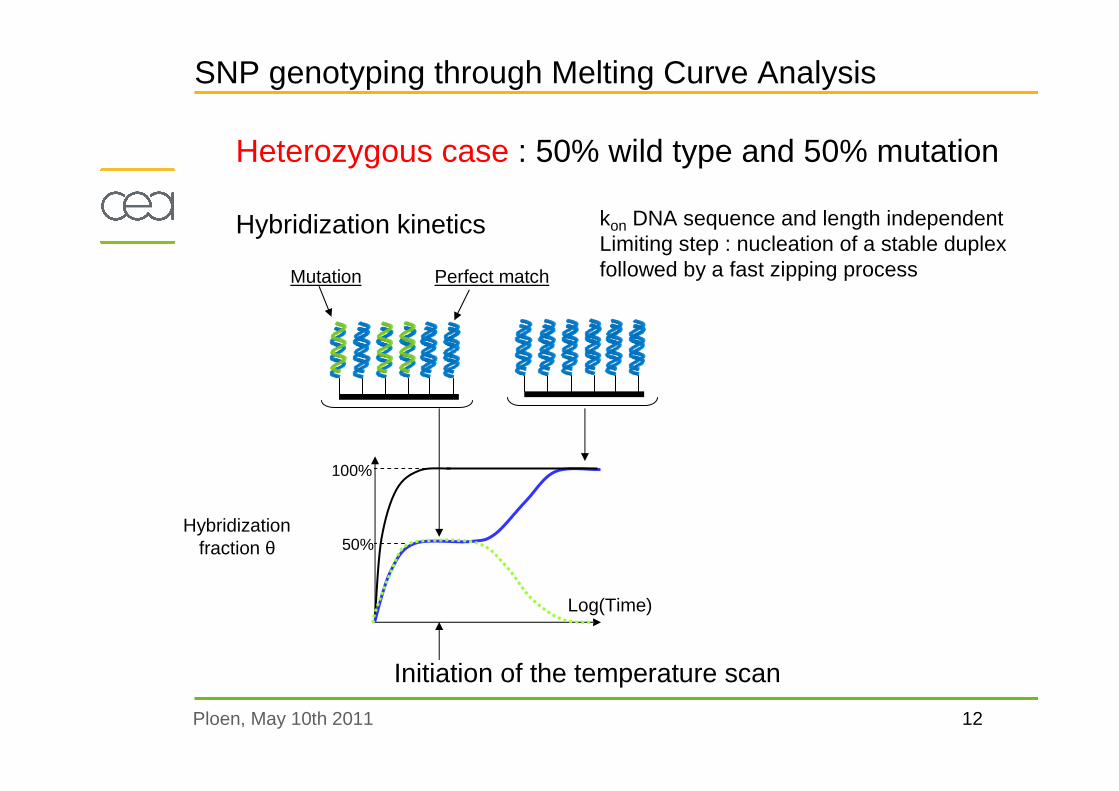
SNP genotyping through Melting Curve Analysis
Perfect matchMutation
Hybridizationfraction θ
Log(Time)
50%
100%
Initiation of the temperature scan
Heterozygous case : 50% wild type and 50% mutation
Hybridization kinetics kon DNA sequence and length independentLimiting step : nucleation of a stable duplexfollowed by a fast zipping process
13Ploen, May 10th 2011
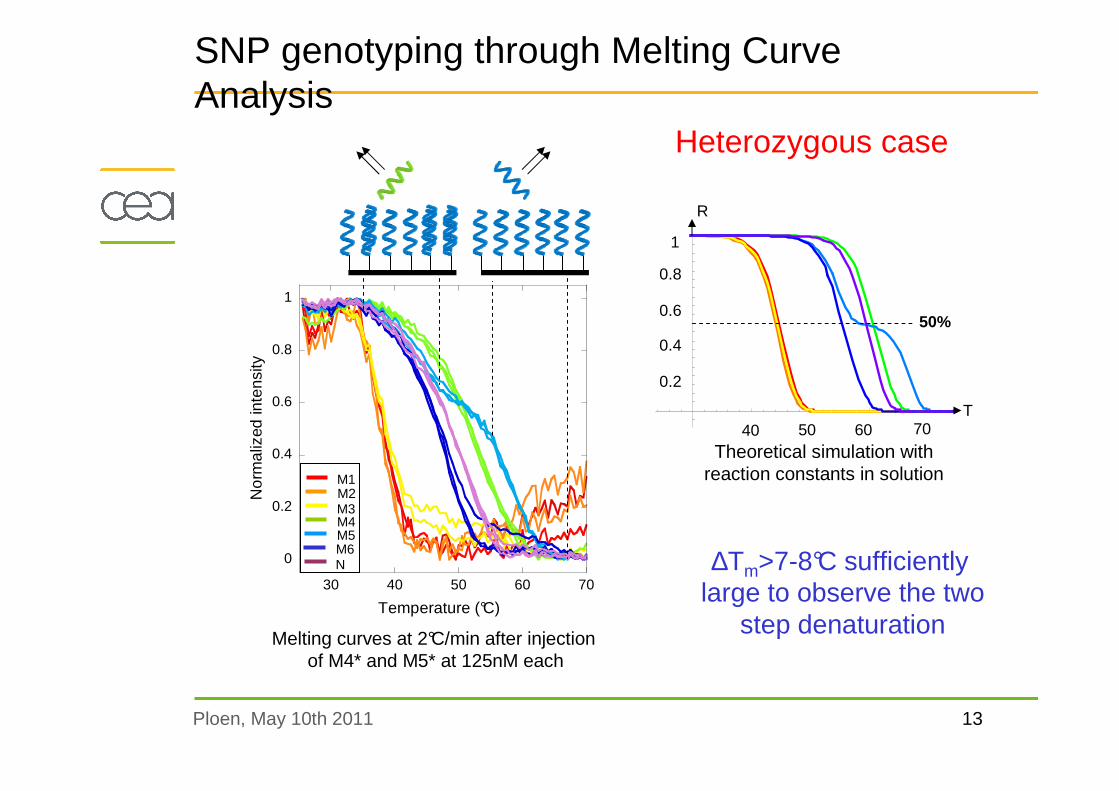
SNP genotyping through Melting Curve Analysis
Melting curves at 2°C/min after injection of M4* and M5* at 125nM each
0
0.2
0.4
0.6
0.8
1
30 40 50 60 70
Nor
mal
ized
inte
nsity
Temperature (°C)
M1M2M3M4M5M6N
40 50 60 70 80
0.2
0.4
0.6
0.8
1
Theoretical simulation withreaction constants in solution
1
0.8
0.6
0.4
0.2
40 50 60 70
50%
T
R
∆Tm>7-8°C sufficientlylarge to observe the two
step denaturation
Heterozygous case
14Ploen, May 10th 2011
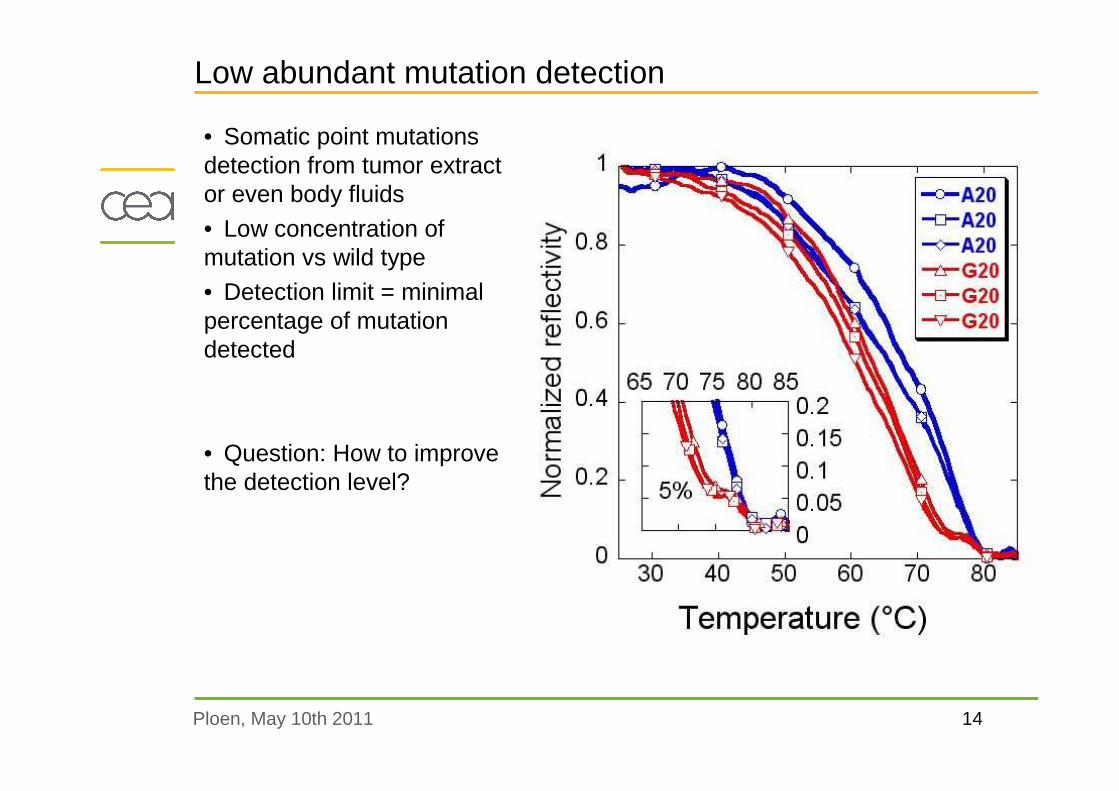
Low abundant mutation detection
• Somatic point mutations detection from tumor extract or even body fluids
• Low concentration of mutation vs wild type• Detection limit = minimal percentage of mutation detected
• Question: How to improve the detection level?
15Ploen, May 10th 2011
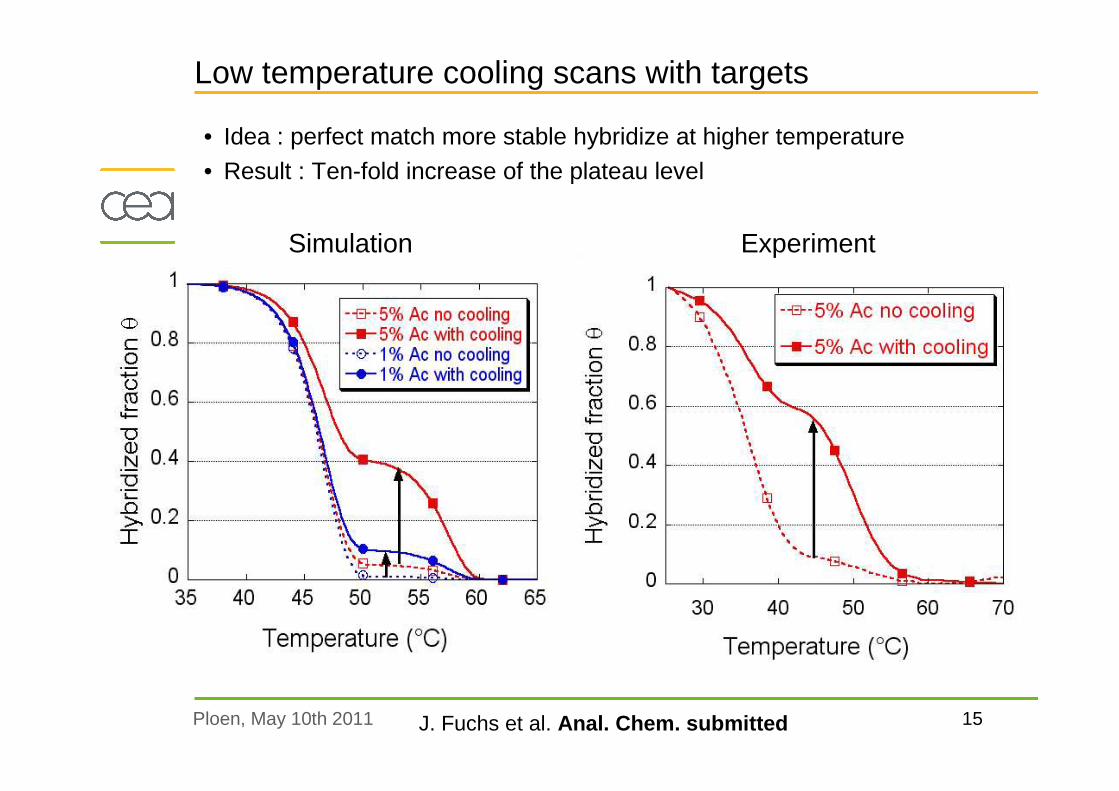
Low temperature cooling scans with targets
• Idea : perfect match more stable hybridize at higher temperature
• Result : Ten-fold increase of the plateau level
Simulation Experiment
J. Fuchs et al. Anal. Chem. submitted

16Ploen, May 10th 2011
Temperature cycles with targets
• Idea : Successive improvements by multiple cycles
• Result : Improvement dependent on the maximal temperature
• Experimental result for Tmax = 47°C
# mismatchwith targets
0
1
2
17Ploen, May 10th 2011
Conclusion
• Since hybridization is a thermodynamic reaction, temperature effects are important particularly on microarrays• Temperature affects equilibrium as well as out-of-equilibrium melting curves and also kinetics• Measuring equilibrium melting curves is experimentally possible
• It allows us to determine electrostatic effects, thermodynamic parameters and much more physico-chemical parameter effects on solid phase hybridization
• Possible applications : SNP genotyping or detection of somatic point mutations
• Drawbacks experienced for Fundamental Physico-Chemical studies
– Grafting chemistry : none seems satisfying
– Grafting density : independent determination difficult– Signal-to-noise ratio : low for precise confrontation to models
– Dependence of the platform used (SPRi, microarrays fabrication)

18Ploen, May 10th 2011
Acknowledgements
• Theory– A. Halperin (Liphy, Grenoble)
– E. B. Zhulina (St Petersbourg)
• Experiments– J.B. Fiche (PhD, 2006)
– J. Fuchs (PhD, 2009)
– C. Daniel (PhD, 2013)– F. Melaïne (Master 2 2011)
– R. Calemczuk (SPrAM/CREAB)
– Th. Livache (SPrAM/CREAB)– Y. Roupioz (SPrAM/CREAB)
• Collaborations
– M. Tabrizian (McGill, Canada)– D. Del Atti et M. Mascini (Firenze, Italy)
– E. Crapez (Canceropole Montpellier)