Embed Size (px)
Citation preview
Applied Energy 143 (2015) 383–394
Contents lists available at ScienceDirect
Applied Energy
journal homepage: www.elsevier .com/locate /apenergy
Temperature-dependent thermal properties of solid/liquid phase changeeven-numbered n-alkanes: n-Hexadecane, n-octadecane and n-eicosane
http://dx.doi.org/10.1016/j.apenergy.2015.01.0540306-2619/� 2015 Elsevier Ltd. All rights reserved.
⇑ Corresponding author. Tel.: +34 91 394 5185.E-mail address: [email protected] (M. Khayet).
C. Vélez, M. Khayet ⇑, J.M. Ortiz de ZárateDepartment of Applied Physics I, Faculty of physics, University Complutense of Madrid, Avda. Complutense s/n, Madrid 28040, Spain
h i g h l i g h t s
� Thermal properties of n-hexadecane,n-octadecane and n-eicosane used asPCM are reported.� Thermal conductivity and thermal
diffusivity were measured by the hotwire technique at differenttemperatures.� A discontinuity in thermal
conductivity and diffusivity wasdetected near the meltingtemperature.� No literature data were found for the
thermal diffusivity of the three n-alkanes considered in this study.� The cumulative heat stored increases
with the number of carbon in the n-alkane hydrocarbon chain.
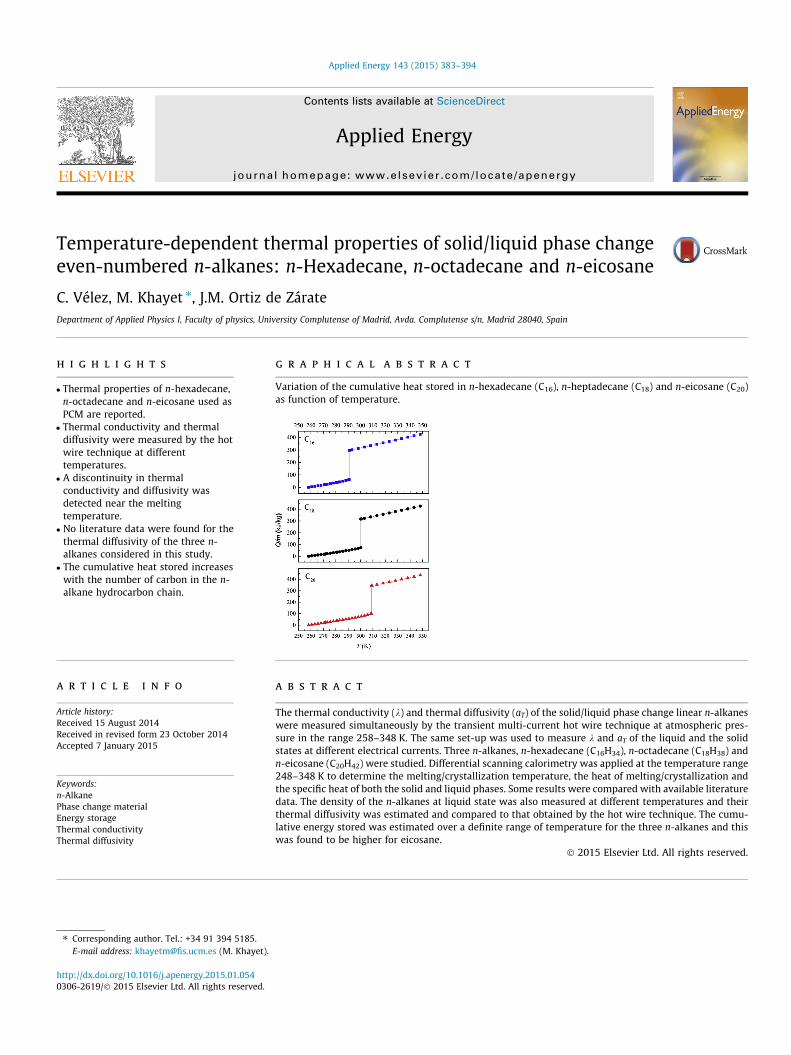
g r a p h i c a l a b s t r a c t
Variation of the cumulative heat stored in n-hexadecane (C16), n-heptadecane (C18) and n-eicosane (C20)as function of temperature.
a r t i c l e i n f o
Article history:Received 15 August 2014Received in revised form 23 October 2014Accepted 7 January 2015
Keywords:n-AlkanePhase change materialEnergy storageThermal conductivityThermal diffusivity
a b s t r a c t
The thermal conductivity (k) and thermal diffusivity (aT) of the solid/liquid phase change linear n-alkaneswere measured simultaneously by the transient multi-current hot wire technique at atmospheric pres-sure in the range 258–348 K. The same set-up was used to measure k and aT of the liquid and the solidstates at different electrical currents. Three n-alkanes, n-hexadecane (C16H34), n-octadecane (C18H38) andn-eicosane (C20H42) were studied. Differential scanning calorimetry was applied at the temperature range248–348 K to determine the melting/crystallization temperature, the heat of melting/crystallization andthe specific heat of both the solid and liquid phases. Some results were compared with available literaturedata. The density of the n-alkanes at liquid state was also measured at different temperatures and theirthermal diffusivity was estimated and compared to that obtained by the hot wire technique. The cumu-lative energy stored was estimated over a definite range of temperature for the three n-alkanes and thiswas found to be higher for eicosane.
� 2015 Elsevier Ltd. All rights reserved.
384 C. Vélez et al. / Applied Energy 143 (2015) 383–394
1. Introduction
Thermal energy can be stored as sensible heat, latent heat,thermo-chemical (i.e., heat involved in a reversible chemicalreaction) or any combination between them. Among these meth-ods, latent heat energy storage is particularly attractive due to itshigh-energy storage density (i.e., heat per unit volume) and to itsability to provide heat at a relatively constant temperature, whichcorresponds to the phase transition temperature of the used phasechange material (PCM) [1–4].
In recent years, development of thermal energy storage systemsusing PCMs has gained a considerable importance in many applica-tions such as in solar energy systems, in industrial waste heat andin energy-conserving buildings. PCMs can store from 5 to 14 timesmore heat per unit volume (i.e., storage density) than the sensiblestorage based materials such as water [2,5–8].
Among the four phase change possibilities (solid/gas, liquid/gas,solid/solid, and solid/liquid), solid/liquid transition is the mostpromising and economically attractive one for thermal energystorage systems. During melting cycle, energy is stored as latentheat of fusion, and then it is recovered during the solidificationstep. Compared to solid/gas and liquid/gas transitions, solid/liquidtransition involves smaller change in volume (<10%) and thereforerequires smaller space for storing although it involves, compara-tively, smaller latent heat. On the other hand, in solid/solid transi-tions, heat is stored as a consequence of the crystalline change ofthe material and the involved latent heat as well as the volumechange is less than those of solid/liquid transition. There are vari-eties of PCMs, both organic and inorganic, that melt and solidifyat a wide range of temperatures and therefore are attractive in anumber of applications [1,3,8–14]. A large number of solid/liquidPCMs have been studied for heating and cooling applications[7,9,15,16]. Therefore, for efficient heat recovery or energy storagedesign processes, it is necessary a good knowledge of the thermo-physical properties of these PCMs in a wide range of temperatureintervals.
The PCM should have suitable thermo-physical and chemicalcharacteristics such as a phase-transition temperature in thedesired operating temperature range, a high latent heat of transi-tion per unit volume to allow a small size of the energy storagecontainer, a high specific heat to provide additional sensible heatstorage, a high thermal conductivity of both solid and liquidphases, a high density, a small volume change on phase transition,non-toxic, non-corrosive, non-flammable and not expensive.Except for the melting point in the desirable operating range, themajority of the used PCMs do not satisfy all these cited propertiesfor an adequate storage system.
The inorganic PCMs exhibit generally a volumetric latentthermal energy storage capacity higher than that of organic PCMs.However, the organic PCMs melt congruently, have self-nucleationand are non-corrosive of the materials of construction. Paraffinwaxes and linear n-alkanes (with the chemical formula CnH2n+2)belong to the latter group of PCMs and have some attractive fea-tures for solar energy systems [17]. It must be clarified that linearn-alkanes with number of carbons between 12 and 40 are knownas paraffins. The n-alkanes have a large range of latent heats, var-ious melting points, densities and specific heats [17]. However,an undesirable characteristic of n-alkanes is their low k values,which may diminish the rate of the charging and discharging ofthe energy storage during the melting and solidification cycles. Ingeneral, for PCMs the higher k the more efficient is the rate of heattransfer. Different possibilities have been adopted in order tocompensate for the low k values such as the use of finned configu-rations, containers and heat exchangers with adequate andimproved designs to ensure efficient extraction and storage of heat,
PCM encapsulation in different geometries, formation of compositeby dispersing high-conductivity particles of different sizes andshapes, embedding metal matrix structures into PCMs, etc.[1,6,11,12,14,18–21].
Specific heat of n-alkanes has been thoroughly investigatedusing differential scanning calorimetry (DSC) by different researchgroups [22–24]. Comparatively, few research studies have beencarried out on k measurements of liquid n-alkanes [25–36] andsolid n-alkanes but most of them were carried out near the solid/liquid phase transition temperature [26,37–41]. The thermal diffu-sivity (aT) of n-alkanes including both solid and liquid phases hasnot yet been systematically studied by the hot wire technique.The reported data so far are for n-tricosane (C23H48), n-tetracosane(C24H50) and n-pentacosane (C25H52), measured by Fourier Trans-form Temperature Wave Analysis (FT-TWA) [42,43] and for liquidn-alkanes (CnH2n+2; n = 5–10) by the transient hot wire technique[36]. Additionally, aT was estimated for a commercial paraffinPCM from the measured thermal conductivity (k), density (q) andspecific heat (cp) (i.e., aT = k/(qcp)) [5,44,45]. Moreover, it must bepointed out that most of the available k values of n-alkanes arerather old and were performed either for the solid or for the liquidphases and not for both solid and liquid phases including the phasetransition region.
The present paper is intended to discuss the thermal character-istics of the even-numbered n-alkanes, n-hexadecane, n-octadecaneand n-eicosane for applications as low-temperature phase changeenergy storage medium. These n-alkanes are named hereafter C16,C18 and C20, respectively. C16 is liquid at room temperature andatmospheric pressure, whereas C18 and C20 are waxy solids. Thetransient multi-current hot wire technique, accepted as the mostprecise and reliable method to measure k of fluids over a wide rangeof temperatures and pressures [26–29], was used in this study forthe first time for both k and aT measurements of solid and liquidphases of PCMs. The melting/crystallization temperature, the heatof melting/crystallization and the specific heat of both the solidand liquid phases were determined by DSC.
2. Experimental
2.1. Materials
The used n-alkanes samples, n-hexadecane (C16H34), n-octadecane (C18H38) and n-eicosane (C20H42) having minimumpurities of 99% were supplied by Sigma–Aldrich. The samples wereused without any further purification or removal of dissolvedwater or air and no information was provided regarding the natureof the impurities. To check the adequate k measurements of thewire, distilled water and dimethyl phthalate (99% purity, Sigma–Aldrich) with known k values were used. Ethylene glycol (Fluka,99.5%) was used as a thermostatic liquid. Methanol (99.8% purity,Sigma–Aldrich) and distilled water were used for calibration ofthe densimeter.
2.2. Measurements
The density of the n-alkane hydrocarbons was measured at dif-ferent temperatures in liquid phase with a densimeter (LudwigSchneider) having an accuracy of 1% and with an Anton PaarDMA 58 having a precision of ±0.05 kg/m3.
Temperature variation test of the samples with time was car-ried out using a glass tube placed inside a thermostatic bath (LaudaECO RE630) with a graduated heating and cooling option. For theseexperiments the applied heating/cooling rate was set to 0.2 �C/min.The sample was first melted, if not liquid at room temperature, and
C. Vélez et al. / Applied Energy 143 (2015) 383–394 385
then it was introduced in the glass tube having an internal diame-ter of 4 cm and a height of 32 cm. The volume of the samples wasmaintained the same (350 ml). A calibrated platinum resistancethermometer (F250-MK2 Precision thermometer, Automatic Sys-tems Laboratories LTD) was placed inside the glass tube containingthe sample. The platinum thermometer was interfaced to a com-puter having a written code that permits to register the tempera-ture each 4 min and control the experiment. These tests permitto localize the phase change temperatures and compare theircorresponding time.
The melting (Tm) and crystallization (Tc) temperatures of thesamples together with their corresponding latent heats (DHm andDHc) were measured using differential scanning calorimetry(DSC1 instrument, Mettler Toledo) equipped with the softwareSTARe for thermal data analysis. Indium was used as standardreference for the calibration of the instrument and the samples(7–9 mg) were sealed in aluminum pans. The tests were carriedout in the temperature range 248–348 K at a heating rate of 2 �C/min and under a constant nitrogen flow rate at atmospheric pres-sure. The specific heat (cp) of both the solid and liquid samples wasdetermined for each n-alkane by DSC performed under a heating/cooling rate of 5 �C/min using the following expression:
cp ¼HFmm
ð1Þ
where HF is the heat flow, m is the used scanning speed and m is theweight of the sample.
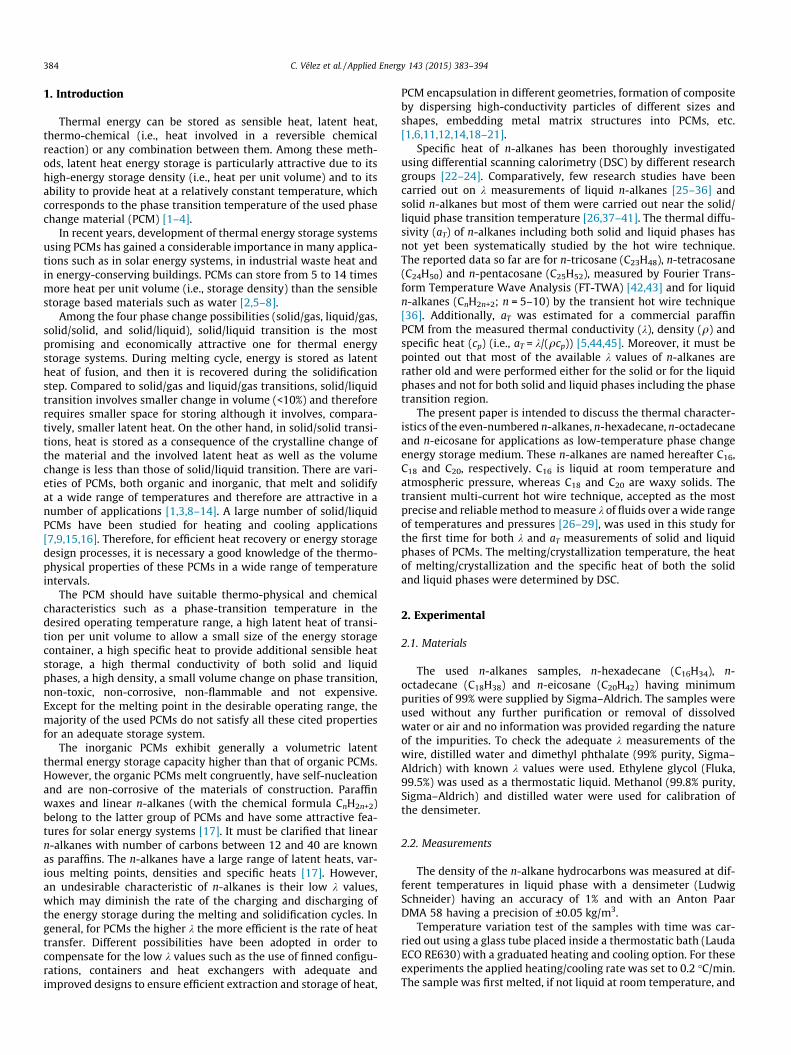
As it was indicated previously, k and aT were measured usingthe transient hot wire method. The experimental set-up shownin Fig. 1 and the method employed are essentially similar to theones used in our laboratory for the measurement of k of several flu-ids [25–27]. Since the details of the experimental set-up and theprinciples of measurements have been described elsewhere [25–27], only some minor changes will be noted. A vertical straightplatinum wire of 50 ± 0.001 lm diameter and 20.13 ± 0.01 cmlength was used. The two wire ends were soldered to tabs in achemically resistant flat frame cut from a circuit board. Two Teflonisolated leads were then soldered to the tabs, after which theconnections were covered by a thermal resistant epoxy. To avoid
Fig. 1. Schematic representation of the experimental set-up for the measurement of the tK20KS thermostatic circulation bath, (3) Keithley 2400 Source Meter, (4) computer, (5chamber temperature, and (7) atmospheric chamber with controlled temperature and h
electrical contact between the platinum wire and the samples,the wire and the frame supporting it were covered with a Teflon-based industrial coating with a thickness less than 1 lm. A Keithley2400 source-meter, which can act simultaneously as currentsource and voltage meter, was employed for electrical measure-ments. This source-meter is interfaced to a personal computerand a software code was written to retrieve the measurementpoints, fit the data, and then calculate k and aT. The electrical cur-rent is injected by two of the leads connected to the wire ends,while voltage measurements are acquired simultaneously usingthe other two leads. For each k and aT measurement, various cur-rent values, from 160 to 260 mA, were applied.
The n-alkane sample is first melted, if not liquid at room tem-perature, and poured in the inner volume of a double-wall cylindri-cal glass cell having an internal diameter of 4 cm, an externaldiameter of 6 cm and a height of 32 cm. Both the hot wire andthe platinum resistance thermometer are inserted inside the cellcontaining the n-alkane sample. The platinum thermometer is alsointerfaced to the personal computer controlling the experiment,and the same computer code manages simultaneously the ther-mometer and the electrical source-meter. Ethylene glycol is circu-lated from a thermostated bath (Lauda ECO RE630) through thejacket of the measurement glass cell in order to control the tem-perature of the sample within ±0.05 K. The whole measurementcell is placed inside a controlled laboratory environmental cham-ber (Mytron) that is set at the same temperature of the thermostat.The humidity of the chamber was maintained around 40%.
To ensure the adequate measurements of the wire, series ofexperimental runs using distilled water and dimethyl phthalateat different temperatures were performed at the beginning andat the end of each experiment as well as when switching betweenthe different n-alkanes. Comparisons with known values of k fordistilled water and dimethyl phthalate were made.
At the first beginning of the experiment, the temperature isestablished. Once steady state is reached, by means of the devel-oped software the electrical current was varied within the estab-lished range with a difference of 20 mA, which is applied to thewire every 4 min. The resistance of the wire (R0) at the beginningof the heating step, the electric potential (V) and the temperature
hermal conductivity (k) and thermal diffusivity (aT). (1) Measurement cell, (2) Lauda) ASL F250 reference thermometer, (6) Pt 100 digital thermometer for monitoringumidity (Mytron).
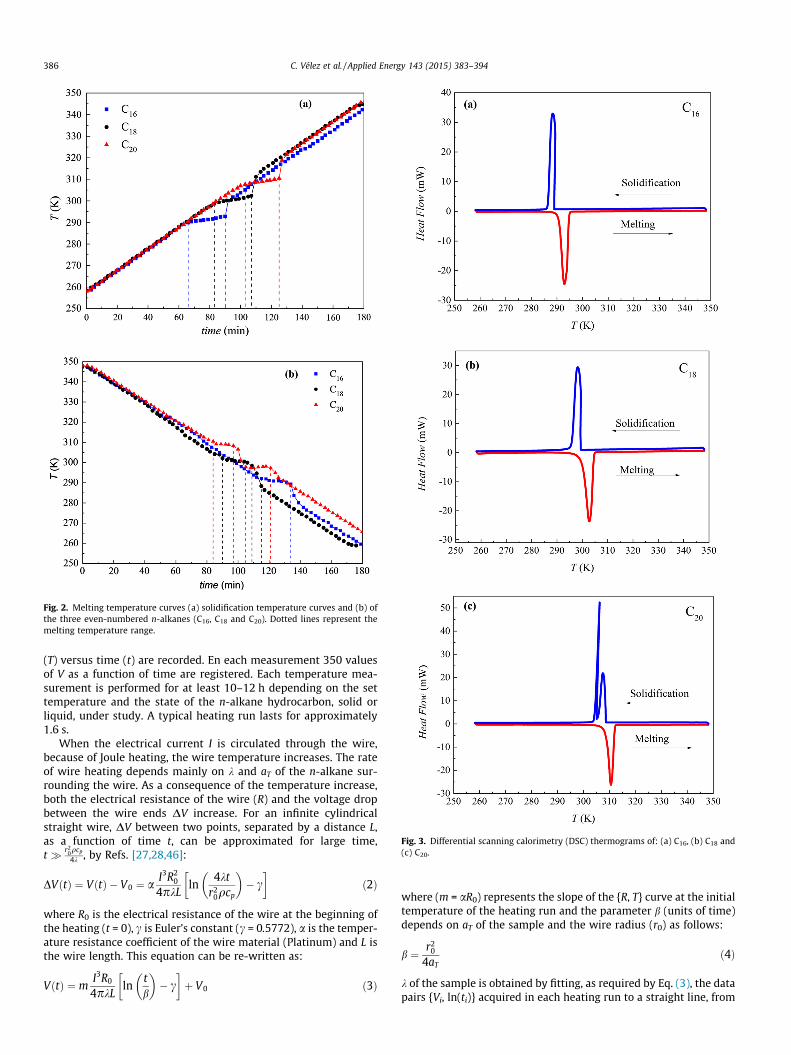
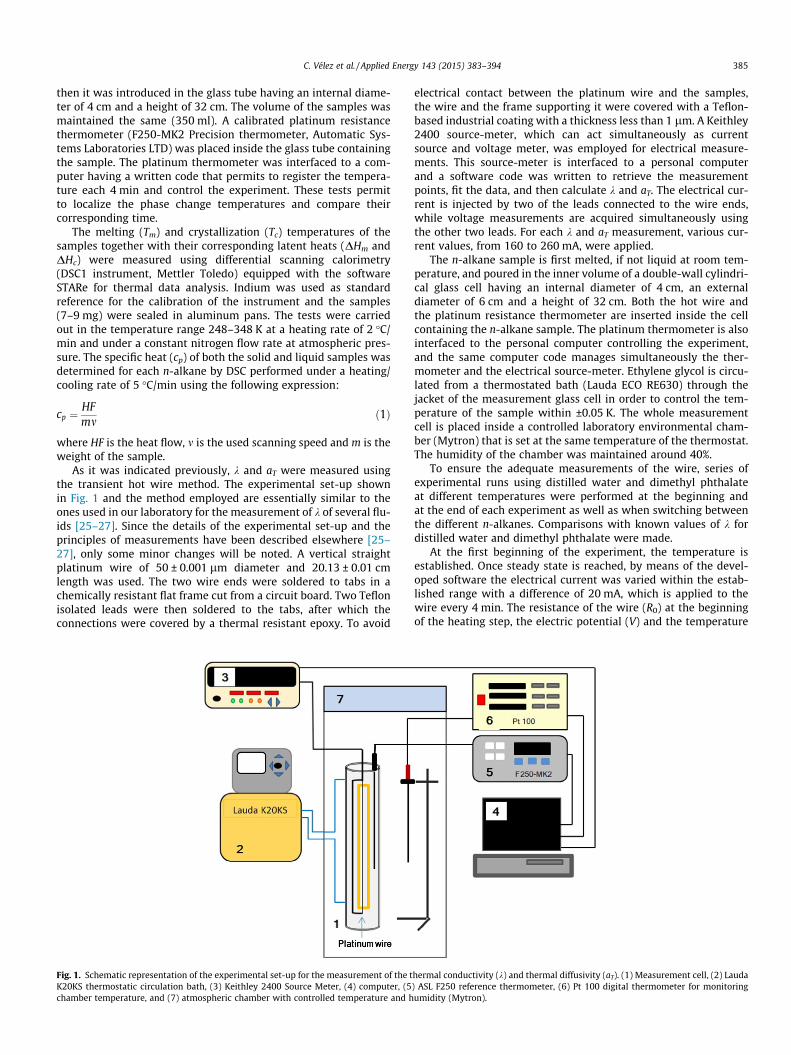
Fig. 2. Melting temperature curves (a) solidification temperature curves and (b) ofthe three even-numbered n-alkanes (C16, C18 and C20). Dotted lines represent themelting temperature range.
Fig. 3. Differential scanning calorimetry (DSC) thermograms of: (a) C16, (b) C18 and(c) C20.
386 C. Vélez et al. / Applied Energy 143 (2015) 383–394
(T) versus time (t) are recorded. En each measurement 350 valuesof V as a function of time are registered. Each temperature mea-surement is performed for at least 10–12 h depending on the settemperature and the state of the n-alkane hydrocarbon, solid orliquid, under study. A typical heating run lasts for approximately1.6 s.
When the electrical current I is circulated through the wire,because of Joule heating, the wire temperature increases. The rateof wire heating depends mainly on k and aT of the n-alkane sur-rounding the wire. As a consequence of the temperature increase,both the electrical resistance of the wire (R) and the voltage dropbetween the wire ends DV increase. For an infinite cylindricalstraight wire, DV between two points, separated by a distance L,as a function of time t, can be approximated for large time,t � r2
0qcp
4k , by Refs. [27,28,46]:
DVðtÞ ¼ VðtÞ � V0 ¼ aI3R2
0
4pkLln
4ktr2
0qcp
� �� c
� �ð2Þ
where R0 is the electrical resistance of the wire at the beginning ofthe heating (t = 0), c is Euler’s constant (c = 0.5772), a is the temper-ature resistance coefficient of the wire material (Platinum) and L isthe wire length. This equation can be re-written as:
VðtÞ ¼ mI3R0
4pkLln
tb
� �� c
� �þ V0 ð3Þ
where (m = aR0) represents the slope of the {R, T} curve at the initialtemperature of the heating run and the parameter b (units of time)depends on aT of the sample and the wire radius (r0) as follows:
b ¼ r20
4aTð4Þ
k of the sample is obtained by fitting, as required by Eq. (3), the datapairs {Vi, ln(ti)} acquired in each heating run to a straight line, from
Table 1Melting temperature (Tm), heat of melting (DHm), crystallization temperature (Tc), solid/solid transition temperature (Tr) and heat of crystallization (DHc) of C16, C18 and C20
determined from DSC thermograms presented in Fig. 3.
n-Alkane Melting Crystallization
Solid/liquid transition Liquid/solid transition Solid/solid transition
Tm (K) DHm (kJ/kg) Tc (K) Tr (K) DHc (J/g)a
C16 290.90 ± 0.006 235.13 ± 0.13 289.96 ± 0.16 – 236.89 ± 0.20C18 300.22 ± 0.095 243.68 ± 0.096 300.87 ± 0.10 – 244.53 ± 0.14C20 308.84 ± 0.15 247.05 ± 0.14 309.27 ± 0.001 305.42 ± 0.10 248.33 ± 0.18
a For C20 the indicated latent heat is the total considering both solid/solid and solid/liquid phase changes.
C. Vélez et al. / Applied Energy 143 (2015) 383–394 387
which a slope (S) and intercept (B) are derived. Since Eq. (3) is anasymptotic expansion for large t, only the points acquired after�412 ms were used in the fitting procedure. Finally, k and aT canbe determined from the following expressions:
k ¼ mI3R0
4pLS¼ A
I3R0
Sð5Þ
aT ¼r2
0
4exp
B� V0
Sþ c
� �ð6Þ
where A is a constant of the wire that depends on its effectivelength.
Table 2Reported melting temperature (Tm) and heat of melting (DHm) of C16, C18 and C20.
n-Alkane Tm (K) DHm (kJ/kg) Referencea
C16 291.25 236 [17]289.85 236 [23]291.49 235.65 [49]291.15 237 [50]
C18 301.25 244 [17]301.6 242.48 [49]301.15 243 [50]
C20 309.75 248 [17]310.3 ± 0.1 247.6 ± 0.2 [24]310.05 247.6 [49]310.15 247 [50]312.3 237.1 [51]
a The data reported in [23,24] were obtained from DSC analysis while the otherreported data in [17,49–51] no specific technique was mentioned. Tc and DHc valuesof C16 and C18 were not found. The only available Tc and DHc values are for of C20
and these were reported by Genovese et al. [24] and indicated in the text of thisstudy.
3. Results and discussions
Fig. 2 shows the melting and crystallization temperatures vari-ation curves with time of the three n-alkanes. The melting timewas estimated from the temperature curves as the time corre-sponding to a constant temperature of the n-alkane. This is24 min, 24 min and 22 min, for C16, C18 and C20, respectively. Thedetected melting temperature range is (289.91–292.78 K),(298.67–302.35 K) and (307.68–310.45 K) for C16, C18 and C20,respectively. It must be pointed out that the reduction of the melt-ing time corresponds to the higher k value of the n-alkane or to thegreater latent heat of melting and mass. Similar to the meltingcurve, from the solidification curve the corresponding temperaturerange and solidification time were determined for each n-alkane.The estimated crystallization time was 19 min for C16 and C18,whereas for C20 it was lower, 16 min and 13 min for liquid/solidtransition and solid/solid transition, respectively. The crystalliza-tion temperature range was (292.05–289.30 K) for C16 and(298.43–302.16 K) for C18; while for C20 it was (308.33–310.49 K)and (297.29–298.81 K) for liquid/solid and solid/solid transitions,respectively.
Fig. 3 shows the DSC curves of the three n-alkanes. From thequantitative analysis of the DSC thermograms, the melting temper-ature (Tm), the crystallization temperature (Tc), the solid/solid tran-sition temperature (Tr) of C20, the heat of melting (DHm) and theheat of crystallization (DHc) were determined. The results of threeDSC essays for each n-alkane are summarized in Table 1. It can beseen in Fig. 3 that the DSC thermograms of C16 and C18 have a sin-gle peak both for heating (i.e., melting) and cooling (i.e., crystalliza-tion), whereas C20 exhibits other than a single endothermicabsorption melting peak, two almost overlapping crystallizationpeaks. The minor peak represents the liquid/solid phase change(i.e., crystallization) while the large peak (called secondary peak)represents the solid/solid transition indicating the structural phasechange in the solid [28]. It must be pointed out that the presence oftwo peaks for C20 is characteristic of odd-numbered n-alkanes andhydrocarbons with carbon number greater or equal to 19 (i.e., n-nonadecane, C19H40). Triclinic structure (i.e., crystalline I) has beenconfirmed by X-ray Diffraction (XRD) at lower temperatures than
Tr while rotator crystal was reported for higher temperatures upto Tm [47,48].
For all n-alkanes, the temperatures Tm and Tc determined fromDSC curves by means of STARe software are found to be withinthe temperature ranges obtained from Fig. 2, except for the solid/solid transition temperature of C20. From DSC analysis this is305.42 K, whereas the temperature range shown in Fig. 2 is slightlylower (297.29–298.81 K). As it was claimed by Genovese et al. [24],this result may be attributed to the different solidification ratesapplied that were 2 �C/min in DSC and 0.2 �C/min in the thermo-static bath used to obtain the crystallization temperature curve.In addition, the discrepancy between the DSC and the temperaturecurves based values may be attributed to the amount of n-alkaneused in the experimental test 7–9 mg for DSC and about 272 g(350 ml) for temperature variation tests. The thermal stability ofa small amount is much better than for a large amount of sample.
It was observed a gradual increase of DHm, DHc, Tm and Tc withincreasing the number of carbon atoms of the n-alkane (seeTable 1). Table 2 summarizes some Tm and DHm reported valuesin other studies, which are found to be very close to the obtainedones in this study for the three n-alkane hydrocarbons (i.e., thedeviations were less than 0.8%), except the data reported by Jianget al. [51], which showed greater deviations 4.2% and 1.2% forDHm and Tm, respectively. This may be attributed to the higherheating rate used (i.e., 10 �C/min). It must be mentioned that, ingeneral, the three n-alkanes exhibit a satisfying latent heat capac-ity for latent heat thermal energy storage systems applications.
It is worth noting that Tc of C20 obtained by Genovese et al. [24],308.75 K, is quite similar to that obtained in this study, whereasthe Tr value reported by Genovese et al. [24] as initial solid/solidphase change temperature is 307.15 K, which is 0.6% greater thanthat obtained in this study. In Fig. 3(c) it can be seen the quick exo-thermic solid/solid phase change resulting in a slightly declinedpeak to higher temperature, which corresponds to an initial
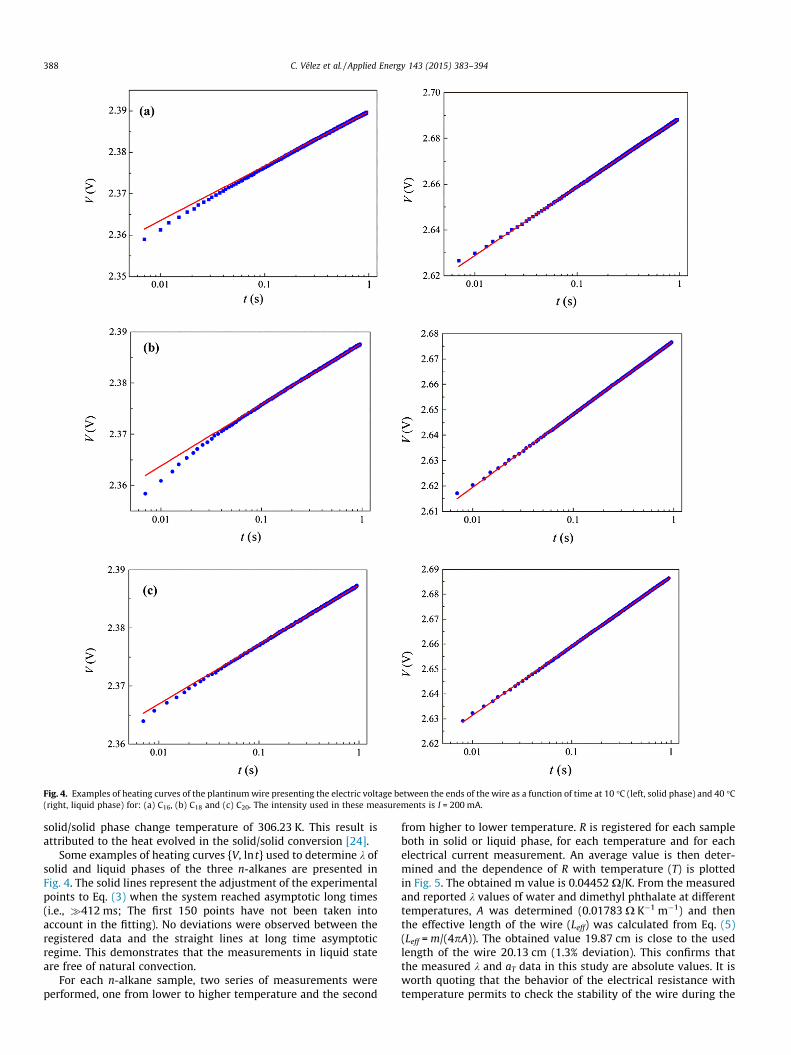
Fig. 4. Examples of heating curves of the plantinum wire presenting the electric voltage between the ends of the wire as a function of time at 10 �C (left, solid phase) and 40 �C(right, liquid phase) for: (a) C16, (b) C18 and (c) C20. The intensity used in these measurements is I = 200 mA.
388 C. Vélez et al. / Applied Energy 143 (2015) 383–394
solid/solid phase change temperature of 306.23 K. This result isattributed to the heat evolved in the solid/solid conversion [24].
Some examples of heating curves {V, ln t} used to determine k ofsolid and liquid phases of the three n-alkanes are presented inFig. 4. The solid lines represent the adjustment of the experimentalpoints to Eq. (3) when the system reached asymptotic long times(i.e., �412 ms; The first 150 points have not been taken intoaccount in the fitting). No deviations were observed between theregistered data and the straight lines at long time asymptoticregime. This demonstrates that the measurements in liquid stateare free of natural convection.
For each n-alkane sample, two series of measurements wereperformed, one from lower to higher temperature and the second
from higher to lower temperature. R is registered for each sampleboth in solid or liquid phase, for each temperature and for eachelectrical current measurement. An average value is then deter-mined and the dependence of R with temperature (T) is plottedin Fig. 5. The obtained m value is 0.04452 X/K. From the measuredand reported k values of water and dimethyl phthalate at differenttemperatures, A was determined (0.01783 X K�1 m�1) and thenthe effective length of the wire (Leff) was calculated from Eq. (5)(Leff = m/(4pA)). The obtained value 19.87 cm is close to the usedlength of the wire 20.13 cm (1.3% deviation). This confirms thatthe measured k and aT data in this study are absolute values. It isworth quoting that the behavior of the electrical resistance withtemperature permits to check the stability of the wire during the
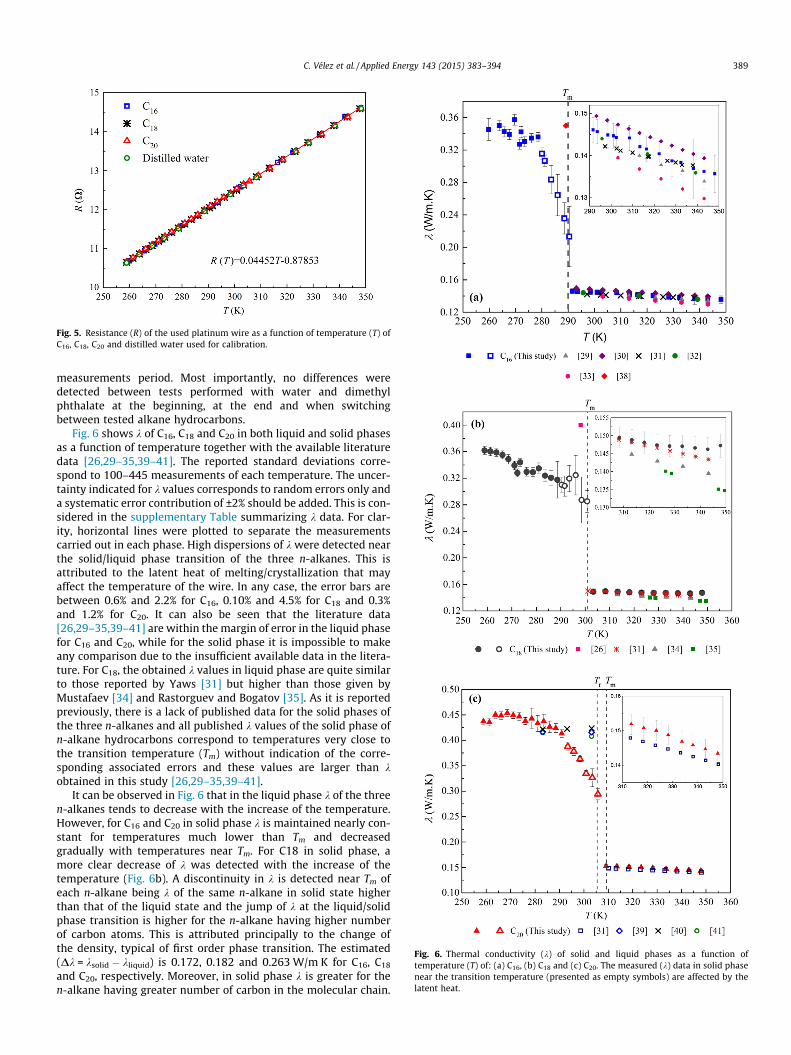
Fig. 5. Resistance (R) of the used platinum wire as a function of temperature (T) ofC16, C18, C20 and distilled water used for calibration.
Fig. 6. Thermal conductivity (k) of solid and liquid phases as a function oftemperature (T) of: (a) C16, (b) C18 and (c) C20. The measured (k) data in solid phasenear the transition temperature (presented as empty symbols) are affected by thelatent heat.
C. Vélez et al. / Applied Energy 143 (2015) 383–394 389
measurements period. Most importantly, no differences weredetected between tests performed with water and dimethylphthalate at the beginning, at the end and when switchingbetween tested alkane hydrocarbons.
Fig. 6 shows k of C16, C18 and C20 in both liquid and solid phasesas a function of temperature together with the available literaturedata [26,29–35,39–41]. The reported standard deviations corre-spond to 100–445 measurements of each temperature. The uncer-tainty indicated for k values corresponds to random errors only anda systematic error contribution of ±2% should be added. This is con-sidered in the supplementary Table summarizing k data. For clar-ity, horizontal lines were plotted to separate the measurementscarried out in each phase. High dispersions of k were detected nearthe solid/liquid phase transition of the three n-alkanes. This isattributed to the latent heat of melting/crystallization that mayaffect the temperature of the wire. In any case, the error bars arebetween 0.6% and 2.2% for C16, 0.10% and 4.5% for C18 and 0.3%and 1.2% for C20. It can also be seen that the literature data[26,29–35,39–41] are within the margin of error in the liquid phasefor C16 and C20, while for the solid phase it is impossible to makeany comparison due to the insufficient available data in the litera-ture. For C18, the obtained k values in liquid phase are quite similarto those reported by Yaws [31] but higher than those given byMustafaev [34] and Rastorguev and Bogatov [35]. As it is reportedpreviously, there is a lack of published data for the solid phases ofthe three n-alkanes and all published k values of the solid phase ofn-alkane hydrocarbons correspond to temperatures very close tothe transition temperature (Tm) without indication of the corre-sponding associated errors and these values are larger than kobtained in this study [26,29–35,39–41].
It can be observed in Fig. 6 that in the liquid phase k of the threen-alkanes tends to decrease with the increase of the temperature.However, for C16 and C20 in solid phase k is maintained nearly con-stant for temperatures much lower than Tm and decreasedgradually with temperatures near Tm. For C18 in solid phase, amore clear decrease of k was detected with the increase of thetemperature (Fig. 6b). A discontinuity in k is detected near Tm ofeach n-alkane being k of the same n-alkane in solid state higherthan that of the liquid state and the jump of k at the liquid/solidphase transition is higher for the n-alkane having higher numberof carbon atoms. This is attributed principally to the change ofthe density, typical of first order phase transition. The estimated(Dk = ksolid � kliquid) is 0.172, 0.182 and 0.263 W/m K for C16, C18
and C20, respectively. Moreover, in solid phase k is greater for then-alkane having greater number of carbon in the molecular chain.
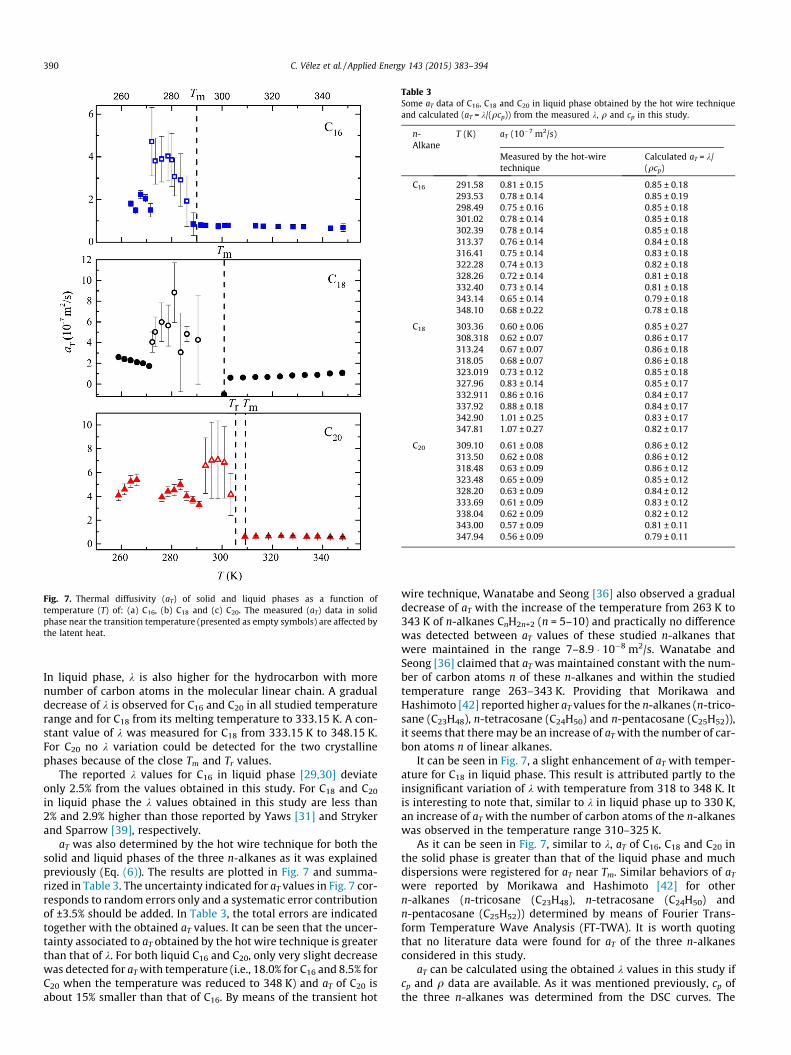
Fig. 7. Thermal diffusivity (aT) of solid and liquid phases as a function oftemperature (T) of: (a) C16, (b) C18 and (c) C20. The measured (aT) data in solidphase near the transition temperature (presented as empty symbols) are affected bythe latent heat.
Table 3Some aT data of C16, C18 and C20 in liquid phase obtained by the hot wire techniqueand calculated (aT = k/(qcp)) from the measured k, q and cp in this study.
n-Alkane
T (K) aT (10�7 m2/s)
Measured by the hot-wiretechnique
Calculated aT = k/(qcp)
C16 291.58 0.81 ± 0.15 0.85 ± 0.18293.53 0.78 ± 0.14 0.85 ± 0.19298.49 0.75 ± 0.16 0.85 ± 0.18301.02 0.78 ± 0.14 0.85 ± 0.18302.39 0.78 ± 0.14 0.85 ± 0.18313.37 0.76 ± 0.14 0.84 ± 0.18316.41 0.75 ± 0.14 0.83 ± 0.18322.28 0.74 ± 0.13 0.82 ± 0.18328.26 0.72 ± 0.14 0.81 ± 0.18332.40 0.73 ± 0.14 0.81 ± 0.18343.14 0.65 ± 0.14 0.79 ± 0.18348.10 0.68 ± 0.22 0.78 ± 0.18
C18 303.36 0.60 ± 0.06 0.85 ± 0.27308.318 0.62 ± 0.07 0.86 ± 0.17313.24 0.67 ± 0.07 0.86 ± 0.18318.05 0.68 ± 0.07 0.86 ± 0.18323.019 0.73 ± 0.12 0.85 ± 0.18327.96 0.83 ± 0.14 0.85 ± 0.17332.911 0.86 ± 0.16 0.84 ± 0.17337.92 0.88 ± 0.18 0.84 ± 0.17342.90 1.01 ± 0.25 0.83 ± 0.17347.81 1.07 ± 0.27 0.82 ± 0.17
C20 309.10 0.61 ± 0.08 0.86 ± 0.12313.50 0.62 ± 0.08 0.86 ± 0.12318.48 0.63 ± 0.09 0.86 ± 0.12323.48 0.65 ± 0.09 0.85 ± 0.12328.20 0.63 ± 0.09 0.84 ± 0.12333.69 0.61 ± 0.09 0.83 ± 0.12338.04 0.62 ± 0.09 0.82 ± 0.12343.00 0.57 ± 0.09 0.81 ± 0.11347.94 0.56 ± 0.09 0.79 ± 0.11
390 C. Vélez et al. / Applied Energy 143 (2015) 383–394
In liquid phase, k is also higher for the hydrocarbon with morenumber of carbon atoms in the molecular linear chain. A gradualdecrease of k is observed for C16 and C20 in all studied temperaturerange and for C18 from its melting temperature to 333.15 K. A con-stant value of k was measured for C18 from 333.15 K to 348.15 K.For C20 no k variation could be detected for the two crystallinephases because of the close Tm and Tr values.
The reported k values for C16 in liquid phase [29,30] deviateonly 2.5% from the values obtained in this study. For C18 and C20
in liquid phase the k values obtained in this study are less than2% and 2.9% higher than those reported by Yaws [31] and Strykerand Sparrow [39], respectively.
aT was also determined by the hot wire technique for both thesolid and liquid phases of the three n-alkanes as it was explainedpreviously (Eq. (6)). The results are plotted in Fig. 7 and summa-rized in Table 3. The uncertainty indicated for aT values in Fig. 7 cor-responds to random errors only and a systematic error contributionof ±3.5% should be added. In Table 3, the total errors are indicatedtogether with the obtained aT values. It can be seen that the uncer-tainty associated to aT obtained by the hot wire technique is greaterthan that of k. For both liquid C16 and C20, only very slight decreasewas detected for aT with temperature (i.e., 18.0% for C16 and 8.5% forC20 when the temperature was reduced to 348 K) and aT of C20 isabout 15% smaller than that of C16. By means of the transient hot
wire technique, Wanatabe and Seong [36] also observed a gradualdecrease of aT with the increase of the temperature from 263 K to343 K of n-alkanes CnH2n+2 (n = 5–10) and practically no differencewas detected between aT values of these studied n-alkanes thatwere maintained in the range 7–8.9 � 10�8 m2/s. Wanatabe andSeong [36] claimed that aT was maintained constant with the num-ber of carbon atoms n of these n-alkanes and within the studiedtemperature range 263–343 K. Providing that Morikawa andHashimoto [42] reported higher aT values for the n-alkanes (n-trico-sane (C23H48), n-tetracosane (C24H50) and n-pentacosane (C25H52)),it seems that there may be an increase of aT with the number of car-bon atoms n of linear alkanes.
It can be seen in Fig. 7, a slight enhancement of aT with temper-ature for C18 in liquid phase. This result is attributed partly to theinsignificant variation of k with temperature from 318 to 348 K. Itis interesting to note that, similar to k in liquid phase up to 330 K,an increase of aT with the number of carbon atoms of the n-alkaneswas observed in the temperature range 310–325 K.
As it can be seen in Fig. 7, similar to k, aT of C16, C18 and C20 inthe solid phase is greater than that of the liquid phase and muchdispersions were registered for aT near Tm. Similar behaviors of aT
were reported by Morikawa and Hashimoto [42] for othern-alkanes (n-tricosane (C23H48), n-tetracosane (C24H50) andn-pentacosane (C25H52)) determined by means of Fourier Trans-form Temperature Wave Analysis (FT-TWA). It is worth quotingthat no literature data were found for aT of the three n-alkanesconsidered in this study.
aT can be calculated using the obtained k values in this study ifcp and q data are available. As it was mentioned previously, cp ofthe three n-alkanes was determined from the DSC curves. The
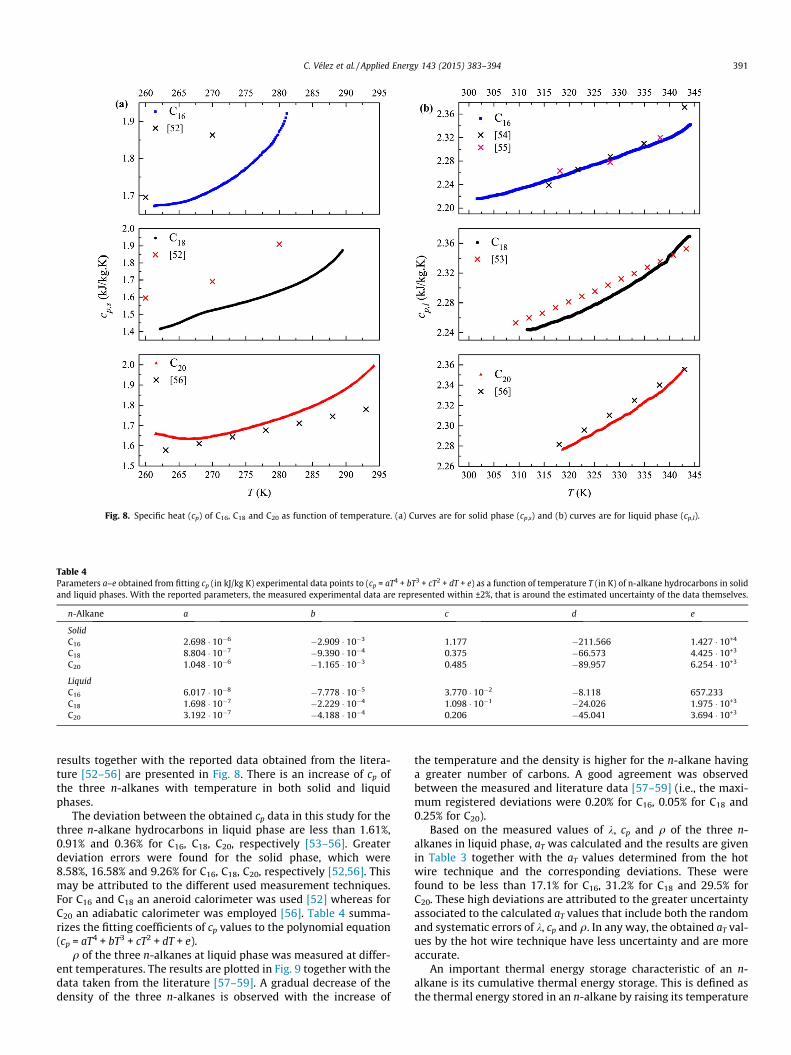
Fig. 8. Specific heat (cp) of C16, C18 and C20 as function of temperature. (a) Curves are for solid phase (cp,s) and (b) curves are for liquid phase (cp,l).
Table 4Parameters a–e obtained from fitting cp (in kJ/kg K) experimental data points to (cp = aT4 + bT3 + cT2 + dT + e) as a function of temperature T (in K) of n-alkane hydrocarbons in solidand liquid phases. With the reported parameters, the measured experimental data are represented within ±2%, that is around the estimated uncertainty of the data themselves.
n-Alkane a b c d e
SolidC16 2.698 � 10�6 �2.909 � 10�3 1.177 �211.566 1.427 � 10+4
C18 8.804 � 10�7 �9.390 � 10�4 0.375 �66.573 4.425 � 10+3
C20 1.048 � 10�6 �1.165 � 10�3 0.485 �89.957 6.254 � 10+3
LiquidC16 6.017 � 10�8 �7.778 � 10�5 3.770 � 10�2 �8.118 657.233C18 1.698 � 10�7 �2.229 � 10�4 1.098 � 10�1 �24.026 1.975 � 10+3
C20 3.192 � 10�7 �4.188 � 10�4 0.206 �45.041 3.694 � 10+3
C. Vélez et al. / Applied Energy 143 (2015) 383–394 391
results together with the reported data obtained from the litera-ture [52–56] are presented in Fig. 8. There is an increase of cp ofthe three n-alkanes with temperature in both solid and liquidphases.
The deviation between the obtained cp data in this study for thethree n-alkane hydrocarbons in liquid phase are less than 1.61%,0.91% and 0.36% for C16, C18, C20, respectively [53–56]. Greaterdeviation errors were found for the solid phase, which were8.58%, 16.58% and 9.26% for C16, C18, C20, respectively [52,56]. Thismay be attributed to the different used measurement techniques.For C16 and C18 an aneroid calorimeter was used [52] whereas forC20 an adiabatic calorimeter was employed [56]. Table 4 summa-rizes the fitting coefficients of cp values to the polynomial equation(cp = aT4 + bT3 + cT2 + dT + e).
q of the three n-alkanes at liquid phase was measured at differ-ent temperatures. The results are plotted in Fig. 9 together with thedata taken from the literature [57–59]. A gradual decrease of thedensity of the three n-alkanes is observed with the increase of
the temperature and the density is higher for the n-alkane havinga greater number of carbons. A good agreement was observedbetween the measured and literature data [57–59] (i.e., the maxi-mum registered deviations were 0.20% for C16, 0.05% for C18 and0.25% for C20).
Based on the measured values of k, cp and q of the three n-alkanes in liquid phase, aT was calculated and the results are givenin Table 3 together with the aT values determined from the hotwire technique and the corresponding deviations. These werefound to be less than 17.1% for C16, 31.2% for C18 and 29.5% forC20. These high deviations are attributed to the greater uncertaintyassociated to the calculated aT values that include both the randomand systematic errors of k, cp and q. In any way, the obtained aT val-ues by the hot wire technique have less uncertainty and are moreaccurate.
An important thermal energy storage characteristic of an n-alkane is its cumulative thermal energy storage. This is defined asthe thermal energy stored in an n-alkane by raising its temperature
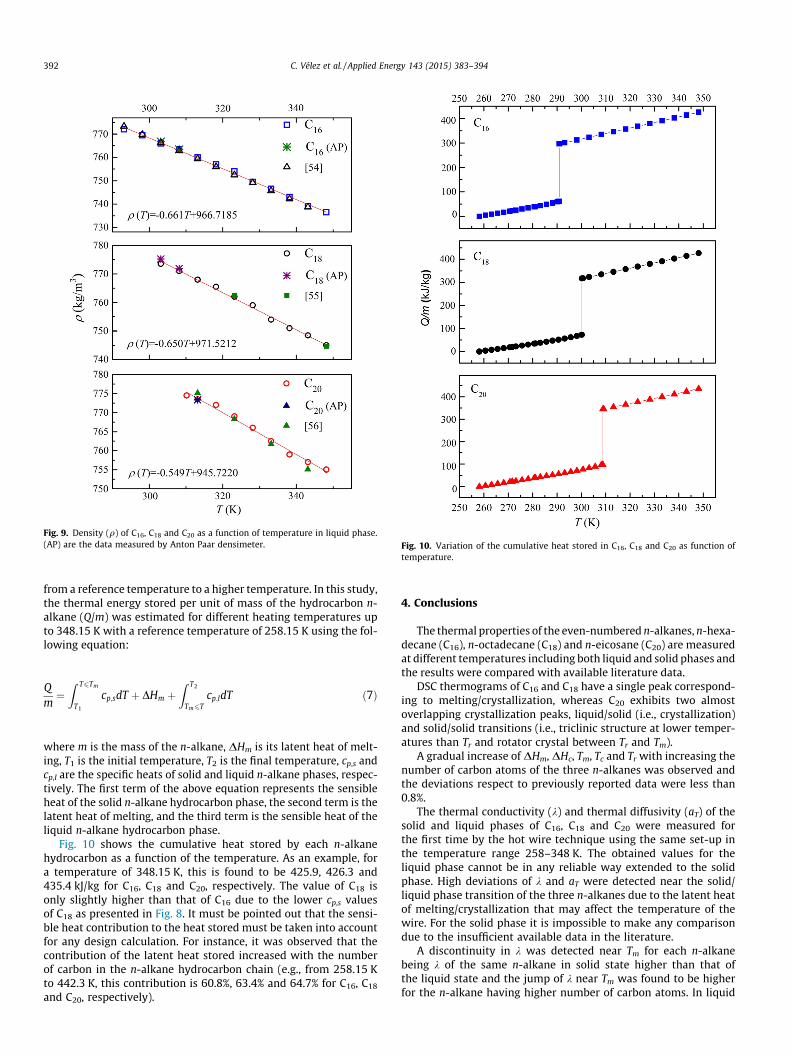
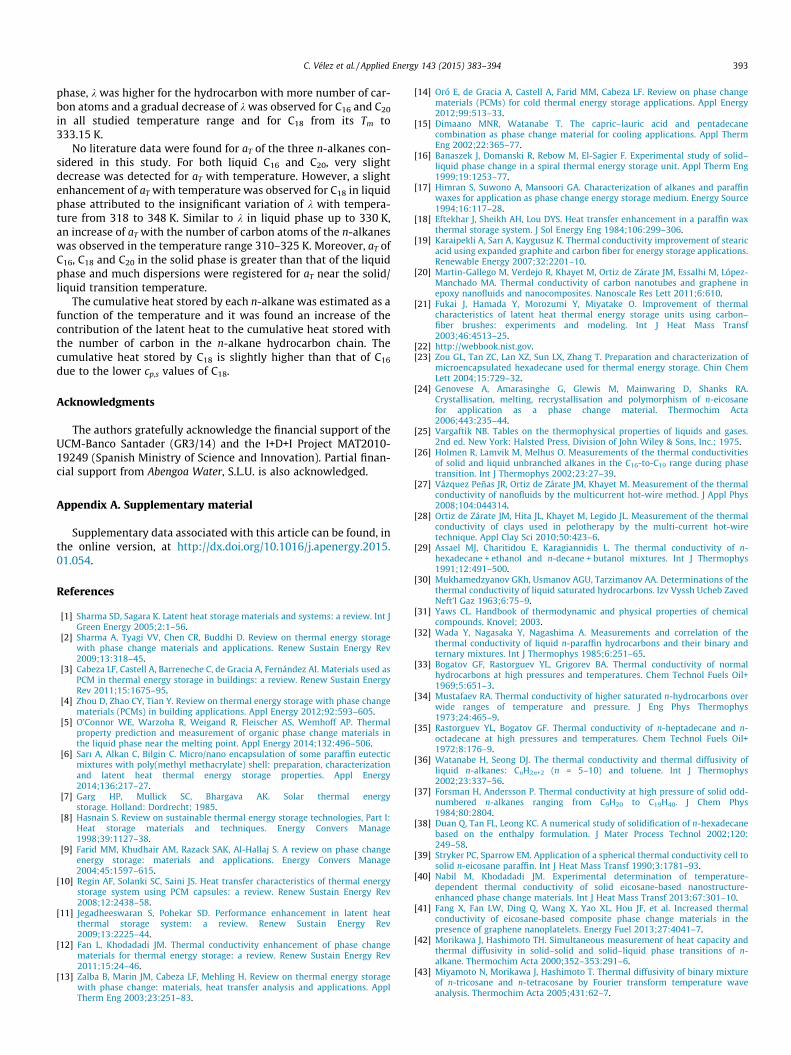
Fig. 9. Density (q) of C16, C18 and C20 as a function of temperature in liquid phase.(AP) are the data measured by Anton Paar densimeter. Fig. 10. Variation of the cumulative heat stored in C16, C18 and C20 as function of
temperature.
392 C. Vélez et al. / Applied Energy 143 (2015) 383–394
from a reference temperature to a higher temperature. In this study,the thermal energy stored per unit of mass of the hydrocarbon n-alkane (Q/m) was estimated for different heating temperatures upto 348.15 K with a reference temperature of 258.15 K using the fol-lowing equation:
Qm¼Z T6Tm
T1
cp;sdT þ DHm þZ T2
Tm6Tcp;ldT ð7Þ
where m is the mass of the n-alkane, DHm is its latent heat of melt-ing, T1 is the initial temperature, T2 is the final temperature, cp,s andcp,l are the specific heats of solid and liquid n-alkane phases, respec-tively. The first term of the above equation represents the sensibleheat of the solid n-alkane hydrocarbon phase, the second term is thelatent heat of melting, and the third term is the sensible heat of theliquid n-alkane hydrocarbon phase.
Fig. 10 shows the cumulative heat stored by each n-alkanehydrocarbon as a function of the temperature. As an example, fora temperature of 348.15 K, this is found to be 425.9, 426.3 and435.4 kJ/kg for C16, C18 and C20, respectively. The value of C18 isonly slightly higher than that of C16 due to the lower cp,s valuesof C18 as presented in Fig. 8. It must be pointed out that the sensi-ble heat contribution to the heat stored must be taken into accountfor any design calculation. For instance, it was observed that thecontribution of the latent heat stored increased with the numberof carbon in the n-alkane hydrocarbon chain (e.g., from 258.15 Kto 442.3 K, this contribution is 60.8%, 63.4% and 64.7% for C16, C18
and C20, respectively).
4. Conclusions
The thermal properties of the even-numbered n-alkanes, n-hexa-decane (C16), n-octadecane (C18) and n-eicosane (C20) are measuredat different temperatures including both liquid and solid phases andthe results were compared with available literature data.
DSC thermograms of C16 and C18 have a single peak correspond-ing to melting/crystallization, whereas C20 exhibits two almostoverlapping crystallization peaks, liquid/solid (i.e., crystallization)and solid/solid transitions (i.e., triclinic structure at lower temper-atures than Tr and rotator crystal between Tr and Tm).
A gradual increase of DHm, DHc, Tm, Tc and Tr with increasing thenumber of carbon atoms of the three n-alkanes was observed andthe deviations respect to previously reported data were less than0.8%.
The thermal conductivity (k) and thermal diffusivity (aT) of thesolid and liquid phases of C16, C18 and C20 were measured forthe first time by the hot wire technique using the same set-up inthe temperature range 258–348 K. The obtained values for theliquid phase cannot be in any reliable way extended to the solidphase. High deviations of k and aT were detected near the solid/liquid phase transition of the three n-alkanes due to the latent heatof melting/crystallization that may affect the temperature of thewire. For the solid phase it is impossible to make any comparisondue to the insufficient available data in the literature.
A discontinuity in k was detected near Tm for each n-alkanebeing k of the same n-alkane in solid state higher than that ofthe liquid state and the jump of k near Tm was found to be higherfor the n-alkane having higher number of carbon atoms. In liquid
C. Vélez et al. / Applied Energy 143 (2015) 383–394 393
phase, k was higher for the hydrocarbon with more number of car-bon atoms and a gradual decrease of k was observed for C16 and C20
in all studied temperature range and for C18 from its Tm to333.15 K.
No literature data were found for aT of the three n-alkanes con-sidered in this study. For both liquid C16 and C20, very slightdecrease was detected for aT with temperature. However, a slightenhancement of aT with temperature was observed for C18 in liquidphase attributed to the insignificant variation of k with tempera-ture from 318 to 348 K. Similar to k in liquid phase up to 330 K,an increase of aT with the number of carbon atoms of the n-alkaneswas observed in the temperature range 310–325 K. Moreover, aT ofC16, C18 and C20 in the solid phase is greater than that of the liquidphase and much dispersions were registered for aT near the solid/liquid transition temperature.
The cumulative heat stored by each n-alkane was estimated as afunction of the temperature and it was found an increase of thecontribution of the latent heat to the cumulative heat stored withthe number of carbon in the n-alkane hydrocarbon chain. Thecumulative heat stored by C18 is slightly higher than that of C16
due to the lower cp,s values of C18.
Acknowledgments
The authors gratefully acknowledge the financial support of theUCM-Banco Santader (GR3/14) and the I+D+I Project MAT2010-19249 (Spanish Ministry of Science and Innovation). Partial finan-cial support from Abengoa Water, S.L.U. is also acknowledged.
Appendix A. Supplementary material
Supplementary data associated with this article can be found, inthe online version, at http://dx.doi.org/10.1016/j.apenergy.2015.01.054.
References
[1] Sharma SD, Sagara K. Latent heat storage materials and systems: a review. Int JGreen Energy 2005;2:1–56.
[2] Sharma A, Tyagi VV, Chen CR, Buddhi D. Review on thermal energy storagewith phase change materials and applications. Renew Sustain Energy Rev2009;13:318–45.
[3] Cabeza LF, Castell A, Barreneche C, de Gracia A, Fernández AI. Materials used asPCM in thermal energy storage in buildings: a review. Renew Sustain EnergyRev 2011;15:1675–95.
[4] Zhou D, Zhao CY, Tian Y. Review on thermal energy storage with phase changematerials (PCMs) in building applications. Appl Energy 2012;92:593–605.
[5] O’Connor WE, Warzoha R, Weigand R, Fleischer AS, Wemhoff AP. Thermalproperty prediction and measurement of organic phase change materials inthe liquid phase near the melting point. Appl Energy 2014;132:496–506.
[6] Sarı A, Alkan C, Bilgin C. Micro/nano encapsulation of some paraffin eutecticmixtures with poly(methyl methacrylate) shell: preparation, characterizationand latent heat thermal energy storage properties. Appl Energy2014;136:217–27.
[7] Garg HP, Mullick SC, Bhargava AK. Solar thermal energystorage. Holland: Dordrecht; 1985.
[8] Hasnain S. Review on sustainable thermal energy storage technologies, Part I:Heat storage materials and techniques. Energy Convers Manage1998;39:1127–38.
[9] Farid MM, Khudhair AM, Razack SAK, Al-Hallaj S. A review on phase changeenergy storage: materials and applications. Energy Convers Manage2004;45:1597–615.
[10] Regin AF, Solanki SC, Saini JS. Heat transfer characteristics of thermal energystorage system using PCM capsules: a review. Renew Sustain Energy Rev2008;12:2438–58.
[11] Jegadheeswaran S, Pohekar SD. Performance enhancement in latent heatthermal storage system: a review. Renew Sustain Energy Rev2009;13:2225–44.
[12] Fan L, Khodadadi JM. Thermal conductivity enhancement of phase changematerials for thermal energy storage: a review. Renew Sustain Energy Rev2011;15:24–46.
[13] Zalba B, Marin JM, Cabeza LF, Mehling H. Review on thermal energy storagewith phase change: materials, heat transfer analysis and applications. ApplTherm Eng 2003;23:251–83.
[14] Oró E, de Gracia A, Castell A, Farid MM, Cabeza LF. Review on phase changematerials (PCMs) for cold thermal energy storage applications. Appl Energy2012;99:513–33.
[15] Dimaano MNR, Watanabe T. The capric–lauric acid and pentadecanecombination as phase change material for cooling applications. Appl ThermEng 2002;22:365–77.
[16] Banaszek J, Domanski R, Rebow M, El-Sagier F. Experimental study of solid–liquid phase change in a spiral thermal energy storage unit. Appl Therm Eng1999;19:1253–77.
[17] Himran S, Suwono A, Mansoori GA. Characterization of alkanes and paraffinwaxes for application as phase change energy storage medium. Energy Source1994;16:117–28.
[18] Eftekhar J, Sheikh AH, Lou DYS. Heat transfer enhancement in a paraffin waxthermal storage system. J Sol Energy Eng 1984;106:299–306.
[19] Karaipekli A, Sarı A, Kaygusuz K. Thermal conductivity improvement of stearicacid using expanded graphite and carbon fiber for energy storage applications.Renewable Energy 2007;32:2201–10.
[20] Martin-Gallego M, Verdejo R, Khayet M, Ortiz de Zárate JM, Essalhi M, López-Manchado MA. Thermal conductivity of carbon nanotubes and graphene inepoxy nanofluids and nanocomposites. Nanoscale Res Lett 2011;6:610.
[21] Fukai J, Hamada Y, Morozumi Y, Miyatake O. Improvement of thermalcharacteristics of latent heat thermal energy storage units using carbon–fiber brushes: experiments and modeling. Int J Heat Mass Transf2003;46:4513–25.
[22] http://webbook.nist.gov.[23] Zou GL, Tan ZC, Lan XZ, Sun LX, Zhang T. Preparation and characterization of
microencapsulated hexadecane used for thermal energy storage. Chin ChemLett 2004;15:729–32.
[24] Genovese A, Amarasinghe G, Glewis M, Mainwaring D, Shanks RA.Crystallisation, melting, recrystallisation and polymorphism of n-eicosanefor application as a phase change material. Thermochim Acta2006;443:235–44.
[25] Vargaftik NB. Tables on the thermophysical properties of liquids and gases.2nd ed. New York: Halsted Press, Division of John Wiley & Sons, Inc.; 1975.
[26] Holmen R, Lamvik M, Melhus O. Measurements of the thermal conductivitiesof solid and liquid unbranched alkanes in the C16-to-C19 range during phasetransition. Int J Thermophys 2002;23:27–39.
[27] Vázquez Peñas JR, Ortiz de Zárate JM, Khayet M. Measurement of the thermalconductivity of nanofluids by the multicurrent hot-wire method. J Appl Phys2008;104:044314.
[28] Ortiz de Zárate JM, Hita JL, Khayet M, Legido JL. Measurement of the thermalconductivity of clays used in pelotherapy by the multi-current hot-wiretechnique. Appl Clay Sci 2010;50:423–6.
[29] Assael MJ, Charitidou E, Karagiannidis L. The thermal conductivity of n-hexadecane + ethanol and n-decane + butanol mixtures. Int J Thermophys1991;12:491–500.
[30] Mukhamedzyanov GKh, Usmanov AGU, Tarzimanov AA. Determinations of thethermal conductivity of liquid saturated hydrocarbons. Izv Vyssh Ucheb ZavedNeft’I Gaz 1963;6:75–9.
[31] Yaws CL. Handbook of thermodynamic and physical properties of chemicalcompounds. Knovel; 2003.
[32] Wada Y, Nagasaka Y, Nagashima A. Measurements and correlation of thethermal conductivity of liquid n-paraffin hydrocarbons and their binary andternary mixtures. Int J Thermophys 1985;6:251–65.
[33] Bogatov GF, Rastorguev YL, Grigorev BA. Thermal conductivity of normalhydrocarbons at high pressures and temperatures. Chem Technol Fuels Oil+1969;5:651–3.
[34] Mustafaev RA. Thermal conductivity of higher saturated n-hydrocarbons overwide ranges of temperature and pressure. J Eng Phys Thermophys1973;24:465–9.
[35] Rastorguev YL, Bogatov GF. Thermal conductivity of n-heptadecane and n-octadecane at high pressures and temperatures. Chem Technol Fuels Oil+1972;8:176–9.
[36] Watanabe H, Seong DJ. The thermal conductivity and thermal diffusivity ofliquid n-alkanes: CnH2n+2 (n = 5–10) and toluene. Int J Thermophys2002;23:337–56.
[37] Forsman H, Andersson P. Thermal conductivity at high pressure of solid odd-numbered n-alkanes ranging from C9H20 to C19H40. J Chem Phys1984;80:2804.
[38] Duan Q, Tan FL, Leong KC. A numerical study of solidification of n-hexadecanebased on the enthalpy formulation. J Mater Process Technol 2002;120:249–58.
[39] Stryker PC, Sparrow EM. Application of a spherical thermal conductivity cell tosolid n-eicosane paraffin. Int J Heat Mass Transf 1990;3:1781–93.
[40] Nabil M, Khodadadi JM. Experimental determination of temperature-dependent thermal conductivity of solid eicosane-based nanostructure-enhanced phase change materials. Int J Heat Mass Transf 2013;67:301–10.
[41] Fang X, Fan LW, Ding Q, Wang X, Yao XL, Hou JF, et al. Increased thermalconductivity of eicosane-based composite phase change materials in thepresence of graphene nanoplatelets. Energy Fuel 2013;27:4041–7.
[42] Morikawa J, Hashimoto TH. Simultaneous measurement of heat capacity andthermal diffusivity in solid–solid and solid–liquid phase transitions of n-alkane. Thermochim Acta 2000;352–353:291–6.
[43] Miyamoto N, Morikawa J, Hashimoto T. Thermal diffusivity of binary mixtureof n-tricosane and n-tetracosane by Fourier transform temperature waveanalysis. Thermochim Acta 2005;431:62–7.
394 C. Vélez et al. / Applied Energy 143 (2015) 383–394
[44] Warzoha RJ, Weigand RM, Fleischer AS. Temperature-dependent thermalproperties of a paraffin phase change material embedded with herringbonestyle graphite nanofibers. Appl Energy 2014.
[45] Ukrainczyk N, Kurajica S, Sipusic J. Thermophysical comparison of fivecommercial paraffin waxes as latent heat storage materials. Chem BiochemEng Q 2010;24:129–37.
[46] Khayet M, Ortiz de Zárate JM. Application of the multi-current transient hot-wire technique for absolute measurements of the thermal conductivity ofglycols. Int J Thermophys 2005;26:637–46.
[47] Briard AJ, Bouroukba M, Petitjean D, Hubert N, Dirand M. Experimentalenthalpy increments from the solid phases to the liquid phase of homologousn-alkane series (C18–C38 and C41, C44, C46, C50, C54, and C60). J Chem Eng Data2003;48:497–513.
[48] Xie B, Liu G, Jiang S, Zhao Y, Wang D. Crystallization behaviors of n-octadecanein confined space. Crossover of rotator phase from transient to metastableinduced by surface freezing. J Phys Chem B 2008;112:13310–5.
[49] González JA, Zawadzki M, Domanska U. Thermodynamics of mixturescontaining polycyclic aromatic hydrocarbons. J Mol Liq 2008;143:134–40.
[50] Zhang P, Ma ZW, Wang RZ. An overview of phase change material slurries:MPCS and CHS. Renew Sustain Energy Rev 2010;14:598–614.
[51] Jiang F, Wang X, Wu D. Design and synthesis of magnetic microcapsules basedon n-eicosane core and Fe3O4/SiO2 hybrid shell for dual-functional phasechange materials. Appl Energy 2014;134:456–68.
[52] Parks GS, Moore GE, Renquist ML, Naylor BF, McClaine LA, Fujii PS, et al.Thermal data on organic compounds. XXV. Some heat capacity, entropy andfree energy data for nine hydrocarbons of high molecular weight. J Am ChemSoc 1949;71:3386–9.
[53] van Miltenburg JC. Fitting the heat capacity of liquid n-alkanes: newmeasurements of n-heptadecane and n-octadecane. Thermochim Acta2000;343:57–62.
[54] Petit JC, Minassian LT. Measurements of (dv/dt)P, (dv/dp)T, and (dh/dt)P by fluxcalorimetry. J Chem Thermodyn 1974;6:1139–52.
[55] Dadgostar N, Shaw JM. A predictive correlation for the constant-pressurespecific heat capacity of pure and ill-defined liquid hydrocarbons. Fluid PhaseEquilibr 2012;313:211–26.
[56] van Miltenburg JC, Oonk HAJ, Metivaud V. Heat capacities and derivedthermodynamic functions of n-nonadecane and n-eicosane between 10 K and390 K. J Chem Eng Data 1999;44:715–20.
[57] Outcalt S, Laesecke A, Fortin TJ. Density and speed of sound measurements ofhexadecane. J Chem Thermodyn 2010;42:700–6.
[58] Caudwell DR, Trusler JPM, Vesovic V, Wakeham WA. The viscosity and densityof n-dodecane and n-octadecane at pressures up to 200 MPa and temperaturesup to 473 K. Int J Thermophys 2004;25:1339–52.
[59] Queimada AJ, Marrucho IM, Coutinho JAP, Stenby EH. Viscosity and liquiddensity of asymmetric n-alkane mixtures: measurement and modeling. Int JThermophys 2005;26:47–61.


![Thermal Imaging - cvip.louisville.edu · Only dependent on object’s temperature, no other characteristic [Tippler 2003]. Thermal radiation needs no transfer medium (i.e. thermal](https://img.pdfslide.us/doc/110x75/5ac547ec7f8b9ae06c8dae97/thermal-imaging-cvip-dependent-on-objects-temperature-no-other-characteristic.jpg)