Embed Size (px)
Citation preview
ANALYTICAL SCIENCES MAY 2015, VOL. 31 451
Introduction
Raman spectroscopy is an extremely useful technique for biological research, enabling label-free and comprehensive molecular analysis. Ultraviolet (UV)-resonance Raman spectroscopy is even more useful because of the high sensitivity and molecular selectivity provided by the electronic resonance effect.1–6 The main drawback associated with UV-resonance Raman spectroscopy is photodegradation of the samples during laser exposure, which can pose a serious problem for the observation of actual biological processes, especially when the observation volume cannot be refreshed, as is the case with microscopic imaging.7,8
In order to develop non-destructive UV-resonance Raman microscopic measurement methods, the origin of UV photodegradation during spectroscopic measurements must be more clearly defined. Several sources of photodegradation have been proposed, including the formation of singlet oxygen and radicals,9 the generation of photoproducts,10 excitation energy transfer,11 and bond cleavage and bond formation.12 Temperature is another critical factor that can lead to photodegradation, since irradiation using a strong incident laser always produces thermal effects. The inherent properties of photodegradation in UV range is that molecules are excited to higher energy levels therefore leading to the further chemical reactions with a smaller activation energy compared to the visible range. A quantitative evaluation of the effect by changing the temperature may provide a better understanding of the mechanism of photodegradation, which would be of great importance in the UV-resonance Raman microscopy of biomolecules.
In this study, we investigated the effect of temperature on
molecular photodegradation during the UV-resonance Raman spectroscopy of a biological molecule in order to enhance our understanding of the photothermal effect. Bacteriochlorophyll a (BChl), a component of the photosynthetic system, was employed for this study.13 The excitation laser wavelength used (355 nm) is on the absorption band of the Soret transition of neutral BChl.14,15
Experimental
The experimental details are shown in Fig. S1 in Supporting Information. Briefly, the excitation laser 355 nm line was introduced through an objective lens (magnification, ×20, numerical aperture, 0.4) and focused onto the sample surface. The Raman signal was detected using the same objective lens and directed to the entrance slit of a spectrometer via an optical fiber. Signals were recorded using a 30 s accumulation time per spectra for a duration of 30 min. The excitation laser power was estimated to be 1.0 × 10⁶ W/cm2 at the sample. The sample was attached to a copper ring-shaped plate in a cryostat chamber equipped on the microscopic stage, and illuminated by the incident laser through a quartz window. BChl was dissolved in 1,2-dichrolomethane at a concentration of 5 × 10⁻³ wt% and spin-coated on a glass cover slip.
Results and Discussion
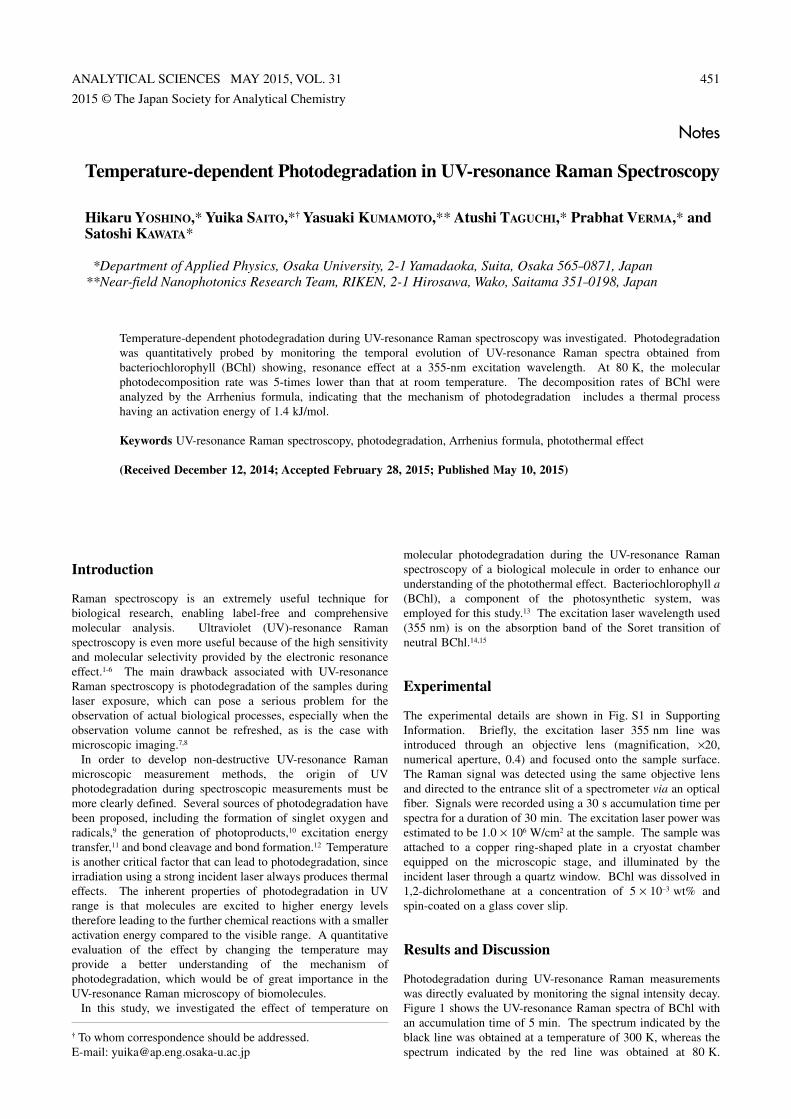
Photodegradation during UV-resonance Raman measurements was directly evaluated by monitoring the signal intensity decay. Figure 1 shows the UV-resonance Raman spectra of BChl with an accumulation time of 5 min. The spectrum indicated by the black line was obtained at a temperature of 300 K, whereas the spectrum indicated by the red line was obtained at 80 K.
2015 © The Japan Society for Analytical Chemistry
† To whom correspondence should be addressed.E-mail: [email protected]
Temperature-dependent Photodegradation in UV-resonance Raman Spectroscopy
Hikaru YOSHINO,* Yuika SAITO,*† Yasuaki KUMAMOTO,** Atushi TAGUCHI,* Prabhat VERMA,* and Satoshi KAWATA*
*Department of Applied Physics, Osaka University, 2-1 Yamadaoka, Suita, Osaka 565–0871, Japan **Near-field Nanophotonics Research Team, RIKEN, 2-1 Hirosawa, Wako, Saitama 351–0198, Japan
Temperature-dependent photodegradation during UV-resonance Raman spectroscopy was investigated. Photodegradation was quantitatively probed by monitoring the temporal evolution of UV-resonance Raman spectra obtained from bacteriochlorophyll (BChl) showing, resonance effect at a 355-nm excitation wavelength. At 80 K, the molecular photodecomposition rate was 5-times lower than that at room temperature. The decomposition rates of BChl were analyzed by the Arrhenius formula, indicating that the mechanism of photodegradation includes a thermal process having an activation energy of 1.4 kJ/mol.
Keywords UV-resonance Raman spectroscopy, photodegradation, Arrhenius formula, photothermal effect
(Received December 12, 2014; Accepted February 28, 2015; Published May 10, 2015)
Notes
452 ANALYTICAL SCIENCES MAY 2015, VOL. 31
The Raman peaks of the sample analyzed at 80 K were of higher intensity than those of the sample analyzed at 300 K. Many weak BChl Raman peaks that were difficult to distinguish in the spectrum at 300 K were clearly visible in the 80 K spectrum, indicating that conducting UV-resonance Raman spectroscopy at lower temperatures effectively prevents sample photodegradation. In addition, the line width at 80 K was sharper, indicating better spectral separation.
The dominant Raman peaks at 1611, 1530, 1343, and 1287 cm–1 originating from the conjugated macrocycle of BChl were used for further time-dependent analyses, because these peaks were well isolated, firmly assigned, and showed a reasonable S/N ratio after a long exposure. The 1611 cm–1 peak, which had the highest frequency, can be attributed to Cm–Ca′ stretching, whereas the peak at 1530 cm–1 represents coupled vibrations of Cb–Cb and Ca–Cb stretching, and the peaks at 1343 and 1287 cm–1 represent coupled vibrations of Ca–Cm and
Ca′–N stretching and CH in-plane bending. An additional peak at 1065 cm–1 was assigned to stretching of the C–C bonds outside the conjugated system but within the macrocycle.16 The peak observed at 1568 cm–1 on the left shoulder of the 1611 cm–1 peak only appears in the 300 K spectrum, and can be assigned as a photoproduct because it appeared after a long exposure.
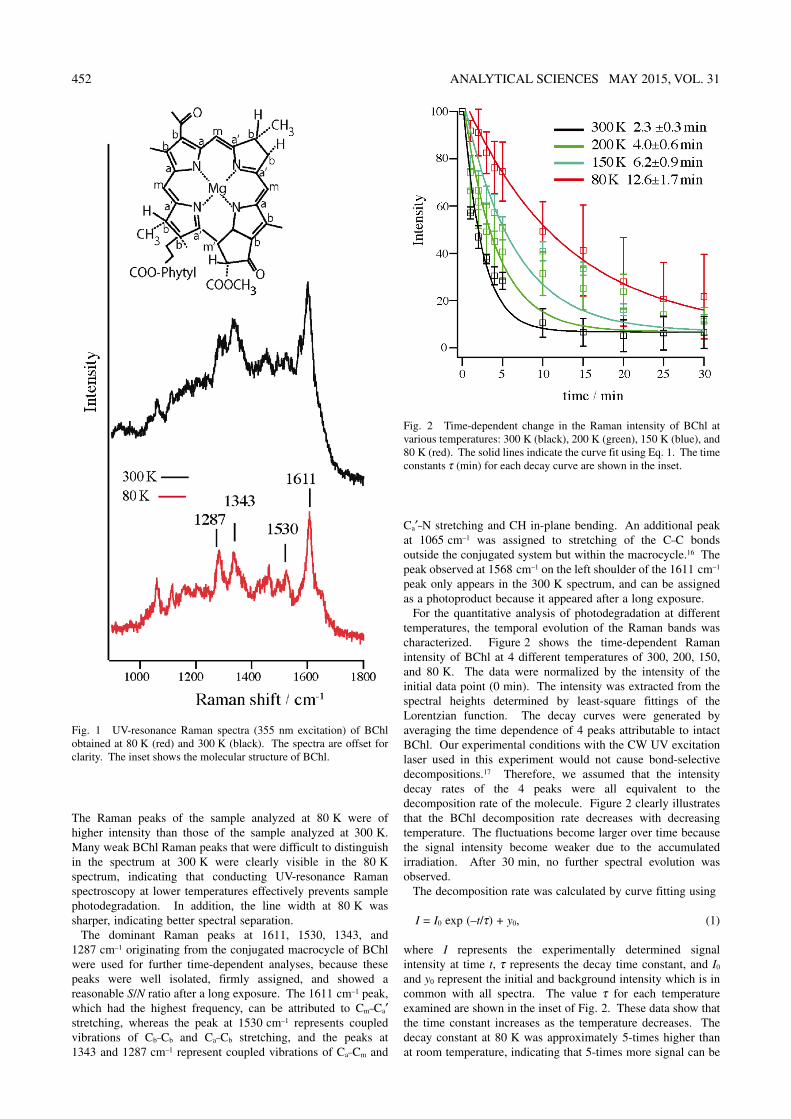
For the quantitative analysis of photodegradation at different temperatures, the temporal evolution of the Raman bands was characterized. Figure 2 shows the time-dependent Raman intensity of BChl at 4 different temperatures of 300, 200, 150, and 80 K. The data were normalized by the intensity of the initial data point (0 min). The intensity was extracted from the spectral heights determined by least-square fittings of the Lorentzian function. The decay curves were generated by averaging the time dependence of 4 peaks attributable to intact BChl. Our experimental conditions with the CW UV excitation laser used in this experiment would not cause bond-selective decompositions.17 Therefore, we assumed that the intensity decay rates of the 4 peaks were all equivalent to the decomposition rate of the molecule. Figure 2 clearly illustrates that the BChl decomposition rate decreases with decreasing temperature. The fluctuations become larger over time because the signal intensity become weaker due to the accumulated irradiation. After 30 min, no further spectral evolution was observed.
The decomposition rate was calculated by curve fitting using
I = I0 exp (–t/τ) + y0, (1)
where I represents the experimentally determined signal intensity at time t, τ represents the decay time constant, and I0 and y0 represent the initial and background intensity which is in common with all spectra. The value τ for each temperature examined are shown in the inset of Fig. 2. These data show that the time constant increases as the temperature decreases. The decay constant at 80 K was approximately 5-times higher than at room temperature, indicating that 5-times more signal can be
Fig. 1 UV-resonance Raman spectra (355 nm excitation) of BChl obtained at 80 K (red) and 300 K (black). The spectra are offset for clarity. The inset shows the molecular structure of BChl.
Fig. 2 Time-dependent change in the Raman intensity of BChl at various temperatures: 300 K (black), 200 K (green), 150 K (blue), and 80 K (red). The solid lines indicate the curve fit using Eq. 1. The time constants τ (min) for each decay curve are shown in the inset.
ANALYTICAL SCIENCES MAY 2015, VOL. 31 453
accumulated at 80 K in UV-resonance Raman spectroscopy, leading to better S/N ratios in analyses of soft materials. The typical bond dissociation energies of organic compounds are around 300 – 600 kJ/mol, equivalent to the photon energy of light at wavelengths in the range 396 – 198 nm.18 At excitation wavelengths exceeding the bond-breaking energies, thermal activation energy is the only contributor to sample degradation. On the other hand, at shorter excitation wavelengths, direct ionization of molecules become obvious. From this point of view, an excitation wavelength of 355 nm could produce the optical dissociation of chemical bonds. Resonant excitation of the Soret band may lead to the formation of radical cations or oxidized states.19,20 However, if the short wavelength is the only contribution to the sample degradation, such a temperature effect should not be observed.
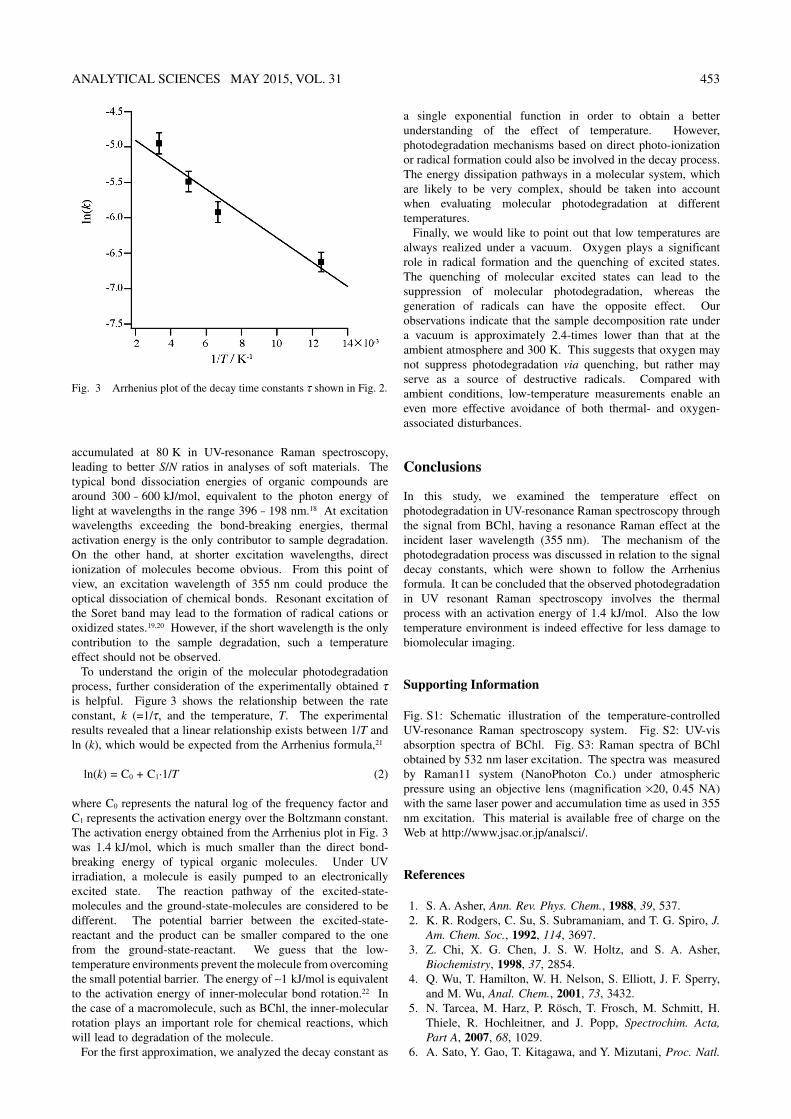
To understand the origin of the molecular photodegradation process, further consideration of the experimentally obtained τ is helpful. Figure 3 shows the relationship between the rate constant, k (=1/τ, and the temperature, T. The experimental results revealed that a linear relationship exists between 1/T and ln (k), which would be expected from the Arrhenius formula,21
ln(k) = C0 + C1·1/T (2)
where C0 represents the natural log of the frequency factor and C1 represents the activation energy over the Boltzmann constant. The activation energy obtained from the Arrhenius plot in Fig. 3 was 1.4 kJ/mol, which is much smaller than the direct bond-breaking energy of typical organic molecules. Under UV irradiation, a molecule is easily pumped to an electronically excited state. The reaction pathway of the excited-state-molecules and the ground-state-molecules are considered to be different. The potential barrier between the excited-state-reactant and the product can be smaller compared to the one from the ground-state-reactant. We guess that the low-temperature environments prevent the molecule from overcoming the small potential barrier. The energy of ~1 kJ/mol is equivalent to the activation energy of inner-molecular bond rotation.22 In the case of a macromolecule, such as BChl, the inner-molecular rotation plays an important role for chemical reactions, which will lead to degradation of the molecule.
For the first approximation, we analyzed the decay constant as
a single exponential function in order to obtain a better understanding of the effect of temperature. However, photodegradation mechanisms based on direct photo-ionization or radical formation could also be involved in the decay process. The energy dissipation pathways in a molecular system, which are likely to be very complex, should be taken into account when evaluating molecular photodegradation at different temperatures.
Finally, we would like to point out that low temperatures are always realized under a vacuum. Oxygen plays a significant role in radical formation and the quenching of excited states. The quenching of molecular excited states can lead to the suppression of molecular photodegradation, whereas the generation of radicals can have the opposite effect. Our observations indicate that the sample decomposition rate under a vacuum is approximately 2.4-times lower than that at the ambient atmosphere and 300 K. This suggests that oxygen may not suppress photodegradation via quenching, but rather may serve as a source of destructive radicals. Compared with ambient conditions, low-temperature measurements enable an even more effective avoidance of both thermal- and oxygen-associated disturbances.
Conclusions
In this study, we examined the temperature effect on photodegradation in UV-resonance Raman spectroscopy through the signal from BChl, having a resonance Raman effect at the incident laser wavelength (355 nm). The mechanism of the photodegradation process was discussed in relation to the signal decay constants, which were shown to follow the Arrhenius formula. It can be concluded that the observed photodegradation in UV resonant Raman spectroscopy involves the thermal process with an activation energy of 1.4 kJ/mol. Also the low temperature environment is indeed effective for less damage to biomolecular imaging.
Supporting Information
Fig. S1: Schematic illustration of the temperature-controlled UV-resonance Raman spectroscopy system. Fig. S2: UV-vis absorption spectra of BChl. Fig. S3: Raman spectra of BChl obtained by 532 nm laser excitation. The spectra was measured by Raman11 system (NanoPhoton Co.) under atmospheric pressure using an objective lens (magnification ×20, 0.45 NA) with the same laser power and accumulation time as used in 355 nm excitation. This material is available free of charge on the Web at http://www.jsac.or.jp/analsci/.
References
1. S. A. Asher, Ann. Rev. Phys. Chem., 1988, 39, 537. 2. K. R. Rodgers, C. Su, S. Subramaniam, and T. G. Spiro, J.
Am. Chem. Soc., 1992, 114, 3697. 3. Z. Chi, X. G. Chen, J. S. W. Holtz, and S. A. Asher,
Biochemistry, 1998, 37, 2854. 4. Q. Wu, T. Hamilton, W. H. Nelson, S. Elliott, J. F. Sperry,
and M. Wu, Anal. Chem., 2001, 73, 3432. 5. N. Tarcea, M. Harz, P. Rösch, T. Frosch, M. Schmitt, H.
Thiele, R. Hochleitner, and J. Popp, Spectrochim. Acta, Part A, 2007, 68, 1029.
6. A. Sato, Y. Gao, T. Kitagawa, and Y. Mizutani, Proc. Natl.
Fig. 3 Arrhenius plot of the decay time constants τ shown in Fig. 2.
454 ANALYTICAL SCIENCES MAY 2015, VOL. 31
Acad. Sci. U. S. A., 2007, 104, 9627. 7. Y. Kumamoto, A. Taguchi, N. I. Smith, and S. Kawata, J.
Biomed. Opt., 2012, 17, 076001. 8. Y. Kumamoto, A. Taguchi, N. I. Smith, and S. Kawata,
Biomed. Opt. Express, 2011, 2, 927. 9. Q. Wu, G. Balakrishnan, A. Pevsner, and T. G. Spiro, J.
Phys. Chem. A, 2003, 107, 8047. 10. J. L. Ravanat, T. Douki, and J. Cadet, J. Photochem.
Photobiol., B, 2001, 63, 88. 11. K. Lao and A. N. Glazer, Proc. Natl. Acad. Sci. U. S. A.,
1996, 93, 5258. 12. S. D. Moran, T. O. Zhang, S. M. Decatur, and M. T. Zanni,
Biochemistry, 2013, 52, 6169. 13. V. Palaniappan, P. C. Martin, V. Chynwat, H. A. Frank, and
D. F. Bocian, J. Am. Chem. Soc., 1993, 115, 12035. 14. T. M. Cotton, K. D. Parks, and R. P. Van Duyne, J. Am.
Chem. Soc., 1980, 102, 6399. 15. A. Ellervee and A. Freiberg, Chem. Phys. Lett., 2008, 450,
386. 16. E. Nishizawa and Y. Koyama, Chem. Phys. Lett., 1990, 172,
317. 17. R. J. Levis, G. M. Menkir, and H. Rabitz, Science, 2001,
292, 709. 18. S. J. Blanksby and G. B. Ellison, Acc. Chem. Res., 2003,
36, 255. 19. J. R. Diers and D. F. Bocian, J. Phys. Chem., 1994, 98,
12884. 20. Y. Koyama and L. Limantara, Spectrochim. Acta, Part A,
1998, 54, 1127. 21. N. T. Wright, J. Biomech. Eng., 2003, 125, 300. 22. J. N. Latosinska, M. A. Tomczak, and J. Kasprzak, Chem.
Phys. Lett., 2008, 462, 284.