Embed Size (px)
Citation preview
Ti
YB
a
ARRAA
KMTFF
1
sfpamRcsttolrTa
s
0d
Journal of Materials Processing Technology 211 (2011) 737–749
Contents lists available at ScienceDirect
Journal of Materials Processing Technology
journa l homepage: www.e lsev ier .com/ locate / jmatprotec
emperature dependent flow softening of titanium alloy Ti6Al4V: Annvestigation using finite element simulation of machining
igit Karpat ∗
ilkent University, Department of Industrial Engineering, Ankara 06800, Turkey
r t i c l e i n f o
rticle history:eceived 23 April 2010eceived in revised form 2 December 2010ccepted 7 December 2010vailable online 14 December 2010
eywords:achining
itanium alloysinite element modeling
a b s t r a c t
Titanium alloy Ti6Al4V is the most commonly used titanium alloy in the aerospace and medical deviceindustries due to its superior properties. There has been a considerable amount of research to betterunderstand the serrated chip formation mechanism of titanium alloy Ti6Al4V by using finite elementsimulation of machining. An accurate representation of the behavior of the material is important in orderto obtain reliable results from the finite element simulation. Flow softening behavior has been integratedinto the material constitutive models to simulate adiabatic shear bands and serrated chips. Flow softeningis usually related to the dynamic recrystallization phenomenon which initiates after a critical tempera-ture. The aim of this study is to investigate the influence of various flow softening conditions on the finiteelement simulation outputs for machining titanium alloy Ti6Al4V. For this purpose, a new flow soften-
low softening ing expression, which allows defining temperature-dependent flow softening behavior, is proposed andintegrated into the material constitutive model. The influence of flow softening below the critical temper-ature, as adopted in recent studies, is also investigated. Various temperature-dependent flow softeningscenarios are tested using finite element simulations, and the results are compared with experimen-tal data from the literature. The results showed that the flow softening initiating around 350–500 ◦Ccombined with appropriate softening parameters yields simulation outputs that agree well with the
nts.
experimental measureme. Introduction
An important goal in machining research is to eliminate expen-ive and time-consuming experimental modeling approaches inavor of physics-based machining models that are capable ofroducing realistic results at practical cutting conditions. Onepproach towards this goal is to develop finite element basedachining models that rely on material constitutive models.
ecently, Childs (2009) has shown that finite element models areapable of producing realistic results if the material behavior at hightrains and strain rates is defined properly. It is not easy to replicatehe deformation conditions typical in machining by using materialesting procedures such as split bar Hopkinson tests. The behaviorf the materials at high strains and strain rates is usually extrapo-ated based on these measurements, which may not yield reliableesults when employed in finite element simulations of machining.
itanium alloy, which exhibits a different behavior at high strainsnd strain rates, is the subject of this study.Titanium alloy Ti6Al4V has received particular considerationince it is a popular material in the aerospace and medical device
∗ Tel.: +90 312 290 22 63; fax: +90 312 266 40 54.E-mail address: [email protected]
924-0136/$ – see front matter © 2010 Elsevier B.V. All rights reserved.oi:10.1016/j.jmatprotec.2010.12.008
© 2010 Elsevier B.V. All rights reserved.
industries. Moreover, it produces serrated chips under practicalmachining conditions, which makes it remarkable in terms of metalcutting research. Considering that the interaction between the cut-ting tool flank face and the workpiece affects the chatter stabilityof the process when machining materials such as titanium alloysat low cutting speeds, it becomes important to develop machiningmodels that consider the physics of the process and allow detailedanalysis of the machining process (Altintas et al., 2008). Finite ele-ment simulation is an indispensable tool because it not only enablessimulating serrated chip formation, but it also allows inclusion ofthe cutting tool edge geometry in the analysis in order to predictprocess outputs.
In finite element models, serrated chips can be simulated by arti-ficially modifying the material flow stress behavior at higher strains(at the level of strains common in machining, but those cannotbe easily attained by standard material testing devices) and/or byintegrating a damage criterion. The focus of this study is on investi-gating the influence of modified flow stress behavior at high strainsthrough a parametric study.
Shivpuri et al. (2001) artificially modified the flow stress behav-ior as a function of temperature and simulated serrated chipformation. They suggested that microstructure transformation isresponsible for flow softening at high strains. An identical approachwas also used by Bäker et al. (2002), but neither of these stud-

738 Y. Karpat / Journal of Materials Processin
Nomenclature
˛T thermal expansionε strainε strain rateε0 reference strain rate� thermal conductivity� coefficient of friction� flow stress�s steady state flow stressA Johnson–Cook material model coefficientB Johnson–Cook material model coefficientC Johnson–Cook material model coefficientD Johnson–Cook material model coefficientn Johnson–Cook material model coefficient (strain
hardening index)m Johnson–Cook material model coefficient (strain
rate sensitivity)a proposed material model coefficientb proposed material model coefficientc proposed material model coefficientd proposed material model coefficiente proposed material model coefficientl proposed material model coefficientp proposed material model coefficientq proposed material model coefficientn* proposed material model coefficient (strain harden-
ing index)k softening function parameterr softening function parameterw width of cutFc cutting forceFt thrust forceEY Young’s moduluscp heat capacityTr room temperature
iOrtmomkemertda((sTs
rsKc
Tm melting temperatureS softening function parameter
es proposed a mathematical model for flow softening. Rhim andh (2006) integrated the effect of flow softening due to dynamic
ecrystallization initiating after a critical strain value at tempera-ures higher than half of the melting temperature in the material
odel. They also included a damage model to increase the degreef serration. Calamaz et al. (2008) summarized various possibleechanisms that would lead to flow softening, such as the platelet
inking suggested by Miller et al. (1999). They also proposed a soft-ning function integrated to the Johnson and Cook (1983) materialodel. The proposed material model assumes that flow softening
xists at all temperature levels. They were able to simulate ser-ated chips that resembled experimental chips. On the other hand,hrust force predictions were lower than experimental cutting forceata (during this paper’s review process a further publication hasppeared relating to those issues (Calamaz et al., 2010)). Wang et al.2010) used the flow softening model proposed by Calamaz et al.2008) for the micro cutting of copper based alloy. They empha-ized the effect of elastic strains on the formation of serrated chips.hey showed that shear band formation initiates from the outerurface of the chip and grows towards the cutting tool edge.
The serrated chip formation is closely related to the mate-ial properties of Ti6Al4V, including its low thermal conductivity,train hardening and thermal softening behavior. According toomanduri and Turkovich (1981), the serrated chip formation pro-ess starts by upsetting the material in front of the tool. When
g Technology 211 (2011) 737–749
critical shear strain is attained at a certain temperature, thermo-plastic instability occurs, and as a result the serrated chip formsand shear bands are observed. Studies on thermoplastic instabil-ity relate the formation and propagation of adiabatic shear bandsto the dynamic recrystallization (DRX) phenomenon without rulingout the crack initiation. DRX is defined as the process of microstruc-ture reformation and evolution resulting in newly crystallized smallgrains with very low dislocation density. Critical strain, strain rateand temperature are required for DRX to occur. A detailed literaturereview on thermoplastic instability can be found in Xu et al. (2008),in which some principal findings on adiabatic shear localizationare summarized as: “(a) there is a strain-rate dependent criticalstrain for the development of shear bands; (b) grain refinementand amorphization occur in shear bands; (c) loss of stress-carryingcapability is more closely associated with microdefects rather thanwith localization of strain; and (d) band development and bandstructures are material dependent” (Xu et al., 2008). Recently, Rittelet al. (2008) have presented evidence that DRX triggers adiabaticshear failure by observing dynamically recrystallized nanograinsin titanium alloy Ti6Al4V subjected to impact loading only halfof its failure strain. Medyanik et al. (2007) studied the interac-tion between strain rate and temperature for AISI 4340 steel andshowed that the critical temperature for DRX to occur decreaseswith increasing strain rate but reaches a steady state at a limit-ing value. Liao and Duffy (1998) measured the temperatures in theadiabatic band region to be around 440–550 ◦C for the Ti6Al4V. Ingeneral, recrystallization process in metals occurs about 0.4–0.5of the melting temperature of the material which is 499–589 ◦Cfor Ti6Al4V alloy (melting temperature is 1922 K) (Liao and Duffy,1998). This temperature increase is sufficient to produce newlyrecrystallized grains in the shear bands. However, according to thefindings of Medyanik et al. (2007), it may be possible that the criti-cal temperature initiating DRX during machining can be even lowerthan 0.4–0.5 of melting temperature since it is closely related to thestrain rate.
Another flow softening mechanism observed in titanium alloysat high temperatures is globularization, which is governed by thealpha to beta transformation and sliding of grain boundaries (Songet al., 2009). The experiments conducted by Song et al. (2009) revealthe initiation of globularization between strain levels of 0.42–0.65around 920–980 ◦C under strain rate range of 0.01–10 1/s. Songet al. (2009) identify the differences between dynamic recrystal-lization and globularization, stating that for the former, the criticalstrain is lower and mainly dependent on temperature and strainrate, whereas the latter is not very sensitive to deformation tem-perature and strain rate since it is controlled by dislocation glide.
The propagation of adiabatic shear bands has also been consid-ered as a major ductile failure mechanism, one which results inmaterial separation along the shear band associated with the voidformation due to thermal softening and local melting of secondaryphases (Giovanola, 1988).
The aim of this study is to investigate flow softening behav-ior especially, around and below critical DRX temperatures. Forthis purpose, a new softening function which allows introducingdifferent material behavior at various temperature levels is pro-posed. Different softening scenarios are considered, and results ofthe finite element simulations are validated and tested under differ-ent machining conditions on two different experimental datasetsfrom the literature.
2. Material constitutive model
In the literature, many material models have been proposed todefine the relationship between strain, strain rate, and tempera-ture. Johnson and Cook (1983) material model is the most popular
Y. Karpat / Journal of Materials Processing Technology 211 (2011) 737–749 739
Table 1List of Johnson–Cook material model parameters reported for Ti6Al4V.
A (MPa) B (MPa) n C m Ref.
782.7 498.4 0.28 0.028 1 Umbrello (2008)724 683.1 0.47 0.035 1 Lee and Lin (1998)968 380 0.421 0.0197 0.577 Li and He (2006)
0.000.010.010.01
oatmispduionuw
tsttbflTt
�
erfaa
at
TT
can successfully represent flow stress behavior at low strains.An appropriate modification must be included in the material
model (Eq. (3)) to consider flow softening, which initiates after acritical strain and temperature. In order to be able to facilitate soft-
(a)0 0.05 0.1 0.15 0.2 0.25 0.3 0.35
400
600
800
1000
1200
1400
1600
Strain
Str
ess
(MP
a)
T=293K
T=573K
T=773K
T=973K
(b)
0 0.05 0.1 0.15 0.2 0.25 0.3 0.35650
700
750
800
850
900
950
1000
1050
1100
1150
Strain
Str
ess
(MP
a)
800 1/s - model2000 1/s - model100000 1/s - model2000 1/s - experimental
1600
1700
1800
1900
a)
859 640 0.22862 331 0.34
1098 1092 0.93997.9 653.1 0.45
ne due to its simple form (Eq. (1)). It relates strain, strain ratend temperature to flow stress in a multiplicative form throughhe parameters A, B, n, C and m. Some Johnson–Cook material
odel parameters calculated for Ti6Al4V titanium alloy are listedn Table 1. Even though some parameter sets are based on theame split Hopkinson bar test data, the calculated material modelarameters are spread over a wide range of values due to possibleifferences in microstructures and/or the mathematical techniquessed in calculating Johnson–Cook parameters. Hence, when used
n finite element simulations, different simulation outputs arebtained for different material model parameters. Unfortunately,o microstructure information is available for the titanium alloysed in the study of Lee and Lin (1998) except that the materialas received as annealed.
� = (A + Bεn)(
1 + C ln(
ε
ε0
))(1 − T∗m)
T∗ = T − Tr
Tm − Tr
(1)
Anurag and Guo (2007) proposed a material model based onhe microstructural properties of the titanium alloy Ti6Al4V ashown in Eq. (2). The advantage of using this material model ishat it offers a methodology of calculating material model parame-ers. They obtained the relationship between strain and flow stressy considering the dynamic strain aging phenomenon where theow stress becomes insensitive to strain at a certain temperature.hen a temperature function was added to include the influence ofemperature on the flow stress.
(ε, T) = f (T)(Aεn) (2)
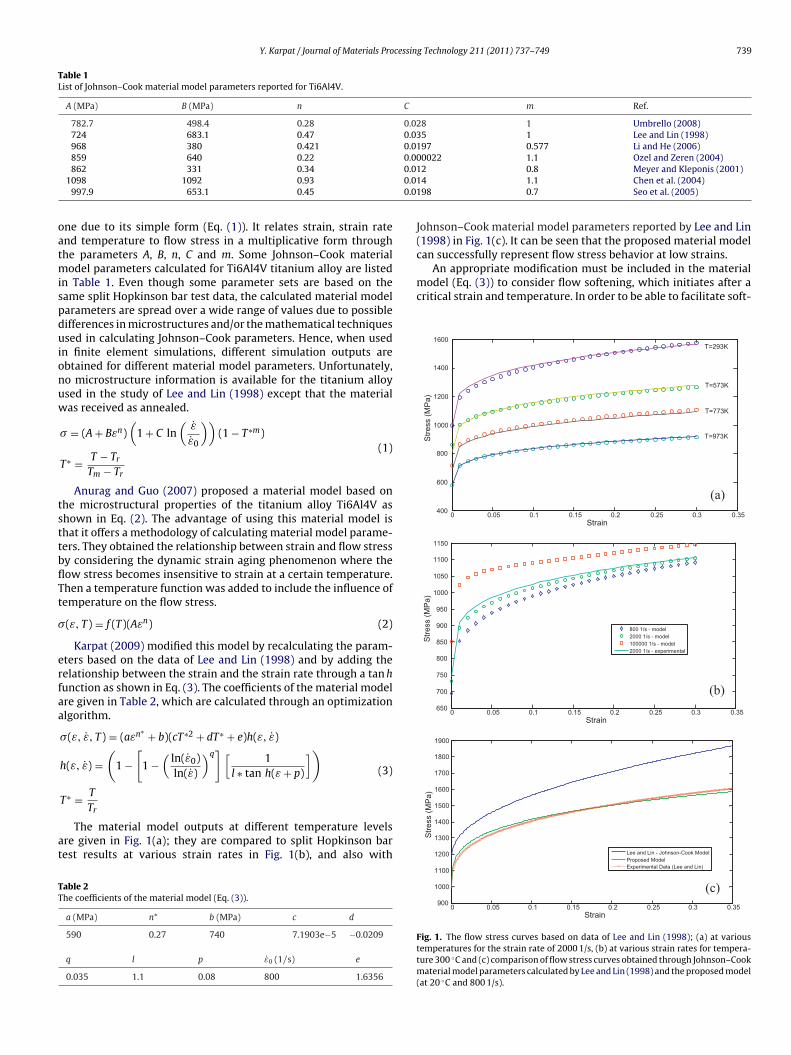
Karpat (2009) modified this model by recalculating the param-ters based on the data of Lee and Lin (1998) and by adding theelationship between the strain and the strain rate through a tan hunction as shown in Eq. (3). The coefficients of the material modelre given in Table 2, which are calculated through an optimizationlgorithm.
�(ε, ε, T) = (aεn∗ + b)(cT∗2 + dT∗ + e)h(ε, ε)
h(ε, ε) =(
1 −[
1 −(
ln(ε0)ln(ε)
)q][
1l ∗ tan h(ε + p)
])
T
(3)
T∗ =Tr
The material model outputs at different temperature levelsre given in Fig. 1(a); they are compared to split Hopkinson barest results at various strain rates in Fig. 1(b), and also with
able 2he coefficients of the material model (Eq. (3)).
a (MPa) n* b (MPa) c d
590 0.27 740 7.1903e−5 −0.0209
q l p ε0 (1/s) e
0.035 1.1 0.08 800 1.6356
0022 1.1 Ozel and Zeren (2004)2 0.8 Meyer and Kleponis (2001)4 1.1 Chen et al. (2004)98 0.7 Seo et al. (2005)
Johnson–Cook material model parameters reported by Lee and Lin(1998) in Fig. 1(c). It can be seen that the proposed material model
(c)0 0.05 0.1 0.15 0.2 0.25 0.3 0.35
900
1000
1100
1200
1300
1400
1500
Strain
Str
ess
(MP
Lee and Lin - Johnson-Cook ModelProposed ModelExperimental Data (Lee and Lin)
Fig. 1. The flow stress curves based on data of Lee and Lin (1998); (a) at varioustemperatures for the strain rate of 2000 1/s, (b) at various strain rates for tempera-ture 300 ◦C and (c) comparison of flow stress curves obtained through Johnson–Cookmaterial model parameters calculated by Lee and Lin (1998) and the proposed model(at 20 ◦C and 800 1/s).
740 Y. Karpat / Journal of Materials Processing Technology 211 (2011) 737–749
0 0.1 0.2 0.3 0.4 0.5 0.6 0.7 0.8 0.9 1700
800
900
1000
1100
1200
1300
Stre
ss (
MP
a)
S=0.6, k=2, r=2S=0.8, k=2, r=2S=0.8, k=2.5, r=2.5S=0.8, k=1.1, r=1.1S=0.6, k=1.1, r=1.1S=0.6, k=2.5, r=2.5
Fk
efactssslsbv
�
�
�
ε
lrai(oisE
3
tpiBcbI(ds
Table 3Material model parameters at different temperature levels.
Experiment # T = 25 ◦C T = 350 ◦C T = 500 ◦C T = 700 ◦C
1 S1 = 0.8 S2 = 0.8 S3 = 0.8 S4 = 0.82 S1 = 0.6 S2 = 0.6 S3 = 0.6 S4 = 0.63 S1 = 1 S2 = 0.6 S3 = 0.6 S4 = 0.64 Strain hardening S2 = 0.6 S3 = 0.6 S4 = 0.65 Strain hardening S2 = 1 S3 = 0.6 S4 = 0.66 Strain hardening Strain hardening S3 = 0.6 S4 = 0.6
Table 4Material model parameters with different k and r values.
Experiment # S (at all temperature levels) k = r
The orthogonal cutting data are selected from the study ofCotterell and Byrne (2008a,b). The titanium alloy Ti6Al4V usedin experiments was an extra low interstitial (ELI) grade withan equiaxed ˛–ˇ microstructure and a 10 �m grain size. The
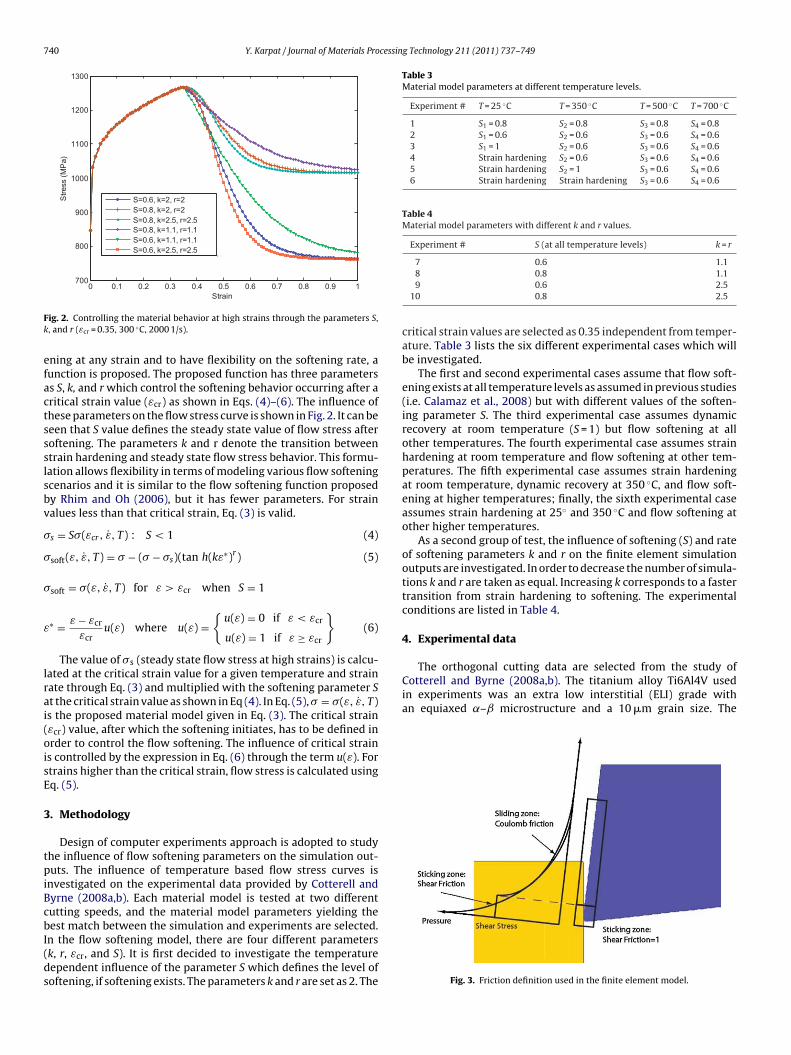
Strain
ig. 2. Controlling the material behavior at high strains through the parameters S,, and r (εcr = 0.35, 300 ◦C, 2000 1/s).
ning at any strain and to have flexibility on the softening rate, aunction is proposed. The proposed function has three parameterss S, k, and r which control the softening behavior occurring after aritical strain value (εcr) as shown in Eqs. (4)–(6). The influence ofhese parameters on the flow stress curve is shown in Fig. 2. It can beeen that S value defines the steady state value of flow stress afteroftening. The parameters k and r denote the transition betweentrain hardening and steady state flow stress behavior. This formu-ation allows flexibility in terms of modeling various flow softeningcenarios and it is similar to the flow softening function proposedy Rhim and Oh (2006), but it has fewer parameters. For strainalues less than that critical strain, Eq. (3) is valid.
s = S�(εcr, ε, T) : S < 1 (4)
soft(ε, ε, T) = � − (� − �s)(tan h(kε∗)r) (5)
soft = �(ε, ε, T) for ε > εcr when S = 1
∗ = ε − εcr
εcru(ε) where u(ε) =
{u(ε) = 0 if ε < εcr
u(ε) = 1 if ε ≥ εcr
}(6)
The value of �s (steady state flow stress at high strains) is calcu-ated at the critical strain value for a given temperature and strainate through Eq. (3) and multiplied with the softening parameter St the critical strain value as shown in Eq (4). In Eq. (5), � = �(ε, ε, T)s the proposed material model given in Eq. (3). The critical strainεcr) value, after which the softening initiates, has to be defined inrder to control the flow softening. The influence of critical strains controlled by the expression in Eq. (6) through the term u(ε). Fortrains higher than the critical strain, flow stress is calculated usingq. (5).
. Methodology
Design of computer experiments approach is adopted to studyhe influence of flow softening parameters on the simulation out-uts. The influence of temperature based flow stress curves is
nvestigated on the experimental data provided by Cotterell andyrne (2008a,b). Each material model is tested at two differentutting speeds, and the material model parameters yielding the
est match between the simulation and experiments are selected.n the flow softening model, there are four different parametersk, r, εcr, and S). It is first decided to investigate the temperatureependent influence of the parameter S which defines the level ofoftening, if softening exists. The parameters k and r are set as 2. The
7 0.6 1.18 0.8 1.19 0.6 2.5
10 0.8 2.5
critical strain values are selected as 0.35 independent from temper-ature. Table 3 lists the six different experimental cases which willbe investigated.
The first and second experimental cases assume that flow soft-ening exists at all temperature levels as assumed in previous studies(i.e. Calamaz et al., 2008) but with different values of the soften-ing parameter S. The third experimental case assumes dynamicrecovery at room temperature (S = 1) but flow softening at allother temperatures. The fourth experimental case assumes strainhardening at room temperature and flow softening at other tem-peratures. The fifth experimental case assumes strain hardeningat room temperature, dynamic recovery at 350 ◦C, and flow soft-ening at higher temperatures; finally, the sixth experimental caseassumes strain hardening at 25◦ and 350 ◦C and flow softening atother higher temperatures.
As a second group of test, the influence of softening (S) and rateof softening parameters k and r on the finite element simulationoutputs are investigated. In order to decrease the number of simula-tions k and r are taken as equal. Increasing k corresponds to a fastertransition from strain hardening to softening. The experimentalconditions are listed in Table 4.
4. Experimental data
Fig. 3. Friction definition used in the finite element model.
Y. Karpat / Journal of Materials Processing Technology 211 (2011) 737–749 741
Table 5The range of experimental conditions and experimentally measured and calculated process outputs (Cotterell and Byrne, 2008a,b).
Experimental conditions Experimentally measured/calculated process outputs (for uncut chip thickness of 0.1 mm)
V = 120 m/min V = 60 m/min V = 30 m/min
Uncut chip thickness range (mm) 0.05, 0.075, 0.1 Shear angle (◦) (measured) 40 39 36Width of cut (mm) 2 Shear stress (MPa) (calculated) 480 510 540
) (caempelatedh (mm
mBmi
Tool edge radius (�m) ∼8 Coeff. of friction (�Rake angle (deg) +6.5 Aver. shear zone tCutting speed range (m/min) 4–140 Shear strain (calcuTool material Uncoated carbide Chip contact lengt
aterial was annealed with a hardness of 340 HV (Cotterell andyrne, 2008a,b). The experimental conditions and some experi-entally measured and calculated process outputs are summarized
n Table 5.
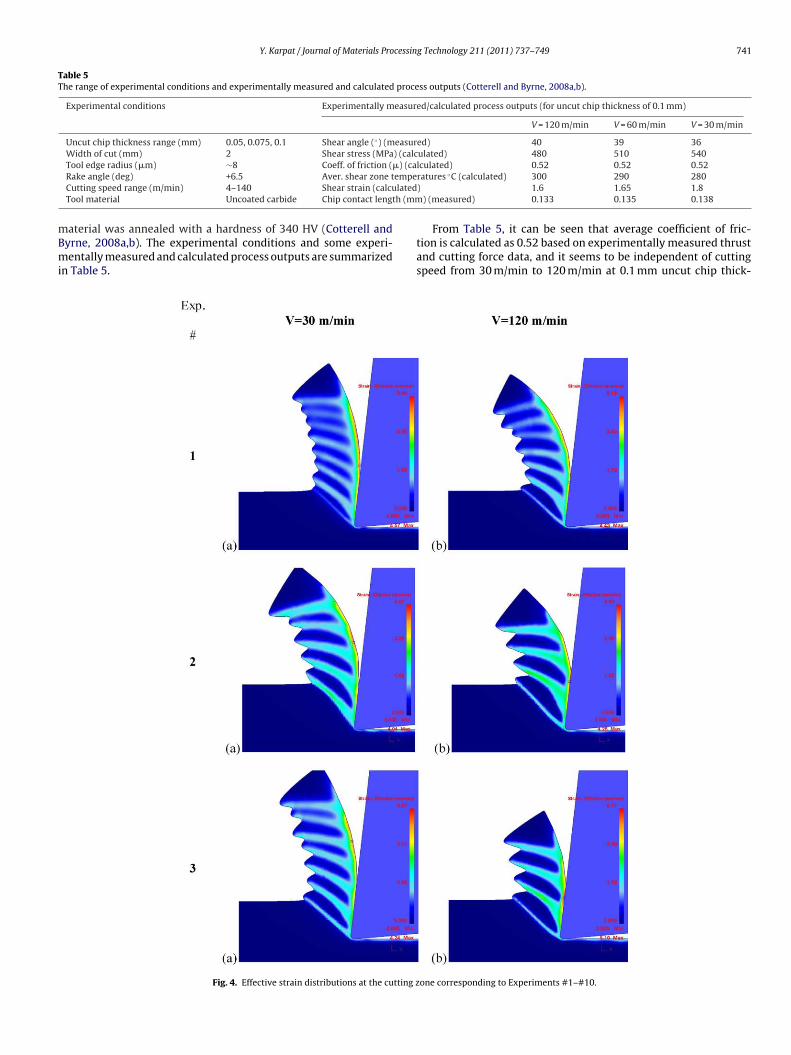
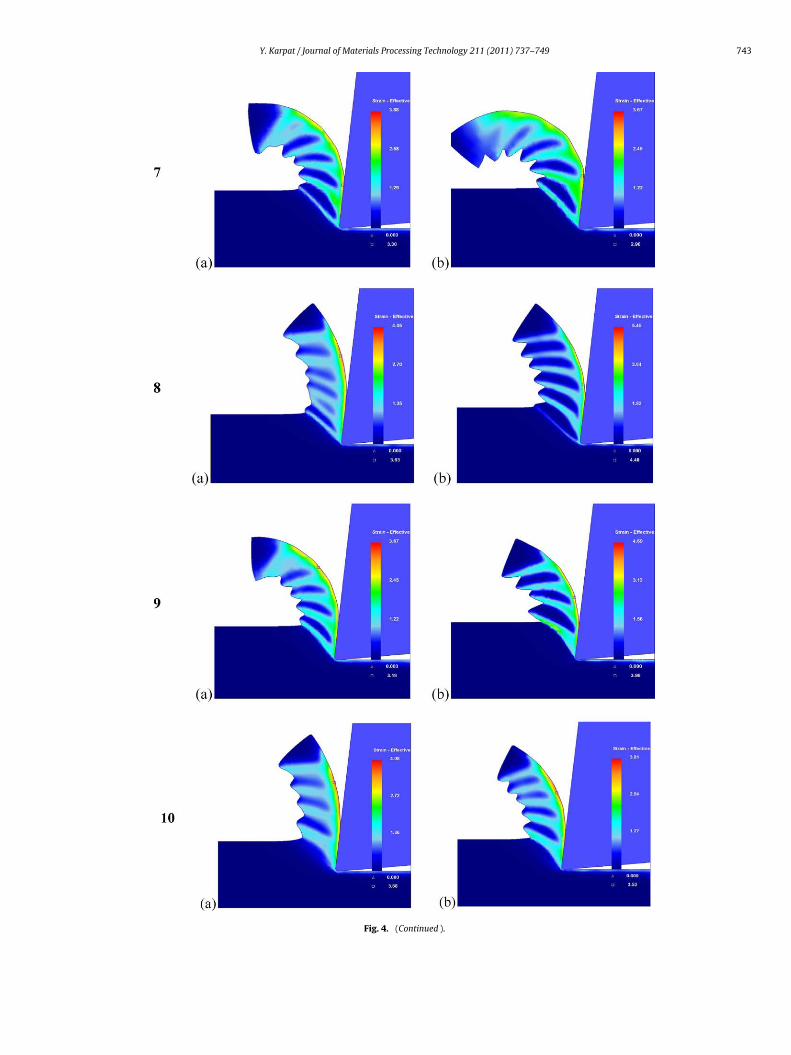
Fig. 4. Effective strain distributions at the cutting z
lculated) 0.52 0.52 0.52ratures ◦C (calculated) 300 290 280) 1.6 1.65 1.8
) (measured) 0.133 0.135 0.138
From Table 5, it can be seen that average coefficient of fric-tion is calculated as 0.52 based on experimentally measured thrustand cutting force data, and it seems to be independent of cuttingspeed from 30 m/min to 120 m/min at 0.1 mm uncut chip thick-
one corresponding to Experiments #1–#10.
742 Y. Karpat / Journal of Materials Processing Technology 211 (2011) 737–749
(Cont
nu2twttad
5
intOtu
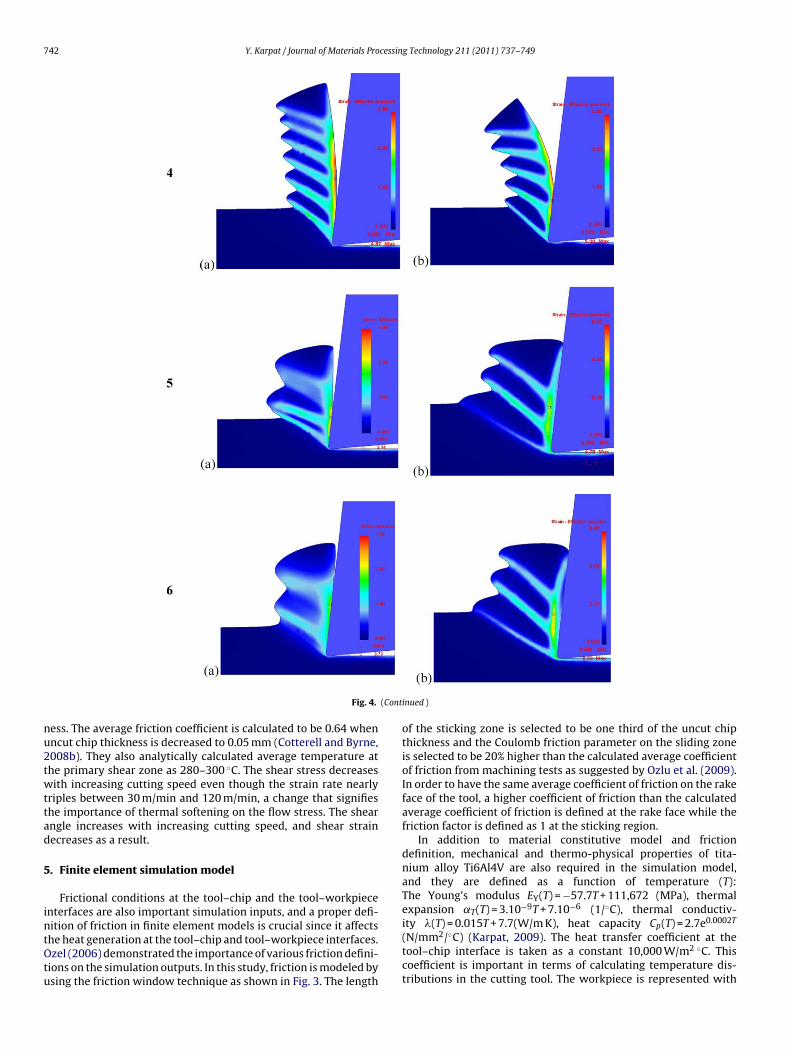
Fig. 4.
ess. The average friction coefficient is calculated to be 0.64 whenncut chip thickness is decreased to 0.05 mm (Cotterell and Byrne,008b). They also analytically calculated average temperature athe primary shear zone as 280–300 ◦C. The shear stress decreasesith increasing cutting speed even though the strain rate nearly
riples between 30 m/min and 120 m/min, a change that signifieshe importance of thermal softening on the flow stress. The shearngle increases with increasing cutting speed, and shear strainecreases as a result.
. Finite element simulation model
Frictional conditions at the tool–chip and the tool–workpiecenterfaces are also important simulation inputs, and a proper defi-
ition of friction in finite element models is crucial since it affectshe heat generation at the tool–chip and tool–workpiece interfaces.zel (2006) demonstrated the importance of various friction defini-ions on the simulation outputs. In this study, friction is modeled bysing the friction window technique as shown in Fig. 3. The length
inued )
of the sticking zone is selected to be one third of the uncut chipthickness and the Coulomb friction parameter on the sliding zoneis selected to be 20% higher than the calculated average coefficientof friction from machining tests as suggested by Ozlu et al. (2009).In order to have the same average coefficient of friction on the rakeface of the tool, a higher coefficient of friction than the calculatedaverage coefficient of friction is defined at the rake face while thefriction factor is defined as 1 at the sticking region.
In addition to material constitutive model and frictiondefinition, mechanical and thermo-physical properties of tita-nium alloy Ti6Al4V are also required in the simulation model,and they are defined as a function of temperature (T):The Young’s modulus EY(T) = −57.7T + 111,672 (MPa), thermalexpansion ˛T(T) = 3.10−9T + 7.10−6 (1/◦C), thermal conductiv-
ity �(T) = 0.015T + 7.7(W/m K), heat capacity Cp(T) = 2.7e0.0002T(N/mm2/◦C) (Karpat, 2009). The heat transfer coefficient at thetool–chip interface is taken as a constant 10,000 W/m2 ◦C. Thiscoefficient is important in terms of calculating temperature dis-tributions in the cutting tool. The workpiece is represented with
Y. Karpat / Journal of Materials Processing Technology 211 (2011) 737–749 743
Fig. 4. (Continued ).
744 Y. Karpat / Journal of Materials Processing Technology 211 (2011) 737–749
FV
1maotusw
6
rSsbo
0 1 2
x 10-4
0
50
100
150
200
250
Time (s)
For
ce (
N/m
m)
Fc
Ft
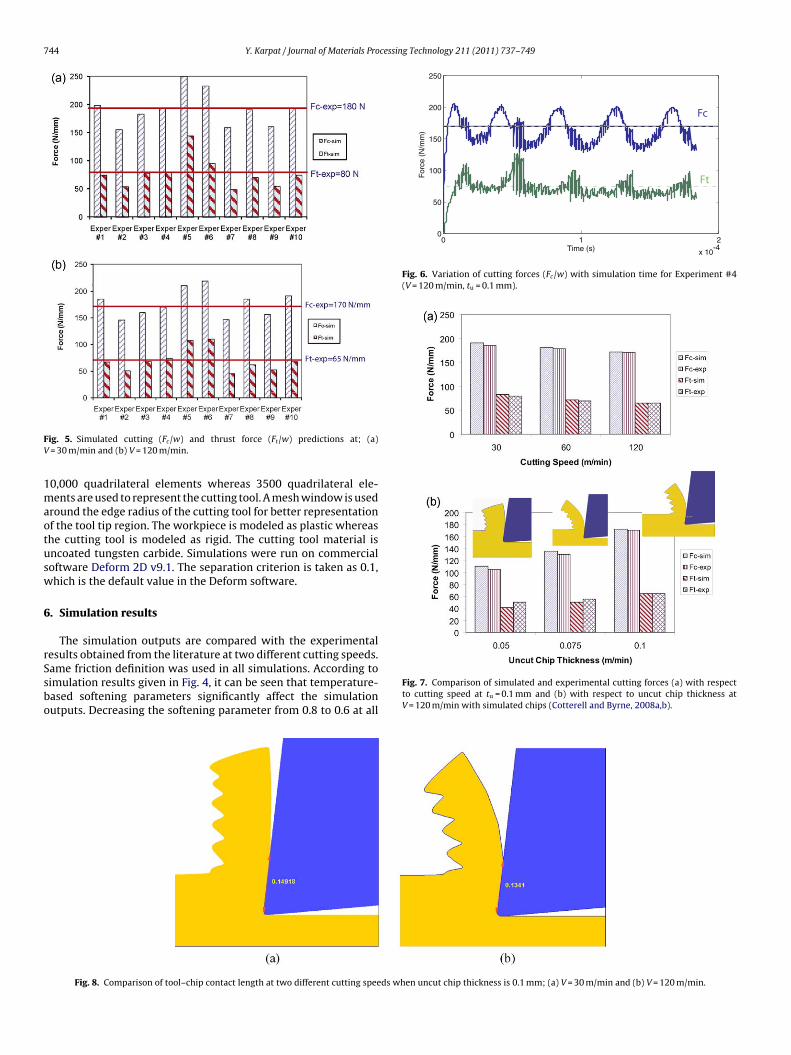
Fig. 6. Variation of cutting forces (Fc/w) with simulation time for Experiment #4(V = 120 m/min, tu = 0.1 mm).
ig. 5. Simulated cutting (Fc/w) and thrust force (Ft/w) predictions at; (a)= 30 m/min and (b) V = 120 m/min.
0,000 quadrilateral elements whereas 3500 quadrilateral ele-ents are used to represent the cutting tool. A mesh window is used
round the edge radius of the cutting tool for better representationf the tool tip region. The workpiece is modeled as plastic whereashe cutting tool is modeled as rigid. The cutting tool material isncoated tungsten carbide. Simulations were run on commercialoftware Deform 2D v9.1. The separation criterion is taken as 0.1,hich is the default value in the Deform software.
. Simulation results
The simulation outputs are compared with the experimental
esults obtained from the literature at two different cutting speeds.ame friction definition was used in all simulations. According toimulation results given in Fig. 4, it can be seen that temperature-ased softening parameters significantly affect the simulationutputs. Decreasing the softening parameter from 0.8 to 0.6 at allFig. 7. Comparison of simulated and experimental cutting forces (a) with respectto cutting speed at tu = 0.1 mm and (b) with respect to uncut chip thickness atV = 120 m/min with simulated chips (Cotterell and Byrne, 2008a,b).
Fig. 8. Comparison of tool–chip contact length at two different cutting speeds when uncut chip thickness is 0.1 mm; (a) V = 30 m/min and (b) V = 120 m/min.
cessing Technology 211 (2011) 737–749 745
t1eay#tshieis
eeE(isaSt
ccpprEtrtsa
stetSf
tisfctita
tsitiwwa
tigc
Y. Karpat / Journal of Materials Pro
emperature levels produces more serrated chips at 30 m/min and20 m/min, and chips tend to be more curved with higher soft-ning (Experiments #1 and #2). Introducing no strain hardeningt room temperature and strain hardening at room temperatureielded similar results in terms of chip morphology (Experiments2 and #4). The chips simulated in Experiment #4 are straighter
han those obtained in Experiments #1 and #2 and there is stillignificant serration at 30 m/min cutting speed. With no strainardening or when strain hardening is introduced at 350 ◦C (Exper-
ments #5 and #6), the chips become thicker and less serrated,specially at 30 m/min. This phenomenon is related to the decreas-ng temperatures at the primary deformation zone at lower cuttingpeeds.
The finite element simulation results for the second group ofxperiments (Experiments #7–#10), where the effect of rate of soft-ning parameters are investigated, are shown in Fig. 4. For example,xperiments #2, #7, and #9 have the same S value but different kand r) values. It is observed that the softening parameters (k and r)nfluence the serrated chip formation and in some cases are respon-ible for forming irregular serrations. Their effect is less significantt 120 m/min cutting speed. It is obvious that softening parameterhas a more dominant effect on the serrated chip formation than
he softening parameters k and r.Fig. 5 compares of simulated cutting forces in each tested
ase for two different cutting speed levels. By considering theutting forces and chip shape, temperature dependent softeningarameters given in Experiment #4 are selected as material modelarameters. It can be noted that introducing strain hardening atoom temperature improved thrust force predictions compared toxperiments #2 and #3. The same friction definition was used inhe simulations as per the results given in Table 5. The simulationesults of Experiments #2 and #3 can be increased by increasinghe coefficient of friction on the sliding region. However, by doingo, the friction definition becomes different from the experimentalverage friction value.
From these findings, it can be concluded that the degree of flowoftening initiating from 350 ◦C significantly affects the simula-ion force outputs. When flow softening is initiated from 500 ◦C,ven though serrated chips are simulated, the cutting force calcula-ions do not agree well with the experimental force measurements.train hardening at room temperature does not affect the cuttingorce (Fc) but slightly increases the thrust force (Ft) predictions.
Fig. 6 shows the fluctuation of cutting forces with respect toime. Serrated chip formation affects the cutting forces. An increasen cutting and thrust forces corresponds to the initiation phase oferrated chip formation. According to simulation results, the chipormation frequency (number of serrated chips per unit time) arealculated as 7751 Hz at 30 m/min cutting speed and 28,571 Hz athe 120 m/min cutting speed, which agrees well with the exper-mental data given in Cotterell and Byrne (2008a). It is observedhat there is an almost linear relationship between cutting speednd chip formation frequency.
Fig. 7 shows the comparison of simulated and experimental cut-ing forces at all cutting conditions. It can be seen that finite elementimulation yields results that are in good agreement with the exper-mental results. The maximum error is about 20% when uncut chiphickness is decreased to 0.05 mm. In that case, the length of stick-ng zone may need to be changed to match the simulation results
ith the experimental ones. The amount of chip serration decreasesith decreasing uncut chip thickness and decreasing cutting speed
s shown in Fig. 7(b).
Fig. 8 reveals the tool–chip contact length at two different cut-ing conditions. Tool–chip contact length slightly decreases withncreasing cutting speed. When compared with the measurementsiven in Table 5, the finite element simulation predicts tool–chipontact length reasonably well.
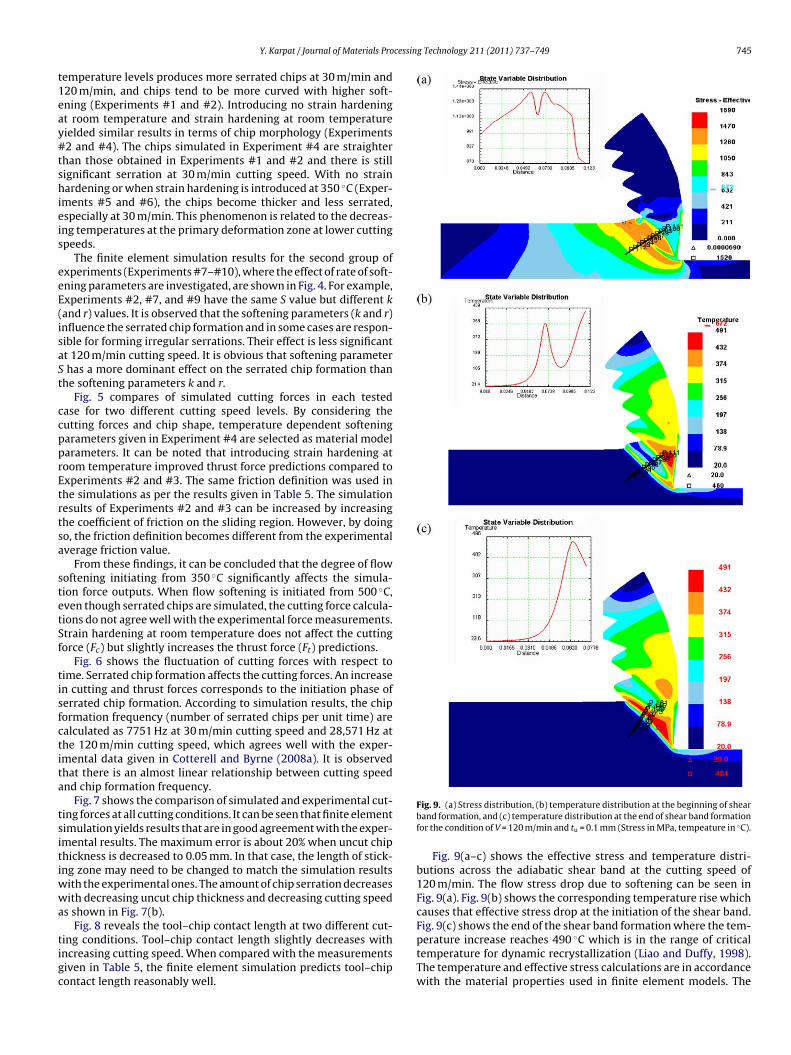
Fig. 9. (a) Stress distribution, (b) temperature distribution at the beginning of shearband formation, and (c) temperature distribution at the end of shear band formationfor the condition of V = 120 m/min and tu = 0.1 mm (Stress in MPa, tempeature in ◦C).
Fig. 9(a–c) shows the effective stress and temperature distri-butions across the adiabatic shear band at the cutting speed of120 m/min. The flow stress drop due to softening can be seen inFig. 9(a). Fig. 9(b) shows the corresponding temperature rise whichcauses that effective stress drop at the initiation of the shear band.Fig. 9(c) shows the end of the shear band formation where the tem-
perature increase reaches 490 ◦C which is in the range of criticaltemperature for dynamic recrystallization (Liao and Duffy, 1998).The temperature and effective stress calculations are in accordancewith the material properties used in finite element models. The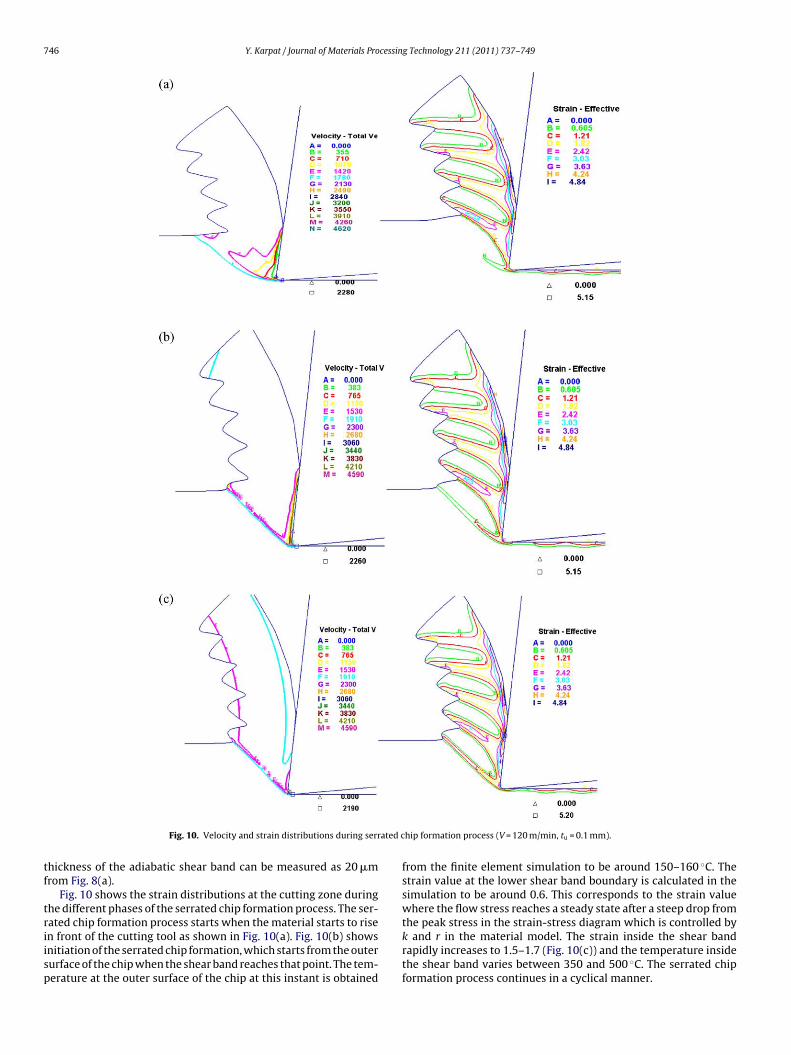
746 Y. Karpat / Journal of Materials Processing Technology 211 (2011) 737–749
ated c
tf
triisp
Fig. 10. Velocity and strain distributions during serr
hickness of the adiabatic shear band can be measured as 20 �mrom Fig. 8(a).
Fig. 10 shows the strain distributions at the cutting zone duringhe different phases of the serrated chip formation process. The ser-
ated chip formation process starts when the material starts to risen front of the cutting tool as shown in Fig. 10(a). Fig. 10(b) showsnitiation of the serrated chip formation, which starts from the outerurface of the chip when the shear band reaches that point. The tem-erature at the outer surface of the chip at this instant is obtainedhip formation process (V = 120 m/min, tu = 0.1 mm).
from the finite element simulation to be around 150–160 ◦C. Thestrain value at the lower shear band boundary is calculated in thesimulation to be around 0.6. This corresponds to the strain valuewhere the flow stress reaches a steady state after a steep drop from
the peak stress in the strain-stress diagram which is controlled byk and r in the material model. The strain inside the shear bandrapidly increases to 1.5–1.7 (Fig. 10(c)) and the temperature insidethe shear band varies between 350 and 500 ◦C. The serrated chipformation process continues in a cyclical manner.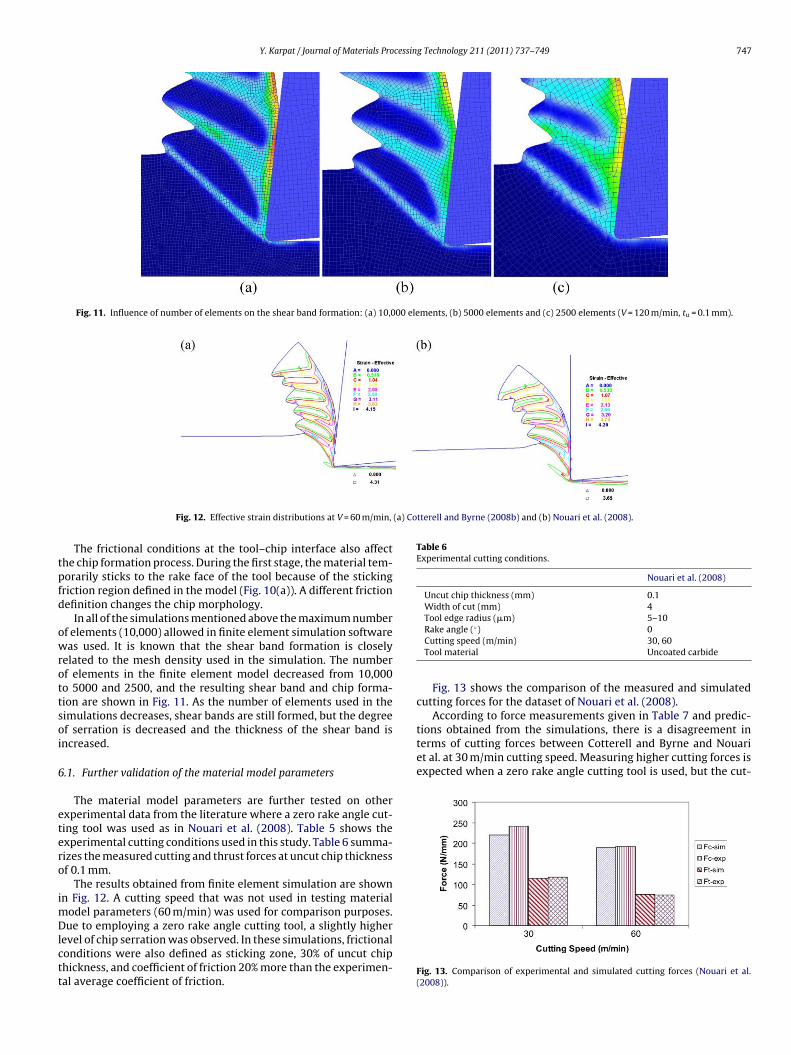
Y. Karpat / Journal of Materials Processing Technology 211 (2011) 737–749 747
Fig. 11. Influence of number of elements on the shear band formation: (a) 10,000 elements, (b) 5000 elements and (c) 2500 elements (V = 120 m/min, tu = 0.1 mm).
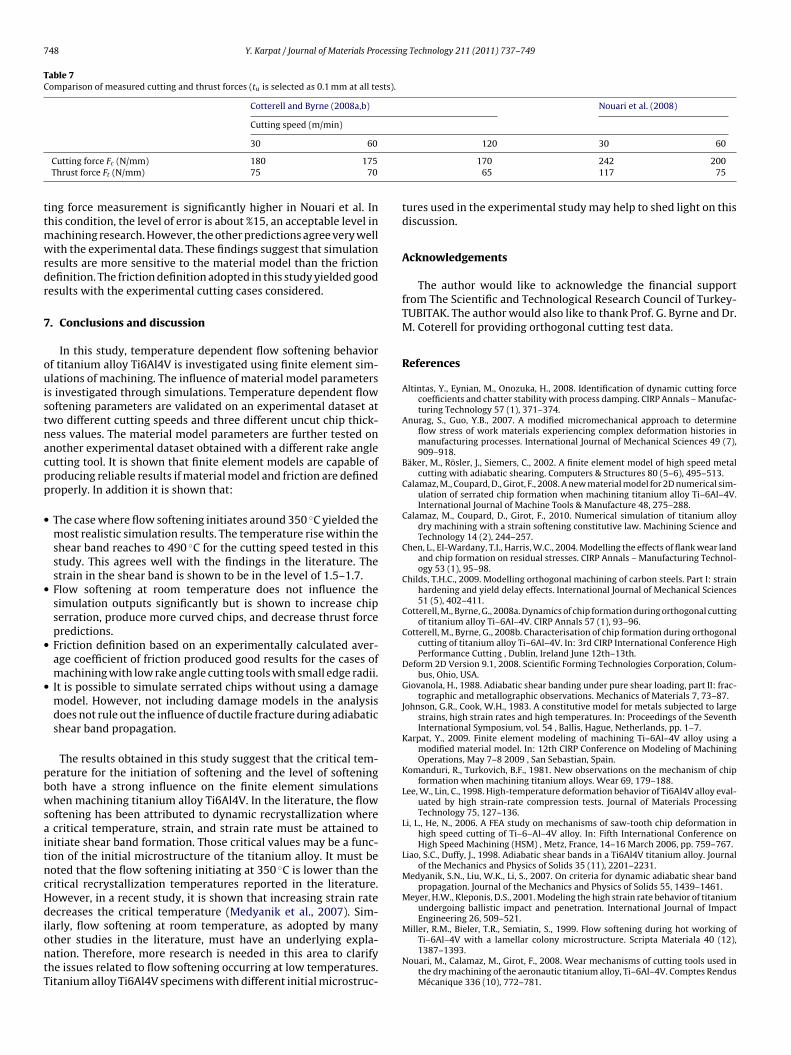
(a) Cotterell and Byrne (2008b) and (b) Nouari et al. (2008).
tpfd
owrottsoi
6
etero
imDlctt
Table 6Experimental cutting conditions.
Nouari et al. (2008)
Uncut chip thickness (mm) 0.1Width of cut (mm) 4Tool edge radius (�m) 5–10
According to force measurements given in Table 7 and predic-tions obtained from the simulations, there is a disagreement interms of cutting forces between Cotterell and Byrne and Nouariet al. at 30 m/min cutting speed. Measuring higher cutting forces isexpected when a zero rake angle cutting tool is used, but the cut-
Fig. 12. Effective strain distributions at V = 60 m/min,
The frictional conditions at the tool–chip interface also affecthe chip formation process. During the first stage, the material tem-orarily sticks to the rake face of the tool because of the stickingriction region defined in the model (Fig. 10(a)). A different frictionefinition changes the chip morphology.
In all of the simulations mentioned above the maximum numberf elements (10,000) allowed in finite element simulation softwareas used. It is known that the shear band formation is closely
elated to the mesh density used in the simulation. The numberf elements in the finite element model decreased from 10,000o 5000 and 2500, and the resulting shear band and chip forma-ion are shown in Fig. 11. As the number of elements used in theimulations decreases, shear bands are still formed, but the degreef serration is decreased and the thickness of the shear band isncreased.
.1. Further validation of the material model parameters
The material model parameters are further tested on otherxperimental data from the literature where a zero rake angle cut-ing tool was used as in Nouari et al. (2008). Table 5 shows thexperimental cutting conditions used in this study. Table 6 summa-izes the measured cutting and thrust forces at uncut chip thicknessf 0.1 mm.
The results obtained from finite element simulation are shownn Fig. 12. A cutting speed that was not used in testing material
odel parameters (60 m/min) was used for comparison purposes.
ue to employing a zero rake angle cutting tool, a slightly higherevel of chip serration was observed. In these simulations, frictionalonditions were also defined as sticking zone, 30% of uncut chiphickness, and coefficient of friction 20% more than the experimen-al average coefficient of friction.
Rake angle (◦) 0Cutting speed (m/min) 30, 60Tool material Uncoated carbide
Fig. 13 shows the comparison of the measured and simulatedcutting forces for the dataset of Nouari et al. (2008).
Fig. 13. Comparison of experimental and simulated cutting forces (Nouari et al.(2008)).
748 Y. Karpat / Journal of Materials Processing Technology 211 (2011) 737–749
Table 7Comparison of measured cutting and thrust forces (tu is selected as 0.1 mm at all tests).
Cotterell and Byrne (2008a,b) Nouari et al. (2008)
Cutting speed (m/min)
ttmwrdr
7
ouistnacpp
•
•
•
•
pbwsaitncHdiontT
30 60
Cutting force Fc (N/mm) 180 175Thrust force Ft (N/mm) 75 70
ing force measurement is significantly higher in Nouari et al. Inhis condition, the level of error is about %15, an acceptable level in
achining research. However, the other predictions agree very wellith the experimental data. These findings suggest that simulation
esults are more sensitive to the material model than the frictionefinition. The friction definition adopted in this study yielded goodesults with the experimental cutting cases considered.
. Conclusions and discussion
In this study, temperature dependent flow softening behaviorf titanium alloy Ti6Al4V is investigated using finite element sim-lations of machining. The influence of material model parameters
s investigated through simulations. Temperature dependent flowoftening parameters are validated on an experimental dataset atwo different cutting speeds and three different uncut chip thick-ess values. The material model parameters are further tested onnother experimental dataset obtained with a different rake angleutting tool. It is shown that finite element models are capable ofroducing reliable results if material model and friction are definedroperly. In addition it is shown that:
The case where flow softening initiates around 350 ◦C yielded themost realistic simulation results. The temperature rise within theshear band reaches to 490 ◦C for the cutting speed tested in thisstudy. This agrees well with the findings in the literature. Thestrain in the shear band is shown to be in the level of 1.5–1.7.Flow softening at room temperature does not influence thesimulation outputs significantly but is shown to increase chipserration, produce more curved chips, and decrease thrust forcepredictions.Friction definition based on an experimentally calculated aver-age coefficient of friction produced good results for the cases ofmachining with low rake angle cutting tools with small edge radii.It is possible to simulate serrated chips without using a damagemodel. However, not including damage models in the analysisdoes not rule out the influence of ductile fracture during adiabaticshear band propagation.
The results obtained in this study suggest that the critical tem-erature for the initiation of softening and the level of softeningoth have a strong influence on the finite element simulationshen machining titanium alloy Ti6Al4V. In the literature, the flow
oftening has been attributed to dynamic recrystallization wherecritical temperature, strain, and strain rate must be attained to
nitiate shear band formation. Those critical values may be a func-ion of the initial microstructure of the titanium alloy. It must beoted that the flow softening initiating at 350 ◦C is lower than theritical recrystallization temperatures reported in the literature.owever, in a recent study, it is shown that increasing strain rateecreases the critical temperature (Medyanik et al., 2007). Sim-
larly, flow softening at room temperature, as adopted by manyther studies in the literature, must have an underlying expla-ation. Therefore, more research is needed in this area to clarifyhe issues related to flow softening occurring at low temperatures.itanium alloy Ti6Al4V specimens with different initial microstruc-
120 30 60
170 242 20065 117 75
tures used in the experimental study may help to shed light on thisdiscussion.
Acknowledgements
The author would like to acknowledge the financial supportfrom The Scientific and Technological Research Council of Turkey-TUBITAK. The author would also like to thank Prof. G. Byrne and Dr.M. Coterell for providing orthogonal cutting test data.
References
Altintas, Y., Eynian, M., Onozuka, H., 2008. Identification of dynamic cutting forcecoefficients and chatter stability with process damping. CIRP Annals – Manufac-turing Technology 57 (1), 371–374.
Anurag, S., Guo, Y.B., 2007. A modified micromechanical approach to determineflow stress of work materials experiencing complex deformation histories inmanufacturing processes. International Journal of Mechanical Sciences 49 (7),909–918.
Bäker, M., Rösler, J., Siemers, C., 2002. A finite element model of high speed metalcutting with adiabatic shearing. Computers & Structures 80 (5–6), 495–513.
Calamaz, M., Coupard, D., Girot, F., 2008. A new material model for 2D numerical sim-ulation of serrated chip formation when machining titanium alloy Ti–6Al–4V.International Journal of Machine Tools & Manufacture 48, 275–288.
Calamaz, M., Coupard, D., Girot, F., 2010. Numerical simulation of titanium alloydry machining with a strain softening constitutive law. Machining Science andTechnology 14 (2), 244–257.
Chen, L., El-Wardany, T.I., Harris, W.C., 2004. Modelling the effects of flank wear landand chip formation on residual stresses. CIRP Annals – Manufacturing Technol-ogy 53 (1), 95–98.
Childs, T.H.C., 2009. Modelling orthogonal machining of carbon steels. Part I: strainhardening and yield delay effects. International Journal of Mechanical Sciences51 (5), 402–411.
Cotterell, M., Byrne, G., 2008a. Dynamics of chip formation during orthogonal cuttingof titanium alloy Ti–6Al–4V. CIRP Annals 57 (1), 93–96.
Cotterell, M., Byrne, G., 2008b. Characterisation of chip formation during orthogonalcutting of titanium alloy Ti–6Al–4V. In: 3rd CIRP International Conference HighPerformance Cutting , Dublin, Ireland June 12th–13th.
Deform 2D Version 9.1, 2008. Scientific Forming Technologies Corporation, Colum-bus, Ohio, USA.
Giovanola, H., 1988. Adiabatic shear banding under pure shear loading, part II: frac-tographic and metallographic observations. Mechanics of Materials 7, 73–87.
Johnson, G.R., Cook, W.H., 1983. A constitutive model for metals subjected to largestrains, high strain rates and high temperatures. In: Proceedings of the SeventhInternational Symposium, vol. 54 , Ballis, Hague, Netherlands, pp. 1–7.
Karpat, Y., 2009. Finite element modeling of machining Ti–6Al–4V alloy using amodified material model. In: 12th CIRP Conference on Modeling of MachiningOperations, May 7–8 2009 , San Sebastian, Spain.
Komanduri, R., Turkovich, B.F., 1981. New observations on the mechanism of chipformation when machining titanium alloys. Wear 69, 179–188.
Lee, W., Lin, C., 1998. High-temperature deformation behavior of Ti6Al4V alloy eval-uated by high strain-rate compression tests. Journal of Materials ProcessingTechnology 75, 127–136.
Li, L., He, N., 2006. A FEA study on mechanisms of saw-tooth chip deformation inhigh speed cutting of Ti–6–Al–4V alloy. In: Fifth International Conference onHigh Speed Machining (HSM) , Metz, France, 14–16 March 2006, pp. 759–767.
Liao, S.C., Duffy, J., 1998. Adiabatic shear bands in a Ti6Al4V titanium alloy. Journalof the Mechanics and Physics of Solids 35 (11), 2201–2231.
Medyanik, S.N., Liu, W.K., Li, S., 2007. On criteria for dynamic adiabatic shear bandpropagation. Journal of the Mechanics and Physics of Solids 55, 1439–1461.
Meyer, H.W., Kleponis, D.S., 2001. Modeling the high strain rate behavior of titaniumundergoing ballistic impact and penetration. International Journal of ImpactEngineering 26, 509–521.
Miller, R.M., Bieler, T.R., Semiatin, S., 1999. Flow softening during hot working ofTi–6Al–4V with a lamellar colony microstructure. Scripta Materiala 40 (12),1387–1393.
Nouari, M., Calamaz, M., Girot, F., 2008. Wear mechanisms of cutting tools used inthe dry machining of the aeronautic titanium alloy, Ti–6Al–4V. Comptes RendusMécanique 336 (10), 772–781.

cessin
O
O
O
R
R
S
Wang, H., To, S., Chan, C.Y., Cheung, C.F., Lee, W.B., 2010. Elastic strain induced shear
Y. Karpat / Journal of Materials Pro
zel, T., Zeren, E., 2004. Determination of work material flow stress and friction prop-erties for FEA of machining using orthogonal cutting tests. Journal of MaterialsProcessing Technology 153, 1019–1025.
zel, T., 2006. Influence of friction models on finite element simulations of machin-ing. International Journal of Machine Tools and Manufacture 46 (5), 518–530.
zlu, E., Budak, E., Molinari, A., 2009. Analytical and experimental investigationof rake contact and friction behavior in metal cutting. International Journal ofMachine Tools and Manufacture 49, 865–875.
him, S.H., Oh, S.I., 2006. Prediction of serrated chip formation in metal cuttingprocess with new flow stress model for AISI 1045 steel. Journal of Materials
Processing Technology 171, 417–422.ittel, D., Landau, P., Venkert, A., 2008. Dynamic recrystallization as a potential causefor adiabatic shear failure. Physical Review Letters 101, 165501.
eo, S., Min, O., Yang, H., 2005. Constitutive equation for Ti–6Al–4V at high tem-peratures measured using the SHPB technique. International Journal of ImpactEngineering 31, 735–754.
g Technology 211 (2011) 737–749 749
Shivpuri, R., Hua, J., Mittal, P., Srivastava, A.K., 2001. Microstructure–mechanicsinteractions in modeling chip segmentation during titanium machining. CIRPAnnals 51, 85–89.
Song, H.W., Zhang, S.H., Cheng, M., 2009. Dynamic globularization kinetics duringhot working of a two phase titanium alloy with a colony alpha microstructure.Journal of Alloys and Compounds 480, 922–927.
Umbrello, D., 2008. Finite element simulation of conventional and high speedmachining of Ti6Al4V alloy. Journal of Materials Processing Technology 196(1–3), 79–87.
bands in the microcutting process. International Journal of Machine Tools andManufacture 50 (1), 9–18.
Xu, Y., Zhang, J., Bai, Y., Meyers, M.A., 2008. Shear localization in dynamic deforma-tion: microstructural evolution. Metallurgical and Materials Transactions 39A,811.