Embed Size (px)
Citation preview
Deep-Sea Research II 50 (2003) 2183–2204
Temperature and salinity variability in the exit passagesof the Indonesian Throughflow
Janet Sprintalla,*, James T. Potemrab, Susan L. Hautalac, Nancy A. Brayd,Wahyu W. Pandoee
aScripps Institution of Oceanography, UCSD, Mail Code 0230, La Jolla, CA 92093-0230, USAb IPRC, University of Hawaii, Honolulu, HI, USA
cUniversity of Washington, Seattle, WA, USAdCSIRO Marine Research, Hobart, TAS, Australia
eBPPT, Indonesia
Abstract
The Indonesian Throughflow was monitored from December 1995 until May 1999 in the five major exit passages of
the Lesser Sunda Islands, as it flows from the Indonesian interior seas into the southeast Indian Ocean. The monitoring
array included pairs of shallow pressure gauges at each side of the straits, equipped with temperature and salinity
sensors. As in the inferred geostrophic velocity from the cross-strait pressure gauge data, the temperature and salinity
data show strong variability over all time scales related to the local regional and remote forcing mechanisms of heat,
freshwater and wind. The annual cycle dominates the temperature time series, with warmest temperatures occurring
during the austral summer northwest monsoon, except in Lombok Strait where the semi-annual signal is dominant, and
related to the Indian Ocean westerly wind-forced Kelvin waves during the monsoon transitions that supply Indian
Ocean warmer surface water to the strait. In the salinity data, the annual signal again dominates the time series in all
straits, with a distinct freshening occurring in March–May. This is partly related to the rainfall and resultant
voluminous river runoff impacting the region, one month after the wetter northwest monsoon ends in March. The fresh,
warm water from the monsoon-transition Indian Ocean Kelvin wave also contributes to the freshening observed in
May. There is little cross-strait gradient in near-surface temperature and salinity through the outflow straits, except in
Lombok Strait, where Lombok is warmer (except during the northwest monsoon) and fresher than the Bali site
(especially during March through May). A fortnightly signal in temperature is found in Ombai and Sumba Straits, and
is probably related to the proximity of these straits to the interior Banda Sea where the fortnightly tidal signal is strong.
The fortnightly signal is also evident at the Bali site, although not at the Lombok site. Numerous ADCP surveys taken
during the survey period suggest a western intensification of the flow through Lombok Strait, such that the Bali site also
may be more influenced by the internal Indonesian seas. Finally, there is regional variability in temperature and salinity
on interannual time scales. From mid-1997 through early 1998, the region is cooler and saltier than normal. These
property changes are related to both the strong 1997–1998 El Nino event in the Pacific, and the strong 1997 Dipole
Mode in the Indian Ocean, which together can result in lower regional precipitation; lower transport of the fresh, warm
Throughflow water; and changes in the upwelling regime along the Lesser Sunda Island chain. From mid-1998 on,
warmer conditions returned to the region probably related to the La Nina event.
r 2003 Elsevier Science Ltd. All rights reserved.
*Corresponding author. Fax: +1-858-5349820.
E-mail address: [email protected] (J. Sprintall).
0967-0645/03/$ - see front matter r 2003 Elsevier Science Ltd. All rights reserved.
doi:10.1016/S0967-0645(03)00052-3
1. Introduction
The heat and freshwater carried by the Indone-sian Throughflow (ITF), as it follows its circuitousroute through the basins and multiple narrowconstrictions within the Indonesian seas, impactsthe basin budgets of both the Pacific and IndianOceans (Bryden and Imawaki, 2001; Wijffels,2001). In turn, the interbasin exchange of proper-ties also substantially affects atmosphere–oceancoupling, not just in the connected tropical Indianand Pacific Oceans, but on a global scale. Coupledmodeling work by Schneider (1998) found thatwith a Throughflow moving heat from the Pacificto the Indian Ocean, the warmest sea-surfacetemperatures (SST) and associated atmosphericconvection region are more westward relative to ano-Throughflow condition. The change in convec-tion would drive changes in the global atmosphericcirculation and affect mid-latitude winds. Inaddition, variability in the ITF mass and heattransport on interannual time scales has beenstrongly linked to the evolution of interannualclimate anomalies, such as occur through theENSO and monsoon systems (Webster et al.,1998). These effects have potentially large eco-nomic and societal impacts on the nations thatborder the Indian Ocean. For example, Nichols(1984) linked ruinous drought conditions inAustralia to cool SST anomalies in the Indonesianseas and central Indian Ocean. Similarly, SSTanomalies that contribute to the dipole mode ofvariability in the tropical Indian Ocean, firstappear in the vicinity of Lombok Strait inIndonesia. This potentially internal mode ofvariability, characterized by basinwide gradientsin tropical SST anomalies, was accompanied bywind and precipitation anomalies that resulted incatastrophic floods in eastern Africa and severedrought in Indonesia. Thus, while it is apparentlywell established that the ITF, in terms of mass andproperty fluxes, greatly impacts the Indian Oceanbasin and beyond, efforts to characterize it havebeen primarily based on large-scale inverse-typeobservations or numerical models (Wijffels et al.,1992; MacDonald, 1998; Ganachaud et al., 2000).There are few time series of directly measuredtemperature and salinity data available in the
Indonesian region so that making robust estimatesof the long-term average ITF heat and freshwatertransport is nearly impossible.
Observations suggest that the ITF is composedof North Pacific thermocline waters flowingthrough Makassar Strait, while lower thermoclineand deeper water masses of South Pacific originenter via an eastern route, north of the Banda Sea(Fig. 1; Gordon and Fine, 1996). While some ofthe Makassar Throughflow directly exits theIndonesian seas via the shallow Lombok Strait,most turns eastward within the Flores Sea to enterthe Banda Sea. It is primarily within the BandaSea that the relatively cool and salty upper Pacificinflow waters are modified by mixing, upwellingand air–sea fluxes before export to the IndianOcean (Ffield and Gordon, 1992; Hautala et al.,1996). From the Banda Sea, the two main exitpassages for the ITF into the eastern Indian Oceanare Ombai Strait and Timor Passage. Ombai Straitdirectly connects the modified waters of the BandaSea to the Savu Sea, before they exit into theIndian Ocean via the Sumba and Savu/Dao Straits(Fig. 1). The Timor Passage is a long, narrowtrench that lies between Timor Island and the wideshallow Northwest Australian coastal shelf.
The five major exit passages along the LesserSunda Island chain, through which the ITF Water(ITW; Wijffels et al., 2002) leaks into the southeastIndian Ocean, were monitored from December1995 until May 1999. The monitoring arrayincluded pairs of shallow pressure gauges at eachside of Lombok, Timor, Ombai, Sumba and SavuStraits (Fig. 1). Geostrophic upper layer velocityand transport, inferred from the cross-straitpressure gradient, show strong variability over alltime scales related to the local and remote forcingmechanisms (Chong et al., 2000; Hautala et al.,2001). Each pressure gauge was also equipped witha temperature and salinity sensor, and it is thesedata that are the focus of this paper.
2. The data
In December 1995, as part of a joint US–Indonesian program, a shallow pressure gaugearray (SPGA) was deployed to monitor the flow of
J. Sprintall et al. / Deep-Sea Research II 50 (2003) 2183–22042184
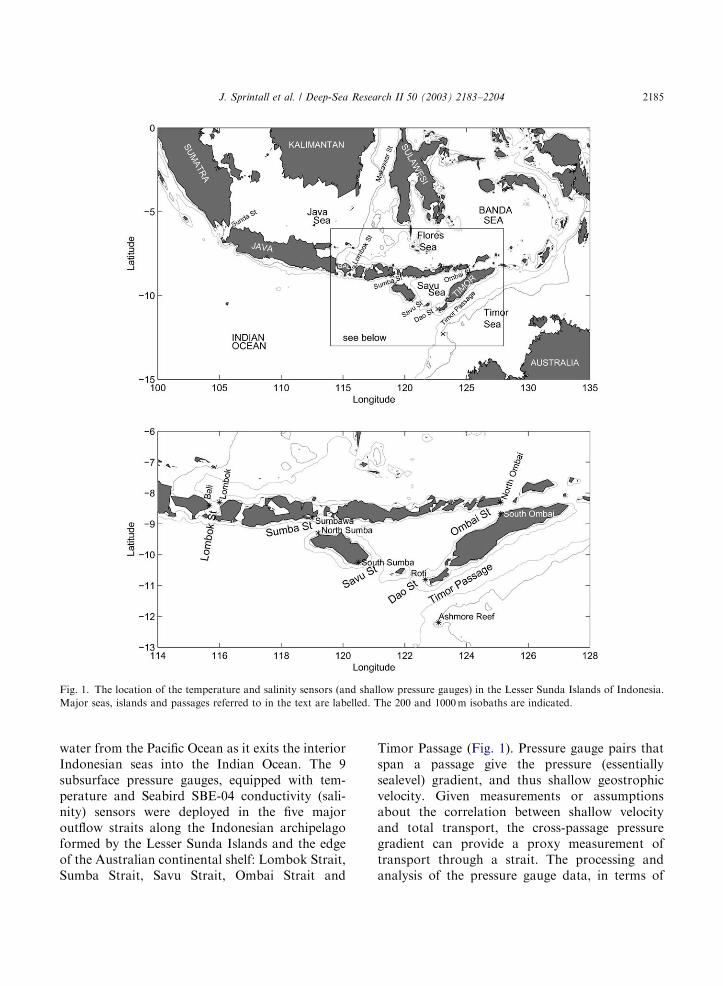
water from the Pacific Ocean as it exits the interiorIndonesian seas into the Indian Ocean. The 9subsurface pressure gauges, equipped with tem-perature and Seabird SBE-04 conductivity (sali-nity) sensors were deployed in the five majoroutflow straits along the Indonesian archipelagoformed by the Lesser Sunda Islands and the edgeof the Australian continental shelf: Lombok Strait,Sumba Strait, Savu Strait, Ombai Strait and
Timor Passage (Fig. 1). Pressure gauge pairs thatspan a passage give the pressure (essentiallysealevel) gradient, and thus shallow geostrophicvelocity. Given measurements or assumptionsabout the correlation between shallow velocityand total transport, the cross-passage pressuregradient can provide a proxy measurement oftransport through a strait. The processing andanalysis of the pressure gauge data, in terms of
Fig. 1. The location of the temperature and salinity sensors (and shallow pressure gauges) in the Lesser Sunda Islands of Indonesia.
Major seas, islands and passages referred to in the text are labelled. The 200 and 1000m isobaths are indicated.
J. Sprintall et al. / Deep-Sea Research II 50 (2003) 2183–2204 2185
variability in velocity and transport, is detailed inChong et al. (2000), Hautala et al. (2001), andPotemra et al. (2002a). This paper will discuss thepressure and velocity variability from thoseanalyses, as it relates to the companion tempera-ture and salinity data.
The pressure gauges and their accompanyingCTD sensors are located just offshore of thebounding islands in each strait at a depth of5–10m. Along the Lesser Sunda Islands the 8gauges are located off the islands of Bali andLombok (Lombok Strait), Sumbawa and NorthSumba (Sumba Strait), South Sumba and Roti(Savu/Dao Strait), and North Ombai and SouthOmbai (Ombai Strait) (Fig. 1). These gauges weredeployed from an Indonesian research vessel inDecember 1995, with recovery and redeploymentsin March 1997 and April 1998. The gauges weremostly recovered in May 1999, except SouthSumba where poor visibility due to suspendedsediment prevented location of the instruments,and South Ombai where the political situation onEast Timor prevented recovery. Consequently,there is no temperature and salinity (or pressure)data for the period April 1998–May 1999 for theselocations. At all other periods and locations,temperature data were 100% successfully re-corded. Full 3.5-yr salinity records are alsoavailable for North Ombai, Sumbawa and NorthSumba. Partial salinity records (mostly >2 yr) areavailable for Bali, Lombok, South Ombai andRoti. No salinity data are available from the SouthSumba sensor. Salinity sensors at these locationswere impacted during the missing periods bybiological or sediment fouling. Bottle samplestaken at the gauge locations during each deploy-ment and recovery dive were analyzed by theOcean Data Facility at SIO and used to calibratethe salinity data collected by the sensors. The ninthpressure gauge, at Ashmore Reef in Australianwaters, was deployed with the help of Australianagencies ANCA and Environment Australia, on adifferent schedule. The gauge at Ashmore Reef is acompanion to the gauge at Roti Island, Indonesia:together they measure flow through Timor Passage(Fig. 1). The instruments at Ashmore Reef wereinitially deployed in February 1995, recoveredand redeployed in April 1996, October 1997,
and October 1998, with subsequent recovery inJanuary 2000. While there is a full-length 5-yrrecord of temperature, the salinity sensor failedfrom September 1995 till April 1996, and againduring the final deployment period from October1998 onwards.
Underway measurements include ADCP andCTD surveys taken throughout the region duringthe four deployment and recovery cruises. Duringthe initial deployment cruise in December 1995, atowed package consisting of a 150 kHz RDInstruments BroadBand ADCP and an OceanSensors CTD was used. The subsequent surveys inApril 1997, May 1998, and May 1999 used ashipboard ADCP, and the CTD was setup throughan onboard intake system. Bucket samples wereroutinely collected underway for calibration of theCTD salinity sensor. Corrections to salinityranged from o0.05 to 0.2. In addition, duringthe first three cruises, repeat transects of 1–2 daysduration were made across each of the outflowstraits to determine the time-average velocity andhelp resolve the tidal cycle within each strait. Thetechnique used for processing and tidal correctionof the repeat ADCP transects across the straits iscovered in Hautala et al. (2001). No tidalcorrection was applied to the single transect surveypattern for the May 1999 data, and tidal analysisof the complete underway data set is to beexplored more fully in a subsequent paper. Forthis paper, the underway data provide four snap-shots of regional conditions that help to put theindividual time series from each gauge locationinto perspective.
3. Temporal variability of temperature and salinity
3.1. Dominant frequencies in the daily temperature
time series
In Ombai Strait, Timor Passage, Savu Strait,and Sumba Strait the dominant signal in the dailyaveraged temperature time series is the annualcycle (Fig. 2). Highest temperatures are foundduring the Northwest monsoon, and coincide withthe austral summer months from January throughMarch. Geostrophic velocity, determined from the
J. Sprintall et al. / Deep-Sea Research II 50 (2003) 2183–22042186
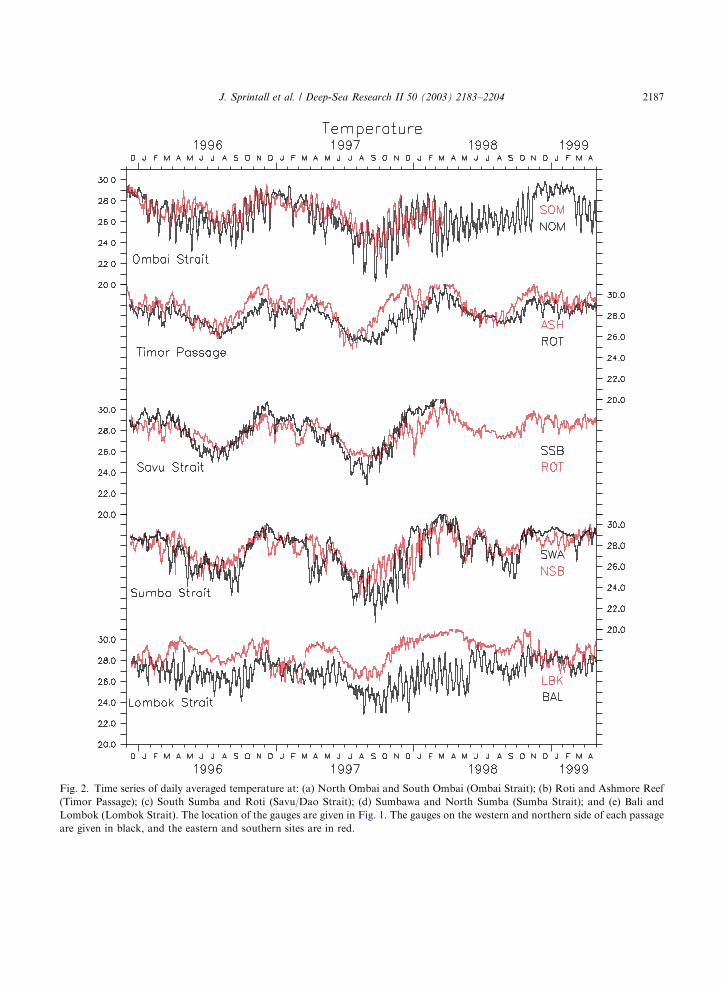
Fig. 2. Time series of daily averaged temperature at: (a) North Ombai and South Ombai (Ombai Strait); (b) Roti and Ashmore Reef
(Timor Passage); (c) South Sumba and Roti (Savu/Dao Strait); (d) Sumbawa and North Sumba (Sumba Strait); and (e) Bali and
Lombok (Lombok Strait). The location of the gauges are given in Fig. 1. The gauges on the western and northern side of each passage
are given in black, and the eastern and southern sites are in red.
J. Sprintall et al. / Deep-Sea Research II 50 (2003) 2183–2204 2187
pressure gauge array, is directed toward the IndianOcean and is weakest during this period (Chonget al., 2000; Hautala et al., 2001). The phase of themaximum temperature for the annual harmonicdoes not appear to have much progression aroundthe archipelago, although the spectra (not shown)find the strongest annual peaks at Sumba andSavu Straits. Interestingly, the temperature data atAshmore Reef show a strong annual cycle, but thesemi-annual cycle also contains half as muchenergy as the annual signal. Here, the warmesttemperatures have a double maxima, warmingearly around September each year, then, after abrief period of moderate cooling over December,warming again in January through March inconcert with the other passages (Fig. 2). Coolertemperatures along these four eastern passages inthe Lesser Sundas are found during the Southeastmonsoon coinciding with austral winter, whenalong-shore winds drive offshore Ekman transportthat also result in the upwelling of cooler waters atdepth. Average temperatures on either side of eachof these four passages are within less than a degreeof each other, being lowest in Ombai Strait, andincrease moving westward along the island chain(Table 1). In addition, the temperature time seriesfrom within each of these straits are highlycorrelated to each other, as well as with theircorresponding pressure field. Variability in thetemperature time series is highest in Sumba Strait(Table 1), which also has the highest amplitude(1.7�C) in the annual harmonic (not shown).
Temperature variability in Lombok Strait isstrikingly different than the other four exitpassages located further eastward. Here there is
little annual cycle, and it is the semi-annual signalthat dominates the temperature time series at bothBali and Lombok (Fig. 2). Some weaker semi-annual energy also is found from temperaturespectra of the Sumbawa, North Ombai, and SouthSumba measurements (not shown). The maximumin this semi-annual harmonic is felt in May in thewestern archipelago and subsequently in June atOmbai Strait. The semi-annual frequency is mostlikely related to the arrival of the Kelvin wavealong the coastal wave guide, forced throughstrong westerly wind bursts in the equatorialIndian Ocean during the April–May monsoontransition period. This period also coincides witheastward flow in the semi-annually reversing SouthJava Current, found along the south coast of theLesser Sunda Island chain (Quadfasel and Cress-well, 1992). Another Kelvin wave may be forcedduring the November monsoon transition,although its effect on the temperature variabilitymay not be as evident given that it coincides withthe maximum temperature of the annual harmonic(Fig. 2). Note that the semi-annual signal is highestalong the northern edge of Sumba Strait (atSumbawa), Ombai Strait (North Ombai), andSuva Strait (South Sumba). This is consistent withHautala et al. (2001), who found northernboundary currents with strong eastward velocitycores in their ADCP sections of these passages,associated with the eastward incursion of theSouth Java Current. Apart from North Ombai,the temperature field measured along the northernsides of the passages, as well as at the Bali location,are highly correlated with velocity through thestraits. The correlations are of the sense that
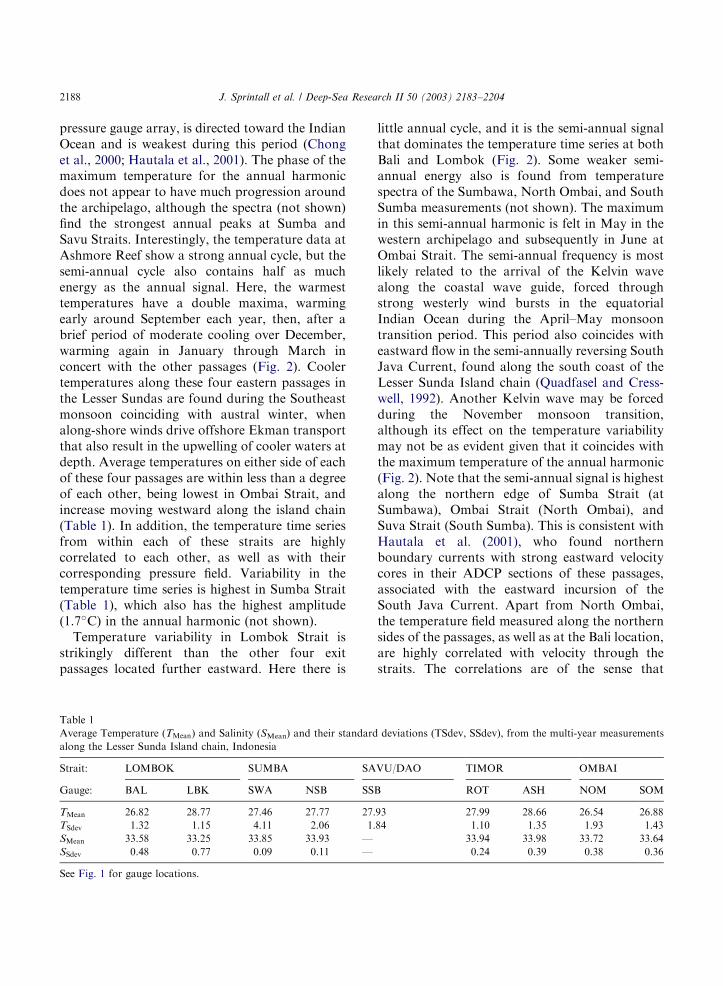
Table 1
Average Temperature (TMean) and Salinity (SMean) and their standard deviations (TSdev, SSdev), from the multi-year measurements
along the Lesser Sunda Island chain, Indonesia
Strait: LOMBOK SUMBA SAVU/DAO TIMOR OMBAI
Gauge: BAL LBK SWA NSB SSB ROT ASH NOM SOM
TMean 26.82 28.77 27.46 27.77 27.93 27.99 28.66 26.54 26.88
TSdev 1.32 1.15 4.11 2.06 1.84 1.10 1.35 1.93 1.43
SMean 33.58 33.25 33.85 33.93 — 33.94 33.98 33.72 33.64
SSdev 0.48 0.77 0.09 0.11 — 0.24 0.39 0.38 0.36
See Fig. 1 for gauge locations.
J. Sprintall et al. / Deep-Sea Research II 50 (2003) 2183–22042188
eastward (northern) flow through the passages areassociated with higher temperatures. This isconsistent with the Indian Ocean source of warmerwaters (compared to that of ITW) found off thecoast of Sumatra and advected eastward in theSouth Java Current.
Unlike the other passages in the Lesser Sundas,in Lombok Strait there is little correlation(r ¼ 0:13) between the temperature time series atBali and Lombok (Fig. 2). The average tempera-ture at Lombok is 28.77�C, much warmer than theaverage temperature of 26.82�C at Bali (Table 1).In fact the temperature time series shows thatLombok is consistently warmer than Bali, with thestriking exception during the December–Marchperiod of each year, when Lombok cools to thesame temperature found at the Bali gauge (apartfrom the El Nino years of 1997–1998). Recall thatfor the other four passages in the Lesser Sundas,these months coincide with the annual maximumtemperatures.
Temperature variations at the Lombok site arenot significantly correlated with either localpressure at Lombok, or geostrophic velocitythrough Lombok Strait, whereas Bali temperatureis significantly correlated with both local Balipressure (r ¼ 0:64) and flow through the strait(r ¼ 0:5). Bali pressure is also highly correlated(r ¼ 0:87) to flow through Lombok Strait, and topressure at Lombok (r ¼ 0:7). As discussed inPotemra et al. (2002a), the correlations are of thesense that higher sealevel at Lombok is indicativeof higher southward flow of warmer water throughLombok Strait. Whereas higher sealevel at Bali isassociated with higher sealevel across the strait,and hence decreased southward flow. Thesevariations are consistent with that of Murray andArief (1988) and will be explored more fully inSection 4.
Finally, the temperature time series at Balishows a prominent fortnightly signal, as do theNorth Ombai and South Ombai time series, and toa lesser extent the Sumbawa and North Sumbadata in Sumba Strait (Fig. 2). This strong fort-nightly tidal signal is also found in the internalIndonesian seas, caused through the interaction ofthe M2 and S2 tides (Ffield and Gordon, 1996).All three passages where the fortnightly energy is
found are directly linked to the internal Indone-sian seas. It may be that the fortnightly signal itselfis a local tidal effect, since the pressure variationsare correlated to temperature variations(r ¼ 0:620:7) at these sites. However, salinity isnot correlated to pressure at any site, except atLombok where salinity and pressure are correlated(r ¼ �0:52) whereas temperature is not (r ¼ 0:32).In Lombok Strait, the ADCP surveys of Hautalaet al. (2001) suggested a western intensification ofthe southward flow through the strait, and thus amore direct connection between conditions atthe Bali site to the internal seas compared to theLombok site. This notion is supported by thedominance of the fortnightly signal at Bali, andthe lack of the signal in the Lombok temperaturetime series (Fig. 2). Consistent with Ffield andGordon (1996), the fortnightly signal in thetemperature time series is much diminished duringthe austral summer months of the Northwestmonsoon from December through March, againwith the exception of these months during the1997–1998 El Nino (Fig. 2).
3.2. Dominant frequencies in the daily salinity time
series
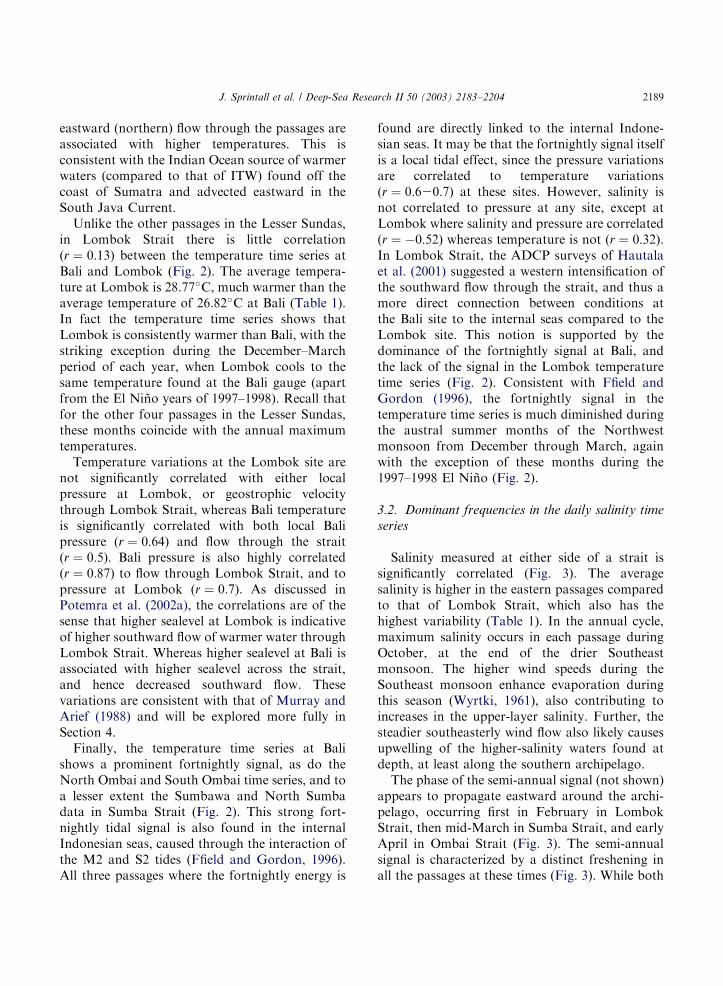
Salinity measured at either side of a strait issignificantly correlated (Fig. 3). The averagesalinity is higher in the eastern passages comparedto that of Lombok Strait, which also has thehighest variability (Table 1). In the annual cycle,maximum salinity occurs in each passage duringOctober, at the end of the drier Southeastmonsoon. The higher wind speeds during theSoutheast monsoon enhance evaporation duringthis season (Wyrtki, 1961), also contributing toincreases in the upper-layer salinity. Further, thesteadier southeasterly wind flow also likely causesupwelling of the higher-salinity waters found atdepth, at least along the southern archipelago.
The phase of the semi-annual signal (not shown)appears to propagate eastward around the archi-pelago, occurring first in February in LombokStrait, then mid-March in Sumba Strait, and earlyApril in Ombai Strait (Fig. 3). The semi-annualsignal is characterized by a distinct freshening inall the passages at these times (Fig. 3). While both
J. Sprintall et al. / Deep-Sea Research II 50 (2003) 2183–2204 2189
Bali and Lombok salinity time series showfreshening early in the year, Lombok is noticeablyfresher than Bali by more than 1 psu. The distinctfreshening in Lombok Strait can last for months,with salinities as fresh as 32 psu and belowcommonly found at the Lombok site. TheLombok gauge is located close to a river mouththat probably influences salinity variability at thesite. In Section 4, we will show that most of thesemi-annual freshening is probably accounted forby the higher precipitation during the Northwestmonsoon that is followed by maximum riverdischarge. The semi-annual arrival of the coastalKelvin wave from the equatorial Indian Ocean canalso contribute a source of freshwater in thesurface layer.
In Lombok Strait, salinity variations at theLombok site are correlated with both the tem-perature (r ¼ �0:57) and pressure (r ¼ �0:52)
variations at the Lombok site, although there isno significant correlation between temperature andpressure at this site per se (r ¼ 0:32). Thesignificant correlations are of the sense that low(high) salinity is associated with high (low)temperature or pressure at the Lombok site. TheLombok gauge is the only location in all the LesserSunda Island measurements where temperatureand salinity variations are significantly correlatedwith each other. Interestingly, there is also acorrelation, of the same sense, between the salinityat the Bali site and pressure at the Lombok site(r ¼ �0:5), although there is little correlationbetween local salinity and pressure at the Bali site.Further, recall that while salinity variations acrossLombok Strait are highly correlated (r ¼ 0:8),there is no significant correlation between tem-perature variations across this strait (r ¼ 0:13).This confusing pattern of correlations is interpreted
Fig. 3. As in Fig. 2, but for daily averaged salinity. Note, there are no salinity data available for South Sumba.
J. Sprintall et al. / Deep-Sea Research II 50 (2003) 2183–22042190
in Section 4 in terms of the western intensificationof the flow through Lombok Strait, and the flow’svertical separation into two layers that is particu-larly evident during the semi-annual northwardpassage of the Kelvin wave through the strait.
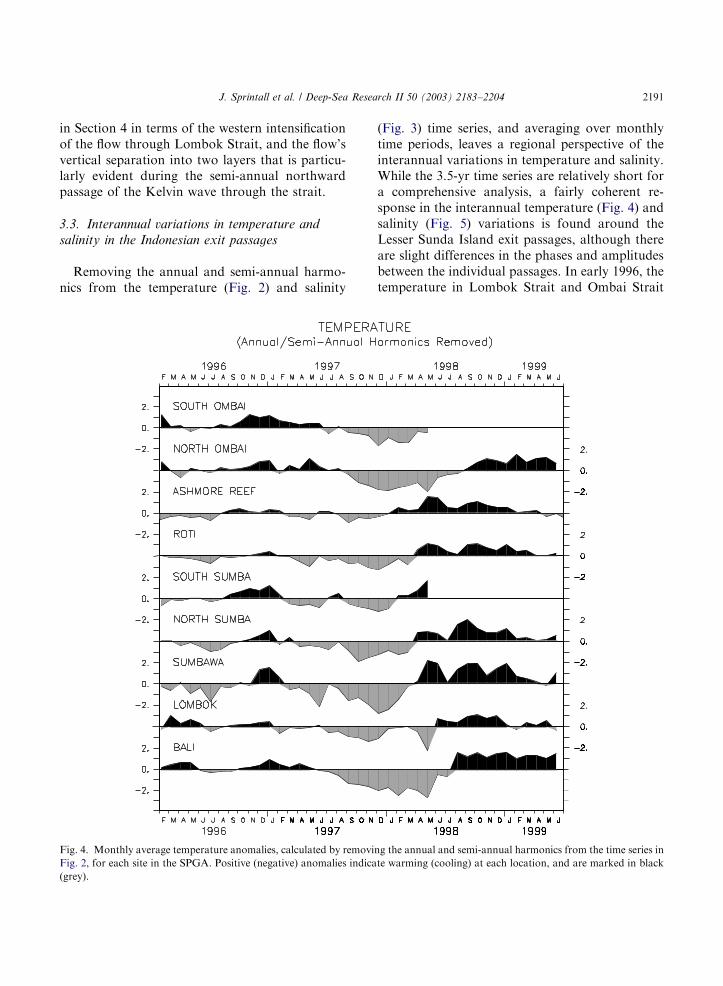
3.3. Interannual variations in temperature and
salinity in the Indonesian exit passages
Removing the annual and semi-annual harmo-nics from the temperature (Fig. 2) and salinity
(Fig. 3) time series, and averaging over monthlytime periods, leaves a regional perspective of theinterannual variations in temperature and salinity.While the 3.5-yr time series are relatively short fora comprehensive analysis, a fairly coherent re-sponse in the interannual temperature (Fig. 4) andsalinity (Fig. 5) variations is found around theLesser Sunda Island exit passages, although thereare slight differences in the phases and amplitudesbetween the individual passages. In early 1996, thetemperature in Lombok Strait and Ombai Strait
Fig. 4. Monthly average temperature anomalies, calculated by removing the annual and semi-annual harmonics from the time series in
Fig. 2, for each site in the SPGA. Positive (negative) anomalies indicate warming (cooling) at each location, and are marked in black
(grey).
J. Sprintall et al. / Deep-Sea Research II 50 (2003) 2183–2204 2191
was warmer than average, whereas in the othereastern passages it was slightly cooler than averageor near normal (Fig. 4). The period of annualmaximum temperature in September 1996 throughJanuary 1997 was slightly warmer than normal inall passages, but by mid-1997 the whole region haddramatically cooled, with small phase differencesin onset between the passages. The regionremained cool throughout the remainder of 1997,then warmed substantially around February–March 1998 in Sumba, Savu/Dao and Timor
Passages, and a bit later around May–June inLombok and Ombai Straits. The warming trendmostly continued till the end of the records in May1999.
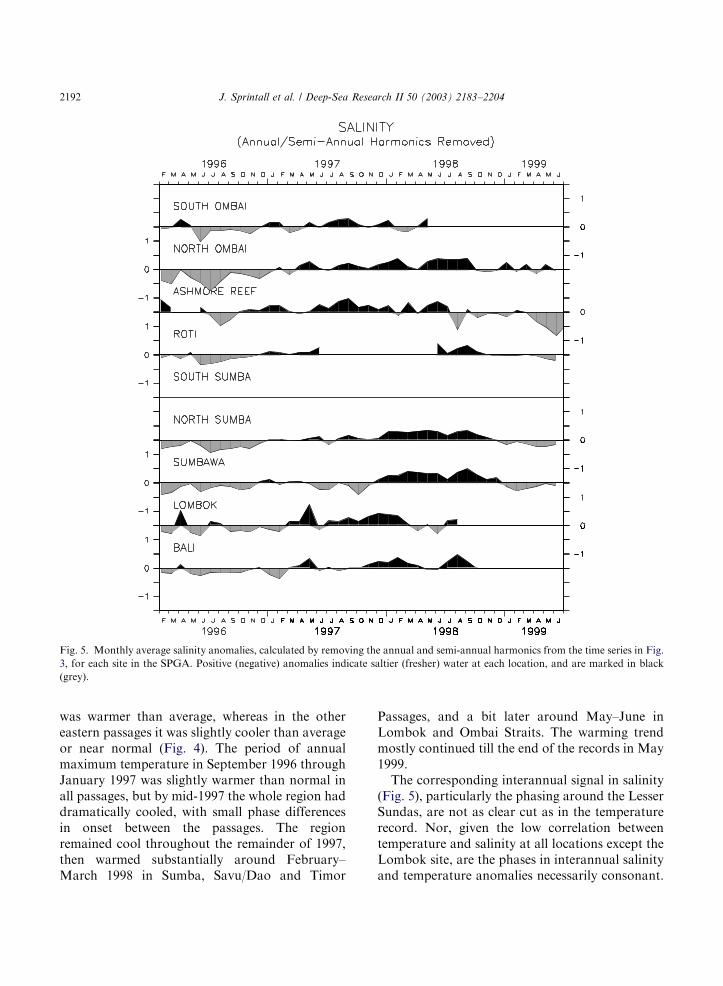
The corresponding interannual signal in salinity(Fig. 5), particularly the phasing around the LesserSundas, are not as clear cut as in the temperaturerecord. Nor, given the low correlation betweentemperature and salinity at all locations except theLombok site, are the phases in interannual salinityand temperature anomalies necessarily consonant.
Fig. 5. Monthly average salinity anomalies, calculated by removing the annual and semi-annual harmonics from the time series in Fig.
3, for each site in the SPGA. Positive (negative) anomalies indicate saltier (fresher) water at each location, and are marked in black
(grey).
J. Sprintall et al. / Deep-Sea Research II 50 (2003) 2183–22042192
Nonetheless, in general, the salinity records showan anomalous freshening of the region occurredthrough mostly all of 1996, followed by a saltierthan normal period during all of 1997 and on untilmid-to-late 1998. A freshening occurred in early1999 till the end of the remaining records. The lowfrequency variability in the temperature andsalinity records are related to the patterns asso-ciated with Pacific ENSO and basin-wide IndianOcean dynamics, as described in Section 4.
4. Discussion
As in the inferred geostrophic velocity data(Hautala et al., 2001), the temperature and salinitydata from the SPGA in the Indonesian exitpassages for the Throughflow show strong varia-bility over all time scales related to the local andremote forcing mechanisms of wind, heating andprecipitation. The forcing on different time scalesand from different regions, results in water massesof different temperature and salinity characteris-tics being advected into or formed locally withinthe Indonesian archipelago. In addition, thesituation is further complicated in the region asthese different forcing mechanisms overlap andinteract, and thus partitioning direct effects in theproperty signals is a complex exercise.
4.1. Why is T–S variability in Lombok Strait
different to the other ITF exit passages?
Lombok Strait displays distinctly differentproperty characteristics between the two sitesacross the passage, as well as compared to theother four main exit passages located farther eastalong the Lesser Sunda Island chain. Perhaps notsurprisingly, this is directly related to Lombok’sgeography. First, nearly all of the southwardLombok Throughflow is considered to comedirectly from Makassar Strait via the Java Sea.The remainder of the Makassar Throughflow thatdoes not exit via Lombok flows east, and spendstime mixing in the internal Flores and Banda Seasbefore exiting through the other eastern passagesalong the Lesser Sunda Islands (Gordon and Fine,1996). Second, Lombok Strait has the shallowest
sill depth (B250m) and therefore the Throughflowhere consists of primarily surface waters that aremore readily and rapidly altered through directsurface air–sea heating and freshwater fluxes.Third, Lombok Strait opens directly onto theSoutheast Indian Ocean, and is the first majorstrait along the southern archipelago to beimpacted by remotely forced coastal Kelvin wavesthat bring water within the eastward South JavaCurrent of distinct Indian Ocean origins (Sprintallet al., 1999; Susanto et al., 2001; Wijffels et al.,2002). While Lombok Strait, at 37 km wide, isnarrower than the Rossby radius of deformation,the Kelvin waves may temporarily reverse theshallow along-strait pressure gradient (Potemraet al., 2002a), and thus their impact may be feltwithin the strait and even further ‘‘upstream’’ atMakassar Strait (Sprintall et al., 2000).
An example of the interaction of all these forceson properties within Lombok Strait can beobserved during the distinct freshening of over2 psu that occurs from March to May of each yearover the measurement period (Fig. 3). South of theequator, the rainy season is during the Northwestmonsoon, lasting from November through March.The maximum river discharge from the mountai-nous islands of Java, Kalimantan and Sumatrathat surround the Java Sea, occurs about onemonth later in April (Wyrtki, 1961). Indeed, theupper layer salinity for the region from the Levitusand Boyer, (1998) climatology, finds the freshestsalinity values for the region occur during April inthe Java Sea, located just to the north of LombokStrait (Fig. 6). Some of the freshening in thesalinity signals at Lombok Strait are in alllikelihood related to the local high precipitationand voluminous river runoff into the Java Seaduring this period. A simple salinity balance findsthat the local precipitation during April inLombok Strait (from the Janowiak and Xie(1999) rainfall data set) accounts for a time rateof change in salinity of only B1.1 psu/month, notenough to fully compensate for the signal observedin Lombok Strait during this period. Generallysouthward flow is found through Lombok Strait inMarch and April (Hautala et al., 2001) that alsocould account for the freshening. In May, how-ever, the surface flow through Lombok Strait, as
J. Sprintall et al. / Deep-Sea Research II 50 (2003) 2183–2204 2193
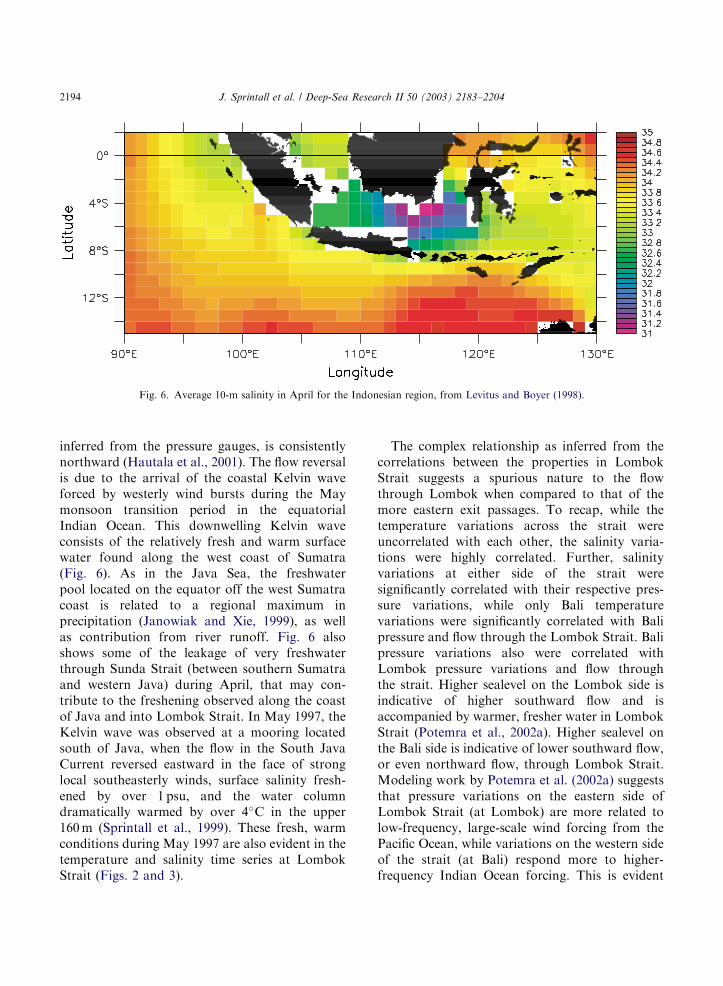
inferred from the pressure gauges, is consistentlynorthward (Hautala et al., 2001). The flow reversalis due to the arrival of the coastal Kelvin waveforced by westerly wind bursts during the Maymonsoon transition period in the equatorialIndian Ocean. This downwelling Kelvin waveconsists of the relatively fresh and warm surfacewater found along the west coast of Sumatra(Fig. 6). As in the Java Sea, the freshwaterpool located on the equator off the west Sumatracoast is related to a regional maximum inprecipitation (Janowiak and Xie, 1999), as wellas contribution from river runoff. Fig. 6 alsoshows some of the leakage of very freshwaterthrough Sunda Strait (between southern Sumatraand western Java) during April, that may con-tribute to the freshening observed along the coastof Java and into Lombok Strait. In May 1997, theKelvin wave was observed at a mooring locatedsouth of Java, when the flow in the South JavaCurrent reversed eastward in the face of stronglocal southeasterly winds, surface salinity fresh-ened by over 1 psu, and the water columndramatically warmed by over 4�C in the upper160m (Sprintall et al., 1999). These fresh, warmconditions during May 1997 are also evident in thetemperature and salinity time series at LombokStrait (Figs. 2 and 3).
The complex relationship as inferred from thecorrelations between the properties in LombokStrait suggests a spurious nature to the flowthrough Lombok when compared to that of themore eastern exit passages. To recap, while thetemperature variations across the strait wereuncorrelated with each other, the salinity varia-tions were highly correlated. Further, salinityvariations at either side of the strait weresignificantly correlated with their respective pres-sure variations, while only Bali temperaturevariations were significantly correlated with Balipressure and flow through the Lombok Strait. Balipressure variations also were correlated withLombok pressure variations and flow throughthe strait. Higher sealevel on the Lombok side isindicative of higher southward flow and isaccompanied by warmer, fresher water in LombokStrait (Potemra et al., 2002a). Higher sealevel onthe Bali side is indicative of lower southward flow,or even northward flow, through Lombok Strait.Modeling work by Potemra et al. (2002a) suggeststhat pressure variations on the eastern side ofLombok Strait (at Lombok) are more related tolow-frequency, large-scale wind forcing from thePacific Ocean, while variations on the western sideof the strait (at Bali) respond more to higher-frequency Indian Ocean forcing. This is evident
Fig. 6. Average 10-m salinity in April for the Indonesian region, from Levitus and Boyer (1998).
J. Sprintall et al. / Deep-Sea Research II 50 (2003) 2183–22042194
given that northward flow through the strait (i.e.higher sealevel at Bali) occurs primarily during thesemi-annual Kelvin wave events, driven by windsin the Indian Ocean. What is more, Potemra et al.(2003) further suggests that the modes of varia-bility have a vertical separation: lower frequencyPacific-related variability is found at depth in theoutflow passages, whereas the upper-surface flowthrough these straits has more of an annual orsemi-annual signal related to local regional andIndian Ocean winds. This is consistent withHautala et al. (2001) who note that the repeatADCP surveys in the outflow passages show atwo-layer flow structure, with flow in the lowerlayer consistently directed toward the IndianOcean, whereas upper-layer flow can episodicallyreverse. The property correlations suggest supportfor the variations in the upper layer: at Lombokwarm, freshwater is associated with high pressure,and therefore higher southward flow of ITW, asoccurs during March and April (Figs. 2 and 3);whereas at Bali higher sealevel and northward flowis associated with the warm temperatures foundoff the Sumatra coast, and at most times is notsignificantly correlated to salinity (although thenegative correlation implies the relatively fresh-water found off Sumatra). Hautala et al. (2001)further suggest that the strongest core of outflowthrough Lombok Strait shows a consistent in-tensification toward the Bali side, a lateral separa-tion also noted by Murray and Arief (1988). Thisis true whether the southward high-velocity coreoccurs in the upper or lower layer, and explainswhy the correlation between Bali pressure andtemperature variations with flow through the straitare significant, whereas the variations at theLombok site are not significantly correlatedwith the outflow. In addition, as noted earlier,the western intensification also accounts for thepresence of the fortnightly tidal energy in thetemperature signal at Bali that is not found atLombok.
4.2. Regional variability observed by underway
ADCP and CTD measurements
In December 1995, the underway ADCP andCTD data show that near-surface flow in the
western archipelago was predominantly towardthe Indonesian Seas (Fig. 7a). The flow issuggestive of coastal Kelvin wave propagation,forced in response to equatorial Indian Oceanwesterly wind bursts during the November mon-soon transition (Wyrtki, 1973). Typically theNovember Kelvin wave is considered to be weakerthan the May transition Kelvin wave (Han et al.,1999). Nonetheless, in December 1995 the repeatADCP surveys across the straits found northwardflow in the upper 100m of Lombok Strait, andeastward flow in the South Java Current extendingthrough Sumba Strait, and into the Savu Sea(Hautala et al., 2001). Eastward flow also wasobserved in the upper 160m of the moored ADCPdata collected during December 1995 in OmbaiStrait (Molcard et al., 2001). The surface tempera-ture–salinity structure from the concurrent under-way CTD measurements (Fig. 7a) shows that theeastward flow consisted of the relatively fresh,warm water consistent with that found in the nearequatorial Indian Ocean west of Sumatra. A directoutflow of the freshwater found in the internalJava, Flores and Banda seas is not found duringthis period (Fig. 7a). This implies that the SouthJava Current, at least during its semi-annualmaximum, may provide a very efficient mechanismfor transporting the relatively low-salinity IndianOcean surface water through the Lesser Sundapassages and into the internal Indonesian seas.Surface flow toward the Indian Ocean duringDecember 1995 was confined to Dao Strait andTimor Passage (Fig. 7a). During March 1997 (Fig.7b), and again in March 1998 (Fig. 7c), the ADCP/CTD near-surface measurements return to a moreclassical picture of the Throughflow, in whichthere is flow mostly toward the Indian Oceanthroughout the archipelago. The fresher Java Seatemperature–salinity characteristics (compared tothe Indian Ocean surface thermohaline structure)are present in the strong southward flow emergingfrom Lombok Strait. This is consistent with thevery freshwater observed at the Lombok and Balipressure gauge sites during these months (Fig. 3).Finally, the underway ADCP/CTD survey in May1999, again shows the likely presence of the semi-annual Kelvin wave, at least in the vicinity ofLombok Strait, as evidenced by the northward
J. Sprintall et al. / Deep-Sea Research II 50 (2003) 2183–2204 2195
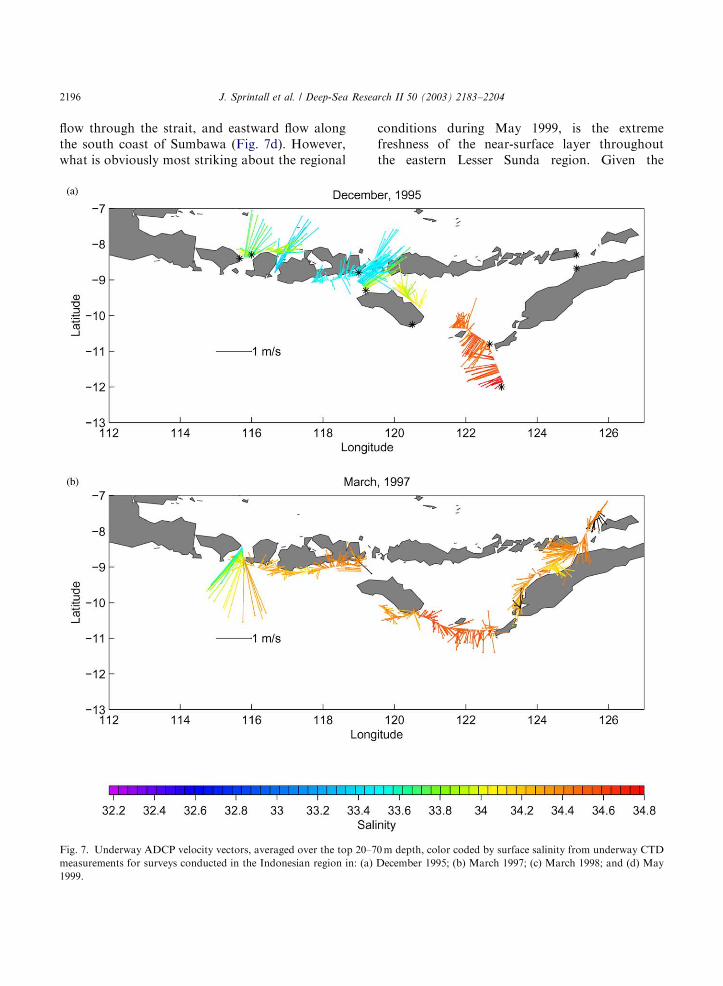
flow through the strait, and eastward flow alongthe south coast of Sumbawa (Fig. 7d). However,what is obviously most striking about the regional
conditions during May 1999, is the extremefreshness of the near-surface layer throughoutthe eastern Lesser Sunda region. Given the
Fig. 7. Underway ADCP velocity vectors, averaged over the top 20–70m depth, color coded by surface salinity from underway CTD
measurements for surveys conducted in the Indonesian region in: (a) December 1995; (b) March 1997; (c) March 1998; and (d) May
1999.
J. Sprintall et al. / Deep-Sea Research II 50 (2003) 2183–22042196
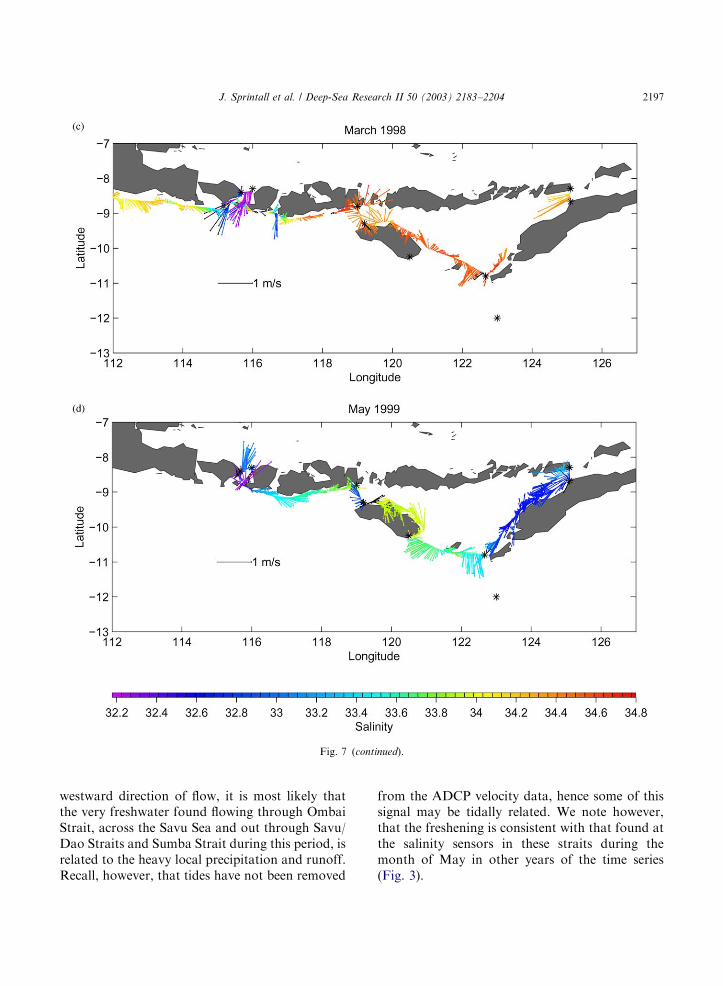
westward direction of flow, it is most likely thatthe very freshwater found flowing through OmbaiStrait, across the Savu Sea and out through Savu/Dao Straits and Sumba Strait during this period, isrelated to the heavy local precipitation and runoff.Recall, however, that tides have not been removed
from the ADCP velocity data, hence some of thissignal may be tidally related. We note however,that the freshening is consistent with that found atthe salinity sensors in these straits during themonth of May in other years of the time series(Fig. 3).
Fig. 7 (continued).
J. Sprintall et al. / Deep-Sea Research II 50 (2003) 2183–2204 2197
4.3. T–S variability in response to local forcing
Local forcing from wind and heating can alsoplay a role in causing the variability observed inthe upper-ocean measurements of temperature andsalinity in the Indonesian exit passages. Forexample, in December 1995, the regional windssouth of Java were eastward (see Fig. 3 of Potemraet al., 2002a, 2003) and hence may have enhancedflow of the eastward South Java Current observedalong the Lesser Sunda island chain during thisperiod (Fig. 7a). Similarly, some of the tempera-ture variability may be attributed to regional air–sea heat fluxes. For instance the NCEP monthlyclimatology shows that the net surface heat fluxfor the region is maximum in October and March,and minimum in June–July. This partially agreeswith what we find in the annual cycle of thetemperature measurements at least in the easternpassages (Fig. 2): warmest from October throughMarch and coolest from June through September.In particular, the temperature time series atAshmore Reef (Fig. 2) shows peak temperaturesin October/November with a secondary maximumaround March. This suggests that at AshmoreReef, vertical mixing of the air–sea heat flux maydetermine the annual cycle temperature variability.However, as we have outlined, the regionalmonsoon winds also play a large role in definingthe annual cycle of the Indonesian region. Therelationship between wind forcing and the hor-izontal advective effects (Potemra et al., 2002a)appears to be consistent with the annual cycleobserved in temperature.
The relationship of salinity variability to theregional precipitation and runoff has been dis-cussed. However, given the proximity of theLombok site gauge to a river mouth, local forcesprobably also play a prominent role in influencingthe salinity and temperature variability at this site.It is likely that the enhanced freshening observedat Lombok during March through May of eachyear is due to the influx of river discharge directlyonto the site. In addition, the prevailing windsduring this Northwest monsoon period imply thatlocal precipitation also would be higher on thewestern side of Lombok Island where the gauge islocated.
4.4. T–S variability related to ENSO
There is substantial evidence that the ITF is alsomodulated on interannual time scales. The changesare of the sense that transport is smaller (larger),and the thermocline is shallower (deeper) during ElNino (La Nina) time periods (Meyers, 1996; Brayet al., 1996; Fieux et al., 1996; Gordon and Fine,1996; Potemra et al., 1997). Wyrtki (1987)suggested that the reversal in the Pacific Oceantrade winds that occurs during an El Nino reducesthe pressure gradient between the Pacific and theIndian Ocean, thought to be the driving force forthe Throughflow on low-frequency time scales.Indeed, the Arlindo mooring observations withinMakassar Strait find an average transport of 5.1 Svduring the El Nino months of December 1997–February 1998, while during the La Nina monthsof December 1996–February 1997 the average is12.5 Sv, a 2.5-fold difference (Gordon et al., 1999).Further, using nearly 15 years of XBT data in theregion, Ffield et al. (2000) show that the Makassarupper thermocline temperature is also highlycorrelated with ENSO, a feature that may proveuseful for developing proxy measurements of ITFtransport.
In the Lesser Sunda Island exit passages, therelationship of transport to ENSO is much lesscertain, and a different response is evident betweenthe passages (Hautala et al., 2001). In thetransport estimated from the shallow pressuregauges, there is some suggestion of weaker flowthrough Ombai Strait, with increased flow throughTimor Passage during the El Nino event in 1997–1998. This is consistent with a 20-yr run of thePOCM model, in which there is stronger flowthrough Timor Passage and weaker flow throughOmbai Strait during ENSO events (Potemra et al.,2002a), although the magnitude of the transportchanges through the two model straits do not fullycompensate each other. In Lombok Strait, and toa lesser extent in Sumba Strait, it appears thatthrough-strait transport was much stronger thannormal for most of 1997 till mid-1998, and thenweaker than normal (or even more northward)from mid-1998 until the end of the record in May1999 (Hautala et al., 2001). The uncertainty of theENSO signal in the outflow straits may be related
J. Sprintall et al. / Deep-Sea Research II 50 (2003) 2183–22042198
to the fact that the SPGA pressure gauges infer theflow for the surface layer, whereas models suggestthat the low-frequency signal appears strongest inthe deeper layers (Potemra et al., 2003).
Clearly, however, in the temperature andsalinity measurements of the upper layer, the1997–1998 El Nino period corresponds to a strongcooling in every exit passage, with a general senseof increased salinity (Figs. 4 and 5). While it isapparent that there are phase differences for theonset of the cooling trend, for the most part itappears that at least for the period July 1997through February 1998, every exit passage wascooler than normal. A simple explanation wouldbe that there is simply less of the warm, fresh ITFentering the Indonesian seas during an El Nino, asthe flow is being diverted from the western Pacificwarm pool toward the eastern Pacific Ocean. Suchan explanation due to advective effects would besuitable for the ENSO temperature–transportrelationship observed in Makassar Strait (Ffieldet al., 2000), as this strait is more directlyconnected to the western Pacific warm pool, andthe ENSO impact would be more direct. For theoutflow passages, however, a simple relationshipto transport may not be as clear cut, due to theimpact of storage that probably occurs on seasonaltime scales in the Banda Sea (Hautala et al., 2001;Gordon and Susanto, 2001). Gordon and Susanto(2001) found cooler surface temperatures in theBanda Sea during El Nino periods, and furthersuggest that during the 1997 ENSO event surface-layer divergence (loss) from the Banda Sea was ashigh as 4 Sv. However, given the varying ratios oftransport carried through each of the outflowstraits during ENSO events, as observed in thepressure gauge data (Hautala et al., 2001; Potemraet al., 2002a), the gating of this Banda Seadivergence through the respective exit passagesalong the Lesser Sunda chain appears an extremelycomplex issue that may not be answerable with thelimited number of observations to date. Ofinterest, however, we note that the strongestoutflow during the 1997 El Nino occurred throughLombok Strait, consistent with the hypothesis ofWyrtki (1961), who suggested that Banda Seadivergence may at times be exported westward intothe Flores and Java Seas.
In addition to advective effects, the regionalcooling and saltiness evident in the upper oceanmeasurements along the Lesser Sunda Island chainduring the 1997–1998 El Nino may be attributedto associated variability in the air–sea and windmomentum fluxes. Certainly during El Ninoevents, the center of atmospheric convection thatnormally resides over Indonesia shifts eastwardtoward the central Pacific (Ropeleweski andHalpert, 1987). In 1997–1998, the lack of rainfallover the Indonesian region resulted in a cata-strophic drought with subsequent devastatingwide-spread fires, that left a legacy of profoundeconomic and political consequences. This anom-alously low precipitation also reduced the nor-mally voluminous freshwater outflow from therivers in the region, and both effects would act toraise the upper layer salinity in 1997, as observedin the salinity time series around the archipelago(Fig. 5). A further effect of the reduced precipita-tion in Indonesia during 1997 was a significantincrease in the absorbed short-wave and outgoinglong-wave radiation fluxes (Gutman et al., 2000).The change in these fluxes during 1997 wasactually compounded by the injection of smokeaerosols into the atmosphere from the wide-spreadfires during the 1997 drought (see Gutman et al.(2000) for an interesting discussion on the chain ofatmospheric events). The net effect of the increasein outgoing radiative fluxes may have partiallyresulted in the cooler upper-ocean temperaturesobserved during 1997 in the Lesser Sunda exitpassages (Fig. 4), that also were observed inAVHRR satellite SST measurements over theentire Indonesian archipelago (Gutman et al.,2000). Finally, a change in the wind regime toenhanced easterlies over Indonesia during the 1997El Nino probably increased upwelling activity,raising the depth of the thermocline and bringingcooler and saltier water to the surface along thesouthern coast of the Lesser Sunda Islands(Sprintall et al., 1999; Susanto et al., 2001).
4.5. T–S variability related to the Indian Ocean
Dipole Mode
Unfortunately, the picture is further compli-cated as the strong 1997–1998 El Nino event
J. Sprintall et al. / Deep-Sea Research II 50 (2003) 2183–2204 2199
coincided with the equally strong 1997 IndianOcean dipole event (Saji et al., 1999; Webster et al.,1999; Yu and Rienecker, 1999; Murtugudde et al.,2000). This coincidence is considered unfortunatefrom three standpoints: first, it is a hotly contesteddebate in the climate community whether the twophenomena are related or not (see Saji et al., 1999;Murtugudde et al., 2000 for a review of thearguments); second, within the Indonesian seasthe impacts on the regional atmospheric andoceanic conditions from both phenomena are verysimilar, if not indistinguishable; and third, bothphenomena may be amplified or modulated by the‘‘normal’’ shifts induced by the annual regionalmonsoon. The 1997 Indian Ocean Dipole event ischaracterized by anomalously cool SSTs occurringin the eastern tropical Indian Ocean off the coastof Sumatra and Java, while the western tropicalIndian Ocean is warmer than usual (hence the‘‘dipole’’). Strong easterly wind anomalies alsowere present along the equator in the tropicalIndian Ocean (Saji et al., 1999). The ENSO-dependent camp suggest that these anomalouseasterlies were induced by an ENSO-relatedreversal in the Walker Cell that subsequentlycaused the cooler eastern Indian conditions (Yuand Rienecker, 1999), whereas the ENSO-inde-pendent camp suggests that the warm SSTs in thewestern tropical Indian Ocean shifted and in-creased convection over eastern Africa, thusproducing the easterly wind anomalies in thecentral Indian Ocean (Webster et al., 1999).Whatever the sequence of events, both groupsnote that the enhanced equatorial Indian OceanSST gradient from June to December 1997 in turnmaintained and prolonged the easterly windanomalies during this period. Furthermore, theequatorial easterlies probably forced upwellingKelvin waves leading to a shallower thermoclinewith lower sea-surface height in the east (Murtu-gudde et al., 2000), bringing cold, relatively saltywater to the surface along the coasts of Sumatraand Java (Susanto et al., 2001), and a sustainedperiod of anomalously eastward flow of cooler,saltier water in South Java Current lasting fromJuly 1997 through January 1998 (Sprintall et al.,1999). Thus, the impact of the Indian OceanDipole Mode on atmospheric conditions and
oceanic properties, at least in the vicinity of theITF exit passages, are strongly reminiscent ofthose equally attributable to El Nino: cooler water(Fig. 4) due to an enhancement of upwellingcaused by a shift in the surface winds; and saltierwater (Fig. 5), also attributable to increasedupwelling, as well as to a decrease in rainfall,caused by a shift in the locus of the atmosphericconvection (eastward to the central Pacific Oceanin the case of ENSO, and westward to over Africain the case of the dipole mode). Finally, we notethat the upwelling response along the Sumatra andJava coasts of cooler SST due to alongshore windforcing is actually typical of that observed duringthe southeast monsoon (June–October), althoughSusanto et al. (2001) suggest that the upwellinghere extended both in time (till November) andspace (to the equator) during 1997.
4.6. T–S variability related to La Nina
The 1997–1998 El Nino event was immediatelyfollowed by a La Nina, beginning around April1998 (Climate Diagnostics Bulletin, 1998). The LaNina period corresponds with larger ITF anddeeper thermocline in Makassar Strait (Gordonet al., 1999), and reduced upwelling, deeperthermocline and warmer SST along the coasts ofSumatra and Java (Susanto et al., 2001). In theLesser Sunda Island passages, warmer upper-ocean temperatures are evident in Timor Passage,Savu/Dao and Sumba Straits from April 1998until near the end of the record in May 1999 (Fig.4). In Lombok Strait and at North Ombai, theonset of warmer than normal temperatures occurs1–3 months later. In Lombok Strait, this delaymay be related to the arrival of the transitionalKelvin wave that resulted in northward flow ofcooler water through the strait during May–June1998 (Fig. 4; Hautala et al., 2001). Concurrentpressure data for inferring velocity through OmbaiStrait are unavailable over this time period(Hautala et al., 2001), although there are (weak)eastward flow and a reduction in the anomalouswarm temperatures in Sumba Strait (Fig. 4) at theeastern edge of the Savu Sea in June 1998, whichcould indicate the Kelvin wave passage throughthe Savu Sea to North Ombai. As during the El
J. Sprintall et al. / Deep-Sea Research II 50 (2003) 2183–22042200
Nino period, the relationship of transport totemperature during the La Nina period is equallyas complicated, and with the non-recovery ofpressure gauge data in Ombai and Timor Passageduring this period, no clear-cut signal can bedetermined. Again, however, transport and flowthrough Lombok Strait displays an inverse rela-tionship to that found during La Nina periods inMakassar Strait: southward flow through Lombokis much weaker than average. In fact, after thenorthward flow in May–June 1998 associated withthe Kelvin wave, there is only a short return toweak southward flow, and from November 1998onwards, Lombok Strait is characterized byperiods of strong, prolonged northward flow(Hautala et al., 2001). Again we invoke Wyrtki’s(1961) hypothesis of increased convergence intothe Banda Sea, supported by Gordon and Susanto(2001) who found maximum convergence into theinternal sea occurs during the northwest monsoon(November–March), that is enhanced under LaNina conditions. The salty conditions that existedin the outflow passages during the 1997 El Ninoappear to continue until at least mid-1998, anduntil late-1998 in the passages that still had activesalinity sensors at this time (Fig. 5). Precipitationfrom the Janowiak and Xie (1999) data set, showsa severe rainfall deficit existed throughout theentire Indonesian region in January 1998, rainfallwas as scarce during this period as during theSeptember–October 1997 El Nino period (Gutmanet al., 2000). The anomalous drought conditionsremained throughout most of the region in Marchand April 1998, apart from anomalously highrainfall that occurred in the Java Sea region. Thefreshening that appears at the Lombok and Balisensors in March–May 1998 (Fig. 5) is likelyrelated to this heavy local rainfall and subsequentrunoff, as well as the arrival of the Kelvin wave inMay–June 1998. The precipitation fields show areturn to normal rainfall patterns over the south-east monsoon period from May through October1998, with slightly wetter conditions in the easternarchipelago. We can therefore offer no reasonableexplanation for the prolonged saltiness observed inthe Lesser Sunda exit passages during this period,for instance in the upper-ocean records at SumbaStrait and at North Ombai (Fig. 5). During the
northwest monsoon from January to April 1999,however, heavier than normal rainfall occurred,and the freshening in the Sumba Strait salinitysensors (Fig. 5) and evident in the (early) May1999 underway ADCP/CTD survey (Fig. 7d)indicate the regional and cumulative impact ofthis precipitation.
5. Conclusions
The upper-ocean temperature and salinity datafrom a 31
2year deployment in the five major
passages along the Lesser Sunda Island chain inIndonesia document the property characteristics ofthe Throughflow as it exits into the SoutheastIndian Ocean. As in the concurrent pressure gaugedata that yield estimates of geostrophic surfaceflow and upper layer transport (Hautala et al.,2001), the property data show variability overmany time scales, with different responses evidentwithin each passage along the island chain due todifferent forcing mechanisms. In particular, itseems that Lombok Strait displays very distinctproperty characteristics compared to the moreeastern passages of Sumba, Savu/Dao, Ombai,and Timor passages. Lombok Strait is moredirectly connected to Makassar Strait, the majorinflow passage for ITF upper surface and thermo-cline water masses from the Pacific Ocean (Gordonet al., 1999), as well as being the first major straitimpacted by remote forcing from the IndianOcean. In addition, the temperature and salinitydata on either side of Lombok Strait, at Bali islandon the western side and Lombok island on theeast, reveal different scales of variability from eachother. The water at Lombok is much warmer andmuch fresher than that found at the Bali site,whereas in the other exit passages there is littlecross-strait gradient evident in temperature andsalinity.
We have attempted to explain the variability inthe temperature and salinity time series in terms ofthe different local and remote forcing mechanismsthat impact both property and mass fluxes in theIndonesian region. However, it should not neces-sarily be assumed that the forcing impacts thevelocity variations and the temperature and
J. Sprintall et al. / Deep-Sea Research II 50 (2003) 2183–2204 2201
salinity variations in the same way. For example,Potemra et al. (2002a) find a dominant intrasea-sonal signal in the inferred geostrophic velocityand transport time series from the shallowpressure gauges that was not evident or particu-larly strong in the spectra of temperature orsalinity. The velocity obviously only contributesthe advective effects to changes in the salinity andtemperature balance, as shown above, otherequally strong contributions are from the local orlarge-scale air–sea fluxes of heat and windmomentum, as well as precipitation and evapora-tion in the salinity balance.
During the 1996–1999 SPGA deployment peri-od, there was a strong El Nino occurring in thePacific Ocean, and an equally strong Dipole Modein the Indian Ocean. Whether they are related ornot, the complex dynamics from the interplaybetween these two events that geographically mustinteract within the Indonesian region, is evident inthe property and velocity observations in theoutflow straits. From mid-1997 till early 1998,when both the El Nino and Dipole Eventsoccurred, the upper ocean was warmer and saltierthan normal. We presented reasons why both ofthese interannual climatic events could cause theproperty fluxes in the outflow passages to respondin this way: a deficit in precipitation (due to bothclimate phenomena); less warm, fresh Through-flow (ENSO-related); and an influx of cooler, saltywater from the Indian Ocean (Dipole-related).Again, the interaction between the forcing me-chanisms from the two basins appears to be morecomplex in Lombok Strait. In particular, it isinteresting that during the Northwest monsoonmonths of December–February when Lombokand Bali temperatures are generally similar, in1997–1998 there is a large cross-strait temperaturedifference and there was no decrease in thefortnightly cycle in temperature at the Bali site.The fortnightly signal at Bali, due to tidal forcingat this frequency in Makassar Strait and theinternal Indonesian seas, is further evidence forthe western intensification of flow through Lom-bok Strait (Hautala et al., 2001), and also its directconnection to flow from Makassar Strait. Sincethere was no seasonal decrease in the fortnightlysignal during the 1997–1998 Northwest monsoon,
we speculate that during this period, flow at Baliwas more related to upstream conditions andpossibly Pacific Ocean forcing. Shallow southwardflow through Lombok Strait was stronger thannormal during this time adding support to theconnection, although this is counter-intuitive tothat expected during El Nino events. However, theresponse in the outflow straits to ENSO isuncertain due to the lack of lower layer velocityobservations, and further, the inability of state-of-the-art models to adequately resolve the width ofthe shallow Lombok Strait (Potemra et al.,2002a, 2003).
Although the interannual signals from both theIndian Ocean and the Pacific Ocean are interest-ing, it is the annual cycle that tends to dominatethe time series of both temperature and salinity, atleast in the eastern passages along the LesserSunda Island chain. Here, each year during thewarm, wet summer months of the Northwestmonsoon from November through March, theupper ocean temperatures rise and salinity falls inconcert around the archipelago. During the cooler,drier and windier Southeast monsoon, tempera-ture falls and salinity increases. The semi-annualsignal is dominant in Lombok Passage, and isrelated to both high local precipitation and runoff,as well as the arrival of freshwater in thetransitional Kelvin wave around May, manifestedas eastward flow in the South Java Current. Thesemi-annual signal also is seen in the salinity timeseries of Sumba Strait and Ombai Strait, evidencethat the eastward flow of freshwater in the SouthJava Current is advected into the Savu Sea andbeyond into the internal seas. The two regionalmonsoon phases, and the two periods between thetransitioning of the wind direction, even with theirinherent year-to-year variability in onset andstrength (Webster et al., 1998), still explain mostof the upper ocean property variability in theoutflow passages.
Finally, we draw attention to the fact that theobservations presented in this paper were allrecorded at only 5–10m depth, and were single-point measurements very close to land at eitherside of the major passages that make up the exitchannels. It is somewhat remarkable then that weare able to observe and explain so much of the rich
J. Sprintall et al. / Deep-Sea Research II 50 (2003) 2183–22042202
spatial and temporal variability evident in thetemperature and salinity series as it relates toknown remote and local forcing. Given thelocation and depth of the observations, however,they are of limited use in calculating definitiveestimates of heat and freshwater fluxes through thepassages. Obviously a coherent time series ofsimultaneous observations of temperature, salinityand velocity measurements that adequately resolvethe cross-passage and the vertical structure of theflow and property characteristics through the exitpassages, should be of high priority to accuratelydetermine the ITF transport of heat and fresh-water flux into the Indian Ocean.
Acknowledgements
We gratefully acknowledge the commandersand crew of the R/V Baruna Jaya I and the R/V
Baruna Jaya IV for their capable and enthusiasticsupport of the project. We also thank ourcolleagues at BPPT Indonesia (particularly Dr.Indroyono Soesilo and Mr. Basri Gani) for theirorganizational efforts and shiptime. The fieldsupport, technical expertise and scientific insightof Thomas Moore, Paul Harvey, Werner Mor-awitz, and Jackson Chong were an important partof the SPGA program. Many of the figuresproduced in this manuscript used the Ferretpackage, freely available from NOAA/PMEL,and supported by Steve Hankin and Ed Harrison.The underway 1998 and 1999 ADCP data set wereprocessed using the CODAS package, availablefrom the University of Hawaii, supported by EricFiring. Financial support for the SPGA fieldworkand analysis was provided by the National ScienceFoundation (OCE-9819511, OCE-9818670, OCE-9505595, OCE-9415897, and OCE-9529641) andthe Office of Naval Research (N00014-94-1-0617).
References
Bray, N.A., Hautala, S.L., Pariwono, J., Chong, J.C., 1996.
Large-scale sea level, thermocline, and wind variations in
the Indonesian Throughflow region. Journal of Geophysical
Research 101, 12239–12254.
Bryden, H.L., Imawaki, S., 2001. Ocean transport of heat. In:
Siedler, G., Church, J., Gould, J. (Eds.), Ocean Circulation
and Climate. Academic Press, New York.
Chong, J.C., Sprintall, J., Hautala, S., Morawitz, W., Bray,
N.A., Pandoe, W., 2000. Shallow Throughflow variability in
the outflow straits of Indonesia, Geophys. Research Letters
27, 125–128.
Climate Diagnostics Bulletin, published by the Climate Predic-
tion Center, US Department of Commerce, NOAA/NWS/
NCEP, 1998.
Ffield, A., Gordon, A., 1992. Vertical mixing in the Indonesian
Thermocline. Journal of Physical Oceanography 22,
184–195.
Ffield, A., Gordon, A., 1996. Tidal mixing signatures in the
Indonesian Seas. Journal of Physical Oceanography 26,
1924–1937.
Ffield, A.L., Vranes, K., Gordon, A.L., Susanto, R.D., Garzoli,
S.L., 2000. Temperature variability within Makassar Strait.
Geophysical Research Letters 27, 237–240.
Fieux, M., Molcard, R., Ilahude, A.G., 1996. Geostrophic
transport of the Pacific–Indian Oceans Throughflow.
Journal of Geophysical Research 101, 12421–12432.
Ganachaud, A., Wunsch, C., Marotzke, J., Toole, J., 2000. The
meridional overturning and large-scale circulation in the Indian
Ocean. Journal of Geophysical Research 105, 26117–26134.
Gordon, A., Fine, R., 1996. Pathways of water between the
Pacific and Indian Oceans in the Indonesian seas. Nature
379, 146–149.
Gordon, A.L., Susanto, R.D., 2001. Banda sea surface layer
divergence. Journal of Ocean Dynamics 52, 2–10.
Gordon, A.L., Susanto, R.D., Ffield, A.L., 1999. Throughflow
within Makassar Strait. Geophysical Research Letters 26,
3325–3328.
Gutman, G., Csiszar, I., Romanov, P., 2000. Using noaa/avhrr
products to monitor el nino impacts: focus on indonesia in
1997–98. Bulletin of the American Meteorological Society
81 (6), 1189–1205.
Han, W., McCreary, J.P., Aderson, D.L.T., Mariano, A.J.,
1999. Dynamics of the Eastward Surface Jets in the
equatorial Indian Ocean. Journal of Physical Oceanography
29, 2191–2209.
Hautala, S.L., Reid, J.L., Bray, N., 1996. The distribution and
mixing of Pacific water masses in the Indonesian Seas.
Journal of Geophysical Research 101, 12375–12389.
Hautala, S.L., Sprintall, J., Potemra, J., Ilahude, A.G., Chong,
J.C., Pandoe, W., Bray, N., 2001. Velocity structure and
transport of the Indonesian Throughflow in the major
straits restricting flow into the Indian Ocean. Journal of
Geophysical Research 106, 19527–19546.
Janowiak, J.E., Xie, P., 1999. CAMS-OPI: a global satellite-
rain gauge merged product for real-time precipitation
monitoring applications. Journal of Climate 12, 3335–3342.
Levitus, S., Boyer, T.B., 1998. World Ocean Atlas. National
Ocenic and Atmos. Admin., Silver Spring, Md.
MacDonald, A.M., 1998. The global ocean circulation: a
hydrographic estimate and regional analysis. Progress in
Oceanograpy 41, 281–382.
J. Sprintall et al. / Deep-Sea Research II 50 (2003) 2183–2204 2203
Meyers, G., 1996. Variation of Indonesian Throughflow and
the El Nino—Southern Oscillation. Journal of Geophysical
Research 101, 12255–12263.
Molcard, R., Fieux, M., Syamsudin, F., 2001. The
Throughflow within Ombai Strait. Deep-Sea Research I
48, 1237–1253.
Murtugudde, R., McCreary, J.P., Busalacchi, A.J., 2000.
Oceanic processes associated with anomalous events in the
Indian Ocean with relevance to 1997–98. Journal of
Geophysical Research 105, 3295–3306.
Murray, S.P., Arief, D., 1988. Throughflow into the Indian
Ocean through Lombok Strait, January 1985–January 1986.
Nature 333, 444–447.
Nichols, N., 1984. The Southern Oscillation and Indonesian
Sea surface temperature. Monthly Weather Review 112,
424–432.
Potemra, J.T., Lukas, R., Mitchum, G.T., 1997. Large scale
estimation of transport from the Pacific to the Indian
Ocean. Journal of Geophysical Research 102 (C13),
27795–27812.
Potemra, J.T., Hautala, S.L., Sprintall, J., Pandoe, W., 2002a.
Interaction between the Indonesian Seas and the Indian
Ocean in observations and numerical models. Journal of
Physical Oceanography 32, 1838–1854.
Potemra, J.T., Hautala, S.L., Sprintall, J., 2003. Vertical modes
of the Indonesian Throughflow in a large-scale model.
Deep-Sea Research II, this issue.
Quadfasel, D., Cresswell, G., 1992. A note on the seasonal
variability of the South Java Current. Journal of Geophy-
sical Research 97, 3685–3688.
Ropeleweski, C., Halpert, M.S., 1987. Global and regional scale
precipitation patterns associated with the El Nino/Southern
Oscillation. Monthly Weather Review 115, 1606–1626.
Saji, N.H., Goswami, B.N., Vinayachandran, P.N., Yamagata,
T., 1999. A dipole mode in the tropical Indian Ocean.
Nature 401, 360–363.
Schneider, N., 1998. The Indonesian Throughflow and the
global climate system. Journal of Climate 11, 676–689.
Sprintall, J., Chong, J., Syamsudin, F., Morawitz, W., Hautala,
S., Bray, N., Wijffels, S., 1999. Dynamics of the South Java
Current in the Indo-Australian basin. Geophysical Research
Letters 26, 2493–2496.
Sprintall, J., Gordon, A.L., Murtugudde, R., Susanto, R.D.,
2000. A semiannual Indian Ocean forced Kelvin wave
observed in the Indonesian seas in May 1997. Journal
Geophysical Research 105, 17217–17230.
Susanto, R.D., Gordon, A.L., Zheng, Q., 2001. Upwelling
along the coasts of Java and Sumatra, and its relation to
ENSO. Geophysical Research Letters 28, 1599–1602.
Webster, P.J., et al., 1998. Monsoons: processes, predictibility
and the prospects of prediction. Journal Geophysical
Research 103, 14451–14510.
Webster, P.J., Moore, A.M., Loschnigg, J.P., Leben, R.R.,
1999. Coupled ocean–atmosphere dynamics in the Indian
Ocean during 1997–1998. Nature 401, 356–360.
Wijffels, S.E., 2001. Ocean transport of freshwater. In: Siedler,
G., Church, J., Gould, J. (Eds.), Ocean Circulation and
Climate. Academic Press, New York.
Wijffels, S.E., Schmitt, R.W., Bryden, H.L., Stigebrandt, A.,
1992. Transport of freshwater by the oceans. Journal of
Physical Oceanography 22, 155–162.
Wijffels, S.E., Sprintall, J., Fieux, M., Bray, N.A., 2002. The
JADE and WOCE I10/IR6 Throughflow Sections in the
Southeast Indian Ocean. Part 1: water mass distribution and
variability. Deep-Sea Research II 49, 1341–1362.
Wyrtki, K., 1961. Physical Oceanography of Southeast Asian
waters. NAGA Report Vol. 2, Scripps Institution of
Oceanography, La Jolla, CA, 195pp.
Wyrtki, K., 1973. An equatorial jet in the Indian Ocean. Science
181, 262–264.
Wyrtki, K., 1987. Indonesian Throughflow and the associated
pressure gradient. Journal of Geophysical Research 92,
12941–12946.
Yu, L., Rienecker, M.M., 1999. Mechanisms for the Indian
Ocean warming during the 1997–1998 El Nino. Geophysical
Research Letters 26, 735–738.
J. Sprintall et al. / Deep-Sea Research II 50 (2003) 2183–22042204