Embed Size (px)
Citation preview

Temi di Discussione(Working Papers)
Legal status of immigrants and criminal behavior: evidence from a natural experiment
by Giovanni Mastrobuoni and Paolo Pinotti
Num
ber 813Ju
ne
2011


Temi di discussione(Working papers)
Legal status of immigrants and criminal behavior: evidence from a natural experiment
by Giovanni Mastrobuoni and Paolo Pinotti
Number 813 - June 2011

The purpose of the Temi di discussione series is to promote the circulation of workingpapers prepared within the Bank of Italy or presented in Bank seminars by outside economists with the aim of stimulating comments and suggestions.
The views expressed in the articles are those of the authors and do not involve the responsibility of the Bank.
Editorial Board: Marcello Pericoli, Silvia Magri, Luisa Carpinelli, Emanuela Ciapanna, Daniela Marconi, Andrea Neri, Marzia Romanelli, Concetta Rondinelli, Tiziano Ropele, Andrea Silvestrini.Editorial Assistants: Roberto Marano, Nicoletta Olivanti.

LEGAL STATUS OF IMMIGRANTS AND CRIMINAL BEHAVIOR: EVIDENCE FROM A NATURAL EXPERIMENT
by Giovanni Mastrobuoni* and Paolo Pinotti**
Abstract
We estimate the causal effect of immigrants' legal status on criminal behavior exploiting exogenous variation in migration restrictions across nationalities driven by the last round of the European Union enlargement. Unique individual-level data on a collective clemency bill enacted in Italy five months before the enlargement allow us to compare the post-release criminal record of inmates from new EU member countries with a control group of pardoned inmates from candidate EU member countries. Difference-in-differences in the probability of re-arrest between the two groups before and after the enlargement show that obtaining legal status lowers the recidivism of economically motivated offenders, but only in areas that provide relatively better labor market opportunities to legal immigrants. We provide a search-theoretic model of criminal behavior that is consistent with these results.
JEL Classification: F22, K42, C41. Keywords: immigration, crime, legal status.
Contents
1. Introduction.......................................................................................................................... 5 2. Legal and illegal immigrants: preliminary evidence from Italy .......................................... 7 3. Theoretical framework....................................................................................................... 11 4. The natural experiment ...................................................................................................... 15 5. Empirical strategy.............................................................................................................. 17 6. Results................................................................................................................................ 23 7. Conclusions........................................................................................................................ 28 References .............................................................................................................................. 28 Appendix ................................................................................................................................ 33 Tables and figures................................................................................................................... 35
______________________________________ * Collegio Carlo Alberto and ** Bank of Italy, Economics, Research and International Relations.


1 Introduction1
Concerns about the effects of immigration on crime are widespread. As a matter offact, foreigners are heavily over-represented among the prison population of all developedcountries. In recent years the share of foreigners over official residents barely reached 10%in the US (and it was significantly lower in most other countries), while their incidence overincarcerated individuals was many times larger (Figure 1). Such numbers increase supportfor migration restrictions, which prevent part of the prospective immigrant populationfrom (legally) residing in the host countries. At the same time, if enforcement is loose,migration restrictions might also create a pool of unauthorized immigrants that are ableto (illegally) cross the frontier but, once in the host country, do not enjoy legal status andtherefore cannot work in the official sector.
The implications of migration barriers for crime are then ambiguous. On the one hand,restrictive policies prevent a number of immigrants (that would be potentially at risk ofcommitting crime) from entering the country, or expel them after entry; on the other hand,those that manage to enter anyway face worse income opportunities in official markets,which raises their propensity to engage in criminal activity. Empirically identifying theoverall effect is difficult as immigrants determine, at least in part, their legal status. Thedecision about whether to reside legally or illegally into the destination country may infact respond to several individual characteristics (e.g. working ability) that are also likelyto enter the decision about whether to commit a crime. In addition to this problem, thesize of the illegal immigrant population is usually not reported in official statistics, so theircrime rate remains also unobserved.
In this paper we exploit exogenous variation in legal status, provided by the last roundof the European Union (EU) enlargement, and detailed criminal records on a sample ofpardoned immigrants in Italy to address these issues. After August 1, 2006, more than9,000 foreigners were released from Italian prisons upon approval of a Collective ClemencyBill passed by the Italian Parliament; five months later, on January 1, 2007, about 800 ofthem acquired the right to legally stay in Italy as their origin countries, namely Romaniaand Bulgaria, entered the EU. We thus exploit the asymmetric effect of the EU enlargementacross nationalities to estimate the effect of legal status on criminal behavior, as measuredby the post-release criminal record of pardoned foreign individuals.
1Contacts: [email protected], Collegio Carlo Alberto and CeRP, Via Real Colle-gio 30, Moncalieri, Italy, and [email protected], Bank of Italy, Via Nazionale 91, Rome, Italy.We would like to thank Federico Cingano, David Card, Raquel Fernandez, Andrea Ichino, Justin McCrary,Enrico Moretti, Alfonso Rosolia, Adriaan Soetevent, Giordano Zevi and seminar participants at the Bankof Italy, Bocconi University, Collegio Carlo Alberto, FEEM-CEPR Conference on Economics of Culture,Institutions and Crime, Center for Studies in Economics and Finance in Naples, University of Padua,University of Paris X, INSIDE Workshop in Barcelona, NBER Summer Institute 2010 (Labor Studies),Universitat van Amsterdam, Cornell University and Brown University for very useful comments. Finan-cial support from the Collegio Carlo Alberto, the W.E. Upjohn Institute for Employment Research, andFondazione Antonveneta is gratefully acknowledged. Giovanni Mastrobuoni thanks INSIDE at UniversitatAutnoma de Barcelona University for their hospitality. Giancarlo Blangiardo kindly provided the ISMUdata. Any opinions expressed here are those of the authors and not those of the Collegio Carlo Alberto orof the Bank of Italy. c© 2009 by Giovanni Mastrobuoni and Paolo Pinotti.
5

The empirical strategy is grounded on a search-theoretic model of crime that relateslegal status to the probability of committing a crime. In the tradition of economic modelsof crime, agents choose between legitimate and illegitimate activities by comparing theeconomic costs and benefits between the two. Granting access to the official sector, legalstatus raises the returns to legitimate activities (or the opportunity cost of illegitimateones), which in turn lowers the probability of engaging in crime. However, there is alsoanother effect that goes in the opposite direction. Immigrants without legal status mayin fact be deported back to their own country with some positive probability, which me-chanically reduces the pool of individuals in this group that are at risk of committing anoffense.
The model does also allow for self-selection into legal status. In particular, migrationpolicy imposes some fixed cost on official entrants, so that only immigrants with higher(legitimate) income opportunities in the host country will decide to comply with it; theother ones prefer to enter unofficially and face the risk of being expelled in the future.Therefore, self-selection at the frontier implies that the distribution of individual char-acteristics potentially correlated with criminal activity differs systematically between thegroups of legal and illegal immigrants; this will also be the main threat to the identificationof the causal effect of legal status.
To address this issue, we focus on the difference-in-differences in the probability of(re)arrest between pardon inmates from new EU member countries and a control group ofinmates from candidate member countries, before and after the EU enlargement. Whilethere are significant differences between the average characteristics of the two groups,weighting observations by the (inverse) propensity score of belonging to each group elim-inates such differences, as well as differences in pre-enlargement outcomes. Baseline es-timates suggest that the average probability of rearrest over a six-month period declinesfrom 5.8% to 2.3% for Romanians and Bulgarians after obtaining legal status (as a conse-quence of the EU enlargement), relative to no change in the control group. Distinguishingbetween different categories of potential offenders, the effect is significant only for pardonedinmates that were previously incarcerated for economically-motivated crimes and the re-duction is stronger in areas characterized by better income opportunities for legal (relativeto illegal) immigrants. These results are robust to alternative estimation techniques andto several robustness checks.
We contribute to the literature on social and economic effects of immigration. Untilvery recently, this research area has traditionally emphasized the labor market competitionbetween immigrants and natives (surveys include Borjas, 1994; Friedberg and Hunt, 1995;Bauer et al., 2000; Card, 2005), as well as the effects of immigration on fiscal balances(Storesletten, 2000; Lee and Miller, 2000; Chojnicki et al., 2005) and prices (Lach, 2007;Cortes, 2008). Drawing on survey evidence from 21 European countries in 2002, Cardet al. (2009) show that, besides these (“economic”) issues, natives’ support for migrationrestrictions is shaped also (and indeed mostly) by other “compositional amenities”, among
6

which crime plays a major role.2
Partly as a consequence of this increasing awareness, a few previous papers have ex-amined the empirical relationship between immigration and crime. At the aggregate level,Butcher and Piehl (1998a), Bianchi et al. (2008) and Bell et al. (2010) document somecorrelation between- and within-local areas in the US, Italy and the UK, respectively,but conclude that the causal effect is not different from zero (maybe with the exceptionof asylum-seekers in the UK).3 At the micro level, Butcher and Piehl (1998b, 2007) useCensus data to show that, keeping other individual characteristics constant, current immi-grants have lower incarceration rates than natives, while the opposite was true for formerimmigrants at the beginning of the XX century (Moehling and Piehl, 2007). Yet, no pre-vious study has investigated the role of legal status; this is precisely the contribution ofthe present paper.
We also add to a huge empirical literature on the relationship between legitimateincome opportunities and criminal career. Indeed, the fact that the propensity to engage incrime should decrease with outside options in official markets is one of the key results of theeconomic model of crime (Becker, 1968). Over the years, several paper have examined theempirical validity of this prediction, finding in general a good deal of evidence consistentwith it: a non-exhaustive list includes Witte (1980), Meyers (1983), Grogger (1998), Gouldet al. (2002) and Machin and Meghir (2004). We contribute to this strand of literature byshowing that, also in our sample of pardoned foreigners, access to better legitimate incomeopportunities (through the acquisition of legal status) lowers the individual propensity toengage in crime.
In the next section we summarize the main features of immigration in Italy, payingparticular attention to the gap between legal and illegal immigrants in terms of labormarket outcomes and crime. In Section 3 we provide a theoretical framework that capturesthese elements in a very simple way, studies the channels through which legal status mayimpact on crime and clarifies which are the main threats to identification. Then, Section 4describes in detail the natural experiment while Section 5 derives the estimating equations.Finally, in Section 6 we discuss the empirical results and Section 7 concludes.
2 Legal and illegal immigrants: preliminary evidence from
Italy
After centuries of massive emigration, Italy became a recipient of positive net inflowsonly in the late 1980s. As a consequence, the legislative framework in this respect is alsovery recent, the first migration law being enacted in 1990 and later amended in 1995and 2002. Throughout these changes, Italian migration policy remained firmly grounded
2See also Bauer et al. (2000)3Partly in contrast with these findings, Borjas et al. (2010) argue that migration has indeed an effect,
but a very indirect one: by displacing black males from the labor market, immigration increases thecriminal activity of this latter group.
7

on the institute of the residence permit, which establishes a direct link between workingcondition and legal residence: the main condition for eligibility is receiving a job offer inItaly. However, the total number of residence permits issued each year is fixed on the basisof migration quotas decided by the government.
2.1 Official migration
Over the last two decades, the number of valid residence permits rose from less than 1million at the beginning of the 1990s to more than 2 million in 2005, slightly decliningthereafter; the number of foreign (official) residents increased even more steeply, from lessthan 600 thousands to almost 4 million (in the face of an otherwise declining population),see Figure 2. Official residents include immigrants holding a valid residence permit (andpossibly their close relatives), as well as foreigners enjoying legal status in Italy for otherreasons, such as being citizen of a EU member country. The divergence between thetwo measures (permits and residents) toward the end of the period is indeed explainedby the EU enlargement, which starting in 2004 relieved an increasing number of EasternEuropean citizens from the need of a residence permit to legally reside in Italy.
Notwithstanding the spectacular growth of the official immigrant population, the num-ber of newly issued residence permits fell systematically short of total demand over theyears, often by a large extent. For instance, 170,000 permits were issued in 2007 in front ofmore than 740,000 demands; the following year, the number of new residence permits evendecreased to 150,000, to be primarily assigned to applications left pending the year before(thus increasing the gap between current demand and supply of permits). In addition tothat, the 2002 reform of migration policy requires prospective immigrants to find a jobcontract before entering the country, thus hampering further the match of foreign workerswith Italian employers. Stringent requirements on permit eligibility and tight rationingof migration quotas, coupled with weak border enforcement (also due to the geographicconfiguration and location of the Italian peninsula), resulted in an increasing number ofundocumented immigrants illegally crossing the border or overstaying tourist visas.
2.2 Unofficial migration
While the very nature of unofficial migration prevents accurate estimates of its size,amnesties of formerly undocumented immigrants provide some information in this re-spect. During these episodes, immigrants illegally present in Italy can apply for a validresidence permit under very mild conditions, with clear incentives to report their illegalstatus.4 General amnesties have been enacted every 4-5 years since 1986, growing in sizefrom 100 to 200-250 thousand individuals during the 1990s, and reaching a peak of 700
4Bianchi et al. (2008) and Fasani (2009) also use applications for amnesty to estimate the size of theillegal population in Italy, while several studies adopted the same methodology to count the number ofundocumented immigrants in the United States after the amnesty passed with the Immigration Reformand Control Act in 1986 (see, e.g., Winegarden and Khor, 1991).
8

thousand in 2002. The acceleration in official migration observed during the last few yearswas thus accompanied by an analogous one in unofficial inflows; see Figure 3.
The graph reports also the number of illegal immigrants expelled from the country.In Italy illegal immigrants apprehended by the police are not incarcerated. Rather, theyare accompanied at the frontier and deported back to their origin country. In some cases,deportation is not enforced and the individual receives just an injunction to leave thecountry.5 While the fraction of immigrants that are deported is not large, it isn’t negligible.Looking again at the years in which there was an amnesty, the ratio of expulsions overdemands for amnesty by unofficial immigrants were 17% in 1986, went up to 28% in 1998,and down again to 15% during the last amnesty program of 2002.
2.3 Criminal and labor market outcomes
Even though foreigners cannot be incarcerated for breaking migration laws, they are nev-ertheless overly represented in Italian prison population. The number of foreign inmatesmore than doubled since the early 1990s, from less than 10 thousand to more than 20thousand in 2008, in the face of just a slight increase of total prison population. As aresult, the share of foreigners in prison population has reached one third (Figure 4), anorder of magnitude greater than the share of immigrants in the whole population. Ofcourse, such imbalance is not necessarily driven by differences in criminal behavior, asit might also depend on statistical discrimination in law enforcement against foreigners(Becker, 1957). Yet, it is hard to believe that such a huge difference in incarceration ratesbetween natives and foreigners is the sole product of discrimination.
However, an important distinction between official and unofficial immigrants seems tosuggest that discrimination is not the whole story. While detailed statistics on convictedforeigners disaggregated by legal status are not publicly available, the Italian Ministry ofInternal Affairs (2007) claims that legal immigrants represented about 6% of all individ-uals reported by the police to the judiciary authority in year 2006, which is in line withtheir share over total population. The disproportionate incidence of foreigners in prisonpopulation is entirely due to undocumented immigrants, who account for 70% and 80% offoreigners reported for violent and property crimes, respectively.
Then, legal status seems to have profound implications for immigrants’ criminal ca-reers. There are several reasons why this might indeed be the case. In particular, legaland illegal immigrants may face very different (legitimate) earning profiles, which in turnaffect the opportunity cost of crime. Most likely, the administrative and penal sanctions(including the possibility of incarceration) faced by employers who hire undocumentedimmigrants, in addition to the risk of job destruction due to the expulsion of the worker,adversely impact on the demand for illegal immigrants (relative to those holding a valid
5In 2002 the last reform of migration policy (Law 189/2002) introduced the possibility of incarcerationfor those that did not comply with a previous injunction to leave and were later re-apprehended bythe police. However, such norm was never enforced because it was deemed Anti-Constitutional by theConstitutional Court.
9

residence permit). This effect could be amplified by selection into legal status. Far frombeing randomly distributed, legal status is strongly correlated with other individual char-acteristics, which are known to be important determinants of criminal activity.
While information in this respect is not available for a representative sample of (legaland illegal) immigrants in Italy, survey evidence from a region in the North-West is con-sistent with this conjecture. Starting in year 2001, the NGO ISMU has conducted yearlyinterviews on a sample of about 9,000 immigrants in the Lombardy region. The data con-tain information on labor market outcomes, along with several individual characteristics,including legal status. Sampling of illegal immigrants is attained through the “center-sampling technique” devised by the statistical team of ISMU in the early 1990s. The mainidea is to exploit the social networks among the foreign population and base samplingon a number of “aggregation centers” that are attended by both legal and unauthorizedimmigrants (care centers, meeting points, shops, telephone centers, etc.), as opposed toadministrative sources that cover only official residents; the methodology is described atlength in Blangiardo et al. (2004) and Blangiardo (2008).6
Table 1 compares the characteristics of legal and illegal immigrants in the 2006 roundof the survey (that is, immediately before the EU enlargement of 2007). It turns out thatunauthorized immigrants are on average younger, less educated, disproportionately singlemales and have fewer kids. Most importantly, they tend to be employed in occupationswith lower skill content and earn significantly lower wages; notice also that the wage gapis relatively more severe among the high-skilled.7
While restrictions imposed by migration laws on the employment of illegal immigrantscertainly explain part of the wage gap, the striking differences in other observable charac-teristics point at the importance of selection into legal status. In particular, immigrantscould voluntarily self-select when deciding whether to comply or not with migration pol-icy; for instance, individuals with better income prospects in the host country could exertgreater effort in dealing with the bureaucratic difficulties imposed by (legal) entry pro-cedures. On the other hand, selection could also be involuntarily (on the part of theimmigrant), whenever less skilled individuals have lower chances to receive a job offereventually entitling them to apply for a permit. Whatever the reasons are, the differencesreported in Table 1 suggest that legal status is not randomly distributed across immi-grants, which considerably hampers the empirical identification of its effect on criminalbehavior.
We next present a model of crime that is consistent with the stylized facts describedabove and clarifies which are the main threats to identify the causal effect of legal status
6Using the ISMU data to estimate the determinants of immigrants’ earnings in Italy, Accetturo andInfante (2010) examine the reliability of the information on legal status by comparing the results of the2002 survey with the demands for amnesty presented during the same year, concluding that the extent ofunder-sampling of unauthorized immigrants and/or misreporting of legal status is modest.
7Drawing on several rounds of the ISMU survey, Accetturo and Infante (2010) confirm these findingsin a multivariate regression analysis. Extensive empirical evidence on the wage gap suffered by illegalimmigrants is available also for the US, see for instance Bratsberg et al. (2002), Kossoudji and Cobb-Clark(2002) and Kaushal (2006).
10

on crime.
3 Theoretical framework
Consider a population of infinitely lived, risk-neutral prospective immigrants. If theydecide to actually move to the destination country they incur a travel cost T . In addition,official entry in the host country imposes an upfront cost B on legal immigrants (L); suchcost may include, for instance, the time and money spent to deal with paperwork, acquirehealth certifications, pay head taxes and so on. Alternatively, immigrants may decide tocross the border illegally. In this way, illegal immigrants (I) avoid the burden imposed bymigration policy, but face the risk of being apprehended and deported back to their homecountry at the beginning of any subsequent period.
Once in the host country, both legal and illegal immigrants may engage in crime.Criminal activities deliver an immediate payoff z, which is randomly distributed acrossagents in each period according to the cumulative density F (z); however, those committinga crime are arrested and sent to jail in the following period with probability π. Assuminga constant discount factor ρ < 1, the expected utility of seizing a crime opportunity z forimmigrants of type k = I, L is then
Ck(z) = z + ρ [πP + (1− π)EVk] (1)
where P is utility associated with incarceration, Vk is the utility when not in prison and Edenotes expectations over (future) values of z; without loss of generality, we may imposeP equal to zero.
Apart from criminal proceeds, immigrants have access to labor earnings that vary withindividual skills and the returns to skills for different groups of immigrants in the labormarket. In particular, letting h denote the (heterogeneous) level of human capital, thewage of each immigrant is wLh if (s)he holds a residence permit and wIh otherwise, with∆w = wL − wI ≥ 0.8 While the strict inequality would be consistent with the empiricalevidence discussed in the previous section, the conservative assumption that wL is no lowerthan wI is sufficient for all the results that follow.
The utility of legal immigrants is
VL = max {CL(z); ρEVL}+ wLh, (2)
which depends both on the decision about criminal activity (the first term on the r.h.s.)and on legitimate income (the second term). The utility of illegal immigrants is similarexcept for the fact that, with probability δ > 0, they are apprehended and deported back
8From now on the notation ∆ will always refer to the difference between the (potential) outcomes ofan individual when legal and illegal.
11
to their origin country,
VI = δVH + (1− δ) [max {CI(z); ρEVI}+ wIh] , (3)
where VH is utility in the home country. The latter depends, positively, on the labormarket income wHh and we posit that wH < wI ≤ wL.9 From now on we assume forsimplicity that those expelled from the country do not try anymore to migrate.
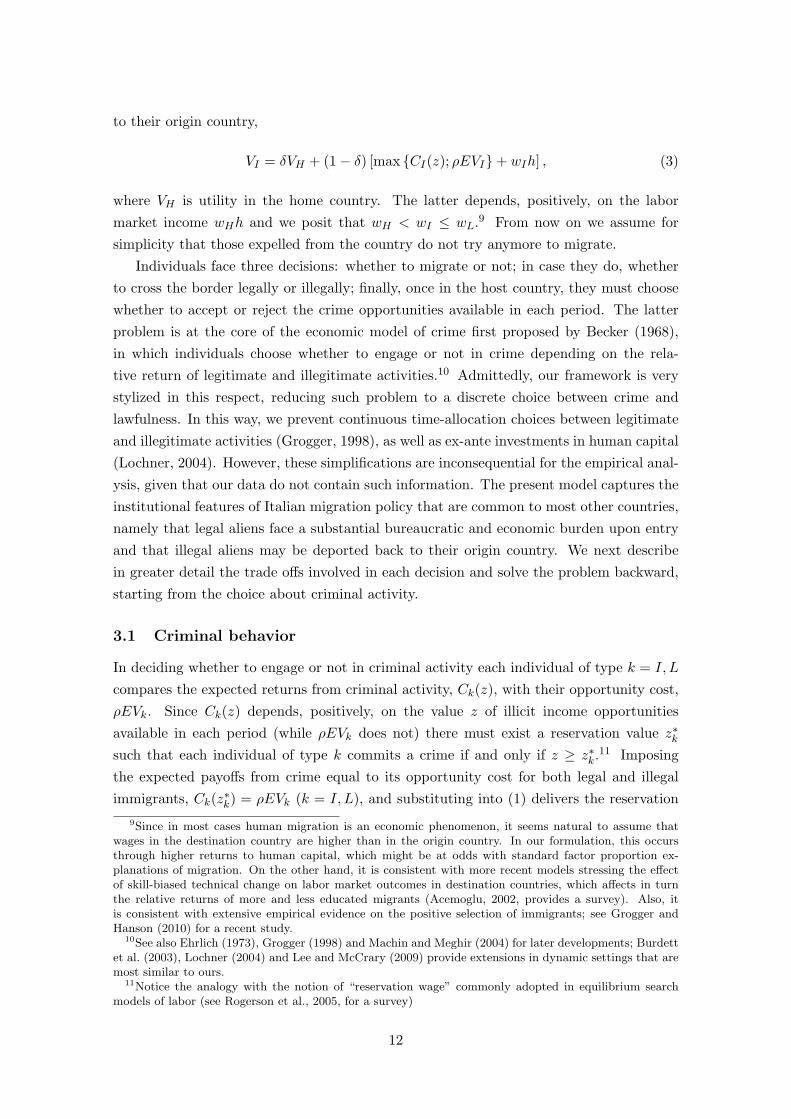
Individuals face three decisions: whether to migrate or not; in case they do, whetherto cross the border legally or illegally; finally, once in the host country, they must choosewhether to accept or reject the crime opportunities available in each period. The latterproblem is at the core of the economic model of crime first proposed by Becker (1968),in which individuals choose whether to engage or not in crime depending on the rela-tive return of legitimate and illegitimate activities.10 Admittedly, our framework is verystylized in this respect, reducing such problem to a discrete choice between crime andlawfulness. In this way, we prevent continuous time-allocation choices between legitimateand illegitimate activities (Grogger, 1998), as well as ex-ante investments in human capital(Lochner, 2004). However, these simplifications are inconsequential for the empirical anal-ysis, given that our data do not contain such information. The present model captures theinstitutional features of Italian migration policy that are common to most other countries,namely that legal aliens face a substantial bureaucratic and economic burden upon entryand that illegal aliens may be deported back to their origin country. We next describein greater detail the trade offs involved in each decision and solve the problem backward,starting from the choice about criminal activity.
3.1 Criminal behavior
In deciding whether to engage or not in criminal activity each individual of type k = I, L
compares the expected returns from criminal activity, Ck(z), with their opportunity cost,ρEVk. Since Ck(z) depends, positively, on the value z of illicit income opportunitiesavailable in each period (while ρEVk does not) there must exist a reservation value z∗ksuch that each individual of type k commits a crime if and only if z ≥ z∗k.11 Imposingthe expected payoffs from crime equal to its opportunity cost for both legal and illegalimmigrants, Ck(z∗k) = ρEVk (k = I, L), and substituting into (1) delivers the reservation
9Since in most cases human migration is an economic phenomenon, it seems natural to assume thatwages in the destination country are higher than in the origin country. In our formulation, this occursthrough higher returns to human capital, which might be at odds with standard factor proportion ex-planations of migration. On the other hand, it is consistent with more recent models stressing the effectof skill-biased technical change on labor market outcomes in destination countries, which affects in turnthe relative returns of more and less educated migrants (Acemoglu, 2002, provides a survey). Also, itis consistent with extensive empirical evidence on the positive selection of immigrants; see Grogger andHanson (2010) for a recent study.
10See also Ehrlich (1973), Grogger (1998) and Machin and Meghir (2004) for later developments; Burdettet al. (2003), Lochner (2004) and Lee and McCrary (2009) provide extensions in dynamic settings that aremost similar to ours.
11Notice the analogy with the notion of “reservation wage” commonly adopted in equilibrium searchmodels of labor (see Rogerson et al., 2005, for a survey)
12

valuesz∗k = ρπEVk. (4)
Conditional on legal status, the reservation value completely characterizes criminalbehavior. In particular, the probability of committing a crime for legal immigrants simplyequals the probability of receiving a crime opportunity worth more than z∗L,
cL = 1− F (z∗L); (5)
for illegal immigrants, we must first condition the probability of committing a crime onthe risk of deportation,
cI = (1− δ) [1− F (z∗I )] . (6)
The log-probability of committing a crime for each individual, conditional on legalstatus, may be written compactly as
ln c(h) = ln cI(h) + β(h)L,
where L = 1 if the immigrant is legal and L = 0 otherwise, and β(h) ≡ ∆ ln c(h) is thecausal effect of legal status conditional on h; using equations (5) and (6),
β(h) ≈ δ − [F (z∗L)− F (z∗I )] . (7)
The sign of (7) depends on two effects. On the one hand, holding constant the propen-sity to engage in criminal activity, deportation of illegal aliens (at rate δ) lowers the numberof crimes they commit relative to legal immigrants. This is the incapacitation effect ofmigration restrictions, which is apparent from the first term on the right hand side, mov-ing the crime rate upward after the removal of migration restrictions. On the other hand,the propensity to criminal behavior does also change with legal status, because differentlabor market opportunities for legal and illegal immigrants entail also a difference in termsof opportunity cost of crime. This second effect, which is apparent from the last term ofthe equation (namely the change in the probability of accepting a crime opportunity forformerly unofficial immigrants) increases with the wage premium to legal status, ∆w ≥ 0.However, its sign and strength, as well as the direction of the overall effect in (7), dependcrucially on the equilibrium distribution of h across legal and illegal immigrants, whichwe examine next.
3.2 Equilibrium
In the remainder of this section we provide a graphical representation of the equilibriumand the intuition behind all results; formal proofs are presented in the Appendix. Firstnotice that wH < wI implies that there exists a threshold for h above which individualsdecide to leave the origin country. In particular, Figure 5a shows that all individualscharacterized by h ≥ hI prefer to unofficially cross the border rather than staying home.
13

What about the option of entering the destination country by complying with migra-tion policy? Notice that, once in the host country, all immigrants prefer to be legal ratherthan illegal, i.e. E∆V = E(VL − VI) > 0. By a simple revealed-preference argument, infact, all those willing to (illegally) migrate prefer to live in the destination than in theorigin country; therefore, these same individuals are better off avoiding the risk of beingdeported back. Moreover, the differential E∆V increases with h; intuitively, better la-bor market opportunities in the destination country mean a greater utility loss in case ofexpulsion.12
After arrival, legal immigrants are thus better off holding a valid residence permit;however, upon arrival, they must bear the entry cost B, so they apply for legal statusif and only if E∆V ≥ B. Since E∆V (h) is upward sloped, the latter condition musthold beyond some threshold hL; see Figure 5b. The diagram clearly illustrates the selfselection of immigrants at the frontier: individuals in the upper tail of the distribution ofskills comply with migration policy, while those in the intermediate range [hI , hL] enterunofficially in the country.
Therefore, labor skills sort out immigrants from non-immigrants and, among the for-mer, legal from illegal entrants. Figure 5c shows then how the equilibrium distribution ofh determines within- and between-group differences in criminal behavior. The probabil-ity of committing a crime for legal immigrants, cL, is inversely related to the reservationvalue z∗L, which in turn is proportional to expected utility EVL; the same is true for illegalimmigrants, conditional on not being deported. Therefore, EVL(h) > EVI(h) implies that,conditional on h, unauthorized immigrants that are not deported commit more crimes thanlegal immigrants: cI = 1 − F (z∗I ) ≥ 1 − F (z∗L) = cL. However, the unofficial populationincludes also those that are deported at the beginning of each period (before committinga crime), so deportation shifts the crime rate for this group down from cI to cI .
The causal effect of legal status on crime is then the average (log) difference betweenthe curves cL and cI over the interval [hI , hL]
β ≡ E [β(h)|hI ≤ h ≤ hL] = E [ln cL(h)|hI ≤ h ≤ hL]− E [ln cI(h)|hI ≤ h ≤ hL] . (8)
The sign of (8) is a priori ambiguous, depending upon whether the average (relative)reduction in criminal activity by formerly unofficial immigrants after the concession oflegal status, E [(F (z∗L)− F (z∗I )) |hI ≤ h ≤ hL], is strong enough to counterbalance theincrease in crime brought by the end of deportations. Therefore, determining the effect oflegal status on criminal activity is ultimately an empirical issue.
3.3 Identification
Assuming to have data on criminal activity for a sample of legal and illegal immigrants,the main threat to empirically identify β is that each individual is commonly observed onlyin one state (either with or without legal status), so the first term on the right hand side of
12The Appendix presents the formal proof that E∆V ≥ 0 and ∂E∆V∂h
≥ 0 for h ≥ hI .
14

equation (8), namely the (counterfactual) log probability of committing a crime for illegalimmigrants conditional on obtaining legal status, is not observed (in the terminology ofRubin, 1974, it is the “potential outcome”). Missing this element, one could alternativelyconduct a naive comparison between legal and illegal immigrants,
β = E [ln cL(h)|hL ≤ h]− E [ln cI(h)|hI ≤ h ≤ hL] ;
however, E [ln cL(h)|hL ≤ h] ≤ E [ln cL(h)|hI ≤ h ≤ hL] (because crime decreases with h),so β would provide a downward biased estimate of β,
β = β + E [ln cL(h)|hL ≤ h]− E [ln cL(h)|hI ≤ h ≤ hL]︸ ︷︷ ︸SELECTION BIAS
< β,
see the last diagram in Figure 5.The last round of the EU enlargement provides an exogenous source of variation in
legal status that allows us to remove the selection bias. The next section describes indetail this quasi-experimental setting.
4 The natural experiment
4.1 The EU enlargement
With the fall of the Eastern Bloc and the EU enlargement toward the east, immigrantsfrom central and eastern Europe became a large and growing share of total inflows in Italy(see Figure 2). A first round of the enlargement took place in 2004 with the admissionof Czech Republic, Estonia, Cyprus, Latvia, Lithuania, Hungary, Malta, Poland, Sloveniaand Slovakia. Then, on January 1st, 2007, Bulgaria and Romania also joined the EU; andthe process of enlargement is far from over, as several countries are “candidate members” ofthe EU. In particular, Croatia, Turkey and the Former Yugoslavian Republic of Macedoniaare already negotiating admission conditions, while such negotiations should start soonfor Albania, Bosnia and Herzegovina, Kosovo, Montenegro and Serbia. New member andcandidate member countries are shown in Figure 6.
Article 39 of the European Commission Treaty would in principle allow citizens of newmember countries to i) look for a job in any other country within the EU, ii) work therewithout needing any permit, iii) live there for that purpose, iv) stay until the end of theemployment relationship, v) enjoy equal treatment with natives in access to employment,working conditions and all other social and tax advantages that may help to integrate inthe host country. In practice, however, several countries in Europe maintained significantrestrictions to the free movement of immigrants from new member countries.
The application of the EU directives was at the center of a heated public debate alsoin Italy until the very last weeks before the enlargement, mostly because of the allegedimpacts on crime. However, in the end (on December 28, 2006) the center-left government
15

led by Romano Prodi guaranteed free movement to all new EU citizens and completelyliberalized access to the labor market in the following sectors: agriculture, hotel andtourism, managerial and highly skilled work, domestic work, care services, construction,engineering and seasonal work. These sectors account for the bulk of foreign employment,both before and after the enlargement. And in the rest of the official economy (basicallythe manufacturing sector) migration quotas were also eased in order to accommodate thelarger number of workers from Romania and Bulgaria.
The removal of migration restrictions led to sharp changes in the composition of for-eign population in Italy. The left graph of Figure 7 compares the number of (official)residents coming from new member and candidate member countries before and after theEU enlargement. Until 2006, the combined size of Romanian and Bulgarian communitieswas about half of the other group, the difference between the two remaining constant overthe period. Then, in the wake of admission to the EU, the number of Romanians andBulgarians officially residing in Italy nearly doubled, while the size of the other groupcontinued to grow at approximately the same rate as in the previous years.
A similar pattern arises among the individuals arrested by the Italian police between2006 and 2007. However, the (differential) increase was much less pronounced in thiscase, so the ratio of arrested over total official residents actually declined for Romaniansand Bulgarians, while no significant change is observed for the control group; see theright graph in Figure 7. At a first sight, one might be tempted to conclude that theremoval of migration restrictions favored a decline in criminal activity. Yet, the increasein Romanians and Bulgarians between 2006 and 2007 includes both inflows from abroadand acquisitions of legal status by (formerly unofficial) immigrants already in Italy, the twocomponents being undistinguishable from each other. Figure 7 would be indeed consistentwith a decline in the crime rate if the sharp increase in the left graph was driven largely byinflows of new immigrants after the EU enlargement. On the other hand, if it was causedby changes in legal status of foreigners already residing in Italy before 2007, the declinein the incidence of arrests would be due to the fact that formerly unofficial immigrantsimpact, positively, on total official population only after 2007, but affect the number ofcrimes both before and after that period.
One way to circumvent this problem is to focus on a sample of immigrants that werealready present in Italy before the enlargement.
4.2 The July 2006 Collective Pardon
Italian collective pardons eliminate part of the sentence, typically 2 or 3 years, to all prisoninmates; then, all those whose residual sentence is below such length are immediatelyreleased. In this way, pardons generate sudden releases of large numbers of inmates. Theonly ones excluded are Mafia members, terrorists, kidnappers, and sexual offenders, buteven violent criminals like murderers and robbers can be pardoned. Whenever a pardonedprisoner recommits a crime within five years, the commuted prison term gets added to the
16

new term.Collective clemency bills are deeply rooted in Italian history; over the last 40 years
there has been on average a pardon every 5 years (Barbarino and Mastrobuoni, 2010).The last one was voted by the Italian Parliament in July 2006 and enacted shortly after(on August 1). About 22,000 individuals, corresponding to more than one third of totalprison population, were freed within a few days. More than 8,000 of them were foreigners,reaching the figure of 9,642 by the end of 2006.
We were granted access to the criminal records, from August 2006 through December2007, of all prison inmates released with the Collective Clemency Bill.13 The most im-portant information for our purposes is the nationality and the date of rearrest (if any).Figure 8 shows that, among foreigners, a large number of pardoned inmates were rear-rested over the following year and a half. In particular, 795 individuals were back to jail bythe end of 2006, before the EU enlargement, growing to 1654 one year later, after the EUenlargement. The main idea behind our empirical strategy will be then to exploit differ-ences in the probability of rearrest, before and after the EU enlargement, across differentnationalities in our sample.14
5 Empirical strategy
In this section we devise a difference-in-differences estimator that exploits the uniquecharacteristics of our sample to estimate the effect of legal status on the probability ofcommitting a crime. If legal status does indeed affect the criminal behavior of immigrants,we should observe a change in such probability for Romanians and Bulgarians after theEU enlargement. In terms of our theoretical model, the average log probability for thisgroup in year 2006 (before the policy change) is
E [ln c(h)] = E [ln cI(h)|hI ≤ h < hL]G(hL) + E [ln cL(h)|hL ≤ h] [1−G(hL)] , (9)
where G(.) is the cumulative density of h among the immigrant population in the hostcountry.15 Then, in year 2007 (after the enlargement) everybody in this group obtainslegal status, so
E[ln c′(h)
]= E
[ln c′L(h)
]. (10)
13These data are similar to those used by Drago et al. (2009) to study the deterrence effect of residualsentence.
14While looking at former prisoners may at a first sight limit the external validity of our results, itallows indeed to focus on the group of individuals that is at the margin between a criminal career andlegitimate activity; at the opposite, the great majority of the population at large never engages in any typeof (serious) crime. For this and other reasons, previous offenders have been widely studied in the empiricalliterature on crime, see for instance Witte (1980) and Lee and McCrary (2009).
15Letting Γ(h) denote the cumulative distribution of h over the entire population in the origin country
(including migrants and non-migrants), G(h) = 0 for h ≤ hI and G(h) = Γ(h)−Γ(hI )1−Γ(hI )
for h > hI .
17

Subtracting (9) from (10) delivers the change after the extension of legal status to all(formerly illegal) immigrants from new EU member countries,
E[ln c′(h)− ln c(h)
]= βG(hL) + Ψ, (11)
where Ψ is the (unobserved) counterfactual change between the two periods absent thepolicy shock,
Ψ = E [ln c′I(h)− ln cI(h)|hI ≤ h < hL]G(hL)
+E [ln c′L(h)− ln cL(h)|hL ≤ h] [1−G(hL)] . (12)
Equation (11) clarifies which are the main estimating issues, which we examine next.
5.1 The control group
To isolate any causal effect β from common trends and time-specific shocks in Ψ, we relyon a control group that is as close as possible to Romanians and Bulgarians except forthe change in legal status between 2006 and 2007. Pardoned inmates from candidate EUmember countries naturally provide such a control group.
As we described in the previous section, in fact, candidate members are countriesthat have either started access negotiations or that are going to do so in the near future.Therefore, this group of countries should be most comparable to new EU members alongthe economic and political criteria required for admission to the EU. As a matter offact, they all belong to the same geographical area and most of them (possibly with theexception of Turkey) share a great deal of linguistic, cultural and historical heritage.
Our sample includes about 800 Romanians and Bulgarians, as well as 1,800 immigrantsfrom candidate member countries; restricting to the subsample of males (in order to reduceheterogeneity), we are left with 725 and 1,622 individuals, respectively. Using the changein crime for the the control group between 2006 and 2007 to estimate the right hand sideof equation (12) and substituting into (11) we obtain
βG(hL) = E[ln c′(h)− ln c(h)
]− E
[ln c′0(h)− ln c0(h)
], (13)
where the subscript 0 denotes the control group.Equation (13) will constitute the basis for our empirical analysis. Moving to its sample
analogue requires to address some important measurement issues.
5.2 Measurement
The first issue concerns the measurement of criminal activity, which remains partly un-observed. This happens either because of under-reporting of criminal offenses or because,even for the recorded ones, the identity of the offender cannot always be determined. Oneobserves incarceration, though, which is often used as a proxy for unobserved criminal
18

activity (see, e.g. Ehrlich, 1996; Levitt, 1996). Consistently with this approach, our modelmaintains that the probability of being arrested after a crime is constant and equal toπ, which implies that πcL(h)
πcI(h) = cL(h)cI(h) . It follows that the relative log probability of incar-
ceration for legal and illegal immigrants is exactly equal to the relative log probability ofcommitting a crime, which remains unobserved; since the former is instead observable, wewill use it as our main dependent variable. The confounding effect of departures from thisassumption will be discussed as we present the empirical results.
The second measurement issue concerns the term G(hL), namely the fraction of illegalimmigrants in (prison) population. Since illegal status is not by itself a valid reasonfor incarceration, administrative criminal records do not report the legal status of theindividuals in our sample. Nevertheless, a valid estimator for the right hand side ofequation (13) would still be informative about the sign of β and would bound its magnitudefrom below. Moreover, as we already point out in Section 2, the fraction of illegals is veryhigh (between 70% and 80%) among the foreign prison population, so the attenuation biasinduced by G(h) < 1 is going to be small.
5.3 Propensity score weighting
Longitudinal data on (re)arrests of former inmates from new EU member countries andcandidate member countries over the period 2006 and 2007 allow us to estimate equation(13) using the difference-in-difference between the log probability of arrest for the twogroups before and after the EU enlargement. The identifying assumption is that in theabsence of the policy shock the hazard rates for the two groups would have followedparallel paths. Such condition may be implausible in presence of significant differencesin individual characteristics that are possibly correlated with criminal activity (Abadie,2005).
The left columns of Table 2 compare the two groups in terms of the observable charac-teristics that are reported in our data, namely age, gender, marital status and education,the latter being available only for a very restricted subsample; the type of crime for whichthe individual was first incarcerated before the Pardon (possibly more than one, so thegroup means of economic and violent crimes do not add up to one); finally, the length ofsentence and the amount commuted with the pardon.16 While marital status is not signif-icantly different, Romanians and Bulgarians appear to be on average younger (31 vs. 33years of age) and more educated than individuals in the control group; they are also more(less) likely to commit violent (economic) crimes but, despite this, they are charged tolighter sentences. One reason may be that migration waves from such countries are morerecent, while immigrants from some countries in the control group (primarily Albanians)came earlier in time and are more likely to have recidivated.
If we are willing to assume that deviations from the “parallel paths” depend solely ondifferences in observable characteristics, conditioning on such differences does remove all
16The data report also the prison from which the individual was released (167 institutes in total), whichwill be used later in the analysis.
19

biases. This assumption, which is alternatively referred to as unconfoundedness, condi-tional independence, selection on observables or ignorability of treatment, constitutes animportant special case in the econometrics of program evaluation (Imbens and Wooldridge,2009). While unconfoundedness may be a strict requirement, notice that we are imposingit on changes over time of the crime rate (as opposed to levels); that is, we allow for(time-invariant) differences between groups to persist even after conditioning on observ-able characteristics. Moreover, the availability of longitudinal data over repeated periodsbefore the policy change provides us with the opportunity to investigate the plausibilityof unconfoundedness.
One simple way of adjusting for differences between the two groups is to weight ob-servations based on the propensity score of assignment, i.e. the conditional probability ofbelonging to each group conditional on observed covariates.17 Specifically, we weight eachunit by
new EUip
P (Xi)+ (1− new EUi)
1− p1− P (Xi)
, (14)
where new EUi is a dummy equal to 1 if the i-th individual is citizen of new EU membercountries and 0 otherwise, p is the unconditional probability of belonging to the new EU
group and P (Xi) is the same probability conditional on the vector of individual charac-teristics Xi.
The weighting scheme (14) enhances the comparability between the two groups byattaching greater (lower) weight to units that are less (more) different from the othergroup relative to the average individual in the sample.18 As it is generally the case innon-experimental settings, the propensity score is unknown, so we estimate it exploitingall information available in our data set. In practice, we compute the predicted propensityscore based on a logit regression of an indicator variable for being Romanian or Bulgarianon the following vector of covariates: a quadratic polynomial in age, marriage status, edu-cation (indicator variables for illiteracy, primary and secondary school, as well as missinginformation on education), type of crime committed when first incarcerated (7 categories),a quadratic polynomial in sentence and commuted sentence and, finally, a full set of fixedeffects for the region where the prison from which the individual was released is located.19
Figure 9 shows the distribution of the estimated propensity score by group. As it shouldbe expected, there is a large tail of individuals in the control group whose estimatedpropensity score is close to zero, meaning they are very different (in terms of observablecharacteristics) from Romanians and Bulgarians. Then, the weighting scheme will dis-count these observations, while it will attach greater importance to observations of bothgroups that lie in the middle range of the distribution. The right columns of Table 2 show
17Rosenbaum and Rubin (1983) show that, under unconfoundedness, conditioning on the propensityscore and on the full set of covariates are equivalent methods of guaranteeing independence of potentialoutcomes across groups. One advantage of using the propensity score is that it reduces the dimensionalityof the conditioning problem (from a multi-dimensional vector to a scalar).
18The idea of using the propensity score to weight observation was pioneered by Hirano et al. (2003);Abadie (2005) extends the same approach to difference-in-differences estimators.
19We dropped a few observations for which some covariates other than schooling were missing.
20

that weighting observations according to (14) actually eliminates differences in averagegroup characteristics. We next examine to which extent this adds to the credibility of un-confoundedness by investigating pre-enlargement differences in outcomes, which dependon both observable and unobservable characteristics.
5.4 Preliminary evidence
Figure 10 plots non-parametric estimates of daily log hazard rates of re-arrest of inmatesfrom new EU member (solid line) and candidate member countries (dashed line).20 Sincewe are particularly interested into the effect of legal status through legitimate earningopportunities, we focus on individuals that were first arrested (before the pardon) foreconomically-motivated crimes (mainly property and drug-related offenses).
The left graph shows the results obtained before applying the weighting scheme. WhileRomanians and Bulgarians display greater recidivism during the first months after thepardon, the opposite is true after they obtain legal status. Turning to the plausibilityof identifying assumptions, the evidence from the pre-enlargement period seems broadlyconsistent with the hypothesis of parallel outcomes (absent the policy change). As weweight observations by the propensity score (right graph), not only the dynamics but alsothe levels of the hazard rates are very similar between the two groups, which providesstrong empirical support for unconfoundedness of changes over time across groups. Turn-ing to the effect of legal status, a few weeks before the EU enlargement, the probability ofincarceration starts to decrease for Romanians and Bulgarians, continuing to do so duringthe first months of 2007.
To quantify such effect, in Table 3 we cross-tabulate the hazard rate of re-arrest foreach group over the last two trimesters of 2006 and the first two of 2007, as well as thedifference between the two groups in each period and the difference-in-differences acrossdifferent periods. The left panel of the Table shows the results for economically-motivatedoffenders. The second row confirms that, after weighting by the propensity score, the twogroups exhibit an identical probability of incarceration before the policy change. Then, in2007 the hazard rate does not change significantly for the control group while it decreases,from 5.8% to 2.3%, for Romanians and Bulgarians; as a result, the difference-in-differencesis also negative and very similar in absolute value (3.2%). Instead, the effect is positiveand smaller in magnitude for violent offenders.21
The table does also report both robust and bootstrapped standard errors. Whilebootstrapping will generally lead to valid standard errors and confidence intervals for
20The hazard rate is the probability of being rearrested at each period-at-risk τ conditional on not havingbeen rearrested in the τ − 1 periods before. For the sake of graphical illustration, we restrict to inmatesrelease during the first week after the Pardon (about 72% of total sample), so the duration-at-risk on thehorizontal axis is the same for all individuals. The results presented in the next tables will be based insteadon the total sample.
21Notice that, when we focus on violent offenders, we restrict to individuals that were previously in prisonfor having committed only violent crimes. Instead, individuals that were reported for both economic andviolent crimes are included among economically-motivated offenders, in that the latter type of crime wasprobably instrumental to the first one (e.g. an assault during a robbery).
21
propensity score weighting estimators (Abadie and Imbens, 2008), Busso et al. (2009)suggest that robust regression standard errors provide a good approximation as the numberof observations grows large. This is confirmed in our case, as the two estimates of thestandard errors are always extremely similar. For the sake of computational efficiency,inference on the multivariate regression models presented next will be based on robust(clustered) standard errors.
Turning to inference, the effect of the EU enlargement on the recidivism of economically-motivated offenders from new EU member countries is statistically significant at con-ventional confidence levels, while the differences for violent crimes are not significantlydifferent from zero.
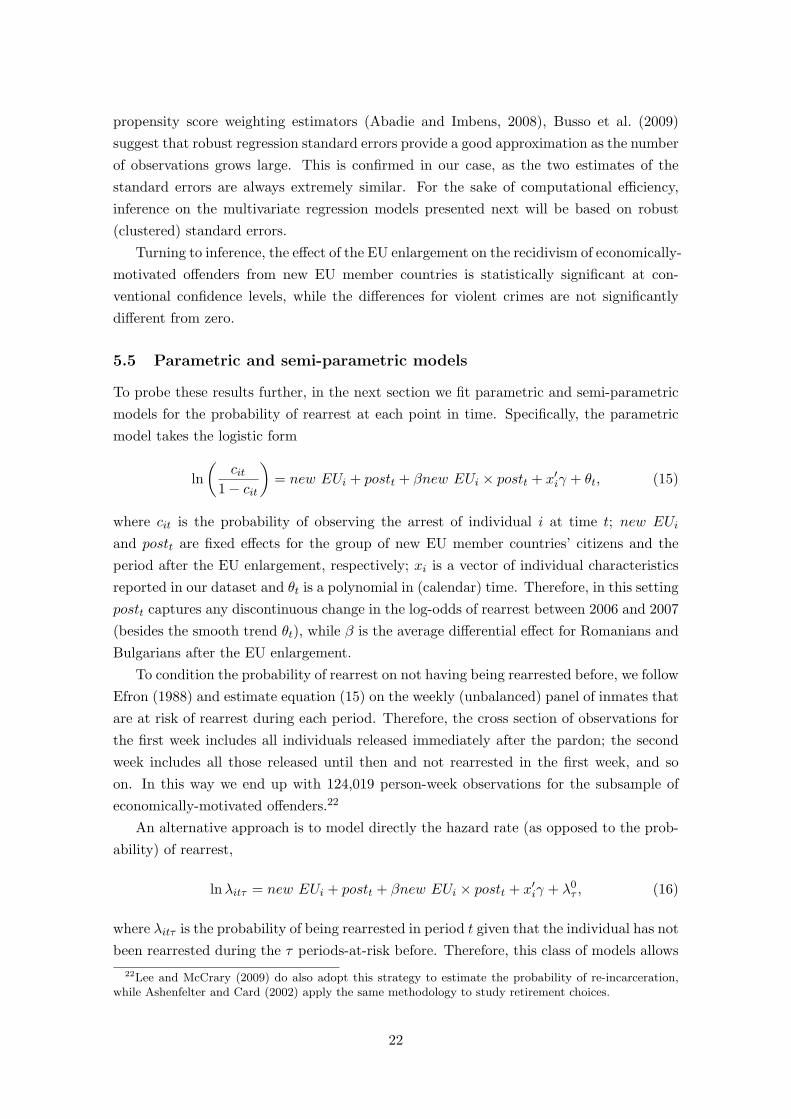
5.5 Parametric and semi-parametric models
To probe these results further, in the next section we fit parametric and semi-parametricmodels for the probability of rearrest at each point in time. Specifically, the parametricmodel takes the logistic form
ln(
cit1− cit
)= new EUi + postt + βnew EUi × postt + x′iγ + θt, (15)
where cit is the probability of observing the arrest of individual i at time t; new EUi
and postt are fixed effects for the group of new EU member countries’ citizens and theperiod after the EU enlargement, respectively; xi is a vector of individual characteristicsreported in our dataset and θt is a polynomial in (calendar) time. Therefore, in this settingpostt captures any discontinuous change in the log-odds of rearrest between 2006 and 2007(besides the smooth trend θt), while β is the average differential effect for Romanians andBulgarians after the EU enlargement.
To condition the probability of rearrest on not having being rearrested before, we followEfron (1988) and estimate equation (15) on the weekly (unbalanced) panel of inmates thatare at risk of rearrest during each period. Therefore, the cross section of observations forthe first week includes all individuals released immediately after the pardon; the secondweek includes all those released until then and not rearrested in the first week, and soon. In this way we end up with 124,019 person-week observations for the subsample ofeconomically-motivated offenders.22
An alternative approach is to model directly the hazard rate (as opposed to the prob-ability) of rearrest,
lnλitτ = new EUi + postt + βnew EUi × postt + x′iγ + λ0τ , (16)
where λitτ is the probability of being rearrested in period t given that the individual has notbeen rearrested during the τ periods-at-risk before. Therefore, this class of models allows
22Lee and McCrary (2009) do also adopt this strategy to estimate the probability of re-incarceration,while Ashenfelter and Card (2002) apply the same methodology to study retirement choices.
22
to disentangle the effect of calendar time shocks (i.e. the EU enlargement) from that oftime-at-risk (which varies across individuals depending on the exact moment at which theywere released). Equation (16) is the general form of proportional hazard models, whichdiffer from each other with respect to the specification of the baseline hazard functionλ0τ . The most flexible approach is to leave it unrestricted and estimate the coefficients
of interest by partial maximum likelihood (Cox, 1972). Therefore, the semi-parametricmodel trades off efficiency for flexibility relative to the fully parametric approach.
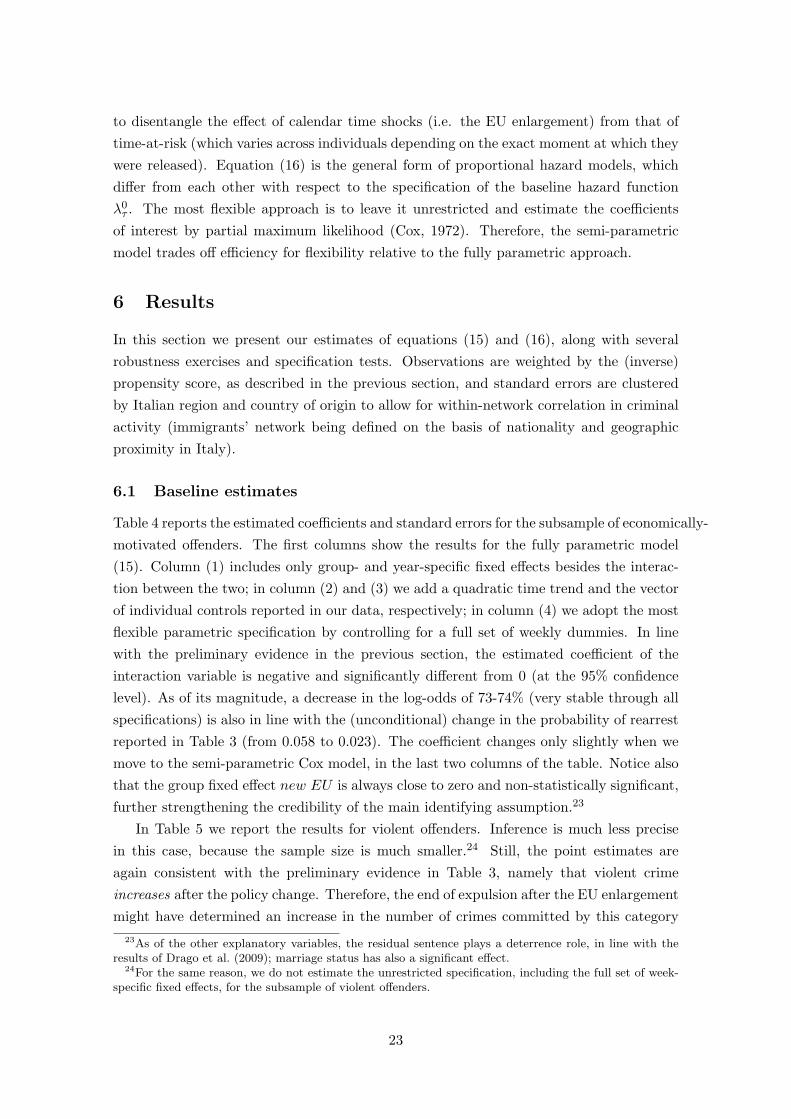
6 Results
In this section we present our estimates of equations (15) and (16), along with severalrobustness exercises and specification tests. Observations are weighted by the (inverse)propensity score, as described in the previous section, and standard errors are clusteredby Italian region and country of origin to allow for within-network correlation in criminalactivity (immigrants’ network being defined on the basis of nationality and geographicproximity in Italy).
6.1 Baseline estimates
Table 4 reports the estimated coefficients and standard errors for the subsample of economically-motivated offenders. The first columns show the results for the fully parametric model(15). Column (1) includes only group- and year-specific fixed effects besides the interac-tion between the two; in column (2) and (3) we add a quadratic time trend and the vectorof individual controls reported in our data, respectively; in column (4) we adopt the mostflexible parametric specification by controlling for a full set of weekly dummies. In linewith the preliminary evidence in the previous section, the estimated coefficient of theinteraction variable is negative and significantly different from 0 (at the 95% confidencelevel). As of its magnitude, a decrease in the log-odds of 73-74% (very stable through allspecifications) is also in line with the (unconditional) change in the probability of rearrestreported in Table 3 (from 0.058 to 0.023). The coefficient changes only slightly when wemove to the semi-parametric Cox model, in the last two columns of the table. Notice alsothat the group fixed effect new EU is always close to zero and non-statistically significant,further strengthening the credibility of the main identifying assumption.23
In Table 5 we report the results for violent offenders. Inference is much less precisein this case, because the sample size is much smaller.24 Still, the point estimates areagain consistent with the preliminary evidence in Table 3, namely that violent crimeincreases after the policy change. Therefore, the end of expulsion after the EU enlargementmight have determined an increase in the number of crimes committed by this category
23As of the other explanatory variables, the residual sentence plays a deterrence role, in line with theresults of Drago et al. (2009); marriage status has also a significant effect.
24For the same reason, we do not estimate the unrestricted specification, including the full set of week-specific fixed effects, for the subsample of violent offenders.
23

of offenders, which might be less (or not at all) responsive to economic motives whenengaging in criminal activity. Instead, access to legitimate income opportunities seemsstrong enough to move the crime rate in the opposite direction for the subsample ofeconomically-motivated offenders. We next explore this mechanism in detail.
6.2 The role of labor market opportunities
In our theoretical framework, the overall effect of legal status depends on two oppositeforces: on the one hand, the end of deportations of formerly unofficial immigrants (andsome potential criminals among them) increases the number of crimes they commit inthe host country; on the other hand, access to legitimate income opportunities raises theopportunity cost of crime. We next confront these predictions with the data, exploitingvariation in the relative importance of these factors across different regions in Italy.
Specifically, the Italian Statistical Office (ISTAT) assigns 8 regions each to North andSouth, and 4 to the Center; if we aggregate Center regions to the South, we obtain an areathat is comparable to the North in terms of number of observations in our sample, butprofoundly different in terms of economic and social development. As shown in Table 6,the North is in fact characterized by higher income and better labor market opportunitiesin the official sector. Actually, 6 out of 10 regions in Center-South fall into the “Objective1” areas according to the EU classification (meaning among other things that their GDPper capita falls below the 75 percent of the EU average). At the same time, a large shareof the labor force in the Center-South resorts to employment in the unofficial sector; therelative size of the shadow economy is twice as much as in the North (last column of thetable).25
The relative importance of the official and unofficial sector determines in turn theincome opportunities of legal and illegal immigrants, respectively. Therefore, we shouldexpect the increase in the opportunity cost of crime after obtaining legal status to begreater in the North.
On the other hand, North and Center-South exhibit similar levels of enforcement ofmigration restrictions. In particular, if we estimate the number of illegal immigrants basedon the applications presented during the last amnesty program (as previously explainedin Section 2.2), we obtain similar ratios of unofficial over official immigrants in the twoareas; see the bottom panel of the table. Therefore, the change in the probability ofdeportation for Romanians and Bulgarians after the EU enlargement should have been ofsimilar magnitude between North and Center-South.
In the end, if we compare the policy effect in the North relative to that in the Center-South we are keeping approximately constant the change in incapacitation while increasingthe strength of the economic channel; see also Figure 11. If the effect of legal status goesthrough the mechanism proposed in our theoretical framework, the magnitude of the
25Indeed, the differential between North and Southern Italy has been widely studied over the years, seefor instance Eckaus (1961) and Helliwell and Putnam (1995).
24

(negative) change in the criminal activity of Romanians and Bulgarians should then begreater in the North.
This is exactly the evidence emerging from Tables 7 and 8. The unconditional changein the fraction of Romanians and Bulgarians rearrested in the North between 2006 and2007, as well as the difference-in-differences relative to the control group, are almost twiceas much as the average effect in the whole country; at the opposite, no significant (differ-ential) effect is detected in the Center-South. These results are qualitatively unaffectedby conditioning on common time trends and individual characteristics in the parametricand semi-parametric models.
6.3 Structural break point
The estimates presented so far detect a statistically significant decrease in the criminalactivity of immigrants from new EU member countries relative to the control group afterthe EU enlargement. Moreover, variation across areas characterized by different rela-tive income opportunities for legal and illegal immigrants is consistent with the channelproposed in our theoretical framework.
One question is whether such estimates are really capturing the effect of this policychange as opposed to other events affecting the relative hazard rate of the two groupsbefore and/or after that moment. In order to exclude this possibility, we run a placeboexperiment at any possible date in our sample period to identify the most likely breakpoint in the behavior of the two groups, much in the spirit of the tests of Andrews (1993)for identifying structural changes with unknown break points. If the most likely period isclose to (distant from) the date of the EU enlargement, this would be evidence against (infavor of) spurious effects driving the results.
In practice, for each placebo date t∗ we estimate the following linear probability modelson the sample of individuals at risk of incarceration in each period t ≤ t∗ and t > t∗,
H0 : d∗it = new EUi + post∗t (17)
H1 : d∗it = new EUi + post∗t + βnew EUi × post∗t ,
where post∗t = 1 after t∗ and post∗t = 0 otherwise, and d∗it = 1 if individual i was re-arrestedin period t and d∗it = 0 otherwise; notice that estimating β by OLS is an alternative way ofcalculating the difference-in-differences reported in Table 3. Then, for any possible breakpoint t∗ we compute the R-squared ratio between models H1 and H0, as a measure of theimportance (in terms of explanatory power) of any differential change in criminal behaviorbetween the two groups at date t∗.
The placebo estimated coefficients and R-squared ratio for Italy, as well as for the Northand Center-South areas, are presented in the the left plots in Figure 12. The most likelybreak point for Italy as a whole is December 12, which is indeed quite close to the date ofthe enlargement and consistent with immigrants rationally anticipating the policy changeand modifying their behavior as uncertainty about the policy change gradually unravels
25

(see Section 4.1).26 When the same test is run separately for North and Center-South,the estimated break-points are very similar (December 1 and December 7), but while forthe North the additional explanatory power is considerable, for the Center-South the R-squared increases by just a little; moreover, in the latter case the difference-in-differenceseffect is positive. This might be explained by the absence of significant improvements ofthe income opportunities of formerly unofficial immigrants after obtaining legal status, sothat in Center-Southern regions the incapacitation effect prevails also for economically-motivated offenders. Another thing to notice is that the magnitude of the effect (grayline) is always higher as we let the data “choose” the break point, rather than fixing it onJanuary 1, 2007.
The right plots in the figure provide additional visual evidence in this respect, showingthe discontinuity in criminal behavior at the estimated break point. The plots are predicted(daily) hazard rates of rearrest as a function of a third order polynomial in time forRomanians and Bulgarians (solid line) and for control group (dashed line), before andafter the break point. In line with the results in Tables 7 and 8, the discontinuity forthe first group is particularly relevant in Northern regions, reaching 8%, as opposed to nodiscontinuity at all for the control group.
One interpretation of the general increase in the magnitudes is that estimating thebreak point addresses the measurement error induced by the fact that individuals will notin general stick to the official date of the policy change when adjusting their behavior. Onthe other hand, when we choose the break point by maximizing the explanatory power ofthe difference-in-differences, specification search bias implies that the coefficient estimatedusing the same data will have a nonstandard distribution (Leamer, 1978); in particular,conventional test statistics reject too often the null hypothesis that the coefficient is equalto zero. For this reason, we stick to the (more conservative) estimates reported in theregression tables.27
6.4 Threats to identification
In the final part of this section we discuss some additional identification issues. One firstconcern is that legal status affects the probability of being arrested and/or incarceratedconditional on having committed an offense. For instance, immigrants found withoutdocuments may be carefully scrutinized and additional evidence may become available atcloser inspection. Also, conditional on the severity of charges, official immigrants couldhave easier access to sanctions alternative to institutionalization (like for instance home
26A likelihood ratio test statistic based on Cox’s proportional hazard model gives very similar results.See Ichino and Riphahn (2005) for a similar exercise.
27In a study on the dynamics of segregation, Card et al. (2008) address this source of bias by randomlysplitting the sample and using different subsamples to estimate the break point and the size of the change.However, their data set includes about 40,000 census tract observations from 114 Metropolitan Areas,so even after splitting the sample into 2/3 and 1/3 subsamples for estimating the break point and thecoefficient, respectively, they end up with a reasonably large number of observations in both steps. On theother hand, with just over 2000 individuals, we run into serious troubles in terms of statistical power.
26

detention). If this is the case, the reduction in incarceration that we observe could be ex-plained by changes in the probability of ending up in jail conditional on criminal behavior,as opposed to changes in criminal behavior itself.
While we cannot directly address this issue (because the conditional probability ofincarceration remains unobserved), there are several reasons why we believe that it ispossible to exclude these alternative stories on the basis of the available empirical evidence.First of all, changes in the probability of arrest and incarceration should matter after theEU enlargement, while all the tests identify the break point before that date, which ismore consistent with expectation-induced changes in (criminal) behavior. In addition,there is little or no reason for these alternative explanations to impact differentially inNorthern and Center-Southern regions, or among economic and violent offenders. Finally,as to the possibility of sanctions alternative to incarceration, the pardon status precludesall individuals in our sample from accessing this opportunity.
Another issue is that legal and illegal immigrants may be characterized by a differentwillingness to travel back to their origin country, as they retain the right to return to Italyat any subsequent moment. While we consider at risk all individuals released with thepardon, spending less time in Italy would decrease the probability of committing a crimethere for Romanians and Bulgarian after the acquisition of legal status. While this wouldalso imply a reduction in the crime rate of this group, the mechanism would be totallydifferent from the one proposed in this paper. However, also this alternative channel(like the ones discussed before) should work mostly after the policy change and, again, itshould impact similarly on all (regardless of the type of crime previously committed andthe region of residence in Italy).
A related concern is that, after obtaining the right to free movement, immigrants mightconsider moving to other European countries that offer relatively better labor marketopportunities to legal immigrants. In addition to the usual counter-arguments in terms ofbreak point and heterogeneity of effects (which hold true also in this case) we should noticein addition that migration to other EU states would not occur instantaneously; indeed, ifthis was really driving the change in re-incarceration, the effect should be increasing overtime, as more and more Romanians and Bulgarians exit from the pool at risk. Therefore,we can investigate the empirical relevance of this alternative explanation by looking at theevolution of the differential effect over time. For this reason, we re-estimate the model(15) truncating the longitudinal dimension at each week after the EU enlargement. Theresults, shown in Figure 13, are remarkable stable over time, suggesting if anything thatmost of the action takes place in the first weeks after the enlargement, when migration toother countries plays probably little or no role.
One final issue concerns the possibility of interactions in crime between different com-munities of immigrants. In particular, the change in the criminal behavior of Romaniansand Bulgarians after the EU enlargement could have affected the activities of the otherindividuals in our sample, thus “contaminating” the control group. In particular, substi-tution between the criminal activity of the two groups would bias our estimates upward,
27

in that other immigrants would increase their criminal activity in response to the decreaseby Romanians and Bulgarians; the opposite is true in the case of complementarity.
While interactions in crime raise formidable estimating issues (which we do not addressin this paper), descriptive evidence seems supportive of the complementarity hypothesis.Figure 14 plots the change (between 2006 and 2007) in the number of crimes committed byall Romanians in Italy against the same changes for (some of) the nationalities included inthe control group, for different types of crime.28 It emerges clearly a positive correlationbetween the two. While we can hardly attach any causal interpretation to this finding,the latter seems more consistent with the existence of complementarity in the criminalactivities of the two groups (as opposed to substitution), in which case our estimateswould be biased downward.
7 Conclusions
We use a natural experiment, namely the last round of the EU enlargement, to identifythe effect of legal status on immigrants’ crime. We provide a theoretical framework thatillustrates the two main effects of legal status: on the one hand, it increases crime byprecluding deportation of potential foreign criminals; on the other hand, it lowers thepropensity to engage in crime by providing immigrants with better income opportunities.Evidence from a sample of former prison inmates released in Italy a few months beforethe enlargement suggests that the second effect prevails. In particular, the probability ofrearrest decreases by more than half after obtaining legal status as a consequence of theEU enlargement.
Besides the effect on the pool of undocumented immigrants already in the host country,the concession of legal status (either through subsequent rounds of the EU enlargement orthough amnesties) is also likely to attract new immigrants from abroad: indeed, thousandsof Romanians and Bulgarians were standing along the European borders on New Year’sEve of 2007. It is then likely that changes in migration policy affect also the quantitativedimension of incoming flows, as well as their composition. Policy makers would also needan estimate of the cost and benefits of these additional consequences, but this goes beyondthe scope of this paper.
References
Abadie, A. (2005). Semiparametric difference-in-differences estimators. Review of Eco-nomic Studies 72 (1), 1–19.
Abadie, A. and G. W. Imbens (2008). On the failure of the bootstrap for matchingestimators. Econometrica 76 (6), 1537–1557.
28These data are not available for Bulgarians and some other small foreign communities in the controlgroup.
28

Accetturo, A. and L. Infante (2010). Immigrant earnings in the italian labour market.Giornale degli Economisti 69 (1), 1–28.
Acemoglu, D. (2002). Technical change, inequality, and the labor market. Journal ofEconomic Literature 40 (1), pp. 7–72.
Andrews, D. W. K. (1993). Tests for parameter instability and structural change withunknown change point. Econometrica 61 (4), 821–856.
Ashenfelter, O. and D. Card (2002). Did the elimination of mandatory retirement affectfaculty retirement? The American Economic Review 92 (4), pp. 957–980.
Barbarino, A. and G. Mastrobuoni (2010). Pardon me: Estimating incapacitation usingcollective clemency bills. Carlo alberto notebooks, Collegio Carlo Alberto.
Bauer, T. K., M. Lofstrom, and K. F. Zimmermann (2000). Immigration policy, assim-ilation of immigrants and natives’ sentiments towards immigrants: Evidence from 12oecd-countries. IZA Discussion Paper No. 187.
Becker, G. (1957). The Economics of Discrimination. University of Chicago Press.
Becker, G. S. (1968). Crime and punishment: An economic approach. The Journal ofPolitical Economy 76 (2), pp. 169–217.
Bell, B., S. Machin, and F. Fasani (2010). Crime and immigration: Evidence from largeimmigrant waves. CReAM Discussion Paper Series 1012, Centre for Research and Anal-ysis of Migration (CReAM), Department of Economics, University College London.
Bianchi, M., P. Buonanno, and P. Pinotti (2008). Do immigrants cause crime? PSEWorking Papers 2008-05, PSE (Ecole normale suprieure).
Blangiardo, G. (2008). The centre sampling technique in surveys on foreign migrants.The balance of a multi-year experience. Working Paper 12, United Nations StatisticalCommission and EUROSTAT.
Blangiardo, G., S. Migliorati, and L. Terzera (2004). Center sampling: from applicativeissues to methodologocal aspects. Atti della XLII Riunione Scientifica della SIS, volumeSessioni plenarie e Sessioni specializzate.
Borjas, G. J. (1994). The economics of immigration. Journal of Economic Literature 32 (4),1667–1717.
Borjas, G. J., J. Grogger, and G. H. Hanson (2010). Immigration and the economic statusof african-american men. Economica 77 (306), 255–282.
Bratsberg, B., J. F. Ragan, and Z. M. Nasir (2002). The effect of naturalization on wagegrowth: A panel study of young male immigrants. Journal of Labor Economics 20 (3),568–597.
29

Burdett, K., R. Lagos, and R. Wright (2003). Crime, inequality, and unemployment.American Economic Review 93 (5), 1764–1777.
Busso, M., J. DiNardo, and J. McCrary (2009). New evidence on the finite sample prop-erties of propensity score matching and reweighting estimators. Technical report.
Butcher, K. F. and A. M. Piehl (1998a). Cross-city evidence on the relationship betweenimmigration and crime. Journal of Policy Analysis and Management 17 (3), 457–493.
Butcher, K. F. and A. M. Piehl (1998b). Recent immigrants: Unexpected implications forcrime and incarceration. Industrial and Labor Relations Review 51 (4), 654–679.
Butcher, K. F. and A. M. Piehl (2007). Why are immigrants’ incarceration rates so low?evidence on selective immigration, deterrence, and deportation. Technical report.
Card, D. (2005). Is the new immigration really so bad? Economic Journal 115 (507),300–323.
Card, D., C. Dustmann, and I. Preston (2009, November). Immigration, wages, andcompositional amenities. NBER Working Papers 15521, National Bureau of EconomicResearch, Inc.
Card, D., A. Mas, and J. Rothstein (2008). Tipping and the dynamics of segregation. TheQuarterly Journal of Economics 123 (1), 177–218.
Chojnicki, X., F. Docquier, and L. Ragot (2005). Should the u.s. have locked the heaven’sdoor? reassessing the benefits of the postwar immigration. IZA Discussion Paper No.1676.
Cortes, P. (2008). The effect of low-skilled immigration on u.s. prices: Evidence from cpidata. Journal of Political Economy 116 (3), 381–422.
Cox, D. R. (1972). Regression models and life-tables. Journal of the Royal StatisticalSociety. Series B (Methodological) 34 (2), 187–220.
Drago, F., R. Galbiati, and P. Vertova (2009). The deterrent effects of prison: Evidencefrom a natural experiment. Journal of Political Economy 117 (2), 257–280.
Eckaus, R. S. (1961). The north-south differential in italian economic development. TheJournal of Economic History 21 (3), pp. 285–317.
Efron, B. (1988). Logistic regression, survival analysis, and the kaplan-meier curve. Journalof the American Statistical Association 83 (402), pp. 414–425.
Ehrlich, I. (1973). Participation in illegitimate activities: A theoretical and empiricalinvestigation. The Journal of Political Economy 81 (3), pp. 521–565.
30

Ehrlich, I. (1996). Crime, punishment, and the market for offenses. Journal of EconomicPerspectives 10 (1), 43–67.
Fasani, F. (2009). Deporting undocumented immigrants. mimeo, University College ofLondon.
Friedberg, R. M. and J. Hunt (1995). The impact of immigrants on host country wages,employment and growth. Journal of Economic Perspectives 9 (2), 23–44.
Gould, E. D., B. A. Weinberg, and D. B. Mustard (2002, February). Crime rates and locallabor market opportunities in the united states: 1979-1997. The Review of Economicsand Statistics 84 (1), 45–61.
Grogger, J. (1998). Market wages and youth crime. Journal of Labor Economics 16 (4),pp. 756–791.
Grogger, J. and G. H. Hanson (2010). Income maximization and the selection and sortingof international migrants. Journal of Development Economics (forthcoming).
Helliwell, J. F. and R. D. Putnam (1995). Economic growth and social capital in italy.Eastern Economic Journal 21 (3), 295–307.
Hirano, K., G. W. Imbens, and G. Ridder (2003). Efficient estimation of average treatmenteffects using the estimated propensity score. Econometrica 71 (4), pp. 1161–1189.
Ichino, A. and R. T. Riphahn (2005). The effect of employment protection on workereffort: Absenteeism during and after probation. Journal of the European EconomicAssociation 3 (1), 120–143.
Imbens, G. W. and J. M. Wooldridge (2009). Recent developments in the econometrics ofprogram evaluation. Journal of Economic Literature 47 (1), 5–86.
Italian Ministry of Internal Affairs (2007). Rapporto sulla criminalita in Italia. Analisi,Prevenzione, Contrasto.
Kaushal, N. (2006). Amnesty programs and the labor market outcomes of undocumentedworkers. Journal of Human Resources 41 (3).
Kossoudji, S. A. and D. A. Cobb-Clark (2002). Coming out of the shadows: Learning aboutlegal status and wages from the legalized population. Journal of Labor Economics 20 (3),598–628.
Lach, S. (2007). Immigration and prices. Journal of Political Economy 115 (4), 548–587.
Leamer, E. (1978). Specification Searches: Ad Hoc Inference with Non Experimental Data.Wiley.
31

Lee, D. S. and J. McCrary (2009). The deterrence effect of prison: Dynamic theory andevidence. Technical report.
Lee, R. D. and T. W. Miller (2000). Immigration, social security and broader fiscal impacts.American Economic Review 90, 350–354.
Levitt, S. D. (1996). The Effect of Prison Population Size on Crime Rates: Evidence fromPrison Overcrowding Litigation. The Quarterly Journal of Economics 111 (2), 319–351.
Lochner, L. (2004). Education, work, and crime: A human capital approach. InternationalEconomic Review 45 (3), 811–843.
Machin, S. and C. Meghir (2004). Crime and economic incentives. Journal of HumanResources 39 (4).
Meyers, Samuel L, J. (1983). Estimating the economic model of crime: Employment versuspunishment effects. The Quarterly Journal of Economics 98 (1), 157–66.
Moehling, C. and A. M. Piehl (2007). Immigration and crime in early 20th centuryamerica. NBER Working Paper No. 13576.
Rogerson, R., R. Shimer, and R. Wright (2005). Search-theoretic models of the labormarket: A survey. Journal of Economic Literature 43 (4), pp. 959–988.
Rosenbaum, P. R. and D. B. Rubin (1983). The central role of the propensity score inobservational studies for causal effects. Biometrika 70 (1), 41.
Rubin, D. B. (1974). Estimating causal effects of treatments in randomized and nonran-domized studies. Journal of Educational Psychology 66 (5), 688 – 701.
Stana, R. M. (2005). Information on Criminal Aliens Incarcerated in Federal and StatePrisons and Local Jails.. Technical Report GAO, 05-337R, US Government Account-ability Office (GAO).
Storesletten, K. (2000). Sustaining fiscal policy through immigration. Journal of PoliticalEconomy 108 (2), 300–323.
Winegarden, C. R. and L. B. Khor (1991). Undocumented immigration and unemploymentof u.s. youth and minority workers: Econometric evidence. The Review of Economicsand Statistics 73 (1), 105–112.
Witte, A. D. (1980). Estimating the economic model of crime with individual data. TheQuarterly Journal of Economics 94 (1), 57–84.
32

Appendix
In this Appendix we characterize the expected utility functions EVL and EVI defined insection 3, as well as the difference between the two, E∆V = E (VL − VI).
Starting with EVL, we may subtract ρEVL from both sides of equation 2 to obtain
VL − ρEVL = max {CL(z)− ρEVL; 0}+ wLh.
Taking expectations with respect to z and recalling that z∗k = ρπEVk (from equation 4)delivers
EVL (1− ρ) =∫ +∞
z∗L
(z − z∗L) dF (z) + wLh;
after integrating by parts,
EVL (1− ρ) =∫ +∞
z∗L
[1− F (z)] dz + wLh; (18)
In a similar way, one obtains that the expected utility of illegal immigrants may be writtenas
EVI (1− ρ) = δ [VH − ρEVI ] + (1− δ)
[∫ +∞
z∗I
[1− F (z)] dz + wIh
]. (19)
Proof that E∆V (h) ≥ 0 ∀h ≥ hI . By contradiction: assume that ∃h′ ≥ hI such thatE∆V (h′) < 0, which implies (after combining 18 and 19)
∫ +∞
z∗L
[1− F (z)] dz + wLh < δ [VH − ρEVI ] + (1− δ)
[∫ +∞
z∗I
[1− F (z)] dz + wIh
](20)
Since [VH − ρEVI ] < 0 over h ≥ hI and ∆w ≥ 0, a necessary condition for (20) to hold isthat z∗L − z∗I = ∆z∗ > 0 > E∆V ; but ∆z∗ and E∆V having a different sign contradictscondition (4).
Proof that ∂E∆V∂h ≥ 0. Using again equation (4), ∂E∆V
∂h ≥ 0⇔ ∂z∗L∂h ≥
∂z∗I∂h ; also, equations
(18) and (19) become, respectively,
z∗L
[1− ρ (1− δ)
πρ
]=
∫ +∞
z∗L
[1− F (z)] dz + wLh
z∗I
(1− ρπρ
)= δVH + (1− δ)
[∫ +∞
z∗I
[1− F (z)] dz + wIh
].
33

Applying the implicit function theorem and the Leibniz rule we obtain
∂z∗L∂h
=πρwL
1− β + 2πρ[1− F
(z∗L)]
∂z∗I∂h
=(1− δ)πρwI
1− β (1− δ) + 2πρ (1− δ)[1− F
(z∗I)] .
Then, a sufficient condition for having ∂E∆V∂h = 1
πρ∂∆z∗
∂h ≥ 0 is that ∆z∗ = πρE∆V ≥ 0,which is always true over the interval h ≥ hI .
34

Figure 1: share of foreigners over total and prison population
0
10
20
30
40
50
60
NLD GRC BEL AUT USA (fed.) ITA DEU ESP PRT FIN
% foreigners over prison population % foreigners over total (official) population
Note: The figure shows the incidence of foreigners over prison and total population, respectively,in some OECD countries around year 2000. The source is the OECD for all countries other thanthe US. The data for the US are taken from Stana (2005) and refer exclusively to federal prisons;representative data on state and local jails are not publicly available.
35
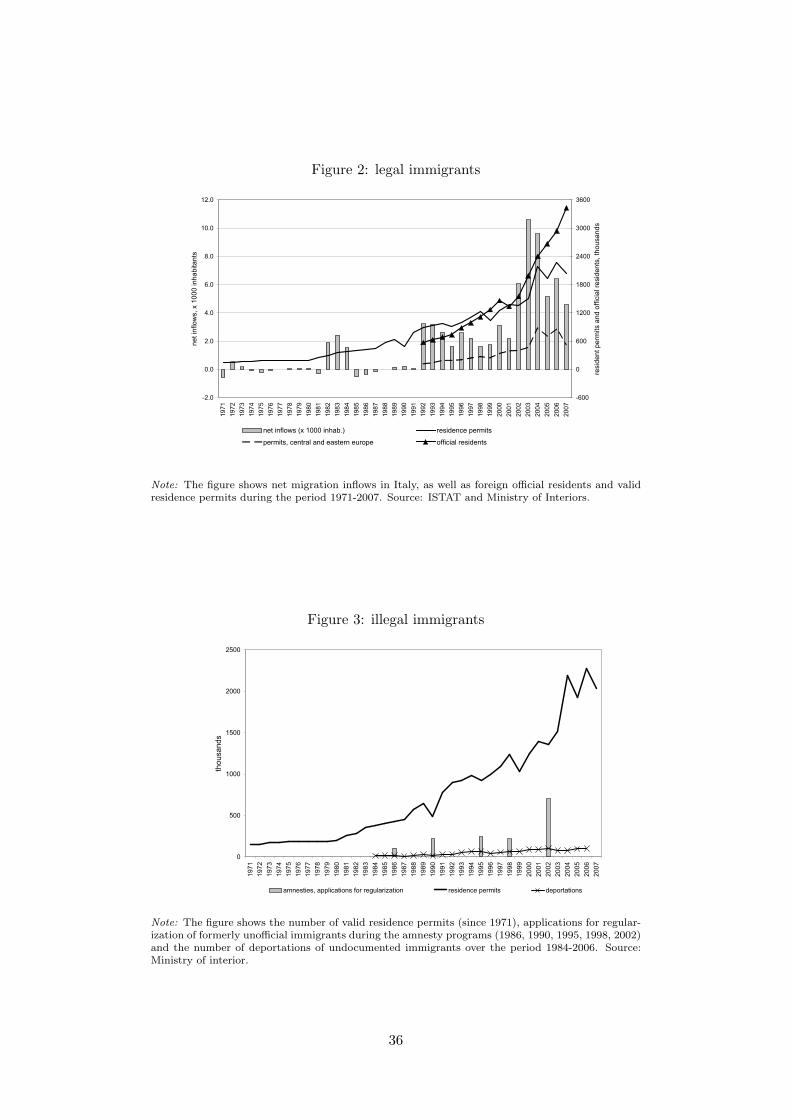
Figure 2: legal immigrants
-2.0
0.0
2.0
4.0
6.0
8.0
10.0
12.0
1971
1972
1973
1974
1975
1976
1977
1978
1979
1980
1981
1982
1983
1984
1985
1986
1987
1988
1989
1990
1991
1992
1993
1994
1995
1996
1997
1998
1999
2000
2001
2002
2003
2004
2005
2006
2007
net inflows, x 1000 inhabitants
-600
0
600
1200
1800
2400
3000
3600
resident perm
its and official residents, thousands
net inflows (x 1000 inhab.) residence permits
permits, central and eastern europe official residents
Note: The figure shows net migration inflows in Italy, as well as foreign official residents and validresidence permits during the period 1971-2007. Source: ISTAT and Ministry of Interiors.
Figure 3: illegal immigrants
0
500
1000
1500
2000
2500
1971
1972
1973
1974
1975
1976
1977
1978
1979
1980
1981
1982
1983
1984
1985
1986
1987
1988
1989
1990
1991
1992
1993
1994
1995
1996
1997
1998
1999
2000
2001
2002
2003
2004
2005
2006
2007
thousands
amnesties, applications for regularization residence permits deportations
Note: The figure shows the number of valid residence permits (since 1971), applications for regular-ization of formerly unofficial immigrants during the amnesty programs (1986, 1990, 1995, 1998, 2002)and the number of deportations of undocumented immigrants over the period 1984-2006. Source:Ministry of interior.
36

Figure 4: prison inmates
0
10,000
20,000
30,000
40,000
50,000
60,000
70,000
1992 1993 1994 1995 1996 1997 1998 1999 2000 2001 2002 2003 2004 2005 2006 2007 2008
foreign inmates
0
5
10
15
20
25
30
35
40
incidence over prison population
% foreign over total prison population (right axis)
foreign inmates
total prison population
Note: The figure plots the number of native and foreign prison inmates in Italy during the period1992-2008, as well as the incidence of foreigners over total prison population. Source: Ministry ofJustice.
37

Figure 5: theoretical model
Figure 5a: illegal immigrants
Figure 5c: criminal behavior
Figure 5b: self selection into legal status
Figure 5d: selection bias
illegals h
ρEVI(h)
hI
T
VH(h)
ρEVI(h)-VH(h)
illegals h
zI*/π=ρEVI(h)zL*/π=ρEVL(h)
legals
lncI = ln[1 – F(zI*)]
illegals, δ=0
(no enforcement)
lncL = ln[1 – F(zI*)]
lncI = ln(1-δ)[1-F(zI*)]
hI hL
˜
illegals h
ρEVI(h)
B
ρEVL(h)
legals
ρEΔV(h)
hI hL
illegals hlegals
E(lncI|I)
BIASββE(lncL|I)
E(lncL|L)
hI hL
38

Figure 6: new EU member and candidate member countries
Note: The map shows the countries admitted to the EU during the last round of the enlargement (inblack), as well as the group of candidate member countries (in gray). Source: European Commission.
39

Figure 7: immigrants in Italy, new EU member and candidate member countries
020
040
060
080
0
2002 2003 2004 2005 2006 2007 2008
Romanians & Bulgarians EU candidate countries
official residents in Italy (thousands)
010
0020
0030
00
2006q1 2006q2 2006q3 2006q4 2007q1 2007q2 2007q3 2007q4
Romanians & Bulgarians EU candidates (Albania & Serbia-Mont)
people reported by the police, x 100k residents
Note: The left graph plots the number of citizens of new EU member and candidate member countriesofficially residing in Italy during the period 2002-2008. The right graph shows instead the ratio ofarrested by the police over official residents in each quarter during the period 2006-2007. In bothgraphs the vertical line refers to the date of the last EU enlargement. Source: ISTAT and Ministryof Interior.
Figure 8: the Collective Clemency Bill
0
1000
2000
3000
4000
5000
6000
7000
8000
9000
aug
2006
jan
2007
may
2007
sep
2007
released
0
20
40
60
80
100
120
140
160
180
200
rearrested
released rearrested
Note: The figure plots the number of foreign prison inmates released after the Collective ClemencyBill in August 2006 (on the left axis), as well as those rearrested until December 2007 (right axis).The vertical line refers to the moment of the EU enlargement. Source: Ministry of Justice.
40

Figure 9: propensity score weighting
01
23
0 .2 .4 .6 .8 1
propensity score
new EU members control group
Note: The figure shows the kernel density of the estimated propensity score across groups. Thepropensity score is the probability of belonging to the groups of citizens of new EU member countries,conditional on observable characteristics. The estimate is based on a logit regression of a dummyfor being Romanian and Bulgarian on a flexible specification of the individual information includedin our sample.
Figure 10: hazard rates of rearrest
.01%
0.02%
0.04%
Hazard rate of rearrest (log scale)
Pardon (08/2006) EU enlargement (01/2007)
Romanians and Bulgarians control
no weighting
.01%
0.02%
0.04%
Hazard rate of rearrest (log scale)
Pardon (08/2006) EU enlargement (01/2007)
Romanians and Bulgarians control
PS weighting
Note: The figure plots the non-parametric (Nelson-Aalen) estimates of daily log hazard rates of rearrest betweenbetween August 2006 and May 2007 for Romanians and Bulgarians (solid line) and for the control group (dashedline). The scale on the vertical axis reports the (estimated) hazard rate of rearrest in each day. In the right graphobservations are weighted by the (estimated) propensity score according to formula (14).
41

Figure 11: differences between north and south
.87
.48
(incapacitation effect)
Enforcement of migration restrictions
.31
.073
(opportunity cost effect)
Unofficial economy
Note: The left map shows the ratio of legal over total (legal and illegal) immigrants across Italianregions; the right map shows instead the relative size of the unofficial economy. In both cases darkercolors refer to higher values. Source: ISTAT and Ministry of Interior.
42

Figure 12: structural break test
-6%
-3%
03%
DID
02
4
R2 ratio
12dec2006
R2 ratio DID
ITALY - structural break test
00.04%
0.08%
hazard rate
12dec2006
New EU control
ITALY - discontinuity
-6%
-3%
03%
DID
02
4
R2 ratio
01dec2006
R2 ratio DID
NORTH - structural break test
00.04%
0.08%
hazard rate
01dec2006
New EU control
NORTH - discontinuity-6%
-3%
03%
DID
02
4
R2 ratio
07dec2006
R2 ratio DID
CENTER-SOUTH - structural break test
00.04%
0.08%
hazard rate
07dec2006
New EU control
CENTER-SOUTH - discontinuity
Note: The left graphs plot (black line and left axis) the ratio of the R2 of the difference-in-differences model H1 in(17), estimated at each possible date in the sample period, over the R2 of the restricted model H0. The estimatedcoefficient of the interaction term in H1 is also shown (gray line and right axis). The vertical solid line correspondsto the day that maximized the R2-ratio (i.e. the most likely break point), while the vertical dashed line is theofficial date of the EU enlargement. The right graphs plot instead the predicted (daily) hazard rates of rearrest asa function of a third order polynomial in time for Romanians and Bulgarians (solid line) and for the control group(dashed line), before and after the break point.
43

Figure 13: effect over time
-3-2
-10
1
0 10 20 30 40 50
truncation of the sample (n-th week in 2007)
point estimate confidence interval
Note: The graph plots the estimated β in model (15), namely the difference-in-differences betweenthe log-odds of rearrest for Romanians and Bulgarians relative to the control group, before and afterthe EU enlargement, when the longitudinal dimension of the sample is truncated at each week duringyear 2007.
Figure 14: substitution of criminal activity
org_crimeterror
smuggling
forgery
pedophilia
mischief
arson
extor
theftarson2
murder1
abuse assault
threat
murder2
murder3
batteryrobberystolen_goods
money_lau
kidnapping
prostitution
narcotics
att_murder
cyber2
copyright
sexual
-1-.5
0.5
1P
erce
ntag
e ch
ange
in c
rimes
200
6-20
07, E
U c
andi
date
s
-1 -.5 0 .5 1 1.5Percentage change in crimes 2006-2007, Romanians
Note: The figure plots the (percentage) change between 2006 and 2007 in the number of Romaniansarrested in Italy for different types of crime against the same change for citizens of candidate membercountries. The area of markers is proportional to the total number of offenses committed in eachcategory. Source: Ministry of Interior.
44

Table 1: legal and illegal immigrants, individual characteristics and labor market outcomes
variable illegals legals diff.obs mean obs mean
age 1280 31.29 7343 34.63 -3.34∗∗∗(8.94) (9.36) (0.28)
female 1281 0.39 7353 0.44 -0.05∗∗∗(0.49) (0.50) (0.01)
married 1281 0.34 7353 0.59 -0.26∗∗∗(0.47) (0.49) (0.01)
number of kids 1279 0.76 7339 1.18 -0.41∗∗∗(1.19) (1.28) (0.04)
college 1281 0.14 7353 0.16 -0.02∗∗∗(0.34) (0.37) (0.01)
low skilled 1281 0.12 7353 0.09 0.04∗∗(0.33) (0.28) (0.01)
income (euros per month) 949 824 5339 1130 -306∗∗∗(371) (652) (22)
college premium 949 9 5339 112 -103∗(35) (25) (62)
Note: This table reports the average characteristics of legal and illegal immigrants, as wellas the between-group difference in each variable. The source is the 2006 round of the ISMUsurvey, the sample is representative of the entire immigrant population of the Italian region ofLombardy. Robust standard errors are reported in parenthesis. ∗, ∗∗ and ∗∗∗ denote between-group differences that are statistically significant at the 90% confidence, 95% confidence and99% confidence, respectively.
45

Table 2: sample statistics by group
NON-WEIGHTED SAMPLE PROPENSITY SCORE WEIGHTINGnew EU control diff new EU control diff
obs mean obs mean mean obs mean obs mean Meanage 725 31.083 1622 33.269 -2.187∗∗∗ 700 33.335 1493 32.716 0.619
(7.597) (8.088) (0.355) (8.528) (7.914) (0.38)
low education 725 0.339 1622 0.461 -0.122∗∗∗ 700 0.437 1495 0.422 0.015(0.474) (0.499) (0.022) (0.496) (0.494) (0.023)
no education 725 0.017 1622 0.017 -0.0001 700 0.015 1493 0.018 -0.003(0.128) (0.128) (0.006) (0.122) (0.133) (0.006)
education missing 725 0.539 1622 0.404 0.135∗∗∗ 700 0.437 1493 0.450 -0.013(0.499) (0.491) (0.022) (0.496) (0.498) (0.024)
married 725 0.257 1622 0.288 -0.031 700 0.266 1493 0.277 -0.011(0.437) (0.453) (0.02) (0.442) (0.448) (0.021)
economic crimes 725 0.84 1622 0.894 -0.054∗∗∗ 700 0.857 1493 0.877 -0.02(0.367) (0.308) (0.015) (0.35) (0.328) (0.016)
violent crimes 725 0.295 1622 0.242 0.053∗∗∗ 700 0.284 1493 0.262 0.022(0.456) (0.428) (0.02) (0.451) (0.44) (0.021)
sentence (months) 725 20.31 1622 39.183 -18.873∗∗∗ 700 32.115 1493 33.269 -1.154(20.706) (32.33) (1.306) (30.63) (30.593) (1.435)
residual sentence 725 9.305 1622 15.727 -6.423∗∗∗ 700 13.349 1493 13.83 -0.481(10.615) (14.784) (0.609) (12.917) (14.13) (0.646)
Note: This table compares the characteristics of Romanians and Bulgarians in our sample with the group of citizensfrom candidate EU member countries. The first tree columns report non-weighted averages for each group, aswell as the between-group difference for each variable. In the last three columns observations are weighted by theinverse propensity score, according to (14). Robust standard errors are reported in parenthesis. ∗, ∗∗ and ∗∗∗
denote between-group differences that are statistically significant at the 90% confidence, 95% confidence and 99%confidence, respectively.
Table 3: difference in difference
economic crimes non-economic crimesnew EU control diff. new EU control diff.
0.023 0.054 -0.031∗∗ 0.047 0.034 0.013post (0.005) (0.008) (0.010) (0.020) (0.014) (0.025)
[0.006] [0.008] [0.010] [0.021] [0.014] [0.025]
0.058 0.057 0.001 0.033 0.043 -0.009pre (0.013) (0.007) (0.015) (0.028) (0.021) (0.035)
[0.014] [0.008] [0.015] [0.019] [0.022] [0.029]
-0.035∗∗ -0.003 -0.032∗ 0.014 -0.009 0.023diff. (0.014) (0.011) (0.017) (0.034) (0.025) ([0.043])
[0.014] [0.011] [0.018] [0.028] [0.027] [0.039]
Note: This table reports the fraction of individuals in our sample that are re-incarcerated,distinguishing between citizens of new EU member countries and candidate member coun-tries, as well as between the period before (“pre”) and after (“post”) the EU enlargement; thedifference-in-differences is reported in the South-East corner of the table. The left and rightpanel show the cross tabulation for the subsamples of former inmates that were previouslyincarcerated (before the pardon) for economic and violent crimes, respectively. Observationsare weighted by the inverse propensity score according to (14). Robust standard errors arereported in parenthesis. ∗, ∗∗ and ∗∗∗ denote between-group differences that are statisticallysignificant at the 90% confidence, 95% confidence and 99% confidence, respectively. Boot-strapped standard errors, based on 400 replications, are also reported in square brackets.
46

Table 4: economic crimes, parametric and semiparametric estimates
(1) (2) (3) (4) (5) (6)Logistic regression Cox model
new EU 0.091 0.091 0.071 0.073 0.022 0.002(0.219) (0.220) (0.222) (0.222) (0.218) (0.219)
post -0.404∗∗ -0.162 -0.162 -0.249 -0.277(0.167) (0.354) (0.354) (0.363) (0.364)
new EU × post -0.744∗∗ -0.740∗∗ -0.733∗∗ -0.736∗∗ -0.679∗∗ -0.668∗∗(0.289) (0.288) (0.289) (0.289) (0.308) (0.308)
time -0.004 -0.004(0.011) (0.011)
time2 -0.000 -0.000(0.000) (0.000)
age 0.090 0.090 0.088(0.058) (0.058) (0.059)
age2 -0.001 -0.001 -0.001(0.001) (0.001) (0.001)
married -0.381∗∗ -0.380∗∗ -0.283∗(0.176) (0.176) (0.158)
residual sentence -0.020∗∗∗ -0.020∗∗∗ -0.021∗∗∗(0.007) (0.007) (0.006)
Observations 124019 124019 124019 115428 3547 3547Subjects 1918 1918 1918 1918 1918 1918Week dummies NO NO NO YES . .pseudo R2 0.009 0.010 0.016 0.042 0.003 0.009Log Likelihood -1704 -1702 -1691 -1631 -1797 -1786
Note: The table shows the results of parametric and semiparametric estimates of the probability of incarcerationfor immigrants from new EU member and candidate member countries before and after the EU enlargement.The parametric model in columns (1)-(4) is a logit equation for the log-odds or incarceration estimated on apanel of individual-weeks observations; the panel is unbalanced because we include only the individuals that areat risk of rearrest in any given week. The semiparametric model in columns (5)-(6) is a proportional hazardCox model for the log hazard rate of incarceration. The sample includes all inmates from new EU member andcandidate member countries released after the July 2006 collective pardon that were previously incarcerated forhaving committed an economically-motivated offense. The dummy postt is equal to 1 in the weeks after theEU enlargement (January 1, 2007), while time and time2 are linear and quadratic trends in time, respectively.Regressions are weighted by the inverse propensity score according to (14). Robust standard errors clustered byItalian region and country of origin are reported in parenthesis. ∗, ∗∗ and ∗∗∗ denote coefficients significantlydifferent from zero at the 90% confidence, 95% confidence and 99% confidence, respectively.
47

Table 5: non-economic crimes, parametric and semiparametric estimates
(1) (2) (3) (4) (5)Logistic regression Cox model
new EU -0.281 -0.283 -0.222 -0.276 -0.215(1.030) (1.030) (0.998) (0.691) (0.691)
post -0.546 0.044 0.051 0.490 0.493(0.585) (0.999) (1.005) (0.838) (0.845)
new EU × post 0.251 0.251 0.245 0.256 0.243(1.144) (1.143) (1.138) (0.864) (0.865)
time -0.015 -0.015(0.027) (0.027)
time2 -0.000 -0.000(0.001) (0.001)
age 0.223 0.229(0.193) (0.212)
age2 -0.003 -0.003(0.003) (0.003)
married 0.111 0.108(0.588) (0.420)
residual sentence -0.008 -0.007(0.023) (0.020)
Observations 18105 18105 18105 531 531Subjects 272 272 272 272 272pseudo R2 0.004 0.008 0.015 0.002 0.012Log Likelihood -202.9 -202.1 -200.6 -150.2 -148.6
Note: The table shows the results of parametric and semiparametric estimates ofthe probability of incarceration for immigrants from new EU member and candidatemember countries before and after the EU enlargement. The parametric model incolumns (1)-(3) is a logit equation for the log-odds or incarceration estimated on apanel of individual-weeks observations; the panel is unbalanced because we includeonly the individuals that are at risk of rearrest in any given week. The semiparametricmodel in columns (4)-(5) is a proportional hazard Cox model for the log hazard rate ofincarceration. The sample includes all inmates from new EU member and candidatemember countries released after the July 2006 collective pardon that were previouslyincarcerated for having committed (only) violent offenses. The dummy postt is equalto 1 in the weeks after the EU enlargement (January 1, 2007), while time and time2
are linear and quadratic trends in time, respectively. Regressions are weighted bythe inverse propensity score according to (14). Robust standard errors clustered byItalian region and country of origin are reported in parenthesis. ∗, ∗∗ and ∗∗∗ denotecoefficients significantly different from zero at the 90% confidence, 95% confidenceand 99% confidence, respectively.
48

Table 6: differences between northern and southern Italy
North Center-South North/CSouthTotal sample 1244 1103 1.1New EU 348 377 0.9Candidate countries 896 726 1.2
economic structure (labor mkt opportunities)GDP per capita 30066 20947 1.4shadow economy (%GDP) 9% 18% 0.5employment rate 48% 37% 1.3
illegal condition in 2002 (incapacitation)residence permits, ths. 832 616 1.4illegals (applications for amnesty), ths. 366 336 1.1illegals/permits 31% 35% 0.9
Note: The table displays the average characteristics of Northern and Center-Southern regions, as well as the ratiobetween the two (in the third column). Source: ISTAT and Ministry of Interior.
Table 7: North vs. South, difference-in-differences
northern regions southern regionsnew EU control diff. new EU control diff.
post 0.014 0.061 -0.046∗∗ 0.034 0.046 -0.013(0.006) (0.010) (0.012) (0.009) (0.013) (0.016)
pre 0.066 0.053 0.013 0.049 0.063 -0.014(0.020) (0.009) (0.022) (0.017) (0.012) (0.021)
diff. -0.052∗∗ 0.007 -0.059∗∗ -0.015 -0.017 0.001(0.021) (0.014) (0.025) (0.020) (0.017) (0.026)
Note: This table reports the fraction of individuals in our sample that are re-incarcerated,distinguishing between citizens of new EU member countries and candidate member coun-tries, as well as between the period before (“pre”) and after (“post”) the EU enlargement;the difference-in-differences is reported in the South-East corner of the table. The left andright panel show the cross tabulation for the subsamples of former inmates that were releasedfrom a prison in the North and Center-South of Italy, respectively. Observations are weightedby the inverse propensity score according to (14). Robust standard errors are reported inparenthesis. ∗, ∗∗ and ∗∗∗ denote between-group differences that are statistically significantat the 90% confidence, 95% confidence and 99% confidence, respectively.
49

Table 8: North vs. South, parametric and semiparametric estimates
(1) (2) (3) (4) (5) (6) (7) (8)Northern regions Center-southern regions
Logistic Cox model Logistic Cox modelnew EU 0.226 0.246 0.214 0.234 -0.085 -0.123 -0.224 -0.256
(0.254) (0.246) (0.287) (0.287) (0.355) (0.351) (0.339) (0.340)
post 0.168 0.170 -0.277 -0.343 -0.612 -0.612 -0.142 -0.612(0.432) (0.432) (0.477) (0.478) (0.524) (0.524) (0.560) (0.524)
new EU × post -0.948∗∗ -0.933∗∗ -0.940∗∗ -0.923∗∗ -0.459 -0.465 -0.323 -0.331(0.413) (0.422) (0.407) (0.408) (0.348) (0.347) (0.472) (0.472)
age 0.151∗ 0.151∗ 0.028 0.022(0.083) (0.085) (0.086) (0.081)
age2 -0.002∗ -0.002 -0.000 -0.000(0.001) (0.001) (0.001) (0.001)
married -0.605∗∗∗ -0.599∗∗∗ -0.087 0.117(0.195) (0.217) (0.315) (0.231)
residual sentence -0.022∗∗ -0.022∗∗∗ -0.019∗ -0.022∗∗(0.009) (0.007) (0.010) (0.009)
Observations 68151 68151 1982 1982 55868 55868 1566 1566Time trend quad. quad. flex. flex. quad. quad. flex. flex.pseudo R2 0.011 0.021 0.005 0.015 0.011 0.015 0.003 0.009Log Likelihood -989.9 -979.9 -950.9 -941.0 -710.4 -706.9 -679.6 -675.7
Note: The table shows the results of parametric and semiparametric estimates of the probability of incarcerationfor immigrants from new EU member and candidate member countries before and after the EU enlargement,distinguishing between Northern and Center-Southern regions. The parametric model (columns 1-2 and 5-6) is alogit equation for the log-odds or incarceration estimated on a panel of individual-weeks observations; the panel isunbalanced because we include only the individuals that are at risk of rearrest in any given week. The semiparametricmodel (columns 3-4 and 7-8) is a proportional hazard Cox model for the log hazard rate of incarceration. The sampleincludes all inmates from new EU member and candidate member countries released after the July 2006 collectivepardon from a prison in the North (columns 1-4) and in the Center-South (columns 5-8). The dummy postt is equalto 1 in the weeks after the EU enlargement (January 1, 2007), while time and time2 are linear and quadratic trendsin time, respectively. Regressions are weighted by the inverse propensity score according to (14). Robust standarderrors clustered by Italian region and country of origin are reported in parenthesis. ∗, ∗∗ and ∗∗∗ denote coefficientssignificantly different from zero at the 90% confidence, 95% confidence and 99% confidence, respectively.
50

(*) Requestsforcopiesshouldbesentto:Bancad’Italia–ServizioStudidistrutturaeconomicaefinanziaria–DivisioneBibliotecaeArchiviostorico–ViaNazionale,91–00184Rome–(fax00390647922059).TheyareavailableontheInternetwww.bancaditalia.it.
RECENTLYPUBLISHED“TEMI”(*)
N. 788 – FaMIDAS: a mixed frequency factor model with MIDAS structure,byCeciliaFraleandLiberoMonteforte(January2011).
N. 789 – Policies for local development: an evaluation of Italy’s “Patti Territoriali”, byAntonioAccetturoandGuidodeBlasio(January2011).
N. 790 – Testing for east-west contagion in the European banking sector during the financial crisis,byEmidioCocozzaandPaoloPiselli(February2011).
N. 791 – Are incentives for R&D effective? Evidence from a regression discontinuity approach,byRaffaelloBronziniandEleonoraIachini(February2011).
N. 792 – Evaluating the impact of innovation incentives: evidence from an unexpected shortage of funds, by Guido de Blasio, Davide Fantino and Guido Pellegrini(February2011).
N. 793 – Credit availability and investment in Italy: lessons from the “Great Recession”,byEugenioGaiotti(February2011).
N. 794 – Bridging the gap between migrants and the banking system,byGiorgioAlbaretoandPaoloEmilioMistrulli(February2011).
N. 795 – I fondi comuni aperti in Italia: performance delle società di gestione del risparmio,byMicheleLeonardoBianchiandMariaGraziaMiele(February2011).
N. 796 – Securitization is not that evil after all,byUgoAlbertazzi,GinetteEramo,LeonardoGambacortaandCarmeloSalleo(February2011).
N. 797 – Reserve management and sovereign debt cost in a world with liquidity crises,byFlaviaCorneliandEmanueleTarantino(March2011).
N. 798 – Managerial incentives, financial constraints and ownership concentration, byMarcoProtopapa(March2011).
N. 799 – Bootstrap LR tests of stationarity, common trends and cointegration, by FabioBusettiandSilvestrodiSanzo(March2011).
N. 800 – Performance pay and shifts in macroeconomic correlations,byFrancescoNucciandMariannaRiggi(March2011).
N. 801 – Monetary and macroprudential policies, by Paolo Angelini, Stefano Neri andFabioPanetta(March2011).
N. 802 – Imperfect information, real-time data and monetary policy in the euro area, byStefanoNeriandTizianoRopele(March2011).
N. 803 – Financial subsidies and bank lending: substitutes or complements? Micro level evidence from Italy,byAmandaCarmignaniandAlessioD’Ignazio(April2011).
N. 804 – Il miglioramento qualitativo delle produzioni italiane: evidenze da prezzi e strategie delle imprese,byValterdiGiacintoandGiacintoMicucci(April2011).
N. 805 – What determines annuity demand at retirement?, by Giuseppe Cappelletti,GiovanniGuazzarottiandPietroTommasino(April2011).
N. 806 – Heterogeneity and learning with complete markets, by Sergio Santoro (April2011).
N. 807 – Housing, consumption and monetary policy: how different are the U.S. and the euro area?,byAlbertoMusso,StefanoNeriandLivioStracca(April2011).
N. 808 – The monetary transmission mechanism in the euro area: has it changed and why?,byMartinaCecioniandStefanoNeri(April2011).

"TEMI" LATER PUBLISHED ELSEWHERE
2008
P. ANGELINI, Liquidity and announcement effects in the euro area, Giornale degli Economisti e Annali di Economia, v. 67, 1, pp. 1-20, TD No. 451 (October 2002).
P. ANGELINI, P. DEL GIOVANE, S. SIVIERO and D. TERLIZZESE, Monetary policy in a monetary union: What role for regional information?, International Journal of Central Banking, v. 4, 3, pp. 1-28, TD No. 457 (December 2002).
F. SCHIVARDI and R. TORRINI, Identifying the effects of firing restrictions through size-contingent Differences in regulation, Labour Economics, v. 15, 3, pp. 482-511, TD No. 504 (June 2004).
L. GUISO and M. PAIELLA,, Risk aversion, wealth and background risk, Journal of the European Economic Association, v. 6, 6, pp. 1109-1150, TD No. 483 (September 2003).
C. BIANCOTTI, G. D'ALESSIO and A. NERI, Measurement errors in the Bank of Italy’s survey of household income and wealth, Review of Income and Wealth, v. 54, 3, pp. 466-493, TD No. 520 (October 2004).
S. MOMIGLIANO, J. HENRY and P. HERNÁNDEZ DE COS, The impact of government budget on prices: Evidence from macroeconometric models, Journal of Policy Modelling, v. 30, 1, pp. 123-143 TD No. 523 (October 2004).
L. GAMBACORTA, How do banks set interest rates?, European Economic Review, v. 52, 5, pp. 792-819, TD No. 542 (February 2005).
P. ANGELINI and A. GENERALE, On the evolution of firm size distributions, American Economic Review, v. 98, 1, pp. 426-438, TD No. 549 (June 2005).
R. FELICI and M. PAGNINI, Distance, bank heterogeneity and entry in local banking markets, The Journal of Industrial Economics, v. 56, 3, pp. 500-534, No. 557 (June 2005).
S. DI ADDARIO and E. PATACCHINI, Wages and the city. Evidence from Italy, Labour Economics, v.15, 5, pp. 1040-1061, TD No. 570 (January 2006).
S. SCALIA, Is foreign exchange intervention effective?, Journal of International Money and Finance, v. 27, 4, pp. 529-546, TD No. 579 (February 2006).
M. PERICOLI and M. TABOGA, Canonical term-structure models with observable factors and the dynamics of bond risk premia, Journal of Money, Credit and Banking, v. 40, 7, pp. 1471-88, TD No. 580 (February 2006).
E. VIVIANO, Entry regulations and labour market outcomes. Evidence from the Italian retail trade sector, Labour Economics, v. 15, 6, pp. 1200-1222, TD No. 594 (May 2006).
S. FEDERICO and G. A. MINERVA, Outward FDI and local employment growth in Italy, Review of World Economics, Journal of Money, Credit and Banking, v. 144, 2, pp. 295-324, TD No. 613 (February 2007).
F. BUSETTI and A. HARVEY, Testing for trend, Econometric Theory, v. 24, 1, pp. 72-87, TD No. 614 (February 2007).
V. CESTARI, P. DEL GIOVANE and C. ROSSI-ARNAUD, Memory for prices and the Euro cash changeover: an analysis for cinema prices in Italy, In P. Del Giovane e R. Sabbatini (eds.), The Euro Inflation and Consumers’ Perceptions. Lessons from Italy, Berlin-Heidelberg, Springer, TD No. 619 (February 2007).
B. H. HALL, F. LOTTI and J. MAIRESSE, Employment, innovation and productivity: evidence from Italian manufacturing microdata, Industrial and Corporate Change, v. 17, 4, pp. 813-839, TD No. 622 (April 2007).
J. SOUSA and A. ZAGHINI, Monetary policy shocks in the Euro Area and global liquidity spillovers, International Journal of Finance and Economics, v.13, 3, pp. 205-218, TD No. 629 (June 2007).
M. DEL GATTO, GIANMARCO I. P. OTTAVIANO and M. PAGNINI, Openness to trade and industry cost dispersion: Evidence from a panel of Italian firms, Journal of Regional Science, v. 48, 1, pp. 97-129, TD No. 635 (June 2007).
P. DEL GIOVANE, S. FABIANI and R. SABBATINI, What’s behind “inflation perceptions”? A survey-based analysis of Italian consumers, in P. Del Giovane e R. Sabbatini (eds.), The Euro Inflation and Consumers’ Perceptions. Lessons from Italy, Berlin-Heidelberg, Springer, TD No. 655 (January
2008).
R. BRONZINI, G. DE BLASIO, G. PELLEGRINI and A. SCOGNAMIGLIO, La valutazione del credito d’imposta per gli investimenti, Rivista di politica economica, v. 98, 4, pp. 79-112, TD No. 661 (April 2008).

B. BORTOLOTTI, and P. PINOTTI, Delayed privatization, Public Choice, v. 136, 3-4, pp. 331-351, TD No. 663 (April 2008).
R. BONCI and F. COLUMBA, Monetary policy effects: New evidence from the Italian flow of funds, Applied Economics , v. 40, 21, pp. 2803-2818, TD No. 678 (June 2008).
M. CUCCULELLI, and G. MICUCCI, Family Succession and firm performance: evidence from Italian family firms, Journal of Corporate Finance, v. 14, 1, pp. 17-31, TD No. 680 (June 2008).
A. SILVESTRINI and D. VEREDAS, Temporal aggregation of univariate and multivariate time series models: a survey, Journal of Economic Surveys, v. 22, 3, pp. 458-497, TD No. 685 (August 2008).
2009
F. PANETTA, F. SCHIVARDI and M. SHUM, Do mergers improve information? Evidence from the loan market, Journal of Money, Credit, and Banking, v. 41, 4, pp. 673-709, TD No. 521 (October 2004).
M. BUGAMELLI and F. PATERNÒ, Do workers’ remittances reduce the probability of current account reversals?, World Development, v. 37, 12, pp. 1821-1838, TD No. 573 (January 2006).
P. PAGANO and M. PISANI, Risk-adjusted forecasts of oil prices, The B.E. Journal of Macroeconomics, v. 9, 1, Article 24, TD No. 585 (March 2006).
M. PERICOLI and M. SBRACIA, The CAPM and the risk appetite index: theoretical differences, empirical similarities, and implementation problems, International Finance, v. 12, 2, pp. 123-150, TD No. 586 (March 2006).
U. ALBERTAZZI and L. GAMBACORTA, Bank profitability and the business cycle, Journal of Financial Stability, v. 5, 4, pp. 393-409, TD No. 601 (September 2006).
S. MAGRI, The financing of small innovative firms: the Italian case, Economics of Innovation and New Technology, v. 18, 2, pp. 181-204, TD No. 640 (September 2007).
V. DI GIACINTO and G. MICUCCI, The producer service sector in Italy: long-term growth and its local determinants, Spatial Economic Analysis, Vol. 4, No. 4, pp. 391-425, TD No. 643 (September 2007).
F. LORENZO, L. MONTEFORTE and L. SESSA, The general equilibrium effects of fiscal policy: estimates for the euro area, Journal of Public Economics, v. 93, 3-4, pp. 559-585, TD No. 652 (November 2007).
R. GOLINELLI and S. MOMIGLIANO, The Cyclical Reaction of Fiscal Policies in the Euro Area. A Critical Survey of Empirical Research, Fiscal Studies, v. 30, 1, pp. 39-72, TD No. 654 (January 2008).
P. DEL GIOVANE, S. FABIANI and R. SABBATINI, What’s behind “Inflation Perceptions”? A survey-based analysis of Italian consumers, Giornale degli Economisti e Annali di Economia, v. 68, 1, pp. 25-52, TD No. 655 (January 2008).
F. MACCHERONI, M. MARINACCI, A. RUSTICHINI and M. TABOGA, Portfolio selection with monotone mean-variance preferences, Mathematical Finance, v. 19, 3, pp. 487-521, TD No. 664 (April 2008).
M. AFFINITO and M. PIAZZA, What are borders made of? An analysis of barriers to European banking integration, in P. Alessandrini, M. Fratianni and A. Zazzaro (eds.): The Changing Geography of Banking and Finance, Dordrecht Heidelberg London New York, Springer, TD No. 666 (April 2008).
A. BRANDOLINI, On applying synthetic indices of multidimensional well-being: health and income inequalities in France, Germany, Italy, and the United Kingdom, in R. Gotoh and P. Dumouchel (eds.), Against Injustice. The New Economics of Amartya Sen, Cambridge, Cambridge University Press, TD No. 668 (April 2008).
G. FERRERO and A. NOBILI, Futures contract rates as monetary policy forecasts, International Journal of Central Banking, v. 5, 2, pp. 109-145, TD No. 681 (June 2008).
P. CASADIO, M. LO CONTE and A. NERI, Balancing work and family in Italy: the new mothers’ employment decisions around childbearing, in T. Addabbo and G. Solinas (eds.), Non-Standard Employment and Qualità of Work, Physica-Verlag. A Sprinter Company, TD No. 684 (August 2008).
L. ARCIERO, C. BIANCOTTI, L. D'AURIZIO and C. IMPENNA, Exploring agent-based methods for the analysis of payment systems: A crisis model for StarLogo TNG, Journal of Artificial Societies and Social Simulation, v. 12, 1, TD No. 686 (August 2008).
A. CALZA and A. ZAGHINI, Nonlinearities in the dynamics of the euro area demand for M1, Macroeconomic Dynamics, v. 13, 1, pp. 1-19, TD No. 690 (September 2008).
L. FRANCESCO and A. SECCHI, Technological change and the households’ demand for currency, Journal of Monetary Economics, v. 56, 2, pp. 222-230, TD No. 697 (December 2008).
G. ASCARI and T. ROPELE, Trend inflation, taylor principle, and indeterminacy, Journal of Money, Credit and Banking, v. 41, 8, pp. 1557-1584, TD No. 708 (May 2007).

S. COLAROSSI and A. ZAGHINI, Gradualism, transparency and the improved operational framework: a look at overnight volatility transmission, International Finance, v. 12, 2, pp. 151-170, TD No. 710 (May 2009).
M. BUGAMELLI, F. SCHIVARDI and R. ZIZZA, The euro and firm restructuring, in A. Alesina e F. Giavazzi (eds): Europe and the Euro, Chicago, University of Chicago Press, TD No. 716 (June 2009).
B. HALL, F. LOTTI and J. MAIRESSE, Innovation and productivity in SMEs: empirical evidence for Italy, Small Business Economics, v. 33, 1, pp. 13-33, TD No. 718 (June 2009).
2010
A. PRATI and M. SBRACIA, Uncertainty and currency crises: evidence from survey data, Journal of Monetary Economics, v, 57, 6, pp. 668-681, TD No. 446 (July 2002).
L. MONTEFORTE and S. SIVIERO, The Economic Consequences of Euro Area Modelling Shortcuts, Applied Economics, v. 42, 19-21, pp. 2399-2415, TD No. 458 (December 2002).
S. MAGRI, Debt maturity choice of nonpublic Italian firms , Journal of Money, Credit, and Banking, v.42, 2-3, pp. 443-463, TD No. 574 (January 2006).
R. BRONZINI and P. PISELLI, Determinants of long-run regional productivity with geographical spillovers: the role of R&D, human capital and public infrastructure, Regional Science and Urban Economics, v. 39, 2, pp.187-199, TD No. 597 (September 2006).
E. IOSSA and G. PALUMBO, Over-optimism and lender liability in the consumer credit market, Oxford Economic Papers, v. 62, 2, pp. 374-394, TD No. 598 (September 2006).
S. NERI and A. NOBILI, The transmission of US monetary policy to the euro area, International Finance, v. 13, 1, pp. 55-78, TD No. 606 (December 2006).
F. ALTISSIMO, R. CRISTADORO, M. FORNI, M. LIPPI and G. VERONESE, New Eurocoin: Tracking Economic Growth in Real Time, Review of Economics and Statistics, v. 92, 4, pp. 1024-1034, TD No. 631 (June 2007).
A. CIARLONE, P. PISELLI and G. TREBESCHI, Emerging Markets' Spreads and Global Financial Conditions, Journal of International Financial Markets, Institutions & Money, v. 19, 2, pp. 222-239, TD No. 637 (June 2007).
U. ALBERTAZZI and L. GAMBACORTA, Bank profitability and taxation, Journal of Banking and Finance, v. 34, 11, pp. 2801-2810, TD No. 649 (November 2007).
M. IACOVIELLO and S. NERI, Housing market spillovers: evidence from an estimated DSGE model, American Economic Journal: Macroeconomics, v. 2, 2, pp. 125-164, TD No. 659 (January 2008).
F. BALASSONE, F. MAURA and S. ZOTTERI, Cyclical asymmetry in fiscal variables in the EU, Empirica, TD No. 671, v. 37, 4, pp. 381-402 (June 2008).
F. D'AMURI, O. GIANMARCO I.P. and P. GIOVANNI, The labor market impact of immigration on the western german labor market in the 1990s, European Economic Review, v. 54, 4, pp. 550-570, TD No. 687 (August 2008).
A. ACCETTURO, Agglomeration and growth: the effects of commuting costs, Papers in Regional Science, v. 89, 1, pp. 173-190, TD No. 688 (September 2008).
S. NOBILI and G. PALAZZO, Explaining and forecasting bond risk premiums, Financial Analysts Journal, v. 66, 4, pp. 67-82, TD No. 689 (September 2008).
A. B. ATKINSON and A. BRANDOLINI, On analysing the world distribution of income, World Bank Economic Review , v. 24, 1 , pp. 1-37, TD No. 701 (January 2009).
R. CAPPARIELLO and R. ZIZZA, Dropping the Books and Working Off the Books, Labour, v. 24, 2, pp. 139-162 ,TD No. 702 (January 2009).
C. NICOLETTI and C. RONDINELLI, The (mis)specification of discrete duration models with unobserved heterogeneity: a Monte Carlo study, Journal of Econometrics, v. 159, 1, pp. 1-13, TD No. 705 (March 2009).
L. FORNI, A. GERALI and M. PISANI, Macroeconomic effects of greater competition in the service sector: the case of Italy, Macroeconomic Dynamics, v. 14, 5, pp. 677-708, TD No. 706 (March 2009).
V. DI GIACINTO, G. MICUCCI and P. MONTANARO, Dynamic macroeconomic effects of public capital: evidence from regional Italian data, Giornale degli economisti e annali di economia, v. 69, 1, pp. 29-66, TD No. 733 (November 2009).
F. COLUMBA, L. GAMBACORTA and P. E. MISTRULLI, Mutual Guarantee institutions and small business finance, Journal of Financial Stability, v. 6, 1, pp. 45-54, TD No. 735 (November 2009).

A. GERALI, S. NERI, L. SESSA and F. M. SIGNORETTI, Credit and banking in a DSGE model of the Euro Area, Journal of Money, Credit and Banking, v. 42, 6, pp. 107-141, TD No. 740 (January 2010).
M. AFFINITO and E. TAGLIAFERRI, Why do (or did?) banks securitize their loans? Evidence from Italy, Journal of Financial Stability, v. 6, 4, pp. 189-202, TD No. 741 (January 2010).
S. FEDERICO, Outsourcing versus integration at home or abroad and firm heterogeneity, Empirica, v. 37, 1, pp. 47-63, TD No. 742 (February 2010).
V. DI GIACINTO, On vector autoregressive modeling in space and time, Journal of Geographical Systems, v. 12, 2, pp. 125-154, TD No. 746 (February 2010).
S. MOCETTI and C. PORELLO, How does immigration affect native internal mobility? new evidence from Italy, Regional Science and Urban Economics, v. 40, 6, pp. 427-439, TD No. 748 (March 2010).
A. DI CESARE and G. GUAZZAROTTI, An analysis of the determinants of credit default swap spread changes before and during the subprime financial turmoil, Journal of Current Issues in Finance, Business and Economics, v. 3, 4, pp., TD No. 749 (March 2010).
A. BRANDOLINI, S. MAGRI and T. M SMEEDING, Asset-based measurement of poverty, Journal of Policy Analysis and Management, v. 29, 2 , pp. 267-284, TD No. 755 (March 2010).
G. CAPPELLETTI, A Note on rationalizability and restrictions on beliefs, The B.E. Journal of Theoretical Economics, v. 10, 1, pp. 1-11,TD No. 757 (April 2010).
S. DI ADDARIO and D. VURI, Entrepreneurship and market size. the case of young college graduates in Italy, Labour Economics, v. 17, 5, pp. 848-858, TD No. 775 (September 2010).
A. CALZA and A. ZAGHINI, Sectoral money demand and the great disinflation in the US, Journal of Money, Credit, and Banking, v. 42, 8, pp. 1663-1678, TD No. 785 (January 2011).
2011
S. DI ADDARIO, Job search in thick markets, Journal of Urban Economics, v. 69, 3, pp. 303-318, TD No. 605 (December 2006).
E. CIAPANNA, Directed matching with endogenous markov probability: clients or competitors?, The RAND Journal of Economics, v. 42, 1, pp. 92-120, TD No. 665 (April 2008).
FORTHCOMING
M. BUGAMELLI and A. ROSOLIA, Produttività e concorrenza estera, Rivista di politica economica, TD No. 578 (February 2006).
G. DE BLASIO and G. NUZZO, Historical traditions of civicness and local economic development, Journal of Regional Science, TD No. 591 (May 2006).
F. SCHIVARDI and E. VIVIANO, Entry barriers in retail trade, Economic Journal, TD No. 616 (February 2007).
G. FERRERO, A. NOBILI and P. PASSIGLIA, Assessing excess liquidity in the Euro Area: the role of sectoral distribution of money, Applied Economics, TD No. 627 (April 2007).
P. E. MISTRULLI, Assessing financial contagion in the interbank market: maximun entropy versus observed interbank lending patterns, Journal of Banking & Finance, TD No. 641 (September 2007).
Y. ALTUNBAS, L. GAMBACORTA and D. MARQUÉS, Securitisation and the bank lending channel, European Economic Review, TD No. 653 (November 2007).
M. BUGAMELLI and F. PATERNÒ, Output growth volatility and remittances, Economica, TD No. 673 (June 2008).
V. DI GIACINTO e M. PAGNINI, Local and global agglomeration patterns: two econometrics-based indicators, Regional Science and Urban Economics, TD No. 674 (June 2008).
G. BARONE and F. CINGANO, Service regulation and growth: evidence from OECD countries, Economic Journal, TD No. 675 (June 2008).
S. MOCETTI, Educational choices and the selection process before and after compulsory school, Education Economics, TD No. 691 (September 2008).
P. SESTITO and E. VIVIANO, Reservation wages: explaining some puzzling regional patterns, Labour, TD No. 696 (December 2008).
P. PINOTTI, M. BIANCHI and P. BUONANNO, Do immigrants cause crime?, Journal of the European Economic Association, TD No. 698 (December 2008).

R. GIORDANO and P. TOMMASINO, What determines debt intolerance? The role of political and monetary institutions, European Journal of Political Economy, TD No. 700 (January 2009).
F. LIPPI and A. NOBILI, Oil and the macroeconomy: a quantitative structural analysis, Journal of European Economic Association, TD No. 704 (March 2009).
Y. ALTUNBAS, L. GAMBACORTA, and D. MARQUÉS-IBÁÑEZ, Bank risk and monetary policy, Journal of Financial Stability, TD No. 712 (May 2009).
P. ANGELINI, A. NOBILI e C. PICILLO, The interbank market after August 2007: What has changed, and why?, Journal of Money, Credit and Banking, TD No. 731 (October 2009).
G. BARONE and S. MOCETTI, Tax morale and public spending inefficiency, International Tax and Public Finance, TD No. 732 (November 2009).
L. FORNI, A. GERALI and M. PISANI, The macroeconomics of fiscal consolidations in euro area countries, Journal of Economic Dynamics and Control, TD No. 747 (March 2010).
A. DI CESARE and G. GUAZZAROTTI, An analysis of the determinants of credit default swap spread changes before and during the subprime financial turmoil, in C. V. Karsone (eds.), Finance and Banking Developments, Nova Publishers, New York., TD No. 749 (March 2010).
G. BARONE, R. FELICI and M. PAGNINI, Switching costs in local credit markets, International Journal of Industrial Organization, TD No. 760 (June 2010).
G. GRANDE and I. VISCO, A public guarantee of a minimum return to defined contribution pension scheme members, Journal of Risk, TD No. 762 (June 2010).
P. DEL GIOVANE, G. ERAMO and A. NOBILI, Disentangling demand and supply in credit developments: a survey-based analysis for Italy, Journal of Banking and Finance, TD No. 764 (June 2010).
G. BARONE and S. MOCETTI, With a little help from abroad: the effect of low-skilled immigration on the female labour supply, Labour Economics, TD No. 766 (July 2010).
S. MAGRI and R. PICO, The rise of risk-based pricing of mortgage interest rates in Italy, Journal of Banking and Finance, TD No. 778 (October 2010).
A. ACCETTURO and G. DE BLASIO, Policies for local development: an evaluation of Italy’s “Patti Territoriali”, Regional Science and Urban Economics, TD No. 789 (January 2006).