Embed Size (px)
Citation preview
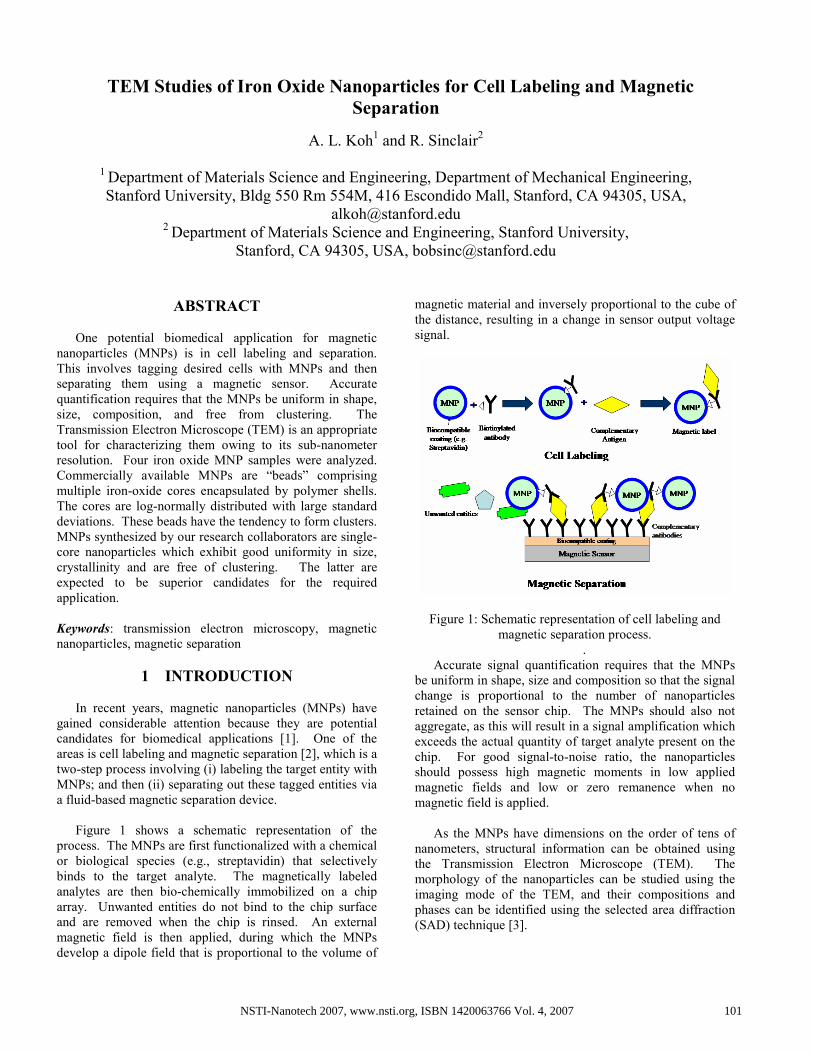
TEM Studies of Iron Oxide Nanoparticles for Cell Labeling and Magnetic Separation
A. L. Koh1 and R. Sinclair2
1 Department of Materials Science and Engineering, Department of Mechanical Engineering, Stanford University, Bldg 550 Rm 554M, 416 Escondido Mall, Stanford, CA 94305, USA,
[email protected] 2 Department of Materials Science and Engineering, Stanford University,
Stanford, CA 94305, USA, [email protected]
ABSTRACT One potential biomedical application for magnetic
nanoparticles (MNPs) is in cell labeling and separation. This involves tagging desired cells with MNPs and then separating them using a magnetic sensor. Accurate quantification requires that the MNPs be uniform in shape, size, composition, and free from clustering. The Transmission Electron Microscope (TEM) is an appropriate tool for characterizing them owing to its sub-nanometer resolution. Four iron oxide MNP samples were analyzed. Commercially available MNPs are “beads” comprising multiple iron-oxide cores encapsulated by polymer shells. The cores are log-normally distributed with large standard deviations. These beads have the tendency to form clusters. MNPs synthesized by our research collaborators are single-core nanoparticles which exhibit good uniformity in size, crystallinity and are free of clustering. The latter are expected to be superior candidates for the required application.
Keywords: transmission electron microscopy, magnetic nanoparticles, magnetic separation
1 INTRODUCTION In recent years, magnetic nanoparticles (MNPs) have
gained considerable attention because they are potential candidates for biomedical applications [1]. One of the areas is cell labeling and magnetic separation [2], which is a two-step process involving (i) labeling the target entity with MNPs; and then (ii) separating out these tagged entities via a fluid-based magnetic separation device.
Figure 1 shows a schematic representation of the
process. The MNPs are first functionalized with a chemical or biological species (e.g., streptavidin) that selectively binds to the target analyte. The magnetically labeled analytes are then bio-chemically immobilized on a chip array. Unwanted entities do not bind to the chip surface and are removed when the chip is rinsed. An external magnetic field is then applied, during which the MNPs develop a dipole field that is proportional to the volume of
magnetic material and inversely proportional to the cube of the distance, resulting in a change in sensor output voltage signal.
Figure 1: Schematic representation of cell labeling and magnetic separation process.
. Accurate signal quantification requires that the MNPs
be uniform in shape, size and composition so that the signal change is proportional to the number of nanoparticles retained on the sensor chip. The MNPs should also not aggregate, as this will result in a signal amplification which exceeds the actual quantity of target analyte present on the chip. For good signal-to-noise ratio, the nanoparticles should possess high magnetic moments in low applied magnetic fields and low or zero remanence when no magnetic field is applied.
As the MNPs have dimensions on the order of tens of
nanometers, structural information can be obtained using the Transmission Electron Microscope (TEM). The morphology of the nanoparticles can be studied using the imaging mode of the TEM, and their compositions and phases can be identified using the selected area diffraction (SAD) technique [3].
NSTI-Nanotech 2007, www.nsti.org, ISBN 1420063766 Vol. 4, 2007 101

2 METHOD Four types of iron oxide nanoparticles were examined in
this study. Nanomag-D SPIO (Manufacturer: Micromod Partikeltechnologie GmbH, Germany) and MACS Basic MicroBeads (Manufacturer: Miltenyi Biotec, Germany) are two commercially available MNPs whose structural properties were compared against those synthesized by our collaborators from Brown University (Sun group) [4] and GE Global Research.
. The commercially available MNPs were dispersed in
Phosphate Buffer Saline (PBS) solution whereas those synthesized by our collaborators were suspended in hexane. For TEM characterization, the samples were pipetted onto amorphous carbon-coated TEM copper grids that had been glow-discharged. The samples were left to dry on the grids for several minutes. Following that, the grids were rinsed with de-ionized water to remove any buffer salts that may be present in the nanoparticle suspensions, and then completely dried using filter paper. The samples were analyzed using a Philips CM20 FEG-TEM operating at 200kV.
3 RESULTS AND DISCUSSION
3.1 Morphology and Phase Identification
Figure 2 shows TEM Bright Field (BF) images of the commercial MNP samples. The corresponding Selected Area Diffraction (SAD) patterns are inset. The TEM images show that the nanoparticle shapes and sizes are not well-defined. In addition, they appear to aggregate and form clusters.
(a) (b)
Figure 2: TEM BF images and SAD patterns (inset) of
(a) Nanomag-D SPIO and (b) MACS Basic MicroBeads.
The scale bar indicates 20nm. The structure of the MNPs was further examined using
high-resolution TEM imaging. Figure 3 shows a HRTEM image an isolated MACS MicroBead taken at a slightly underfocus condition. The boundary between the bead and amorphous carbon was defined by the white Fresnel fringes
(indicated by black arrows). The diameter of the bead was estimated to be about 40nm. At the same time, a strongly diffracting iron oxide core (red triangles) measuring approximately 11nm in diameter could also be seen from the image. We can conclude that the commercially available MNPs are “beads” comprising multiple iron oxide cores encapsulated by a polymer matrix. The bead does not appear to be completely crystalline.
Figure 3: HRTEM image of a MACS Basic MicroBead
showing a bead (indicated by black arrows) and a strongly diffracting iron oxide core (red arrows).
The morphology of the commercial MNPs differs
greatly from those synthesized by our collaborators. Figure 4 shows TEM BF images of the laboratory-synthesized MNPs with the corresponding SAD patterns inset. The nanoparticles appear well-dispersed and the shapes of the particles are clearly defined. From HRTEM (Figure 5), the nanoparticles are found to be composed of single oxide cores.
(a) (b)
Figure 4: TEM BF images and SAD patterns (inset) of iron oxide nanoparticles synthesized by (a) Sun group at Brown University [4] and (b) GE Global Research. The scale bar
marking is 20nm.
NSTI-Nanotech 2007, www.nsti.org, ISBN 1420063766 Vol. 4, 2007102

Figure 5: HRTEM image of GE nanoparticle sample.
3.2 Phase Identification
There are two phases of iron oxide that are ferromagnetic, namely magnetite (Fe3O4) and maghemite (γ-Fe2O3). The former has a higher saturation magnetization value of 480 emu/cc compared to the latter (340 emu/cc). The phases present were identified using the Selected Area Diffraction (SAD) technique, by recording and measuring the radii of the diffraction patterns for each sample and comparing the interplanar spacings obtained against Powder Diffraction Data (JCPDS) files.
Figure 6: SAD patterns for (a) Nanoparticles from Brown
University and (b) Nanomag-D SPIO . A comparison of the SAD patterns for iron oxide
nanoparticles from (a) Brown University and (b) Nanomag-D SPIO is given in Figure 6. Stronger intensities are recorded from the {400} set of planes (Ring 3),
characteristic of magnetite (Fe3O4). By measuring the interplanar spacings and relative intensities, the phases of Nanomag-D SPIO, MACS Basic MicroBeads and GE nanoparticles were found to be γ-Fe2O3, whereas those from Brown University were Fe3O4.
Ring 1 2 3 4 5 6
hkl 220 311 400 422 511 440 d (Ǻ) 2.972 2.539 2.119 1.729 1.614 1.486 Fe3O4 (Ǻ) 2.967 2.532 2.123 1.715 1.616 1.485 Intensity 30 100 51 10 30 40 hkl 220 313 400 426 513 440 d (Ǻ) 2.933 2.510 2.081 1.703 1.602 1.476 γ-Fe2O3 (Ǻ) 2.950 2.514 2.086 1.701 1.604 1.474 Intensity 30 100 15 9 20 40 Table 1: Measured inter-planar spacings, d (Ǻ), based on the rings in Figure 6 and standard inter-planar spacings from powder diffraction database for Fe3O4 and γ-Fe2O3.
3.3 Core Diameter Distribution
TEM BF images from the four MNP samples were used to determine the iron oxide core diameters, size distributions and other particle statistics. Over 300 measurements were made for each sample. Whilst the shapes of the laboratory-synthesized nanoparticles were clearly defined and measurements readily obtainable, the iron oxide cores from the commercial samples were identified by a combination of image contrast and the presence of their lattice fringes, such as those found in Figure 3.
The cumulative distribution functions of the four
samples are plotted on logarithmic scale in Figure 7. The data points are found to approximate a straight line. This suggests that all samples can be fitted to a lognormal distribution with probability density function:
µ−
σ−
πσ= 2
2))x(ln(
2
1exp
2x
1)x(f (1)
where x is the core diameter and µ and σ are the
corresponding mean and standard deviation. The plots corresponding to the two commercial MNP samples have a flatter gradient compared to the laboratory synthesized nanoparticles. This implies that the former have larger standard deviations in the core diameter (i.e. greater variation in size).
1 2 3 4 6 5 1 2 3 4 6 5
(a) (b)
NSTI-Nanotech 2007, www.nsti.org, ISBN 1420063766 Vol. 4, 2007 103

Figure 7: Particle size distribution plots of magnetic nanoparticle samples.
The findings from the structural characterization studies
are summarized in Table 2 below:
Sample Nanoparticle Morphology Description
Iron Oxide Phase
Average Core
Diameter, nm
Nanomag-D SPIO
Magnetic bead composed of multiple iron oxide cores
encapsulated by a polymer shell
Maghemite (γ-Fe2O3)
11±4 (36%)
MACS Basic MicroBeads
Magnetic bead composed of multiple iron oxide cores
encapsulated by a polymer shell
Maghemite (γ-Fe2O3)
13±4 (31%)
Brown University
Single iron oxide core
Magnetite (Fe3O4)
15±1 (7%)
GE Global Research
Single iron oxide core
Maghemite (γ-Fe2O3)
16±2 (13%)
Table 2: Summary of Iron Oxide Nanoparticles findings.
4 CONCLUSION
Structural characterization of four different magnetic
nanoparticle samples was performed using the TEM. Commercial MNPs are found to be magnetic beads composed of multiple iron oxide cores encapsulated by a polymer shell, with large standard deviations in core
diameter. On the other hand, MNPs synthesized by our collaborators are single iron oxide core nanoparticles with small variations in core diameter. The latter are expected to be superior candidates for the intended application of labeling and magnetic separation.
5 ACKNOWLEDGEMENTS
The authors would like to thank Dr. Shan X. Wang of
the Materials Science and Engineering Department at Stanford University for helpful discussions. Samples from Dr. Shouheng Sun of Brown University, and Dr. Amit Kulkarni and Dr. Brian Bales of GE Global Research are gratefully acknowledged.
This research is supported by the Stanford Center for
Cancer Nanotechnology Excellence Focused on Therapy Response (CCNE-TR) grant (NIH U54).
REFERENCES
[1] Q A Pankhurst, J Connolly, S K Jones and J Dobson, “Applications of Magnetic Nanoparticles in Biomedicine”, J. Phys. D: Appl. Phys. 36, R167-R181, 2003.
[2] U. Häfeli, W. Schütt, J. Teller and M.Zborowski "Scientific and Clinical Applications of Magnetic Carriers," Plenum Press, New York, 1999.
[3] D. B. Williams and C. B. Carter “Transmission Electron Microscopy: A Textbook for Materials Science”, Plenum Press, New York, pp. 140-142, 1996.
[4] S. Sun et. al., “Monodisperse MFe2O4 (M=Fe, Co, Mn) Nanoparticles”, J. Am. Chem. Soc. 126, 273-279, 2004.
[5] R. M Cornell and U. Schwertmann “The Iron Oxides: Structure, Properties, Reactions, Occurrences and Uses”, Wiley-VCH 2nd Edition, 2003.
(1): Nanomag D (2): MACS Basic (3): Brown (4): GE
(1) (2) (3)
(4)
NSTI-Nanotech 2007, www.nsti.org, ISBN 1420063766 Vol. 4, 2007104