Embed Size (px)
Citation preview
11 February 2010 The Manager Company Announcements Office Australian Securities Exchange 4th Floor, 20 Bridge Street SYDNEY NSW 2000
Office of the Company Secretary Level 41 242 Exhibition Street MELBOURNE VIC 3000 AUSTRALIA General Enquiries 08 8308 1721 Facsimile 03 9632 3215
ELECTRONIC LODGEMENT Dear Sir or Madam Analyst Briefing – Half year results presentation pack In accordance with the listing rules, I attach a copy of a presentation to be made today, for release to the market. This Announcement has been released simultaneously to the New Zealand Stock Exchange. Yours sincerely
Carmel Mulhern Company Secretary
Telstra Corporation Limited ACN 051 775 556
ABN 33 051 775 556
For
per
sona
l use
onl
y
1Telstra Corporation: [email protected]
2010 Half Year Financial Results
David Thodey, CEO11 February 2010
2
Disclaimer
• These presentations include certain forward-looking statements that are based on information and assumptions known to date andare subject to various risks and uncertainties. Actual results, performance or achievements could be significantly different from thoseexpressed in, or implied by, these forward-looking statements. Such forward-looking statements are not guarantees of futureperformance and involve known and unknown risks, uncertainties and other factors, many of which are beyond the control ofTelstra, which may cause actual results to differ materially from those expressed in the statements contained in these presentations.For example, the factors that are likely to affect the results of Telstra include general economic conditions in Australia; exchangerates; competition in the markets in which Telstra will operate; the inherent regulatory risks in the businesses of Telstra; thesubstantial technological changes taking place in the telecommunications industry; and the continuing growth in the data, internet,mobile and other telecommunications markets where Telstra will operate. A number of these factors are described in Telstra’sFinancial Report dated 13 August 2009 and 2009 Annual Debt Issuance Prospectus lodged with the ASX.
• The Chinese online business results are from unaudited management accounts converted from local currency into Australian Dollars.
• All forward-looking figures in this presentation are unaudited and based on A-IFRS. Certain figures may be subject to roundingdifferences. All market share information in this presentation is based on management estimates based on internally availableinformation unless otherwise indicated.
• All amounts are in Australian Dollars unless otherwise stated.
® Registered trademark of Telstra Corporation Ltd.™ Trademark of Telstra Corporation Ltd.F
or p
erso
nal u
se o
nly
2Telstra Corporation: [email protected]
3
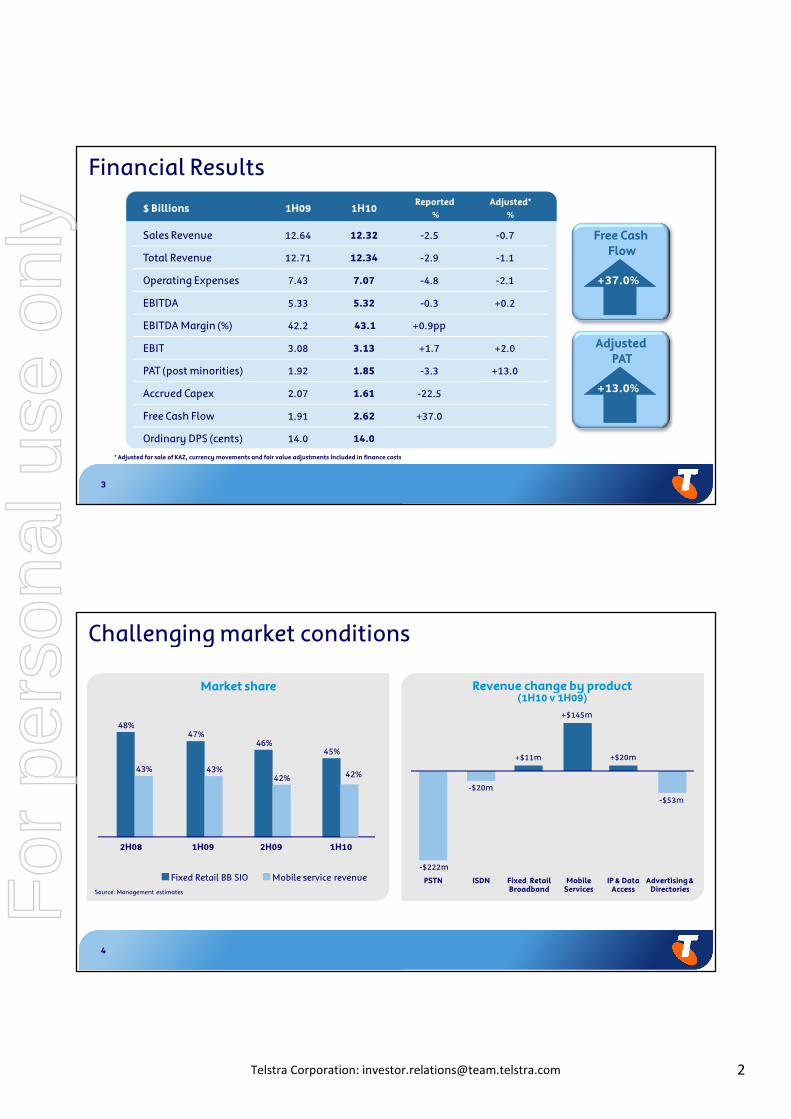
$ Billions 1H09 1H10Reported
%Adjusted*
%
Sales Revenue 12.64 12.32 -2.5 -0.7
Total Revenue 12.71 12.34 -2.9 -1.1
Operating Expenses 7.43 7.07 -4.8 -2.1
EBITDA 5.33 5.32 -0.3 +0.2
EBITDA Margin (%) 42.2 43.1 +0.9pp
EBIT 3.08 3.13 +1.7 +2.0
PAT (post minorities) 1.92 1.85 -3.3 +13.0
Accrued Capex 2.07 1.61 -22.5
Free Cash Flow 1.91 2.62 +37.0
Ordinary DPS (cents) 14.0 14.0
Financial Results
Free CashFlow
+37.0%
* Adjusted for sale of KAZ, currency movements and fair value adjustments included in finance costs
AdjustedPAT
+13.0%
4
Challenging market conditions
Market share
Source: Management estimates
Revenue change by product(1H10 v 1H09)
48%47%
46%45%
43% 43%42% 42%
2H08 1H09 2H09 1H10
Fixed Retail BB SIO Mobile service revenue-$222m
-$20m
+$11m
+$145m
+$20m
-$53m
PSTN ISDN Fixed RetailBroadband
MobileServices
IP & DataAccess
Advertising &DirectoriesF
or p
erso
nal u
se o
nly
3Telstra Corporation: [email protected]
5
-7.3%
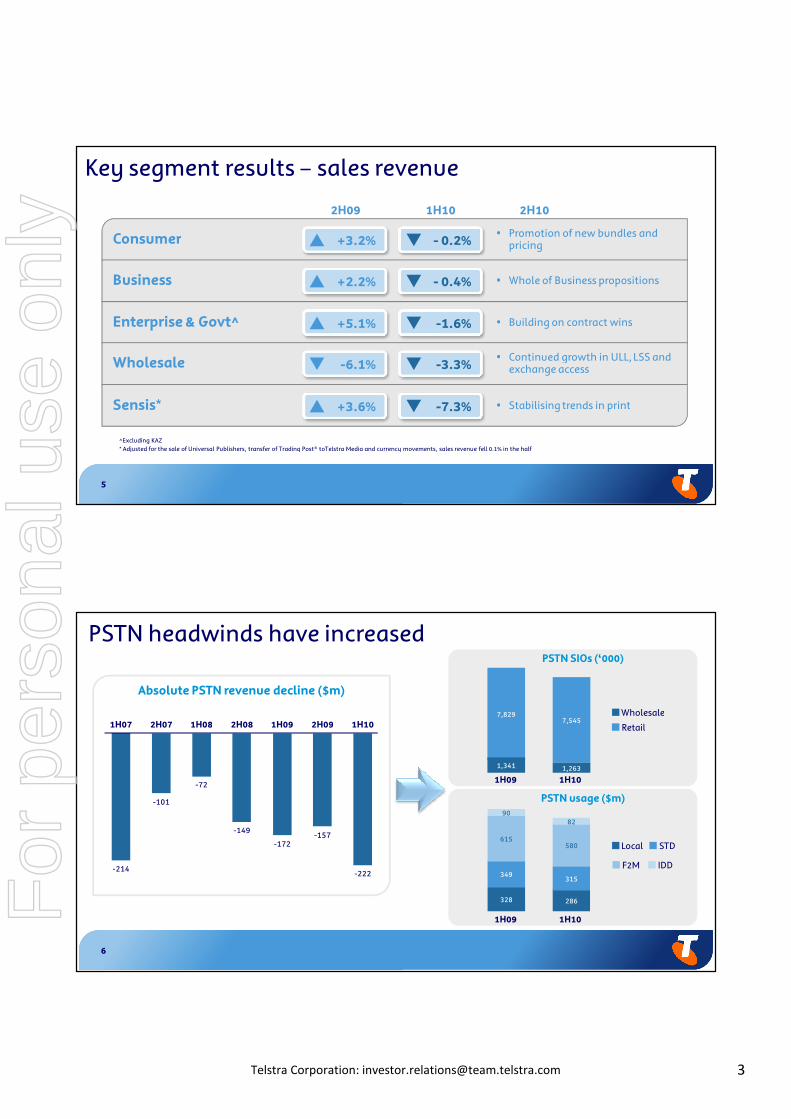
Key segment results – sales revenue
Consumer
Business
Enterprise & Govt^
Wholesale
+3.2%
2H09 1H10 2H10
• Promotion of new bundles andpricing
• Whole of Business propositions
• Building on contract wins
• Continued growth in ULL, LSS andexchange access
- 0.2%
+5.1% -1.6%
+2.2% - 0.4%
-6.1% -3.3%
Sensis* • Stabilising trends in print+3.6%
^Excluding KAZ* Adjusted for the sale of Universal Publishers, transfer of Trading Post® toTelstra Media and currency movements, sales revenue fell 0.1% in the half
6
PSTN headwinds have increased
Absolute PSTN revenue decline ($m)
-214
-101
-72
-149
-172-157
-222
1H07 2H07 1H08 2H08 1H09 2H09 1H10
PSTN usage ($m)
1H09 1H10
Local STD
F2M IDD
286
315
580
82
328
349
615
90
7,545
1,263
7,829
1,341
Wholesale
Retail
1H09 1H10
PSTN SIOs (‘000)
For
per
sona
l use
onl
y
4Telstra Corporation: [email protected]
7
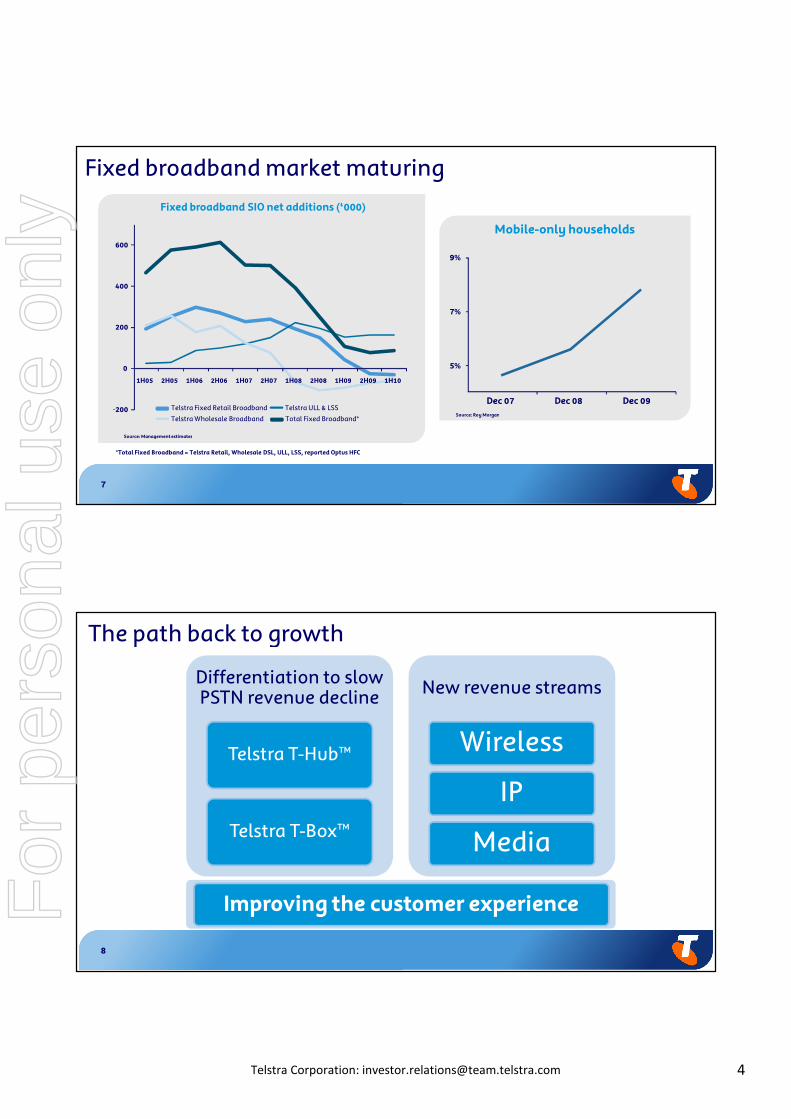
Fixed broadband market maturingFixed broadband SIO net additions (‘000)
Mobile-only households
5%
7%
9%
Dec 07 Dec 08 Dec 09
*Total Fixed Broadband = Telstra Retail, Wholesale DSL, ULL, LSS, reported Optus HFC
Telstra Fixed Retail Broadband Telstra ULL & LSS
Telstra Wholesale Broadband Total Fixed Broadband*-200
0
200
400
600
1H05 2H05 1H06 2H06 1H07 2H07 1H08 2H08 1H09 2H09 1H10
Source: Management estimates
Source: Roy Morgan
8
The path back to growth
Differentiation to slowPSTN revenue decline
Telstra T-Hub™
Telstra T-Box™
New revenue streams
Wireless
IP
Media
Improving the customer experienceFor
per
sona
l use
onl
y
5Telstra Corporation: [email protected]
9
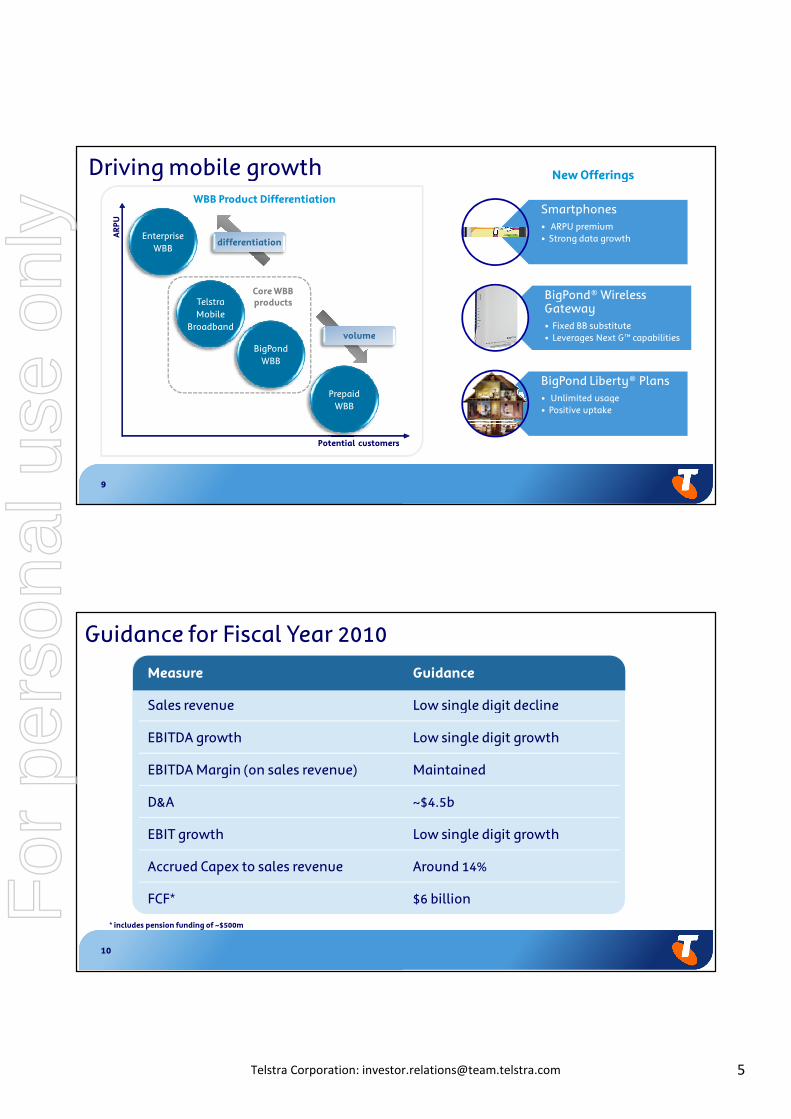
differentiation
Driving mobile growth
Smartphones• ARPU premium• Strong data growth
BigPond® WirelessGateway• Fixed BB substitute• Leverages Next G™ capabilities
BigPond Liberty® Plans• Unlimited usage• Positive uptake
AR
PU
Potential customers
EnterpriseWBB
TelstraMobile
Broadband
BigPondWBB
PrepaidWBB
Core WBBproducts
WBB Product Differentiation
volume
New Offerings
10
Guidance for Fiscal Year 2010
Measure Guidance
Sales revenue Low single digit decline
EBITDA growth Low single digit growth
EBITDA Margin (on sales revenue) Maintained
D&A ~$4.5b
EBIT growth Low single digit growth
Accrued Capex to sales revenue Around 14%
FCF* $6 billion
* includes pension funding of ~$500mFor
per
sona
l use
onl
y
6Telstra Corporation: [email protected]
11
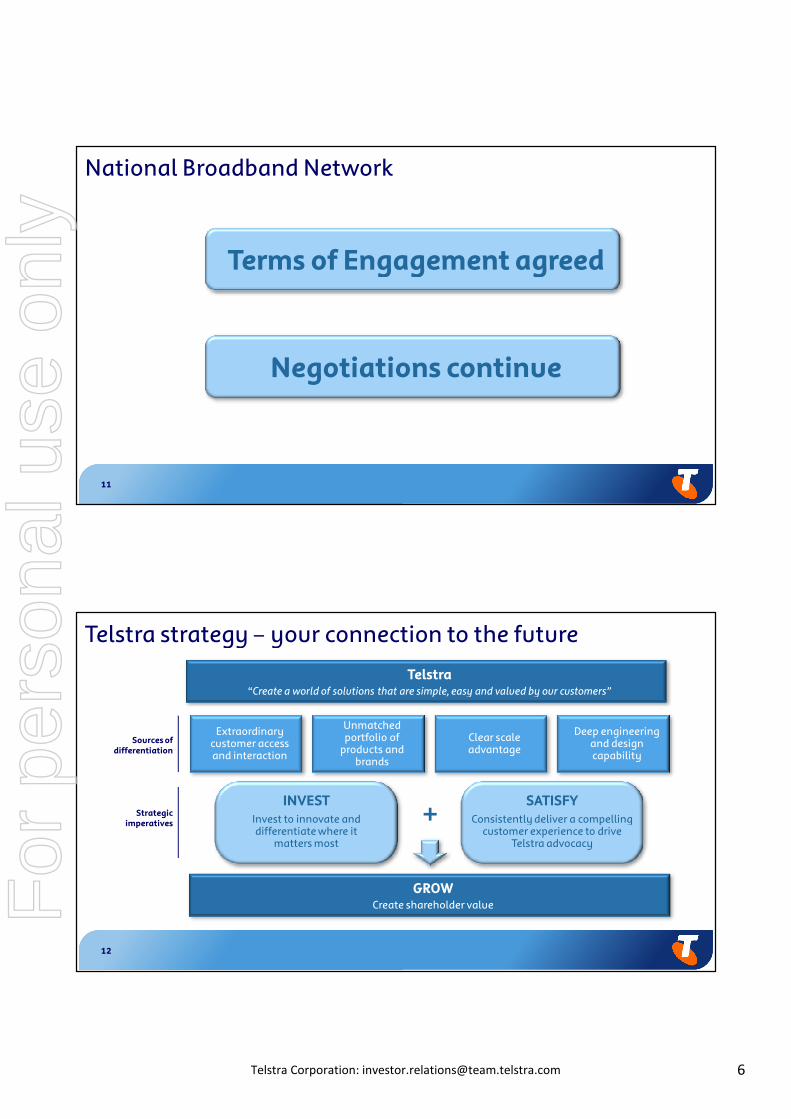
National Broadband Network
Terms of Engagement agreed
Negotiations continue
12
GROWCreate shareholder value
SATISFYConsistently deliver a compelling
customer experience to driveTelstra advocacy
INVESTInvest to innovate anddifferentiate where it
matters most
Telstra strategy – your connection to the future
+
Telstra“Create a world of solutions that are simple, easy and valued by our customers”
Deep engineeringand designcapability
Extraordinarycustomer accessand interaction
Unmatchedportfolio of
products andbrands
Clear scaleadvantage
Sources ofdifferentiation
Strategicimperatives
For
per
sona
l use
onl
y
7Telstra Corporation: [email protected]
2010 Half Year Financial ResultsJohn Stanhope, CFO11 February 2010
14
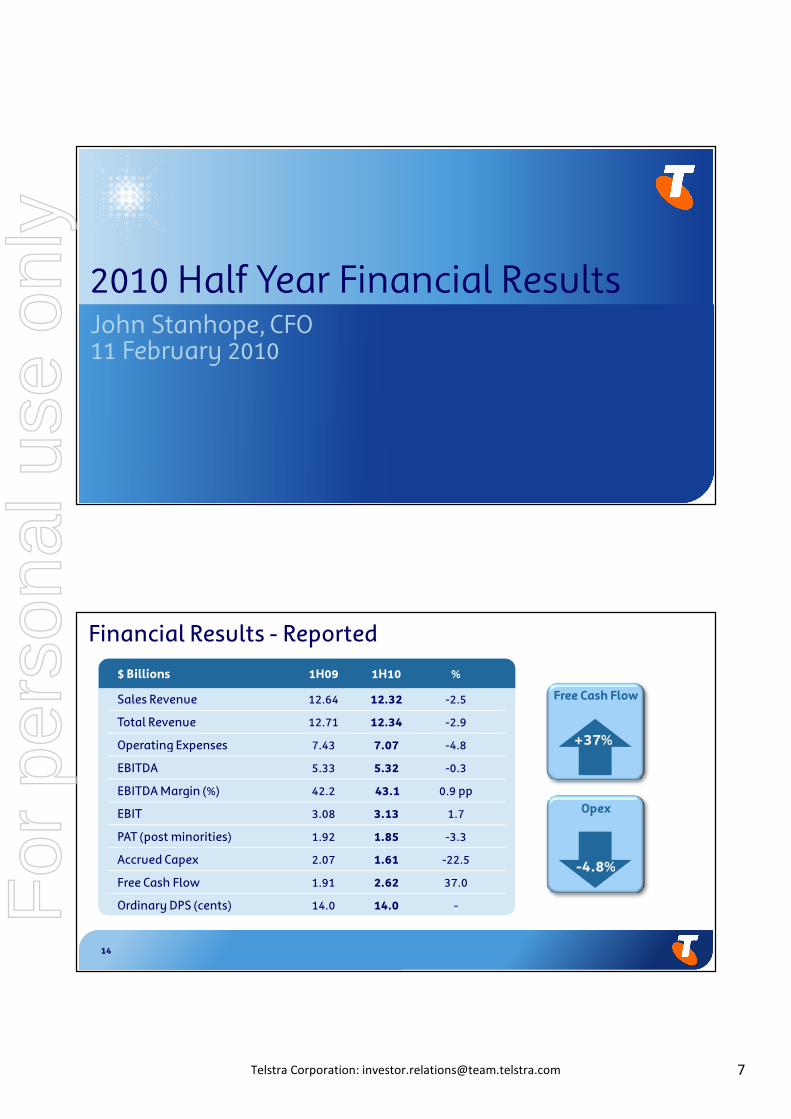
Financial Results - Reported
Free Cash Flow
+37%
Opex
-4.8%
$ Billions 1H09 1H10 %
Sales Revenue 12.64 12.32 -2.5
Total Revenue 12.71 12.34 -2.9
Operating Expenses 7.43 7.07 -4.8
EBITDA 5.33 5.32 -0.3
EBITDA Margin (%) 42.2 43.1 0.9 pp
EBIT 3.08 3.13 1.7
PAT (post minorities) 1.92 1.85 -3.3
Accrued Capex 2.07 1.61 -22.5
Free Cash Flow 1.91 2.62 37.0
Ordinary DPS (cents) 14.0 14.0 -For
per
sona
l use
onl
y
8Telstra Corporation: [email protected]
15
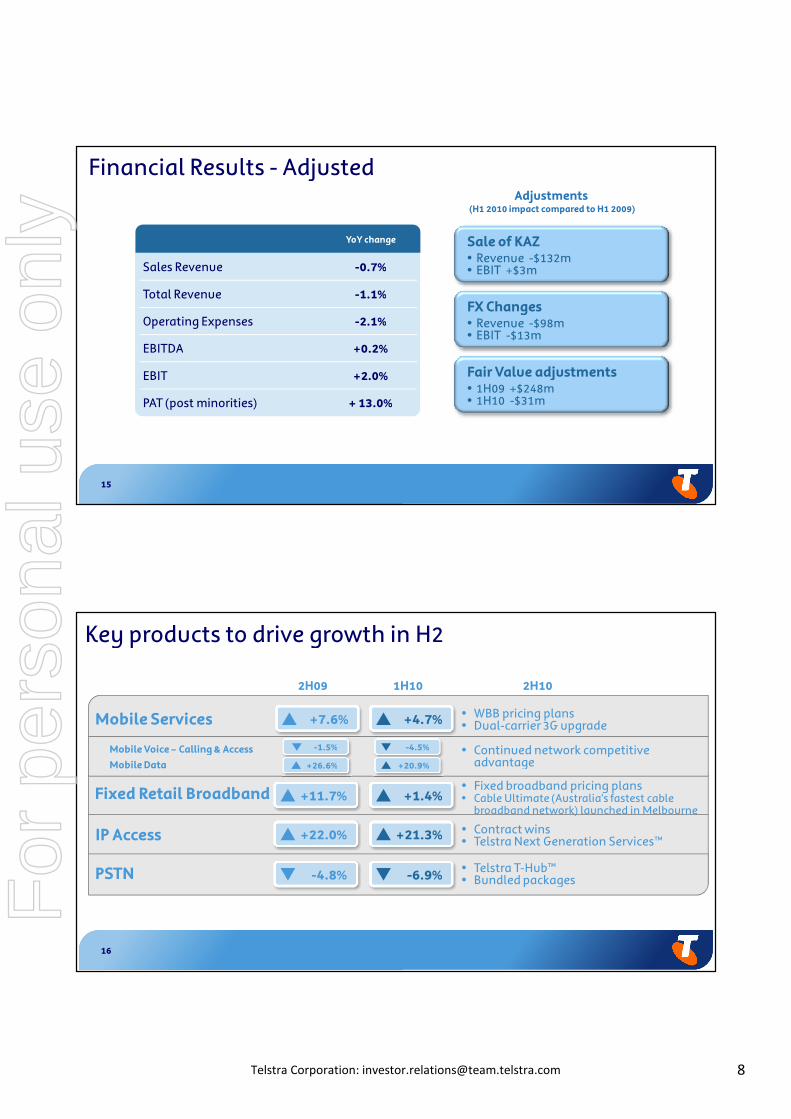
YoY change
Sales Revenue -0.7%
Total Revenue -1.1%
Operating Expenses -2.1%
EBITDA +0.2%
EBIT +2.0%
PAT (post minorities) + 13.0%
Financial Results - AdjustedAdjustments
(H1 2010 impact compared to H1 2009)
Sale of KAZ• Revenue -$132m• EBIT +$3m
FX Changes• Revenue -$98m• EBIT -$13m
Fair Value adjustments• 1H09 +$248m• 1H10 -$31m
16
Key products to drive growth in H2
Mobile Services
Fixed Retail Broadband
IP Access
+7.6%
2H09 1H10 2H10
• WBB pricing plans• Dual-carrier 3G upgrade
• Fixed broadband pricing plans• Cable Ultimate (Australia's fastest cable
broadband network) launched in Melbourne
• Contract wins• Telstra Next Generation Services™
+4.7%
+22.0% +21.3%
+11.7% +1.4%
PSTN • Telstra T-Hub™• Bundled packages-4.8% -6.9%
Mobile Voice – Calling & Access
Mobile Data
-1.5%
+26.6%
-4.5%
+20.9%
• Continued network competitiveadvantage
For
per
sona
l use
onl
y
9Telstra Corporation: [email protected]
17
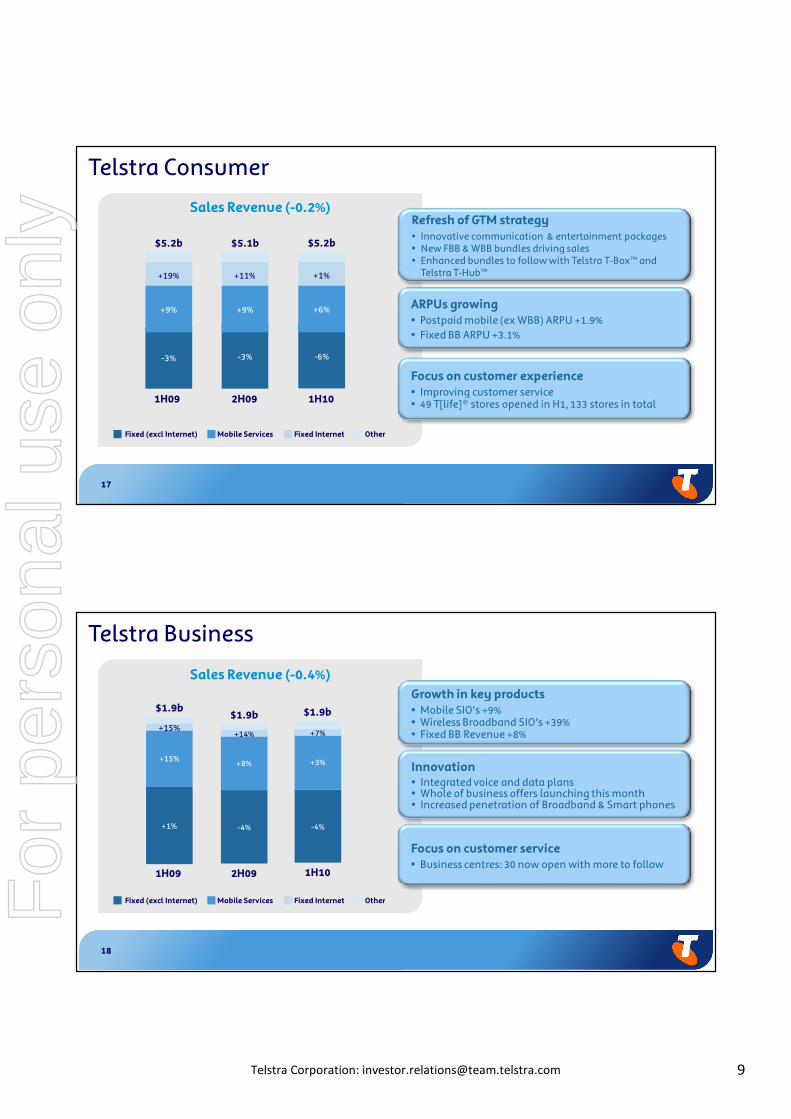
Telstra Consumer
Refresh of GTM strategy• Innovative communication & entertainment packages• New FBB & WBB bundles driving sales• Enhanced bundles to follow with Telstra T-Box™ and
Telstra T-Hub™
ARPUs growing• Postpaid mobile (ex WBB) ARPU +1.9%• Fixed BB ARPU +3.1%
Focus on customer experience• Improving customer service• 49 T[life]® stores opened in H1, 133 stores in total
Sales Revenue (-0.2%)
1H09 2H09
$5.2b
-3%
+19%
+9%
$5.1b
-3%
+11%
+9%
Fixed InternetMobile ServicesFixed (excl Internet) Other
1H10
$5.2b
-6%
+1%
+6%
18
Telstra Business
Sales Revenue (-0.4%)
1H09
$1.9b
+15%
+15%
+1%
2H09
$1.9b
+8%
+14%
-4%
1H10
$1.9b
-4%
+3%
+7%
Fixed InternetMobile ServicesFixed (excl Internet) Other
Growth in key products• Mobile SIO’s +9%• Wireless Broadband SIO’s +39%• Fixed BB Revenue +8%
Innovation• Integrated voice and data plans• Whole of business offers launching this month• Increased penetration of Broadband & Smart phones
Focus on customer service• Business centres: 30 now open with more to follow
For
per
sona
l use
onl
y
10Telstra Corporation: [email protected]
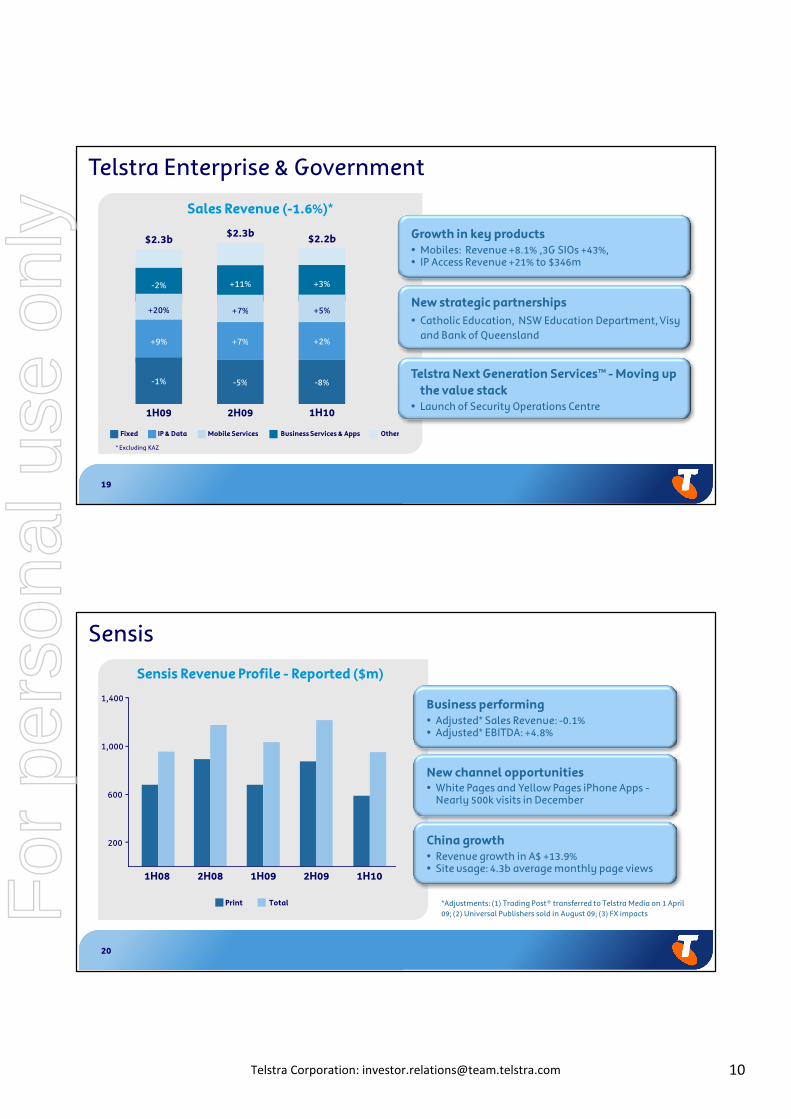
19
Growth in key products• Mobiles: Revenue +8.1% ,3G SIOs +43%,• IP Access Revenue +21% to $346m
New strategic partnerships
• Catholic Education, NSW Education Department, Visyand Bank of Queensland
Telstra Next Generation Services™ - Moving upthe value stack
• Launch of Security Operations Centre
Telstra Enterprise & Government
Sales Revenue (-1.6%)*
* Excluding KAZ
1H09 2H09
$2.3b
-2%
+20%
$2.3b
+11%
+7%
+7%
-5%
+9%
-1%
1H10
$2.2b
+3%
+5%
+2%
-8%
Mobile ServicesIP & DataFixed OtherBusiness Services & Apps
20
Sensis
Sensis Revenue Profile - Reported ($m)
Business performing• Adjusted* Sales Revenue: -0.1%• Adjusted* EBITDA: +4.8%
New channel opportunities• White Pages and Yellow Pages iPhone Apps -
Nearly 500k visits in December
China growth• Revenue growth in A$ +13.9%• Site usage: 4.3b average monthly page views
TotalPrint
200
600
1,000
1,400
1H08 2H08 1H09 2H09 1H10
*Adjustments: (1) Trading Post® transferred to Telstra Media on 1 April09; (2) Universal Publishers sold in August 09; (3) FX impactsF
or p
erso
nal u
se o
nly
11Telstra Corporation: [email protected]
21
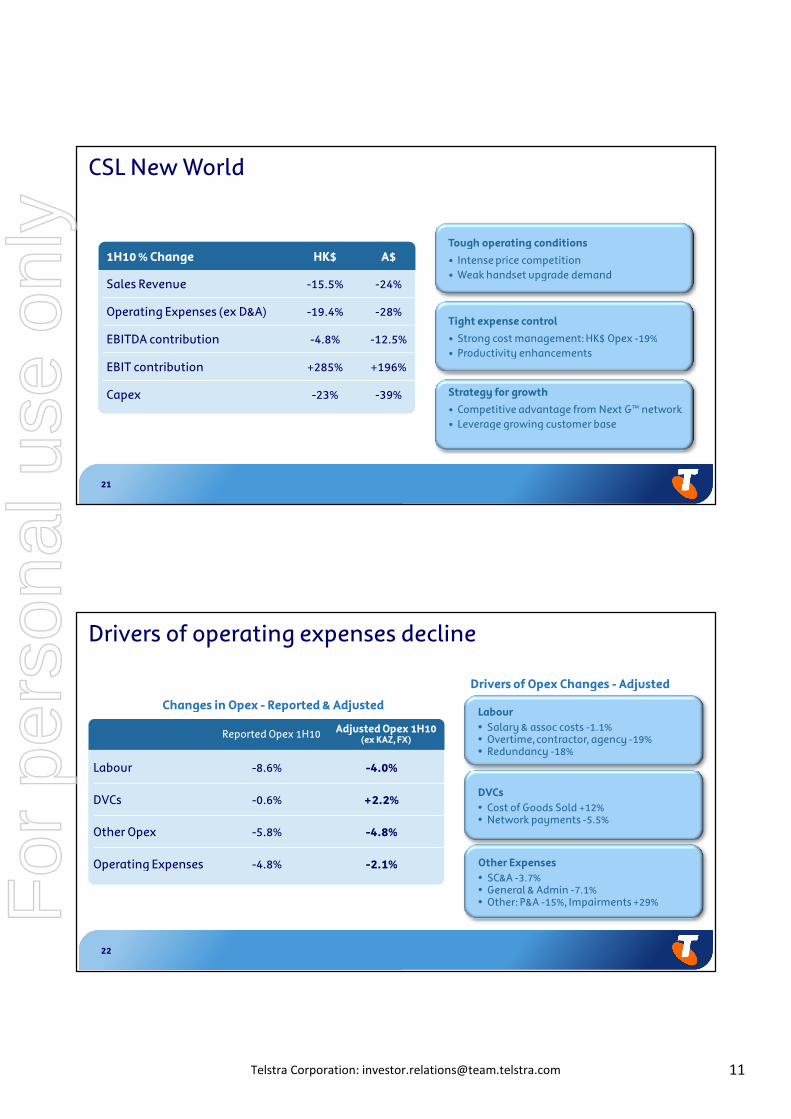
Tough operating conditions
• Intense price competition• Weak handset upgrade demand
Tight expense control
• Strong cost management: HK$ Opex -19%• Productivity enhancements
Strategy for growth
• Competitive advantage from Next G™ network• Leverage growing customer base
CSL New World
1H10 % Change HK$ A$
Sales Revenue -15.5% -24%
Operating Expenses (ex D&A) -19.4% -28%
EBITDA contribution -4.8% -12.5%
EBIT contribution +285% +196%
Capex -23% -39%
22
Reported Opex 1H10 Adjusted Opex 1H10(ex KAZ, FX)
Labour -8.6% -4.0%
DVCs -0.6% +2.2%
Other Opex -5.8% -4.8%
Operating Expenses -4.8% -2.1%
Labour• Salary & assoc costs -1.1%• Overtime,contractor, agency -19%• Redundancy -18%
DVCs• Cost of Goods Sold +12%• Network payments -5.5%
Other Expenses• SC&A -3.7%• General & Admin -7.1%• Other: P&A -15%, Impairments +29%
Drivers of operating expenses decline
Changes in Opex - Reported & Adjusted
Drivers of Opex Changes - Adjusted
For
per
sona
l use
onl
y
12Telstra Corporation: [email protected]
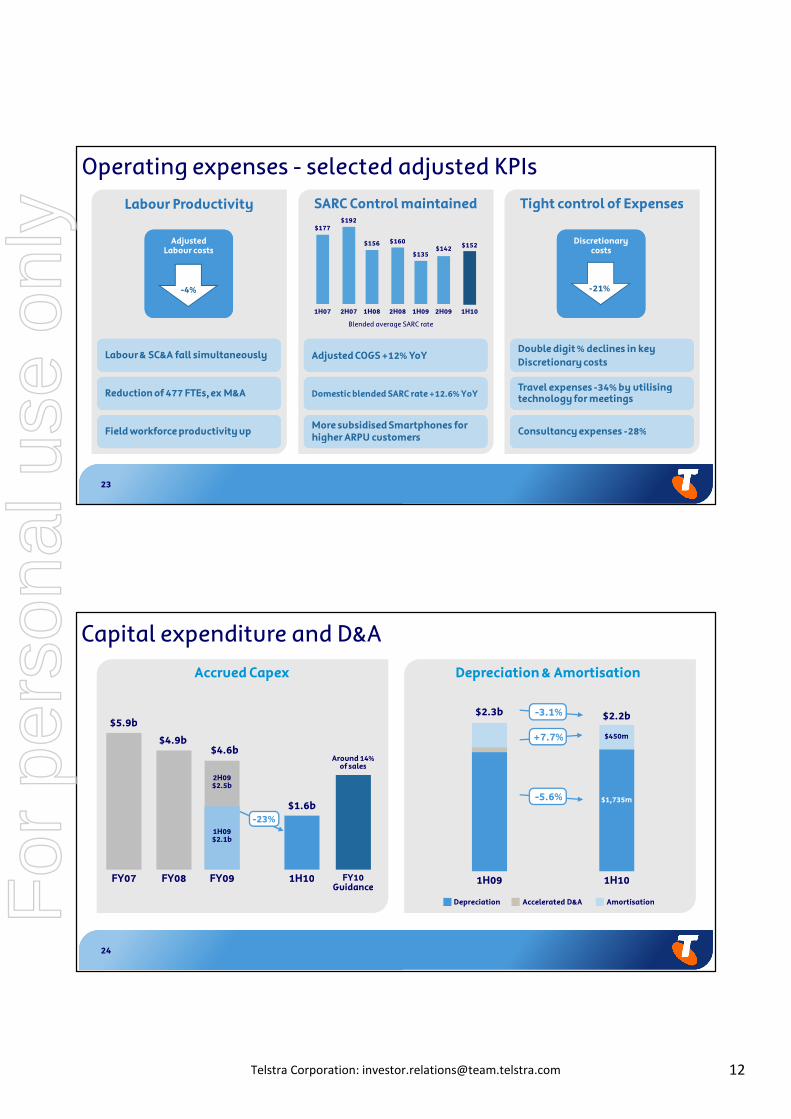
23
Discretionarycosts
Double digit % declines in keyDiscretionary costsDouble digit % declines in keyDiscretionary costs
Travel expenses -34% by utilisingtechnology for meetingsTravel expenses -34% by utilisingtechnology for meetings
Consultancy expenses -28%Consultancy expenses -28%
Adjusted COGS +12% YoYAdjusted COGS +12% YoY
Domestic blended SARC rate +12.6% YoYDomestic blended SARC rate +12.6% YoY
More subsidised Smartphones forhigher ARPU customersMore subsidised Smartphones forhigher ARPU customers
Operating expenses - selected adjusted KPIsSARC Control maintained
1H07 2H07 1H08 2H08 1H09 2H09 1H10
$177$192
$156 $160
$135$142 $152
Tight control of ExpensesLabour Productivity
-4%
AdjustedLabour costs
-21%
Labour & SC&A fall simultaneouslyLabour & SC&A fall simultaneously
Reduction of 477 FTEs,ex M&AReduction of 477 FTEs,ex M&A
Field workforce productivity upField workforce productivity up
Blended average SARC rate
24
Capital expenditure and D&A
FY09FY08
$4.6b$4.9b
FY07
$5.9b
Accrued Capex
FY10Guidance
$1.6b
1H10
Around 14%of sales
1H09$2.1b
2H09$2.5b
-23%
1H101H09
$2.2b$2.3b
Accelerated D&ADepreciation Amortisation
Depreciation & Amortisation
-3.1%
+7.7%
-5.6% $1,735m
$450m
For
per
sona
l use
onl
y
13Telstra Corporation: [email protected]
25
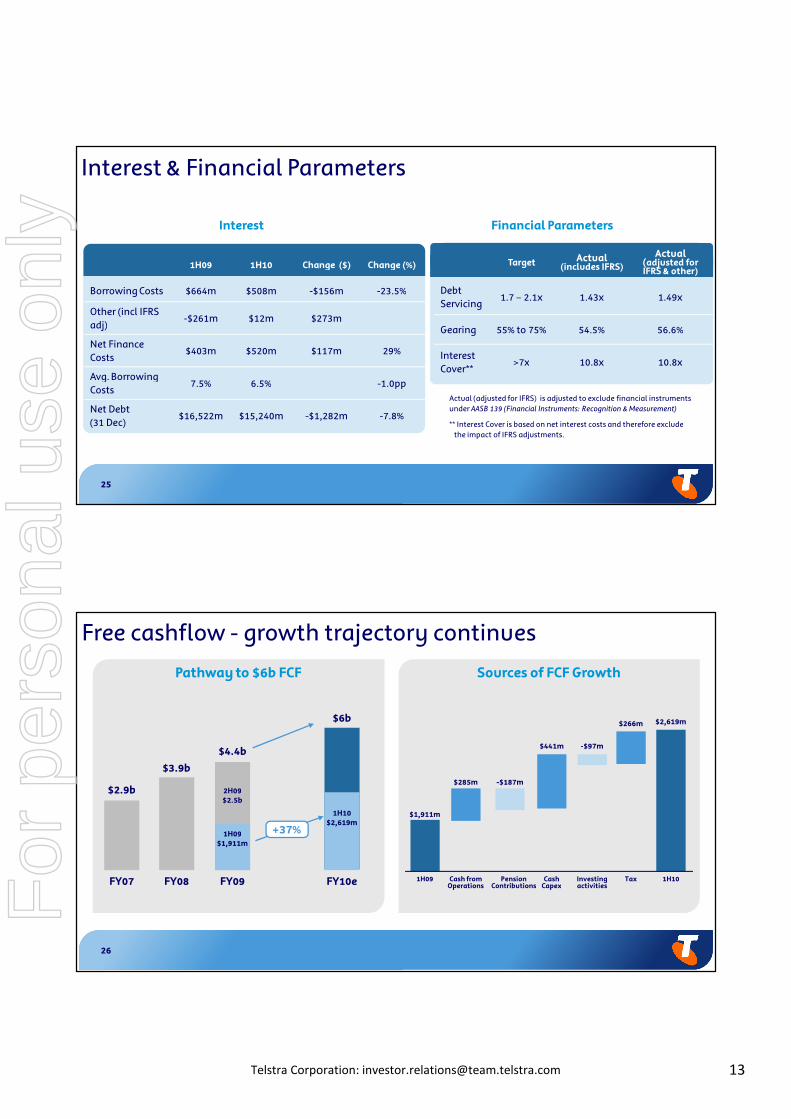
Interest & Financial Parameters
Financial Parameters
Target Actual(includes IFRS)
Actual(adjusted forIFRS & other)
DebtServicing
1.7 – 2.1x 1.43x 1.49x
Gearing 55% to 75% 54.5% 56.6%
InterestCover**
>7x 10.8x 10.8x
Interest
1H09 1H10 Change ($) Change (%)
Borrowing Costs $664m $508m -$156m -23.5%
Other (incl IFRSadj)
-$261m $12m $273m
Net FinanceCosts
$403m $520m $117m 29%
Avg. BorrowingCosts
7.5% 6.5% -1.0pp
Net Debt(31 Dec)
$16,522m $15,240m -$1,282m -7.8%
Actual (adjusted for IFRS) is adjusted to exclude financial instrumentsunder AASB 139 (Financial Instruments: Recognition & Measurement)
** Interest Cover is based on net interest costs and therefore excludethe impact of IFRS adjustments.
26
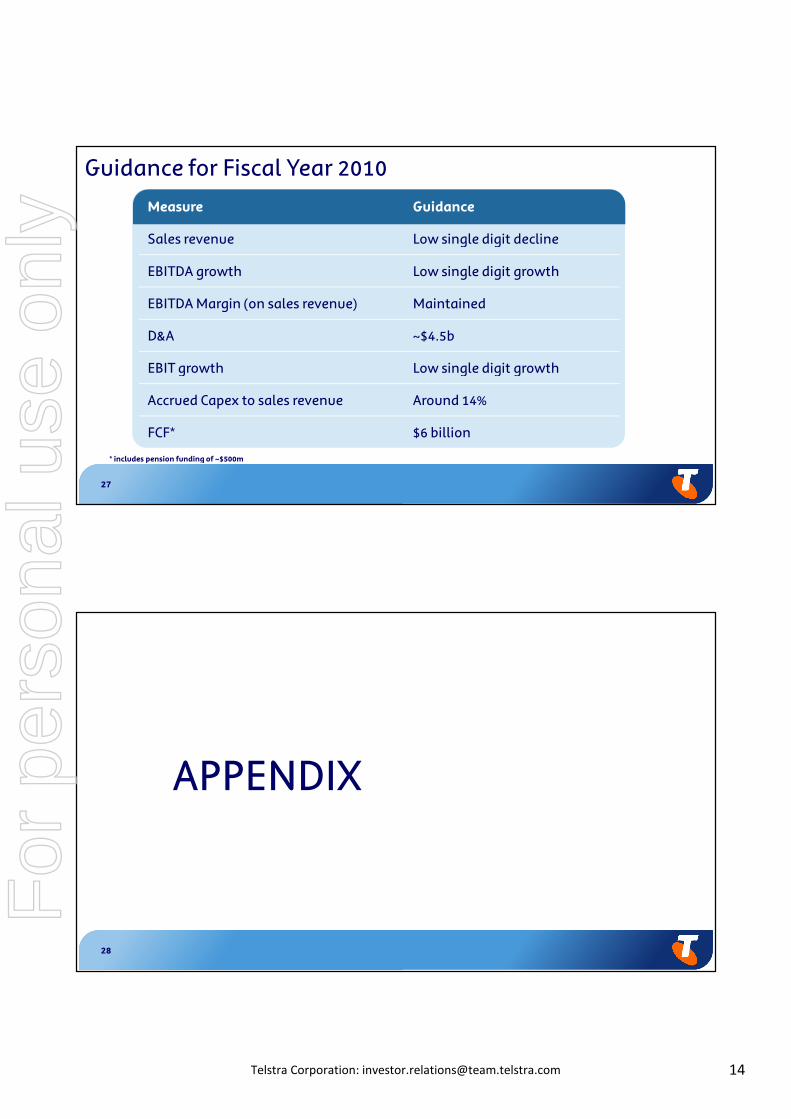
Pathway to $6b FCF Sources of FCF Growth
Free cashflow - growth trajectory continues
FY10eFY09FY08FY07
$6b
$3.9b
$2.9b
$4.4b
+37%1H09$1,911m
2H09$2.5b
1H10$2,619m
$1,911m
$285m -$187m
$441m -$97m
$266m $2,619m
Cash fromOperations
PensionContributions
CashCapex
Investingactivities
Tax 1H101H09For
per
sona
l use
onl
y
14Telstra Corporation: [email protected]
27
Guidance for Fiscal Year 2010
Measure Guidance
Sales revenue Low single digit decline
EBITDA growth Low single digit growth
EBITDA Margin (on sales revenue) Maintained
D&A ~$4.5b
EBIT growth Low single digit growth
Accrued Capex to sales revenue Around 14%
FCF* $6 billion
* includes pension funding of ~$500m
28
APPENDIX
For
per
sona
l use
onl
y
15Telstra Corporation: [email protected]
29
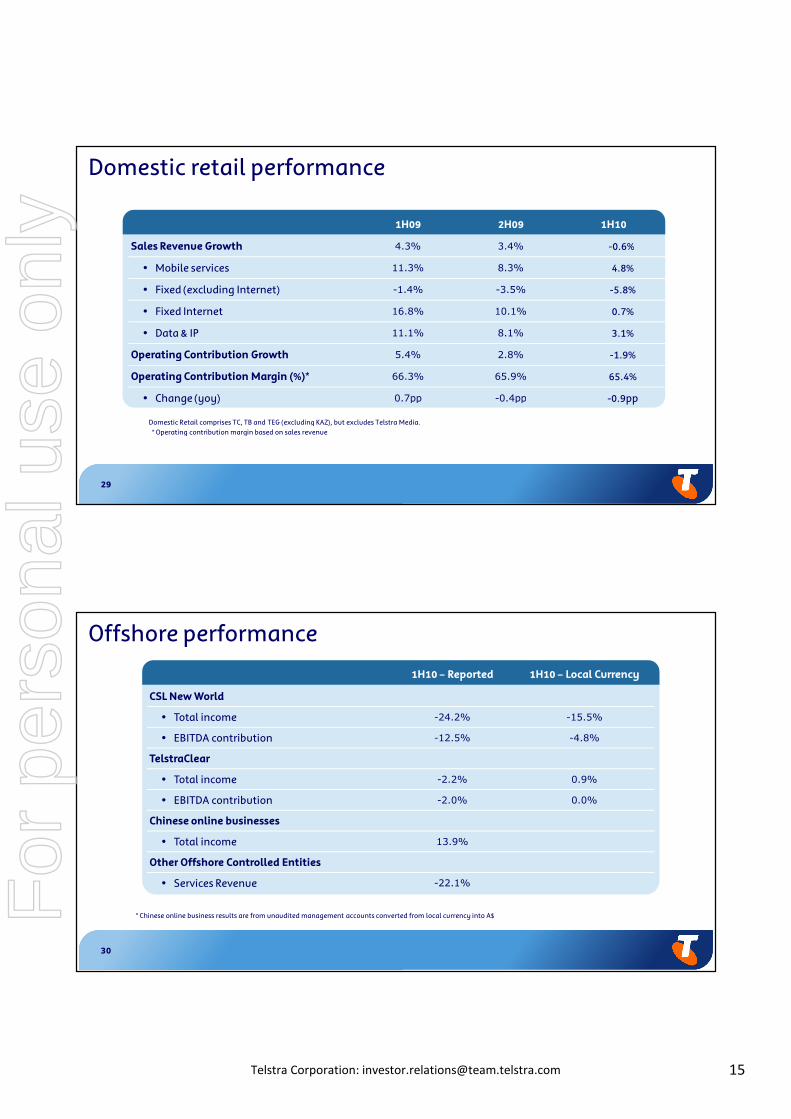
Domestic retail performance
1H09 2H09 1H10
Sales Revenue Growth 4.3% 3.4% -0.6%
• Mobile services 11.3% 8.3% 4.8%
• Fixed (excluding Internet) -1.4% -3.5% -5.8%
• Fixed Internet 16.8% 10.1% 0.7%
• Data & IP 11.1% 8.1% 3.1%
Operating Contribution Growth 5.4% 2.8% -1.9%
Operating Contribution Margin (%)* 66.3% 65.9% 65.4%
• Change (yoy) 0.7pp -0.4pp -0.9pp
Domestic Retail comprises TC, TB and TEG (excluding KAZ), but excludes Telstra Media.* Operating contribution margin based on sales revenue
30
Offshore performance
1H10 – Reported 1H10 – Local Currency
CSL New World
• Total income -24.2% -15.5%
• EBITDA contribution -12.5% -4.8%
TelstraClear
• Total income -2.2% 0.9%
• EBITDA contribution -2.0% 0.0%
Chinese online businesses
• Total income 13.9%
Other Offshore Controlled Entities
• Services Revenue -22.1%
* Chinese online business results are from unaudited management accounts converted from local currency into A$For
per
sona
l use
onl
y
16Telstra Corporation: [email protected]
31
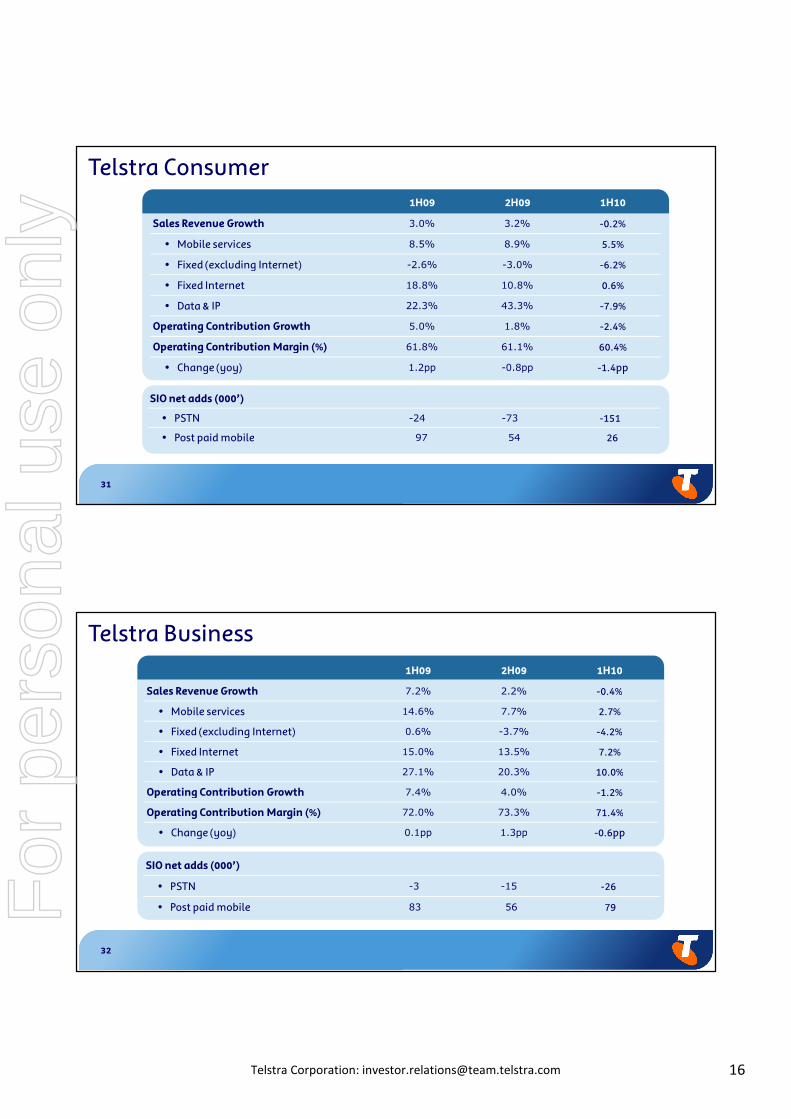
1H09 2H09 1H10
Sales Revenue Growth 3.0% 3.2% -0.2%
• Mobile services 8.5% 8.9% 5.5%
• Fixed (excluding Internet) -2.6% -3.0% -6.2%
• Fixed Internet 18.8% 10.8% 0.6%
• Data & IP 22.3% 43.3% -7.9%
Operating Contribution Growth 5.0% 1.8% -2.4%
Operating Contribution Margin (%) 61.8% 61.1% 60.4%
• Change (yoy) 1.2pp -0.8pp -1.4pp
SIO net adds (000’)
• PSTN -24 -73 -151
• Post paid mobile 97 54 26
Telstra Consumer
32
Telstra Business1H09 2H09 1H10
Sales Revenue Growth 7.2% 2.2% -0.4%
• Mobile services 14.6% 7.7% 2.7%
• Fixed (excluding Internet) 0.6% -3.7% -4.2%
• Fixed Internet 15.0% 13.5% 7.2%
• Data & IP 27.1% 20.3% 10.0%
Operating Contribution Growth 7.4% 4.0% -1.2%
Operating Contribution Margin (%) 72.0% 73.3% 71.4%
• Change (yoy) 0.1pp 1.3pp -0.6pp
SIO net adds (000’)
• PSTN -3 -15 -26
• Post paid mobile 83 56 79For
per
sona
l use
onl
y
17Telstra Corporation: [email protected]
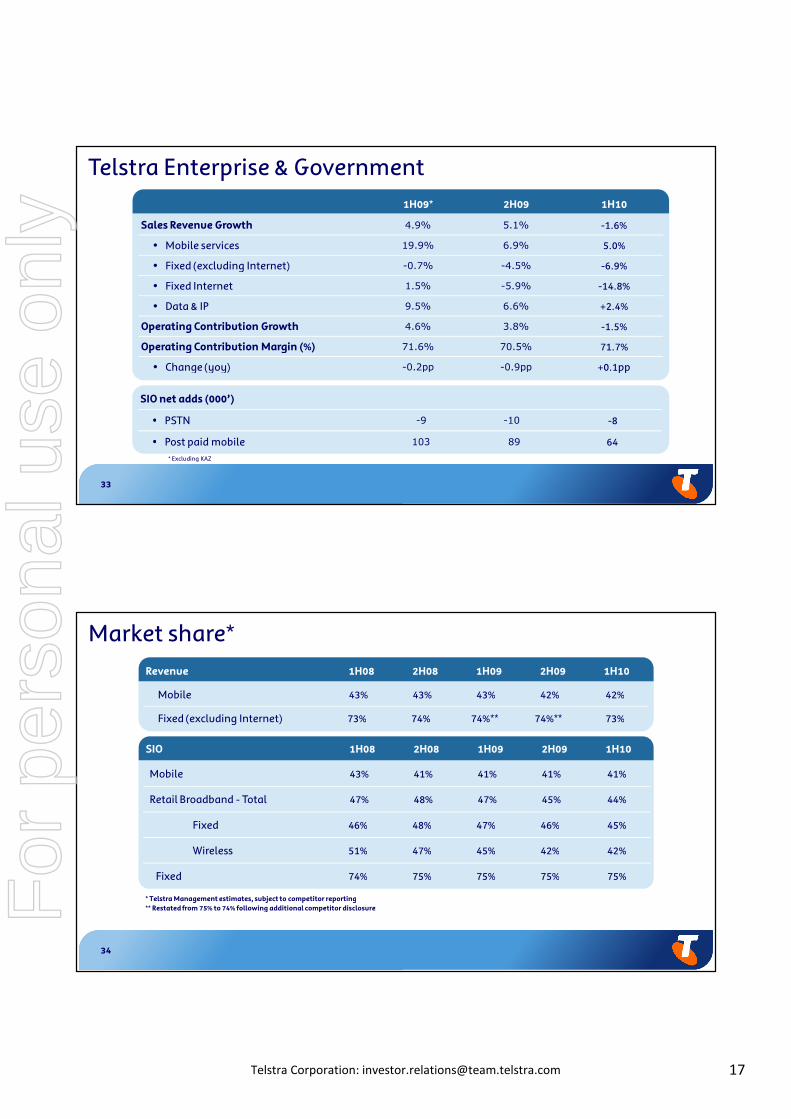
33
1H09* 2H09 1H10
Sales Revenue Growth 4.9% 5.1% -1.6%
• Mobile services 19.9% 6.9% 5.0%
• Fixed (excluding Internet) -0.7% -4.5% -6.9%
• Fixed Internet 1.5% -5.9% -14.8%
• Data & IP 9.5% 6.6% +2.4%
Operating Contribution Growth 4.6% 3.8% -1.5%
Operating Contribution Margin (%) 71.6% 70.5% 71.7%
• Change (yoy) -0.2pp -0.9pp +0.1pp
SIO net adds (000’)
• PSTN -9 -10 -8
• Post paid mobile 103 89 64
Telstra Enterprise & Government
* Excluding KAZ
34
Market share*
SIO 1H08 2H08 1H09 2H09 1H10
Mobile 43% 41% 41% 41% 41%
Retail Broadband - Total 47% 48% 47% 45% 44%
Fixed 46% 48% 47% 46% 45%
Wireless 51% 47% 45% 42% 42%
Fixed 74% 75% 75% 75% 75%
Revenue 1H08 2H08 1H09 2H09 1H10
Mobile 43% 43% 43% 42% 42%
Fixed (excluding Internet) 73% 74% 74%** 74%** 73%
* Telstra Management estimates, subject to competitor reporting** Restated from 75% to 74% following additional competitor disclosureF
or p
erso
nal u
se o
nly
18Telstra Corporation: [email protected]
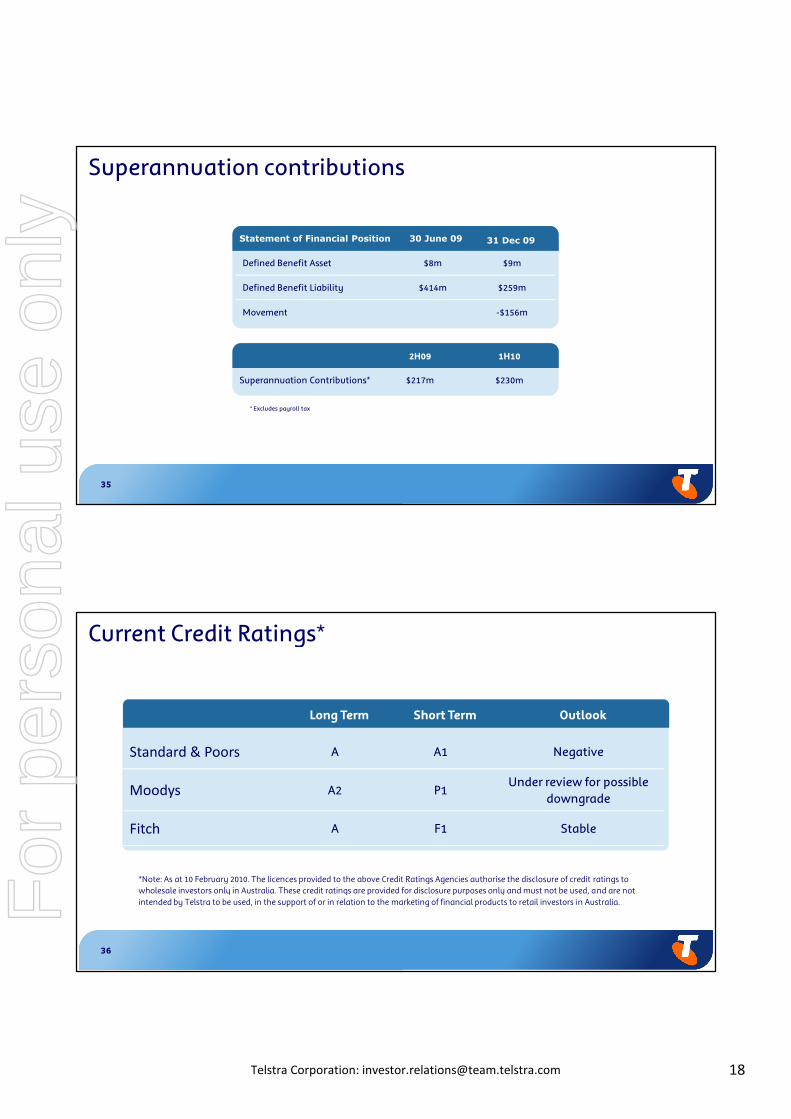
35
Superannuation contributions
Statement of Financial Position 30 June 09 31 Dec 09
Defined Benefit Asset $8m $9m
Defined Benefit Liability $414m $259m
Movement -$156m
2H09 1H10
Superannuation Contributions* $217m $230m
* Excludes payroll tax
36
Long Term Short Term Outlook
Standard & Poors A A1 Negative
Moodys A2 P1Under review for possible
downgrade
Fitch A F1 Stable
Current Credit Ratings*
*Note: As at 10 February 2010. The licences provided to the above Credit Ratings Agencies authorise the disclosure of credit ratings towholesale investors only in Australia. These credit ratings are provided for disclosure purposes only and must not be used, and are notintended by Telstra to be used, in the support of or in relation to the marketing of financial products to retail investors in Australia.F
or p
erso
nal u
se o
nly