Embed Size (px)
Citation preview
UNIVERSIDADE FEDERAL DO RIO GRANDE DO SULINSTITUTO DE INFORMÁTICA
PROGRAMA DE PÓS-GRADUAÇÃO EM COMPUTAÇÃO
VINICIUS WOLOSZYN
Tell Me Why: an architecture to providerich review explanations
Thesis presented in partial fulfillmentof the requirements for the degree ofMaster of Computer Science
Advisor: Prof. PhD Dante Augusto Couto Barone
Porto AlegreJuly 2015
CIP — CATALOGING-IN-PUBLICATION
Woloszyn, Vinicius
Tell Me Why: an architecture to provide rich review expla-nations / Vinicius Woloszyn. – Porto Alegre: PPGC da UFRGS,2015.
101 f.: il.
Thesis (Master) – Universidade Federal do Rio Grande do Sul.Programa de Pós-Graduação em Computação, Porto Alegre, BR–RS, 2015. Advisor: Dante Augusto Couto Barone.
1. Opinion Mining. 2. Data Mining. 3. Natural Language Pro-cessing. 4. Natural Language Generation. 5. Big Data. I. AugustoCouto Barone, Dante. II. Título.
UNIVERSIDADE FEDERAL DO RIO GRANDE DO SULReitor: Prof. Carlos Alexandre NettoVice-Reitor: Prof. Rui Vicente OppermannPró-Reitor de Pós-Graduação: Prof. Vladimir Pinheiro do NascimentoDiretor do Instituto de Informática: Prof. Luis da Cunha LambCoordenador do PPGC: Prof. Luigi CarroBibliotecária-chefe do Instituto de Informática: Beatriz Regina Bastos Haro

ACKNOWLEDGEMENTS
I would like to express my deepest gratitude to my advisor, Prof. Dante Couto Barone,
for all his comments and helps for this research. He always supported me and gave me a lot
of inspiration of research. I also want to thank Sihem Amer-Yahia, François Portet and Cyril
Labbe from Grenoble Informatics Laboratory, whose have invested their effort in guiding me
within the purpose of the development of the Tell Me Why. Without their considerate guidance,
this thesis could not be done.
Gostaria de agradecer aos meus pais Cláudio Woloszyn e Elizabeth Valim por todo o
carinho e dedicação ao longo dos anos. Tais pessoas são um exemplo de caráter e simplicidade
que eu quero seguir. Vocês estão sempre em meus pensamentos. Muito Obrigado.
Existe também uma pessoa a qual eu tenho muito carinho que me apoiou muito durante
o desenvolvimento desse trabalho. Esse carinho e dedicação, mesmo que as vezes a distância,
me ajudou ao cumprimento dos meus objetivos. Bianca Lagasse, eu te amo.

The scientific man does not aim at an immediate result. He does not expect that his
advanced ideas will be readily taken up. His work is like that of the planter - for the
future. His duty is to lay the foundation for those who are to come, and point the way.
— NIKOLA TESLA

ABSTRACT
What other people think has been always an important part of the process of decision-making.
For instance, people usually consult their friends to get an opinion about a book, or a movie or
a restaurant. Nowadays, users publish their opinions on collaborative reviewing sites such as
IMDB for movies, Yelp for restaurants and TripAdvisor for hotels. Over the time, these sites
have built a massive database that connects users, items and opinions expressed by a numeric
rating and a free text review that explain why they like or dislike a specific item. But this vast
amount of data can hamper the user to get an opinion.
Several related work provide a review interpretations to the users. They offer different advan-
tages for various types of summaries. However, they all have the same limitation: they do not
provide personalized summaries nor contrasting reviews written by different segments of re-
viewers. Understanding and contrast reviews written by different segments of reviewers is still
an open research problem.
Our work proposes a new architecture, called Tell Me Why, which is a project developed at
Grenoble Informatics Laboratory in cooperation with Federal University of Rio Grande do Sul
to provide users a better understanding of reviews. We propose a combination of text analysis
from reviews with mining structured data resulting from crossing reviewer and item dimensions.
Additionally, this work performs an investigation of summarization methods utilized in review
domain.
The output of our architecture consists of personalized statement using Natural Language Gen-
eration that explain people’s opinion about a particular item. The evaluation reveal that it is a
promising approach and useful in user’s opinion.
Keywords: Opinion Mining. Data Mining. Natural Language Processing. Natural Language
Generation. Big Data.

Tell My Why: Uma arquitetura para fornecer explicações ricas sobre revisões.
RESUMO
O que as outras pessoas pensam sempre foi uma parte importante do processo de tomada de
decisão. Por exemplo, as pessoas costumam consultar seus amigos para obter um parecer sobre
um livro ou um filme ou um restaurante. Hoje em dia, os usuários publicam suas opiniões em
sites de revisão colaborativa, como IMDB para filmes, Yelp para restaurantes e TripAdiviser
para hotéis. Ao longo do tempo, esses sites têm construído um enorme banco de dados que
conecta usuários, artigos e opiniões expressas por uma classificação numérica e um comentário
de texto livre que explicam por que eles gostam ou não gostam de um item. Mas essa vasta
quantidade de dados pode prejudicar o usuário a obter uma opinião.
Muitos trabalhos relacionados fornecem uma interpretações de revisões para os usuários. Eles
oferecem vantagens diferentes para vários tipos de resumos. No entanto, todos eles têm a
mesma limitação: eles não fornecem resumos personalizados nem contrastantes comentários
escritos por diferentes segmentos de colaboradores.
Compreeder e contrastar comentários escritos por diferentes segmentos de revisores ainda é um
problema de pesquisa em aberto. Assim, nosso trabalho propõe uma nova arquitetura, chamado
Tell Me Why. TMW é um projeto desenvolvido no Laboratório de Informática Grenoble em
cooperação com a Universidade Federal do Rio Grande do Sul para fornecer aos usuários uma
melhor compreensão dos comentários. Propomos uma combinação de análise de texto a partir
de comentários com a mineração de dados estruturado resultante do cruzamento de dimensões
do avaliador e item. Além disso, este trabalho realiza uma investigação sobre métodos de
sumarização utilizados na revisão de produtos.
A saída de nossa arquitetura consiste em declarações personalizadas de texto usando Geração
de Linguagem Natural composto por atributos de itens e comentários resumidos que explicam
a opinião das pessoas sobre um determinado assunto. Os resultados obtidos a partir de uma
avaliação comparativa com a Revisão Mais Útil da Amazon revelam que é uma abordagem
promissora e útil na opinião do usuário.
Palavras-chave: Mineração de Opinião, Mineração de Dados, Processamento de Linguagem
Natural, Geração de Linguagem Natural,Volumes Massivos de Dados.

LIST OF ABBREVIATIONS AND ACRONYMS
TMW Tell Me Why
LIG Grenoble Informatics Laboratory
NLP Natural Language Processing
POS Part of speech
WSD Word Sense Disambiguation
NLG Natural Language Generation
API Application Programming Interface
ATS Automatic text summarization
TF-IDF Term Frequency - Inverse Document Frequency
DUC Document Understanding Conference
ANN Artificial Neural Network
LSA Latent Semantic Analysis
SVD Singular Value Decomposition
PCA Principal Component Analysis
QA Question Answering
ROUGE Recall-Oriented Understudy for Gisting Evaluation
KDD Knowledge Discovery in Databases
BBN Bayesian Belief Networks
DAG Directed Acyclic Graph
AMHR Amazong Most Helpful Review

LIST OF FIGURES
Figure 1.1 Two reviews about the restaurant "The Wolseley" extracted from Yelp. Theblue underline marks feature opinions, and the yellow underline marks contextualinformation....................................................................................................................... 12
Figure 2.1 A dependency tree .................................................................................................. 17Figure 2.2 Quotation location within document ...................................................................... 25Figure 2.3 Three-layer Artificial Neural Network ................................................................... 33Figure 2.4 Decision Tree of the play tennis problem............................................................... 34
Figure 3.1 Visualization of an aspect summary ....................................................................... 40Figure 3.2 The RnR system output .......................................................................................... 41
Figure 4.1 TMW1 Architecture ............................................................................................... 49Figure 4.2 TMW Personalised Summary................................................................................. 51
Figure 5.1 Sentence Extraction module ................................................................................... 54
Figure 6.1 Gender distribution and Age histogram of the population. .................................... 61Figure 6.2 Who reads reviews before watching a movie? ....................................................... 62Figure 6.3 Comparative evaluation between AMHR and TMW non-personalized summary . 63Figure 6.4 Comparative evaluation between AMHR and TMW personalized summary ........ 64Figure 6.5 TMW personalized summary helpfulness .............................................................. 65Figure 6.6 Understanding of the TMW summary.................................................................... 66Figure 6.7 Who would use TMW ............................................................................................ 67Figure 6.8 Who reads reviews before watching a movie? ....................................................... 70Figure 6.9 People’s preference between AMHR and TMW2.................................................. 71Figure 6.10 TMW2 summary helpfulness ............................................................................... 71Figure 6.11 Understanding of the TMW2 summary................................................................ 72Figure 6.12 Who would like to use TMW2 to get an opinion. ................................................ 73Figure 6.13 People’s opinion about the length of the sentences .............................................. 74Figure 6.14 People’s opinion about the number of sentences.................................................. 74Figure 6.15 Precision and Recall ............................................................................................. 76Figure 6.16 Comparative evaluation of TMW1 and TMW2.................................................... 78Figure 6.17 Intrinsic evaluation between TMW1, TMW2, and baseline................................. 78
Figure 7.1 TMW1 comparative evaluation form...................................................................... 97Figure 7.2 TMW1 comparative evaluation form...................................................................... 98Figure 7.3 The TMW prototype’s main screen ....................................................................... 99Figure 7.4 Prototype presenting the TMW2’s summary.......................................................... 99Figure 7.5 The prototype showing the AMHR ...................................................................... 100Figure 7.6 TMW2 comparative evaluation form.................................................................... 101

CONTENTS
1 INTRODUCTION................................................................................................................ 111.1 Problem Statement and Related Work Limitation ....................................................... 121.2 Proposed Solution and Contributions ............................................................................ 131.3 Thesis Structure ............................................................................................................... 142 BACKGROUND................................................................................................................... 152.1 Natural Language Processing ......................................................................................... 152.2 Natural Language Generation ........................................................................................ 172.2.1 SimpleNLG..................................................................................................................... 172.3 Automatic Text Summarization...................................................................................... 182.3.1 Extractive summarization methods................................................................................. 192.3.2 Features for extractive summarization ............................................................................ 242.4 Evaluation methods of Automatic Text Summarization ............................................. 262.4.1 Extrinsic Evaluation........................................................................................................ 272.4.2 Intrinsic Evaluation ......................................................................................................... 272.5 Machine Learning............................................................................................................ 312.5.1 Overview......................................................................................................................... 312.5.2 Machine Learning techniques ......................................................................................... 312.6 Final Remarks .................................................................................................................. 343 RELATED WORK .............................................................................................................. 363.1 Overview ........................................................................................................................... 363.2 Aspect-based Opinion Summarization .......................................................................... 373.2.1 Aspect identification ....................................................................................................... 373.2.2 Sentiment Orientation ..................................................................................................... 383.2.3 Summary Generation ...................................................................................................... 393.3 Non-aspect-based Opinion Summarization................................................................... 413.3.1 Basic Sentiment Summarization ..................................................................................... 423.3.2 Text Summarization ........................................................................................................ 423.3.3 Visualization ................................................................................................................... 433.4 Final Remarks .................................................................................................................. 434 TELL ME WHY ARCHITECTURE................................................................................. 484.1 Architecture Overview..................................................................................................... 484.2 Data retrieval.................................................................................................................... 494.3 Abstraction ....................................................................................................................... 494.4 Macro Planning................................................................................................................ 504.5 Sentence Extraction ......................................................................................................... 514.6 Surface Realization .......................................................................................................... 515 EXPERIMENT DESIGN .................................................................................................... 525.1 Dataset............................................................................................................................... 525.2 Experiments...................................................................................................................... 545.2.1 Input and Output of Sentence Extraction module........................................................... 555.2.2 Experiment 1: Statistical-based method for Sentence Extraction .................................. 555.2.3 Experiment 2: Graph-based method for Sentence Extraction ........................................ 555.3 Evaluation Strategy ......................................................................................................... 565.3.1 Comparative Evaluation.................................................................................................. 575.3.2 Intrinsic Evaluation ......................................................................................................... 575.4 Threats to Validity ........................................................................................................... 58

6 RESULTS.............................................................................................................................. 616.1 Experiment 1: Statistical-based method for sentence extraction ................................ 616.1.1 Comparative Evaluation.................................................................................................. 616.1.2 Intrinsic evaluation.......................................................................................................... 676.1.3 Discussion ...................................................................................................................... 686.2 Experiment 2: Graph-based method for sentence extraction...................................... 696.2.1 Comparative evaluation................................................................................................... 706.2.2 Intrinsic Evaluation ........................................................................................................ 756.2.3 Discussion ....................................................................................................................... 766.3 Comparison between TMW1 and TMW2 ..................................................................... 777 CONCLUSION AND FUTURE WORK ........................................................................... 807.1 Contributions.................................................................................................................... 817.2 Future work...................................................................................................................... 82REFERENCES........................................................................................................................ 84APPENDIX A - COMPLEMENTARY RESULTS .............................................................. 90APPENDIX B - FORMS ........................................................................................................ 977.3 Experiment 1: Statistical-based method for sentence extraction ................................ 977.4 Experiment 2: Graph-based method for sentence extraction...................................... 98

11
1 INTRODUCTION
Getting information about what other people think has always been involved in the pro-
cess of decision-making. For instance, people usually consult their friends to get an opinion
about a book, or a movie or a restaurant. Nowadays, users publish their opinions on collab-
orative reviewing sites such as IMDB1 for movies, Yelp2 for restaurants and TripAdvisor3 for
hotels. These sites allow users to write comments about a determined product and also to see
what other users wrote about it before decide buying something or watching a movie. Over the
time, these sites have built a massive database that connects users, items and opinions expressed
by a numeric rating and a free text review that explain why they like or dislike an item.
The review also plays an important part in purchasing decisions of the products over
the Internet. Empirical studies of the consumers’ behavior show the impact of positive reviews
into the consumers purchasing decision about a product (CHATTERJEE, 2001; CHEVALIER;
MAYZLIN, 2006; KIM; SRIVASTAVA, 2007). Unfortunately, to get a suitable opinion from
this mass of data, users have to deal with a vast amount of textual information. Precisely, they
have to deal with the problem of a huge mass of divergent reviews about an item and its aspects,
in order to extract a suitable opinion from them. Aspects generally refer to features that are
relevant to all products. From the exposed problem, we derive four major sub-problems: (i)
divergence of opinions in which a significant part of the users approve while the other part
disapproves the same item; (ii) user’s personal relevance of the aspect of an item to getting
an opinion. Some aspects such as "price" and "service" can be more relevant than others for
different users at the time they seek for an opinion about an item; (iii) large number of highly
redundant opinions; and (iv) too many information about an item, such as a thousand of reviews.
For instance, Figure 1.1 presents two reviews extracted from Yelp about the restaurant
called "The Wolseley," located in London. Looking at the text review, we can observe more
than just the reasons for the different ratings. It presents a contradictory opinion about same
aspects, such as Service "excellent" and "dismissive"; food is "amazing" and "unimpressive".
Additionally, the reviews reveal contextual information about the conditions that an item or its
feature was observed. For instance, in the sentence "I booked for brunch just to be sure", the
context "brunch" would explain a negative opinion about food. In the sentence "My favorite spot
for breakfast in London", the context "breakfast" would explain the positive opinion about the
food. Such kind of contextual information gives valuable information about the user conditions
1http://www.imdb.com/2http://www.yelp.com/3http://www.TripAdvisor.com/

12
of the item at the time when it was observed.
Figure 1.1 – Two reviews about the restaurant "The Wolseley" extracted from Yelp. The blue underlinemarks feature opinions, and the yellow underline marks contextual information
Source: Developed by Author
In the sequence, Section 1.1 presents the problem that we are addressing and the lim-
itations of related work. In Section 1.2, we present the proposed solution and the expected
contributions. Finally, Section 1.3 shows the structure of this dissertation.
1.1 Problem Statement and Related Work Limitation
Given the importance of the reviews and the problems that users have in order to extract
a suitable opinion from them, this proposed research focuses on digesting mix of reviews and
provides a personalized summary. Regarding Review Summarization domain, several related
work are involved to provide review interpretations. All the previous approaches offer different
advantages for various types of summaries. These related studies are detailed below.
Abstractive summarization builds an internal semantic representation from a source doc-
ument(s) to create a totally new text. Ganesan, Zhai and Han (2010) proposed the use of textual
graphs representation to generate abstractive summaries (GANESAN; ZHAI; HAN, 2010). Ad-
ditionally, the Opinion Digger uses free text review, numeric rating and a set of predefined as-
pects to provide comparisons of different aspects of products (MOGHADDAM; ESTER, 2010).
In the other hand, extractive summaries are built by extracting the most relevant sen-
tences based on statistical analysis of the words frequency or of the occurrence of some fea-
tures. The RnR system (LABBE et al., 2010) captures and summarizes the key rationale for
positive and negative opinions expressed in a corpus of reviews and highlights the negative and

13
positives features and vice versa. It provides a summary of the text review, a performance chart
and gives details of each positive and negative aspects of reviews. Additionally, WANG (2014)
propose a submodular function-based framework for query-focused opinion summarization. In
the approach, the relevance ordering is produced by a statistical ranking, and information cov-
erage with respect to topic distribution and diverse viewpoints are both encoded as submodular
functions.
However, they all have the same limitation: they do not provide personalized summaries
nor contrast reviews written by different segments of reviewers. Understanding and contrasting
reviews written by different segments of reviewers is still an open research problem (DAS et
al., 2011). Indeed, most of the richness of an opinion is contained in free-text comments whose
information is still challenging to be extracted automatically. New solutions must be found to
digest the information carried in individual reviews and create personalized summaries. Un-
fortunately, the ability to explain user reviews is an under-explored research question(LABBE
et al., 2010; GANU; ELHADAD; MARIAN, 2009). It requires combining sophisticated text
analysis from reviews with mining structured data resulting from crossing reviewer and item
dimensions (DAS et al., 2011; REITER; DALE; FENG, 2000).
1.2 Proposed Solution and Contributions
Given the described problem and the related work limitation, the present research lever-
ages data mining techniques and Natural Language Processing to contrast reviews written by
different segments of reviewers. Precisely, we want to analyze item, user and review dimensions
to extract useful patterns, such as: this hotel is liked by young travelers or middle-aged Frenchs
enjoy this restaurant. After, we want to contrast them with sentences extracted from amount
of review that would explain these patterns, such as: "the room is clean and noiseless" and
"The food was okay, not great, not bad.[...]Our favorite part, was the service!". Finally, we use
these extracted data to build a short explanatory statement using Natural Language Generation
(REITER; DALE; FENG, 2000) that could explain why someone like or dislike an item.
Thus, our approach is composed of three main steps: (i) extracting relevant patterns
from the structured data using data mining techniques; (ii) analyzing the text in order to extract
sentences that would explain the cited patterns; and (iii) building a short explanatory text using
Natural Language Generation. The main advantage of this approach is that it uses structured and
unstructured data, which are found into reviews, to build a personalized summary of opinions.
This work makes four primary contributions:

14
• Development of a new Architecture to provide personalized summaries from reviews;
• Investigation of Automatic Text Summarization methods to summarize reviews;
• Providing comparison between methods to summarize reviews; and
• Provide better comprehension of Automatic Review Summarization;
1.3 Thesis Structure
In this Section, we present the structure of this thesis, as follows: in Chapter 2 we
perform a review of theory in order to identify the most appropriate methodology for each
desired task. Chapter 3 presents related work their strengths and limitations. Chapter 4 describes
our architecture to handle with vast amount divergent reviews to provide a helpful opinion to
the users. Chapter 5 describes our experiments and its parameters. Chapter 6 presents our
results and discussion. Finally, in Chapter 7, we present the conclusions derived from the two
experiments performed. Additionally, future work related to our conclusions are presented.

15
2 BACKGROUND
To conduct this research, was necessary perform an examination of the theory in order
to identify the most appropriate methodology for each desired task. Thus, Section 2.1 presents
some pre-processing concepts about Natural Language Processing. Section 2.2 presents the
Natural Language Generation. Section 2.3 presents methods and features commonly used in
Text Summarization. Section 2.4 presents the Evaluation Methods used in Automatic Text
Summarization. Finally, Section 2.5 provides an overview of Machine Learning techniques
related to Review Summarization.
2.1 Natural Language Processing
Natural Language Processing (NLP) is a field of research that exploits how computers
can understand and handle a text or a speech (PALMER, 2010). The NLP techniques are widely
utilized in many areas of studies, such as Machine Translation, Summarization, Information
Retrieval and speech recognition. To identify the most suitable techniques to our problem, this
section aims perform a review of primary NLP techniques utilized in this process.
Naturally, the first task performed on the text is the data preparation. The actions realized
in the preprocessing step intended to prepare them to undergo some indexing algorithm or data
mining (PALMER, 2010). In general, the preprocessing step aims to improve the quality of data
already available. However, there is no single technique with satisfactory results in all the fields.
Thus, to identify the most suitable method to our problem, the main preprocessing methods are
listed bellow:
• Stop Word Removal. The words with low relevance to express the meaning are called
Stop Words. Their presence in a text decreases the algorithm performance in the catego-
rization task. Thus, the Stop Word Removal task aims to exclude these irrelevant words
(SILVA; RIBEIRO, 2003). A list of stop words consists of connective words, preposi-
tions, pronouns, articles and words with a very high incidence in a collection of docu-
ments. For instance, the English stop words list includes words such as the, is, at, which,
a, able, about, across, after, all, almost, also, am, among, and an.
• Stemming. The Stemming refers to the crude heuristic process of cut off the ends of
words in order to reveal the word root (MANNING; RAGHAVAN; SCHÜTZE, 2008).
After the stemming process, all the words is represented by its stem. It represents an

16
important step used in text categorization. For example, "inform" could be the lemma of
"information" or "inform".
• Lemmatization. This task refers the use of a vocabulary and the morphological analysis
to determination of the base (lemma) of the verb and nouns to the singular form (MAN-
NING; RAGHAVAN; SCHÜTZE, 2008). For example, in English, the verb "to walk"
may appear as "walk", "walked", "walks", "walking".
• Sentence Segmentation. To extract and analyze the relevance of the sentences, we first
need handle with the problem of split the amount of text into sentences (MANNING;
RAGHAVAN; SCHÜTZE, 2008). The use of punctuation, particularly the full stop char-
acter is a good approximation. However, it is not trivial due to its utilization for abbrevi-
ations, which may not terminate a sentence. For instance, "Mr." is not a sentence in the
sentence "Mr. Brow went to the club in Jones Street.". Thus, several methods have used
machine-learning techniques (CHUANG; YANG, 2000).
• Tokenization. Given a sentence, the tokenization process perform the separation of the
elements into pieces, called tokens (MANNING; RAGHAVAN; SCHÜTZE, 2008). In
other words, tokens is an instance of a sequence of characters in some particular docu-
ment. Typically, the tokenization process occurs at the word level, not including punctu-
ation nor white space For example, the sentence "Friends, Romans, Countrymen, lend me
your ears", the resulted tokens are: "friends", "Romans", "Countrymen", "lend", "me",
"your" and "ears".
• Part-of-speech tagging (POS). POS tagging is the process of labeling a word of a sen-
tence based on its grammatical classification such as nouns, verbs, adjectives, and adverbs
(TOUTANOVA; MANNING, 2000). It is a relevant task in the process of identifying as-
pects and the opinions in the sentence, given the identification of nouns and adjectives.
However, considering the high percentage of ambiguous words with more than one mor-
phological classification, the tagging process is not a trivial task. For example, in the
sentence "The sailor dogs the hatch" the word "dogs", that is usually classified as plural
noun, can also be a considered as verb.
• Word Sense Disambiguation (WSD). The WSD aim to solve the ambiguity problem in
the meaning of single words or phrases. An example is bank which may have among
others the senses financial institution or the border of a river. A disambiguation process
requires a dictionary to specify the senses that are to be disambiguation and a corpus of
language data to be disambiguation. Additionally, the machine learning methods requires
training corpus of language examples.

17
• Parsing. It refers to the task performed of understanding the exact meaning of a sentence
using the utilization of a formal grammar. The result is a representation of relations
between words in a sentence (MANNING; SCHÜTZE, 1999). Figure 2.1 shows the
dependency trees of the sentence "John hit the ball". Where S, represents the sentence.
NP is abbreviation to noun phrase. VP to verbs phrase, which is the predicate. V to a
verb, in this case, it’s a transitive verb "hit". Det means a determiner. N is used as noun.
Figure 2.1 – A dependency tree
Source: (MANNING; SCHÜTZE, 1999)
2.2 Natural Language Generation
Natural Language Generation (NLG) is a field of Natural Language Processing and lin-
guistics that aims in understand how a computer can build texts automatically. The NLG system
uses knowledge about language and the domain to produces automatically documents, reports,
explanations and other types of text (REITER; DALE; FENG, 2000). At our work, we aim to
build short explanatory statements based on data extracted from reviews. Thus, we present the
SimpleNLG system, a tool to build Natural Language.
2.2.1 SimpleNLG
SimpleNLG (GATT; REITER, 2009) is a text realization engine for English language,
which aims to provide simple and robust interface to generate syntactic structures and linearize
them as a text. Albert Gatt and Ehud Reiter developed SimpleNLG at the University of Ab-
erdeen’s Department of Computing Science in 2009. It provides a direct control over the way

18
phrases are built. It defines a set of lexical and phrasal types corresponding to the major gram-
matical categories, as well as a simple way of combining these and setting a lot of feature
values.
2.3 Automatic Text Summarization
The Automatic Text Summarization (ATS) aims to reduce an amount of text into a
shorter version preserving the core information content (PALMER, 2010). ATS has become
one important field of research motivated by the abundance of text available on the internet
and the difficult for human beings manually to summarize them. Review summarization is one
objective addressed by this work. To identify the most suitable methods to our problem, we
present the most common methods used in ATS, as well as its pros and cons.
To better understanding of ATS methods, some relevant concepts must be made to clarify
and avoid misunderstanding. Regarding the utilization that the summary is supposed to serve,
the summary can be categorized into indicative or informative summary.
• Indicative Summary. This type of summary does not claim any role in substituting
the source document. Its purpose is merely to alert the reader in relation to the original
contents. It is usually employed to allow users to decide which part of the original text
should read (NENKOVA; MASKEY; LIU, 2011).
• Informative Summary. This type of summary can be read in place of the original doc-
ument (NENKOVA; MASKEY; LIU, 2011). It includes the relevant facts reported in the
original text. The purpose of this type of summary is to substitute the original document
as far as coverage of the information is concerned.
Considering the relation between the summary and the original text, it can be an ex-
tractive or abstractive summary (NENKOVA; MASKEY; LIU, 2011). The goal of extractive
summaries is to select most informative sentences from the original text. In other hand, the
abstractive summarization uses the whole sentences to create a new text using the author’s con-
cepts (HAHN; MANI, 2000).
• Extractive summary. It avoids any efforts on text understanding to generate a summary.
It selects a couple of relevant sentences from an original document(s) in order to use
them in a summary. Extractive summaries (NENKOVA; MASKEY; LIU, 2011) are built
by extracting the most appropriate sentences based on statistical analysis of the words
frequency or the features.

19
• Abstractive summary. It attempts to understand the central concepts of the text and ex-
press those ideas in a new text using Natural Language Generation (HAHN; MANI, 2000;
CHEUNG, 2008). The biggest challenge for abstractive summarization is the knowledge
representation. Systems capabilities are constrained by the richness of their representa-
tions, and they cannot summarize what their representations cannot capture (NENKOVA;
MASKEY; LIU, 2011). In limited domains, it may be easy to create appropriate struc-
tures, but a general-purpose solution depends on a semantic analysis.
Additionally, regarding the number of input documents used to build summary, the sum-
marization can be categorized into single document or Multi-documet summarization.
• Multi-document. It can digest information from multiple sources into one single synthe-
sized document. The significant challenges involving this approach are the repetition of
the information, identification of relevant information from all the documents and the cre-
ation of summary coherent and non-redundant summary (NENKOVA; MASKEY; LIU,
2011).
• Single Document. In other hand, single-document summarization extracts sentences
from a single document (NENKOVA; MASKEY; LIU, 2011).
The summarizer can be a monolingual, multilingual or even cross-lingual. It refers to
the ability of the summarizer to generate summaries in more than one idiom (MCKEOWN et
al., 2002; EVANS; KLAVANS, 2003). In the case of monolingual, the output language is the
same as the input text. Multilingual summarization output language is the same as the text of
the entry, but it can work with more than one idiom. A cross-lingual summarizer can accept a
source text in a particular language and build the summary in another language.
2.3.1 Extractive summarization methods
As presented before, extractive summaries are made by extracting the most relevant
sentences based on several methods. Thus, in order to identify the most appropriate method to
our problem, we present an overview about the methods used for Extractive summarization, as
follow:
• Graph-Based. The document(s) is represented by a graph, where nodes represent the
sentences and edges represent the similarity between pairs of sentences (ERKAN; RADEV,
2004). Some sentences are more similar to each other while some others may share only a

20
little information with the rest of the sentences. The sentences that are similar to many of
the other sentences in a graph are more central or salient to the topic. There are two points
to clarify in this definition of centrality. First is how to define similarity between two sen-
tences. Second is how to compute the overall centrality of a sentence given its similarity
to other sentences. We have utilized LexRank algorithm (ERKAN; RADEV, 2004) in
our experiment to compute the sentence importance. To define similarity, LexRank use
bag-of-words model to represent each sentence as an N -dimensional vector, where N is
the number of all possible words in the target language. For each word in a sentence, the
value of the corresponding dimension of the vector representation of the sentence is the
number of occurrences of the word in the sentence times the idf of the word. Equation
2.1 show how LexRank compute the similarity between two sentences.
idf −modified− cosine(x, y) =∑
w∈x,y tfw,xtfw,y(idfw)2√∑
xi∈x(tfxi,xidfxi)2 ×
√∑yi∈y(tfyi,yidfyi)
2(2.1)
where tfw,s is the number of occurrences of the word w in the sentence s.
Algorithm 2.3.1 shows how LexRank computes the overall centrality of each sentence.
All the values obtained from the algorithm are normalized, giving values from 0 to 1. The
sentence with the highest score represents the most informative sentence in a topic.
• Hypergeometric distribution. In statistics, the hypergeometric distribution is userd to
compute the statistical significance of having drawn a particular k successes out of n
total draws from a sample population (LABBE; LABBE, 2005). The test is often used
to identify which sub-populations are over-represented or under-represented in a sam-
ple. In the ATS, Hypergeometric distribution computes the statistical significance of the
sentence based on underused and overused words (LABBE; LABBE, 2005). To better
understanding, some necessary definitions must be made:
U lexical universe of the sentence. Set of tokens or words in each sentence.
C set of tokens in the entire corpus.
Nc length of tokens in the whole corpus.
Nu length of tokens on sentence.
Fic and Fiu absolute frequencies of a word i in the whole corpus C.
Fiu and Fiu absolute frequencies of a word i in the sentence U .

21
Algorithm 2 Input An array S of n sentences, cosine threshold t output: An array L of LexRankscoresArrayCosineMatrix[n][n]ArrayDegree[n];ArrayL[n];for i← 1 to n do
for j ← 1 to n doCosineMatrix[i][j] = idf −modified− cosine(S[i], S[j]);if CosineMatrix[i][j] > t thenCosineMatrix[i][j] = 1;Degree[i] + +;
elseCosineMatrix[i][j] = 0;
end ifend for
end forfor i← 1 to n do
for j ← 1 to n doCosineMatrix[i][j] = CosineMatrix[i][j]/Degree[i];
end forend for
The mathematical expectancy Ei(u) of a word i occur in a sample of size Nu tokens
drawn out of C can be computed by the equation 2.2.
Ei(u) = Fic ∗Nu
Nc
(2.2)
When a token is drawn out of set C, it is not replaced in it. The sample of Nu tokens
extracted out of C will be always less or equal to its frequency in C, that is Ei(u) ≤ Fic.
We must consider that, even in large corpora, the low-frequency words are small. As a
precaution, we will utilize a hypergeometric distribution instead a binomial one(LABBE;
LABBE, 2005). If the expected value of Ei(u) = Fic we can say that a word is "neutral".
But when two values differ we can say that a word is overutilized or underutilized. In this
case, we are interested in finding sentences that contain the less frequent words. To solve
this problem, one must consider the probability of the observed value Fiu resulting from
the combination of two events:
The number of different possibilities in choosing Nu tokens within Cc:
Cuc =
Nc!
Nu!(Nc −Nc)!=dNcebNuc
(2.3)

22
The number of differents options in choosing Fiu tokens within Fic:
CFiufic
=Fic!
Fiu!(Fic− Fiu)!=dFicebFiuc
(2.4)
The joint probability of these two events follows a hypergeometric law with the parame-
ters Fic,Fiu,Nu,Nc:
P (X = Fiu) =
(Fic
Fiu
)(Nc−Fic
Nu−Fiu
)(Nc
Nu
) (2.5)
Where, Nc is the number of the token in the corpus C, Nu the number of token of the
sub-corpus U .
Fiu and Fic are the absolute frequency of word i in corpus U and C respectively.
When the probability is too high compared to its expectation (E = FicNu
NC), then the word
is over-used in the sub-corpus. It provides the statistical significance of the sentence based
on the proportion of underutilized in the corpus and overutilized in the sub-corpus.
• Word probability. Word probability is the simplest way to estimate the sentence rel-
evance based on the probability to occur in a sentence (NENKOVA; MASKEY; LIU,
2011). Equation 2.7 show the probability of word w occur in a single or multi-document.
p(w) =c(w)
N(2.6)
Were, the likelihood of a word w occur in a document, is the number of occurrences of a
word c(w) by the number of all words in the document(s) N .
Given the probability, the likelihood of a summary can be computed based on a multino-
mial distribution given in the Equation 2.7.
L[sum] =M !
n! . . . n!p(w1)
n1 . . . p(wr)nr (2.7)
Where, M is the number of words in the summary, n1 + · · ·+ nr =M and for each i, ni
is the number of times word wi appears in the summary and p(wi) is the probability of wi
appearing in the summary estimated from the input documents.
• Term Frequency-Inverse Document Frequency (TF-IDF). The problem of using word
frequency to measure the importance of the sentences is that there are few words appear-
ing very often and many other words that appear infrequently. The most frequent words
in the sentence include determiners, prepositions and auxiliary verbs or familiar words of
the domain. Considering that often words do not indicate a relevant sentence. To solve

23
this problem, TF-IDF (LUHN, 1957; SALTON; BUCKLEY, 1988) weights increases
proportionally to the number of times a word appears in the document but is offset by
the frequency of the word in the corpus. That fact helps to adjust for the fact that some
words appear more frequently in general (NENKOVA; MASKEY; LIU, 2011). The TF-
IDF weights also are easy and fast to compute and good indicators of importance. These
properties explain why TF-IDF is one of the most commonly used features for extractive
summarization (NENKOVA; MASKEY; LIU, 2011). Equation 2.8 show the computation
of TF-IDF weights, where c(w) is the term frequency, D is the total of the documents and
d(w) is the number of documents that contain the word w.
TF − IDFw = c(w)× logD
d(w)(2.8)
• Cluster-based. The cluster-based method groups similar sentences based on its TF-IDF
scores into multiple clusters(NENKOVA; MASKEY; LIU, 2011). Each cluster consists
of a group of similar sentences representing a topic or theme in the document. It identifies
the themes from the input set of the documents to be summarized and selects the most
representative sentences from the appropriate clusters to create the summary.
• Artificial Neural Networks. The Artificial Neural Networks (ANN) is a method to esti-
mate the sentence relevance. It is performed by a training process that consist of showing
a set of positives and negatives examples of the sentences that should be included in the
summary. The learning process is supervised, and the neural network learns about the fea-
tures presented in the sentences. It can be done by using a Feed-forward neural network,
which has been proven to be a universal function approximator (RUSSELL; NORVIG,
1995). The learning process involves presentation of a set of pairs (x, y), x ∈ X, y ∈ Y
aiming to find a function f : X → Y . Where, x are the set of features of the sentence
and y is the binary label that indicate if the sentence is included or not in the summary.
The cost function is the relation of mismatches between our mapping and the data and it
implicitly contains prior knowledge about the problem domain (NENKOVA; MASKEY;
LIU, 2011).
• Latent Semantic Analysis. The Latent Semantic Analysis (LSA) is a robust unsuper-
vised method derived from Singular Value Decomposition (SVD). SVD is a useful math-
ematical method to find principal orthogonal dimensions of multidimensional data. The
documents are represented by a matrix A, where each row corresponds to a word that
appears in the text and each column corresponds to a sentence in the text. Each entry aij
of the matrix corresponds to the TF-IDF weight of word i in sentence j. If the sentence

24
does not contain the word, the weight is zero. Standard techniques for SVD from linear
algebra are applied to the matrix A in order groups documents that are semantically re-
lated to each other, even when they do not share common words. In order to create an
extractive summary, they consecutively consider each row of the matrix A to select the
sentence with the highest value until the desired summary length is reached (NENKOVA;
MASKEY; LIU, 2011).
• Query-focused. This method is generally employed on Question Answering (QA) sys-
tems. Some sites such ask.fm1 and Yahoo! Answers2 allow people to ask and answer
questions about diverse subjects as health, politics and software. However, digesting the
large amount of information on long topics can be difficult to humans. Given a subject
expressed in a short paragraph statement, Query-focused methods can build summary
highlights the related sentences in the same theme (WANG et al., 2014).
2.3.2 Features for extractive summarization
As exposed, the central process of extractive summarization is the selection of the most
relevant sentences from the original document to be included in the summary. Such process of
selection can be guided based on some features present in the sentence (KYOOMARSI et al.,
2008; GUPTA; LEHAL, 2010). Thus, to identify the most appropriate method to our problem,
we presents an overview of the main features used in extractive summarization, as follow:
• Semantic Similarity. This feature measures the semantic similarity between two words.
Lesk (LESK, 1986) proposed that the relatedness of two words is proportional to the
extent of overlaps of their dictionary definitions. Banerjee and Pedersen (BANERJEE;
PEDERSEN, 2002) extended this notion to use WordNet as for the word definitions.
WordNet. WordNet in the version 1.7, there has 107.930 noun arranged in 74.448 synsets,
10.860 verbs in 12,754 synsets, 21.365 adjectives in 18,523 synsets, ans 4.583 adverbs in
3.618 synsets. Each synset has an associated definition or gloss. It consists of a short entry
explaining the meaning of the concept represented by the synset. Synsets are connected
to each other through a variety of semantic relations.
• Keywords. Keywords are words that represent the main topics discussed in the text.
One way to extract the most relevant sentences in the text is checking the presence of
keywords (NENKOVA; MASKEY; LIU, 2011). However, the automatic determination
1http://www.ask.fm2http://answers.yahoo.com/

25
of the keywords is a challenging due to the intricate complexities of natural language.
• Title Word. Considering that the main idea of the text should be addressed to the title,
the words present in the title should be an indicative of importance. The sentences that
contain these words would have more chances to express the central idea of the text
(NENKOVA; MASKEY; LIU, 2011).
• Sentence location. Studies have shown that the sentences from the first and last para-
graphs are more relevant. It means that they have more chances to express the main
topics of the text (KUPIEC et al., 1998). Figure 2.2 shows the histogram of the loca-
tion of the extracted sentences. There are two peaks in this plot, being one early in the
document while the other is being in the final five percent of the text. Based on it, the
sentences that are in the beginning and the end have more chance to be relevant.
Figure 2.2 – Quotation location within document
Source: (KUPIEC et al., 1998)
• Sentence Length. Very short sentences have a small probability to be an informative sen-
tence (CHEN; HAN; CHEN, 2002). In other hand, the long sentence has many words to
express an idea. The work (CHEN; HAN; CHEN, 2002) considers the sentence relevance
being the inverse proportion to the square root of its length. In the work of (RADEV et
al., 2004) shows a use of fixed threshold of 5 words.
• Proper Noun. A Proper noun is a name of a person, place and concept. The sentences
containing proper nouns have greater chances to be included in the summary (ZHUANG;
JING; ZHU, 2006).

26
• Cue-Phrase Feature This feature was introduced by Edmundson (1969) to indicate sen-
tence importance by the identification of the significant words. Using this approach, “in
summary”, “in conclusion”, and superlatives such as “the best”, “the most important” can
be useful indicators of significant relevance.
• Sentence-to-Centroid Cohesion. Its measures the cohesion in relation to a centroid that
represents the fundamental concept of the text (HABOUSH et al., 2012). Thus, it uses
bag-of-words model to represent each sentence as an N -dimensional vector, where N is
the number of all possible words in the original document. For each word in a sentence,
the value of the corresponding dimension in the vector representation of the sentence
is the number of occurrences of the word in the sentence. The similarity between the
centroid and the sentence is obtained by the cosine value between centroid to the related
sentence. The normalized value for a sentence s is obtained by computing the ratio of the
cosine value over the largest value among all sentences in the document. Sentences with
feature values closer to 1 have a greater degree of cohesion regarding the centroid of the
original document and should represent the fundamental concept of the text.
• Sentence-to-Sentence Cohesion Similar to Sentence-to-Centroid, this feature compute
the similarity between s and other sentence s′ (HABOUSH et al., 2012). The normalized
value for a sentence s is obtained by computing the ratio of the value for s over the largest
value among all sentences in the document. Values closer to 1 indicate that the sentences
have hight cohesion.
• Occurrence of non-essential information. The occurrence of words “because”, “fur-
thermore”, and “additionally” can indicate a non-essential information (NENKOVA; MASKEY;
LIU, 2011). Informative summaries should avoid non-informative sentences.
• Discourse analysis. This feature determines the overall discourse structure of the text in
order to remove all the peripheral sentences. It allows a creation of coherent summaries
containing just central topics of the original document (CHAN et al., 2000).
2.4 Evaluation methods of Automatic Text Summarization
According to Uman et al. (2015), a good summary should contain main topics of the
original document (coverage) while keeping the redundancy to a minimum (high diversity) and
smooth connection among sentences (high coherence). Several methods have been proposed
to evaluate the summary quality, and the better comprehension of these methods is essential to
27
perform a correct evaluation of the system. In this Section, we provide an overview of different
methods for evaluating automatic summarization systems, its implications, as well as present
the pros and cons involved in this choice.
Methods for evaluating ATS can be broadly classified into two categories (NENKOVA;
MASKEY; LIU, 2011). The first, the Intrinsic methods are frequently employed soliciting
human judgments on the goodness and utility of a given summary, or by a comparison of the
summary with a human-authored gold-standard. The second, the Extrinsic methods that aim to
measure on how it affects the completion of some other task.
2.4.1 Extrinsic Evaluation
Extrinsic evaluations measure the impact of summarization on tasks of relevance as-
sessment and reading comprehension. Relevance assessment can be performed by showing the
judges a document (summary or source) and a topic, then asking them to determine whether the
document is relevant to the topic. On average, if the choices for the document and the summary
are the same, then the summary get a high score on relevance. The evaluation of comprehen-
sion, judges receive a document (the original document or the summary) and response a set
of questions. Their answers to these questions determine their understanding of the text. If
the answers based on the summary and the original document are similar, then the summary is
positively evaluated (NENKOVA; MASKEY; LIU, 2011).
2.4.2 Intrinsic Evaluation
The intrinsic evaluations methods have assessed mainly the coherence and informative-
ness of summaries. One way to perform an intrinsic evaluation is comparing the summary gen-
erated by the system with a gold-standard summary3 written by humans. In this case, evaluation
can be quantitative and measure aspects such as precision and recall. The major problem with
this approach is to make the people agree on what constitutes a "gold" summary (NENKOVA;
MASKEY; LIU, 2011). The most relevant intrinsic evaluation methods are:
• Precision and Recall. A human is asked to choose sentences that seem to communicate
the meaning from the original document to be summarized. Then the sentences selected
3In the literature review, the human summaries against which other summaries are compared are also calledmodels, references or models

28
by the summarizer are evaluated against the human selections. In such settings, the typ-
ical information retrieval metrics of precision and recall can be used to evaluating a new
summary (NENKOVA; MASKEY; LIU, 2011). Recall, showed at equation 2.9, is the
relation of sentences are chosen by the person that were also correctly identified by the
system. Precision, showed at equation 2.10, is the fraction of system sentences that were
correct (NENKOVA; MASKEY; LIU, 2011).
Recall =|system− human choice overlap||sentences chosen by human|
(2.9)
Precision =|system− human choice overlap||sentences chosen by system|
(2.10)
The use of precision and recall as evaluation metrics can be used many times to evaluate
automatically by a mere comparison of the sentence. However, there are several problems
with these measures, as follow:
Human Variation. Different people tend to choose different sentences when asked
to construct an extractive summary. Research as early (RATH; RESNICK; SAV-
AGE, 1961) reported that extracts selected by six different human judges for ten ar-
ticles from Scientific American had only 8% overlap on average. It has been shown
(DONAWAY; DRUMMEY; MATHER, 2000) that the same summary can obtain
a recall score with between 25% and 50% difference depending on which of two
available human gold summary are used for evaluation. Thus, a system can extract
good sentences, but still be penalized in precision and recall assessment methods.
It also seems that is more beneficial to concentrate on recall rather than precision
(NENKOVA, 2006a). Precision is overly strict because some of the sentences cho-
sen by the system might be good, even if the gold standard creator has not chosen
them. Recall, on the other hand, measures the overlap over the already observed
sentence choices.
Granularity. Another problem with the precision and recall measures is the fact that
sentences are not the best granularity for measuring content (NENKOVA; MASKEY;
LIU, 2011). Sentences are different in word length and convey different amounts of
information. Selecting a longer and more informative sentence can be more desir-
able than choosing a short sentence. For instance, a gold standard summary con-
taining the sentences: (1) "We need urgent help." and (2) "Fires have spread in the
nearby forest, and threaten several villages in this remote area.”. Considering two

29
system, each choosing only one sentence of the gold standard, one choosing sen-
tence (1), and other one selection the sentence (2). Both summaries will have the
same precision and recall score, but they are not equally informative (NENKOVA,
2006a).
Semantic Equivalence. Another problem with using sentences as the core of eval-
uation is that two distinct sentences can express the same meaning (NENKOVA;
MASKEY; LIU, 2011). It can occur in summarization of news, and it is very fre-
quent in multi-document summarization, in which the source documents consists
of many articles on the same subject. Again, a human would select one of the
equivalent sentences, but a system will be penalized for the utilization of an alter-
nate sentence that expresses the same meaning (JING et al., 1998). Few alternative
evaluation measures were designed to address the issues that were raised regarding
precision and recall measures. Thus, it has been suggested to use multiple models
rather than a single person’s judgment (JING et al., 1998). Smaller, more seman-
tically oriented units of analysis have been proposed, and more emphasis has been
given on recall (NENKOVA; MASKEY; LIU, 2011).
• Relative Utility. Relative utility (RADEV; TAM, 2003) is a way to solve the human
variation and redundancy problem using precision and recall as metrics. Like some other
evaluation metrics, it compares sentence selection between machine and "gold standard"
summary created by a human. Relative utility approach uses multiple judges to score
each sentence in the source document using a scale from 0 to 10. Being a score of 10
indicate that a sentence is central to the topic of the cluster while a score of 0 marks an
entirely irrelevant sentence. The judges also explicitly mark which sentences are mutu-
ally substitutable in function of the semantic equivalence. Thus, the summaries having
sentences semantic equivalent to the gold standard are better evaluated.
• ROUGE. Recall-Oriented Understudy for Gisting Evaluation (ROUGE) (LIN, 2004) is
inspired by the success of the Bilingual Evaluation Understudy (BLEU) (PAPINENI et
al., 2002) that uses n-gram overlap as a based on the measure. It is based on the compar-
ison of n-grams between the summary to be evaluated and the "gold standard". ROUGE
has been preferred for summarization because it is recall-oriented, unlike BLEU, which
emphasizes precision (PAPINENI et al., 2002). ROUGE is one of most used measures of
content selection quality to be fast and easy. Many researchers usually use the ROUGE
with supplementary manual evaluation such as Pyramid (POIBEAU et al., 2012).
• DUC Manual Evaluation. The Document Understanding Conference (DUC) and Text

30
Analysis Conference (TAC) has been woking on in assessments methods to the sum-
marization systems. They developed cheap methods to perform a comparation between
"gold standards" to summarization system. Thus, they have created summary to be used
as the gold standard. The DUC evaluations methods used between 2001 and 2004 are
based on a single human model. After that, in order to mitigate the bias coming from
the use of one person, different annotators created models for various subsets of the test
data (HARMAN; OVER, 2004). Other improvements were the adoption of elementary
discourse units (EDU) to perform more fine-grained analysis than the sentence level. The
evaluations of the summary were conducted analyzing which they cover each EDU in
the model. The overall score, called coverage, was the average score across all EDU in
the model. DUC also started using human-generated abstracts as gold standards, but this
evaluation method is expensive, requiring more human involvement. Nowadays, the DUC
evaluation protocol was no longer used, giving rise to the Pyramid manual evaluation.
• Pyramid Method. The Pyramid evaluation method (NENKOVA; PASSONNEAU; MCK-
EOWN, 2007) uses multiple human abstracts to derive a gold standard. In this process, in-
formation with the same meaning, even when expressed using different words, is marked
as showing the same summary content unit (SCU). Each SCU is assigned a weight equal
to the number of human summaries who expressed the SCU in their summaries. SCU
analysis shows that summaries that have different content can be equally useful and as-
signs a stable score. A disadvantage of the approach is that the process is very labor
intensive, even the fact that an annotation tool called DUCView5 were developed to facil-
itate the process. The approach was primary developed to evaluate abstractive summaries,
and not efficient to extractive summaries.
• Linguistic Quality Evaluation. While researchers are working on improving system
content selection, most automatic summaries have poor readability aspects such as co-
herence and referential clarity (NENKOVA, 2006b). Recent interest in sentence ordering
and referential cohesion have led to a proposal for automatic evaluation of cohesion (LA-
PATA; BARZILAY, 2005) have been improving automatic summary readability.
Human assessments on a scale, usually from 1 to 5, are probably the fastest and cheapest
way to evaluate the readability aspects. It does not require the collection of gold standard
summaries, nor any annotation or manual analysis from the assessors in order to come
up with a summary quality score. Because of these properties, this evaluation approach
is rather attractive especially when many systems have to be compared on many inputs
(NENKOVA; MASKEY; LIU, 2011).

31
2.5 Machine Learning
Most of the review summarization strategies relies on Machine Learning methods to
mining product features that have been commented on by customers. Since we aim to discover
why people like and dislike about specific product, discovering product features is a crucial task.
Then, we present next, in Section 2.5.1, an overview of machine learning. Finally, in Section
2.5.2, we introduce the machine learning approaches commonly used in review summarization.
2.5.1 Overview
Machine Learning (MITCHELL, 1999) is the study of algorithms that can learn from
an experience to make predictions on data. Regarding the learning task, machine-learning tech-
niques are categorized as supervised or unsupervised. Supervised methods are based on training
data set with examples of inputs and their desired outputs. It aims to learn a general rule that
maps the inputs to outputs. On the other hand, unsupervised techniques data set without la-
bels are given to the algorithm, leaving it on its own to find structure in its input. This type of
learning is used to discovering hidden patterns in data.
Regarding our problem, we want to analyze item, user and review dimensions in order to
extract useful patterns, such as: this hotel is liked by young travelers or middle-aged Frenchs en-
joy this restaurant. Thus, this section presents an overview of the machine learning techniques
utilized to find these patterns.
2.5.2 Machine Learning techniques
Machine Learning is composed by a couple of techniques used for different purposes,
each method offers advantages and disadvantages depending the use. Such techniques are:
• Association Rules Learning. It is a statistical correlation between the occurrences of
certain attributes in large datasets. It is formally defined as: Let I = {i1, i2, . . . , in} be a
set of n binary attributes called items. Let D = {t1, t2, . . . , tm} be a set of transactions
called the database. Each transaction in D contains a subset of the items in I. A rule is
defined as an implication of the form X ⇒ Y where X, Y ⊆ I and X ∩ Y = ∅. The
sets of items (for short itemsets) X and Y are called antecedent (left-hand-side or LHS)
and consequent (right-hand-side or RHS) of the rule respectively (RUSSELL; NORVIG,

32
1995). For example, the association rule {onions, potatoes} ⇒ {hamburger} present
in the sales dataset of a supermarket would indicate that if a customer buys onions and
potatoes together, they frequently also buy hamburger.
FP-growth algorithm is one of the currently most fast and most modern algorithms for
association rule learning. It is based on a prefix tree representation of the given database
of transactions, and this approach can save a considerable amount of memory for storing
the transactions (HAN; PEI; YIN, 2000). The basic idea of FP-growth algorithm is: In
the first pass, the algorithm counts the occurrence of items (attribute-value pairs) in the
dataset. In the second pass, it builds the FP-tree structure by inserting instances. Items
in each case have to be sorted in descending order of their frequency in the dataset so
that the tree can be processed quickly. Items in each instance that do not meet minimum
coverage threshold are discarded. If many cases share most frequent items, FP-tree pro-
vides high compression close to the tree root. Recursive processing of this compressed
version of primary dataset grows large itemsets directly, instead of generating candidate
items and testing them against the entire database. Growth starts from the bottom of the
header table, by finding all instances matching given condition. The new tree is created,
with counts projected from the original tree corresponding to the set of cases that are
conditional on the attribute, with each node getting the sum of its children counts. Re-
cursive growth ends when no individual items dependent on the attribute meet minimum
support threshold, and processing continues the remaining header elements of the origi-
nal FP-tree. Once the recursive process has completed, all large itemsets with minimum
coverage have been found, and association rule creation begins.
• Artificial Neural Networks. Artificial neural networks (ANNs) is part of the statistical
learning family algorithms inspired in a neural network of a brain. It is often used to
approximate functions that can depend on a large number of inputs. Like in the human
brain, the strength of neuron interconnections can change when a stimulus occurs, which
enables the ANN to learn. For example, a neural network for character recognition is
defined by a set of input neurons wich read the pixels of an input image. After being
weighted and transformed by a function, the activations of these neurons are then passed
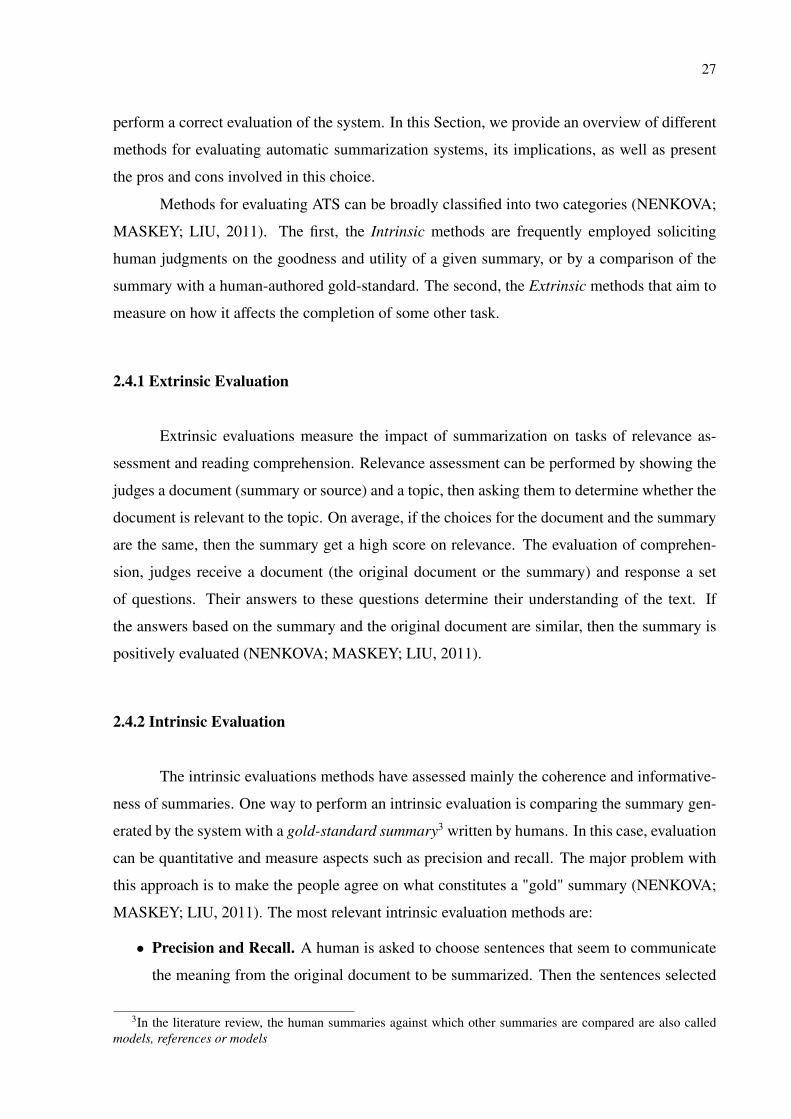
on to other neurons. This process is repeated continuously until the learning of pattern
is reached. It determines which character was read. Figure 2.3 shows a system having
three layers. The first layer has input neurons that send data via synapses to the second
layer of neurons, and then via more synapses to the third layer of output neurons. More
complex systems will have more layers of neurons with some having increased layers
33
of input neurons and output neurons. The synapses store parameters called weights that
manipulate the data in the calculations.
Figure 2.3 – Three-layer Artificial Neural Network
Source: Developed by the author
• Decision Trees. It is a predictive model that maps observations about an item to con-
clusions about the item’s target value. Tree models, where the target variable can take a
finite set of values, are called classification trees. In these tree structures, leaves represent
class labels, and branches represent conjunctions of features that lead to a class. Decision
trees, where the target variable can take continuous values, are called regression trees. To
classify a particular data item, we start at the root node and follow the assertions down
until we reach a terminal node or leaf. When a terminal node is reached, a decision is
made. Decision trees can also be interpreted as a particular form of a rule set, character-
ized by their hierarchical organization of rules. Given the training set composed of the
weather and the decision of play or not play tennis observations. Figure 2.4 represents a
decision tree of how a decision is made.
• Bayesian Belief Network. Bayesian belief networks (BBN) is a probabilistic graphical
model that represents a set of random variables and their conditional dependencies via a
directed acyclic graph (DAG). The nodes represent attribute variables, and the edges rep-
resent probabilistic dependencies between the attribute variables. Associated with each
node are conditional probability distributions that describe the relationships between the
node and its parents. For example, a Bayesian network could represent the probabilistic
relationships between diseases and symptoms. Given symptoms, the BBN can be used to
compute the probabilities of the presence of various diseases.

34
Figure 2.4 – Decision Tree of the play tennis problem
Source: (RUSSELL; NORVIG, 1995)
• Genetic algorithms. It is a search heuristic that are inspired by the principles observed
in natural evolution. This heuristic is routinely used to generate solutions to optimiza-
tion and search problems. The process starts with a population of candidate solutions
called individuals. Each candidate solution has a set of properties called chromosomes
or genotype that can be mutated and altered. Traditionally, solutions are represented in
binary as strings. The evolution usually starts from a population of randomly generated
individuals and is an iterative process, with the population in each iteration called a gen-
eration. In each generation, the fitness of each person in the population is evaluated. The
fitness is usually the value of the objective function in the optimization problem being
solved. The more fit individuals are stochastically selected from the current population,
and each individual’s genome is modified or recombined to form a new generation. The
new generation of candidate solutions is then used in the next iteration of the algorithm.
Commonly, the algorithm terminates when either a maximum number of generations has
been produced or a satisfactory fitness level has been reached for the population.
• Clustering. Clustering is used for finding groups of with similar features. For example,
given a data set of customers, identify subgroups of customers that have a similar buying
behavior. It discovers groups and structures in the dataset that are in some way similar.
2.6 Final Remarks
In this Chapter, we presented an overview of concepts necessary to conduct this research.
It provides a better understanding to the task of choose the most appropriate methodology for the
problem that this research is addressed. Thus, we presented the Natural Language Processing
techniques necessary to build short explanatory statements that could explain why some people
like or dislike an item. After, we provide an overview of the Automatic Text Summarization

35
techniques necessary to contrast these extracted patterns with relevant sentences of the reviews.
Finally, we presented the most significant Machine Learning techniques necessary to perform
the analysis of item, user and review dimensions to extract useful patterns from them.

36
3 RELATED WORK
People usually consult their friends to get an opinion about a book, or a movie or a
restaurant. With the growth of the web over the last decade, users have generated opinions on
collaborative reviewing sites. Unfortunately, the vast amount of such opinions becomes difficult
to users. Thus, researchers on opinion summarization have introduced various techniques and
paradigms to solve this relevant problem.
The related work in this area can be classified into those that rely on the presence of
aspects, and those that do not require aspects. An aspect (also called feature) is an attribute or
component of an item that has been commented on in a review. For instance, the ’soundtrack’,
’art director’ or ’the cast’. In this chapter, we present these two main classes of studies in
review summarization, dividing the studies by aspect-based and non-aspect-based approaches.
First, in Section 3.1, we provide an overview about Automatic Review Summarization. Next,
in Section 3.2, presents approaches focuses on Aspect-based. In Section 3.3 show approaches
focuses on Non-Aspect-based. Finally, in the Section 3.4, presents the synthesis of the related
work.
3.1 Overview
Opinion and Review are usually addressed in the literature with the same sense. How-
ever, Review is a particular subtype of opinion, generally obtained in collaborative reviews sites
like IMDb. A review can be viewed as a tuple <u,i,r,w,t>, that represents a text review w and
rating r about an item i wrote by a user u, in a particular period t. The user u contains di-
mensions such as location, age, and gender. The item i also have dimensions such as director
and actors for a movie. The rating r express a relative acceptance or rejection of a related item
by a user. The users can also describe their reasons for acceptance or rejection of a particular
item using a textual explanation w. For example, in a movie review the users may express their
opinion about aspects/features of the movie.
Currently, there are three extensible surveys that are related to the study of opinion
summarization (PANG; LEE, 2008; KIM et al., 2014). Our research aimed at treating overload
of Reviews, but, of course, many works on opinions are related. First, Pang’s book (PANG;
LEE, 2008) covers various techniques in opinion mining and summarization. Second, Kim’s
survey (KIM et al., 2014) provides a comprehensive review of the work of this area. Finally,
Chapter 11 of Liu’s book (LIU, 2007) introduces basic concepts and definitions about opinion

37
mining.
3.2 Aspect-based Opinion Summarization
The summary based on aspects provide a detailed overview of a particular item, dividing
the input text into aspects (also called features). The segmentation of the text into aspects
can provide quick interpretation of the summary. In divergent opinions, aspect-based opinion
summarization can be useful because they expose separately the overall opinion of each aspect.
It allows a direct comparison between positive against negative aspects. It is very popular and
has been heavily explored over the last few years (LIU; HU; CHENG, 2005; HU; LIU, 2004;
KU; LIANG; CHEN, 2006; MEI et al., 2007).
The aspect-based summarization involves the task of building summaries based a set
of aspects (or features). Usually, aspect-based summarization is based on three distinct steps:
(i) aspect/feature identification; (ii) sentiment prediction; and (iii) summary generation. First,
feature identification task is used to discovery aspects within the text. Second, the sentiment
prediction task is used to set the overall sentiment polarity (negative or positive) about the
aspect. Finally, the summary generation step is used build the results of the previous step in an
effective way. Various techniques have been proposed to solve the challenges in each of these
steps. In the following three subsections, we will describe the common techniques used for this
purpose.
3.2.1 Aspect identification
The Aspect identification is the task of discover the item’s aspects within the text. For
instance, if we want create a summary about the movie "Donnie Darko", some of the expected
aspects are ’soundtrack’, ’art director’ and ’cast’.
Natural Language Processing (NLP). It relies on Part-Of-Speech (POS) tagging method
(see Section 2.1) to discover aspects candidate (POPESCU; ETZIONI, 2007; HU; LIU, 2004).
It is a common starting point for feature discovery. However, the NLP techniques may not
sufficient to discover all the aspects of the text. It because the features are not always nouns,
and often they are not explicitly in the text. For instance, the sentence, "While light, it will not
easily fit in pockets.", Implicitly the sentence refers to the ‘size’ aspect, but there is no mention
of the word ‘size’ in the sentence. For solve this problem, some domain knowledge ontological

38
word dictionary is required (KIM et al., 2014).
Probabilistic Latent Semantic Analysis (PLSA) has recently been applied to perform the
aspect extraction (LU; ZHAI; SUNDARESAN, 2009; HENNIG; LABOR, 2009). To identify
multiple topics in the text, it uses a Mixture Model to define the parameters of the multiple word
distributions. The result had shown that is a promising approach to discover hidden aspects
within the text.
Query-Based opinion summarization generates a summary based on the users’ question.
It tries to answer the question recovering the aspects that the user needs (JIN; HUANG; ZHU,
2009). Several modules are needed to perform it: (i) question analysis and query reformulation
module; (ii) latent semantic analysis for topic detection; (iii) sentence polarity detection module;
and (iv) redundancy removal module. For instance, the question “What is free at Bestwestern
Inn, San Francisco?” the summary generated is "Free wine reception in evening. Free coffee
and biscotti and wine.". The work (WANG et al., 2014) uses a submodular function-based
to produce a summary based on aspects the user need. It uses a statistical ranker to rank the
sentences by their relevance. The results have shown that the approach provides a high coverage
of the information and little redundancy in their summaries.
Mining Techniques for Feature Discovery. Data mining techniques can be used way to
discover features into the text (HU; LIU, 2004). Association Rules is the most common method
used to identify frequent itemsets. In this context, item sets are frequent words that could
indicate an aspect. It requires a manual tagging of words that represent aspects in the text. With
the segmented and tagged data set, Association Rule Mining is performed. It learns rules in the
form A1, A2 . . . An → [aspect], where An is the remaining words in the text. After the learning
process, an aspect can be discovered without the presence of the word that represent the aspect.
3.2.2 Sentiment Orientation
After the aspect discovery, the next step is often the sentiment prediction. It predicts the
people’s sentiment orientation (positive or negative) about an aspect. For instance, some people
can think that the ’soundtrack’ of the movie ’Donnie Darko’ is ’positive’, while other persons
think that the ’cast’ is ’negative’. Thus, the results of aspect-based sentiment predictions would
help users to digest the general sentiments on the aspect.
Learning-based Methods can be applied to discover the sentiment orientation of the as-
pect. The problem can be viewed as text classification problem. Machine learning method can
capture context to predict the sentiment orientation. The work (PANG; LEE; VAITHYANATHAN,

39
2002) compare the efficiency of Naive Bayes, Maximum Entropy and Support Vector Machines
(SVM) techniques to predict the sentiment orientation of the text. The study showed that SVM
provides better results to predict sentiment orientation.
Lexicon Methods relies on a word dictionary to predict sentiment orientation. The dic-
tionary contains a list of positive and negative words used to match the sentence’s word to
discover the overall opinion orientation of the sentence. For instance, if the sentence has many
words classified as positive and few negative, it is classified as a positive sentence. The work
(KAMPS et al., 2004) have used WordNet1 to measuring the semantic distance (or similarity)
between sentence’s words to the keywords “good” and “bad”. Additionally, the study of (TUR-
NEY, 2002) have used pointwise mutual information (PMI) as the semantic distance between
two words. However, the work (TURNEY; LITTMAN, 2003) show better results by the using
the cosine as the distance measure on latent semantic analysis (LSA) method.
3.2.3 Summary Generation
Given the aspects and the sentiment about them, the next task is to use them to present
a useful summary to the user. It involves aggregation of the aspects and the sentiment into the
concise summary. Several methods have been employed in this way, as follows:
Statistical Summary. It is an easy way to present aspects and sentiment about them. It
gives the statistics about the number of the persons that have provided a negative or positive
opinion in a format of the list. It allows to the user a quick interpretation of general opinion in
each aspect. The work of (LIU; HU; CHENG, 2005) presents a graphic summary of product’s
feature with multiples bars. Figure 3.1 is a graphical interpretation of the opinion. The portion
of a bar projecting above the centered “horizon” line represents the number of positive opinions.
The part of the bar below the line represents the number of negative opinions. It allows an easily
simultaneously comparative between negatives against positives.
Text Selection. Many approaches extract a couple of sentences that expose the reasons
for the positive or negative opinion. However, selecting a sentence that describe an opinion is
not a trivial task. Many of recent studies (TITOV; MCDONALD, 2008; POPESCU; ETZIONI,
2007; GANESAN; ZHAI; HAN, 2010) tries to extract from the text smaller pieces of text to
contextualize the opinions. Thus, they use different granularities of text, such as word and
sentence as level granularities.
1http://wordnet.princeton.edu

40
Figure 3.1 – Visualization of an aspect summary
Source: (LIU; HU; CHENG, 2005)
Rated aspect is a way to provide aspect summary that combines statistical and sentence
extraction methods (LU; ZHAI; SUNDARESAN, 2009). The system combines aspect, rating
and text selection to form a summary. For each aspect, it provides a rating average of cited
reviews and a sentence that justify that rating.
Timeline summary provides a graphical interpretation of the opinion, showing opinion
trends over a timeline (MEI et al., 2007; KU; LIANG; CHEN, 2006). While other approaches
show the opinion based on current data, the timeline allows an analysis over the time. It provides
us a analyzing the events that happened at the drastic opinion change. For instance, in a political
analysis we can quickly identify that there is a radical opinion changing after a political debate.
Contrastive Opinion Summarization. While, general methods of opinion summarization
present negative and positive sentences, aspect-based methods divides the sentences according
to its aspects (LIU; HU; CHENG, 2005; HU; LIU, 2004; KU; LIANG; CHEN, 2006; MEI et
al., 2007). Frequently, there are sentences with mixed orientation. For instance, the sentences,
‘The battery life is long when we rarely use buttons’ and ‘The battery life is short when we
use buttons a lot’ would be classified as positive and negative respectively, but they are actually
saying the same fact. Opinion Digger (MOGHADDAM; ESTER, 2010) creates abstractive
summary based on predefined set of aspects to provide a comparison between them.
Unified method. While others approaches provide one type of summary, the Unified
method provides an extensible summary that covers multiples methods. The RnR system
(LABBE et al., 2010) captures and summarizes the key rationale for positive and negative opin-

41
ions expressed in a corpus of reviews and highlights the negative features of positive reviews.
Figure 3.2 shows the summary of a hotel in a four-quarter screen. In the left top, we can see
statistics about the overall opinion of the hotel. The top right contains performance timeline of
their ratings. The bottom gives details of each positive and negative aspects identified in the
reviews.
Figure 3.2 – The RnR system output
Source: (LABBE et al., 2010)
3.3 Non-aspect-based Opinion Summarization
There are many studies that not rely on aspects to provide a summary (RADEV et al.,
2004; LIU; HU; CHENG, 2005; HU; LIU, 2004; KU; LIANG; CHEN, 2006; MEI et al., 2007).
Additionally, they provide different types of interpretation. We can categorize them into basic
sentiment summarization, advanced text summarization, visualization, and entity-based sum-
marization (KIM et al., 2014).

42
3.3.1 Basic Sentiment Summarization
Given the sentiment orientation obtained in Sentiment prediction (see Section 3.2.2), a
basic summary can be built from them. A simple summary can be generated based on the count
of how many positive/negative opinions have an item. This type of summary can show overall
opinion distribution of input text without a sophisticated aspect analysis.
3.3.2 Text Summarization
Naturally, the task of review summarization is related to many other works on multi-
document summarization. ATS approaches are broadly utilized for the general purpose, from
News to scientific paper summarization. In the opinion summarization domain, they are em-
ployed to digest the vast amount of text and extract the most relevant sentences that can explain
user opinion. Regarding how the summary was generated, it can be categorized in Abstractive
and Extractive summarization. Considering how it exposes the sentiment orientation, it can
provide Constrastive Opinion Summary (COS).
Abstractive Text Summarization is the task of creating a new text using the author’s con-
cepts (see Section 2.3). The biggest challenge for abstractive summarization is the knowledge
representation. Systems capabilities are constrained by the richness of their representations,
and they cannot summarize what their representations cannot capture (NENKOVA; MASKEY;
LIU, 2011). In limited domains, it may be easy to create appropriate structures, but a general-
purpose solution depends on a semantic analysis. The Opinosis (GANESAN; ZHAI; HAN,
2010) receives as input a set of free text reviews, and it performs an extraction of the aspects
based on the graph representation of the source documents. This approach was primarily used
to summarize opinions, But the authors also related their use on blogs and news articles. For
instance, considering the food at Holiday Inn, London" the summary generated by the opinions
is "The food was excellent, good and delicious. Excellent selection of food".
Extractive text summarization avoids any efforts on text understanding to generate a
summary. It selects a couple of relevant sentences from an original document(s) in order to use
them in a summary (see Section 2.3). The MEAD framework (RADEV et al., 2004) implements
multiple algorithms such as position-based, centroid-based, largest common subsequence, and
keywords. Additionally, it provides a tool to support evaluating tasks. Open Text Summa-
rizer2(ROTEM, 2012) is another example of Automatic Text Summarization. It reads a text and2OTS available at http://libots.sourceforge.net/

43
decides which sentences are relevant based on its frequency. However, there is no way to the
summarizer filter irrelevant information because it is based on the frequency of words. Its use
in the review domain can result in irrelevant and biased summary, such as: “booking was done
at very last minute...”, “I did a lot of research...”.
Multilingual opinion summarization refers to the ability of the summarizer to generate
summaries in more than one language (MCKEOWN et al., 2002; EVANS; KLAVANS, 2003)
(see Section 2.3). NewsBlaster (MCKEOWN et al., 2002) is one example of multilingual sum-
marizer. It addresses the problem of users have on browsing news from multiple languages on
sites on the internet (MCKEOWN et al., 2002). The system automatically collects, organizes,
and summarizes news in multiple source languages, allowing the user to browse news topics
with English summaries. Additionally, it provides a comparison of the perspectives from differ-
ent countries on the same topics. SimFinderML (EVANS; KLAVANS, 2003) is another example
of multilingual summarization. It identifies similar pieces of text by computing similarity over
multiple features. Given a set of documents about a specific topic, the goal is to identify text
units about the same event. Such identification is performed in five steps: (i) identifying prim-
itives in each language; (ii) translating primitives between languages; (iii) computing feature
values across primitives and translations of primitives; (iv) merging feature values into a single
similarity value; and (v) clustering text units based on the computed similarity values.
3.3.3 Visualization
The methods for visualization also plays an important part in the interpretation of the
review information. While many approaches have used a table-based statistical summary with
relevant text to the user (LIU; HU; CHENG, 2005; HU; LIU, 2004; MEI et al., 2007), others
provides an interpretation of the opinions by a histogram (LIU; HU; CHENG, 2005). Addition-
ally, the work (CHEN et al., 2006) with different graph structures to analyze the features that
have influenced the user’s opinion about a particular item.
3.4 Final Remarks
To the best of our knowledge there is no work that provides personalized summaries
to contrast reviews written by different segments of reviewers. Indeed, most of the richness of
an opinion is contained in free-text comments whose information is still challenging to extract

44
automatically. New solutions must be found to digest the information carried in individual
reviews and create personalized summaries. Unfortunately, the ability to explain user reviews
is an under-explored research question (LABBE et al., 2010; GANU; ELHADAD; MARIAN,
2009).
To better understanding, the nex table shows a summary of the related work presented.
The First column shows the authors name and publication year. The second column describes
the input formats. The third column gives information about the domain. The fourth column
describes the methods of the system. Finally, the last column provides information about the
evaluation.

45
Tabl
e3.
1:R
elat
edw
ork
onop
inio
nsu
mm
ariz
atio
n
SYST
EM
Inpu
tD
omai
nFe
atur
esE
valu
atio
n
Opi
nosi
s,(G
AN
ESA
N;
ZH
AI;
HA
N,
2010
),
2010
-Mul
ti-D
ocum
ent
-Mon
olin
gual
(Eng
lish)
-Spe
cific
(Opi
nion
)-A
bstr
activ
e
-Gra
ph-B
ased
-Avo
ids
redu
ndan
ttex
t
-Int
rins
ic(R
OU
GE
)
Min
qing
Hu
and
Bin
g
Liu
,(H
OV
Y;
LIN
,
1998
),20
04
-Mul
ti-D
ocum
ent
-Mon
olin
gual
(Eng
lish)
-Spe
cific
(Opi
nion
)-A
bstr
activ
e
-PO
Sta
ggin
g
-Fre
quen
tfea
ture
iden
tifica
tion
-Fea
ture
Prun
ing
-Sen
timen
tAna
lysi
s
Ext
rins
ic
CB
SEA
S,(B
OSS
AR
D;
GÉ
NÉ
RE
UX
;
POIB
EA
U,
2009
),
2009
-Mul
ti-D
ocum
ent
-Mon
olin
gual
(Eng
lish)
-Spe
cific
(Opi
nion
)-E
xtra
ctiv
e
-Clu
ster
ing-
Bas
ed(k
-mea
ns)
-Det
ectr
edun
danc
y
-Sen
tenc
era
nkin
gba
sed
ontf
/idf
-Avo
ids
redu
ndan
ttex
t
intr
insi
c(P
YR
AM
ID)
QO
S,(J
IN;
HU
AN
G;
ZH
U,2
009)
,200
8
-Mul
ti-D
ocum
ent
-Mon
olin
gual
(Eng
lish)
-Spe
cific
(Opi
nion
)-E
xtra
ctiv
e
-Sen
timen
tAna
lisys
-Det
ectr
edun
danc
y
-PO
Sta
ggin
g
-Ext
rins
ic(N
IST
)

46
LIP
N,
(BO
SSA
RD
;
GÉ
NÉ
RE
UX
;
POIB
EA
U,
2008
),
2008
-Mul
ti-D
ocum
ent
-Mon
olin
gual
(Eng
lish)
-Spe
cific
(Opi
nion
)-E
xtra
ctiv
e
-Clu
ster
-Bas
ed(M
EA
D)
-Sen
timen
tAna
lysi
s
-Avo
ids
redu
ndan
ttex
t
Intr
insi
c(P
YR
AM
ID)
RnR
Syst
em,
(LA
BB
E
etal
.,20
10),
2010
-Mul
ti-D
ocum
ent
-Mon
olin
gual
(Eng
lish)
-Spe
cific
(Opi
nion
)-E
xtra
ctiv
e
-Sen
timen
tAna
lisys
-Sem
antic
anal
ysis
-PO
Sta
ggin
g
-Gra
phic
alou
tput
Intr
insi
can
dE
xtri
nsic
Que
ry-F
ocus
ed,
(WA
NG
etal
.,20
14),
2014
-Mul
ti-D
ocum
ent
-Mon
olin
gual
(Eng
lish)
-Spe
cific
(Que
stio
nA
nsw
er-
ing)
-Ext
ract
ive
-Sub
mod
ular
Opi
nion
Sum
mar
izat
ion
base
don
Rel
evan
ce,
Cov
erag
e,A
u-
thor
ship
Cov
erag
e,Po
lari
ty,
Con
tent
Cov
erag
e
Dis
pers
ion
Func
tion
base
don
Lex
ical
Dis
sim
ilari
ty,
Sem
antic
Dis
sim
ilari
ty,
Topi
calD
issi
mila
rity
Ext
rins
ic

47
Ope
nTe
xtSu
mm
ariz
er,
(RO
TE
M,2
012)
,200
7
-Mul
ti-D
ocum
ent
-Mul
ti-lin
gual
-Gen
eric
-Ext
ract
ive
-Ope
nSo
urce
-Dic
tiona
ryof
syno
nym
s
-Cue
term
s
-Ste
mm
ing
and
Pars
ing
Ext
rins
ic
Mea
d(R
AD
EV
etal
.,
2004
),20
01
-Mul
ti-D
ocum
ent
-Mul
ti-lin
gual
-Gen
eric
-Ext
ract
ive
base
don
cent
roid
scor
e,po
si-
tion
and
over
lap
with
the
first
sent
ence
.
-Avo
ids
redu
ndan
ttex
t.
-Gra
ph-B
ased
-Ope
nSo
urce
intr
insi
can
dex
trin
sic

48
4 TELL ME WHY ARCHITECTURE
Given the related work and their limitation, we now introduce our architecture. In this
Chapter we describe Tell Me Why, a new architecture to provide a better understanding of
reviews. Thus, Section 4.1 provides an Architecture overview. Next, Section 4.2 presents the
Data Retrieval. Section 4.3 describes the Abstraction module. Section 4.4 provides details
about Macro Planning. Section 4.5 present Sentence Extraction. Finally, Section 4.6 Surface
Realization shows information how handle the data into text.
4.1 Architecture Overview
We have developed an architecture to provide a helpful opinion to the users. Tell Me
Why (TMW) analyze item, user and reviews dimensions to extract frequents item sets. In this
context, item sets refers to the often features found into dataset dimensions. Next, it retrieves
a couple of sentences to contrast these frequent itemsets. Finally, we build a short explanatory
statement using Natural Language Generation. Such summary could explain why someone like
or dislike an item and provide a useful opinion. Thus, we design our architecture to answer the
following questions about movies:
1. Which product a group of user appreciates?
2. Who appreciates this product?
3. What a user group appreciate about a specific product?
To answer these questions, the system generates two different types of summary, such
as:
• Non-personalized summary. In this mode, the system can summarize characteristics
about a product and extract sentences that explain what the general people’s preference
about an item.
• Personalized summary. In this mode, we added personalization. With this feature, we
can provide a summarization for a specific people’s characteristic.
Figure 4.1 presents the TMW1’s architecture and its modules. The modules represents
a black box responsible to handle a distinct task in the whole workflow, as follow:
In the sequence, we will explain the different modules and how they are interconnected.

49
Figure 4.1 – TMW1 Architecture
Source: Developed by the author
4.2 Data retrieval
This module receives a request for a summary and is responsible to perform a query on
the database to create a data structure to the next modules. When it receives a request to create
a summary, a particular query on the database. The related query is responsible to create the
data structures in the format of the tuples < u, i, r, w >. Such tuples represent a text review w
and rating r about an item i gave by a user u.
For instance, let us suppose that a middle-aged woman wants to get an opinion about the
Pulp Fiction movie. In this case, the Q1 represent the request to the TMW and the P1 the real
input of the system. The Data Retrieval module receives the parameter P1 and perform a query
on the database. It provides a set of < user, item, rating, review > as output.
Q1: What do middle-aged females think about Pulp Fiction movie?
P1 : {user : {gender : female, age : middle− aged},movie : {title : PulpF iction}}
4.3 Abstraction
The abstraction task consists of discovery pairs of values that are related each other by
using of heuristics (PORTET et al., 2007). It allows rewriting these similar values into a higher-
order unit. The abstraction process can be compared to an information compression problem.
When applied a higher level of abstraction on the data, necessarily it will lose details about

50
the original information. The dilemma represents the problem of choosing the right level of
abstraction necessary to make possible finding similar patterns in a data set, without losing
essential details. The user’s age are abstracted as follows: teenager, ages under 20; Twenties,
ages from 20 to 29; Thirties, ages from 30 to 39; forties, ages from 40 to 49; Quinquagenarian,
ages from 50 to 59; Senior, ages over 60. The rating grades would be abstracted into labels
"like" or "dislike".
As output, we have a tuple of < user, item, rating, review > abstracted data used as
input to the next module, called Macro Planning.
4.4 Macro Planning
Among all the attributes available in the dataset, this module decides which one is the
most important to express the idea into the text. It defines what kind of information should
be communicated (REITER; DALE; FENG, 2000). Thus, Association Rules Learning is used
in the Macro Planning process to extract a set of frequent itemsets. These extracted rules will
be used to communicate a pattern found in the dataset. Formally, A rule is defined as an im-
plication of the form X =⇒ Y where X, Y ⊆ I and I = {i1, i2, . . . , in}. The sets of
items X and Y are called antecedent and consequent of the respective rule. For instance, from
the item, user and review data we can extract the follow rule: {middleAged, woman} ⇒
{drama,AmericanBeauty}. However, this process may produce a vast number of associa-
tion rules, being necessary the use of criteria to select the best one. The best rules are selected
according to three criterias, as follow:
• Support: supp(X) is defined as the proportion of transactions in the dataset that contains
the itemset X . When the rules are ranked by support, the most frequent patterns found in
the data set are selected.
• Confidence: conf(X ⇒ Y ) = supp(X∪Y )supp(X)
and represents the proportion of transactions
that contains X and Y itemsets. When the rules are ranked by confidence, the truest
patterns found in the data set are selected.
• Number of words: This metric is a quick way to select the best rules based on the size
of its corpus. This metric allows only rules that have better chances to answer why a
determined group like or dislike a movie will be chosen.
As output, each rule extracted from the data contains a list of characteristics that fre-
quently occurs together. The output of this process is a list of frequents patterns {O1, O1, O1...On},

51
where O = {atr1 : val1, atr2 : val2, . . . , atrn : valn}.
4.5 Sentence Extraction
Sentence Extraction is responsible to extract sentences from the mass of reviews that
explains why people like or dislike an item. The corpus of a rule is compared to the entire corpus.
The sentences that have underutilized words are classified as the most distinguished.(LABBE;
LABBE, 2005). Section 5 provides details about the two methods employed in this task.
4.6 Surface Realization
This module renders the sentences and attributes as a string. The SimpleNLG (see 2.2)
was utilized to put the features in a proper syntactic structure. To illustrate, the question Q1
represents the question asked to TMW and I1 : the related input into the Surface Realization
module. Figure 4.2 show the output of Surface Realization related to the question Q1.
Q1: What do middle-aged females think about Pulp Fiction movie?
I1 :
{user : {gender : female, age : middleAged}, item : {genre :
drama, title : PulpF iction}, rating : {avg : 4.11},metrics = {support =
0.07, confidence = 0.3977}, statistics : {. . . }, sentences : {s1, s2}}
Figure 4.2 – TMW Personalised Summary
Source: Developed by author

52
5 EXPERIMENT DESIGN
As presented in Chapter 4, the Tell Me Why (TMW) architecture is composed of Data
retrieval, Abstraction, Macro Planning, Sentence Extraction and Surface Realization. Addition-
ally to conducting an evaluation of TMW, two methods were employed in Sentences Extraction
module. In this Chapter, we describe the validation of TMW, as well as the experiments per-
formed using Statistical-based and Graph-based methods in the Sentence Extraction. Thus,
Section 5.1 describes the dataset utilized in our experiments. Section 5.2 presents two meth-
ods utilized into Sentence Extraction module. Section 5.3 presents the strategy utilized in the
evaluation task. Finally, Section 5.4 describes the threats involved in the evaluation strategy.
5.1 Dataset
The essential requirement to opinion summarization is opinionated data. Thus, many
researchers have created dataset by themselves by crawling review sites with specific queries
(LIU; HU; CHENG, 2005; KIM; ZHAI, 2009; TITOV; MCDONALD, 2008; LU; ZHAI; SUN-
DARESAN, 2009). For example, IMDB for movies, Yelp for restaurants and TripAdvisor for
hotels. Additionally, some standard data sets that are commonly used to evaluate the task of
opinion summarization. These databases are TREC1, NCTIR2, and MPQA3 that were initially
designed for sentiment classification. However, considering that there is no standard data set
specially designed for opinion summarization, just a few researchers have used these standard
data sets.
Another way to perform an evaluation is using a gold standard as reference to perform-
ing a comparative assessment. However, to create a gold standard data is another issue in the
evaluation. Most of previous opinion summarization research relies on multiple human anno-
tations. It solves the problem of Human Variation, Granularity and Semantic Equivalence (see
Section 2.4.2)(LIU; HU; CHENG, 2005; KU; LIANG; CHEN, 2006; LU; ZHAI; SUNDARE-
SAN, 2009; POPESCU; ETZIONI, 2007; ZHUANG; JING; ZHU, 2006; GANESAN; ZHAI;
HAN, 2010; STOYANOV; CARDIE, 2006). Most studies also have shown agreement rate
among human assessors and ratings of reviews. Such agreement leads to the use of numeric
classification as a gold standard (TITOV; MCDONALD, 2008; LU; ZHAI; SUNDARESAN,
1http://trec.nist.gov2http://research.nii.ac.jp/ntcir/index-en.html3ttp://nrrc.mitre.org/NRRC/publications.htm

53
2009). The output of another system also has been used in comparative assessments. The work
(GANESAN; ZHAI; HAN, 2010) use MEAD 4 summarization system as gold standard.
In the movie domain, there are public databases that provide the necessary data to per-
form our experiments. In addition to Review data, they provide a helpful score that can be used
as gold standard. Such related databases are:
• Internet Movie Database (IMDb)5 It is website that aims to catalog every pertinent detail
about a movie and provides an interface to people generate and browse reviews. For
the research purpose, it provides 49 plain text files containing different characteristics
about movies 6. These files are continually updated, and until May 3th 2015 the movie
list contains more than 3,200,000 titles. The database includes rich information about
the movie and ranting, but neither information about user nor the text reviews. The full
description of data available in this database is showed on table 5.1.
• MovieLens Dataset. MovieLens is a movie recommender system, developed by the De-
partment of Computer Science and Engineering at the University of Minnesota. The
MovieLens system implements a typical collaborative filtering system that collects users’
preferences to suggest to user a movie. Two datasets with different sizes are available
at for non-commercial, educational and research use 7. The first one consists of 100,000
ratings for 1682 movies by 943 users. The second one consists of approximately 1 mil-
lion ratings for 3883 movies by 6040 users. Unfortunately, the data set provides details
only about users, ratings, and movies, but not text review. The full data description is
presented on Table 5.1.
• Stanford Web Data project is a collection containing approximately 7 million records ex-
tracted from Amazon (MCAULEY; LESKOVEC, 2013). However, the location attribute,
in the original data, comes directly from a text informed by the user, without any vali-
dation or revision. Such fact represents a significant problem. To solve this issue, use
Google Maps API8 to standardize the location attribute and get a location standard name
from the text informed by the user. Table 5.1 presents the complete list of its attributes.
Considering the databases mentioned before, we have opted to perform our experiments
in the movie review domain. Unfortunately, there is no unique database that provides all the
necessary data. The architecture needs a database that fill the tuple <u,i,r,w> (described in the
4http://www.summarization.com/mead/5http://imdb.com6http://www.imdb.com/interfaces7htp://grouplens.org/datasets/movielens/8Google Maps API can be accessible at https://developers.google.com/maps/

54
Section 4). We thus decided create our database by building two new databases merging data
from IMDb, MovieLens, and Amazon. Such databases are:
• Dataset α: This database was created from merging Amazon, IMDb, and Amazon’s
databases. We have used it to create personalized summaries since it contains user’s
description. Note that, the criteria to get the text review from Amazon database is that the
rating must be the most similar possible to each other. The complete list of attributes of
the Dataset α is showed at table 5.1.
• Dataset β: This database was created from merging between MovieLens and IMDb’s
databases. We have used it to create non-personalized summaries since it does not contain
user’s description. It includes movie characteristics, user location, as well as the free text
review. The complete list of attributes of the Dataset β is showed at table 5.1.
Given the database utilized, we now introduce our experiments and the methods em-
ployed in Sentence Extraction module.
5.2 Experiments
The Sentence Extraction module, showed at Figure 5.1, aims to analyses and extracts
relevant sentences that explain why some group of people like or dislike a movie. We have
employed two different methods on this module. Thus, Section 5.2.1 present the input and
output data of Sentence Extraction module. Section 5.2.2 describes the Statistical-based method
for sentence extraction. Section 5.2.3 presents Graph-based method for sentence extraction.
Figure 5.1 – Sentence Extraction module
Source: Developed by the author

55
5.2.1 Input and Output of Sentence Extraction module
Macro Planning extracts a set of Association Rule (ARs) of the review data (see Section
4). The Macro Planning’s output is used as input to the Sentence Extraction. It is composed by
a set of features F , a set of related sentences S and the number of sentences to be extracted N .
The output of the Sentence Extraction module is a set of sentences S, and their score R.
5.2.2 Experiment 1: Statistical-based method for Sentence Extraction
This Section describes the statistical-based method, called as TMW1. This method uses
Hypergeometric Law to identify the most distinguished sentences based on the likely of overuti-
lized and underutilized words (LABBE; LABBE, 2005) (Section 2.3.1). Thus, we use the vo-
cabulary U related to the input features F . Next, U is compared to the entire corpus of review
C to highlight the words that are over utilized and underutilized. Equation 5.1 given Hyperge-
ometric law used to compute this probability.
P (X = Fiu) =
(Fic
Fiu
)(Nc−Fic
Nu−Fiu
)(Nc
Nu
) (5.1)
WhereNc is the number of token in the corpus C, Nu the number of token of U . The Fiu
and Fic are the absolute frequency of word i in U and C respectively. When the probability is
too high compared to its expectation (E = FicNu
NC), then the word is over-used in the sub-corpus.
Thus, the sentences are ranked according to the proportion of underutilized in the corpus and
overutilized in the sub-corpus (LABBE; LABBE, 2005).
5.2.3 Experiment 2: Graph-based method for Sentence Extraction
Based on results obtained in TMW1, were identified deficiencies and limitations that can
hinder the understanding of the summary by the user. Thus, some modifications were proposed
to handle with this cited, such as: (i) considering the size of the sentences to be included in
the review; (ii) regarding the semantic similarity between words of sentences and the features
found in the association rules; (iii) considering its centrality in the corpus (ERKAN; RADEV,
2004).
We propose the function-based method (WANG et al., 2014), to compute sentence rel-

56
evance, called TMW2. Each sentence s ⊂ r ∈ R, where r is an individual text review wrote
by user subset of the mass of reviews R, are evaluated individually. The computation of the
scores of the sentences is performed by the weighted sum of a set of functions called sub-
functions. Each sub-function aims to evaluate a different aspect of the sentence to provide a
relevance score. The function-based developed in the TMW2 is based on the follow functions:
(i) Sentence salience (ii) Sentence length; and (iii) Semantic Similarity. The function is give in
Equation 5.3:
F (s) = αc(s) + βl(s) + ωw(s) (5.2)
Where c(S), l(S), w(S), are Sentence Salience function, Lenght function and Semantic
Similarity function respectively. The coefficients α, β, ω are 0.5, 0.25, 0.25 for α, β , ω,
respectively, as tuned on the development set.
c(s) is stochastic graph-based method for computing the sentence relevance (ERKAN; RADEV,
2004). It uses the concept of sentence salience to identify the most important sentences
in a set of documents (see section 2.3.1). We have utilized LexRank (ERKAN; RADEV,
2004) algorithm for computing sentence relevance based on the centrality of a graph rep-
resentation.
l(s) is a binary function, resulting 1 to sentences that are in the range of 5 to 50 words. Small
sentences cannot entirely justify an opinion. On the other hand, large sentences use many
words to express an opinion.
w(s) computes the Semantic similarity between the features found in Association Rule to the
words of the sentence (see Section 2.3.1). We have used WordNet Similarity for Java
(WS4J) API9 to compute the Semantic similarity between features and words. For in-
stance, the normalized score between the features middleAged, Woman, drama, American
Beauty and the sentence "My wife loves this movie" is 0.6334.
5.3 Evaluation Strategy
We have performed two types of evaluation. First, a comparative assessment, where
human judges the goodness and utility of the TMW summary by a comparison with a human-
authored gold standard. We used Amazon Most Helpful Review (AMHR) as the gold standard.
The Amazon site allows people to say how much helpful is a review. The most voted is called
9Available at HTTP://code.google.com/p/ws4j/

57
The Most Helpful Review. Second, we performed an intrinsic evaluation using ROUGE to mea-
sure the content selection quality. Thus, Section 5.3.1 describes the comparative assessment.
Section 5.3.2 describes the intrinsic evaluation.
5.3.1 Comparative Evaluation
To evaluate the TMW, a population was recruited to compare TMW with AMHR. In
addition to the task of deciding which reviews are most helpful, the population also was invited
to answer questions about the summary utility, as follow:
1. What do you prefer: AMHR or TMW summary?
2. What do you prefer: AMHR or TMW personalized summary?
3. Does the explanation is helpful?
4. Is it easy to understand?
5. Would you use this system to get an opinion?
To better understanding of the answers given by population, we asked if they usually
read movie reviews. We use this information to categorize people into three classes, as follow:
(i) who always read reviews to get an opinion; (ii) who sometimes read review; and (iii) who
never use read reviews to get opinion; This segmentation provide us a better understanding of
the people preference in each class. We can assume that people who always read reviews to get
an opinion is an expert. In other hand, people who sometimes and never use to read reviews
also provide us valuable feedback about the summarization process.
5.3.2 Intrinsic Evaluation
ROUGE-N is an n-gram recall between a candidate summary and a set of reference
summaries. We use ROUGE (LIN, 2004) to quantitatively assess the agreement of TMW sum-
maries with a human review. ROUGE is based on an n-gram co-occurrence between gold
standard and system summary. It is a widely accepted standard for evaluation of summarization
tasks (GANESAN; ZHAI; HAN, 2010). ROUGE-1 and ROUGE-2 have been shown to have
the most correlation with human summaries (LIN; HOVY, 2003) and higher order ROUGE-N
scores (N>1) estimate the fluency of summaries. We use five human reviews as reference in our
evaluation since it can achieve better correlation with human judgment (LIN, 2004). ROUGE-N

58
is computed as follow:
ROUGE −N =
∑S∈{ReferenceSummary}
∑gramn∈S
countmatch(gramn)∑S∈{ReferenceSummary}
∑gramn∈S
count(gramn)(5.3)
Where n stands for the length of the n-gram, gramn, and Countmatch(gramn) is the
maximum number of n-grams co-occurring in a candidate summary and a set of reference sum-
maries. We have chosen MEAD (RADEV et al., 2004) as baseline. MEAD is the state of the art
extractive summarizer based on clustering. It aims to detect the most important words from the
whole cluster of sentences to select the best one to be included in the final summary. The sen-
tence selection is based on three parameters: minimum sentence length, centroid, and position in
the text. The minimum sentence length by default is nine words. It means that sentences shorter
than nine words is cutted off. The parameter position is related to the position of the sentence
in the document. In Our experiments, we turn this parameter off since it’s not considered in our
methods. MEAD is the ideal baseline because a good summary in our case would be one that
capture the essential information. It is what centroid-based summarize aims to produce.
5.4 Threats to Validity
This section presents the threats to validity our evaluation and the actions that were
utilized to handle with those risks.
Movie bias
To avoid bias, the movies are selected according to two criteria. First, the selected films
should cover as many different genres as possible. Second, the selected films should be
familiar to most of population. According to criteria, we have selected eight movies from
the top 250 list of IMDB. The selected movies are Stand by Me, Pulp Fiction, The Good
the bad and the ugly, Forrest Gump, The Silence of the Lamb, Forrest Gump, Schindler’s
List, American beauty. For each movie, we have used 200 reviews. There are more than
25,000 sentences and more than 484,000 words in all the selected reviews.
Criteria of choice of gold standard review
To perform our evaluation is necessary select some reviews written by human as a gold-
standard. To avoid an inadequate assessment of our system, we have used the AMHR as
the gold standard.
Mobile devices

59
The results obtained in the TMW1 lead us to conclude that review summarization could
be more useful in mobile devices. The size of the screen even the transmission rate
can hamper users to access and read lengthy reviews. To validate this hypothesis, we
conducted a brief survey to collect people opinion about read long text in devices mobile.
We recruited a population composed of 21 men and women that self-declared as a user of
mobile devices. The results show that 76% of the people said that felt uncomfortable to
read a lengthy review on a mobile devices. Based on the results obtained, we conduct the
TMW2 experiments on mobile devices.
Human choice between multiple options
It seems intuitively that the task of choosing between more than two options can be dif-
ficult for humans. Thus, in the comparative evaluation, we only show AMHR and TMW
to the population.
Blind comparison between AMHR and TMW
It seems intuitively that any association with the Amazon trademark can influence the
answers given by the user. Thus, we performed a blind comparison between TMW and
AMHR. We do not provide any information about where come each review. It ensures a
fair comparison.

60
Table 5.1 – DataSets SummaryFild Name Description IMDb MovieLens Amazon α β
Id Internal identifier codeof the record.
X X X X X
Title Title of the movie. X X X X XGenre Genre of the movie
rated, such as Drama orAction.
X X X X
Release Date The release date of themovie rated
X X X
Actors The names of the actorsthat starred the movie
X X X
Directors The name(s) of themovie director(s)
X X X
Writers The name(s) of themovie writer(s)
X X X
Runtime The length of the movie X X XRating Numeric rating of the
reviewX X X
Timestamp The date of the review. X X X XActresses Actresses of movies X X XReleaseDates Dates of movie releases X X X XLanguage Languages of movies X X XCountry Countries of movie X X XProducers Producers of movies X X XUserId Internal identifier code
of the userX X X
Age Age of the user. X XGender The gender of the user,
such as Male or Fe-male.
X X
Occupation The User occupation. X XZipCode User’s postal code. X XLocation User’s location. X XReview The User’s comments
about the movie.X X
Helpfulness A numeric rating givingby the users to mensurethe Helpfulness of thereview.
X X
Source: Developed by the author

61
6 RESULTS
Given details of how the experiments were performed, in this Chapter we provide the
results and discussion of the evaluation. Thus, Section 6.1 presents the results obtained using
Statistical-based method for sentence extractions. Section 6.2 results using Graph-based method
for sentence extractions.
6.1 Experiment 1: Statistical-based method for sentence extraction
This section describes the results obtained from the Statistical-based method for sen-
tence extraction. Thus, Section 6.1.1 describes comparative evaluation. Section 6.1.2 provides
results of Intrinsic Evaluation. Finally, Section 6.1.3 provides discussion about the results ob-
tained.
6.1.1 Comparative Evaluation
To perform a comparative evaluate, we have recruited a population composed of 44 men
and women between 20 and 45 years of age. The figure 6.17 reveals detail about the age and
the gender of the population.
Figure 6.1 – Gender distribution and Age histogram of the population.
Source: Developed by the author
The populations were confronted with two options to choose the most helpful summary.
One being the AMHR and other from TMW1 (The complete form and prototype used to this
evaluation is available in Appendix B). Additionally, they were invited to answer a couple of
questions, as follow:

62
1. Do you usually browse reviews before watching a movie?
To better understanding of the answers given by population, we asked if the population
read reviews before watching a movie. It provides a valuable information to carry out an
analysis of the population’s answers.
Figure 6.2 – Who reads reviews before watching a movie?
Source: Developed by the author
2. What do you prefer: AMHR or TMW non-personalized summary?
As described in Section 4, TMW1 provides non- and personalized summaries. The
TMW1 non-personalized summary just contains information about items and review’s
dimensions. The population were confronted to choose the most helpful summary be-
tween AMHR and TMW. The "Pan’s Labyrinth" movie was utilized because the vast
amount of reviews available. The summaries used to this evaluation is available on Ap-
pendix B. Figure 6.3 show that almost all the population think that AMHR is the most
helpful. Additionally, Table 6.1 show that all the people that always read reviews chosen
the AMHR as the most useful. Just a few people that sometimes and never use to read
reviews accepted TMW1 as most helpful. A full discussion about results is provided on
Section 6.1.3.

63
Figure 6.3 – Comparative evaluation between AMHR and TMW non-personalized summary
Source: Developed by the author
Table 6.1 – Comparative evaluation between AMHR and TMW non-personalized segmented by: a)
People who always read review; b) People who sometimes read review; and c) People who never read
review;
a) Always b) Sometimes c) Never
TMW1 0% 34.62% 33.33%
AMHR 100% 65.38% 66.67%Source: Developed by the author
3. What do you prefer: AMHR or TMW personalized summary?
TMW1 personalized summary offer a summary that match a user’s profile. To the task of
evaluate TMW personalized summary, we asked people to assume that they are looking
for a movie to a middle-aged female friend. They choose the most helpful summary be-
tween AMHR and TMW. Figure 6.4 shows that almost half of the population has chosen
TMW’s personalized summary as the most helpful review. Table 6.2 shows that almost all
the people who always read reviews have preferred AMHR. In order hand, half of people
who sometimes and never read reviews have preferred TMW1.
64
Figure 6.4 – Comparative evaluation between AMHR and TMW personalized summary
Source: Developed by the author
Table 6.2 – Comparative evaluation between AMHR and TMW non-personalized segmented by: a)People who always read review; b) People who sometimes read review; and c) People who never readreview;
a) Always b) Sometimes c) NeverTMW1 16.67% 50% 50%AMHR 83.33% 50% 50%
Source: Developed by the author
4. Does TMW1 summary is helpful?
To measure the quality of the TMW, we ask us for people to evaluate the usefulness of
TMW summary. Figure 6.5 shows that overall people said that TMW1 is very helpful.
Table 6.3 shows that most of the people that says that TMW1 is helpful belongs to the
class of always read reviews. It means the same class of people who says that AMHR
is better then TMW1 said that TMW1 was helpful. Section 6.1.3 provides a discussion
about this fact.

65
Figure 6.5 – TMW personalized summary helpfulness
Source: Developed by the author
Table 6.3 – Comparative evaluation between AMHR and TMW non-personalized segmented by: a)People who always read review; b) People who sometimes read review; and c) People who never readreview;
a) Always b) Sometimes c) NeverVery Helpful 0% 3.85% 0%Helpful 66.67% 57.69% 50%Poor 33.33% 38.46% 33.33%Very Poor 0% 0% 16.67%
Source: Developed by the author
5. Is it easy to understand?
Assuming that a summary should be clear, we want to know how easy TMW1 is to un-
derstand. Figure 6.6 shows that most of the people think that the summary is easy and
very easy to comprehend. Table 6.4 shows that all the classes of people has the same
preference about understanding of TMW1 summary.

66
Figure 6.6 – Understanding of the TMW summary
Source: Developed by the author
Table 6.4 – Comparative evaluation between AMHR and TMW non-personalized segmented by: a)People who always read review; b) People who sometimes read review; and c) People who never readreview;
a) Always b) Sometimes c) NeverVery Easy to understand 0% 11.54% 16.67%Easy to understand 50% 50% 50%Hard to understand 50% 38.46% 33.33%Very Hard to understand 0% 0% 0%
Source: Developed by the author
6. Who would like to use TMW to get an opinion
Finally, we asked who would like to use TMW to get an opinion. Figure 6.7 shows
that almost all the people would use this system to get an opinion. Table 6.5 shows that
specialist would use sometimes TMW1 to get an opinion.

67
Figure 6.7 – Who would use TMW
Source: Developed by the author
Table 6.5 – Comparative evaluation between AMHR and TMW non-personalized segmented by: a)People who always read review; b) People who sometimes read review; and c) People who never readreview;
a) Always b) Sometimes c) NeverAlways 0% 3.85% 8.33%Sometimes 66.67% 69.23% 58.33%Never 33.33% 26.92% 33.33%
Source: Developed by the author
6.1.2 Intrinsic evaluation
As presented in Section 5, we use ROUGE-N to assess quantitatively the agreement of
TMW summaries (LIN, 2004). ROUGE is based on an n-gram co-occurrence between gold
standard summaries and system summaries. It is a widely accepted standard for evaluation
of summarization tasks (GANESAN; ZHAI; HAN, 2010). To compare the results, we use
MEAD as baseline. Table 6.6 shows the performance comparison between TMW statistical-
based method and baseline. This comparative have shown that the baseline method has better
results in the recall, precision, and f-measure scores. We have observed that the sentences
chosen by baseline has 35 words on average against 16 of TMW1. Such characteristic could
improve the baseline recall. Unfortunately, we cannot change the max length of the sentences
to provide a fair comparative.

68
Table 6.6 – Performance comparison between TMW1 and Baseline.
Recall
Rouge-1 Rouge-2 Avg Words
TMW1 0.03737 0.00719 16
Baseline 0.07318 0.01500 35
Precision
Rouge-1 Rouge-2 Avg Words
TMW1 0.50000 0.08276 16
Baseline 0.55429 0.23284 35
F-measure
Rouge-1 Rouge-2 Avg Words
TMW1 0.06954 0.01323 16
Baseline 0.12929 0.02819 35Source: Developed by the author
6.1.3 Discussion
To evaluate the TMW1 were recruited a population composed of 44 men and women be-
tween 20 and 45 years of age to compare TMW with the AMHR. To evaluate non-personalized
summarization, we chose "Pan’s Labyrinth" movie because the vast amount of available re-
views. The results showed that 70.45% of the people preferred AMHR instead TMW. The
results showed that all the specialist selected AMHR as the most helpful. Such fact could say
that TMW1 non-personalized summary has no advantage comparing with AMHR. There are
two possible explanation of this negative result. First, the reviews used to generated the sum-
mary provide few information about the movie. Second, the method employed in the Sentence
Extraction could not be the most suitable to capture the most relevant sentences in review sum-
marization. To better understand this negative result, we performed an intrinsic evaluation in
the sentence extraction. We used ROUGE-N to compare our results with MEAD. The results
showed that Hypergeometric Law have no advantages comparing with MEAD. Both recall and
support had lower precision and recall comparing with the baseline. It can explain the negative
results.
To evaluate TMW1 personalized summary, the people were asked to assume they are
looking for a movie to a middle-aged female friend. We presented AMHR and a personalized
summary about "American Beauty" movie. Additionally to choosing the most helpful, they

69
were inquired about the understanding, helpfulness and if they would use TMW1 in the future
to get opinion. The results have shown that 45.45% of the recruited population has chosen
TMW1 as the most helpful review against 54.55% of AMHR. Additionally, 50% of all people
considered TMW1 easy to understand and 65.91% would use TMW1 to get an opinion.
TMW1 personalized summary achieved better results than TMW1 non-personalized
summary. However, TMW1 is not even better than AMHR. A possible cause for this nega-
tive result is the fact that the sentence extraction does not select the most informative sentences.
We also realize that TMW could be more useful in mobile devices. The size of the screen even
the transmission rate can hamper users to access and read lengthy reviews. To validate this hy-
pothesis, we propose conduct a survey to collect people opinion about read long text in devices
mobile. The evaluation also have shown that the current limitations of the TMW1 are present
on the quotations extraction process. The extracted sentences are not directly related to the fea-
tures found in the association rule, and this may not explain why some people like or dislike a
movie. However, the whole process of getting the information, abstract them, discover frequent
itemsets, sentence extraction, and surface realization are functional. Most of the people also
agree that the TMW can be helpful, easy to understand and would like to use this system to get
an opinion.
As future works, we highlight the improvements in the quotation extraction. Considering
the limitation of the TMW previously cited, three primary improvements were identified on
the Sentence Extraction module: (i) considering the size of the sentences to be included in the
review; (ii) regarding the semantic similarity between words of sentences and the features found
into the itemsets. (iii) considering its centrality in the corpus (ERKAN; RADEV, 2004).
6.2 Experiment 2: Graph-based method for sentence extraction
This section describes the results obtained from the Graph-based method for sentence
extraction employed by TMW2. Thus, Section 6.2.1 performs comparative evaluation between
AMHR and TMW2. Section 6.2.2 provides results of intrinsic evaluation of Graph-based
method for sentence extraction. Finally, Section 6.2.3 presents discussion about results.

70
6.2.1 Comparative evaluation
To evaluate the TMW2 were recruited a population composed of 21 men and women
between ages of 20 to 35 years to perform blind comparison evaluations between TMW and
the AMHR (The complete form used to this assessment is available in Appendix B). In such
configuration, the population was invited to answer the follow questions:
1. Do you browse reviews before watching a movie?
To better understanding of the answers given by population, we asked if the population
read reviews before watching a movie. It provides us a valuable information to carry out
an analysis of the population’s answers. Figure 6.8 provides the results.
Figure 6.8 – Who reads reviews before watching a movie?
Source: Developed by the author
2. What do you prefer, AMHR or TMW2?
We asked people to choose a best review between AMHR and TMW2. Figure 6.9 shows
that almost all the population have preferred our approach then AMHR (The summary
and the questions are provided on Appendix B). Table 6.7 shows that even the people
who usually read reviews have preferred TMW2.

71
Figure 6.9 – People’s preference between AMHR and TMW2
Source: Developed by the the author
Table 6.7 – Comparative evaluation between AMHR and TMW non-personalized segmented by: a)People who always read review; b) People who sometimes read review; and c) People who never readreview;
a) Always b) Sometimes c) NeverTMW1 100% 75% 100%AMHR 0% 25% 0%
Source: Developed by the author
3. Does TMW2 summary is helpful?
We have asked for people how useful is TMW2 summary. Figure 6.10 shows that more
than half of people said that TMW2 is very helpful and helpful. Table 6.8 shows that the
specialist also agree that TMW2 is helpful.
Figure 6.10 – TMW2 summary helpfulness
Source: Developed by the author

72
Table 6.8 – Comparative evaluation between AMHR and TMW non-personalized segmented by: a)People who always read review; b) People who sometimes read review; and c) People who never readreview;
a) Always b) Sometimes c) NeverVery Helpful 0% 25% 50%Helpful 66.67% 56.25% 50%Poor 33.33% 12.50% 0%Very Poor 0% 6.25% 0%
Source: Developed by the author
4. Does it easy to understand?
We want to assess how TMW2 is easy to comprehend. Figure 6.11 shows that almost
all the people considered TMW2 summary Very easy and Easy to Understand. Table 6.9
shows that the majority of people who always read reviews before watching a movie said
that it is Very easy to understand.
Figure 6.11 – Understanding of the TMW2 summary
Source: Developed by the author
Table 6.9 – Comparative evaluation between AMHR and TMW non-personalized segmented by: a)People who always read review; b) People who sometimes read review; and c) People who never readreview;
a) Always b) Sometimes c) NeverVery Easy to understand 66.67% 35.71% 25%Easy to understand 33.33% 50% 50%Hard to understand 0% 14.29% 25%Very Hard to understand 0% 0 0%
Source: Developed by the author

73
5. Would you use this system to get an opinion?
We would like to know who want to use this system to obtain an opinion before seeing
a movie. Figure 6.12 shows that more than half of people have said that they would
sometimes use TMW2 to get a further opinion about a movie. Just a few people have said
that won’t use the TMW2. Additionally, Table 6.10 shows that all the experts agree to use
TMW2.
Figure 6.12 – Who would like to use TMW2 to get an opinion.
Source: Developed by the author
Table 6.10 – Comparative evaluation between AMHR and TMW non-personalized segmented by: a)People who always read review; b) People who sometimes read review; and c) People who never readreview;
a) Always b) Sometimes c) NeverAlways 0% 53.85% 25%Sometimes 100% 46.15% 50%Never 0% 0% 25%
Source: Developed by the author
6. Does the sentence length is enough to get an opinion?
TMW2 summary expose a couple sentence from the amount of reviews. We want to
understand the people opinion about the sentence length. Figure 6.13 have shown that
almost all the people considered the sentences length as "Good". Additionally, Table 6.11
show that the experts also considered length sufficient to get opinion.

74
Figure 6.13 – People’s opinion about the length of the sentences
Source: Developed by the author
Table 6.11 – Comparative evaluation between AMHR and TMW non-personalized segmented by: a)People who always read review; b) People who sometimes read review; and c) People who never readreview;
a) Always b) Sometimes c) NeverLong 0% 0% 0%Good 100% 92.86% 100%Short 0% 7.14% 0%
Source: Developed by the author
7. Does the number of sentences is sufficient to get an opinion?
The TMW2 extracts five sentences to each summary. Figure 6.14 shows that the almost
all the people think that the number of the sentence are enough to get an opinion. Table
6.12 shows that the expert also agree that the number of sentences is sufficient to get an
opinion.
Figure 6.14 – People’s opinion about the number of sentences
Source: Developed by the author

75
Table 6.12 – Comparative evaluation between AMHR and TMW non-personalized segmented by: a)People who always read review; b) People who sometimes read review; and c) People who never readreview;
a) Always b) Sometimes c) NeverToo much 0% 7.14% 0%Enough 75% 92.86% 100%Few 25% 0% 0%
Source: Developed by the author
6.2.2 Intrinsic Evaluation
For intrinsic evaluation of the TMW2, we also have chosen the MEAD as baseline. By
default, MEAD has three parameters: mining sentence length, centroid and position in the text.
We have utilized with default parameters (Centroid, and Position are both 1. The default Length
cutoff is 9). Table 6.14 shows the performance comparison between TMW2 and baseline. First,
we can see that TMW2 has better results using ROUGE-2. This show that TMW’s graph-
based approach has good performance in the task of capture the essential information of the
original text. Second, the recall scores of TMW summary using ROUGE-1 are slightly lower
than baseline while the precision scores are higher. It also shows the effectiveness of the graph
method into the summarization task.
Table 6.13 – Performance comparison between TMW2 and baseline.Recall
Rouge-1 Rouge-2 Avg WordsTMW2 0.05614 0.02090 15Baseline 0.07318 0.01500 35
PrecisionRouge-1 Rouge-2 Avg Words
TMW2 0.64865 0.26286 15Baseline 0.55429 0.23284 35
Rouge-1 Rouge-2 Avg WordsF-measure
TMW2 0.10334 0.03872 15Baseline 0.12929 0.02819 35
Source: Developed by the author
The TMW2 is based on submodular function-based is given by F (S) = αc(S)+βl(S)+
ωw(S). Where c(S), l(S), w(S), are Sentence Salience function (Graph), Length function
and Semantic Similarity function respectively and α, β and ω are the weights. Additionally
to intrinsic evaluation, we performed experiments with different values of β and ω to better
understanding of system results.

76
The semantic similarity function gives the score to the sentences based on the similarity
between features found into itemset and words the words of the sentence. Figure 6.15 shows
the Recall and Precision scores of ω weight from 0% to 100%. When ω increases, the recall and
precision tend to decrease. It because the submodular function gives better scores to semantic
related sentences.
Figure 6.15 – Precision and Recall
Source: Developed by the author
6.2.3 Discussion
Based on the prior results obtained in the experiments realized under TMW1, we propose
a Graph-based method to sentence extraction, called TMW2. It uses sub-modular functions to
compute the relevance of each sentence (WANG et al., 2014). We propose a combination of
Length function, Semantic similarity function, and a Graph function. The results obtained on
TMW1 also leads us to deduct that the TMW could be more useful in mobile devices. The size
of the screen even the transmission rate can hamper users to access and read lengthy reviews.
We conducted a brief interview to collect people opinion about read long text in devices mobile.
The results show that 76% of the people said that felt uncomfortable to read long text on mobile
devices and preferred short version instead. Based on it, we conduct the experiments on mobile
devices context.
To perform a comparative evaluation, were recruited a population composed of 21 men
and women between 20 and 35 years of age to evaluate a comparison between TMW2 and
AMHR. As the result, most of the people chose TMW2 as the most helpful review and Easy to
understand. They also said that the length and number of sentences are enough to get an opinion
and they would use TMW2 to get an opinion.
Additionally to a comparative evaluation, an intrinsic evaluation was performed using

77
ROUGE-N . It shows that graph-based approach has good recall and precision in the task of
select the most relevant sentences. We also use different values of β and ω to understand how it
can impact on recall and precision (see Equation 5.2). It shows that when the semantic function
receives a higher weight the recall and precision decrease.
The results prior cited, show that the whole process of getting the information, abstract
them, find patterns, execute quotation extraction and surface realization are functional and sat-
isfactory. Most of the people agree that the TMW2 can be helpful, easy to understand, and they
would use TMW2 to get an opinion. The TMW2 also provide good precision and recall in the
sentence extraction.
6.3 Comparison between TMW1 and TMW2
Given the result of comparative evaluation of TMW1 and TMW2, this section provides a
comparison between them. Thus, Figure 6.16 exposes their results obtained in the comparative
assessment. The red bars represents the TMW2, and the blue one is the TMW1. The horizontal
group of the axis represents four questions: 1) Does the explanation is helpful? 2) Is it easy
to understand? 3) Would you use this system to get an opinion? And 4) What do you prefer:
AMHR or TMW summary?
Some observation must be made: a) the evaluation were performed individually. TMW1
was not confronted directly against TMW2; b) The people that evaluate TMW1 were not the
same that Evaluate TMW2; c) TMW1 evaluations were performed on the computers, while
TMW2 evaluation were conducted on mobile device; Such observations prevent us from making
a direct comparison between TMW1 and TMW2. However, we can we can observe that TMW2
obtained a slight advantage in the opinion of users.

78
Figure 6.16 – Comparative evaluation of TMW1 and TMW2
Source: Developed by the author
Additionally, we perform a comparison of intrinsic results. Table 6.14 shows that TMW2
is better than TMW1 in all the measures. It shows that Graph-based method has better results
than Hypergeometric, using ROUGE measure. Figure 6.17 provides visual interpretation of the
results.
Figure 6.17 – Intrinsic evaluation between TMW1, TMW2, and baseline.
Source: Developed by the author

79
Table 6.14 – Performance comparison between TMW1 and baseline.Recall
Rouge-1 Rouge-2 Avg WordsTMW1 0.03737 0.00719 16TMW2 0.05614 0.02090 15Baseline 0.07318 0.01500 35
PrecisionRouge-1 Rouge-2 Avg Words
TMW1 0.50000 0.08276 16TMW2 0.64865 0.26286 15Baseline 0.55429 0.23284 35
Rouge-1 Rouge-2 Avg WordsF-measure
TMW1 0.06954 0.01323 16TMW2 0.10334 0.03872 15Baseline 0.12929 0.02819 35
Source: Developed by author

80
7 CONCLUSION AND FUTURE WORK
Users increasingly rely on collaborative reviewing sites to achieve tasks such as purchas-
ing a product or renting a movie. Over the time, these sites have built a rich database containing
user demographic dimensions such as location, age, gender, item dimensions such as director
and actors for a movie, ratings, and reviews. But this vast amount of data can hamper the user to
get an unbiased opinion. The review also plays an important part in the purchasing decisions of
the consumers(CHATTERJEE, 2001; CHEVALIER; MAYZLIN, 2006; KIM; SRIVASTAVA,
2007). However, to get a suitable opinion from this mass of data, the users have to deal with
a vast amount of textual information. Precisely, they have to deal with the problem of the vast
amount of divergent reviews about the item and its features, to extract a suitable opinion from
them. Unfortunately, the ability to explain user reviews is an under-explored research question.
It requires combining sophisticated text analysis with the exploration of an exponential search
space that results from crossing reviewer and item dimensions.
Our work proposes a new architecture, called Tell Me Why. It is a project developed at
Grenoble Informatics Laboratory in cooperation with the Federal University of Rio Grande do
Sul to provide users a better understanding of reviews. This architecture provides a combination
of text analysis from reviews with mining structured data resulting from crossing reviewer and
item dimensions. Additionally, this work performs an investigation of summarization methods
utilized Sentence Extraction module.
We have employed Hypergeometric Law on the Sentence Extraction to extract an expla-
nation from the reviews. We call this method as TMW. To evaluate the TMW1 were recruited
a population composed of 44 men and women between 20 and 45 years of age to compare
TMW1 with the Amazon Most Helpful Review (AMHR). They were inquired about the under-
standing, helpfulness and if they would like to use TMW in the future. The results have shown
that 45.45% of the recruited population has chosen TMW as the most helpful review against
54.55% of AMHR. 50% of all people considered TMW easy to understand and 65.91% said
they would like to use this system in the future to get an opinion.
Based on the prior results obtained in the experiments realized under TMW1, we propose
a new architecture called TMW2. This structure keeps the main features of the first approach,
but some improvements were made to get better results. To evaluate the TMW2 were recruited a
population composed of 21 men and women between 20 and 35 years of age to compare TMW2
against Amazon Most Helpful Review (AMHR). The results have shown that 85.71% of the
recruited population has chosen TMW as the most helpful review against 14.29% of AMHR.

81
47.62% of all people considered TMW easy to understand and 38.10% said they would like to
use this system in the future to get an opinion about a movie.
The results obtained in both evaluation show us that it is a promising approach and useful
in user’s opinion. However, TMW presented deficiencies in the summarization process. The
current limitations of the TMW summarization are related to: (a) Coverage. TMW just consider
just the main topics in the review, not covering all topics available about the related movie;
(b) Redundancy. The extractive summarization process also presents a redundancy, allowing
that multiples sentences about the same topic; and (c) Coherence. The TMW also showed a
coherence problem between sentences, chosen sentences that have no semantic link each other.
The summarization also ignores the position of the sentence in the text allowing introductory
sentences be inserted after the concluding sentences. It can hinder the understanding of the
summary to the user.
The evaluation process also reveals a deficiency to measure the quality of the summary.
The questions asked to the populations don’t cover all the relevant aspects of the summary. To
solve this problem, we recommend the adoption of a standard evaluation framework. The DUC 1
framework is a standard and a widely used into evaluation process of the summarization system.
The linguistic quality questions are targeted to assess how readable and fluent the summaries
are. A comparative evaluation with other opinion summarization also is an important manner
to measure the quality of the approach.
7.1 Contributions
Given the results obtained, we now list the main contributions of this work, as follow:
Development of a new architecture to provide a personalized summary of reviews
As specified in Chapter 1, the users have faced a vast amount of reviews to get an opinion
about a product or a service, such as a restaurant, movie or a book. To provide users
better understanding of reviews, we proposed a new architecture to review summarization
called Tell Me Why. Such architecture are composed of five modules, which represents
the common tasks in the review summarization process. The output of this architecture
is a piece of text using Natural Language Generation to provide users an explanation of
reviews. Therefore, one of our main contribution in this work is a new architecture to
summarize reviews.
1http://www-nlpir.nist.gov/projects/duc/duc2007/quality-questions.txt

82
Comparative evaluation of Tell Me Why architecture
The Amazon site allows people to say how much helpful is a review. The most voted is
called The Most Helpful Review (AMHR). It is a cheap and quick method to perform a
comparative evaluation of the system. To the best of our knowledge, we were the first
to use the AMHR as the gold standard to perform an evaluation. In this configuration,
the people who have said that always read review before seeing a movie is identified
as the specialist. The results obtained from comparative evaluation show that TMW is
functional, useful and easy to understand in the user’s opinion.
Investigation and Employment of Automatic Text Summarization methods
The Tell Me Why architecture is composed of Data Retrieval, Abstraction, Macro Plan-
ning, Sentence Extraction and Surface Realization. The Sentence Extraction module is
responsible to extract a couple of relevant sentences. Thus, we have performed a theory
review to identify the most suitable technique to be employed for sentence extraction.
One contribution of this work is the employment of Statistical-based and Graph-based
methods into review summarization.
Intrinsic comparison of methods employed on sentences extraction
Additionally to a comparative Evaluation, we perform an assessment of the methods used
in Sentence Extraction module. We used ROUGE-N to compare the performance of the
state of the art in extractive summarization (MEAD). The intrinsic evaluation showed that
both Statistical-based and Graph-based has good performance on the task of summariza-
tion. However, the Statistical-based has worse results. One contribution of this work is a
comparative between these methods and the baseline.
7.2 Future work
Our work proposes a new architecture to provide to the user a review explanation. Ad-
ditionally to the architecture, this work performed a study of summarization methods employed
in the Sentence Extraction module. The future work related to this work are listed below.
Large Scale Evaluation.
Our procedure of evaluation achieved relevant results to review summarization. To under-
stand the system performance in a real application, we propose a performance evaluation
in large datasets. This assessment provides results of the TMW’s applicability in large-
scale use, such as collaborative review sites.

83
Individual study of TMW modules.
In this work, we have performed an investigation and evaluation of the methods to the
Sentence Extraction module. As future work, we propose an individual and focused study
in each module. An individual study on the TMW modules will provide an improvement
of the result.
Sentiment Analysis.
Currently, each sentence of the text review is classified based on their numeric rating.
However, the results have shown the sentences found in the review have different senti-
ment orientation. The same review can contain positive and negative sentences. Thus, the
use of sentiment analysis can identify the individual orientation of the sentence.
Temporal Extraction
Currently, TMW provides a summary based on overall opinion. However, such approach
can hide an opinion changing. It can be relevant in domains of service. As future work,
we propose generate summaries exposing the people opinion about an item along the
time.
Aspect-based summarization
As future work, we proposed generate summaries based on aspects. We aim to recognize
the users’ aspects of interest in an item based on their prior reviews. Thus, we can provide
them a personalized summary that explains the pros and cons. Precisely, we want to create
useful summaries that cover their aspects of interest to provide a suitable opinion. From
this broader problem, it can be divided it into two sub-problems: (i) How to automatically
discover users’ aspects of interest based reviews prior generated by them; and (ii) How to
create a summary that explain the pros and cons taking into account the user’s aspects of
interest.

84
REFERENCES
BANERJEE, S.; PEDERSEN, T. An adapted lesk algorithm for word sense disambiguationusing wordnet. In: INTERNATIONAL CONFERENCE ON INTELLIGENT TEXTPROCESSING AND COMPUTATIONAL LINGUISTICS. Proceedings... [S.l.]: Springer,2002. p. 136–145.
BOSSARD, A.; GÉNÉREUX, M.; POIBEAU, T. Description of the lipn system at tac 2008:Summarizing information and opinions. In: INTERNATION CONFERENCE ON TEXTANALYSIS, Gaithersburg, USA. Proceedings... [S.l.]: Nist, 2008. p. 282–291.
BOSSARD, A.; GÉNÉREUX, M.; POIBEAU, T. Cbseas, a summarization system integrationof opinion mining techniques to summarize blogs. In: CONFERENCE OF THE EUROPEANCHAPTER OF THE ASSOCIATION FOR COMPUTATIONAL LINGUISTICS, AberWrac’h, France. Proceedings... [S.l.]: Association for Computational Linguistics, 2009.p. 5–8.
CHAN, S. W. et al. Mining discourse markers for chinese textual summarization. In:INTERNATION WORKSHOP ON AUTOMATIC SUMMARIZATION. Proceedings... [S.l.]:Association for Computational Linguistics, 2000. p. 11–20.
CHATTERJEE, P. Online reviews: do consumers use them? Journal of Consumer Research,Oxford University Press, p. 129–134, 2001.
CHEN, C. et al. Visual analysis of conflicting opinions. In: IEEE SYMPOSIUM ON VISUALANALYTICS SCIENCE AND TECHNOLOGY. Proceedings. [S.l.]: IEEE, 2006. p. 59–66.
CHEN, F.; HAN, K.; CHEN, G. An approach to sentence-selection-based text summarization.In: INTERNATIONAL CONFERENCE ON COMPUTERS, COMMUNICATIONS,CONTROL AND POWER ENGINEERING. Proceedings... [S.l.]: IEEE, 2002. v. 1, p.489–493.
CHEUNG, J. C. Comparing Abstractive and Extractive Summarization of EvaluativeText: Controversiality and Content Selection. Thesis (PhD) — Citeseer, 2008.
CHEVALIER, J. A.; MAYZLIN, D. The effect of word of mouth on sales: Online bookreviews. Journal of marketing research, American Marketing Association, v. 43, n. 3, p.345–354, 2006.
CHUANG, W. T.; YANG, J. Extracting sentence segments for text summarization: amachine learning approach. In: INTERNATIONAL CONFERENCE ON RESEARCH ANDDEVELOPMENT IN INFORMATION RETRIEVAL. Proceedings... [S.l.]: ACM, 2000. p.152–159.
DAS, M. et al. Mri: Meaningful interpretations of collaborative ratings. Journal of VeryLarge Databases, Citeseer, v. 4, n. 11, 2011.
DONAWAY, R. L.; DRUMMEY, K. W.; MATHER, L. A. A comparison of rankings producedby summarization evaluation measures. In: INTERNATION WORKSHOP ON AUTOMATICSUMMARIZATION. Proceedings... [S.l.]: Association for Computational Linguistics, 2000.v. 4, p. 69–78.

85
EDMUNDSON, H. P. New methods in automatic extracting. Journal of the ACM, ACM,v. 16, n. 2, p. 264–285, 1969.
ERKAN, G.; RADEV, D. R. Lexrank: graph-based lexical centrality as salience in textsummarization. Journal of Artificial Intelligence Research, p. 457–479, 2004.
EVANS, D. K.; KLAVANS, J. L. Simfinderml: multilingual text similarity identification,experimentation, and evaluation. Journal of ACM Computer Documentation, ACM, p. 1–2,2003.
GANESAN, K.; ZHAI, C.; HAN, J. Opinosis: a graph-based approach to abstractivesummarization of highly redundant opinions. In: INTERNATIONAL CONFERENCE ONCOMPUTATIONAL LINGUISTICS. Proceedings... [S.l.]: Association for ComputationalLinguistics, 2010. p. 340–348.
GANU, G.; ELHADAD, N.; MARIAN, A. Beyond the stars: Improving rating predictionsusing review text content. In: INTERNATIONAL WORKSHOP ON THE WEB ANDDATABASES. Proceedings... [S.l.]: ACM, 2009. v. 9, p. 1–6.
GATT, A.; REITER, E. Simplenlg: A realisation engine for practical applications. In:EUROPEAN WORKSHOP ON NATURAL LANGUAGE GENERATION. Proceedings...[S.l.]: Association for Computational Linguistics, 2009. p. 90–93.
GUPTA, V.; LEHAL, G. S. A survey of text summarization extractive techniques. Journal ofEmerging Technologies in Web Intelligence, v. 2, n. 3, p. 258–268, 2010.
HABOUSH, A. et al. Arabic text summarization model using clustering techniques. Journalof Computer Science and Information Technology, p. 2221–0741, 2012.
HAHN, U.; MANI, I. The challenges of automatic summarization. Journal of IEEEComputer, IEEE, v. 33, n. 11, p. 29–36, 2000.
HAN, J.; PEI, J.; YIN, Y. Mining frequent patterns without candidate generation. In:INTERNATIONAL CONFERENCE ON MANAGEMENT OF DATA. Proceedings... NewYork, NY, USA: ACM, 2000. v. 29, n. 2, p. 1–12. ISSN 0163-5808.
HARMAN, D.; OVER, P. The effects of human variation in duc summarization evaluation.In: INTERNATION WORKSHOP ON TEXT SUMMARIZATION BRANCHES OUT.Proceedings... [S.l.]: ACL, 2004. p. 10–17.
HENNIG, L.; LABOR, D. Topic-based multi-document summarization with probabilisticlatent semantic analysis. In: INTERNATION CONFERENCE ON RECENT ADVANCES INNATURAL LANGUAGE PROCESSING. Proceedings... Borovets, Bulgaria: ACL, 2009. p.144–149.
HOVY, E.; LIN, C.-Y. Automated text summarization and the summarist system.In: INTERNATION WORKSHOP ON HELD. Proceedings... [S.l.]: Association forComputational Linguistics, 1998. p. 197–214.
HU, M.; LIU, B. Mining and summarizing customer reviews. In: INTERNATIONALCONFERENCE ON KNOWLEDGE DISCOVERY AND DATA MINING. Proceedings...[S.l.]: ACM, 2004. p. 168–177.

86
JIN, F.; HUANG, M.; ZHU, X. A query-specific opinion summarization system. In:INTERNATIONAL CONFERENCE ON COGNITIVE INFORMATICS. Proceedings... [S.l.]:IEEE, 2009. p. 428–433.
JING, H. et al. Summarization evaluation methods: Experiments and analysis. In: AAAISYMPOSIUM ON INTELLIGENT SUMMARIZATION. Proceedings... [S.l.]: AAAI Press,1998. p. 51–59.
KAMPS, J. et al. Using wordnet to measure semantic orientations of adjectives. In:INTERNATIONAL CONFERENCE ON LANGUAGE RESOURCES AND EVALUATION.Proceedings... Lisbon, PT, 2004. p. 1115—-1118.
KIM, H. D. et al. Comprehensive review of opinion summarization. Journal of ComputerEngineering and Applications, v. 4, 2014.
KIM, H. D.; ZHAI, C. Generating comparative summaries of contradictory opinions intext. In: INTERNATION CONFERENCE ON INFORMATION AND KNOWLEDGEMANAGEMENT. Proceedings... [S.l.]: ACM, 2009. p. 385–394.
KIM, Y.; SRIVASTAVA, J. Impact of social influence in e-commerce decision making. In:INTERNATIONAL CONFERENCE ON ELECTRONIC COMMERCE. Proceedings... [S.l.]:ACM, 2007. p. 293–302.
KU, L.-W.; LIANG, Y.-T.; CHEN, H.-H. Opinion extraction, summarization and trackingin news and blog corpora. In: AAAI SPRING SYMPOSIUM ON COMPUTATIONALAPPROACHES TO ANALYZING WEBLOGS. Proceedings... [S.l.]: AAAI Press, 2006. v.100107.
KUPIEC, J. M. et al. Automatic method of generating feature probabilities for automaticextracting summarization. [S.l.]: Google Patents, 1998. US Patent 5,778,397.
KYOOMARSI, F. et al. Optimizing text summarization based on fuzzy logic. In:INTERNATIONAL CONFERENCE ON COMPUTER AND INFORMATION SCIENCE,2008. Proceedings... [S.l.], 2008. p. 347–352.
LABBE, C.; LABBE, D. How to measure the meanings of words? amour in corneille’swork. Journal of Language Resources and Evaluation, Springer Netherlands, v. 39, n. 4, p.335–351, 2005.
LABBE, C. et al. Rnr: Extracting rationale from online reviews and ratings. In:INTERNATIONAL CONFERENCE ON DATA MINING. Proceedings... [S.l.]: IEEE, 2010.p. 358–368.
LAPATA, M.; BARZILAY, R. Automatic evaluation of text coherence: Models andrepresentations. In: INTERNATIONAL JOINT CONFERENCE ON ARTIFICIALINTELLIGENCE. Proceedings... [S.l.], 2005. v. 5, p. 1085–1090.
LESK, M. Automatic sense disambiguation using machine readable dictionaries: how to tella pine cone from an ice cream cone. In: INTERNATIONAL CONFERENCE ON SYSTEMSDOCUMENTATION. Proceedings... [S.l.]: ACM, 1986. p. 24–26.

87
LIN, C.-Y. Rouge: A package for automatic evaluation of summaries. In: INTERNATIONWORKSHOP ON TEXT SUMMARIZATION BRANCHES OUT. Proceedings... [S.l.], 2004.p. 74–81.
LIN, C.-Y.; HOVY, E. Automatic evaluation of summaries using n-gram co-occurrencestatistics. In: CONFERENCE OF THE NORTH AMERICAN CHAPTER OF THEASSOCIATION FOR COMPUTATIONAL LINGUISTICS ON HUMAN LANGUAGETECHNOLOGY. Proccedings... [S.l.]: Association for Computational Linguistics, 2003. v. 1,p. 71–78.
LIU, B. Web data mining. [S.l.]: Springer Science & Business Media, 2007.
LIU, B.; HU, M.; CHENG, J. Opinion observer: analyzing and comparing opinions on theweb. In: INTERNATIONAL CONFERENCE ON WORLD WIDE WEB. Proceedings... [S.l.]:ACM, 2005. p. 342–351.
LU, Y.; ZHAI, C.; SUNDARESAN, N. Rated aspect summarization of short comments. In:INTERNATIONAL CONFERENCE ON WORLD WIDE WEB. Proceedings... [S.l.]: ACM,2009. p. 131–140.
LUHN, H. P. A statistical approach to mechanized encoding and searching of literaryinformation. Journal IBM of research and development, IBM, v. 1, n. 4, p. 309–317, 1957.
MANNING, C. D.; RAGHAVAN, P.; SCHÜTZE, H. Introduction to information retrieval.[S.l.]: Cambridge university press Cambridge, 2008.
MANNING, C. D.; SCHÜTZE, H. Foundations of statistical natural language processing.[S.l.]: MIT press, 1999.
MCAULEY, J. J.; LESKOVEC, J. From amateurs to connoisseurs: Modeling the evolution ofuser expertise through online reviews. In: INTERNATIONAL CONFERENCE ON WORLDWIDE WEB. Proccedings... Republic and Canton of Geneva, Switzerland, 2013. p. 897–908.
MCKEOWN, K. R. et al. Tracking and summarizing news on a daily basis with columbia’snewsblaster. In: INTERNATIONAL CONFERENCE ON HUMAN LANGUAGETECHNOLOGY RESEARCH. Proceedings... [S.l.]: Morgan Kaufmann Publishers Inc., 2002.p. 280–285.
MEI, Q. et al. Topic sentiment mixture: modeling facets and opinions in weblogs. In:INTERNATIONAL CONFERENCE ON WORLD WIDE WEB. Proceedings... [S.l.]: ACM,2007. p. 171–180.
MITCHELL, T. M. Machine learning and data mining. Journal of ACM Communications,ACM, v. 42, n. 11, p. 30–36, 1999.
MOGHADDAM, S.; ESTER, M. Opinion digger: an unsupervised opinion miner fromunstructured product reviews. In: INTERNATIONAL CONFERENCE ON INFORMATIONAND KNOWLEDGE MANAGEMENT. Proceedings... [S.l.]: ACM, 2010. p. 1825–1828.
NENKOVA, A. Summarization evaluation for text and speech: issues and approaches.In: INTERNATIONAL CONFERENCE ON SPOKEN LANGUAGE PROCESSING.Proceedings... [S.l.], 2006.
88
NENKOVA, A. Understanding the process of multi-document summarization: contentselection, rewriting and evaluation. Thesis (PhD) — Columbia University, 2006.
NENKOVA, A.; MASKEY, S.; LIU, Y. Automatic summarization. In: ANNUAL MEETINGOF THE ASSOCIATION FOR COMPUTATIONAL LINGUISTICS. Proceedings... [S.l.]:Association for Computational Linguistics, 2011. p. 3.
NENKOVA, A.; PASSONNEAU, R.; MCKEOWN, K. The pyramid method: Incorporatinghuman content selection variation in summarization evaluation. ACM Transactions on Speechand Language Processing, ACM, v. 4, n. 2, p. 4, 2007.
PALMER, D. D. Text pre-processing. In: INDURKHYA, N.; DAMERAU, F. J. (Ed.).Handbook of Natural Language Processing, Second Edition. Boca Raton, FL: CRC Press,Taylor and Francis Group, 2010. ISBN 978-1420085921.
PANG, B.; LEE, L. Opinion mining and sentiment analysis. Journal of Foundations andtrends in information retrieval, Now Publishers, v. 2, n. 1-2, p. 1–135, 2008.
PANG, B.; LEE, L.; VAITHYANATHAN, S. Thumbs up?: sentiment classification usingmachine learning techniques. In: INTERNATION CONFERENCE ON EMPIRICALMETHODS IN NATURAL LANGUAGE PROCESSING. Proceedings... [S.l.]: Associationfor Computational Linguistics, 2002. v. 10, p. 79–86.
PAPINENI, K. et al. Bleu: a method for automatic evaluation of machine translation. In:ANNUAL MEETING ON ASSOCIATION FOR COMPUTATIONAL LINGUISTICS.Proceedings... [S.l.]: Association for Computational Linguistics, 2002. p. 311–318.
POIBEAU, T. et al. Multi-source, Multilingual Information Extraction and Summariza-tion. [S.l.]: Springer Science & Business Media, 2012.
POPESCU, A.-M.; ETZIONI, O. Extracting product features and opinions from reviews. In:Natural language processing and text mining. [S.l.]: Springer, 2007. p. 9–28.
PORTET, F. et al. Automatic generation of textual summaries from neonatal intensive care data.In: INTERNATIONAL CONFERENCE ON ARTIFICIAL INTELLIGENCE IN MEDICINE.Proccedings... [S.l.], 2007. p. 227–236.
RADEV, D. et al. Mead-a platform for multidocument multilingual text summarization. In:INTERNATIONAL CONFERENCE ON LANGUAGE RESOURCES AND EVALUATION.Proceedings... [S.l.], 2004.
RADEV, D. R.; TAM, D. Single-document and multi-document summary evaluationvia relative utility. In: INTERNATIONAL CONFERENCE ON INFORMATION ANDKNOWLEDGE MANAGEMENT. Proccedings... [S.l.]: ACM, 2003.
RATH, G.; RESNICK, A.; SAVAGE, T. The formation of abstracts by the selection ofsentences. Journal of American Society for Information Science, American Society forInformation Science, v. 12, n. 2, p. 139–141, 1961.
REITER, E.; DALE, R.; FENG, Z. Building natural language generation systems. [S.l.]:MIT Press, 2000.
ROTEM, N. Open Text Summarizer. 2012. Http://libots.sourceforge.net.

89
RUSSELL, S.; NORVIG, P. Artificial intelligence: a modern approach. [S.l.]: Citeseer,1995.
SALTON, G.; BUCKLEY, C. Term-weighting approaches in automatic text retrieval. Journalof Information processing & management, Elsevier, v. 24, n. 5, p. 513–523, 1988.
SILVA, C.; RIBEIRO, B. The importance of stop word removal on recall values in textcategorization. In: INTERNATIONAL CONFERENCE ON NEURAL NETWORKS.Proceedings... [S.l.]: IEEE, 2003. v. 3, p. 1661–1666.
STOYANOV, V.; CARDIE, C. Toward opinion summarization: Linking the sources.In: INTERNATION WORKSHOP ON SENTIMENT AND SUBJECTIVITY IN TEXT.Proceedings... [S.l.]: Association for Computational Linguistics, 2006. p. 9–14.
TITOV, I.; MCDONALD, R. Modeling online reviews with multi-grain topic models. In:INTERNATIONAL CONFERENCE ON WORLD WIDE WEB. Proceedings... [S.l.]: ACM,2008. p. 111–120.
TOUTANOVA, K.; MANNING, C. D. Enriching the knowledge sources used in a maximumentropy part-of-speech tagger. In: INTERNATION CONFERENCE ON EMPIRICALMETHODS IN NATURAL LANGUAGE PROCESSING AND VERY LARGE CORPORA.Proceedings... [S.l.]: Association for Computational Linguistics, 2000. p. 63–70.
TURNEY, P. D. Thumbs up or thumbs down?: semantic orientation applied to unsupervisedclassification of reviews. In: ANNUAL MEETING ON ASSOCIATION FOR COMPUTA-TIONAL LINGUISTICS. Proceedings... [S.l.]: Association for Computational Linguistics,2002. p. 417–424.
TURNEY, P. D.; LITTMAN, M. L. Measuring praise and criticism: Inference of semanticorientation from association. Journal of ACM Transactions on Information Systems(TOIS), v. 21, n. 4, p. 315–346, 2003.
UMAM, K. et al. Coverage, diversity, and coherence optimization for multi-documentsummarization. Jurnal Ilmu Komputer dan Informasi, v. 8, n. 1, p. 1–16, 2015.
WANG, L. et al. Query-focused opinion summarization for user-generated content. In:INTERNATIONAL CONFERENCE ON COMPUTATIONAL LINGUISTICS. Proceedings...[S.l.]: Association for Computational Linguistics, 2014. p. 1660–1669.
ZHUANG, L.; JING, F.; ZHU, X.-Y. Movie review mining and summarization.In: INTERNATIONAL CONFERENCE ON INFORMATION AND KNOWLEDGEMANAGEMENT. Proceedings... [S.l.]: ACM, 2006. p. 43–50.

90
APPENDIX A - COMPLEMENTARY RESULTS
This appendix presents complementary results obtained from the experiments performed
in the TMW2. The table 7.1 presents the sentences extracted from the mass of review by our
approach. The first column shows the movie title of the related sentence. The column labeled
as Features shows the features extracted from the Association Rule, to guide the sentence selec-
tion. The column labeled Sentence shows the phrase extracted from the mass of reviews. The
sentiment shows the rating of the review, where the related sentence were extracted. Next, the
Support and Confidence of the Association Rule is given. The Column labeled as Score shows
the final scored obtained by the sub-modular function-based described in Chapter 5
Table 7.2 shows the TMW2 summary to teenager female. The firs column describe the
movie title. The second show the features of the personalized summary. The table also shows a
positive and negative explanation containing a short explanatory text and five sentences.

91
Tabl
e7.
1:E
xtra
cted
Sent
ence
sfr
omre
view
s
Mov
ieFe
atur
esSe
nten
ceSe
ntim
ent
Supp
ort
Con
fiden
ceSc
ore
Pulp
Fict
ion
Fem
ale,
Teen
ager
Thi
sm
ovie
wou
ldbe
onm
yto
pte
nW
hatc
anIs
ay?
+0.
2020
0.40
400.
7770
Pulp
Fict
ion
Fem
ale,
Twen
ties
One
part
ofth
em
ovie
Ilik
ew
asth
atth
eyne
ver
show
edyo
uw
hatw
asin
the
case
.+
0.30
502
0.5
0.76
60
Pulp
Fict
ion
Fem
ale,
Thi
rtie
sPU
LP
FIC
TIO
Nis
Que
ntin
Tara
ntin
o’s
MA
STE
RPI
EC
E!t
hebe
stfil
mhe
ever
mad
e!+
0.36
800.
50.
7968
Pulp
Fict
ion
Mal
e,Te
enag
erT
his
mov
iew
ould
beon
my
top
ten
Wha
tcan
Isay
?+
0.20
200.
4040
0.77
70Pu
lpFi
ctio
nM
ale,
Twen
ties
Wha
tyo
um
ight
not
know
isth
atth
eea
chan
dev
ery
scen
eis
alit
tlem
ovie
inof
itsel
f.+
0.20
70.
414
0.78
95
Pulp
Fict
ion
Mal
e,T
hirt
ies
Ifyo
uha
ven’
tsee
nit
you
have
mis
sed
one
ofth
ebe
stfil
ms
ofth
ela
st20
year
s.+
0.08
930.
50.
7545
Pulp
Fict
ion
Fem
ale,
Teen
ager
Mos
tpeo
ple
that
have
the
slig
htes
tpro
blem
with
afil
mw
illra
teit
one
star
soat
leas
tI’m
fair.
-0.
2020
0.40
400.
9217
Pulp
Fict
ion
Fem
ale,
Twen
ties
Als
oa
little
know
nfa
ctis
that
Jona
than
Win
ters
was
toha
vea
cam
eoin
the
film
,but
beca
me
illdu
ring
the
shoo
ting.
-0.
2020
0.5
0.94
01
Pulp
Fict
ion
Fem
ale,
Thi
rtie
sB
TW
,the
fact
ther
ear
eal
lthe
se"K
id’s
Rev
iew
s"of
this
mov
iehe
reis
dist
urbi
ng.
-0.
3680
0.5
0.88
93
Pulp
Fict
ion
Mal
e,Te
enag
erPr
obab
lym
yfa
vori
tepa
rtof
the
mov
ie,
iten
dsin
the
base
men
tof
apa
wn-
shop
,with
asw
ord
and
and
ape
rver
ted
cop
nam
edZ
ed.
-0.
1122
0.5
0.89
45
Pulp
Fict
ion
Mal
e,Tw
entie
sT
his
isH
ISm
ovie
,and
his
dial
ogue
and
man
neri
sms
are
soin
tune
with
Tara
ntin
o’s
wri
ting,
you
won
der
ifth
isis
how
Jack
son
real
lyis
inlif
e(h
ope
not)
.
-0.
207
0.41
40.
9081
Pulp
Fict
ion
Mal
e,T
hirt
ies
Whe
nhe
dies
they
will
refe
rto
him
first
and
fore
mos
tas
the
dire
ctor
ofPU
LP
FIC
TIO
N.
-0.
0893
0.5
0.90
51
Forr
estG
ump
Fem
ale,
Teen
ager
Tha
nks,
Tom
!To
mH
anks
give
san
outs
tand
ing
perf
orm
ance
inon
eof
the
best
mov
iesI
have
ever
seen
,and
this
one
isal
soon
eof
my
favo
rite
s!+
0.11
850.
355
0.78
17

92
Forr
estG
ump
Fem
ale,
Twen
ties
Thi
sm
ovie
ison
eof
the
best
mov
ies
that
Ihav
eev
erse
en;T
omH
anks
has
gott
obe
one
ofth
ebe
stac
tors
ofou
rtim
e.+
0.11
853
0.35
50.
8265
Forr
estG
ump
Fem
ale,
Thi
rtie
sT
here
isno
thin
gI
can
say
toth
ose
mill
ions
ofyo
uw
hoha
vese
enth
isA
llIc
ando
,is
give
you
my
revi
ew.
+0.
1185
30.
3555
0.75
64
Forr
estG
ump
Fem
ale,
Teen
ager
Ihad
totu
rnm
yT
Vup
and
itst
arte
dto
buzz
.-
0.11
850.
3555
0.90
99Fo
rres
tGum
pFe
mal
e,Tw
entie
sIh
ate
Tom
Han
ks,b
uthe
isa
good
acto
rand
this
show
isin
tere
stin
g,if
high
lyun
prob
able
.-
0.11
850.
3555
0.93
65
Forr
estG
ump
Fem
ale,
Thi
rtie
sIc
anea
sily
read
the
wor
dson
sign
sin
the
mov
ie.
-0.
1185
0.35
550.
9261
The
Sile
nce
ofth
eL
ambs
Fem
ale,
Teen
ager
"Han
niba
lthe
Can
niba
l",a
geni
usse
rial
kille
rwho
ate
part
sof
his
vic-
tims.
+0.
0885
0.5
0.74
60
The
Sile
nce
ofth
eL
ambs
Fem
ale,
Twen
ties
The
stor
y,as
we
allk
now
byno
w,r
evol
ves
arou
ndha
unte
dFB
IA
gent
Cla
rice
Star
ling
(Jod
ieFo
ster
)tr
ying
toge
tinf
orm
atio
nou
tof
impr
is-
oned
cann
ibal
istic
kille
rHan
niba
lLec
ter(
Ant
hony
Hop
kins
)on
ase
rial
kille
rcal
led
Buf
falo
Bill
(Ted
Lev
ine)
.
+0.
1933
0.5
0.80
14
The
Sile
nce
ofth
eL
ambs
Fem
ale,
Thi
rtie
sC
lari
ceSt
arlin
gis
aFB
Itra
inee
who
isas
sign
edby
herb
oss
Jack
Cra
w-
ford
,to
help
inth
eca
seof
Buf
falo
Bill
,a
seri
alki
ller
who
skin
shi
svi
ctom
s.
+0.
1097
0.5
0.75
74
The
Sile
nce
ofth
eL
ambs
Mal
e,Te
enag
erA
sgo
odas
the
mov
ieis
,am
Ith
eon
lype
rson
inth
ew
orld
who
thin
ksbo
thac
tors
have
done
bette
rwor
kin
othe
rfilm
s?+
0.09
20.
50.
7799
The
Sile
nce
ofth
eL
ambs
Mal
e,Tw
entie
sJo
die
Fost
erst
ars
asC
lari
ceSt
arlin
g,an
FBIa
gent
intr
aini
ng.
+0.
209
0.5
0.80
08
The
Sile
nce
ofth
eL
ambs
Mal
e,T
hirt
ies
Thi
sis
anex
celle
ntm
ovie
buti
fyo
u’re
one
ofth
eve
ryfe
wpe
ople
out
ther
ew
hoha
vene
vers
een
itbe
fore
then
I’d
reco
mm
end
that
you
shou
ldre
adth
ebo
okfir
st,b
ecau
seit’
sju
stfa
ntas
tic.
+0.
0953
0.5
0.75
27
The
Sile
nce
ofth
eL
ambs
Fem
ale,
Teen
ager
"The
Sile
nce
ofth
eL
ambs
"is
agr
eatm
ovie
inal
mos
teve
ryw
ay.
-0.
0885
0.40
400.
7940
The
Sile
nce
ofth
eL
ambs
Fem
ale,
Twen
ties
The
mov
iew
aspr
edic
tabl
eat
times
and
itsdi
rect
ion
was
shak
yat
the
sam
etim
e.-
0.19
330.
50.
8640
The
Sile
nce
ofth
eL
ambs
Fem
ale,
Thi
rtie
sT
his
glar
ing
inac
cura
cyth
roug
hout
the
mov
iele
ads
me
toco
nclu
deth
atth
eSt
arlin
gch
arac
teri
sno
thin
gbu
twin
dow
dres
sing
.-
0.10
970.
50.
8016

93
The
Sile
nce
ofth
eL
ambs
Mal
e,Te
enag
erA
ndH
opki
ns’s
seet
hing
,m
alev
olen
tL
ecte
rm
akes
the
knif
e-w
ield
ing
Nor
man
Bat
esin
"Psy
cho"
look
like
abo
ysc
out.
-0.
092
0.5
0.84
33
The
Sile
nce
ofth
eL
ambs
Mal
e,Tw
entie
sN
onet
hele
ss,I
find
itev
ery
bita
sen
tert
aini
ngno
was
Idid
then
butf
ordi
ffer
entr
easo
ns.
-0.
209
0.5
0.92
47
The
Sile
nce
ofth
eL
ambs
Mal
e,T
hirt
ies
Her
judg
men
tpro
ves
bette
rth
anhi
sas
they
purs
ueB
uffa
loB
illan
dhe
duly
ackn
owle
dges
that
.-
0.09
530.
50.
8428
Tabl
e7.
2:R
elat
edop
inio
nsu
mm
ariz
atio
nsy
stem
s
Mov
iePe
rson
aliz
edsu
mm
ary
toPo
sitiv
eE
xpla
natio
nN
egat
ive
Exp
lana
tion

94
Pulp
Fict
ion
Fem
ale,
Teen
ager
Few
(66%
)wom
enin
thei
rthi
rtie
sen
joy
Pulp
Fict
ion
mov
iew
ithra
ting
of4.
7on
aver
age,
assh
own
inth
efo
llow
ing
sent
ence
sex
trac
ted
from
the
revi
ews:
1)P
ULP
FIC
TIO
Nis
Que
ntin
Tara
ntin
o’s
MA
STE
R-
PIE
CE
!the
best
film
heev
erm
ade!
2)W
haty
oum
ight
notk
now
isth
atth
eea
chan
dev
ery
scen
eis
alit
tlem
ovie
inof
itsel
f.3)
Ifyo
uw
ant
tose
eso
met
hing
like
you
have
neve
rse
enbe
fore
,gi
veth
ism
ovie
atr
y,an
dif
you
are
like
me,
itw
illgi
vene
wm
eani
ngto
the
term
"gre
atm
ovie
".4)
The
pers
onI
was
mos
tsho
cked
tose
ein
this
mov
iew
asB
ruce
Will
is!
5)H
eha
sa
bunc
hof
the
acto
rsta
lkin
gab
out
how
grea
ta
dire
ctor
heis
and
how
heap
proa
ched
the
mak
ing
ofth
em
ovie
,but
Ica
me
away
with
the
sam
equ
estio
nsab
outt
hem
ovie
asId
idw
hen
Iwat
ched
the
Spec
ialF
eatu
res.
Few
(34%
)w
omen
inth
eir
thir
ties
disl
ike
Pulp
Fic-
tion
mov
iew
ithra
ting
of2.
6on
aver
age,
assh
own
inth
efo
llow
ing
sent
ence
sex
trac
ted
from
the
revi
ews:
1)B
TW,t
hefa
ctth
ere
are
allt
hese
"Kid
’sR
evie
ws"
ofth
ism
ovie
here
isdi
stur
bing
.2)
How
ever
,man
yof
thes
ese
rve
mer
ely
asen
tert
ain-
men
t,an
ddo
n’tr
evea
lmuc
hin
the
way
ofch
arac
ter
orst
ory.
3)I
love
all
ofth
eac
tors
,B
ruce
Will
isas
abo
xer
runn
ing
from
am
anhe
was
paid
toth
row
afr
ight
,Jo
hnTr
avol
ta,a
ndSa
mue
lJac
kson
with
his
over
act-
ing
both
are
hitm
en,s
entt
oki
llW
illis
.4)
Ther
ear
eal
soa
few
cam
eos,
one
ofw
hich
isC
hris
toph
erW
alke
nw
hoha
sa
com
ical
5m
inut
este
lling
an8
year
old
boy
how
aw
atch
was
smug
gled
safe
lyso
Wal
ken
coul
dgi
veit
toth
ebo
y.5)
Iabs
olut
ely
love
this
mov
ie;i
tis
one
ofth
efe
wfil
ms
that
wou
ldbe
Iwou
ldca
tch
onca
ble
late
atni
ghta
ndI
wou
ldfin
dm
ysel
fsta
ying
upju
stto
finis
hw
atch
ing
it.

95
Forr
estG
ump
Fem
ale,
Teen
ager
Alm
ost
all
(76.
9%)
wom
enin
thei
rtw
entie
sen
joy
Forr
est
Gum
pm
ovie
with
ratin
gof
4.6
onav
erag
e,as
show
nin
the
follo
win
gse
nten
ces
extr
acte
dfr
omth
ere
view
s:1)
This
mov
ieis
one
ofth
ebe
stm
ovie
sth
atIh
ave
ever
seen
;To
mH
anks
has
gott
obe
one
ofth
ebe
stac
tors
ofou
rtim
e.2)
Not
only
will
iten
thra
llyo
u,it
may
just
mak
eyo
ua
bette
rpe
rson
.3)
This
mov
ieis
the
only
mov
ieI
can
say
that
ever
ysi
ngle
pers
onin
my
fam
ilyha
sse
enan
dlo
ved
from
youn
gto
old
and
Ikno
wth
atal
loft
hem
own
it4)
Iam
also
afa
nof
Tom
Han
ksan
dI
doth
ink
that
this
ishi
sbe
stm
ovie
.5)
Than
ks,T
om!
Tom
Han
ksgi
ves
anou
tsta
ndin
gpe
r-fo
rman
cein
one
ofth
ebe
stm
ovie
sI
have
ever
seen
,an
dth
ison
eis
also
one
ofm
yfa
vori
tes!
Few
(23.
1%)
wom
enin
thei
rtw
entie
sdi
slik
eFo
rres
tG
ump
mov
iew
ithra
ting
of2.
4on
aver
age,
assh
own
inth
efo
llow
ing
sent
ence
sex
trac
ted
from
the
revi
ews:
1)I
orde
red
this
mov
iean
dI
was
real
lylo
okin
gfo
rwar
dto
itan
dit
cam
ein
the
mai
lrig
hton
time.
2)I
hate
Tom
Han
ks,b
uthe
isa
good
acto
ran
dth
issh
owis
inte
rest
ing,
ifhi
ghly
unpr
obab
le.
3)So
me
ofth
elin
esha
vebe
com
epa
rtof
our
natio
nal
cultu
re.
4)w
hen
Ibeg
anto
wat
chth
em
ovie
,the
soun
dqu
ality
was
notr
ealg
ood.
5)It
’sne
atse
eing
exac
tlyho
wal
loft
hesp
ecia
leffe
cts
wer
edo
neor
how
soun
dan
dm
akeu
pw
ere
used
toen
hanc
em
ood
inpa
rtic
ular
scen
es.

96
The
Sile
nce
ofth
eL
ambs
Fem
ale,
Teen
ager
Alm
ost
all
(87.
2%)
wom
enin
thei
rtw
entie
sen
joy
The
Sile
nce
ofth
eL
ambs
mov
iew
ithra
ting
of4.
7on
aver
age,
assh
own
inth
efo
llow
ing
sent
ence
sex
-tr
acte
dfr
omth
ere
view
s:1)
Jodi
eFo
ster
star
sasC
lari
ceSt
arlin
g,an
FB
Iage
ntin
trai
ning
.2)
The
stor
y,as
we
allk
now
byno
w,re
volv
esar
ound
haun
ted
FB
IA
gent
Cla
rice
Star
ling
(Jod
ieFo
ster
)tr
ying
toge
tinf
orm
atio
nou
tofi
mpr
ison
edca
nnib
al-
istic
kille
rH
anni
bal
Lect
er(A
ntho
nyH
opki
ns)
ona
seri
alki
ller
calle
dB
uffa
loB
ill(T
edLe
vine
).3)
It’s
rare
for
afil
mto
win
Bes
tAct
or,B
estA
ctre
ss,
Bes
tP
ictu
re,B
est
Dir
ecto
ran
dB
est
Scre
enpl
ayO
s-ca
rs,b
utTh
eSi
lenc
eof
the
Lam
bsdi
dju
stth
at.
4)W
hile
Ilo
veth
isfil
m-
Ith
ink
that
itm
aybe
the
best
seri
alki
ller
film
ever
-I
doth
ink
that
ther
ew
ere
issu
es,o
fcou
rse.
5)Th
esi
lenc
eof
the
lam
bsis
byfa
ron
eof
the
best
mov
ies
inm
ovie
hist
ory.
Few
(12.
8%)
wom
enin
thei
rtw
entie
sdi
slik
eT
heSi
lenc
eof
the
Lam
bsm
ovie
with
ratin
gof
2.6
onav
erag
e,as
show
nin
the
follo
win
gse
nten
ces
extr
acte
dfr
omth
ere
view
s:1)
The
mov
iew
aspr
edic
tabl
eat
times
and
itsdi
rect
ion
was
shak
yat
the
sam
etim
e.2)
This
ison
eof
the
best
mov
ies
tobe
rele
ased
duri
ngth
ela
sttw
enty
year
s.3)
Itw
asa
good
film
,no
ques
tion
abou
ttha
tbut
nota
mas
terp
iece
like
One
Fle
wO
ver
the
Cuc
koo’
sN
est.
4)I’
mgl
adit
won
the
five
big
Aca
dem
yAw
ards
(Bes
tP
ictu
re,B
estA
ctor
,Bes
tAct
ress
,Bes
tDir
ecto
r,B
est
Scre
enpl
ay).
5)Th
eco
mm
enta
rytr
ack,
reco
rded
3ye
ars
afte
rth
em
ovie
cam
eou
t,w
asov
erly
anal
ytic
al.

97
APPENDIX B - FORMS
7.3 Experiment 1: Statistical-based method for sentence extraction
In this Section, we expose the form used to perform a comparative evaluation of the
Statistical-based method for sentence extraction. Thus, Figures 7.1 and 7.2 show the form used
in this task.
Figure 7.1 – TMW1 comparative evaluation form
Source: Developed by author

98
Figure 7.2 – TMW1 comparative evaluation form
Source: Developed by author
7.4 Experiment 2: Graph-based method for sentence extraction
To evaluate Graph-based method for sentence extraction, we built a prototype to collect
the people opinion about reading a summary in a mobile device. Figure 7.3 show the prototype’s
main screen. At the top of the main screen, people were invited to choose a movie title from the
movie list.

99
Figure 7.3 – The TMW prototype’s main screen
Source: Developed by authors
After chose a movie title, enter their personal data, the people are invited to read two
reviews from the film selected, being one from AMHR and other from TMW. Figure 7.6 shows
the TMW’s summary about the Pulp Fiction movie. The TMW2’s summary are composed
by: (i) The movie title and release date; (ii) A short personalized positive summary about the
related movie, showed in green; (iii) A brief personalized negative summary about the related
movie, showed in red; (iv) Five positive sentences, showed into green box; and (v) Five negative
sentences, showed into red box.
Figure 7.4 – Prototype presenting the TMW2’s summary
Source: Developed by authors
Figure 7.5 presents the Amazon Most Helpful Review (AMHR) about the Pulp Fiction

100
movie. Added to the text review, the screen also show the rating and the release movie date.
Figure 7.5 – The prototype showing the AMHR
Source: Developed by authors
After use the prototype to get a movie opinion, the population were invited to response
a survey. Figures 7.6 show the form that the users answered.
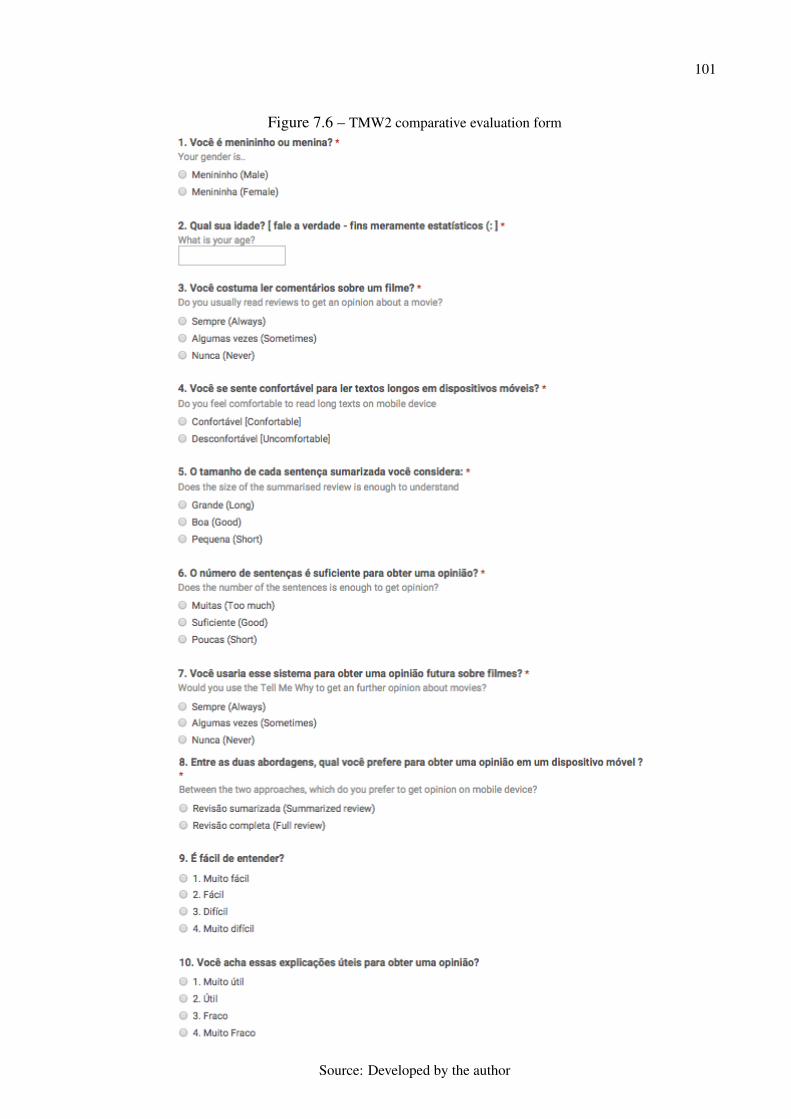
101
Figure 7.6 – TMW2 comparative evaluation form
Source: Developed by the author