Embed Size (px)
Citation preview

NON-CONFIDENTIAL
TELEFÓNICA O2 (UK) LIMITED RESPONSE TO: APPLICATION OF SPECTRUM LIBERALISATION AND TRADING TO THE MOBILE SECTOR (A FURTHER CONSULTATION) 1 MAY 2009

NON-CONFIDENTIAL
TABLE OF CONTENTS
I. INTRODUCTION........................................................................................................................................ 5
II. EXECUTIVE SUMMARY.......................................................................................................................... 7
III. STRUCTURE OF THIS RESPONSE....................................................................................................... 11
IV. THE 2007 CONSULTATION............................................................................................................................ 12
THE FUNDAMENTALLY FLAWED CONSULTATION ....................................................................................................... 12 O2’S RESPONSE .......................................................................................................................................................... 13 SUBSEQUENT EVENTS................................................................................................................................................. 14 OFCOM TAKES ACCOUNT OF THE CONSULTATION RESPONSES .................................................................................... 15
V. DEVELOPMENTS SINCE 2007 ....................................................................................................................... 18
LEGAL BASIS – REVISION OF THE GSM DIRECTIVE .................................................................................................... 19 MARKET FORECASTS.................................................................................................................................................. 21 USAGE GROWTH......................................................................................................................................................... 22 THE DATA RATE ASSUMPTION .................................................................................................................................... 22 TECHNOLOGICAL DEVELOPMENTS ............................................................................................................................. 24 SUBSTITUTE SPECTRUM AND ITS AVAILABILITY FOR USE ........................................................................................... 25 COMPETITION BETWEEN FIXED AND MOBILE BROADBAND ......................................................................................... 25 THE GLOBAL ECONOMIC CRISIS .................................................................................................................................. 26 THE SECOND UMTS900 CARRIER ASSUMPTION ......................................................................................................... 28
VI. COST DIFFERENCES IN DENSELY POPLUATED AREAS ................................................................................ 31
SHARED OR DEDICATED CARRIER? ............................................................................................................................. 32 MAXIMUM GUARANTEED SPEED AT CELL EDGE.......................................................................................................... 32 USAGE GROWTH ASSUMPTIONS AND THEIR IMPLICATIONS ......................................................................................... 35 SIMPLIFICATION OF GEOTYPES/CLUTTER ASYMMETRICALLY AFFECTS UMTS900 ..................................................... 36 NETWORKS ARE BUILT INCREMENTALLY, RATHER THAN PRE-DETERMINED FROM THE OUTSET ................................. 37 DERIVATION OF SCENARIOS FOR THE CBA ................................................................................................................ 39 COST DIFFERENCES RESULTS...................................................................................................................................... 40
VII. COST DIFFERENCES IN LESS-DENSELY POPLUATED AREAS ...................................................................... 42
IN CAR PENETRATION LOSSES ................................................................................................................................... 42 UPLINK LOAD FACTOR............................................................................................................................................... 43 ADJUSTED LESS DENSELY POPULATED AREA SITE COUNTS...................................................................................... 43 CALCULATING “COST ADVANTAGE” .......................................................................................................................... 43 WILL THERE BE ROLLOUT IN RURAL AREAS?.............................................................................................................. 44

NON-CONFIDENTIAL
VIII. COST OF CLEARANCE .................................................................................................................................. 46
THE TRAFFIC GROWTH ASSUMPTION .......................................................................................................................... 46 SFH AND THE RED-M REPORT ................................................................................................................................... 49 CHOICE OF MITIGATION TECHNIQUE BY OPERATORS .................................................................................................. 52 UMTS2100 NETWORK ENHANCEMENT ...................................................................................................................... 53 GSM1800 DEPLOYMENT AND 900MHZ CELL SPLITTING ........................................................................................... 53 NETWORK SHARING ................................................................................................................................................... 54 INCREMENTAL COSTS OF LTE900 RESULTING FROM RELEASE ................................................................................... 55
IX. COMPETITION AND WELFARE ..................................................................................................................... 56
MODEL OF COMPETITION............................................................................................................................................ 56 MARKET SIZE AND SEGMENTATION............................................................................................................................ 59 THE SIZE OF THE HIGH QUALITY MOBILE BROADBAND MARKET SEGMENT ................................................................. 60 PARTIAL MATCHING................................................................................................................................................... 62 ADDITIONAL CONSTRAINTS ON THE PRICING OF MOBILE BROADBAND ....................................................................... 64 SUMMARY.................................................................................................................................................................. 65
X. COST – BENEFIT ANALYSIS ......................................................................................................................... 67
A SIMPLER APPROACH – CONSISTENT WITH BEST PRACTICE ....................................................................................... 68 COST-BENEFIT ANALYSIS FOR POSSIBLE SCENARIOS .................................................................................................. 69 CONCLUSIONS............................................................................................................................................................ 71
XI. ENDURING BENEFITS FOR UK 1800MHZ OPERATORS..................................................................... 72
IT’S ALL ABOUT CAPACITY ......................................................................................................................................... 72 ACCESS TO UMTS1800 IS LESS DISRUPTIVE AND WILL BE POSSIBLE BY 2010............................................................ 73 ACCESS TO 2X20MHZ CONTIGUOUS GIVES A SPEED ADVANTAGE FOR LTE............................................................... 73 ORANGE AND T-MOBILE CAN ACCESS LTE1800 MORE QUICKLY THAN OFCOM SUGGESTS ....................................... 73 OFCOM MUST ACT CONSISTENTLY WHEN LIBERALISING 1800MHZ............................................................................ 74 OFCOM MUST ACT CONSISTENTLY TO ADDRESS THE HOLD-UP RISK AT 2600MHZ ..................................................... 75
XII. PROCEDURAL AND LEGAL FAILURE............................................................................................... 76
XIII. CONCLUSIONS AND REMEDIES............................................................................................................. 77
DIFFERENCES OF OPINION AMONGST VARIOUS “REGULATORS” INCREASE UNCERTAINTY .......................................... 77 AUCTIONS CANNOT PROCEED WITH THIS UNCERTAINTY ............................................................................................ 77 CERTAIN COSTS OF INTERVENTION DOMINATE OVER SPECULATIVE AND POORLY EVIDENCED BENEFITS.................... 78 OFCOM IS CERTAIN TO BREACH ITS DUTY TOWARDS THE CITIZEN .............................................................................. 78 OFCOM PROPOSES TO INTERVENE TO THE BENEFIT OF THE FEW AT THE EXPENSE OF THE MANY................................. 78 A MORE PROPORTIONATE APPROACH ......................................................................................................................... 78
3 of 80

NON-CONFIDENTIAL
ANNEX A DETAILED COST DIFFERENCE ANALYSIS..................................................................................................... 80
ANNEX B DETAILED COST OF CLEARANCE ANALYSIS ................................................................................................ 80
ANNEX C IMPACT OF THE ECONOMIC CRISIS ON THE SECTOR .................................................................................. 80
4 of 80

NON-CONFIDENTIAL
I. INTRODUCTION
1. Telefónica O2 UK Limited (O2) welcomes the opportunity to respond to Ofcom's consultation on the application of spectrum liberalisation and trading to the 900MHz, 1800MHz and 2100MHz licences held by O2, Vodafone, T-Mobile, Orange and H3G.
2. It is clear from this consultation that the Ofcom project team have undertaken a considerable amount of new analysis and significantly improved their information. It is vitally important that Ofcom reaches a clearly evidenced position and the facts that underpin that position are beyond dispute. We would like to thank the project team for the efforts that they have put in to date. It is also clear that the Ofcom Board have expended significant time in discussing this issue and that the governance surrounding the new analysis and data put into the public domain has been much improved since 2007.
3. That said, we remain concerned that Ofcom still tends to accept results from its analysis that confirm its previously held position, rather than really challenging its thinking and relying on the advice of independent experts. If this tendency had been avoided, we believe that the errors in cost advantages calculations shared with us in Summer 2008 and those that remain in this consultation would not have arisen. Once this process is over we hope there will be time to review how such processes are handled in the future and that lessons can be learned by all parties.
4. On many occasions Ofcom has pointed to the divergent views of the MNOs as a major stumbling block in reaching a conclusion on this matter. In our view the positions of the MNOs are not the predominant consideration. What matters is the evidence and that an evidence based decision is objectively justifiable, proportionate and transparent. What the divergent views of the MNOs without 900MHz should tell Ofcom is that perhaps UMTS900 is not the pot of gold that Ofcom’s analysis says it is. If it were, the views of the other MNOs would be perfectly aligned in their desire to secure – at a premium – such valuable spectrum. In reality however:
i. One operator does not appear to value 900MHz and is prepared to wait for 800MHz to be available;
ii. Another doesn’t know whether it does or it doesn’t1 want 900MHz and in contrast to Ofcom, it views the benefits as residing only in rural areas2 3; and
iii. Only one operator has consistently demanded access to 900MHz. That operator appears keen to disrupt the businesses of its competitors rather than have an evidence based case [ …..]. Furthermore, that operator now appears to accept that the cost of
1 See Annex 7 A7.399b2 of the consultation. 2 Orange UK’s parent company France Telecom identifies, in its recent representations to investors (see http://www.orange.com/en_EN/finance/invest-analysts/invest-days/att00003163/090303-IdayITN-VD.pdf , slide 17), “refarming of GSM bands providing resources to improve UMTS coverage, in rural areas first”. 3 See http://www.culture.gov.uk/images/publications/OrangeUK__DBIRResponse.pdf . Notwithstanding Ofcom’s view of significant benefits in urban areas, Orange’s response to the Digital Britain consultation concentrates solely on rollout of UMTS900 to 98.5% pop. coverage.
5 of 80
NON-CONFIDENTIAL
clearance may be too great for wider access to 900MHz to be a viable proposition and that 800MHz may be the next best alternative4.
5. These facts alone should make Ofcom question the accuracy of its cost advantages calculations, if nothing else.
4 http://www.culture.gov.uk/images/publications/T-MobileUK_DBIRResponse.pdf
6 of 80

NON-CONFIDENTIAL
II. EXECUTIVE SUMMARY
6. A like-for-like comparison between the analysis contained in this consultation and O2’s response to the 2007 consultation shows that O2 was broadly correct in its criticism of that consultation. A release of 2x7.5MHz of spectrum in conjunction with refarming by the incumbents would have entailed over 10,000 additional mast sites being constructed, based on unqualified speculation about future mobile broadband network requirements.
7. In this consultation Ofcom adopts the correct methodological approach with regard to the costs of spectrum clearance. Similarly, it adopts a broader range of scenarios with regard to cost differences between UMTS900 and UMTS2100, in order to provide a justification for its revised intervention – release of 2x2.5MHz each by O2 and Vodafone by the end of 2011. Ofcom has also undertaken considerable sensitivity analysis in order to bolster the robustness of this proposal, when compared to the 2007 proposal. Unfortunately, this detailed analysis is undermined by errors in four major assumptions. These assumptions are fundamental to the analysis, Ofcom has failed to stress test these assumptions, presumably because at face value they provide at least some basis for intervention. In order to justify intervention, Ofcom’s analysis must be sufficiently robust to withstand the profound and rigorous scrutiny of the affected parties, independent experts and a review on the merits. It is currently significantly below that standard, in our view.
8. As with the 2007 consultation, Ofcom adopts a methodology and assumptions which significantly over estimate the number of UMTS2100 sites required to match the coverage and quality of a UMTS900 deployment; as well as under estimating the number of sites required to mitigate for spectrum loss to the GSM networks of O2 and Vodafone. The principal fundamental flaws in this consultation are:
i. Failure to appreciate that in urban environments, the end user speed at edge of cell is interference limited: Ofcom’s analysis of the costs differences between UMTS900 and UMTS2100 depends on the number of sites required to provide “high quality mobile broadband“ using the different frequencies. The calculation of the number of sites depends on an assumed user speed at the end of the cell. However, the end user speeds which are used to move the benefits calculation from the low figures calculated by O2 in 2007 (c.£200m) to those contained in the press release for this consultation (c.£1bn), are not feasible in interference limited environments. Ofcom appears to have extrapolated some theoretical data in its model without benchmarking the results against accepted engineering literature and deployed networks. When corrected for this and other technical errors, a cost difference analysis derives maximum benefits of just £290m between 2010 and 2015. In any event, the extent to which these “advantages” will arise is driven by the economics of network build and its relative power as a differentiator compared with, for example, device subsidy. We show that network coverage is not a major differentiator and, [ …..], operators will focus on differentiators with rapid payback rather than long term NPV justified investment in network5.
5 [ …..]
7 of 80

NON-CONFIDENTIAL
Correcting for this error removes all non-matching or partial matching rollout cases in urban areas, hugely diluting Ofcom’s purported welfare benefits.
ii. UMTS2100 networks will not be decommissioned, UMTS900 is an underlay : Ofcom’s models appear to assume large scale decommissioning of UMTS2100 networks when UMTS900 comes on-stream. In Ofcom’s modelling this allows operators to makes significant cost savings by reducing the number of UMTS2100 sites. Even at face value this appears a poor assumption:
a. There are already many millions6 of UTMS2100 only devices to serve, which will remain in active use for many years.
b. Decommissioning incurs significant costs and so the cost / benefit of such an approach would be compromised; and
c. Usage per user will be such that a shared voice and data UMTS900 carrier would require UMTS2100 to be available for capacity off-load.
Furthermore, there remains an obligation to provide coverage to 80% of the population using UMTS2100 until end 2021.
iii. Traffic growth in 2G networks means higher clearance costs: Ofcom assumes a value for traffic growth that is at odds with evidence from today’s traffic profiles that Ofcom itself publishes. The available evidence shows that 2G traffic volumes will be much greater than Ofcom assumes. With higher 2G volumes the number of additional sites required to clear 900MHz spectrum increases significantly. O2’s market strategy has focussed on increasing the richness of our customer proposition rather than ARPU dilution, ie we have given consumers more for the same money, rather than reduce headline revenue per user. In so doing, we have taken the number one position in the UK market. [ …..]
iv. Reliance on Synthesised Frequency Hopping as a mitigation technique to off-set the loss of 2x2.5MHz caused by intervention: Ofcom assumes that SFH can be used to improve spectral efficiency of the 900MHz spectrum, so that fewer additional 2G sites are needed to mitigate the effect of the decreased spectrum available for O2’s 2G traffic. We demonstrate why no operator in the UK has implemented SFH, notwithstanding that all operators are driven by economic imperative to work their spectrum as hard as possible. Removing SFH from the equation and revisting the 2G traffic assumption leads to Ofcom’s proposals costing O2 and Vodafone jointly c.£700m and requiring the construction of c.2,400 additional 2G mast sites, with build starting around May 2010. These sites are certain to be built, notwithstanding the speculative nature of the purported benefits.
9. O2’s cost benefit analysis identifies no scenario where the total benefits outweigh the total costs of intervention. In fact, even in the best case, the costs are nearly twice the benefits. In the worst cast they are six times larger.
6 O2, for example, now has over [ …..] UMTS2100 only devices active on its network.
8 of 80

NON-CONFIDENTIAL
10. The main downside impact of these proposals will be felt by citizens (householders) in urban areas, whereas the only upside benefits may be felt by a few high value consumers in rural areas. Citizens will be impacted from the start of 2010 by a massive mast building programme in urban centres to off-set spectrum release. Rural consumers may benefit in the longer term from limited rollout of UMTS900. Ofcom has a primary duty towards citizens7 which in this case must dominate over its parallel duty towards consumers.8
11. We note that Ofcom’s welfare analysis focuses on the welfare benefits to high value customers obtaining better services. Whereas the costs will be incurred by all in society in urban areas. Furthermore, if the current retail market is distorted as a result of intervention, that will be felt most strongly in capacity rationing to the least profitable customers9. We believe that the Communications Consumer Panel needs to be particularly alive to the adverse distributional effects of Ofcom’s proposals.
12. The revisions to the GSM Directive that will be passed into law this Summer require that within six months Ofcom amends the 900MHz licences of O2 and Vodafone. Whatever else Ofcom chooses to do, including any remedies regarding competition issues, liberalisation of 1800MHz and 2100Mz licences are out of the scope of the Directive. No urgent timetable binds Ofcom in these parallel decisions. However, Ofcom is required under law to make consistent decisions.
13. We appreciate that before 800MHz is available there may be advantages accruable by 900MHz licensees to the extent that there is significant rollout of UMTS900 in rural areas. That would suggest that the most appropriate remedies for Ofcom to consider are to:
i. Bring forward 800MHz spectrum for mobile broadband on a more aggressive timetable, in order to provide an infrastructure substitute; and
ii. Encourage network sharing or network access on commercial terms; and / or
iii. Consider, in the light of evidence at the time, whether the use of Ofcom’s ex post competition powers under the Competition Act or the Enterprise Act will achieve a more proportionate outcome.
14. In comparable cases Ofcom has highlighted that its powers under the Competition Act and potentially the Enterprise Act provide a sufficient basis for it to intervene10, we see no difference here. We believe that this approach would give all parties comfort that competition would not be distorted before substitute spectrum is available on the market at 800MHz.
15. [ …..]
16. Finally, we highlight the discriminatory treatment that Ofcom has proposed when looking at substitution between spectrum bands and in particular the issue of hold-up in auctions of
7 s3(1)a of the Communications Act 2003. 8 s3(1)b of the 2003 Act. 9 [ …..] 10 http://www.ofcom.org.uk/consult/condocs/sec/ §1.5, §1.9
9 of 80

NON-CONFIDENTIAL
substitute spectrum. In order to comply with its duties Ofcom will need to ensure that it consistently addresses hold-up with regard to:
i. 900MHz ownership and rules surrounding participation in the 800MHz auction; and
ii. 2x30MHz 1800MHz ownership and access to 2x20MHz in the 2600MHz auction.
17. A coterminous decision is required in order to secure fair treatment for all and move the spectrum awards process forward. This is only in this way that the Government’s ambitions may be realised.
10 of 80

NON-CONFIDENTIAL
III. STRUCTURE OF THIS RESPONSE
18. The remainder of this document is structured as follows:
iv. The 2007 consultation : we compare the results of the 2007 consultation on a like-for-like basis with the revised calculations in this consultation – highlighting how on that basis there is no case for any intervention;
v. Developments since 2007 : the market has moved on since 2007 and Ofcom uses a number of reasons to justify changing the basis of its benefits calculation. We review each of these reasons in turn and comment on their evidential basis, the sensitivity of Ofcom’s conclusions to them and where appropriate provide more realistic assumptions;
vi. Cost differences in densely populated areas review : a summary of the results of the detailed analysis in Annex A of this response;
vii. Cost differences in less - densely populated areas review : we provide a short review of Ofcom’s assumptions and analysis.
viii. Cost of clearance review : a summary of the results of the detailed analysis in Annex B of this response;
ix. Competition and welfare : in this section we evaluate Ofcom’s welfare analysis.
x. Cost – benefit analysis : We use a simplified scenario based approach to examine the case (or otherwise) for intervention;
xi. Enduring benefits for UK 1800MHz operators
xii. Procedural and legal failure
xiii. Conclusions and Remedies.
19. In addition, the following annexes are appended:
A. Detailed cost differences analysis;
B. Detailed cost of clearance analysis;
C. Impact of the economic crisis on the sector.
11 of 80
NON-CONFIDENTIAL
IV. THE 2007 CONSULTATION
20. Before conducting a review of the current consultation, it is important to step back and summarise the outcome of the September 2007 consultation, in light of Ofcom’s revised analysis. We do not do this to draw attention to the failings of the 2007 consultation, rather as we show later, it is important to understand the sequence and timing of events that has led to the current consultation adopting the methodology it has.
The fundamentally flawed consultation
21. On 20th September 2007, Ofcom heralded the first consultation on spectrum liberalisation and trading with the following press release11:
“Liberalising the spectrum could bring very large benefits to citizens and consumers, as it will allow major improvements to be made at low cost to the capacity and coverage of 3G networks. Ofcom estimates the benefits to the UK of liberalising the 2G spectrum could be in the order of £6bn.
Almost all of these benefits are likely to flow from use of the 900MHz band. This is because it is lower frequency than the other bands used for mobile services, making it particularly good for providing 3G services in rural areas and delivering such services inside buildings. In addition, equipment using 900MHz for 3G services is now starting to be manufactured.
In particular, future 3G services rolled out using 900MHz would require far fewer mobile phone masts than if higher frequencies were used. It would be possible to build a high quality mobile broadband network covering 99 per cent of population using around 10,000 fewer sites per operator.
The 900MHz band is likely to be so important that we should ensure that more operators have access to this spectrum in future. Wider access is needed to ensure that competition and innovation continue to thrive in the UK mobile sector.
For these reasons, Ofcom is today proposing that some spectrum currently used by Vodafone and O2 for 2G services should be released for use by others in future.”
[Our emphasis]
22. Despite characterising this as its “initial view”, Ofcom appeared sufficiently confident of its position to state that:
i. The benefits of liberalising the 900MHz spectrum were £6bn; and that
ii. Without access to 900MHz spectrum, other operators would need to deploy 29,000 base stations at 2100MHz to remain competitive on quality in a market with a UMTS900 operator.
11 http://www.ofcom.org.uk/media/news/2007/09/nr_20070920
12 of 80

NON-CONFIDENTIAL
iii. Release of 2x7.5MHz of 900MHz spectrum by O2 and Vodafone would not only result in five operators providing UMTS900, but that it could be done without the requirement to deploy base station sites to mitigate the loss of spectrum;
iv. 50,000 fewer base stations would be required as a result of Ofcom’s proposals.
23. Consequently, Ofcom justified this interventionist proposal on the basis of both its primary duty, to further the interests of consumers where appropriate by promoting competition, and on spectrum efficiency grounds. Efficient use of spectrum was defined as requiring the deployment of as few base stations as possible – something that would also be in the wider interests of citizens and the planning departments of Local Authorities.
O2’s response
24. O2’s response, by contrast, suggested that there were some fundamental flaws in Ofcom’s analysis – both technical and methodological. Importantly, Ofcom had only accounted for the costs of O2 and Vodafone releasing 900MHz spectrum for a future award. Ofcom had not calculated the consequent increased cost placed on O2 and Vodafone to refarm 2x5MHz each of their remaining spectrum to UMTS900. Alarmingly, elsewhere in the consultation Ofcom admitted12, that if O2 or Vodafone had refarmed “it is highly unlikely that a GSM network would be able to continue carrying the remaining 2G traffic with such a low quantity of spectrum available”. Essentially the consultation failed on its own terms.
25. On the benefits side there appeared to be some fundamental problems with Ofcom’s coverage modelling, but the consultation document provided insufficient detail of the approach for us to tease out what the errors were. Consequently we provided our own analysis based on our internal radio planning tools.
26. As of December 2007 there was a significant divergence of view between O2’s position and that of Ofcom, which we summarise in the table below.
12 2007 consultation §A9.141
13 of 80
NON-CONFIDENTIAL
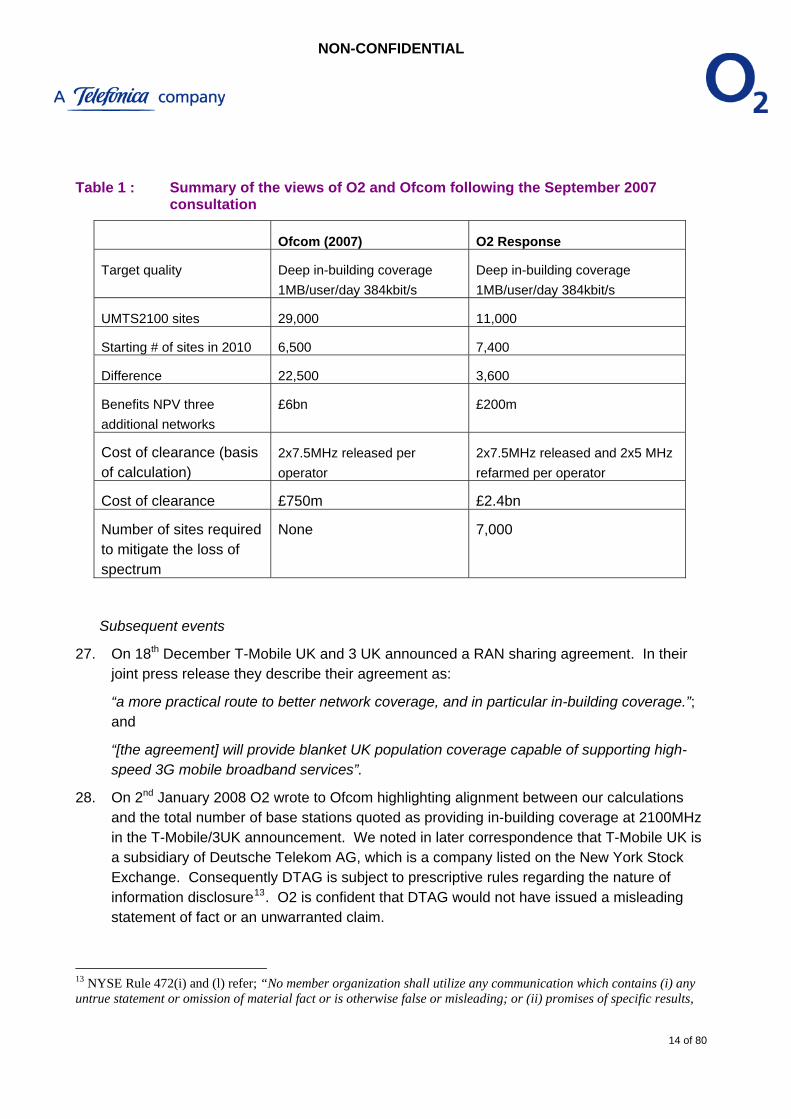
Table 1 : Summary of the views of O2 and Ofcom following the September 2007 consultation
Ofcom (2007) O2 Response
Target quality Deep in-building coverage 1MB/user/day 384kbit/s
Deep in-building coverage 1MB/user/day 384kbit/s
UMTS2100 sites 29,000 11,000
Starting # of sites in 2010 6,500 7,400
Difference 22,500 3,600
Benefits NPV three additional networks
£6bn £200m
Cost of clearance (basis of calculation)
2x7.5MHz released per operator
2x7.5MHz released and 2x5 MHz refarmed per operator
Cost of clearance £750m £2.4bn
Number of sites required to mitigate the loss of spectrum
None 7,000
Subsequent events
27. On 18th December T-Mobile UK and 3 UK announced a RAN sharing agreement. In their joint press release they describe their agreement as:
“a more practical route to better network coverage, and in particular in-building coverage.”; and
“[the agreement] will provide blanket UK population coverage capable of supporting high-speed 3G mobile broadband services”.
28. On 2nd January 2008 O2 wrote to Ofcom highlighting alignment between our calculations and the total number of base stations quoted as providing in-building coverage at 2100MHz in the T-Mobile/3UK announcement. We noted in later correspondence that T-Mobile UK is a subsidiary of Deutsche Telekom AG, which is a company listed on the New York Stock Exchange. Consequently DTAG is subject to prescriptive rules regarding the nature of information disclosure13. O2 is confident that DTAG would not have issued a misleading statement of fact or an unwarranted claim.
13 NYSE Rule 472(i) and (l) refer; “No member organization shall utilize any communication which contains (i) any untrue statement or omission of material fact or is otherwise false or misleading; or (ii) promises of specific results,
14 of 80

NON-CONFIDENTIAL
Ofcom takes account of the consultation responses
29. On 27th May Ofcom held a meeting with all five MNOs. At that meeting it presented its revised analysis of the benefits of UMTS900 cf. UMTS2100. It confidently concluded that its calculations from September 2007 were broadly accurate, notwithstanding the evidence from the T-Mobile / 3UK announcement.
30. On 5th June, Ofcom held a further meeting with all five MNOs. At that meeting it revealed that it had underestimated the cost of clearance by some considerable margin and made a number of methodological errors. In particular:
i. That the correct counterfactual to its proposal was refarming by the incumbents alone. So the cost of clearance should be the incremental cost of releasing spectrum over and above the costs of refarming 2x5MHz each for O2 and Vodafone’s own uses; and
ii. There is no free lunch – less spectrum requires more base stations in capacity constrained networks. Many thousands in fact.
31. Each operator was invited to review the analysis from the two presentations and make further submissions / hold bi-lateral meetings. What was clear at this stage was that Ofcom was presented with the rather unpalatable mix of high benefits and high costs, rather than the rosy world of high benefits and low costs it foresaw in September 2007.
32. At O2’s bi-lateral on cost of clearance we provided a number of observations, not least that 2G traffic growth from 2008 was a key variable, given that there is a non-linear impact of traffic on the cost of clearance – we will return to this issue later.
33. On the cost difference analysis we presented diagrams similar to those at Figure 8, page 28 of Annex 13 of the current consultation. Which we reproduce below.
exaggerated or unwarranted claims; or (iii) opinions for which there is no reasonable basis; or (iv) projections or forecasts of future events which are not clearly labled as forecasts.”
15 of 80

NON-CONFIDENTIAL
Figure 1 : Impact of capacity on site count differences
Source : Ofcom
34. Essentially the more traffic there is in a network the less relevant differences in carrier frequency become. The size of the cell is capacity rather than coverage limited, as in UMTS networks cell size is defined by the aggregate power (a function of both coverage and capacity) available in a cell. We did not see Ofcom’s modelling behaving in the way identified in accepted engineering literature and asked for more details in order to work out what the issues were.
35. By August we had been provided with sufficient information to determine that significant errors in the uplink calculations had led to Ofcom building a network that was massively over specified and consequently able to consume huge volumes of traffic without any requirement to cell split. We communicated this to Ofcom on 29th August. By 18th September Ofcom admitted to us that it could now reproduce scenarios “fairly close to the results of your analysis”.14
36. Ofcom has made significant amendments to its radio modelling, which is welcome. We provide further corrections in Annex A. However, broadly, on a like-for-like basis Ofcom’s data now agrees with that of O2’s 2007 response and the press release of T-Mobile / 3UK.
14 [ …..]
16 of 80

NON-CONFIDENTIAL
Table 2 : Comparison of the position of Ofcom in 2007 and 2009, with the response of O2 to the 2007 consultation, on a like-for-like basis15
Ofcom (2007) O2 Response Ofcom (2009)
Target quality Deep in-building coverage 1MB/user/day 384kbit/s
UMTS2100 sites 29,000 11,000 12,715
Starting # of sites in 2010
6,500 7,400 9,000
Difference 22,500 3,600 3,715
Benefits NPV three additional networks
£6bn £200m £150m - £4.8bn
Depending on scenarios
Cost of clearance (basis of calculation)
2x7.5MHz released per operator
2x7.5MHz released and 2x5 MHz refarmed per operator
2x7.5MHz released and 2x5 MHz refarmed per operator
Cost of clearance £750m £2.4bn Up to £2.4bn depending on method
Number of sites required to mitigate the loss of spectrum
None 7,000 4,000 – 10,000 depending on method
37. The UMTS2100 site counts can be found buried away at Table 25, page 108 of Annex 13 to the 2009 consultation. Ofcom does not appear keen to give them similar prominence to the figures it quoted in its September 2007 press release.
38. O2’s assessment was that such networks would rapidly become capacity constrained and that any “cost advantage” would be very short lived, if it emerged at all – given that cost advantages would only arise to the extent that UMTS900 networks were deployed to the scale assumed by Ofcom in 2007.
39. By September 2008 Ofcom finds itself in the situation where benefits are close to the costs of intervention, noting that the benefits are speculative but the costs are certain. Worse still, spectrum efficiency (as defined in the 2007 consultation) now points significantly away from intervention. A release of 2x7.5MHz and refarming of 2x5MHz each for O2 and Vodafone would require many thousands of new masts to be built in urban areas during Spring 2010. Further, neither O2 nor Vodafone could effectively operate their GSM network following intervention.
15 Based on the “High Scenario” in the 2007 consultation
17 of 80

NON-CONFIDENTIAL
V. DEVELOPMENTS SINCE 2007
40. At this point, over twelve months have passed since the previous consultation and the market for mobile broadband services has developed at a considerable pace. Furthermore, two separate network sharing agreements have been announced. The development of regulatory policy has and continues to be over taken by events and the dynamic nature of the UK mobile market. This very fact should alert the Ofcom Board to the real risk of regulatory failure dominating over market failure.
41. A number of factors are identified by Ofcom as leading to a revised basis for assessing the benefits of UMTS900 cf. UMTS2100 deployment. They are:
i. Change in legal basis – rather than the RSC Decision, Ofcom now seeks to rely on the forthcoming revision of the so-called GSM Directive. A copy of the amending Directive is supplied at Annex 17 of the consultation;
ii. Development and growth of the mobile broadband market, in particular its implications for usage growth;
iii. The data rate assumption and evidence about customer satisfaction with existing speed levels;
iv. Technological developments in UMTS availability, LTE and WiMAX;
v. Availability of substitute spectrum at 800MHz (as a substitute for 900MHz) and 2600MHz (as a substitute for 1800MHz);
vi. The second 900MHz carrier assumption; and
vii. The current global economic crisis.
42. In the remainder of this section we deal with these developments in turn, as well as a number of other developments that Ofcom omits to consider, namely:
i. Competition between fixed and mobile broadband services; and
ii. The considerable growth of 3G subscribers (at 2100MHz) and the consequent undermining of the assumptions around decommissioning of UMTS2100 networks in Annex 12 of the consultation.
43. It is the duty of a responsible regulator to ensure that the important decisions it takes, with potentially wide ranging impact on industry, should be sufficiently convincing to withstand industry, public and judicial scrutiny.16
44. In particular Ofcom’s benefits and welfare analysis must be proportionately more robust than its clearance cost calculations, in light of ECJ C-12/03 EC vs Tetra Laval (§4.23):
“because the likelihood of error is greater in a prospective analysis, the prospective analysis must be proportionately more rigorous to account for this possibility”.
16 CAT 1094/3/3/08 Judgment in Vodafone vs Ofcom §47
18 of 80

NON-CONFIDENTIAL
45. It is O2’s general experience that we should be particularly alert to consultations whereby the objective justification for intervention moves around, as the evidence base crystallizes – but the remedy remains broadly the same.
Legal basis – revision of the GSM Directive
46. The purported legal basis under which Ofcom makes these proposals is a draft new EU Directive, amending Directive 87/372/EEC the so-called “GSM Directive”. The revisions to the GSM Directive extend the scope of the directive to cover both the P-GSM and E-GSM bands. Neither the amending directive nor the GSM Directive relate to the 1800MHz licences nor the 2100MHz licences.
47. Consequently there are three parallel processes in play in this consultation:
i. The liberalisation of the 900MHz band under the terms of the amending Directive; and
ii. The liberalisation of the 1800MHz band; and
iii. The liberalisation of the 2100MHz band.
48. Only one of these activities (i) will be mandated under EU law and will need to be implemented in a UK Statutory Instrument. The other activities are things that Ofcom chooses to do, in light of its duties and functions laid out in the Communications Act 2003. In particular in the 2007 consultation, Ofcom has had regard to its duties to:
i. Further the interests of consumers, where appropriate by promoting competition17; and
ii. To ensure optimal use of the spectrum18.
49. Ofcom has chosen to deal with the liberalisation of the mobile spectrum in the round, but is only bound to make available the 900MHz spectrum within six months of entry into force of the amending Directive and undertake a consultation19 on competition issues. Ofcom rightly identifies that “make available” means that it will need to amend the UK frequency allocation table and the relevant spectrum licences of O2 and Vodafone20 within the six month timeframe, potentially by means of a Statutory Instrument.
50. The timeframe for making any decision arising from the required consultation into competitive effects and its subsequent implementation are not determined by the amending directive. Whatever Ofcom chooses to do in this regard is not time limited and is a decision to be made in light of all of Ofcom’s domestic duties under statute.
51. What Ofcom chooses to do for the the 1800MHz frequencies and the 2100MHz frequencies – in terms of liberalisation - is similarly a matter for its duties under the Communications
17 s3(1) 18 S3(2)a 19 Article 1(2) and Recital (5) 20 §§8.43-8.47 of the consultation.
19 of 80

NON-CONFIDENTIAL
Act. We must therefore refer back to the overall basis under which Wireless Telegraphy licences are liberalised, as set out in Ofcom’s Statement on Liberalisation in 200521.
52. In that Statement Ofcom deals with the issue of distortions of competition, stating that they will be assessed on an ex-ante basis before licences are liberalised (§§3.12-3.16). The foundation for liberalisation itself is found under Ofcom’s general duties as they relate to spectrum matters under s3(2) of the WT Act 2006, however as s3(5) makes clear, Ofcom’s general duties under s3 to s6 of the Communications Act 2003 take precedence over its spectrum management duty.
53. With regards to releasing 900MHz spectrum, Ofcom fails to, beyond its primary duty under the Communications Act (s3(1)), identify any other duty or function that it is intending to rely on should it wish to intervene following the consultation it is bound to make under the amending directive.
54. Furthermore, it appears to now walk away from making these proposals under its definition of spectrum efficiency as put forward in the 2007 consultation. This retreat is understandable, given that Ofcom admit (albeit buried away at Annex 16) that the current proposal would require by its own analysis between 300-600 new cell sites to be built to deal with a 2x2.5MHz spectrum release, whereas its 2007 proposals would have required between 4,000-10,000 new cells to be built. All of this mitigation cell build would have been required with certainty, whilst the purported “savings” in 3G cell build from liberalisation would have been at best speculative and in practice illusory22.
55. The 2007 consultation and the 2009 consultation are characterised by a lack of clarity as to the specific duties that Ofcom will seek to rely on before undertaking the procedures under Schedule 1 of the WTA 2006. Article 14 of the Authorisation Directive, as implemented by the Wireless Telegraphy Act 2006, is purely the procedural measure by which the changes to licences will be made, whether following the process under the amending Directive, or the application of s3(1) of the 2003 Act.
56. In light of O2’s view of the powers under which Ofcom may choose to base its decision and whatever the final forum of review, it is still incumbent on Ofcom, in light of their obligations under section 3 of the CA 2003, to conduct their assessment with appropriate care, attention and accuracy so that their results are soundly based and can withstand [the] profound and rigorous scrutiny23. Ofcom must also act consistently in light of s3(3)a of the 2003 Act.
21 http://www.ofcom.org.uk/consult/condocs/liberalisation2/statement.pdf 22 Based on the incremental cell build requirements for 3,4 & 5 block releases after deducting the cell build required to support a two block release in the hands of the incumbents. See Annex 16 Tables 25, 34 & 44. 23 CAT 1094/3/3/08 Judgment in Vodafone vs Ofcom §46
20 of 80

NON-CONFIDENTIAL
Market forecasts
57. At Annex A11.14 Ofcom deals with the consequences of the growth in mobile broadband services – that is the significant traffic growth on 3G networks since 2007, as illustrated by Figure 1 in Annex 11.
58. At our bi-lateral meeting on cost differences (14 July 2008), we highlighted how our experience with the 2G iPhone and dongles was producing usage figures ahead of the forecasts contained in the Spectrum Value Partners24 (SVP) work identified by Ofcom as supporting its target usage figure of 30MB/user/day in 2015. Since we provided this evidence to Ofcom, we have launched iPhone 3G and have gained further experience of mobile broadband usage both in the UK and Ireland.
59. The forecasts for data usage and in particular smartphone take-up are crucial to determining rollout profiles and welfare gains. Unfortunately Ofcom does not undertake its analysis with any rigour. For example, in its welfare analysis Ofcom makes assumptions about the revenues associated with “customers who may be sensitive to differences in mobile broadband quality”25. It then assumes that the relevant market size is 25% of the total UK market revenues. Ofcom also examines sensitivities to 15% and 35% of market revenues. Ofcom effectively assumes, if the 2.1GHz operators do not incur significant costs to match their networks to those of the 900MHz operators, that between 2012 and 2014 only 900MHz players are able to provide services to this entire market segment (which under Ofcom’s calculations is around £5.5-5.6bn). In contrast, in its analysis of the impact of delay in liberalisation, Ofcom assumes a range of migration profiles26 which show that only a proportion of mobile subscribers will have upgraded to UMTS900 devices27 ie the “available market” for UMTS900 operators is a subset of this high value market.
60. Ofcom should, at a minimum, have ensured the internal consistency between its:
• view of capacity growth, driven by smartphone and dongle take-up;
• the addressable revenue assumption : dongle customers do not have associated voice and text revenues, whereas smartphone customers do. Smartphone customers are where the value lies in the market, dongle customers are ARPU and margin dilutionary28;
• the addressable market size for UMTS900 operators: smartphone penetration x ARPU x % of smartphones that are UMTS900 compatible;
• the proportion of those customers which are sensitive to quality; firstly, not all of these customers will be sensitive to changes in quality and secondly, in circumstances where it is possible for UMTS2100 operators to match or closely match the offering of UMTS900 operators there will be a chain of substitution between these products, as there are with
24 A report commissioned by amongst others Telefónica, Vodafone and Orange. We note that the SVP report relies on lower data usage predictions than a similar study http://www.digitaldividend.eu/ sponsored by T-Mobile. 25 Annex 9, A9.22 26 Annex 9 Figure 10 27 Or equivalent UMTS2.1GHz devices in the matching scenarios 28 See further Annex A §Error! Reference source not found.
21 of 80

NON-CONFIDENTIAL
other products with differential qualities to the extent that Ofcom may consider them to be in the same economic market. 29
Usage growth
61. [ …..]
62. [ …..]
63. It is already clear from the reference points for usage per user (by type of user) in the Spectrum Value Partners analysis understate usage by some considerable margin. Furthermore, we have now a greater understanding of the smartphone market (as the market leader) and the likely prospects for the dongle market. Therefore, we have revisited our assumptions which are summarised in Section VI and covered in more detail in Annex A at §368.
64. Finally, unlike Ofcom, we use scenarios to understand the potential impact of the economic crisis on take-up of mobile broadband devices and usage patterns.
The data rate assumption
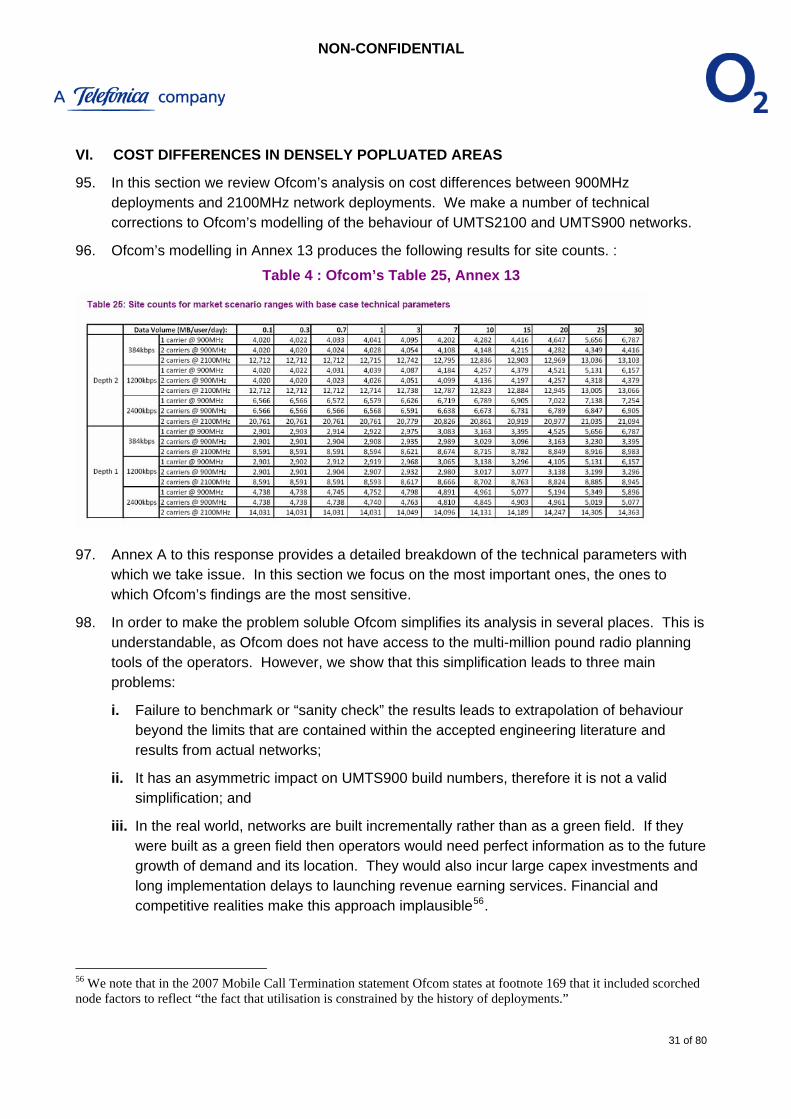
65. Even a cursory glance at Table 25 Annex 13 shows the sensitivity of Ofcom’s analysis to assumptions about the guaranteed data rate per user at edge of cell. For 30MB/user/day and deep in-building coverage 2.4Mbps end user speed requires 60% more UMTS2100 cell sites than delivering 1.2Mbps, for example.
66. Site counts effectively drive cost differences more than any other assumption. Therefore, there should be a strong and sound evidential basis for 2.4Mbps, especially if it were to transpire that Ofcom needs to rely on this speed assumption in order to get benefits above costs in the CBA30.
67. In fact Ofcom deals with this critical assumption in just four paragraphs (§§A11.24-A11.27). Having re-read all 743 pages of this consultation a number of times, we can find no further evidential basis31.
29 http://www.ofcom.org.uk/consult/condocs/nga_future_broadband/statement/statement.pdf §§4.40-4.48. Interestingly, in the case of NGA, Ofcom states at §4.44 “Although the determination of the relevant market will be conducted within the scope of a market review, generally, we expect that many of the applications and services delivered by super-fast broadband initially will be able to be supported by current higher speed broadband services. Therefore, in the absence of evidence suggesting otherwise, super-fast broadband services and today’s broadband services are likely to fall into a single broad market definition.” [our emphasis] Ofcom appears keen to act ex post on the basis of evidence in the case of BT’s uncertain future investments, but ex ante on the basis of assertion with regard to the hypothetical future investments of O2 and Vodafone. This is not the approach of a consistent regulator. 30 Once again we draw Ofcom’s attention to §46, §48 and §123 of the Tribunal’s judgment in Vodafone vs Ofcom 1094/3/3/08. 31 Furthermore, at §6.32b3 Ofcom makes further assertions regarding the relative demand uncertainty regarding LTE vs HSDPA speeds, but again provides no evidence to that effect.
22 of 80

NON-CONFIDENTIAL
68. The first evidential point is at §A11.25, the results of eight qualitative focus groups held in London and Cardiff. Ofcom characterises the views of users in these focus groups as “generally impressed that mobile broadband exists at all at present and are currently content with relatively low speeds”. Ofcom then goes on to discuss the weight consumers place on headline speed (data rate) in marketing literature.
69. Our experience is that it is not speed that is important but that consumers get the service they expect to receive. Ofcom has expressed concern about the disconnect between marketing claims of headline speed and the service customers receive. The response of industry has not been a mad dash to increase speeds at cell edge (rather than the headline speed available at a limited number of locations), rather it is to agree to send more appropriate marketing messages. This is enshrined in the Mobile Broadband Group’s code of practice on the subject32. Some observers might conclude that it is more cost efficient to reduce the rate of dongle returns by matching customer expectations, than build many millions of £s worth of incremental network to meet the claims of certain marketing departments.
70. To this end, when O2 relauched its mobile broadband proposition in October 2008, we undertook research with customers in order to obtain insight into their needs. In summary this research pointed to one-fifth of customers being unable to use their mobile broadband service where their provider said they could33. Consequently, O2 invested significantly in its in-store and web based coverage checker, to ensure it could adequately manage customers expectations. What we did not do was build another 2,000 base stations.
71. As the mobile broadband market has developed, there has been an increasing focus in the post-pay segment on “dongle with laptop” propositions. This approach has effectively imposed the existing mobile handset subsidy model into the “dongle” market. The consequence will be to make the “device” (in this case the laptop) an even greater consideration in the customer’s purchasing decision than it is today. By contrast data speed will consequently reduce in its importance. We agree with Ofcom at A11.27 when it says that “operators will seek to provide as fast a service as practical and profitable”. However, in a dynamic market, there may be better ways for operators to invest (for example in subsidy), which provide for more certain and shorter payback34 than differentiation on network quality and service availability.
72. In his recent (interim) report “Digital Britain”, Lord Carter introduces proposals for a Universal Service Commitment in relation to broadband services. In principle (as discussed on p.55 of the Interim Report) such universal service commitments arise where there is a clear public policy case for universality (both in terms of cost and availability) but where the market has failed to deliver such solutions.
32 Due for publication shortly. 33 See O2 press release published 31/10/2008 - http://mediacentre.o2.co.uk/Content/Detail.asp?ReleaseID=402&NewsAreaID=2 34 Payback is not a function considered by Ofcom, but is increasingly important in light of the current capital markets. Where operators target cashflow improvement, one key lever is to shorten the payback periods for approved investment cases.
23 of 80

NON-CONFIDENTIAL
73. Whilst there is still some way to go in this process, it is clear from the recent Budget statement that public funds may contribute towards the delivery of a 2Mbps Universal Service Commitment.35 There are significant legal hurdles for the use of public funds in this way, in particular, the Government will need to determine where the market will fail to deliver the target speed of 2Mbps as specified by the Chancellor in his Budget. There will need to be consistency between the view of the Minister and Ofcom as to the limit of coverage that the market will naturally deliver.
Technological developments
74. We note Ofcom’s discussion of technological developments regarding LTE at 800/1800/2100 and 2600MHz. However, unlike Ofcom we have seen evidence of support for LTE800 amongst vendors, [ …..]. In addition, the process whereby the GSM Directive will be amended further to accommodate LTE1800 has already begun. At least one part of Ofcom is already looking ahead to this eventuality, it is a shame that this consultation is so restricted in scope.36 We also note that in Finland TeliaSonera, Elisa and DNA have been allocated additional 1800MHz frequencies specifically to use LTE technology.37
75. Furthermore, and in the context of competitive advantage accrued by T-Mobile and Orange at 1800MHz, we note the views expressed by Joachim Horn who was Chief Technology Officer of T-Mobile International (T-Mobile UK’s holding company), that “If I need to invest into more hardware, I think it's better to start early [with LTE]. LTE is a more future-oriented technology……. We'll deploy HSPA as long as there is no hardware replacement necessary”38. The building of momentum for LTE1800 and the stated desire of an operator with access to 2x30MHz of contiguous 1800MHz spectrum to leapfrog UMTS for LTE, undermines Ofcom’s assertions that support its proposal to liberalise 1800MHz in the hands of the incumbents.
76. Below is a table summarising the views of major vendors as to the availability of UMTS and LTE network equipment and devices in the 800,900 and 1800MHz bands.
[ …..]
35 http://www.hm-treasury.gov.uk/d/Budget2009/bud09_completereport_2591.pdf §4.40 36 Working document RSCOM09-12 of the RSC includes draft mandates for CEPT to “study technical conditions under which LTE technology can be deployed in the 900/1800MHz band.” 37 http://www.government.fi/ajankohtaista/tiedotteet/tiedote/en.jsp?oid=259965 38 http://www.unstrung.com/document.asp?doc_id=167315
24 of 80

NON-CONFIDENTIAL
Substitute spectrum and its availability for use
77. Ofcom has recently consulted on increasing the quantity of available spectrum in the 800MHz band, that will be cleared at digital switchover. We welcome this development, which would enable three lots of 2x10MHz of spectrum for LTE (or potentially UMTS) to come into the market.
78. We believe that in the interests of the Government’s spectrum modernisation programme, Ofcom should be more ambitious in the timescales for release, bringing forward switchover to the earliest possible date.
Competition between fixed and mobile broadband
79. In this consultation Ofcom appears to dismiss the possibility that in-building wireless systems connected to fixed internet connections (for example WiFi) act as either (or both) a demand side or a supply side substitute to macrocell based networks delivering mobile broadband services39.
80. Furthermore, somewhat illogically, Ofcom asserts that if there was a lot of traffic off-load to fixed networks this would enhance, rather than reduce the cost advantages of 900MHz, see for example §A13.204. We have the following comments:
i. Whilst the research presented in the Illuminas report suggests that mobile broadband is not a substitute for fixed broadband, rather a complementary product, this is at odds with assertions in other Ofcom documents40, or the speeches of senior Ofcom staff41.
Our view is, as we articulated in our response to Ofcom’s Mobile Sector Assessment – if Ofcom is going to seek to rely on mobile broadband as a demand or supply side substitute to fixed broadband, it needs to consider whether this effect also flows the other way42.
39 For example, BTfon has >100k hotpots, see www.btfon.com 40 See Mobile Sector Assessment http://www.ofcom.org.uk/consult/condocs/msa08/msa.pdf §3.100 “the promise of mobile broadband is hard to ignore – promising the freedom and ease of use of the public internet with the ubiquity, portability and popularity of mobile devices. It also carries the prospect of increasing the scope for competition between mobile and fixed broadband providers, thereby benefiting consumers.” 41 See for example, Ed Richards in http://www.ofcom.org.uk/media/speeches/2009/jan/viewersfirst “our own data suggests that the rate of take up of mobile broadband is outstripping further growth in fixed broadband. In some cases this is a complement to fixed lines, in others it’s a substitute.” Or Ed Richards again in http://www.ofcom.org.uk/media/speeches/2008/04/ietspeech “In both wireless and fixed-line there are now very significant moves to develop higher and higher bandwidth services. Wireless is, of course, vital for everyone on the move and excellent for nomadic uses. Technological developments mean that it offers an increasingly attractive alternative not only to fixed voice but also to first generation broadband. Take up of mobile data cards and the bit rates that they deliver is increasingly impressive and will play a more and more important role in the future pattern of connectivity. It is impossible to separate developments into ‘fixed’ and ‘wireless’ as we used to do as if they were unrelated worlds; consumers are increasingly indifferent to that distinction, and packets of data are completely indifferent.” 42 See O2 response to MSA http://www.ofcom.org.uk/consult/condocs/msa08/responses/o2.pdf §36
25 of 80

NON-CONFIDENTIAL
ii. The off-load point is somewhat illogical. If it is more cost effective to use a supply side substitute, perhaps:
a. WiFi attached to fixed broadband; or
b. Macrocell network built to provide high quality outdoor coverage augmented with in-building 3G solutions,43 then
significant expenditure on UMTS900 may not take place at all, at least for coverage purposes.
The global economic crisis
81. In a number of places Ofcom puts forward its view of the relevance of the current global economic crisis to its proposals, specifically:
i. At §5.75 Ofcom observes that “costs are certain to be incurred but the benefits are only realised if the market would not have achieved wider access.44 But also because it is important for us to make sure that any costs imposed on stakeholders are proportionate. This issue is particularly important given the current economic climate.”
ii. At §§A.8.67-A8.76, Ofcom goes into further detail on the likely impact of the financial crisis on both demand and the ability of operators to fund capital investment in network. In summary, Ofcom believes that:
a. Demand for mobile broadband may be less resilient than other mobile services and fixed broadband – potentially driven by the complementary nature of the service identified in the Illuminas research. This would point away from operators using UMTS900 as a competitive differentiator, as major network build programmes are much less flexible in their ability to respond to a rapidly deteriorating economy than changes in other factors, such as subsidy / bundling with laptops etc.
b. Handset migration may slow for the duration of the recession, as customers delay significant purchasing decisions. This would push up the cost of spectrum clearance45 and reduce the attractiveness of network infrastructure build as a competitive tool. Fewer customers would be able to use UMTS900, or the additional subsidy to migrate customers to UMTS900 networks would be prohibitive.
82. We would agree with these statements. However, what Ofcom fails to do is draw the full conclusion from §A8.71.1, ie what it implies beyond the fact that the global economic crisis
43 See T-Mobile http://www.ubiquisys.com/ub3b/pressreleases.php?id=61 or Orange http://www.unstrung.com/document.asp?doc_id=169094 or H3G http://threestore.three.co.uk/broadband/?router=1 44 And we say in addition, only to the extent that building UMTS900 coverage as a competitive differentiator is an efficient strategy that would be engaged in by O2 and/or Vodafone in the counterfactual scenario. 45 [ …..]
26 of 80

NON-CONFIDENTIAL
could “limit the extent to which 900MHz incumbents can increase mobile broadband quality in the interim period, and/or delay their rollout of UMTS900.”
83. If the economic crisis affects 900MHz incumbents in the way described in A8.71.1 then it would equally affect those with access to 900MHz following intervention. Ofcom would impose certain costs on two operators which, through economic circumstance, cannot fund the hypothesised rollout required to create the “cost advantage” in Ofcom’s CBA – only to discover that some of the potential acquirers of that spectrum cannot themselves afford to deploy UMTS900 (or potentially bid for that spectrum in an open and transparent process) because of the very same capital constraints46. It appears unlikely that the current crisis will ease until at least 2010 and so it may not be until 2011/12 that UMTS900 deployment becomes a reality on any scale. This would leave a window of only 18-24 months before 800MHz were available as a substitute. We examine the sensitivity of the CBA to assumptions regarding the economic crisis later. However, we would point out at this stage that given the sensitivity of the benefits calculation to the duration of the interim period, and similarly, the sensitivity of the welfare analysis – it would be wise for Ofcom to be cautious about its assumptions regarding the duration and depth of the current recession and its effects on the business plans of operators, given that 'the only function of economic forecasting is to make astrology look respectable'47
84. Rather than just assert that “future investment [in networks] seems plausible”48, Ofcom will need to have regard to the evidence provided in Annexes B and C of this response. Whilst MNOs remain well resourced companies, especially when compared to other telecoms operators, they are not immune from the effects of the economic crisis. Specifically:
i. The decline of handset sales/upgrades and the increasing attractiveness of SIM only offers in the market,49 as it affect the costs and timing of refarming / release;
ii. The declining capital expenditure of the parent companies of the main UK MNOs in light of Lord Carter’s views 50 of the relative unattractiveness of investment in the UK market; and
iii. The most recent investor guidance provided by the four main operators, to the effect that Operating Cashflow will be maximised to protect operators from the closure of capital markets. The ratios in Annex C show that further contraction of capital expenditure in the short to medium term is the resultant outcome.
46 Whilst prices at any auction would be lower, it is unlikely that the economic crisis will affect operators symmetrically. See for example http://www.telekom.com/dtag/cms/content/dt/en/654734;jsessionid=C0FEE56907DD82F65D4885D84F298568 47 J K Galbraith 48 A11.18 49 SIM only has a significant effect on the cost of clearance by UMTS2100 migration, in that the network operator has no control over which type of handset (2G or 3G) the SIM is inserted. [ …..] 50 “in wireless mobile networks we have to foster a climate in which the operators, many of whom are international and have many other market where they can deploy their capital, want and need to invest in broadband in the United Kingdom and in new services” Lord Carter’s speech to the Westminster Media Forum 14th January 2009 http://www.berr.gov.uk/aboutus/ministerialteam/Speeches/page49804.html
27 of 80

NON-CONFIDENTIAL
85. O2 is particularly concerned that the assertions in this consultation do not reflect the views of Ofcom’s own strategy department51:
“Another possible barrier to the development of digital networks is the global credit crunch. In the short term, it will surely affect companies’ ability and willingness to invest in large new infrastructure projects – like fibre networks, and ‘beyond 3G’ wireless technologies.”
The second UMTS900 carrier assumption
86. We highlight above how in the 2007 consultation Ofcom states that,52 if O2 and Vodafone had each refarmed 2x5MHz following a 2x7.5MHz release (a five block clearance) that “it is highly unlikely that a GSM network would be able to continue carrying the remaining 2G traffic with such a low quantity of spectrum available”. Any assumption that O2 and Vodafone would deploy a second 900MHz carrier in the near term would fail on the same basis, with a 2x5MHz release this would be equivalent to a five block clearance.
87. Notwithstanding this, at §A13.330 Ofcom undertakes some sensitivity analysis regarding the impact of deploying two UMTS carriers at 900MHz. However, having reviewed the analysis we can find no place where Ofcom relies on the availability of a second UMTS900 carrier. The dominance of the 800MHz substitute assumption means that the second carrier does not appear to figure in Ofcom’s consideration, except where Ofcom considers the additional costs of O2 and Vodafone migrating to LTE900 many years after the 2x5MHz release.
88. We therefore do not believe that the second UMTS900 carrier assumption is sound and Ofcom cannot rely on it in any scenario.
The decommissioning assumption
89. §§A13.324-A13.331 and Figures 13 and 40 in Annex 13 of the consultation show that there are various breakpoints in data usage (MB/user/day) that determine the number of UMTS carriers (by frequency type) required to support forecast data volumes. By breakpoints, we mean the capacity load that produces a requirement to implement a new carrier in order to avoid cell splitting. This is the elbow seen in the various charts identified above, rather than the points of cell site convergence.
51 http://www.ofcom.org.uk/media/speeches/2009/mar/comms_challenge Peter Phillips, Partner - Strategy and Market Development 4th March 2009 52 2007 consultation §A9.141
28 of 80

NON-CONFIDENTIAL
Table 3 : Data volume breakpoints that determine aggregate UMTS carrier requirement53
UMTS carrier Usage (MB/user/day)54
Rel.99 384kbps55 HSDPA 1.2Mbps O2 Base Case
1 x 900MHz 3 20 3.5
2 x 900MHz 7 40 10
2 x 2100MHz 20 140 20
90. Absent a second 900MHz carrier assumption, if usage rises above 3.5MB/user/day (assuming O2 Base Case [see later]) the 900MHz incumbents will need to retain their UMTS2100 infrastructure to provide the required data capacity to avoid cell splitting (and optimise the use of spectrum). As we show in Section VI, this is expected to take place before 2015. If this were the case it would not be the availability of an 800MHz substitute that restricts the window for “cost advantages” to be gained, rather the success of mobile broadband in driving data usage and the consequent capacity challenge presented to operators. In a capacity constrained environment, it is of course those operators with the most available spectrum capacity that will benefit. We discuss the enduring capacity advantage of the 1800MHz players in Section XI.
91. The implications on Ofcom’s analysis are far reaching when it comes to one particular assumption – decommissioning.
92. In Annex 12 Ofcom runs through a wide range of colourful charts plotting the rollout of 900, 2100 and 800MHz networks. This is undertaken on the basis that networks remain coverage limited until 2020. There is no consideration of the build requirement for capacity, notwithstanding all the effort undertaken by Ofcom in Annex 13 on that very subject. Furthermore, there is no account of the cost of decommissioning those sites which will affect the payback of any decommissioning programme. The benefits of such a decomm programme would be small annual reductions in recurring opex driven by the site count difference. However, there would be a double whammy of a significant non-recurring opex payment to cover the decommissioning, removal of equipment and making good of the site– and the capex for the UMTS900 equipment, together with the write down of the decommissioned site and equipment.
93. The failings in Ofcom’s approach are underlined by the effect of switching off the decommissioning assumption in Ofcom’s models. It actually increases the cost difference rather than reducing it. By switching off the assumption the model bakes in a site count difference in perpetuity, whereas in reality Ofcom’s analysis in Annex 13 shows that site counts should converge as usage per user increases.
53 Figures in italics are not provided by Ofcom but have been extrapolated by O2 using Ofcom’s models. 54 At depth 2. 55 Taken from Figures 13 and 40 in Annex 13
29 of 80

NON-CONFIDENTIAL
94. In Section VI we combine the effects of usage growth with our rollout assumptions used by Ofcom to demonstrate that rather than decommission, operators will be driven to retain and augment their UMTS2100 networks, both because of the capacity constraints on a 1x900MHz carrier and because of the many millions of UMTS2100 only devices that will already be present in their networks by 2011-12.
30 of 80
NON-CONFIDENTIAL
VI. COST DIFFERENCES IN DENSELY POPLUATED AREAS
95. In this section we review Ofcom’s analysis on cost differences between 900MHz deployments and 2100MHz network deployments. We make a number of technical corrections to Ofcom’s modelling of the behaviour of UMTS2100 and UMTS900 networks.
96. Ofcom’s modelling in Annex 13 produces the following results for site counts. :
Table 4 : Ofcom’s Table 25, Annex 13
97. Annex A to this response provides a detailed breakdown of the technical parameters with which we take issue. In this section we focus on the most important ones, the ones to which Ofcom’s findings are the most sensitive.
98. In order to make the problem soluble Ofcom simplifies its analysis in several places. This is understandable, as Ofcom does not have access to the multi-million pound radio planning tools of the operators. However, we show that this simplification leads to three main problems:
i. Failure to benchmark or “sanity check” the results leads to extrapolation of behaviour beyond the limits that are contained within the accepted engineering literature and results from actual networks;
ii. It has an asymmetric impact on UMTS900 build numbers, therefore it is not a valid simplification; and
iii. In the real world, networks are built incrementally rather than as a green field. If they were built as a green field then operators would need perfect information as to the future growth of demand and its location. They would also incur large capex investments and long implementation delays to launching revenue earning services. Financial and competitive realities make this approach implausible56.
56 We note that in the 2007 Mobile Call Termination statement Ofcom states at footnote 169 that it included scorched node factors to reflect “the fact that utilisation is constrained by the history of deployments.”
31 of 80
NON-CONFIDENTIAL
99. We demonstrate why these three factors undermine Ofcom’s approach. We adopt a different approach to determining the size of networks required to deliver the highest achievable edge of cell speed, to depth 2 as defined by Ofcom.
Shared or dedicated carrier?
100. Ofcom has assumed dedicated data carrier in all cases. However, there are at least four reasons why this is the incorrect approach:
i. UMTS900 is likely to eventually replace GSM900, post 2015, so it is in O2’s interests to seed its whole base (over time) with UMTS900 devices capable of both voice and data. The building of a UMTS900 underlay just for data makes no sense in the long run; and
ii. If there were a dedicated data carrier, smartphones would be relying on 2100MHz layer as their primary way of making and receiving voice calls. There will not be a 100% coincidence in coverage between the 900MHz layer for various reasons (not all sites will be able to physically support an upgrade and there may be different antenna tilts, for example). This lack of overlap will cause excessive handover and impact on customer experience.
iii. It would be highly inefficient (and detrimental to battery life and user experience) for these devices to continually switch carrier in response to in-bound or out-bound voice calls; and
iv. In its welfare analysis Ofcom calculates welfare benefits for both voice and data revenues attributable to consumers that switch to UMTS900 based services. As we highlight above, it is not clear that data customers will bring their voice traffic with them if there is a disconnect between voice and data coverage.
101. Therefore we have corrected Ofcom’s model to assume a shared UMTS900 carrier throughout.
Maximum guaranteed speed at cell edge
102. At A11.27 Ofcom defines two sample data speeds, thus:
• “High end: 2.4 Mps minimum that can be expected consistently (in technical terms the cell edge rate) whilst within coverage……
• Low end : 384kbps minimum that can be expected consistently within coverage.”
103. As we show in Annex A at §§307-334 with evidence and extensive reference to accepted academic and engineering literature, the high end assumption does not hold in loaded networks. In interference limited environments, such as the urban and suburban areas making up the 80% pop. coverage area, the HSDPA coding scheme provides for the following end user data rates.
32 of 80

NON-CONFIDENTIAL
Table 5 : HSDPA end user data rates in an interference limited environment
Headline speed (ie fastest possible)
Average speed (Mbps)
Cell edge speed in urban areas (Mbps)
14.4Mbps 2.0 0.5 7.2Mbps 1.8 0.5 3.6Mbps 1.2 0.5 1.8Mbps 1.0 0.5 384k Rel.99 0.2 0.1
104. Whilst Ofcom’s approach may have merit when dealing with rural areas (lightly loaded networks) – it does not translate to urban environments. This error infects Ofcom’s entire analysis. O2 is particularly concerned that, for a second time, Ofcom has made a fundamental error upfront in its analysis, effectively devaluing the remaining analysis. We saw exactly the same outcome in May 2008. We would urge the Ofcom Board to revisit the way in which it undertakes due diligence on complex analyses. We fear that Ofcom has been too easily seduced by results that confirm its prejudices regarding cost advantages, without effectively stress testing the underlying assumptions.
105. The following table provides the cell count figures for a cell edge of 500kbit/s using the Ofcom assumption set.
Table 6 : Ofcom base case - 500kbit/s at cell edge (depth 2, dedicated carrier)
Usage per user
(MB/user/day)
0.1 10 20 30 40 50 60 80 100 120 140
1 x UMTS900 4,020 4,277 4,620 6,652 8,869 11,087 13,304 17,739 22,173 26,608 31,043
2 x UMTS900 4,020 4,146 4,277 4,408 4,620 5,543 6,652 8,869 11,087 13,304 15,521
2 x UMTS2100 12,712 12,833 12,964 13,095 13,227 13,358 13,489 13,752 14,014 14,277 15,617
106. The chart below shows how these characteristics affect the window over which there is a site count difference between UMTS900 and UMTS2100 networks. It provides the limiting case, based on Ofcom’s calculations and is included in order to gauge the impact of further corrections (below).
33 of 80

NON-CONFIDENTIAL
Figure 2 : Ofcom base case
107. The table below defines the baseline that O2 will use throughout the remainder of its analysis. This effectively determines the maximum site count difference between 1xUMTS900 carrier and 2xUMTS2100 carrier networks. The following corrections are also included:
i. The use of a shared carrier (see §§101-102 above); and
ii. Correction of Ec/Io to -10dB from -8dB (see Annex A §§338-349); and
iii. Corrected HSDPA performance figures from SINR table (see Annex A §§351-354).
Table 7 : O2 base case with 500kbit/s at cell edge (depth 2, shared carrier, Ec/Io and SNIR corrected)
Usage per
user
(MB/user/day)
0.1 0.3 0.7 1 3 7 10 15 20 25 30 40 50 100
1 x UMTS900 2,733 2,747 2,776 2,797 2,939 4,205 6,007 9,010 12,014 15,017 18,020 24,027 30,034 60,068
2 x UMTS900 2,730 2,737 2,751 2,762 2,833 2,975 3,135 4,505 6,007 7,508 9,010 12,014 15,017 30,034
2 x UMTS2100 8,632 8,636 8,650 8,661 8,732 8,874 8,981 9,159 9,337 9,515 9,692 12,024 15,017 30,034
108. These figures enable us to produce our base case capacity growth chart.
34 of 80

NON-CONFIDENTIAL
Figure 3 : O2 base case with 500kbit/s at cell edge (depth 2, shared carrier)
Usage growth assumptions and their implications
109. At §368 we discuss the need to revisit the usage forecasts in order to deal with the increasing data usage of users, which has emerged since our dialogue with Ofcom in Summer 2008. Ofcom’s analysis considers capacity growth on a static basis, as it does not consider how capacity growth affects network build options. Understanding the profile of capacity growth is key to determining when build at 2100MHz will take place, when 900MHz networks congest and consequently why the decommissioning assumption falls away.
110. In order to produce a usage growth forecast we have adopted the approach outlined in Annex A. The results are shown in Table 8 below. Two forecasts are derived, based on differing views of the volume of data that it is economic for operators to carry at the prevailing market price. Understanding the economics of mobile broadband is key to determining its future impact on 3G networks57. “High capping” assumes that operators restrict customers to 10GB per month bundles, “low capping” assumes 5GB/month. We define a further set of coverage scenarios, where we goal-seek the required market size (assuming 3GB capping) in order to keep the a UMTS900 network coverage limited (ie below 15MB/user/day).
57 See for example Analysys Mason “Mobile broadband : high take-up but high usage can lead to low profits”, Amrish Kacker 15 December 2008.
35 of 80

NON-CONFIDENTIAL
Table 8 : O2 Usage forecasts (MB/User/Day)
2008 2009 2010 2011 2012 2013 2014 2015
Coverage limited
usage per user
[ .] [ .] [ .] [ .] [ .] [ .] [ .] [ .]
Data usage per user
(low capping)
[ .] [ .] [ .] [ .] [ .] [ .] [ .] [ .]
Data usage per user
(high capping)
[ .] [ .] [ .] [ .] [ .] [ .] [ .] [ .]
111. By using Figure 5 it is clear that even in the low capping scenario by 2013, a 1x900MHz shared carrier would be capacity constrained to the extent that it provided no coverage driven “cost advantage” versus a network using 2x2100MHz carriers. Essentially, O2 does not need to rely on the availability of 800MHz to time limit the “cost advantage” window. Further, if we adopt our “high capping” assumptions then it is clear that the UMTS900 network would be congested from its deployment. This would suggest that in this scenario, the UMTS900 network is used as capacity relief throughout the period, there is no coverage advantage to be had.
112. Our view above is supported by the forecasts and analysis of Ofcom’s own advisors on mobile spectrum liberalisation – Analysys Mason58. In Figure 2 of Dr Heath’s paper he forecasts downlink traffic in developed markets (ie the UK) in MB per user per month. We have converted these figures and summarised his start and end points in the table below.
Table 9 : Analysys Mason forecast usage per user
2008 2015
MB/user/day 1.9 15.2
113. Both the starting figure and the out-turn are consistent with the figures used by O2 in this response. O2 is at a loss to understand why Ofcom has not relied on the figures of its own advisors in conducting its assessment of cost advantages.
Simplification of geotypes/clutter asymmetrically affects UMTS900
114. The UK is made up of a heterogeneous mix of urban, suburban, open etc geotypes. Each geotype will have a different clutter of buildings which affect radio wave propagation Without access to a specialised radio planning tool, Ofcom has had to simplify its approach to modelling site counts for the 80% population area, by effectively creating four islands.
58 Anaysys Mason “Communiqué” December 2008 – “Rising traffic volumes threaten 3G network congestion”; Dr Mark Heath.
36 of 80

NON-CONFIDENTIAL
Each island has a different clutter type and the number of cells required to cover each island can therefore be calculated in a simplified way. This approach is discussed at §§A13.306-A13.323. Such a simplification could be valid if it affected UMTS2100 networks and UMTS900 networks evenly.
115. We show in Annex A at §§355-364 how there is a significant asymmetric boundary effect between UMTS2100 and UMTS900. We therefore do not believe that the simplification used by Ofcom is a valid approach. Real world evidence for this point can be seen by divergence between Ofcom’s modelled differences between site counts and what is seen in practice. Ofcom’s approach leads to a ratio between 1800MHz and 900MHz site counts of 3:1. In reality, in the UK, with its heterogeneous clutter the ratio today is between 1.5-1.2 :1.
116. Our analysis in Annex A is based on our radio planning tools which include highly granular models of actual clutter distributions. This analysis shows that the economic limit of coverage driven build is 11,000 sites per UMTS2100 operator. The same figure that we stated in response to the 2007 consultation.
Networks are built incrementally, rather than pre-determined from the outset
117. Ofcom’s approach to network build assumes perfect information. It assumes that operators build the network to a pre-determined size. By using a model to deliver a green-field network with a given coverage requirement, there is consequently a starting or “design capacity” for that network built-in. This approach would not work in practice because the operator would be making its decision on design capacity at a single point in time, at the time before it starts building. If the operator gets the design capacity wrong, it cannot move the already built sites, say, 10% closer or further apart so it would have to infill with new sites leading to a less than optimal density than Ofcom’s model would imply.
118. To illustrate the point consider a case where an operator builds to a design capacity, but finds over time that demand grows to exceed capacity by 10%, if this growth were uniform over the service the operator may have to nearly double the number of sites to maintain his service objectives. Luckily, in the real world capacity growth is not uniform, but highly variable.
119. Traffic demand in real mobile networks varies strongly with precise location, and is certainly not uniform by clutter type. For example, Ofcom’s four clutter types for 80% population coverage represent about 5% of the UK landmass; the residential population density varies by a factor of 30 within this region. Further, mobile traffic demand is found to be more variable than this, dependent not just on residential population but workplace population, as well as transport and entertainment venue densities. Moreover, different operators may be more successful and have larger market share in one area than another, dependent on such factors as distribution channels, local marketing effort and local user advocacy, all of which are hard to establish when initially designing a network.
120. In fact an accurate knowledge of mobile traffic sources is a key success factor for mobile operators and one reason why such data is very closely guarded. We do not believe that
37 of 80

NON-CONFIDENTIAL
Ofcom has access to this type of data and consequently has had to adopt the simplified (but erroneous) approach that it has.
121. In practice most operators will build initially to a low site density, enough to provide coverage for the number of customers they might expect within the first one to two years of service. This minimises the initial capital outlay, ahead of service revenue being generated. They will then incrementally infill with capacity sites as and when traffic is seen to build up in specific areas. Thus the number of sites required for capacity rises more quickly than expected in Ofcom’s green-field model, and will result in a higher number of capacity sites than the greenfield design due to the necessarily incremental approach. The Figure below illustrates this effect.
Figure 4 : site count differences between incremental and one-off design approach
0100020003000400050006000700080009000
10000
0 5 10 15 20 25 30Traffic per user
Site
s re
quire
d
Sites OfcomSites O2
122. We note that Ofcom has taken this effect into account in previous work. For example, the cost model Ofcom used to arrive at network costs in the 2007 Mobile Call Termination Statement included look ahead planning periods to allow “for equipment purchase in advance of the exact date at which it is required.”59. It is unclear why Ofcom choose to dispense of this approach here.
123. It is hard to quantify the magnitude of the effect as it is based on a large number of uncertainties. Fortunately the consultation process has provided us with a potentially useful benchmark. We show at Table 7 above that a green field network built to maximise UMTS2100 coverage to the highest possible cell edge data rate requires about 8,600 cells. In our 2007 consultation response we provided a figure of 11,000 cells. By dividing the two we produce a proxy for the impact of the real world incremental design approach. The impact on the modelling will be to increase the differential site count by 27%. We use this uplift as a proxy for these dynamic inefficiencies of site build, to ensure that all possible cost scenarios are captured.
59 Ofcom, Mobile Call Termination statement, 27 March 2007, footnote 170
38 of 80

NON-CONFIDENTIAL
Derivation of scenarios for the CBA
124. Obviously we need to treat usage forecasts with care and choose an appropriate set of sensitivities. We also need to consider the impact of the current economic crisis on the demand side and use these sensitivities in conjunction with consistent supply side assumptions.
125. We present six scenarios. Two whereby the market remains coverage limited for the duration of the period to 2015 when 800MHz spectrum becomes deployed. We note that if Ofcom were to rely on these scenarios (to support intervention) would be somewhat illogical. Mobile broadband would not have been a success, yet Ofcom relies on the assumed overbuild of operators (which drives “cost advantages”) to justify intervention!
126. O2 has also selected the following data points to model capacity limited scenarios. Firstly we assume the capacity profiles in Table 8. In a second group of scenarios we assume that the economic crisis delays demand by one year in comparison to Table 8. If the economic crisis had a more profound effect than this, we believe that Ofcom’s concerns regarding the sector would be more structural and that liberalisation may be a rather academic discussion.
127. In order to determine rollout profiles we must also consider the impact of the economic crisis on rollout of network between now and 2010. Ofcom assumes that all operators will have built to 9,00060 cells by 2010. Ofcom has to rely on this number because it relies on network coverage being an important differentiator. If network coverage were not an important differentiator, logically, Ofcom’s purported rationale for intervention would fall.
128. [ .] In order to model (for completeness) the scenarios where the current economic crisis affects the starting number of 3G sites we also look at a starting position in 2010 of 7,400 sites which is consistent with our view expressed in our response to the 2007 consultation, [ .] We therefore build six cases.
60 Presumably 9,000 is set with reference to the public statements of MBNL, the joint venture between H3G and T-Mobile.
39 of 80

NON-CONFIDENTIAL
Table 10 : Demand / rollout scenarios for the CBA (UMTS2100 only operator)
Capacity limited scenarios
Base Case
Low capping
Data growth as Table 8
9,000 sites in 2010
Scenario B
High capping
Data growth as Table 8
9,000 sites in 2010
Scenario C
Low capping
Data growth delayed one year
7,400 sites in 2010
Scenario D
High capping
Data growth delayed one year
7,400 sites in 2010
Coverage limited scenarios
Scenario E
7,400 sites in 2010
11,000 sites in 2015
Scenario F
9,000 sites in 2010
11,000 sites in 2015
Cost differences results
129. Placing each of these profiles into a cost difference model allows us to calculate the NPV of the cost differences between UMTS900 and UMTS2100 networks.
130. In each scenario we start by determining the build out of 3G sites required for the UMTS2100 only operator, starting from either 7400 or 9000 (depending on scenarios) to the maximum required to achieve the coverage level – 11,000.
131. For the UMTS900/2100 operator we build an identical profile to 2009. From that point we build UMTS900 upgrades using Figure 24 to determine the required number to achieve incremental coverage (to the target level) beyond that provided by the UMTS2100 layer built to 2009.
132. In cases where usage per user congests the UMTS900 layer (ie above 15MB/user/day on that layer, assumes 50% of total traffic is carried on that layer), further UMTS2100 capacity sites are built by the UMTS900/2100 operator, in order to avoid congestion in areas where it only has UMTS900 coverage. We use a factor of 27%61 to converts the “ideal” site count figures to those that would be required based on incremental deployment are applied to the capacity scenarios only, this is explained at §§355-361.
61 See §123
40 of 80

NON-CONFIDENTIAL
Table 11 : Cost advantage of UMTS900 rollout in O2’s six scenarios
Capacity limited scenarios
Impact of economic crisis Low capping High capping
No affect Base Case
£10m
Scenario B
£(105)m
Slows growth by 1 year
No build in 09/10
Scenario C
£151m
Scenario D
£(41)m
Coverage limited scenarios
No build in 09/10 Scenario E
£291m
Scenario F
£153m
133. Essentially, in capacity driven scenarios, it is the phasing of capacity growth in the period to 2015 that determines whether investment in UMTS900 versus UMTS 2100 over the period to 2015 is the most efficient route to deal with demand, whilst providing the level of coverage assumed by Ofcom in this consultation. The negative cases show where it would have been prudent to deploy capacity early (ie a two carrier 2100MHz cell), rather than deploy for coverage (a one carrier 900MHz cell) and then subsequently build again for capacity at 2100MHz after usage reaches 15MB/user/day.
134. It is only where capacity is not the binding constraint within the period, ie average data usage per user does not rise above 15MB/user/day between now and 2015, that we see there being a time limited cost advantage. The requirement to deploy UMTS900 upgrades to many thousands of sites off-sets most of the benefit. It is only in the case where we see a much lower starting value for the UMTS2100 site count in 2010, that a significant cost advantage accrues over the period. In order to concoct an appreciable “cost advantage” Ofcom is required to rely on either:
i. The economic crisis halting all network build between now and 2011; or
ii. Operators being able to survive for two years without matching the coverage advantage of MBNL, which is well advanced in its network rollout.
135. However, in order to (ii) to be true, logically coverage would not be a key differentiator and the basis for Ofcom’s proposals would fall away. This consultation would fail on its own terms (again).
41 of 80
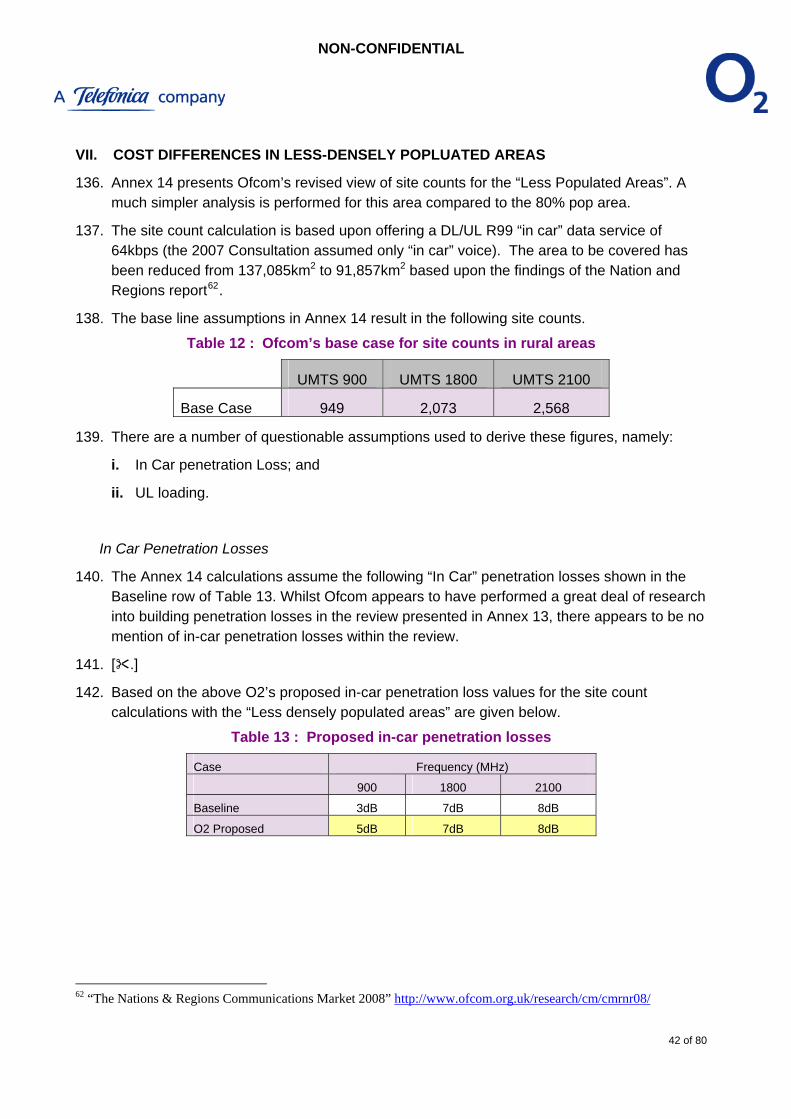
NON-CONFIDENTIAL
VII. COST DIFFERENCES IN LESS-DENSELY POPLUATED AREAS
136. Annex 14 presents Ofcom’s revised view of site counts for the “Less Populated Areas”. A much simpler analysis is performed for this area compared to the 80% pop area.
137. The site count calculation is based upon offering a DL/UL R99 “in car” data service of 64kbps (the 2007 Consultation assumed only “in car” voice). The area to be covered has been reduced from 137,085km2 to 91,857km2 based upon the findings of the Nation and Regions report62.
138. The base line assumptions in Annex 14 result in the following site counts.
Table 12 : Ofcom’s base case for site counts in rural areas
UMTS 900 UMTS 1800 UMTS 2100
Base Case 949 2,073 2,568
139. There are a number of questionable assumptions used to derive these figures, namely:
i. In Car penetration Loss; and
ii. UL loading.
In Car Penetration Losses
140. The Annex 14 calculations assume the following “In Car” penetration losses shown in the Baseline row of Table 13. Whilst Ofcom appears to have performed a great deal of research into building penetration losses in the review presented in Annex 13, there appears to be no mention of in-car penetration losses within the review.
141. [ .]
142. Based on the above O2’s proposed in-car penetration loss values for the site count calculations with the “Less densely populated areas” are given below.
Table 13 : Proposed in-car penetration losses
Case Frequency (MHz)
900 1800 2100
Baseline 3dB 7dB 8dB
O2 Proposed 5dB 7dB 8dB
62 “The Nations & Regions Communications Market 2008” http://www.ofcom.org.uk/research/cm/cmrnr08/
42 of 80

NON-CONFIDENTIAL
Uplink Load Factor
143. Annex 13 includes a load factor of 50% in the uplink which translates to a maximum allowed uplink noise rise of 3dB. Whilst a load factor of 50% is typical in Urban and Suburban areas, operators tend to use a lower value in rural areas and during initial deployment. [ .]
144. Therefore O2 proposes that a more sensible value of uplink load for a coverage limited UMTS deployment is 30% rather than 50%.
Adjusted Less Densely Populated Area Site Counts
145. The individual and cumulative effect of the above proposed parameter changes is show below.
Table 14 : Determining revised site counts for rural areas
UMTS 900 UMTS 1800 UMTS 2100 Base Case 949 2,073 2,568 Pen Loss Correction 1271 2073 2568 UL Load Correction 766 1645 2038
Combined Correction 1027 1645 2038
Calculating “cost advantage”
146. Ofcom’s cost advantage analysis is summarised in the table below.
Table 15 : Ofcom’s analysis for less densley populated areas
UMTS900 UMTS2100
Number of sites 949 2,5,68
Benefit £20-60m depending on rollout speed
147. The difference in site counts suggested by Ofcom is 1,629, whereas O2’s analysis places this differential at just 1,011. We therefore reduce the purported “cost advantage” calculation ,in Table 12 above on a pro rata basis.
Table 16 : O2’s assessment of cost advantage in rural areas
UMTS900 UMTS2100
Number of sites 1,027 2,038
Benefit £12-37m depending on rollout speed
148. We have also assessed the impact of the boundary effect error described in Annex A at §§355-359. Whilst this does not significantly affect the site count differences, it does appreciably increase the absolute site counts for both UMTS900 and UMTS2100.
43 of 80

NON-CONFIDENTIAL
Will there be rollout in rural areas?
149. Ofcom notes that both H3G and T-Mobile have announced plans to extend their UMTS2100 footprint into areas where T-Mobile already has 2G coverage. There is no suggestion that the provision of the existing 2G coverage levels are sufficiently onerous to disadvantage either Orange or T-Mobile now, nor in the last ten years. There has been no proposal from Ofcom in the last 10 years to intervene to alter spectrum holdings because of any hypothetical disadvantage in rural areas at GSM1800. In our view, therefore Ofcom has no basis for intervention to maintain an equivalent level of coverage for UMTS2100, where there is little difference in the number of required sites to GSM1800.
150. In order to determine whether there will be rollout in rural areas it is useful to consider how the cost of providing services varies with geographic location. In its recent draft determination regarding an interconnection dispute between MCom and T-Mobile, Ofcom helpfully estimates the relative unit costs of providing mobile termination in different geographical locations.
Figure 5 : Ofcom’s estimate of efficient network cost of termination (ppm)63
151. Obviously this chart is produced with respect to one service, mobile voice call termination. However, in general terms it will be reflective of the differentials in unit costs between urban/suburban coverage and equivalent costs in rural areas.
63 See http://www.ofcom.org.uk/consult/condocs/mapesbury_tmobile/draftdeter.pdf Figure A1, Annex 1, p.52
44 of 80

NON-CONFIDENTIAL
Table 17 : Geotype data – LRIC Model Geotype Area (km2)
Urban 328
Suburban 1 3,887
Suburban 2 11,534 Rural 1 46,220 Rural 2 55,341 Rural 3 32,675 Rural 4 87,955 Highways 11,000 Railways 2,000 TOTAL 250,941
152. Ofcom’s definition of the 80% population area accounts for 31,444 km2, placing it partially in the Rural 1 geotype. Ofcom estimates the 2G coverage area beyond the 80% footprint at 91,857km2. This moves 3G coverage to into the Rural 3 geotype. It is of note that the unit cost of coverage in the Rural 3 geotype is more than double than that of Rural 1 (according to Figure 7). Therefore, we consider that Ofcom’s assumptions regarding the maximum scope for coverage by a single operator seem sensible. As Ofcom highlights, the real question is, will this rollout take place before 2015?
153. In its recent response to the Digital Britain consultation, Orange64 suggested that it would rollout a network to 98.5% of the population by 2012 if it had access to 900MHz. We do not comment on that claim here, save to note that this is a perfectly rational claim to make as Orange’s proposal is conditional on free 900MHz spectrum and Orange not incurring the cost of clearing that spectrum in urban areas. Orange clearly believes that rural rollout by one operator is an economic proposition, absent spectrum clearance and acquisition costs.
154. Given the plausibility of the extent of rural coverage that Ofcom has assumed and the fact that Orange believes it would rollout into rural areas by 2012 (if it had 900MHz spectrum) we believe that O2’s analysis needs to address the full cost advantages in rural areas from making 900MHz spectrum available, as well as the welfare benefits arising from this.
155. We therefore take forward figures of £12-37m as the range of cost advantages in rural areas into our CBA.
64 http://www.culture.gov.uk/images/publications/OrangeUK__DBIRResponse.pdf
45 of 80

NON-CONFIDENTIAL
VIII. COST OF CLEARANCE
156. In contrast to the 2007 consultation, Ofcom adopts the correct methodological approach to assessing the costs to society of forced release of spectrum by O2 and Vodafone. That approach is to assume a factual case, of the 2x5MHz refarmed by each 900MHz operator, associated with the volume of released spectrum per operator in addition to each 900MHz operator refarming one carrier for its own use. The counterfactual scenario is just the 2x5MHz refarmed by the incumbent 900MHz operators.
157. Ofcom suggests, at §A16.258, that 2011/12 is perhaps the point in time when 2G traffic will be at its highest. This may or may not be true [ .]. However, what we can say with certainty is that O2 does not agree with Ofcom’s estimate of the level of traffic at 2011/12, ie the traffic growth assumptions between now and then. Given the sensitivity of the clearance costs to 2G traffic, Ofcom is required to very carefully assess the implications of traffic growth, rather than assume it away.
158. Synthesised Frequency Hopping65 (SFH) remains Ofcom’s mitigation technique of choice in order to clear spectrum whilst minimising the impact on the environment by way of new mast sites required to beef up UMTS2100 networks or cell split the capacity constrained 900MHz networks. Ofcom appears reticent to provide the same level of transparency to citizens of the disbenefits of its proposal (more masts) when compared to the illusory benefits (less masts) it quoted in the 2007 press release. It would appear that “equal prominence” is not a rule that applies to Ofcom itself. Unlike Ofcom we transparently identify the environmental impact of these proposals and should it be required we are able to provide Ofcom or other interested parties with detailed information as to where the environmental impact on citizens will be felt the most.
159. Three approaches are presented by Ofcom in order to deal with the congestion in the 900MHz networks that spectrum clearance will cause – remembering that these costs are incurred with certainty whereas the benefits of release are pure speculation.
160. The detailed analysis behind the data in this section is contained in Annex B to this response.
The traffic growth assumption
161. Depending on scenario, Ofcom assumes that there will be between 0% and 20% 2G network traffic growth between 2006/7 and 2010/11. We look at three sources:
i. Ofcom’s Mobile Sector Assessment consultation, which clearly identifies the productive efficiency benefits that have been accrued by consumers;
ii. The Telecoms Data Tables, and Communications Market Reports regularly published by Ofcom, which provide a historical reference point as well as evidencing how different operator strategies give rise to different traffic growth outcomes;
65 Or more correctly RF-SFH – Radio Frequency Slow Frequency Hopping
46 of 80

NON-CONFIDENTIAL
iii. O2’s own Network Design Forecast (NDF). In our response to the 2007 consultation we provided Ofcom with the forecasts from this highly confidential document. Forecasts that Ofcom appears to have chosen to ignore.
162. In Ofcom’s recent consultation Mobile Sector Assessment66 there is an extensive analysis of the gains that consumers have benefited from in recent years as the unit cost of calls has fallen. Essentially, customers (on average) are getting many more minutes for their money and this is reflected in significant traffic growth. Ofcom clearly welcomes these consumer benefits – it must therefore be consistent and build in the consequent traffic arising from these benefits into its analysis in this consultation. The following quotes from the MSA are instructive:
163. This is summed up in the following chart, which provides the traffic growth rate across the market for voice call minutes.
66 http://www.ofcom.org.uk/consult/condocs/msa08/msa.pdf p.16
47 of 80

NON-CONFIDENTIAL
164. The Telecoms Market Data Tables are published by Ofcom on a quarterly basis. The following chart summarises the growth rates in overall retail and termination volumes for the market as a whole and O2’s traffic growth relative to the market.
Figure 6 : Voice call volume growth (year-on-year) for both MO and MT
0.0%
5.0%
10.0%
15.0%
20.0%
25.0%
Q2 2005 Q3 2005 Q4 2005 Q1 2006 Q2 2006 Q3 2006 Q4 2006 Q1 2007 Q2 2007 Q3 2007 Q4 2007 Q1 2008 Q2 2008 Q3 2008
yoy growth
MarketO2Market less O2
165. The chart above clearly shows that O2 is the main engine of traffic growth in the UK market. That traffic growth is both a function of our strategy and our success in increasing our market share. It is not appropriate for Ofcom to assume the “market rate” for growth (ie c. 10%), as would be quoted by sources such as Informa (see §A16.61 footnote 2), rather it should look at the specific impact on O2, in light of its historical data whilst also building in sufficient headroom for continuation of our current strategy and further success in securing market share. To do otherwise would be planning for failure and would be highly discriminatory.
166. [ .]
167. [ .]
168. Taking these pieces of evidence in the round leaves us at a loss as to why Ofcom has used such a low forecast in this consultation. Clearly the lower the forecast the easier it is for Ofcom to make the benefits greater than costs in the CBA.
169. [ .]
170. [ .]
48 of 80

NON-CONFIDENTIAL
171. Furthermore, without using O2’s actual forecast volumes Ofcom could not warranty the claim it makes at §A16.56 “we believe that it will be possible for both O2 and Vodafone to maintain a nationwide 2G service incorporating their MVNOs for as long as they wish to do so.”
SFH and the Red-M report
172. MNOs have a significant information, experience, analytical and resource advantage over Ofcom. Designing efficient and effective radio networks is a core element of our business. Whilst Ofcom is the specialist sector regulator it is not efficient for it to retain significant in-house expertise on this very specialised subject. This is why Ofcom has appointed various expert advisors, in particular Red-M, to augment its in-house expertise.
173. Ofcom kindly provided O2 with the requirement specification against which Red-M delivered its results. This specification clearly states that Red-M should undertake the following steps:
“Step 1: The benchmark 2G network should approximate a ‘real’ practical 2G network in the UK today with typical network coverage and capacity levels commensurate with a Macro Cellular layer . A practical frequency plan should be considered for the traffic and broadcast channels.
Step 2: Once the baseline network is simulated, a 2x2.5 MHz block of spectrum needs to be cleared of GSM carriers from the operator. The network then needs to be re-planned (with additional sites as necessary) and optimised to recover (approximately) the same capacity and coverage it had before the spectrum was cleared.
• During the re-planning/optimisation new sites can be rolled out and cell splitting (adding additional sectors) can be performed. Also, a new frequency re-use pattern can be implemented as necessary.
• At the end of the optimisation activity the minimum number of additional base stations and/or cell splits required to provide the same coverage and capacity as the baseline network will need to be calculated.
The Final output should include the number and type of additional macro base sites needed to recover the baseline capacity/coverage against a reduced frequency holding (ie per 2.5MHz incremental reduction)”
[our emphasis]
174. Red-M was instructed to implement “a new frequency re-use pattern” “as necessary”, but Red-M has chosen to stick with baseband hopping rather than switch to SFH. Red-M themselves, in their second report identify their approach as “simulating a ‘least cost minimum disruption’ scenario where sites in the baseline network continue to exist in the reduced spectrum scenario. The sites are not moved, but some tuning of antenna down-tilt was used to control interference.”
49 of 80

NON-CONFIDENTIAL
175. Further, Red-M characterise their assessment as using “A benchmark 2G network was designed using the ‘ICS Telecom’ planning tool. This network was designed to approximate a ‘real’ UK 2G network, with coverage probability as specified in Ofcom’s technical parameters.” [our emphasis]
176. All operators have a strong economic incentive to maximise the efficiency of their radio networks. This means optimising the balance between coverage, capacity and quality (frequency-re-use). We note at §A16.76 that all the MNOs have implemented a form of hopping – Baseband Hopping (BBH). No UK operator has implemented Synthesised Frequency Hopping. If Ofcom’s figures on the increased spectral efficiency of SFH over BBH (18%)67 are to be believed, implementing this technology today could save each operator substantial sums of money irrespective of the prospect of liberalisation.
177. Surely Ofcom should have asked itself the following questions:
i. why haven’t any of the MNOs implemented SFH?
ii. why didn’t Ofcom’s own expert advisors implement SFH?
178. These facts alone should strongly suggest that any marginal improvements in spectrum efficiency from SFH are off-set by other factors. It is actually rather insulting for Ofcom to persist in assuming that it knows the optimum way to configure a 2G network for lower available spectrum, than the operators which have the economic incentive to deploy the best balance between quality, capacity, coverage and cost.
179. At Annex B §§382-400 we discuss in detail why SFH (RF-SFH) is no more efficient than BBH (BB-SFH) utilising random hopping techniques. Trials performed by O2 have shown that customer experience is significantly degraded by the use of RF-SFH compared to the use of random BB-SFH68, and random BB-SFH has been shown to perform significantly better than cyclic BB-SFH.
180. Additionally, greater capacity improvements can be achieved using AMR half rate, with a more consistent level of channel quality given by BB-SFH, when compared to AMR full rate in conjunction with RF-SFH. AMR half rate is able to capitalise on the improved interference conditions assured through a planned frequency distribution, and hence allows lower levels of channel coding to be employed for calls in known good coverage. RF-SFH works in the opposite way by inducing higher interference and hoping the error correction coding can recover the original content, which it sometimes fails to do. Interference can only be assumed to be low close to the cell centre thereby significantly reducing the applicability of AMR half rate with RF-SFH.
181. The lack of ability to use RF-SFH on BCCH TRXs is a significant performance limitation and results in the requirement to increase the amount of spectrum used for BCCHs in order to maintain the required speech and call-drop-rates on those TRXs. This further reduces the
67 A16.81 – Ofcom assume reuse for SFH on TCH is 11 and 13 for BFH. Therefore Ofcom’s view of the maximum efficiency gain from SFH is 13/11 = 18% 68 As deployed by O2.
50 of 80

NON-CONFIDENTIAL
number of frequencies over which RF-SFH can be deployed, which in turn further reduces the efficiency of RF-SFH to or even below that of BB-SFH.
182. Overall, after much investigation, O2 believes that random BB-SFH (base band hopping) offers all the hopping gains achievable from RF-SFH (as proposed by Ofcom), but has the added advantages that AMR half rate and high data rates can still be fully supported over much larger geographic areas69. RF-SFH cannot give something for nothing; it indiscriminately increases interference across the whole cell area, thus significantly reducing the ability to use AMR half rate. BB-SFH preserves the interference environment and mitigates frequency-selective fast fading. It also mitigates higher levels of interference through planned interference diversity over the assigned frequencies, thus optimising its use for AMR half rate, and it allows for high data rates where EDGE is deployed.
183. O2 is strongly of the view that Ofcom has misrepresented the benefits of RF-SFH and that that there are no overall network efficiency gains to be had by deploying RF-SFH (in conjunction with AMR) in place of random hopping BB-SFH (in conjunction with AMR half rate). This is precisely why no MNO has deployed the technology on which Ofcom seeks to rely.
184. Below is a comparison of the cost of clearance both in financial and environmental terms, using Ofcom’s analysis once SFH is removed.70
Table 18 : Impact of removing SFH on the cost of spectrum release
Release Approach 2 Approach 2 without SFH
Cost71 New masts Cost New masts
1 Block (2009 proposal) £120-180m 597 £430-660m 2,422
2 Block £430-660m 2,422 £1,550-£2,300m 9,608
3 Block (2007 proposal) £1,550-£2,300m 9,608 n/a n/a
Source : Ofcom
185. When one looks at the table above it is obvious why Ofcom is willing to disregard evidence, the research of its expert advisors and the practices of the MNOs in order to rely on SFH as its mitigation technique of choice. 2,422 additional masts72 being built in Spring 2010 would be unacceptable to citizens and their democratic representatives. It would also, in our view,
69 O2 has extensive deployment of EDGE. Maintaining data performance would be aligned with the thrust of Ofcom’s proposals, suggesting approaches that actually degrade data performance would appear to be irrational and inconsistent, contrary to Ofcom’s duties. 70 We use Ofcom’s base case for Approach 2 at Tables 34 and 41 in Annex 16. For the data in Table 34 we take the differential between the clearance impact of 3+ blocks and the two block clearance in the hands of the incumbents. To estimate the impact of removing SFH, we use the assumption of Ofcom at A16.131b3 but in reverse. 71 Cost to society 72 This figure is before the erroneous traffic forecast is corrected.
51 of 80

NON-CONFIDENTIAL
constitute a breach of Ofcom’s primary duty towards citizens under s3(1)a of the Communications Act 2003.
186. Given that these sites have to be built in highly specific locations to provide effective traffic offload, in some cases within 50m of an ideal location, O2 and Vodafone will require compulsory access powers over land and property owners at these locations, with some agreed means of establishing fair rents to avoid site-owner hold-up, and will require granting of increased permitted developed rights in order to allow this level site build to progress through Town and Country Planning process with minimal delay. We look forward to the Government’s legislative proposals in due course.
187. For the remainder of this assessment we dispense with RF-SFH as a mitigation technique, as it does not provide the benefits claimed and implementation would be detrimental to service quality and customers.
Choice of mitigation technique by operators
188. Ofcom uses three approaches to determine the envelope of release costs. In summary they are:
i. Increased 3G handset subsidy and investment in UMTS2100 network outside of the 80% coverage area;
ii. Cell splitting 900MHz and relying on more investment in GSM sites;
iii. Increasing the use of 1800MHz and cell splitting 900MHz.
189. At A16.4 Ofcom observes that “in practice they [O2 and Vodafone] are likely to adopt a combination of these solutions.” Each of these approaches has positive and negative aspects which we explore in the following sub-sections. If Ofcom believes that operators would adopt a blended approach then this must be reflected in its assessment of these impacts on citizens and consumers when it comes to the CBA.
190. Alternatively, in order to avoid addressing complex issues such as the dynamic impact on the market, Ofcom could base its calculations on the preferred method of each MNO to mitigate 2G spectrum loss. This would also avoid any risk of discrimination against either O2 or Vodafone by Ofcom having to assume that one operator adopts the strategy of the other.
191. Consequently, in Annex B we provide insight into what we view as the only workable approach to clearing spectrum for our own use, which we summarise in this Section. We have had to investigate this issue thoroughly over the last two years, because of Ofcom’s repeated proposals to intervene to remove spectrum from us. However, O2 has yet to make any decision regarding its own deployment of UMTS900 nor has it allocated funds to that end.
52 of 80

NON-CONFIDENTIAL
UMTS2100 network enhancement
192. This approach is, in the long run, the most efficient in that it is based on greater investment (than the counterfactual) in the future technology UMTS, rather than in GSM. However, in the short run it is one of the more costly approaches according to Ofcom’s figures. Furthermore, this approach is unlikely to deliver a sufficient reduction in 2G traffic in the timeframe for intervention because of falling device churn [ .].
193. In our response to the 2007 consultation we raised the issue of distortions of competition in the market for 3G handsets caused by the “subsidies which we [Ofcom] assume would be needed to ensure there are enough 3G capable handsets available.” Nowhere in the consultation does Ofcom address the consequent distortion of competition in the mobile market that would arise due to frothy competition based on handset subsidy. [ .].
194. In our 2007 response we also highlighted that the use of subsidy has a dynamic effect, leading to a reaction from competitors to the increased level of subsidy which makes it progressively harder to migrate customers [ .] In its response, Vodafone highlighted that these subsidies are not one-off as assumed by Ofcom, but may endure. If customers are sufficiently price sensitive to the subsidy then when it is withdrawn they may revert back to cheaper (2G) devices in the market at some future date.
195. Ofcom’s failure to address these points is a major omission and O2 believes that Ofcom will have not conducted a sufficiently robust assessment until this issue is addressed in full73 and we have had a chance to comment on Ofcom’s analysis. Should Ofcom change its proposal to leave all spectrum in the hands of the incumbents then the subsidy issue falls away.
196. In light of the procedural failure and the inherent complexity in creating a properly functioning dynamic model of the mobile retail market, we do not review this approach in further detail.
197. As we have said elsewhere, any proposal from Ofcom that requires O2 to change the way it successfully trades in the market will be resisted with the utmost vigour.
GSM1800 deployment and 900MHz cell splitting
198. This approach requires O2 to continue to invest in a legacy technology [ .] This is totally the opposite of what Ofcom seeks to achieve – better 3G coverage.
199. O2 has reworked the cost of clearance calculations based on its own NDF and the only workable approach to clearing traffic in order to achieve the counterfactual case – refarming by O2 itself. In our view, the only workable solution would be to migrate as much traffic as would be “natural” into the 2100MHz (ie without recourse to additional subsidy), degrade its
73 [ .]
53 of 80

NON-CONFIDENTIAL
2G network quality in urban areas by heavy deployment74 of AMR half rate and perform about 2,500 GSM1800 upgrades at existing sites in order to maximise spectral capacity.
200. The net result of these corrections is shown below. Further details can be found in Annex B to this response.
Table 19 : Impact of corrections to cost of release
Release Ofcom Approach 375 Based on O2 approach and NDF
Cost New masts Cost New masts
1 Block (2009 proposal) £120-180m 269 £690m 2,400
2 Block £430-660m 874 £1,645m 5,800
3 Block (2007 proposal) £1,550-£2,300m 2,333 Not possible to run
GSM network76
Not possible to run
GSM network
Network sharing
201. At A16.63 Ofcom rather presciently points out that “2G RAN sharing would increase the pool of 2G sites available and therefore could make this a more cost efficient strategy (for operators with such an agreement).”
202. On 23rd March 2009 Telefónica SA and Vodafone plc announced that they had signed an agreement to share base station sites and passive network equipment at their 2G and 3G sites in the UK. [ .]
203. [ .]
204. [ .]
205. Furthermore, we do not feel it is appropriate for Ofcom to rely in a regulatory decision on the continuation of a commercial agreement between two parties. Ofcom’s decision should stand and fall on the standalone operator, such that Ofcom’s assumptions are not instantly unwound should the above agreement fail77.
74 We plan to deploy out the maximum possible AMR Half Rate, to about 66% of our carriers. The radio environment for the remaining 33% of carriers would be too poor to support AMR HR. 75 Annex 6 Table 50 and incremental cell splits from Table 44. 76 2007 consultation §A9.141 77 See §3.29b2 – regarding the now defunct agreement between Vodafone UK and Orange UK.
54 of 80

NON-CONFIDENTIAL
Table 20 : Revised cost of release based on O2’s NDF and chosen approach to clearance
Release Stand alone Network Sharing
1 Block (2009 proposal) £690m £500m
2 Block £1,645m £1,195m
3 Block (2007 proposal) Not possible to run GSM
network
Not possible to run GSM
network
Incremental costs of LTE900 resulting from release
206. In its cost benefit analysis Ofcom recognises that O2 and Vodafone will incur further incremental costs of intervention when they come to migrate from UMTS900 to LTE900 (with a 2x10MHz carrier)78. Ofcom has calculated the costs of the incremental costs in 2015 of migration to LTE. We provide our comparable figures below, based on no SFH deployment, our traffic growth assumptions and other corrections described above. Given the time to 2015, there is much greater range in our forecast costs, driven by the larger range in forecast future 2G traffic in 2015. The figures in the table below are for O2 and Vodafone combined.
Table 21 : Incremental cost of LTE900 deployment in 2015
Release in 2011 Incremental cost of refarming another carrier for LTE900 in 2015
Ofcom O2
1 Block (2009 proposal) £45m £225-1,710m
207. The figures above relate to further cell splits and GSM upgrades in 2015. We estimate that between 500 and 4,000 incremental sites per operator would need to be built, depending on differing views of what will happen to 2G traffic growth and the success of 3G migration in the interim.
78 §§A7.156-158
55 of 80

NON-CONFIDENTIAL
IX. COMPETITION AND WELFARE
208. Ofcom’s cost benefit analysis considers different “significance scenarios” which are related to market scenarios where there is low, medium or high demand for mobile broadband. In the medium and high significance scenarios Ofcom’s analysis suggests that either:
i. all the 2.1GHz operators will match the quality of service that the 900MHz operators can provide on their networks but will incur significantly higher costs to do so; or,
ii. the costs to some or all of the 2.1GHz operators of improving their UMTS networks (by adding more sites) are too high so that they will not be able to match the quality of service that the 900MHz operators can provide on their networks.
209. In the latter case Ofcom analysis implies that without regulatory intervention not all mobile operators will be able to provide what Ofcom terms “high quality mobile broadband”79 services. To estimate the benefits of regulatory intervention, in particular from making the 900MHz spectrum available to more operators, Ofcom uses a competition impact model which assesses the welfare implications of changes in the number of competitors that are able to provide high quality mobile broadband services. Therefore the competition impact model is an important input into Ofcom’s cost benefit analysis. Ofcom states at §4.55 that, in its base case, an increase in the number of operators with access to 900MHz spectrum from 2 to 3 might “increase economic welfare by around £425 million.”
210. This Section focuses on Ofcom’s estimates of the welfare benefit from enabling more operators to be able to compete in the provision of high quality mobile broadband service by making 900MHz spectrum available to more operators.
Model of competition
211. Ofcom’s approach assesses welfare on the basis of a simple static Cournot oligopoly model that is applied across several periods. In each period the model compares the change in consumer surplus, producer surplus and total welfare under mandated release of 900MHz spectrum (what Ofcom calls the “factual” scenario) and the counterfactual of spectrum liberalisation in the hands of the current 900MHz spectrum holders, to calculate the net benefits that arise from an increase in the number of providers of high quality mobile broadband services. Ofcom assumes that UMTS 900MHz networks will be rolled out by 2012 and that 800MHz networks would be rolled out by 2015 and that either of these networks will be able to provide high quality mobile broadband. Therefore, in Ofcom’s model the benefits from mandated spectrum release are due to greater competition in the period 2012-2014 only.
212. Ofcom’s model is simple and heavily stylised. It assumes a model of less than perfect competition (a Cournot oligopoly) with a defined number of competitors. Based upon a forecast for the future revenues and the number of operators in the market and using an
79 Consultation §A9.1
56 of 80

NON-CONFIDENTIAL
estimate of the demand elasticity, the model calculates the shape of the demand curve. The model then provides an analysis of how consumer and producer surplus vary with the number of operators.80 We consider that Ofcom’s approach does not reflect the nature of competition in the mobile sector.
213. Ofcom’s justification for using a Cournot model is not robust. The mobile market does not appear to fulfil many of the basic criteria for using a Cournot model. This is important because a Cournot model by construction assumes significant increases in welfare as the number of competing firms in a market increases. Ofcom claims at §A9.15 that there “is a solid theoretical and regulatory foundation for considering that entry will increase competition” and that “the majority of oligopoly models commonly used in analysing competition and merger issues in oligopoly also predict this result.” We do not dispute the general point that, where there are a limited number of firms in a market, competition would be expected to increase to some extent by entry. However, the form by which prices vary with entry is crucial – by using a Cournot model Ofcom has effectively assumed the result of significant welfare increases without providing any evidence on why prices would be expected to vary with the number of operators in the way it has assumed.
214. We note that Ofcom’s choice of model has been criticised in responses to previous consultations.81 In response to that criticism at §A9.16 Ofcom justifies its use of the Cournot model on the following basis:
i. The Cournot model is very tractable.
ii. The Kreps and Scheinkman model shows that “the outcome of the standard Cournot model (where firms decide only what quantity to supply) is equivalent to a Cournot model with a two-stage decision process. First firms commit to the capacity they aim to provide over their networks and then they compete in prices.”
iii. “a ‘Bertrand’ model of oligopoly (in which firms compete on price) with product differentiation, may describe competition in mobile well. It also produces outcomes similar to the standard Cournot model and it is extensively used in merger simulation for anti-trust cases.”
215. Notwithstanding Ofcom’s justification we have key concerns with the application of the Cournot model to the UK mobile market:
i. Tractability. This is not relevant if the model does not appropriately describe the nature of competition in the mobile market. Therefore, absent evidence that the model of competition that is used is appropriate to describe the market we do not believe that this can be used to justify Ofcom’s approach.
80 An input into the model is the proportion of subscribers that are sensitive to changes in quality. This is necessary for the model to provide values for the retail price and for marginal cost, however, the change in consumer and producer surplus do not vary with this input. Therefore, the values for the retail price and the marginal cost that come from the model are a by-product, and are arguably not meaningful – they simply vary inversely with the assumed proportion of subscribers that are sensitive to changes in quality. 81 For example, Vodafone questioned the appropriateness of the Cournot model in its response to the September 2007 consultation.
57 of 80

NON-CONFIDENTIAL
ii. Assumption on the form of competition. In the Cournot model operators are assumed to make decisions about how much quantity they are going to supply, taking into account the characteristics of demand, and under the assumption that the other operators are acting in the same way. The operators then simultaneously offer the chosen quantities on the market and the price gets determined on the basis of the total quantity as well as the demand characteristics. The Kreps and Scheinkman model is more complex, however, we note that it gives similar outcomes to the Cournot model because in the equilibrium operators set prices in the second stage such that the capacities that are committed to in the first stage are fully utilised.
In the mobile sector operators compete on the basis of prices, with several dimensions including the per-minute or monthly charges and the amount of handset subsidy, as well as on the degree of network coverage and on the installed capacity and all these factors can be varied. Furthermore, typically when operators upgrade networks they install sufficient capacity for several periods and therefore, in any one period, operators are unlikely to be capacity constrained. This is especially the case where demand for services using a specific network is increasing rapidly as would be expected to the case with UMTS 900MHz. Therefore, the nature of competition in the mobile sector does not easily fit either the Cournot or the Kreps and Sheinkman models.
iii. Static model. Both the Cournot and Kreps and Scheinkman models are static i.e. they do not involve multiple time periods. In reality mobile operators vary capacity over time depending on the level of demand, and if demand increases significantly then operators will install more capacity to meet that demand. Furthermore, operators will consider how competition is expected to vary in the future when setting prices. For example, for high quality mobile broadband provided on UMTS 900MHz networks the fact that 800MHz spectrum will become available, could be expected to have constraining influence on the pricing decisions of the 900MHz operators. Therefore, any simple static model cannot be expected to fully describe the nature of competition.
iv. Product differentiation. Ofcom states that a Bertrand model with product differentiation may describe mobile markets well. Ofcom attempts to substantiate the use of the Cournot model by stating that it produces results similar to a differentiated Bertrand model. However, this is not necessarily the case. The way prices vary with the number of competitors in differentiated product Bertrand models is dependent on the product-specific own- and cross-price elasticities of demand, which depend on the firm and product characteristics. There is no reason to suppose that this will lead to results similar to a Cournot model. For example, in a homogeneous product Bertrand model where there are two operators in the market then any further entry leads to no increase in competition and therefore would have no impact on prices and zero impact on consumer welfare. Similarly if there is relatively limited value in additional product differentiation, then the increase in the number of firms beyond a point would be expected to have a relatively limited effect on competition. This example shows that there are generally differences between models based on Bertrand and Cournot
58 of 80

NON-CONFIDENTIAL
competition, which would be expected to affect very materially the results obtained by Ofcom.
Market size and segmentation
216. In order to assess the relevant market Ofcom considers “those customers who may be sensitive to differences in mobile broadband quality and the associated revenues.”82 Ofcom determines the relevant market size by taking a forecast for total mobile market revenues and allocating a proportion of this to the high quality segment using a simple top-down assumption. In the base case Ofcom assumes that “the revenues sensitive to changes in quality - and so forming the size of the affected market segment – is 25% of total UK mobile market revenues.”83 This percentage is held constant over time.
217. As shown in Figure 9 below, between 2012 and 2014 this amounts to assuming that that the revenues from the customers who are sensitive to differences in mobile broadband quality are worth around £5.4-5.5 billion per annum. These revenues constitute are effectively treated as a high quality mobile broadband market segment.
Figure 7 : Revenues associated with customers who may be sensitive to
differences in mobile broadband quality
High quality mobile broadband revenues
0.0
1.0
2.0
3.0
4.0
5.0
6.0
7.0
2008 2009 2010 2011 2012 2013 2014 2015 2016 2017
£ bi
llion
Source: Ofcom (2008 prices)
82 Consultation §A9.22 83 Consultation §A9.23
59 of 80
NON-CONFIDENTIAL
218. The Cournot oligopoly model is then applied to the entire segment, for both the factual and counterfactual scenario. This effectively assumes that:
i. if the 2.1GHz operators do not incur costs to match their networks to those of the 900MHz operators, that during the period 2012-2014 it is only the 900MHz operators that are able to provide services to this entire £5.5 billion market segment;84 and,
ii. pricing constraints on these operators are the result of competition between each other only (based on Cournot).
219. We consider the validity of these assumptions below.
The size of the high quality mobile broadband market segment
220. The assumption that the revenues associated with customers who may be sensitive to differences in mobile broadband quality are equal to 25% of total mobile sector revenues is a key driver of Ofcom’s modelling results, yet Ofcom fails to present any justification for it.
221. Because Ofcom’s competition impact model assumes that only the UMTS 900MHz operators and matched 2.1GHz operators are able to serve these high quality mobile broadband customers, it is reasonable to compare the revenues assumed to be derived from these customers to Ofcom’s projections of the number of subscribers using UMTS 900MHz, or the equivalent services provided by 2.1GHz operators. In this context we note that Ofcom’s assumptions in the cost of delay to launch services model do not appear to be consistent with the 25% assumption. In the cost of delay model, Ofcom presents different migration paths to UMTS 900MHz-based services (or equivalent from 2.1GHZ RAN-sharing operators). The base case migration path is presented in Figure 10 below. Ofcom assumes that subscribers would start to migrate to high quality broadband services in 2011, and during 2012 on average 4.6% of subscribers would be using these high quality broadband networks. For this to be consistent with the 25% assumption these high quality mobile broadband subscribers would need to have associated ARPUs of over five times the average mobile ARPU.85
84 This is clear when Ofcom states at §A9.11 that “the working hypothesis is that only operators with 900MHz spectrum could compete in providing high quality mobile broadband services in the interim period” 85 If 25% of revenues are derived from 4.6% of the subscribers then the ARPU of these subscribers must be 5.4 times higher than average (25%/4.6%).
60 of 80

NON-CONFIDENTIAL
Figure 8. Ofcom’s assumed migration profile to UMTS 900MHz services (or equivalent) – base case
0%
20%
40%
60%
80%
100%
2011 2012 2013 2014 2015 2016 2017 2018 2019 2020
Prop
ortio
n of
sub
scrib
ers
on U
MTS
900
MH
z ne
twor
ks o
r equ
ival
ent
Source: Ofcom, cost of delay model
222. O2 considers that, at the very least, Ofcom should have used a consistent assumption set, ie the estimate of the relevant market revenues should be linked to the take-up of compatible devices. This would mean tempering Ofcom’s market size assumption with migration profile to UMTS 900MHz services (or equivalent). This would be a consistent approach, and is certainly preferable to a simple and unsubstantiated top-down assumption that these revenues are 25% of total mobile revenues in every year.
223. Furthermore, as we highlight in Section VI, usage growth is another key assumption that determines whether there are (in fact) any potential cost differences. Similarly, therefore, O2 is strongly of the view that the welfare model should adopt consistent assumptions with the various scenarios modelled in the CBA. To that end in Annex A in Table 38 and Table 39 we derive a consistent set of subscriber growth forecasts from our usage forecasts and which we use consistency with the results of this welfare analysis.
224. Using Ofcom’s Cournot-based competition impact model with the base case migration profile and assuming that UMTS 900MHz subscribers (or equivalent) have an ARPU 30% greater than the average mobile subscriber’s ARPU we find that Ofcom’s model produces welfare numbers as shown in Table 22 below86.
86 30% is likely to be an overestimate. Ofcom’s competition impact model has an average ARPU per mobile subscriber in 2013 of £21.4 per month. O2 considers that the ARPU from UMTS900MHz smart phones is likely to be around £30 per month and the ARPU from UMTS900MHz mobile broadband may be around £16 per month. If there approximately 60% of UMTS900 users are smartphones (see Error! Reference source not found. and Error!
61 of 80

NON-CONFIDENTIAL
225. Ofcom is, of course, free to postulate higher ARPU per user in order to determine the welfare gain. However, the higher the assumed uplift above the average, the smaller the physical market and the more Ofcom exposes itself to a distributional problem. Ofcom’s proposals would be based on the revenues of a few high value customers, but the impact would be felt by all citizens and competitive constraints in today’s market would disproportionately affect less well off customers.
Table 22. Results of Ofcom's competition impact model under different revenue assumptions
Consultation Welfare Model
High quality mobile broadband is 25% of
sector revenues
Correcting for consistent take-up assumption
High quality mobile broadband revenues are related to
migration profile
Alignment with O2 capacity scenarios
High quality mobile broadband revenues are related smartphone user growth in O2’s forecasts
Alignment with O2 coverage scenarios
High quality mobile broadband revenues are related smartphone user growth in O2’s forecasts
Increase in number of players from 2 to 5
£750m £350m £400m £320m
Increase in number of players from 2 to 3
£425m £200m £230m £190m
Increase in number of players from 2 to 4
£630m £290m £340m £270m
Increase in number of players from 4 to 5
£110m £50m £60m £50m
Source: Ofcom competition impact model and O2 calculations
Partial matching
226. Mobile operators which currently are not in possession of 900MHz spectrum can compete for customers within the high quality mobile segment by upgrading their networks, through additional sites, to be able to provide services comparable to UMTS 900MHz operators. Where partial matching occurs, this would lead to competition between all market players, even without mandated spectrum release. Thus, it would be only suitable to consider a scenario where not all operators are able to provide high quality mobile broadband services in Ofcom’s Cournot oligopoly model in areas where partial matching is not a viable strategy, for example rural areas. Therefore, any potential gains from increased competition would
Reference source not found. below) then the average UMTS900 ARPU would be less than 15% greater than the overall average mobile subscriber ARPU.
62 of 80

NON-CONFIDENTIAL
only be a potential factor where not all 2.1GHz operators are able to match the services of 900MHz operators.
227. Furthermore, in practice it is likely that 900MHz operators will not differentiate mobile broadband prices between customers who use UMTS 900MHz mobile broadband in areas where there is no matching and those in areas where there is matching. In this case the constraint on pricing from areas where there is matching would most likely apply to non-matching areas. Therefore, making 900MHz spectrum available to additional operators may have a much more limited effect on the pricing constraint than a simple application of Ofcom’s model to the non-matching areas would have.
228. Section VI show that, in practice, complete matching is eminently possible in urban areas and that, in capacity scenarios, building UMTS2100 is the economically rational option for the UMTS900/2100 operator. However, there remains some question as to whether the 2.1GHz operators would match in the remotest rural areas. O2 accepts that there could be differentiated payback periods on those investments given the low subscriber density and the larger potential market captured by UMTS900 cells cf. UMTS2100 cells (absent capacity constraints).
229. Taking into account this potential rural partial matching, but ignoring the constraint of uniform geographic pricing87, we can calculate the potential benefits from mandated release. If 2.1GHz operators are not able to match the networks of UMTS 900MHz operators in rural areas, and assuming that a generous 25% of mobile broadband revenues depend on being able to service these areas88, O2’s calculations would imply an upper bound on the gains from competition as per the table below.
87 In practice Ofcom could not simply ignore this effect, but we have not modelled it here. 88 Where 20% of the population live.
63 of 80

NON-CONFIDENTIAL
Table 23. Results of Ofcom's competition impact model including alternative revenue assumptions and partial matching
Consultation Welfare Model
High quality mobile broadband is 25% of
sector revenues
Correcting for consistent take-up assumption
High quality mobile broadband revenues are related to
migration profile
Alignment with O2 capacity scenarios
High quality mobile broadband revenues are related smartphone user growth in O2’s forecasts
Alignment with O2 coverage scenarios
High quality mobile broadband revenues are related smartphone user growth in O2’s forecasts
Increase in number of players from 2 to 5
£190m £90m £100m £80m
Increase in number of players from 2 to 3
£110m £50m £60m £50m
Increase in number of players from 2 to 4
£160m £70m £85m £70m
Increase in number of players from 4 to 5
£30m £15m £60m £10m
Source: Ofcom competition impact model and O2 calculations
Additional constraints on the pricing of mobile broadband
230. Ofcom’s Cournot methodology simply assumes that the only competition constraint on UMTS 900MHz operators will come from other UMTS 900MHz operators and from 2.1GHz operators that upgrade their networks to provide similar services. However, this does not appropriately consider the potential uses of high quality broadband products and the competitive constraints that substitute products will place upon mobile operators when they price mobile broadband. If these constraints were taken into account by Ofcom they would imply that the gains from mandating the release of 900MHz spectrum would be even lower. The welfare implications of any mandated spectrum release needs to consider the following factors.
i. Use of the Cournot model implies that there will be a completely separate market for high quality mobile broadband and there is no constraint from the mobile broadband products provided by mobile operators that do not have access to 800/900MHz spectrum. This is unrealistic and does not recognise the differentiated nature of broadband products. In reality lower quality mobile broadband products would provide a constraint to the pricing of high quality products. Simply ignoring this constraint, as
64 of 80

NON-CONFIDENTIAL
Ofcom has done, necessarily overestimates the effect of having more providers of higher quality mobile broadband.
ii. In the high speed segment, consumers may not all require the mobility characteristic of such services. For subscribers who do not require mobility, limited-mobility products, such as WiFi, and fixed broadband products need to be considered as substitutes. Therefore there are many fixed as well as mobile operators that are able to serve such subscribers. Thus, an important pricing constraint on high quality mobile service providers would come from the pricing of fixed operators. Ofcom estimates for fixed and mobile broadband prices emphasise that this may be an important effect. According to Ofcom the average price for fixed-line broadband services in the UK was around £15 per month at July 2008.89 This compares to an average price for mobile broadband services of around £16 per month.90
Summary
231. O2 accepts that, in principle competition would be expected to increase with the number of firms in a market. However, O2 rejects Ofcom’s use of a Cournot model to estimate the welfare impact of changes in the number of operators that can provide high quality mobile broadband services. Ofcom’s justification for using a Cournot model is not robust. The mobile market does not appear to fulfil many of the basic criteria that are necessary to appropriately use a Cournot model including the form of competition, homogeneity of products and being able to treat competition in each time period separately. This is important because by using a Cournot model, Ofcom effectively assumes significant increases in welfare as the number of competing firms in a market increases.
232. The potential market segment affected by the mandated spectrum release should have, at the very least, have been consistent with Ofcom’s take up projections for high quality mobile broadband from the cost of delay model. Based upon these projections we find that benefit from greater availability of 900MHz spectrum is significantly lower than Ofcom’s competition impact model.
233. In O2’s view, the projections should also be consistent with the usage/user forecasts, in light of their impact on the “cost advantage” calculation.
234. Furthermore, taking partial matching into account the competition benefits may be near zero if, due to uniform geographic pricing, the prices of the UMTS 900MHz operators in the non-matched areas are constrained by the pricing in the matched areas. Even if there is no
89 Ofcom (2008), ‘The International Communications Market 2008’ (page 72). Based on the broadband component of Ofcom’s Consumer Basket 2 (This basket assumes a fixed broadband connection of 1Mbit/s minimum speed, 0.5 GB minimum data usage and 10 hrs of minimum time usage). 90 Ofcom (2008), ‘The International Communications Market 2008’ (page 75). Based on the broadband component of Ofcom’s Consumer Basket 3 (This basket assumes a mobile broadband connection of 1Mbit/s minimum speed, 3 GB minimum data usage and 15 hrs of minimum time usage).
65 of 80

NON-CONFIDENTIAL
uniform geographic pricing constraint then, due to partial matching, we find that the welfare benefits from spectrum release are an order of magnitude lower than Ofcom.
235. This analysis does not consider additional constraints on the pricing of high quality mobile broadband services from lower quality mobile broadband products or from fixed broadband products. If these constraints were taken into account they would imply that the gains from mandating the release of 900MHz spectrum would be even lower.
236. Finally, we note at §80 the need for Ofcom to take consistent decisions with regard to chains of substitution and we look forward to that analysis in due course.
66 of 80

NON-CONFIDENTIAL
X. COST – BENEFIT ANALYSIS
237. O2 welcomes Ofcom’s attempt to undertake more rigorous cost benefit analysis when compared to its proposals, than in 2007. To that end, at Annex 7 we are provided with a 158 page CBA – possibly a record for any Ofcom consultation.
238. However, whereas much of the rest of the consultation is more transparent than that conducted in 2007, the reverse is true of the CBA. There is a level of complexity introduced by the desire to address the impact of sensitivities that leads to a resultant opacity in the outputs of the CBA. In our view, whilst this complexity may be added with the best of intentions it detracts from the transparency of the exercise. Furthermore, as Ofcom itself identifies at §A7.89, the rollout assumptions and cost figures in the CBA are not produced in the other Annexes of the consultation. It is difficult therefore to understand what one has to believe to be true for Ofcom’s figures to be reproduced.
239. We believe that there is substantial scope to simplify the cost benefit analysis by considering which assumptions are mutually exclusive and which sets of assumptions are mutually re-inforcing.
240. Furthermore, O2 is mindful of the Competition Commission’s recently stated view on the role of scenario modelling in regulatory decisions91:
91 http://www.competition-commission.org.uk/appeals/communications_act/mobile_phones_determination.pdf. We note that the CC stresses in footnote 3 of its determination that “we do not intend these paragraphs to specify the approach that should be adopted to uncertainty and modelling in all circumstances.” However, it is O2’s view that this approach is entirely appropriate for the issues at hand in this consultation.
67 of 80

NON-CONFIDENTIAL
A simpler approach – consistent with best practice
241. O2’s analysis of cost differences in Section VI and VII shows that there is limited variability in outcome because the overall site counts used are so much lower than those incorrectly deduced by Ofcom. By removing the cell edge speed error in the analysis for urban areas, O2 removes all the non-matching and partial matching cases in urban areas which drive much of the complexity in Ofcom’s approach.
242. With regard to the cost of clearance, we have identified only one methodology that is workable – Approach 3 without SFH. Reliance by Ofcom on Approach 1 would require it to specifically identify how it would address the distortions of competition caused by increased handset subsidy and restraint on trade in SIM-only propositions. We have identified variablity driven by the 2G traffic assumption and we include that in our analysis.
243. With regard to welfare we have included an upper bound on the potential (but by no means certain) welfare benefit from partial matching in rural areas.
244. O2 has used consistent assumptions to determine the benefits side of its CBA. The costs side is consistent with the impact on O2, based on O2’s forecast future traffic and O2’s preferred approach to refarming.
245. We note the comments of the Competition Commission, and following their approach, we provide six demand scenarios and four release scenarios. However, in order to avoid over complexity, or assigning hypothetical weightings to each scenario, we adopt a two stage approach to determining the range of net benefits from intervention:
i. Firstly we only address scenarios which result in a positive net benefit. All other scenarios would not warrant the level of intervention proposed; and
ii. Secondly, given the limited number of scenarios – we ask some simple questions:
a. What do you need to believe to be true for this scenario to come to pass?
b. Is that likely?
c. Would the assumptions underlying this scenario be logically consistent with the purported justification put forward by Ofcom for ex ante intervention to redistribute 900MHz spectrum?
246. We can then draw the appropriate conclusions with regard to the proportionality of the proposed intervention, based on the answers to these very rational questions.
68 of 80

NON-CONFIDENTIAL
Cost-benefit analysis for possible scenarios
247. The following tables summarises the costs and benefits that we examine and their sources.
Table 24 : Data sources for O2’s CBA
Input Source
Cost advantage Table 11 : Cost advantage of UMTS900 rollout in O2’s six
scenarios
Welfare gain Table 23. Results of Ofcom's competition impact model including
alternative revenue assumptions and partial matching
Cost of release Table 20 : Revised cost of release based on O2’s NDF and
chosen approach to clearance
Incremental cost of LTE900 in 201592 Table 21 : Incremental cost of LTE900 deployment in 2015
248. Firstly, we can ignore all of the “high capacity scenarios” in Table 11 that result in a negative cost advantages. We also note that the low capping capacity scenarios in Table 11 have smaller cost advantages than the coverage limited scenarios so we focus on the latter (even though we consider that these scenarios are logically inconsistent with Ofcom’s rationale for intervention).
249. On the cost of clearance side of the equation, we ignore scenarios with a release of greater than 2x5MHz per operator, because this would not leave sufficient spectrum for either O2 or Vodafone to run a GSM network in 2010, according to Ofcom. This reduces the “benefits” side of the equation to the outputs shown below.
92 We have only evaluated this for a 1 block release. As after a 2 block release O2 and Vodafone would be left with just 12.4MHz from which to run both LTE900 (10MHz carrier) and GSM – with just 2.4MHz of spectrum.
69 of 80

NON-CONFIDENTIAL
Table 25 : Range of benefits cases
Urban scenario Low capping, economic crisis
has no affect on operator build
plans
Low capping, economic crisis
affects operator build plans
significantly
Coverage limited
scenario, no build in
09/10
Urban cost advantage £10m £151m £290
PLUS one of either
Rural scenario Slow rollout Fast rollout
Rural roll costs that are
avoided by spectrum
release
£12m £37m
OR
Increase in competition 2-3 (1 Block release) 2-5 (2 block release)
Welfare gain £50m £80m
250. The rural cost savings and the welfare gains are mutually exclusive. We focus on the maximum possible benefit, which at the very most the benefits calculation yields just £340m. For this to be true:
i. We would expect to see much smaller inclusive data bundles for consumers going forwards in order for the network to remain coverage limited to 2015. This is against the direction of travel of the market at present; and
ii. The economic crisis has a significant adverse effect on operators, but the 900MHz operators can remain competitive between 2008 and 2011 with MBNL, notwithstanding its existing claims of better quality coverage than its rivals;93 and
iii. Rural rollout does not happen at 2100MHz, there is no chain of substitution, there is no geographic price constraint from urban areas and 900MHz operators rollout in these areas.
251. We must now see if there are any cases where the costs of intervention are lower than the benefits – it is only then that we need to ask ourselves the searching questions regarding the validity of these scenarios.
93 If Ofcom were to rely on such an assumption, the basis for intervention would (therefore) be irrational. Network quality would not be a significant competitive differentiator.
70 of 80

NON-CONFIDENTIAL
Table 26 : Range of cost cases
Scenario 1 block release 2 block release
Cost of clearance £690m £1,645m
Cost of clearance (with full
network sharing benefits)
£500m £1,195m
Incremental cost of LTE900
in 2015
£225-1,710m LTE900 unlikely to be deployable.
TOTAL £915-2,400m £1,645m, but O2 / VF would not be able
to deploy LTE900 on a 10MHz carrier
TOTAL (full network
sharing benefits)
£725-2,210m £1,195m, but O2 / VF would not be able
to deploy LTE900 on a 10MHz carrier
Conclusions
252. In no case do the benefits of intervention to release spectrum outweigh the costs. In fact, the costs are between two and six times the benefits, depending on assumptions.
253. There is no case for intervention.
71 of 80

NON-CONFIDENTIAL
XI. ENDURING BENEFITS FOR UK 1800MHZ OPERATORS
It’s all about capacity
254. Our analysis in Section VI shows that very shortly spectrum capacity will be the binding constraint on mobile networks, driven by the success of mobile broadband. In these circumstances it is the operator with both the most spectral capacity and the lowest cost of accessing that capacity which has the real advantage. Whilst spectrum is being cleared for re-use it may be difficult or impossible to utilise. If an operator has more capacity to start with, not only is it able to carry more traffic, its transition costs will be lower.
255. The table below shows the number of 2x5MHz paired channels available to each operator, the number of customers each operator has and the consequent differential impact that clearing, 2x5MHz and 2x10MHz of any sort of spectrum (given that they are all capacity substitutes) would have on a proxy for congestion (million customers per MHz).
Table 27 : Capacity differences by operator
256. What we can see is that O2 is already the most efficient user of its spectrum by this measure. Orange, on the other hand has much lower transition costs and is well positioned to exploit its existing capacity advantage. T-Mobile is even better positioned with lower utilisation (its traffic per customer is much lower) than Orange and lower costs to deploy by virtue of its network sharing agreement with H3G.
72 of 80

NON-CONFIDENTIAL
Access to UMTS1800 is less disruptive and will be possible by 2010
257. The high level analysis above is borne out by Ofcom’s own data.
258. Ofcom’s analysis at §A16.294 shows that the cost of clearing 2x5MHz of 1800MHz spectrum is £15-20m, or just 10-25% of the equivalent costs at 900MHz. If we discount SFH as a mitigation technique and reverse the approximation used by Ofcom at §A16.131b3 we see that transition costs for UMTS1800 are a mere 5-10% of the equivalent costs for UMTS900.
259. As we show above UMTS1800MHz equipment will be available on an equivalent timetable to UMTS900 being useable (due to the increased delays caused by spectrum clearance). Effectively, Ofcom’s proposals disrupt the businesses of O2 and Vodafone and at the same time hand an unfettered capacity advantage to Orange and T-Mobile. It is clear why those parties would be keen for Ofcom to follow through with its interventionist proposals under those circumstances.
Access to 2x20MHz contiguous gives a speed advantage for LTE
260. At §§6.26-6.37 Ofcom discusses the possible competitive advantages that may accrue to Orange and T-Mobile through access to 2x20MHz for LTE at 1800MHz. In this context Ofcom notes that:
i. Other operators may be able to acquire 2x20MHz of contiguous spectrum in the 2.6GHz band, and 2.6GHz is likely to be available earlier than 1800MHz for LTE (2x20MHz). We discuss this in the sub-section on hold-up risk below.
ii. LTE Advanced – a technology in its very earliest stages of development which may allow carrier aggregation across bands. Albeit the success of this technology is far from certain94; and
iii. It is uncertain whether customers will value speed to the degree that 2x20MHz LTE creates a competitive advantage. Obviously, it is also uncertain that customers will value the purported coverage advantage that Ofcom erroneously deduces for UMTS900. That does not appear to dampen Ofcom’s enthusiasm for intervention in the case of UMTS900. Ofcom needs to be consistent in its attitude to uncertainty.
Orange and T-Mobile can access LTE1800 more quickly than Ofcom suggests
261. We have tried to estimate the costs to Orange and T-Mobile of clearing 2x20MHz each of 1800MHz spectrum. We use Ofcom’s own figures, as we do not have access to the underlying information – in so doing we compare them with Ofcom’s figures for 900MHz clearance. Not as an endorsement of Ofcom’s figures but to show the comparative ease of
94 LTE advanced will also support wider carries up to 100MHz, so total volume of spectrum could become a differentiator, thereby handing a further potential advantage to the 1800MHz operators.
73 of 80

NON-CONFIDENTIAL
clearance cf. 900MHz. Also, we note that Ofcom’s figures are at a social discount rate. The commercial cost to Orange/T-Mobile will be lower at the commercial discount rate.
262. Annex 16 Table 4 (p.5) shows that a clearance of six blocks (2x30MHz) by both operators would cost between £100m-£160m, ie £50-80m each. At Annex 16 Table 6 the full clearance (ie 2x60MHz) is calculated at between £2,200m and £3,550m. We have asked Ofcom to compute for us a clearance cost of 2x40MHz but it is unable to do so, which is surprising as we would have hoped that Ofcom would have looked at the barriers to LTE1800 access and consequently likely risk of strategic behaviour by these operators.
263. Interpolating between Ofcom’s figures above produces a cost for 2x40MHz clearance of £400-650m per operator. Ofcom believes that a clearance of four blocks of 900MHz spectrum may cost up to £325m per operator.95 This would equate to refarming plus a 2x5MHz release per operator – something that Ofcom believes still merits consideration96. It is therefore just a small increment for T-Mobile and/or Orange to achieve a strategic advantage over their competitors. Ofcom must act consistently with regard to assumptions as to what is achievable and what isn’t. Furthermore, it is likely that T-Mobile’s 2G network is much more lightly loaded than Orange’s due to the lower usage per user it experiences. Therefore, T-Mobile in particular has strategic avenues open to it. Ofcom needs to do more analysis as to the true extent of this risk, before it can reach a sufficiently well reasoned decision.
Ofcom must act consistently when liberalising 1800MHz
264. Ofcom is clearly mistaken as to the remoteness of this competitive distortion and the consequent uncertainty. At §6.35 Ofcom raises the prospect of reviewing ex post, the impact of competitive distortions caused by unfettered access to LTE1800 for T-Mobile and Orange and if required recovering that spectrum from Orange and T-Mobile. O2 has two observations:
i. If this is the case, why isn’t Ofcom content to rely on ex post with regard to 900MHz? The two positions are analogous and Ofcom’s ex ante approach to 900MHz relies on assertion and erroneous fact rather than independent expert evidence. It will surely fail on the merits.
ii. The current scheme for amendment to the GSM Directive requires that the European Parliament implements a further amending Directive to allow LTE at 1800MHz. It is likely that those operators without access to 2x20MHz at 1800MHz will lobby for an analogous examination of competitive distortions arising from liberalisation as per Article 1(2)2. Ofcom will have to do this work in the future, it would be more efficient and less discriminatory to do it now.
95 Approach 2 – Annex 6 Table 32. 96 §5.87
74 of 80
NON-CONFIDENTIAL
Ofcom must act consistently to address the hold-up risk at 2600MHz
265. We show above that Orange and T-Mobile, can use their existing 1800MHz holdings for LTE within a relatively short timeframe and at an acceptable cost (in Ofcom’s view). The threat of ex post action (see above) means that they have additional incentives to bid up the price of spectrum at the 2600MHz auction. This is because:
i. If they do acquire 2600MHz spectrum they will have denied access to 2x20MHz contiguous to one or more of their competitors; or
ii. If they are eventually unsuccessful in acquiring that spectrum, they will have succeeded in increasing the costs of their competitors [ .] This behaviour is known as hold-up.
266. Oddly, Ofcom has recognised such a risk in relation to their Decision not to hold a Split Auction for the 2600MHz, where the risk of strategic behaviour is said to arise. Ofcom also attaches importance to this risk in its consultation on the spectrum expected to be available from the digital dividend (800MHz). In that document97 Ofcom has expressed concerns that O2 and Vodafone, as holders of 900MHz spectrum, might bid to exclude their competitors from the digital dividend spectrum (see §§9.66, 9.70, 9.78 – 9.80 and 9.83-9.86 of that consultation).
267. As we understand things, Ofcom’s proposal would require O2 and/or Vodafone to relinquish an equivalent volume of spectrum at 900MHz should they pick up spectrum at the 800MHz auction. If O2 were to acquire 2x10MHz for LTE800 it would expose itself (according to Table 20 above) to a consequent cost of £700m to clear 2x10MHz of 900MHz. [ .]
268. In contrast, if Orange and T-Mobile each pick up 2x20MHz at 2600MHz they would then be faced with the prospect of only a possible ex post intervention at some point in the future if competition problems emerged.
269. O2 is strongly of the view that it is efficient and prudent for Ofcom to address the 1800MHz question now, rather than leave it festering for a couple more years; Ofcom is required under s3(3)a of the 2003 Act to resolve this issue in a consistent manner to that adopted for 900MHz and so a coterminous decision is desirable in order not to distort bidding behaviour at the 2600MHz auction. Such a decision may also lead to a more rapid conclusion of the 2600MHz award than the position currently adopted by Ofcom.
97 Digital Dividend Review: 550-630MHz and 790-854MHz: Consultation on detailed award design - 6 June 2008
75 of 80

NON-CONFIDENTIAL
XII. PROCEDURAL AND LEGAL FAILURE
270. [ .]
271. [ .]
272. [ .]
273. [ .]
274. [ .]
275. [ .]
276. [ .]
277. [ .]
278. [ .]
279. [ .]
280. [ .]
281. [ .]
282. [ .]
283. [ .]
76 of 80

NON-CONFIDENTIAL
XIII. CONCLUSIONS AND REMEDIES
Differences of opinion amongst various “regulators” increase uncertainty
284. The Minister of State has publicly stated that the MNOs had until the end of April 2009 to determine an agreed way forward. His view, as expressed in the Interim Digital Britain Report, was that a structured set of spectrum trades should be agreed.
285. In contrast, Ofcom’s view as stated in this consultation is that O2 and Vodafone should release, without compensation, 2x2.5MHz each for re-auction to other players in the market.
286. Finally, this response demonstrates that even after the forthcoming amendment to the GSM Directive which will require Ofcom to liberalise the 900MHz licences in the hands of the incumbents by the end of 2009, there is no evidence based case for any ex ante intervention.
287. In light of this difference of opinion between the affected party, the specialist sector regulator and the Secretary of State with his powers of direction over the specialist sector regulator, it is by no means clear that the final 900MHz and 1800MHz holdings will be as we see today. Further, O2 provides evidence in this response that suggests that Ofcom needs reconsider its position with regard to the holdings of Orange and T-Mobile.
Auctions cannot proceed with this uncertainty
288. These three contrasting positions create a significant amount of uncertainty for all mobile spectrum licensees in their assessment of options in approaching bidding in the forthcoming auctions for 2600MHz and 800MHz.
289. Furthermore, Ofcom’s proposals regarding the 800MHz auction require that it has reached a final decision on 900MHz, such that any proposed capping mechanism can be implemented.
290. In this response we have argued forcefully that the following positions are analogous and need to be treated consistently, if Ofcom is going to act in a lawful manner:
i. The possibility for 900MHz licensees to bid strategically (hold-up) in the 800MHz auction; and
ii. The possibility for 1800MHz licensees to act in an equivalent manner in the 2600MHz auction.
291. With regard to (i) above, Ofcom has proposed an ex ante rule [ .].
292. With regard to (ii), Ofcom proposes an ex post assessment at some indeterminate time in the future, should a competitive distortion emerge. This inconsistency is not acceptable.
77 of 80

NON-CONFIDENTIAL
Certain costs of intervention dominate over speculative and poorly evidenced benefits
293. O2’s cost benefit analysis shows that the costs of any intervention to release 900MHz spectrum will be between two to six times the potential benefits accrued to society.
Ofcom is certain to breach its duty towards the citizen
294. Notwithstanding the complete lack of evidential basis for intervention, release of spectrum as proposed in the consultation would require 2,400 new masts to be built with certainty, starting in 2010. This would be detrimental to the interests of citizens and would place Ofcom in a clear breach of a primary duty.
Ofcom proposes to intervene to the benefit of the few at the expense of the many
295. Ofcom’s own analysis is predicated on increasing the welfare of high value (better off) customers. Ofcom accepts that many thousands of masts will need to be built in urban areas, in order to provide wider availability of 900MHz spectrum to provide UMTS coverage in rural areas. All of this to the detriment of all citizens in urban areas.
296. Ofcom’s proposals would distort the retail market today and reduce the availability of low cost SIM-only propositions, which Ofcom itself points to as a good way for consumers to beat the impact of the recession98.
297. In our experience this is not a typical proposition for a regulator charged with protecting the interests of all citizens and consumers. Ofcom should have the interests of those least advantaged in society at the centre of its consideration, rather than view negative impacts on these consumers and citizens as collateral damage in pursuit of an unsubstantiated benefit for the few. We believe that the Communications Consumer Panel should challenge Ofcom’s position with regard to such inequality.
A more proportionate approach
298. As each licence and band is liberalised, Ofcom conducts an ex ante assessment of the competitive impact of this liberalisation. In this case however, it is not the liberalisation process itself that raises concerns in Ofcom’s mind, rather the concentration of holdings amongst two players, in the presence of benefits that would accrue to just those two players for a limited period.
299. Above we have addressed the issue of the quantum of these benefits and their speculative nature. However, O2 recognises that outside of urban areas there will be, for a short time, a possible advantage to 900MHz players – but only to the extent that O2 and/or Vodafone build out in those areas.
98 http://www.ofcom.org.uk/media/features/recmobile
78 of 80

NON-CONFIDENTIAL
300. Forced release of congested spectrum in urban areas to facilitate economically questionable rollout in rural areas would appear to have many legal, economic, political and distributional problems, not least a potentially contentious mast building programme.
301. By contrast, we expect that it would be in the commercial interests of O2 and Vodafone to increase the volume of traffic contributing to the payback of any rural deployment. Expanding network access to as many MNOs as possible is likely to make commercial sense.
302. The real issue for Ofcom to deal with, therefore, is a time limited question which may never in fact arise. Uncertainty is very difficult for Ofcom to deal with, as its repeated consultations on this issue have demonstrated.
303. When previously determining its policy on spectrum trading and the creation of concentrated holdings Ofcom has stated99:
304. We agree with this sentiment. It is impossible for Ofcom to predict future market development, unless we are reverting to a truly command economy. O2 is strongly of the view that the Competition Act and the Enterprise Act provide Ofcom with sufficient powers to provide adequate comfort to the industry that competition problems will not arise.
305. [ .].
99 http://www.ofcom.org.uk/consult/condocs/sec/ §3.19-3.20
79 of 80

NON-CONFIDENTIAL
ANNEX A DETAILED COST DIFFERENCE ANALYSIS ANNEX B DETAILED COST OF CLEARANCE ANALYSIS ANNEX C IMPACT OF THE ECONOMIC CRISIS ON THE SECTOR
80 of 80