Embed Size (px)
Citation preview
Розділ 2 Інноваційні процеси в економіці
Механізм регулювання економіки, 2009, № 2 91
УДК 339 Kala Seetharam Sridhar, Varadharajan Sridhar1
Telecommunications infrastructure and economic growth: evidence from developing countries
In this study, we investigate empirically the relationship between telephone penetration and
economic growth, using data for developing countries. Using 3SLS, we estimate a system of equations that endogenizes economic growth and telecom penetration. We find that the traditional economic factors explain demand for mainline and mobile phones, even in developing countries. We find positive impacts of mobile and landline phones on national output, when we control for the effects of capital and labor. We discuss the associated policy implications related to improvement of telecom penetration in developing countries.
Keywords: telecommunication, economic growth, reverse causality, developing countries, telephones.
Introduction Convergence between Information and Communications Technologies (ICT), in particular
the Internet, and its related applications, has enabled low-cost diffusion of information technology products and many telecommunication services in developing economies. While the telecommunications sector continues to be deregulated world-wide, the co-existence of stark poverty and islands of technology innovation in many developing countries has received little attention in the literature. This paradox provides the motivation for our research regarding the more specific relationship between telecommunications and the state of economic growth in developing countries.
The literature on general ICT infrastructure and its impact on growth are steadily growing. A number of researchers have hypothesized that ICT (including telecommunication) infrastructure lowers both the fixed costs of acquiring information and the variable costs of participating in markets (Norton, 1992). They point out that as the ICT infrastructure improves, transaction costs reduce, and output increases for firms in various sectors of the economy (Röller & Waverman, 2001). Thus investment in ICT including telecommunications infrastructure and their derived services provide significant benefits to the economy. In the recently concluded First World Summit on Information
Kala Seetharam Sridhar, corresponding author, Fellow- National Institute of Public Finance and Policy, New
Delhi, India; Varadharajan Sridhar, Professor, Information Management, Management Development Institute, Sukhrali, Gurgaon, India.
© Kala Seetharam Sridhar, Varadharajan Sridhar, 2009 Acknowledgements: Thanks are due to M. Govinda Rao for facilitating preliminary review of the paper. We are
thankful to Nirvikar Singh at the University of California-Santa Cruz, for helpful comments. The authors wish to thank the faculty at Management Development Institute for their useful comments during a seminar where this paper was presented. We thank the Indian Institute of Management, Lucknow, India, for facilitating access to the WDI Online database. The authors thank participants of the United Nations University-World Institute for Development Economics Research (WIDER)’s Jubilee Conference in Helsinki, Finland, where a revised paper was presented, for comments. Finally, we thank the National Institute of Public Finance and Policy, and Management Development Institute, for facilitating the research. Any errors remain our responsibility.
brought to you by COREView metadata, citation and similar papers at core.ac.uk
provided by Electronic Sumy State University Institutional Repository
Kala Seetharam Sridhar, Varadharajan Sridhar. Telecommunications infrastructure and economic growth: evidence from developing countries
Механізм регулювання економіки, 2009, № 2 92
Society, Professor Klaus Schwab, Founder and Executive Chairman of the World Economic Forum pointed out that ICT continues to be the best hope for developing countries to accelerate their development process.
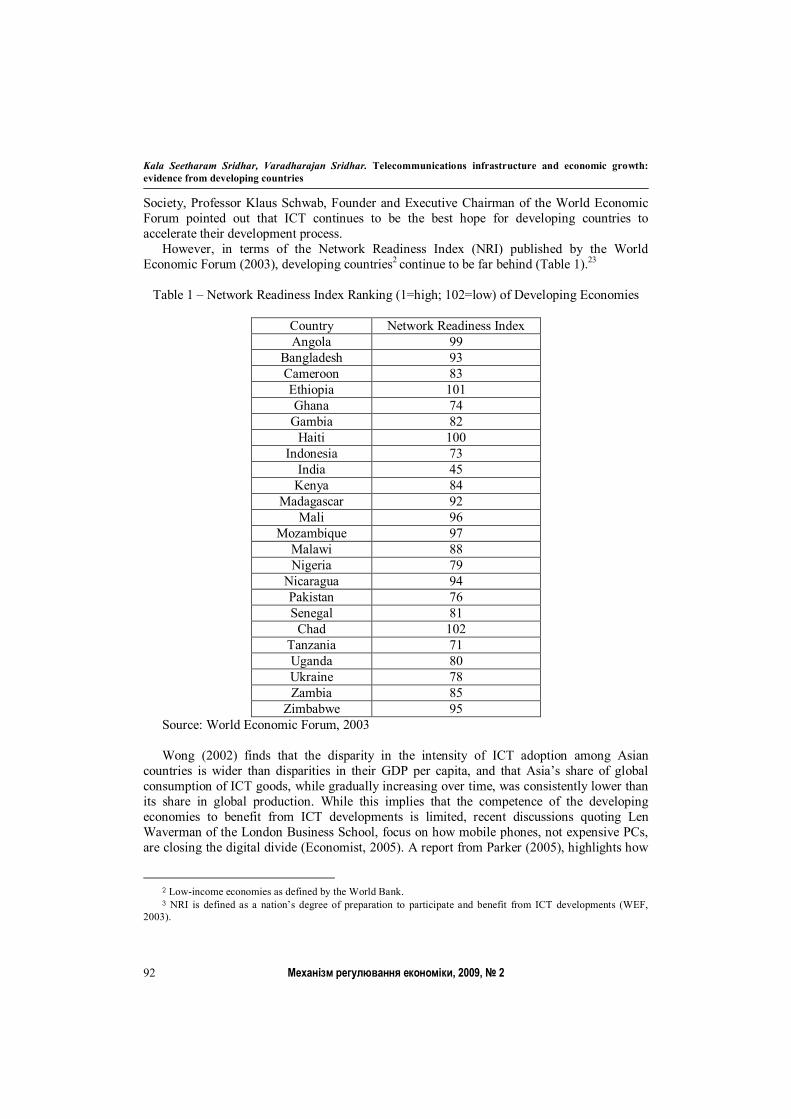
However, in terms of the Network Readiness Index (NRI) published by the World Economic Forum (2003), developing countries2 continue to be far behind (Table 1).23
Table 1 – Network Readiness Index Ranking (1=high; 102=low) of Developing Economies
Country Network Readiness Index Angola 99
Bangladesh 93 Cameroon 83 Ethiopia 101 Ghana 74
Gambia 82 Haiti 100
Indonesia 73 India 45
Kenya 84 Madagascar 92
Mali 96 Mozambique 97
Malawi 88 Nigeria 79
Nicaragua 94 Pakistan 76 Senegal 81
Chad 102 Tanzania 71 Uganda 80 Ukraine 78 Zambia 85
Zimbabwe 95 Source: World Economic Forum, 2003 Wong (2002) finds that the disparity in the intensity of ICT adoption among Asian
countries is wider than disparities in their GDP per capita, and that Asia’s share of global consumption of ICT goods, while gradually increasing over time, was consistently lower than its share in global production. While this implies that the competence of the developing economies to benefit from ICT developments is limited, recent discussions quoting Len Waverman of the London Business School, focus on how mobile phones, not expensive PCs, are closing the digital divide (Economist, 2005). A report from Parker (2005), highlights how
2 Low-income economies as defined by the World Bank. 3 NRI is defined as a nation’s degree of preparation to participate and benefit from ICT developments (WEF,
2003).
Розділ 2 Інноваційні процеси в економіці
Механізм регулювання економіки, 2009, № 2 93
the expansion of wireless telecommunications in sub-Saharan Africa is bridging the technological divide between them and the industrialized world. This report finds that in 2004, in sub-Saharan Africa, there were more new mobile phone subscribers than in the whole of North America.
According to the World Bank, the private sector invested $230 billion in telecommunications infrastructure in the developing world between 1993 and 2003, and that countries with well-regulated competitive markets have seen the greatest extent of investment. Given these findings, it is important to study the relationship between telecommunications and economic growth, if developing countries have to benefit from recent developments in this emerging area to further their economic growth.
While the literature spanning ICT and its effects on growth is now considerably large, this paper specifically focuses on one aspect of ICT – telecommunications and its relationship to growth. World-wide, the telecom sector has been deregulated, and market structures in this sector have become highly competitive. Because of this, prices of telecom services have decreased everywhere throughout the developing world, creating something close to a revolution in growth of telecommunication services. Simultaneously, telecom technology has also leapfrogged into second and higher generation cellular mobile systems. But developing countries still continue to be quite poor, and the digital divide is much larger than the income divide between the developed and developing world, as pointed out by Wong (2002). The intriguing question that has cropped up is how technology can be used to decrease the cost of access of providing telecom services in rural and remote parts of the developing world. If yes, how can the provision of telecom services affect growth more generally. There are empirical investigations (refer to Röller & Waverman, 2001), that specifically look at how telecommunications infrastructure affects economic growth in the developed OECD economies, taking into account the two-way causation between them. Waverman, Meschi and Fuss (2005), find that mobile telephony has a positive and significant impact on economic growth, which is twice as large in developing countries when compared to that in developed countries. However, all relationships have not been studied in the context of developing economies.
The objective of this research is to analyze the effect of penetration of different types of telecom services (landlines and mobile) on the economic growth of developing economies, taking into account the two-way causation that exists between them. Economic growth parameters (GDP) are estimated as a function of telecommunications infrastructure such as main line or mobile phone tele-density. Based on the research, the contribution of various kinds of telecom services (landline and mobile, analyzed separately and together) towards economic growth can be used as benchmark to gain insights into developing policies for diffusing telecommunications infrastructure much more extensively in developing countries. The paper addresses these questions to understand the dynamics of this causal connection i.e. is it telecommunication services that accelerates economic growth or overall economic growth that creates the demand for more telecommunication services for their growth to occur? In the context of developing economies, what are the factors that determine demand for and supply of telecom services? Finally, given the importance of telecom infrastructure in growth, what determines the change in telecom penetration in these economies? The following section summarizes the literature on the subject. The section following the literature survey describes the methodology adopted. Then we describe the sample, data and the sources. Following description of the data, we report results from the estimations. The final section summarizes the policy implications, then discusses data limitations and concludes.
Kala Seetharam Sridhar, Varadharajan Sridhar. Telecommunications infrastructure and economic growth: evidence from developing countries
Механізм регулювання економіки, 2009, № 2 94
Review of Literature The literature on the subject investigates the feasibility of telecommunication as one of the
determinants of the economic growth. Most infrastructure investments including telecommunications can favorably influence the economy in several ways. First, it reduces the cost of production and increases revenues for reinvestment by firms. Productivity increases made possible with the use of telephones increase the productivity of all industries. There is some recent literature that shows that the Internet has changed the markets by allowing more efficient search. Similar to other infrastructure investments, investing in telecommunication will increase the demand for the goods and services used in their production and increase total national output. Such investments can increase employment through both direct and indirect effects (Alleman et. al. (2002)).When compared with other traditional infrastructure, however, there are grounds to expect that the effect of telecommunication services on growth will be somewhat more pronounced. Telecommunications is a little different because of the existence of network externalities, a phenomenon that increases the value of a service with increase in the number of users. Kim et al. (1997), demonstrates this phenomenon in their analysis of online service competition.
The impact of telecommunications on growth was first found by Andrew Hardy (Hardy, 1980) based on data from 45 countries, with the largest effect of telecommunication investment on GDP found in the least developed economies and the smallest effect, in the most-developed economies. Garbade and Silber (1978), find that the telegraph and Trans-Atlantic cable led to efficient markets everywhere by narrowing inter market price differentials. Interesting research by Bayes et al (1999), finds that half of all telephone calls involved economic purposes such as discussing employment opportunities, prices of the commodities, land transactions, remittances and other business items. Bayes et al. (1999) also noted that, the average prices of agricultural commodities were higher in villages with phones than in villages without phones. Leff (1984), argues that firms can have more physically dispersed activity with increased telecom services (for instance, encourage telecommuting of their employees) and enjoy economy of scale and scope.4 Using the Peterson Index, Cronin et al (1993b), finds a statistically significant causal relationship between productivity growth and the portion attributable to telecommunications. Eggleston et al (2002), show how basic telecommunication infrastructure can create a “digital provide” by making markets efficient through information dissemination to isolated local residents and improve the living standards of the world’s poor, which in turn accelerates growth. As the authors themselves point out, their analysis is based on references and examples, more careful analysis is needed in the context of developing countries.
The literature on telecom growth also attempts to entangle the reverse causality between economic growth and the demand for telecommunication services. Common sense suggests that increases in purchasing power (contributed by increased telecom services) also increase demand for such services. Chatterjee et al. (1998), point out that income patterns decide the disposable income levels i.e. purchasing power for telecommunication services, and in turn the growth of services. The reverse causality has also been investigated by Cronin et al. (1991) and Cronin et al. (1993a). Cronin et al (1991), employ the Granger, Sims and modified Sims tests to confirm the existence of feedback process in which economic activity and growth stimulate demands for telecommunication services. As the economy grows, more
4 Sridhar and Sridhar (2003), look at the impact of telecommunication infrastructure and the telecommuting it enables, on spatial dispersion of population, using data from the United States. They find that telecommuting contributes to centralization, not suburbanization, of American MSAs.
Розділ 2 Інноваційні процеси в економіці
Механізм регулювання економіки, 2009, № 2 95
telecommunication facilities are needed to conduct the increased business transactions. Cronin et al. (1993a) investigate this relationship at the state and sub-state levels of the United States. This study confirms at both the state and county levels, using data from the state of Pennsylvania, U.S., that telecommunication investment affects economic activity and that economic activity can affect telecommunications investment. Roller & Waverman (2001), were the first to use a simultaneous approach to incorporate both effects in the economic model in order to validate the hypothesis of reverse causality. They use data for OECD countries that are all high-income. Waverman, Meschi and Fuss (2005), study the impact of mobile telephony in developed and developing economies. They find that mobile telephony has a positive and significant impact on economic growth, which is twice as large in developing countries when compared to that in developed countries Contribution of the Study: While Waverman, Meschi and Fuss (2005) examine the impact of mobile telephony on economic growth in developing countries, in noting the contributions of this paper, we observe that in most of the developing countries, mobile services were started only a decade back. Subscriptions to landline services have now significantly reduced and landline services also are less likely to play a role in the future expansion of telecommunications in developing countries. However, there is a need to disintegrate the effects of landline and cellular phone penetration in the developing countries, and study their relative impacts on economic growth because the erstwhile landline infrastructure still serves a significant portion of households. Most of the landline service providers in developing countries have also now upgraded their networks to provide information intensive services (for instance, Internet connectivity).
In this study, we examine the relationship between different types of telephone infrastructure and economic growth in developing economies, as these countries can use ICT diffusion for spreading growth more rapidly. In developing countries rural teledensity is very low. One of the reasons is the high cost of providing telecommunication services in rural areas and low purchasing power of rural population. While in developed countries, 90 percent of the households can afford monthly expenditure of US$30 on telecommunication services, only 5-6 percent of the households can afford such expenditure in developing countries such as India (Jhunjhunwala (2000)). One way to improve rural teledensity is to reduce the cost of access loop for providing telecom services using wireless technologies (Jain and Sridhar (2003)). For an understanding of relevant issues in rural telecom in India, see Sridhar et al (2000).
Thus there are a number of issues that are relevant to be considered only in the context of a developing country. This provides the motivation for us to more comprehensively model the growth of various types of telephone services. We investigate the strength of their causal relationship with the level of economic growth in developing countries, and examine how to use these various types of telecom services as tools to enable growth in these countries. In this study, we also estimate the price and income elasticities of demand for telecom services for low-income economies defined by the World Bank.
We use panel data from these 63 economies to model this relationship. We use demographic and general economic data, for these economies for 1990-2001 from World Development Indicators (WDI) (2003), and telecom indicators for the same period for these economies from the International Telecommunications Union (ITU) Year book ITU (2003a). Below we discuss our approach, methodology, model and the data.
Approach, Data, Methodology and Model
We develop a structural model that traverses from the micro-level demand for and supply of telecom services to aggregate changes in telecom penetration and the macro production function in which GDP is determined by traditional inputs including capital (net of telecom),
Kala Seetharam Sridhar, Varadharajan Sridhar. Telecommunications infrastructure and economic growth: evidence from developing countries
Механізм регулювання економіки, 2009, № 2 96
and labor stock, along with telephones. We do not attempt to provide a general explanation of the determinants of national output. This means we have not included measures of government deficits or of trade openness that, the literature shows, affect national output. Rather, we use a macro production function approach that relatesinputs to output. We endogenize telecom investment. The causal model we develop demonstrates various relationships between telecom penetration and growth, factors that determine the demand for and supply of telecom services, and those that influence the change in telecom penetration.
We use systems methods to do all estimations. We estimate demand for and supply of telecom infrastructure, and endogenize telecom investment and the change in telephone penetration. We estimate these equations along with the macro economy production function, using data over 1990-2001 period for 63 developing countries. Further, we estimate the system of equations separately for main telephone lines, mobile phones and all telephone lines which includes both main lines and cellular services. Note that Roller and Waverman (2001), report estimation results for main telephone lines, and for OECD countries. Waverman, Meschi, and Fuss (2005), examine the impact of mobile telephony on developing countries. We view the contribution of the model in this paper as being two-fold. First, in modeling these relationships, we disaggregate the effect of landlines and mobile phones separately for developing countries, identify variables that are of relevance, and operationalize them in the context of developing economies. Next, we highlight the use of different variables than what Roller and Waverman (2001), use in their paper, based on certain considerations.
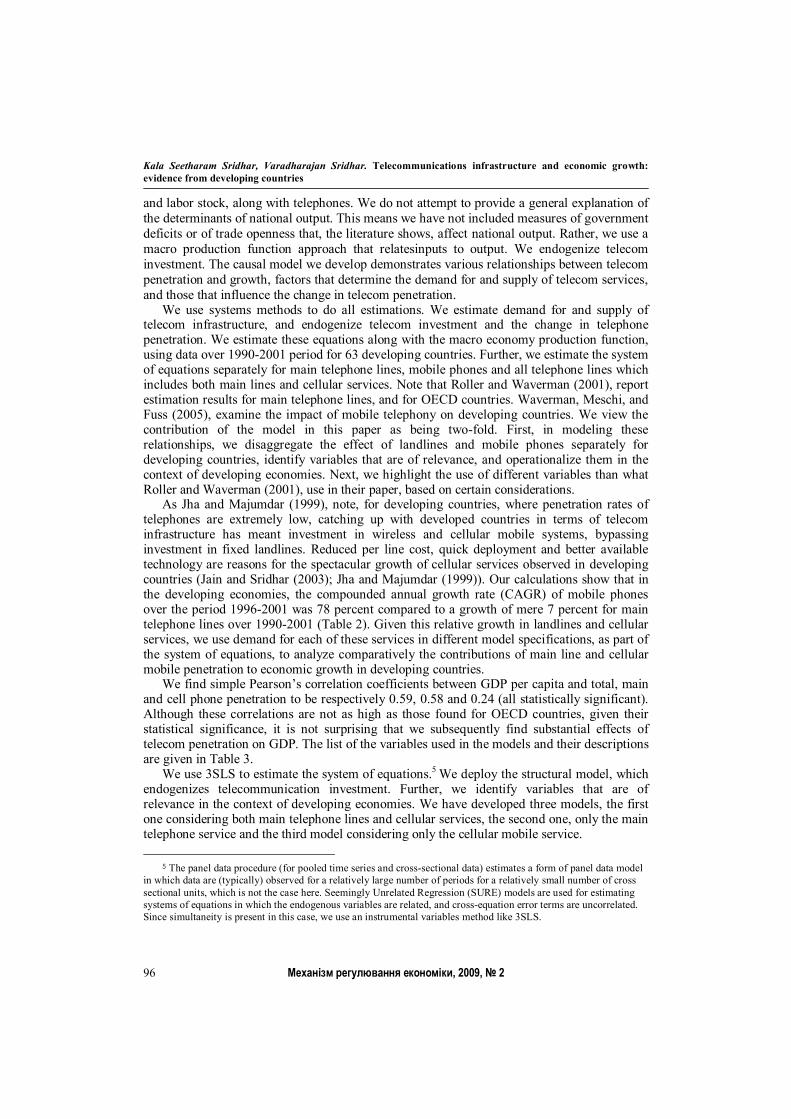
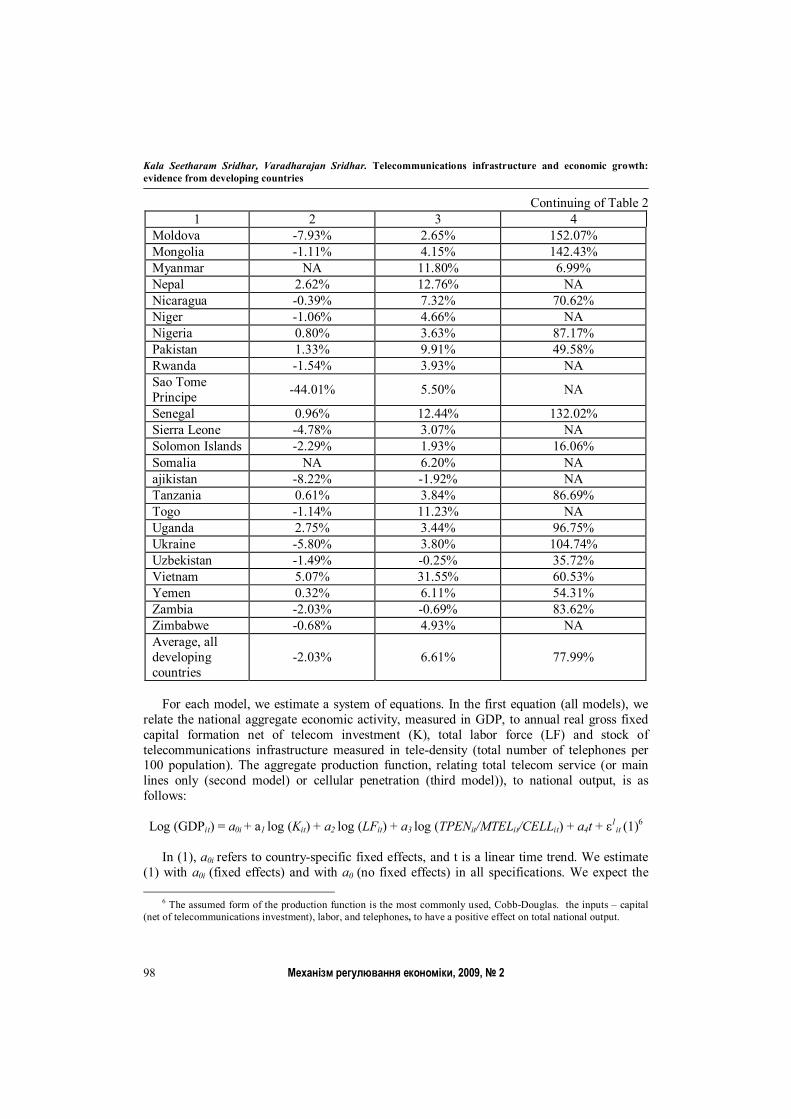
As Jha and Majumdar (1999), note, for developing countries, where penetration rates of telephones are extremely low, catching up with developed countries in terms of telecom infrastructure has meant investment in wireless and cellular mobile systems, bypassing investment in fixed landlines. Reduced per line cost, quick deployment and better available technology are reasons for the spectacular growth of cellular services observed in developing countries (Jain and Sridhar (2003); Jha and Majumdar (1999)). Our calculations show that in the developing economies, the compounded annual growth rate (CAGR) of mobile phones over the period 1996-2001 was 78 percent compared to a growth of mere 7 percent for main telephone lines over 1990-2001 (Table 2). Given this relative growth in landlines and cellular services, we use demand for each of these services in different model specifications, as part of the system of equations, to analyze comparatively the contributions of main line and cellular mobile penetration to economic growth in developing countries.
We find simple Pearson’s correlation coefficients between GDP per capita and total, main and cell phone penetration to be respectively 0.59, 0.58 and 0.24 (all statistically significant). Although these correlations are not as high as those found for OECD countries, given their statistical significance, it is not surprising that we subsequently find substantial effects of telecom penetration on GDP. The list of the variables used in the models and their descriptions are given in Table 3.
We use 3SLS to estimate the system of equations.5 We deploy the structural model, which endogenizes telecommunication investment. Further, we identify variables that are of relevance in the context of developing economies. We have developed three models, the first one considering both main telephone lines and cellular services, the second one, only the main telephone service and the third model considering only the cellular mobile service.
5 The panel data procedure (for pooled time series and cross-sectional data) estimates a form of panel data model in which data are (typically) observed for a relatively large number of periods for a relatively small number of cross sectional units, which is not the case here. Seemingly Unrelated Regression (SURE) models are used for estimating systems of equations in which the endogenous variables are related, and cross-equation error terms are uncorrelated. Since simultaneity is present in this case, we use an instrumental variables method like 3SLS.
Розділ 2 Інноваційні процеси в економіці
Механізм регулювання економіки, 2009, № 2 97
Table 2 - Annual Growth of GDP Per Capita, Main Telephone Lines and Cell Phone Penetration in Developing Economies
Country CAGR,
1990-2001, GDP Per Capita
CAGR, 1990-2001, Mainlines per 100
inhabitants
CAGR, 1996-2001, Mobile phones per 100
inhabitants 1 2 3 4
Afghanistan NA -4.29% NA Angola -2.29% -2.09% 66.54% Armenia -2.95% -0.96% 101.53% Azerbaijan -2.33% 2.10% 81.94% Bangladesh 2.75% 5.74% NA Benin 1.54% 9.49% 83.99% Bhutan 3.03% 17.41% NA Burkina Faso 2.06% 8.70% 100.00% Burundi* -1.19% 0.88% NA Cambodia 1.30% 19.33% 40.05% Cameroon -0.85% 5.68% 101.53% Central African Rep -0.65% 2.92% 45.95%
Chad 0.04% 5.95% NA Comoros -45.66% 4.14% NA Congo D.R. 17.06% 18.78% NA Congo, Rep. -1.20% 0.00% NA Cote d’Ivoire -0.53% 9.29% 88.32% Eritrea 3.67% 7.71% NA Ethiopia 0.95% 4.28% NA Gambia 0.21% 12.18% 57.49% Georgia -6.78% 4.84% 130.89% Ghana 1.08% 12.25% 53.90% Guinea 1.17% 4.97% 62.26% Guinea-Bissau -0.77% 4.03% NA Haiti -45.26% 2.88% NA India 3.34% 16.66% 66.10% Indonesia 2.48% 15.85% 49.45% Kenya -1.08% 2.65% 140.19% Kyrgyz Republic -3.93% 0.72% NA
Lao PDR 3.52% 16.30% 37.89% Lesotho 1.53% 2.95% 87.89% Liberia 0.66% -4.02% NA Madagascar 0.23% 3.90% 90.30% Malawi 1.11% 4.40% 54.31% Mali 1.76% 11.50% 87.89% Mauritania 1.48% 10.49% NA
Kala Seetharam Sridhar, Varadharajan Sridhar. Telecommunications infrastructure and economic growth: evidence from developing countries
Механізм регулювання економіки, 2009, № 2 98
Continuing of Table 2 1 2 3 4
Moldova -7.93% 2.65% 152.07% Mongolia -1.11% 4.15% 142.43% Myanmar NA 11.80% 6.99% Nepal 2.62% 12.76% NA Nicaragua -0.39% 7.32% 70.62% Niger -1.06% 4.66% NA Nigeria 0.80% 3.63% 87.17% Pakistan 1.33% 9.91% 49.58% Rwanda -1.54% 3.93% NA Sao Tome Principe -44.01% 5.50% NA
Senegal 0.96% 12.44% 132.02% Sierra Leone -4.78% 3.07% NA Solomon Islands -2.29% 1.93% 16.06% Somalia NA 6.20% NA ajikistan -8.22% -1.92% NA Tanzania 0.61% 3.84% 86.69% Togo -1.14% 11.23% NA Uganda 2.75% 3.44% 96.75% Ukraine -5.80% 3.80% 104.74% Uzbekistan -1.49% -0.25% 35.72% Vietnam 5.07% 31.55% 60.53% Yemen 0.32% 6.11% 54.31% Zambia -2.03% -0.69% 83.62% Zimbabwe -0.68% 4.93% NA Average, all developing countries
-2.03% 6.61% 77.99%
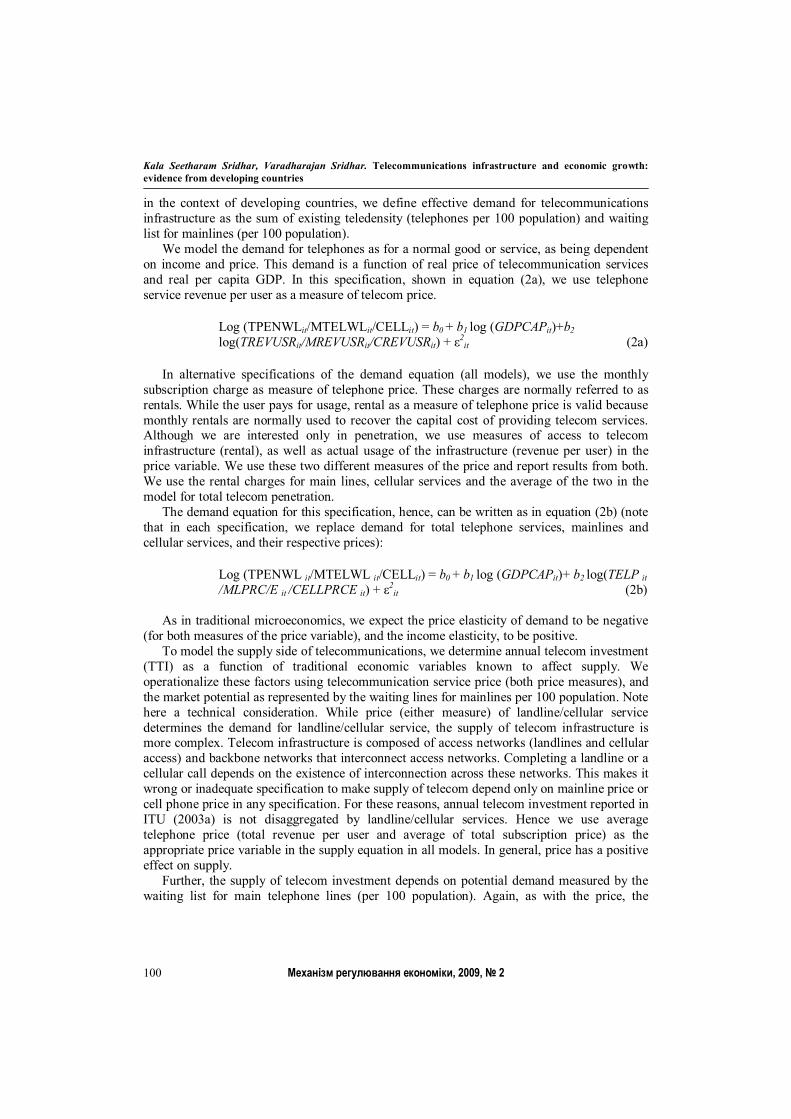
For each model, we estimate a system of equations. In the first equation (all models), we
relate the national aggregate economic activity, measured in GDP, to annual real gross fixed capital formation net of telecom investment (K), total labor force (LF) and stock of telecommunications infrastructure measured in tele-density (total number of telephones per 100 population). The aggregate production function, relating total telecom service (or main lines only (second model) or cellular penetration (third model)), to national output, is as follows: Log (GDPit) = a0i + a1 log (Kit) + a2 log (LFit) + a3 log (TPENit/MTELit/CELLit) + a4t + ε1
it (1)6 In (1), a0i refers to country-specific fixed effects, and t is a linear time trend. We estimate
(1) with a0i (fixed effects) and with a0 (no fixed effects) in all specifications. We expect the
6 The assumed form of the production function is the most commonly used, Cobb-Douglas. the inputs – capital (net of telecommunications investment), labor, and telephones, to have a positive effect on total national output.
Розділ 2 Інноваційні процеси в економіці
Механізм регулювання економіки, 2009, № 2 99
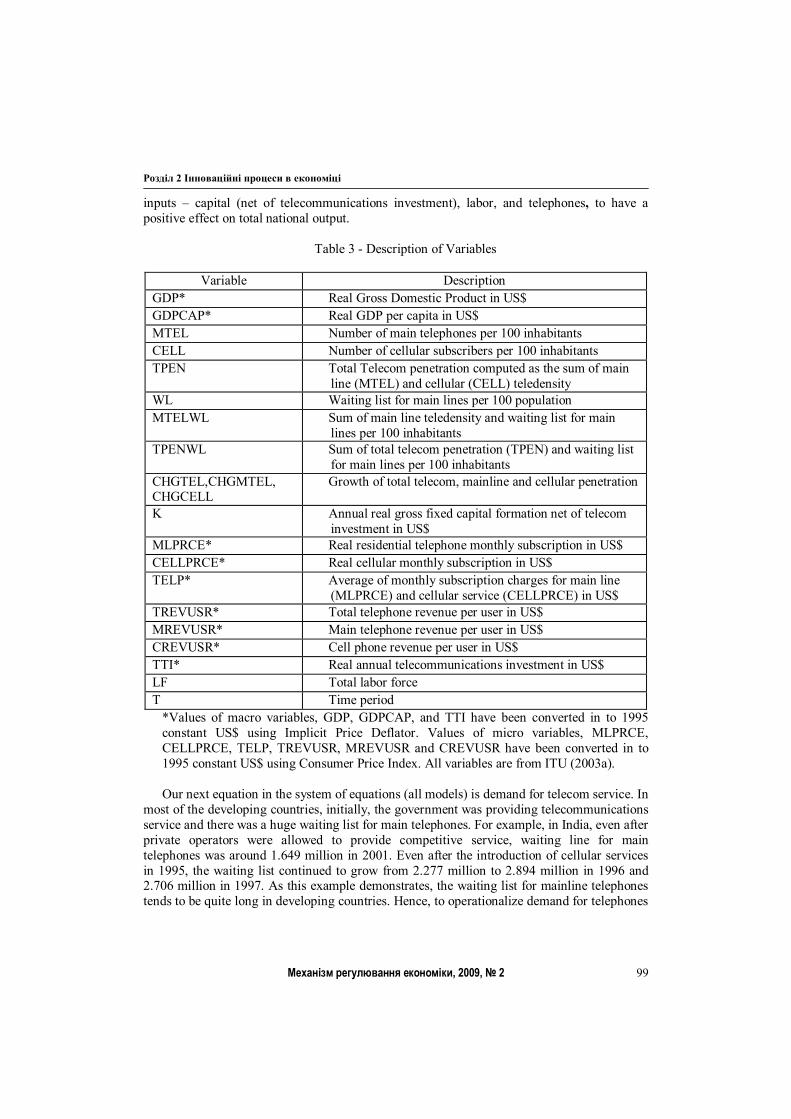
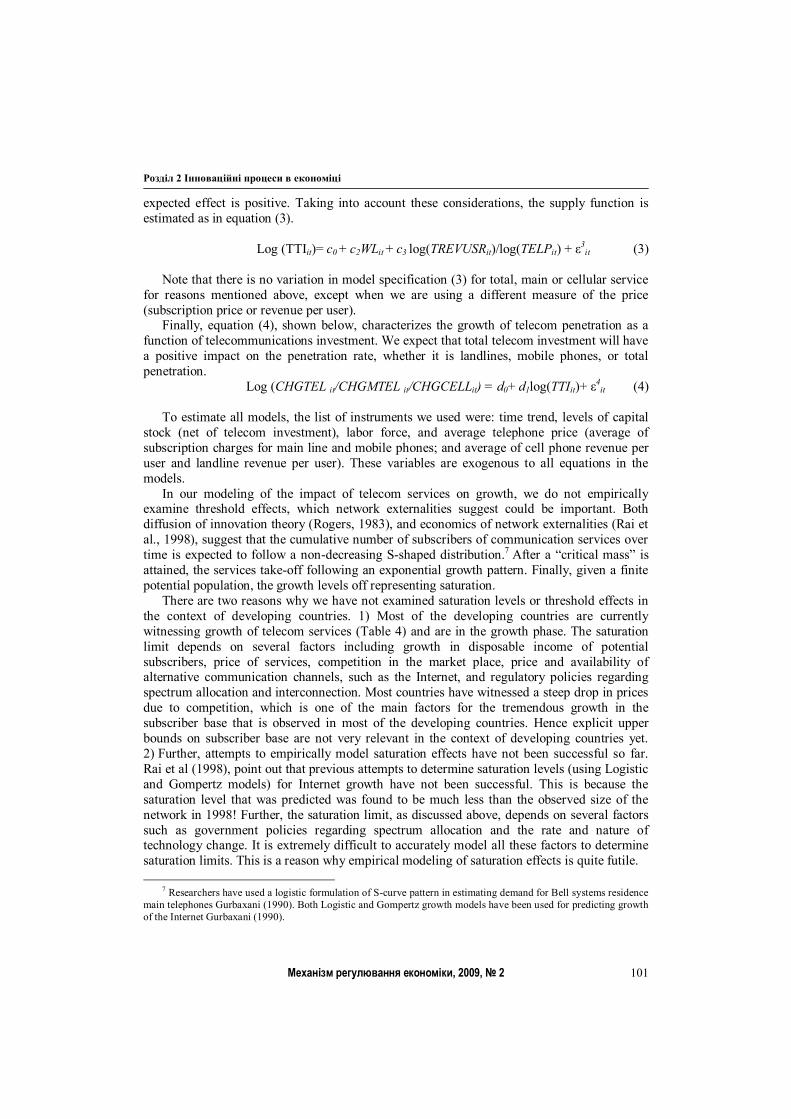
inputs – capital (net of telecommunications investment), labor, and telephones, to have a positive effect on total national output.
Table 3 - Description of Variables
Variable Description
GDP* Real Gross Domestic Product in US$ GDPCAP* Real GDP per capita in US$ MTEL Number of main telephones per 100 inhabitants CELL Number of cellular subscribers per 100 inhabitants TPEN Total Telecom penetration computed as the sum of main
line (MTEL) and cellular (CELL) teledensity WL Waiting list for main lines per 100 population MTELWL Sum of main line teledensity and waiting list for main
lines per 100 inhabitants TPENWL Sum of total telecom penetration (TPEN) and waiting list
for main lines per 100 inhabitants CHGTEL,CHGMTEL, CHGCELL
Growth of total telecom, mainline and cellular penetration
K Annual real gross fixed capital formation net of telecom investment in US$
MLPRCE* Real residential telephone monthly subscription in US$ CELLPRCE* Real cellular monthly subscription in US$ TELP* Average of monthly subscription charges for main line
(MLPRCE) and cellular service (CELLPRCE) in US$ TREVUSR* Total telephone revenue per user in US$ MREVUSR* Main telephone revenue per user in US$ CREVUSR* Cell phone revenue per user in US$ TTI* Real annual telecommunications investment in US$ LF Total labor force T Time period
*Values of macro variables, GDP, GDPCAP, and TTI have been converted in to 1995 constant US$ using Implicit Price Deflator. Values of micro variables, MLPRCE, CELLPRCE, TELP, TREVUSR, MREVUSR and CREVUSR have been converted in to 1995 constant US$ using Consumer Price Index. All variables are from ITU (2003a). Our next equation in the system of equations (all models) is demand for telecom service. In
most of the developing countries, initially, the government was providing telecommunications service and there was a huge waiting list for main telephones. For example, in India, even after private operators were allowed to provide competitive service, waiting line for main telephones was around 1.649 million in 2001. Even after the introduction of cellular services in 1995, the waiting list continued to grow from 2.277 million to 2.894 million in 1996 and 2.706 million in 1997. As this example demonstrates, the waiting list for mainline telephones tends to be quite long in developing countries. Hence, to operationalize demand for telephones
Kala Seetharam Sridhar, Varadharajan Sridhar. Telecommunications infrastructure and economic growth: evidence from developing countries
Механізм регулювання економіки, 2009, № 2 100
in the context of developing countries, we define effective demand for telecommunications infrastructure as the sum of existing teledensity (telephones per 100 population) and waiting list for mainlines (per 100 population).
We model the demand for telephones as for a normal good or service, as being dependent on income and price. This demand is a function of real price of telecommunication services and real per capita GDP. In this specification, shown in equation (2a), we use telephone service revenue per user as a measure of telecom price.
Log (TPENWLit/MTELWLit/CELLit) = b0 + b1 log (GDPCAPit)+b2 log(TREVUSRit/MREVUSRit/CREVUSRit) + ε2
it (2a)
In alternative specifications of the demand equation (all models), we use the monthly subscription charge as measure of telephone price. These charges are normally referred to as rentals. While the user pays for usage, rental as a measure of telephone price is valid because monthly rentals are normally used to recover the capital cost of providing telecom services. Although we are interested only in penetration, we use measures of access to telecom infrastructure (rental), as well as actual usage of the infrastructure (revenue per user) in the price variable. We use these two different measures of the price and report results from both. We use the rental charges for main lines, cellular services and the average of the two in the model for total telecom penetration.
The demand equation for this specification, hence, can be written as in equation (2b) (note that in each specification, we replace demand for total telephone services, mainlines and cellular services, and their respective prices):
Log (TPENWL it/MTELWL it/CELLit) = b0 + b1 log (GDPCAPit)+ b2 log(TELP it /MLPRC/E it /CELLPRCE it) + ε2
it (2b) As in traditional microeconomics, we expect the price elasticity of demand to be negative
(for both measures of the price variable), and the income elasticity, to be positive. To model the supply side of telecommunications, we determine annual telecom investment
(TTI) as a function of traditional economic variables known to affect supply. We operationalize these factors using telecommunication service price (both price measures), and the market potential as represented by the waiting lines for mainlines per 100 population. Note here a technical consideration. While price (either measure) of landline/cellular service determines the demand for landline/cellular service, the supply of telecom infrastructure is more complex. Telecom infrastructure is composed of access networks (landlines and cellular access) and backbone networks that interconnect access networks. Completing a landline or a cellular call depends on the existence of interconnection across these networks. This makes it wrong or inadequate specification to make supply of telecom depend only on mainline price or cell phone price in any specification. For these reasons, annual telecom investment reported in ITU (2003a) is not disaggregated by landline/cellular services. Hence we use average telephone price (total revenue per user and average of total subscription price) as the appropriate price variable in the supply equation in all models. In general, price has a positive effect on supply.
Further, the supply of telecom investment depends on potential demand measured by the waiting list for main telephone lines (per 100 population). Again, as with the price, the
Розділ 2 Інноваційні процеси в економіці
Механізм регулювання економіки, 2009, № 2 101
expected effect is positive. Taking into account these considerations, the supply function is estimated as in equation (3).
Log (TTIit)= c0 + c2WLit + c3 log(TREVUSRit)/log(TELPit) + ε3
it (3) Note that there is no variation in model specification (3) for total, main or cellular service
for reasons mentioned above, except when we are using a different measure of the price (subscription price or revenue per user).
Finally, equation (4), shown below, characterizes the growth of telecom penetration as a function of telecommunications investment. We expect that total telecom investment will have a positive impact on the penetration rate, whether it is landlines, mobile phones, or total penetration.
Log (CHGTEL it/CHGMTEL it/CHGCELLit) = d0+ d1log(TTIit)+ ε4it (4)
To estimate all models, the list of instruments we used were: time trend, levels of capital
stock (net of telecom investment), labor force, and average telephone price (average of subscription charges for main line and mobile phones; and average of cell phone revenue per user and landline revenue per user). These variables are exogenous to all equations in the models.
In our modeling of the impact of telecom services on growth, we do not empirically examine threshold effects, which network externalities suggest could be important. Both diffusion of innovation theory (Rogers, 1983), and economics of network externalities (Rai et al., 1998), suggest that the cumulative number of subscribers of communication services over time is expected to follow a non-decreasing S-shaped distribution.7 After a “critical mass” is attained, the services take-off following an exponential growth pattern. Finally, given a finite potential population, the growth levels off representing saturation.
There are two reasons why we have not examined saturation levels or threshold effects in the context of developing countries. 1) Most of the developing countries are currently witnessing growth of telecom services (Table 4) and are in the growth phase. The saturation limit depends on several factors including growth in disposable income of potential subscribers, price of services, competition in the market place, price and availability of alternative communication channels, such as the Internet, and regulatory policies regarding spectrum allocation and interconnection. Most countries have witnessed a steep drop in prices due to competition, which is one of the main factors for the tremendous growth in the subscriber base that is observed in most of the developing countries. Hence explicit upper bounds on subscriber base are not very relevant in the context of developing countries yet. 2) Further, attempts to empirically model saturation effects have not been successful so far. Rai et al (1998), point out that previous attempts to determine saturation levels (using Logistic and Gompertz models) for Internet growth have not been successful. This is because the saturation level that was predicted was found to be much less than the observed size of the network in 1998! Further, the saturation limit, as discussed above, depends on several factors such as government policies regarding spectrum allocation and the rate and nature of technology change. It is extremely difficult to accurately model all these factors to determine saturation limits. This is a reason why empirical modeling of saturation effects is quite futile.
7 Researchers have used a logistic formulation of S-curve pattern in estimating demand for Bell systems residence main telephones Gurbaxani (1990). Both Logistic and Gompertz growth models have been used for predicting growth of the Internet Gurbaxani (1990).
Kala Seetharam Sridhar, Varadharajan Sridhar. Telecommunications infrastructure and economic growth: evidence from developing countries
Механізм регулювання економіки, 2009, № 2 102
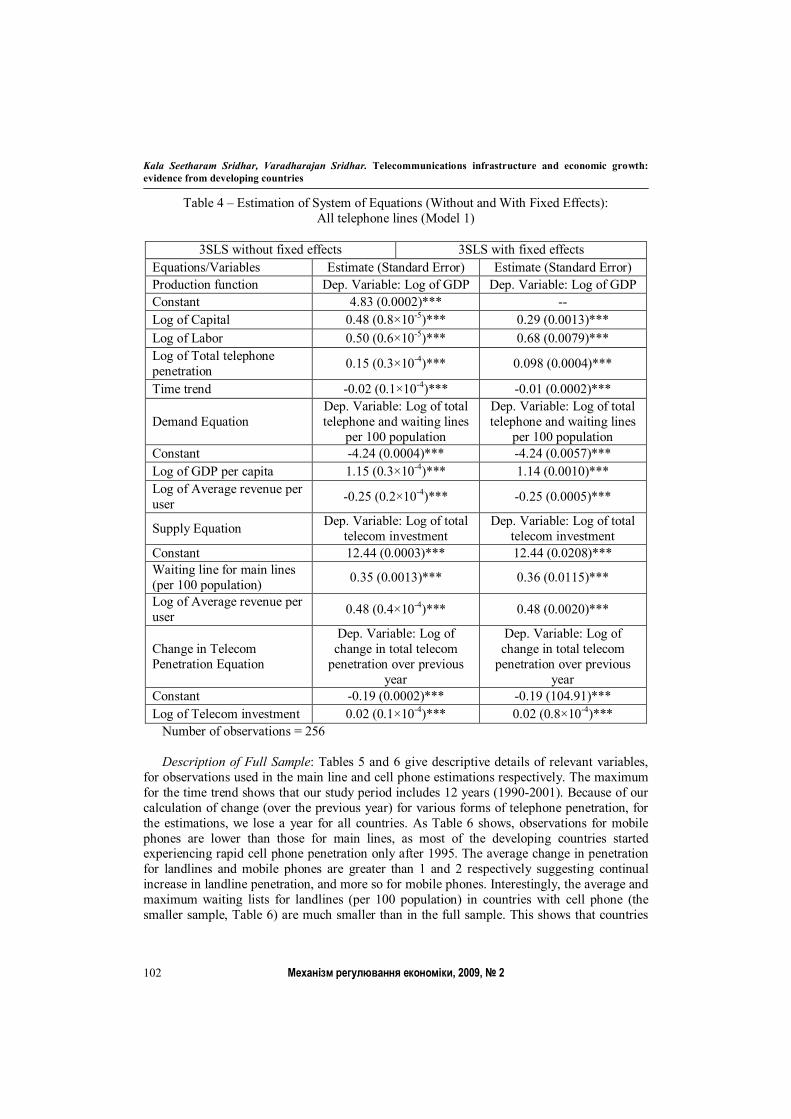
Table 4 – Estimation of System of Equations (Without and With Fixed Effects): All telephone lines (Model 1)
3SLS without fixed effects 3SLS with fixed effects
Equations/Variables Estimate (Standard Error) Estimate (Standard Error) Production function Dep. Variable: Log of GDP Dep. Variable: Log of GDP Constant 4.83 (0.0002)*** -- Log of Capital 0.48 (0.8×10⁻⁵)*** 0.29 (0.0013)*** Log of Labor 0.50 (0.6×10⁻⁵)*** 0.68 (0.0079)*** Log of Total telephone penetration 0.15 (0.3×10⁻⁴)*** 0.098 (0.0004)***
Time trend -0.02 (0.1×10⁻⁴)*** -0.01 (0.0002)***
Demand Equation Dep. Variable: Log of total telephone and waiting lines
per 100 population
Dep. Variable: Log of total telephone and waiting lines
per 100 population Constant -4.24 (0.0004)*** -4.24 (0.0057)*** Log of GDP per capita 1.15 (0.3×10⁻⁴)*** 1.14 (0.0010)*** Log of Average revenue per user -0.25 (0.2×10⁻⁴)*** -0.25 (0.0005)***
Supply Equation Dep. Variable: Log of total telecom investment
Dep. Variable: Log of total telecom investment
Constant 12.44 (0.0003)*** 12.44 (0.0208)*** Waiting line for main lines (per 100 population) 0.35 (0.0013)*** 0.36 (0.0115)***
Log of Average revenue per user 0.48 (0.4×10⁻⁴)*** 0.48 (0.0020)***
Change in Telecom Penetration Equation
Dep. Variable: Log of change in total telecom
penetration over previous year
Dep. Variable: Log of change in total telecom
penetration over previous year
Constant -0.19 (0.0002)*** -0.19 (104.91)*** Log of Telecom investment 0.02 (0.1×10⁻⁴)*** 0.02 (0.8×10⁻⁴)***
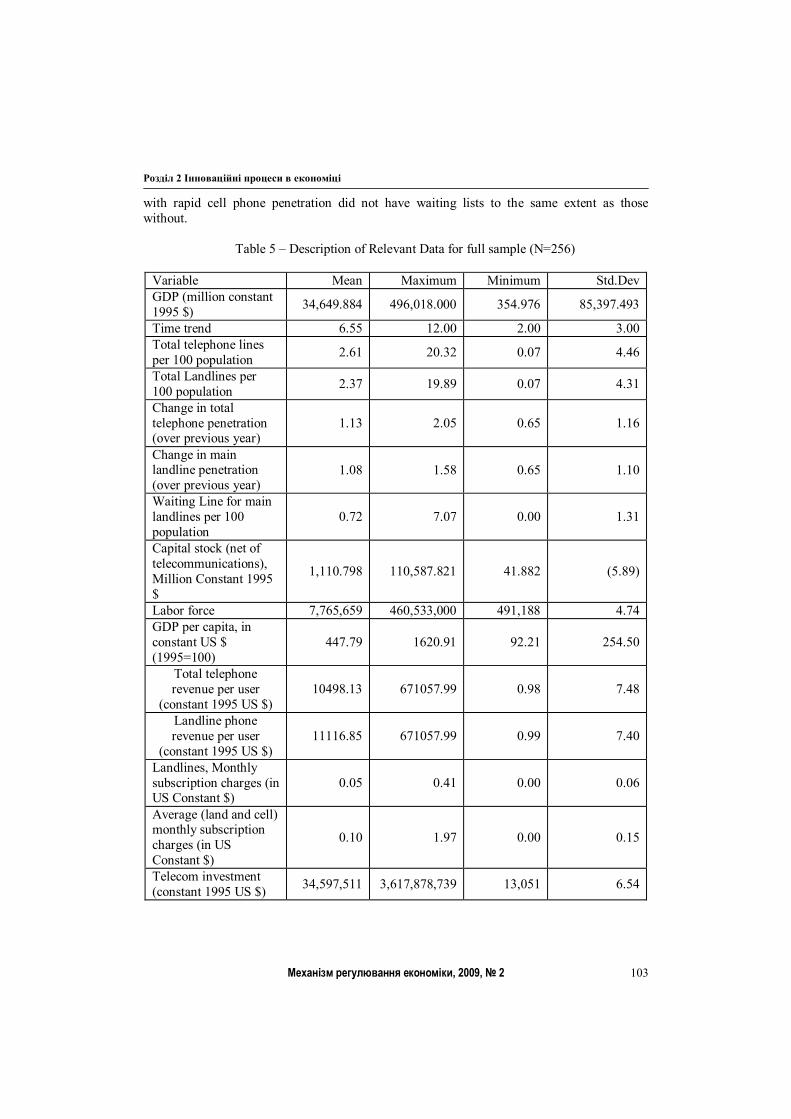
Number of observations = 256 Description of Full Sample: Tables 5 and 6 give descriptive details of relevant variables,
for observations used in the main line and cell phone estimations respectively. The maximum for the time trend shows that our study period includes 12 years (1990-2001). Because of our calculation of change (over the previous year) for various forms of telephone penetration, for the estimations, we lose a year for all countries. As Table 6 shows, observations for mobile phones are lower than those for main lines, as most of the developing countries started experiencing rapid cell phone penetration only after 1995. The average change in penetration for landlines and mobile phones are greater than 1 and 2 respectively suggesting continual increase in landline penetration, and more so for mobile phones. Interestingly, the average and maximum waiting lists for landlines (per 100 population) in countries with cell phone (the smaller sample, Table 6) are much smaller than in the full sample. This shows that countries
Розділ 2 Інноваційні процеси в економіці
Механізм регулювання економіки, 2009, № 2 103
with rapid cell phone penetration did not have waiting lists to the same extent as those without.
Table 5 – Description of Relevant Data for full sample (N=256)
Variable Mean Maximum Minimum Std.Dev GDP (million constant 1995 $) 34,649.884 496,018.000 354.976 85,397.493
Time trend 6.55 12.00 2.00 3.00 Total telephone lines per 100 population 2.61 20.32 0.07 4.46
Total Landlines per 100 population 2.37 19.89 0.07 4.31
Change in total telephone penetration (over previous year)
1.13 2.05 0.65 1.16
Change in main landline penetration (over previous year)
1.08 1.58 0.65 1.10
Waiting Line for main landlines per 100 population
0.72 7.07 0.00 1.31
Capital stock (net of telecommunications), Million Constant 1995 $
1,110.798 110,587.821 41.882 (5.89)
Labor force 7,765,659 460,533,000 491,188 4.74 GDP per capita, in constant US $ (1995=100)
447.79 1620.91 92.21 254.50
Total telephone revenue per user
(constant 1995 US $) 10498.13 671057.99 0.98 7.48
Landline phone revenue per user
(constant 1995 US $) 11116.85 671057.99 0.99 7.40
Landlines, Monthly subscription charges (in US Constant $)
0.05 0.41 0.00 0.06
Average (land and cell) monthly subscription charges (in US Constant $)
0.10 1.97 0.00 0.15
Telecom investment (constant 1995 US $) 34,597,511 3,617,878,739 13,051 6.54
Kala Seetharam Sridhar, Varadharajan Sridhar. Telecommunications infrastructure and economic growth: evidence from developing countries
Механізм регулювання економіки, 2009, № 2 104
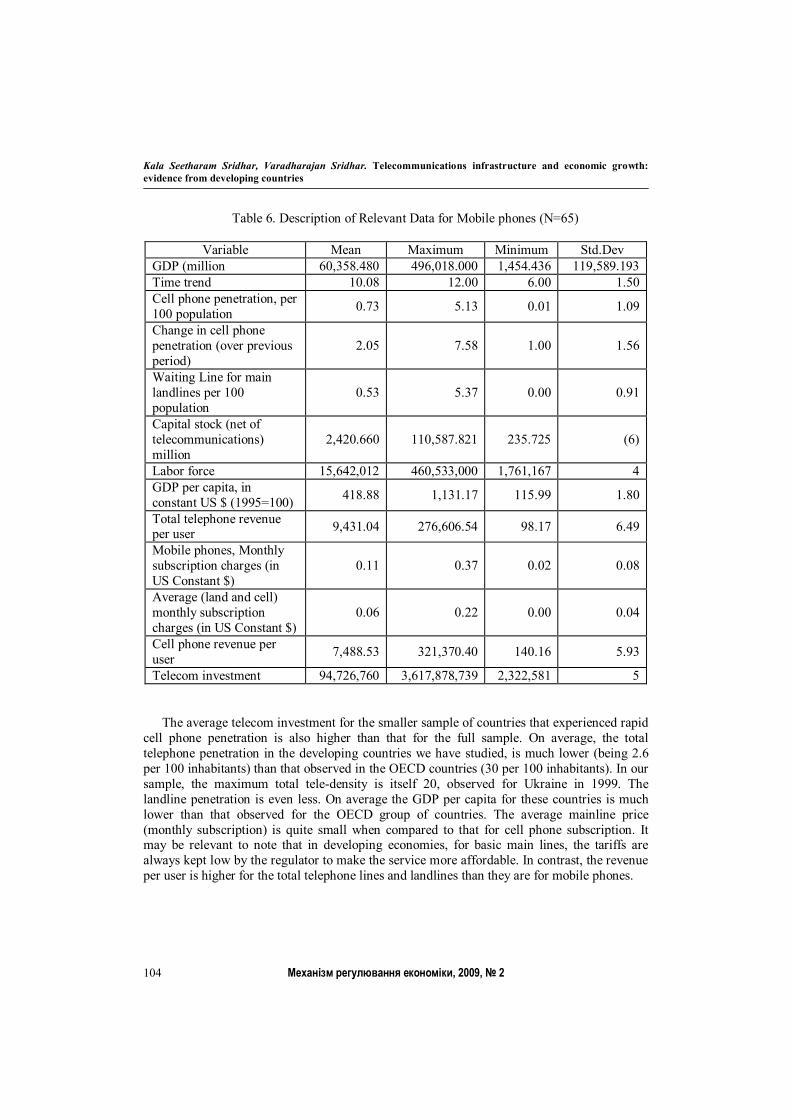
Table 6. Description of Relevant Data for Mobile phones (N=65)
Variable Mean Maximum Minimum Std.Dev
GDP (million 60,358.480 496,018.000 1,454.436 119,589.193 Time trend 10.08 12.00 6.00 1.50 Cell phone penetration, per 100 population 0.73 5.13 0.01 1.09
Change in cell phone penetration (over previous period)
2.05 7.58 1.00 1.56
Waiting Line for main landlines per 100 population
0.53 5.37 0.00 0.91
Capital stock (net of telecommunications) million
2,420.660 110,587.821 235.725 (6)
Labor force 15,642,012 460,533,000 1,761,167 4 GDP per capita, in constant US $ (1995=100) 418.88 1,131.17 115.99 1.80
Total telephone revenue per user 9,431.04 276,606.54 98.17 6.49
Mobile phones, Monthly subscription charges (in US Constant $)
0.11 0.37 0.02 0.08
Average (land and cell) monthly subscription charges (in US Constant $)
0.06 0.22 0.00 0.04
Cell phone revenue per user 7,488.53 321,370.40 140.16 5.93
Telecom investment 94,726,760 3,617,878,739 2,322,581 5 The average telecom investment for the smaller sample of countries that experienced rapid
cell phone penetration is also higher than that for the full sample. On average, the total telephone penetration in the developing countries we have studied, is much lower (being 2.6 per 100 inhabitants) than that observed in the OECD countries (30 per 100 inhabitants). In our sample, the maximum total tele-density is itself 20, observed for Ukraine in 1999. The landline penetration is even less. On average the GDP per capita for these countries is much lower than that observed for the OECD group of countries. The average mainline price (monthly subscription) is quite small when compared to that for cell phone subscription. It may be relevant to note that in developing economies, for basic main lines, the tariffs are always kept low by the regulator to make the service more affordable. In contrast, the revenue per user is higher for the total telephone lines and landlines than they are for mobile phones.
Розділ 2 Інноваційні процеси в економіці
Механізм регулювання економіки, 2009, № 2 105
Results from Estimation Tables 4, 7-10 present the estimation results for various specifications of system of
equations for all telephone lines, landlines and mobile phones. These tables show estimates of the production, demand, supply, and finally of the change in telecom penetration.8
Estimation for all telephone lines: We report 3SLS estimates with and without fixed effects for all telephone lines (that include landlines and mobile phones) models (Tables 4 and 7) using two measures of the telephone price – respectively revenue per user and subscription rental prices.
Estimates of the production function for all telephone lines are consistent with expectation. These estimates indicate that capital, labor force and total telephone penetration positively impact aggregate output.9 The elasticities we obtain for capital, and labor are respectively 0.48 and 0.50 without allowing for country-specific fixed effects. Our separate tests indicated that we have to use country specific fixed effects for the macro production function.
When we use fixed effects, the elasticity of output becomes significantly reduced for capital (0.29) and higher for labor (0.68). This indicates that 1 percentage increase in labor and capital inputs roughly increases aggregate national output by 0.3 and 0.7 percent each. Our estimates also show that a 1 percent increase in tele-density (total telephones per 100 population) increases national output by 0.15 percent without fixed effects and by 0.10 percent with fixed effects.
Estimates of the demand for telecom infrastructure, when we take into account all telephone lines, show the dominance of traditional economic factors – income and price. The income elasticity of demand for telecom services is positive and greater than 1 (being 1.15 and 1.14 respectively without and with fixed effects), indicating elastic demand (Table 4). The magnitude of this becomes larger when we use subscription prices rather than revenue per user (Table 7).
This implies that the reverse causation we suspect exists between telecom and economic growth indeed is true. Any increases in GDP translate to increases in personal disposable income, and hence increase demand for telephone services. The price elasticity of demand is as expected, negative, and less than unity (with both measures of the price), and less than what is found with respect to OECD countries.
Estimates of the supply equation indicate that the market potential (waiting lines per 100 population) is an important determinant of investment in telecom, consistent with our expectation. Further, the traditional relationship between the average telephone revenue per user/average subscription charges, and telecom investment is positive and significant, reinforcing the role of prices in increasing supply of telecom infrastructure.
8 We have not used robust standard errors for the estimates. Greene (2000), points out the misconception in some
of the applied literature that robust standard errors provide a robust asymptotic covariance matrix for the MLE of the various parameters. While that general result is laid out by Gourieroux, Monfort, and Trognon (1984), Greene (2000), points out that this is true only in a very small set of cases, and highlights that the number of actual applications to which their result will apply is distressingly small. Hence the likelihood of robust standard errors in providing a robust covariance matrix in any particular case (including this one) is quite small.
9 Remember here that we have estimated a Cobb-Douglas production function, and the fact that the sum of coefficients is greater than 1 implies increasing returns to scale. This may be, in fact, reasonable to expect, since the countries in the sample on average, experienced Compounded Annual Growth Rates (CAGR) of 3% and 5% respectively in their labor force and capital stock (net of telecom). Further, the average CAGR of mainlines and mobile phones were 7% and 78% respectively (Table 2), which may have all collectively led to increasing returns to scale in the national output of countries in our sample over the period of study.
Kala Seetharam Sridhar, Varadharajan Sridhar. Telecommunications infrastructure and economic growth: evidence from developing countries
Механізм регулювання економіки, 2009, № 2 106
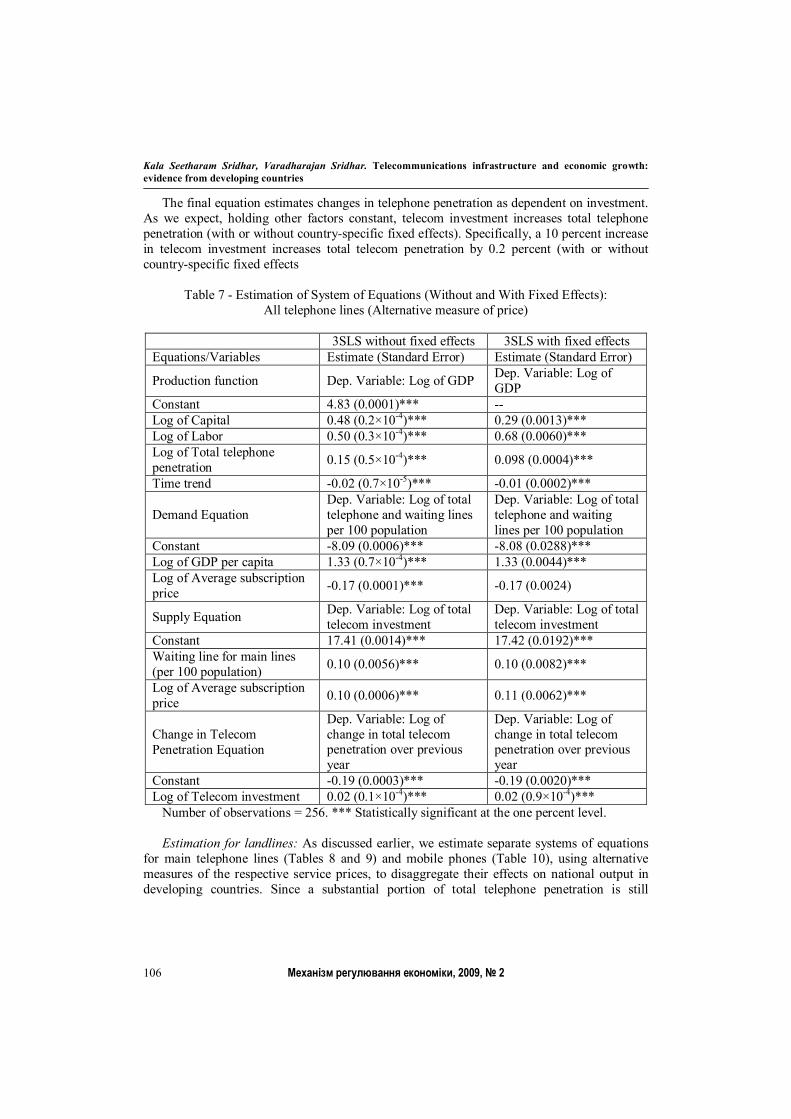
The final equation estimates changes in telephone penetration as dependent on investment. As we expect, holding other factors constant, telecom investment increases total telephone penetration (with or without country-specific fixed effects). Specifically, a 10 percent increase in telecom investment increases total telecom penetration by 0.2 percent (with or without country-specific fixed effects
Table 7 - Estimation of System of Equations (Without and With Fixed Effects):
All telephone lines (Alternative measure of price)
3SLS without fixed effects 3SLS with fixed effects Equations/Variables Estimate (Standard Error) Estimate (Standard Error)
Production function Dep. Variable: Log of GDP Dep. Variable: Log of GDP
Constant 4.83 (0.0001)*** -- Log of Capital 0.48 (0.2×10⁻⁴)*** 0.29 (0.0013)*** Log of Labor 0.50 (0.3×10⁻⁴)*** 0.68 (0.0060)*** Log of Total telephone penetration 0.15 (0.5×10⁻⁴)*** 0.098 (0.0004)***
Time trend -0.02 (0.7×10⁻⁵)*** -0.01 (0.0002)***
Demand Equation Dep. Variable: Log of total telephone and waiting lines per 100 population
Dep. Variable: Log of total telephone and waiting lines per 100 population
Constant -8.09 (0.0006)*** -8.08 (0.0288)*** Log of GDP per capita 1.33 (0.7×10⁻⁴)*** 1.33 (0.0044)*** Log of Average subscription price -0.17 (0.0001)*** -0.17 (0.0024)
Supply Equation Dep. Variable: Log of total telecom investment
Dep. Variable: Log of total telecom investment
Constant 17.41 (0.0014)*** 17.42 (0.0192)*** Waiting line for main lines (per 100 population) 0.10 (0.0056)*** 0.10 (0.0082)***
Log of Average subscription price 0.10 (0.0006)*** 0.11 (0.0062)***
Change in Telecom Penetration Equation
Dep. Variable: Log of change in total telecom penetration over previous year
Dep. Variable: Log of change in total telecom penetration over previous year
Constant -0.19 (0.0003)*** -0.19 (0.0020)*** Log of Telecom investment 0.02 (0.1×10⁻⁴)*** 0.02 (0.9×10⁻⁴)***
Number of observations = 256. *** Statistically significant at the one percent level. Estimation for landlines: As discussed earlier, we estimate separate systems of equations
for main telephone lines (Tables 8 and 9) and mobile phones (Table 10), using alternative measures of the respective service prices, to disaggregate their effects on national output in developing countries. Since a substantial portion of total telephone penetration is still
Розділ 2 Інноваційні процеси в економіці
Механізм регулювання економіки, 2009, № 2 107
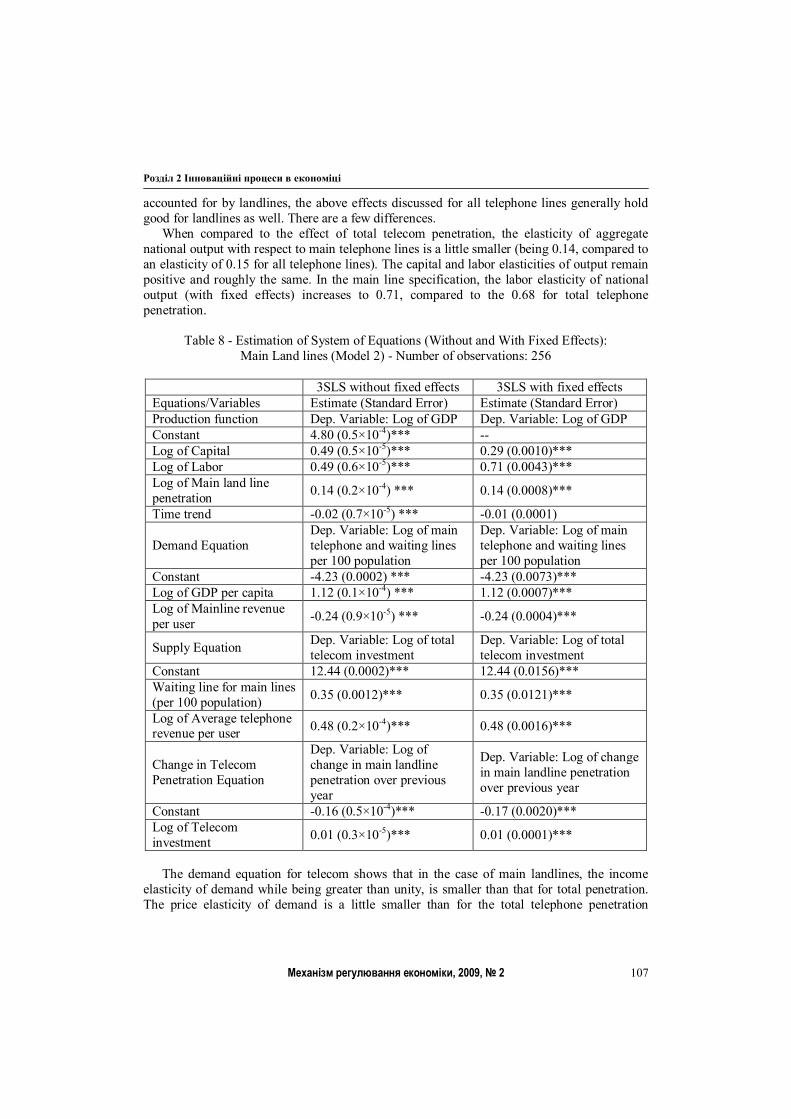
accounted for by landlines, the above effects discussed for all telephone lines generally hold good for landlines as well. There are a few differences.
When compared to the effect of total telecom penetration, the elasticity of aggregate national output with respect to main telephone lines is a little smaller (being 0.14, compared to an elasticity of 0.15 for all telephone lines). The capital and labor elasticities of output remain positive and roughly the same. In the main line specification, the labor elasticity of national output (with fixed effects) increases to 0.71, compared to the 0.68 for total telephone penetration.
Table 8 - Estimation of System of Equations (Without and With Fixed Effects):
Main Land lines (Model 2) - Number of observations: 256
3SLS without fixed effects 3SLS with fixed effects Equations/Variables Estimate (Standard Error) Estimate (Standard Error) Production function Dep. Variable: Log of GDP Dep. Variable: Log of GDP Constant 4.80 (0.5×10⁻⁴)*** -- Log of Capital 0.49 (0.5×10⁻⁵)*** 0.29 (0.0010)*** Log of Labor 0.49 (0.6×10⁻⁵)*** 0.71 (0.0043)*** Log of Main land line penetration 0.14 (0.2×10⁻⁴) *** 0.14 (0.0008)***
Time trend -0.02 (0.7×10⁻⁵) *** -0.01 (0.0001)
Demand Equation Dep. Variable: Log of main telephone and waiting lines per 100 population
Dep. Variable: Log of main telephone and waiting lines per 100 population
Constant -4.23 (0.0002) *** -4.23 (0.0073)*** Log of GDP per capita 1.12 (0.1×10⁻⁴) *** 1.12 (0.0007)*** Log of Mainline revenue per user -0.24 (0.9×10⁻⁵) *** -0.24 (0.0004)***
Supply Equation Dep. Variable: Log of total telecom investment
Dep. Variable: Log of total telecom investment
Constant 12.44 (0.0002)*** 12.44 (0.0156)*** Waiting line for main lines (per 100 population) 0.35 (0.0012)*** 0.35 (0.0121)***
Log of Average telephone revenue per user 0.48 (0.2×10⁻⁴)*** 0.48 (0.0016)***
Change in Telecom Penetration Equation
Dep. Variable: Log of change in main landline penetration over previous year
Dep. Variable: Log of change in main landline penetration over previous year
Constant -0.16 (0.5×10⁻⁴)*** -0.17 (0.0020)*** Log of Telecom investment 0.01 (0.3×10⁻⁵)*** 0.01 (0.0001)***
The demand equation for telecom shows that in the case of main landlines, the income
elasticity of demand while being greater than unity, is smaller than that for total penetration. The price elasticity of demand is a little smaller than for the total telephone penetration
Kala Seetharam Sridhar, Varadharajan Sridhar. Telecommunications infrastructure and economic growth: evidence from developing countries
Механізм регулювання економіки, 2009, № 2 108
specification (Table 8). Where our price variable in Table 8 measures the total revenue from land lines per user, a 10 percent reduction in this price can be expected to lead to a 2.4 percent increase in the demand for main telephone services in developing countries. Both the income and price elasticities of demand for landlines are higher with the use of subscription prices rather than with the landline revenue per user (Table 9).
This shows that landline users are more sensitive to changes in access costs rather than price for actual usage. During monopoly regimes, the erstwhile government monopolies cross-subsidized basic services in the form of lower rental and usage charges, from their other revenues. Even after competition was introduced, basic service provided through land lines have lower rental ceilings prescribed by the regulator to make it affordable to much of the population. Hence a small increase or decrease in the main landline subscription price will affect telecom penetration much.
Estimates of the supply of telecom infrastructure are the same as what they are for all telephone lines. As in the supply equation for all telephone lines, the potential demand (waiting list for telephone lines, per 100 population) has a positive and significantinfluence on investment decisions. As is clear, the magnitude of the estimates for all telephone lines, are driven by those for landlines.
Finally, estimates of the change in telephone penetration equation are as we expect. This shows that a 10 percent increase in telecom investment, other things remaining the same, leads to a 0.1 percent increase in penetration for land lines, lower than for all telephone lines, but positive and significant, as one would expect.
Estimation for mobile phones: As we indicate, we estimate a separate system of equations for mobile phones (Table 10). The sample size here is smaller because of the non-availability of mobile phone related data from a number of developing countries during our study period. Note that developing countries with low penetration rates for main telephone lines, find the infrastructure for mobile phones to be relatively inexpensive and less time-consuming to install. Mobile phone penetration in the countries of our sample started increasing rapidly during the second half of the 1990s due to changes in telecom regulation, and move to competitive market structures everywhere in the developing world. Most of the developing countries leap-frogged into second-generation mobile cellular systems, deploying them at a much greater rate compared to landline installations.
Waverman, Meschi and Fuss (2005), argue that for economies without fixed lines, or where mobile phones supplement the low roll-out of fixed lines, there should be no inherent difference in the growth dividend of a phone, whether it is mobile or fixed. While in general this is true, there are some reasons why we may expect mobile phones to contribute positively to national output. Cell phone penetration reduces transaction costs, including, but not limited to, decisions relating to production of goods and services. For instance, value added services such as stock quotes and commodity prices provided by cellular service providers at affordable prices using the latest digital cellular technologies, may be expected to produce tangible economic outcomes. Qualitative evidence regarding the effect of mobile phones demonstrate their positive economic and social impact (see Infodev, 2003), regarding the FOOD project in Chennai, India, and Manobi, Senegal’s use of mobile phones by the fishermen community).
Allowing for country-specific fixed effects and removing certain outliers as mentioned previously, we find that mobile phones have a positive role in contributing to national output. Specifically, Table 10 shows that for every 1 percent increase in cell phone penetration, national output can be expected to increase by 0.01 percent, small, but positive and
Розділ 2 Інноваційні процеси в економіці
Механізм регулювання економіки, 2009, № 2 109
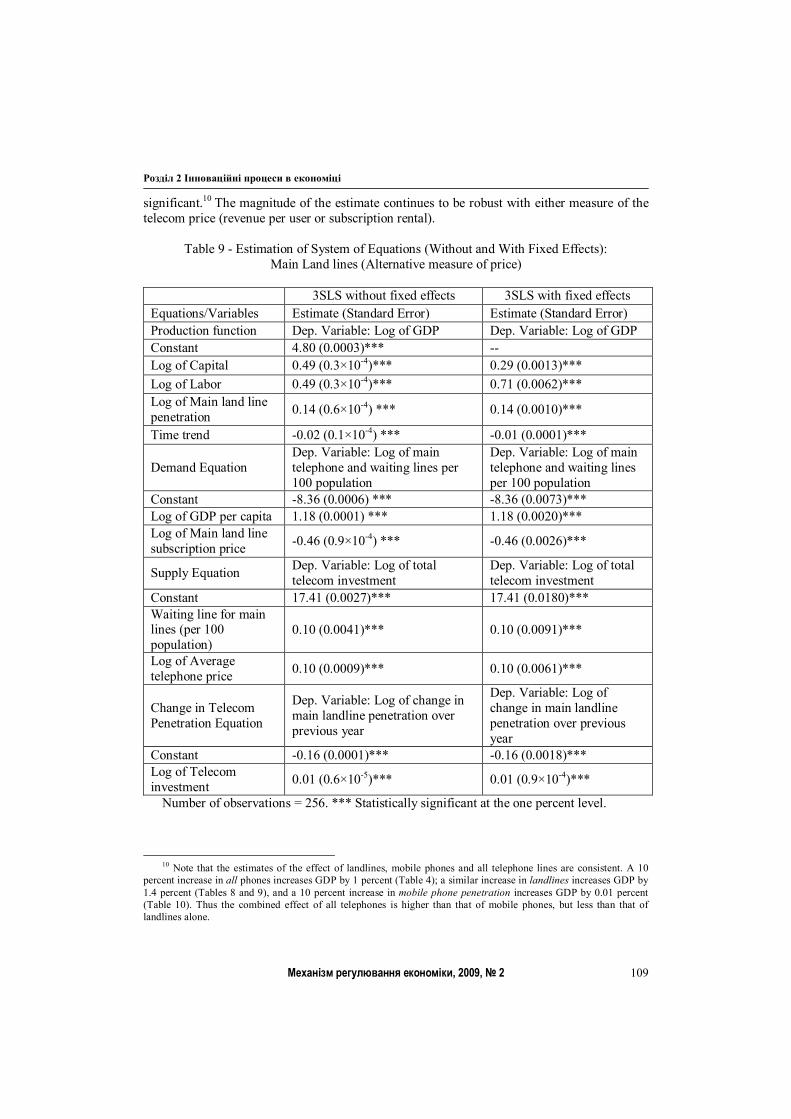
significant.10 The magnitude of the estimate continues to be robust with either measure of the telecom price (revenue per user or subscription rental).
Table 9 - Estimation of System of Equations (Without and With Fixed Effects):
Main Land lines (Alternative measure of price)
3SLS without fixed effects 3SLS with fixed effects Equations/Variables Estimate (Standard Error) Estimate (Standard Error) Production function Dep. Variable: Log of GDP Dep. Variable: Log of GDP Constant 4.80 (0.0003)*** -- Log of Capital 0.49 (0.3×10⁻⁴)*** 0.29 (0.0013)*** Log of Labor 0.49 (0.3×10⁻⁴)*** 0.71 (0.0062)*** Log of Main land line penetration 0.14 (0.6×10⁻⁴) *** 0.14 (0.0010)***
Time trend -0.02 (0.1×10⁻⁴) *** -0.01 (0.0001)***
Demand Equation Dep. Variable: Log of main telephone and waiting lines per 100 population
Dep. Variable: Log of main telephone and waiting lines per 100 population
Constant -8.36 (0.0006) *** -8.36 (0.0073)*** Log of GDP per capita 1.18 (0.0001) *** 1.18 (0.0020)*** Log of Main land line subscription price -0.46 (0.9×10⁻⁴) *** -0.46 (0.0026)***
Supply Equation Dep. Variable: Log of total telecom investment
Dep. Variable: Log of total telecom investment
Constant 17.41 (0.0027)*** 17.41 (0.0180)*** Waiting line for main lines (per 100 population)
0.10 (0.0041)*** 0.10 (0.0091)***
Log of Average telephone price 0.10 (0.0009)*** 0.10 (0.0061)***
Change in Telecom Penetration Equation
Dep. Variable: Log of change in main landline penetration over previous year
Dep. Variable: Log of change in main landline penetration over previous year
Constant -0.16 (0.0001)*** -0.16 (0.0018)*** Log of Telecom investment 0.01 (0.6×10⁻⁵)*** 0.01 (0.9×10⁻⁴)***
Number of observations = 256. *** Statistically significant at the one percent level.
10 Note that the estimates of the effect of landlines, mobile phones and all telephone lines are consistent. A 10
percent increase in all phones increases GDP by 1 percent (Table 4); a similar increase in landlines increases GDP by 1.4 percent (Tables 8 and 9), and a 10 percent increase in mobile phone penetration increases GDP by 0.01 percent (Table 10). Thus the combined effect of all telephones is higher than that of mobile phones, but less than that of landlines alone.
Kala Seetharam Sridhar, Varadharajan Sridhar. Telecommunications infrastructure and economic growth: evidence from developing countries
Механізм регулювання економіки, 2009, № 2 110
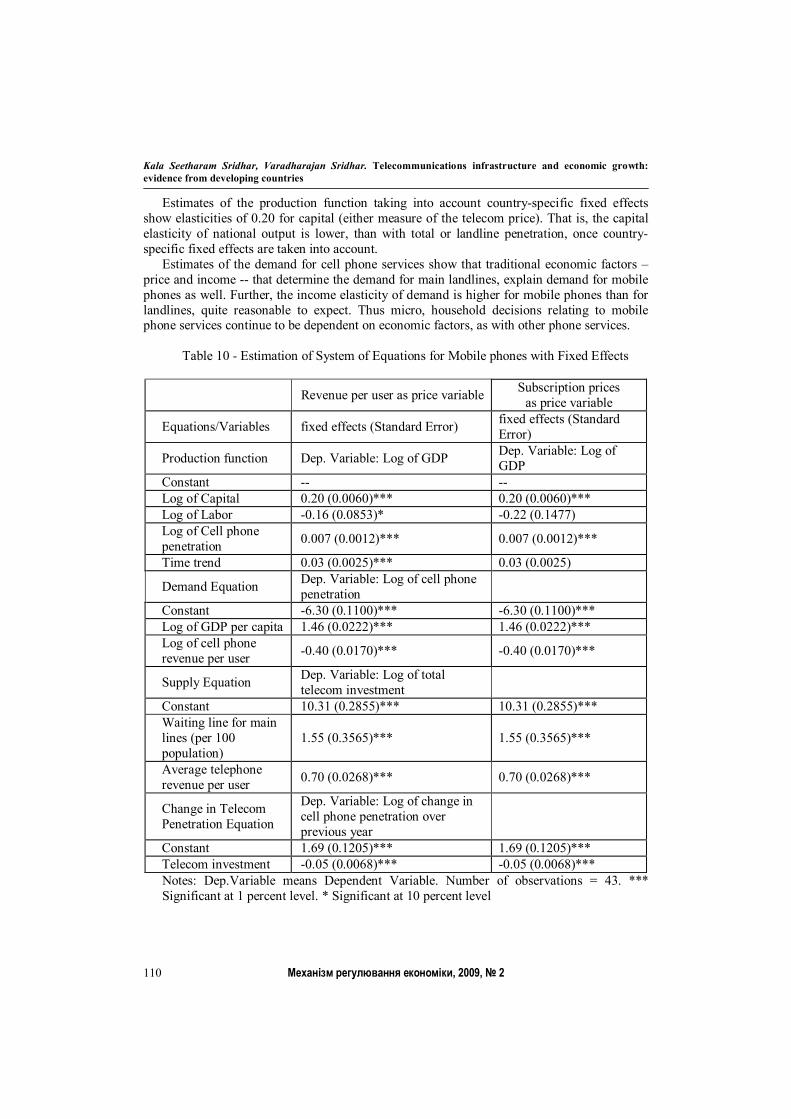
Estimates of the production function taking into account country-specific fixed effects show elasticities of 0.20 for capital (either measure of the telecom price). That is, the capital elasticity of national output is lower, than with total or landline penetration, once country-specific fixed effects are taken into account.
Estimates of the demand for cell phone services show that traditional economic factors – price and income -- that determine the demand for main landlines, explain demand for mobile phones as well. Further, the income elasticity of demand is higher for mobile phones than for landlines, quite reasonable to expect. Thus micro, household decisions relating to mobile phone services continue to be dependent on economic factors, as with other phone services.
Table 10 - Estimation of System of Equations for Mobile phones with Fixed Effects
Revenue per user as price variable Subscription prices as price variable
Equations/Variables fixed effects (Standard Error) fixed effects (Standard Error)
Production function Dep. Variable: Log of GDP Dep. Variable: Log of GDP
Constant -- -- Log of Capital 0.20 (0.0060)*** 0.20 (0.0060)*** Log of Labor -0.16 (0.0853)* -0.22 (0.1477) Log of Cell phone penetration 0.007 (0.0012)*** 0.007 (0.0012)***
Time trend 0.03 (0.0025)*** 0.03 (0.0025)
Demand Equation Dep. Variable: Log of cell phone penetration
Constant -6.30 (0.1100)*** -6.30 (0.1100)*** Log of GDP per capita 1.46 (0.0222)*** 1.46 (0.0222)*** Log of cell phone revenue per user -0.40 (0.0170)*** -0.40 (0.0170)***
Supply Equation Dep. Variable: Log of total telecom investment
Constant 10.31 (0.2855)*** 10.31 (0.2855)*** Waiting line for main lines (per 100 population)
1.55 (0.3565)*** 1.55 (0.3565)***
Average telephone revenue per user 0.70 (0.0268)*** 0.70 (0.0268)***
Change in Telecom Penetration Equation
Dep. Variable: Log of change in cell phone penetration over previous year
Constant 1.69 (0.1205)*** 1.69 (0.1205)*** Telecom investment -0.05 (0.0068)*** -0.05 (0.0068)*** Notes: Dep.Variable means Dependent Variable. Number of observations = 43. *** Significant at 1 percent level. * Significant at 10 percent level
Розділ 2 Інноваційні процеси в економіці
Механізм регулювання економіки, 2009, № 2 111
Estimates of the supply equation for telecom investment when we take into account only mobile phones, show that market potential (waiting lines per 100 population) has a positive influence on its supply. This effect is the same as for all telephone lines and main telephone lines. Both measures of the price – mobile phone revenue per user and subscription prices -- continue to exert the expected positive impact on telecom investment. We estimated the system of equations (all models and specifications) by GMM, but the results were not very different, so we do not report them.
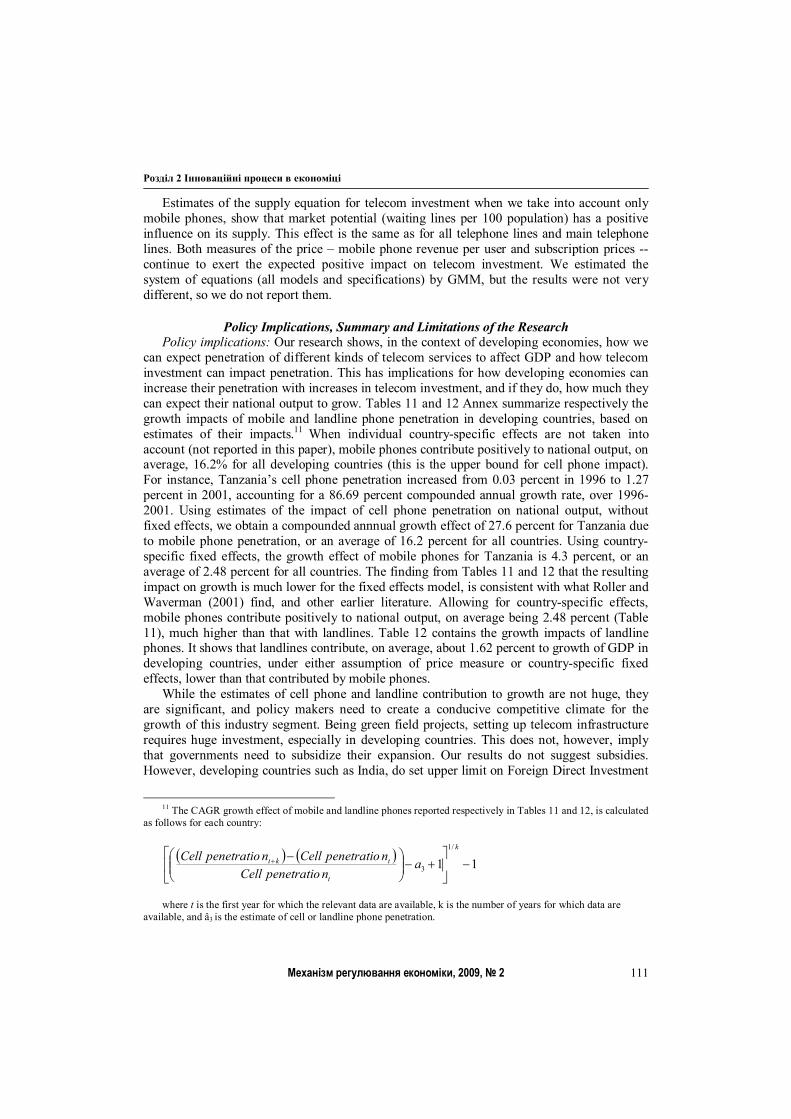
Policy Implications, Summary and Limitations of the Research Policy implications: Our research shows, in the context of developing economies, how we
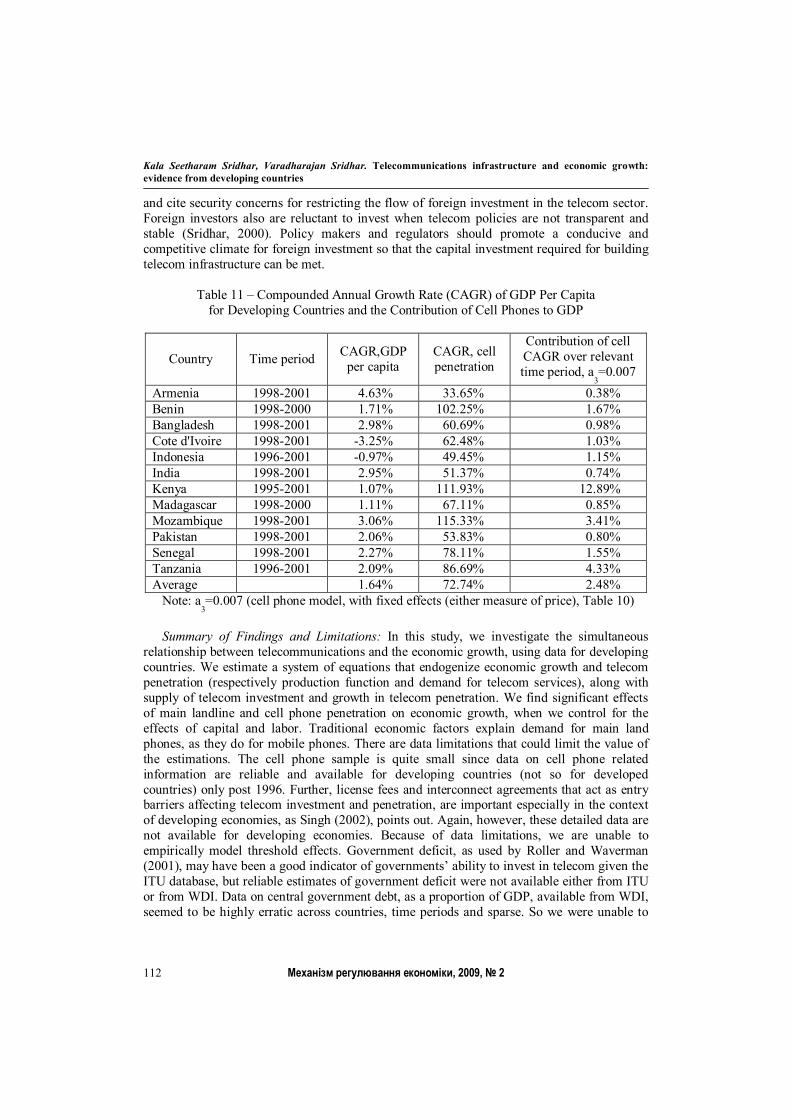
can expect penetration of different kinds of telecom services to affect GDP and how telecom investment can impact penetration. This has implications for how developing economies can increase their penetration with increases in telecom investment, and if they do, how much they can expect their national output to grow. Tables 11 and 12 Annex summarize respectively the growth impacts of mobile and landline phone penetration in developing countries, based on estimates of their impacts.11 When individual country-specific effects are not taken into account (not reported in this paper), mobile phones contribute positively to national output, on average, 16.2% for all developing countries (this is the upper bound for cell phone impact). For instance, Tanzania’s cell phone penetration increased from 0.03 percent in 1996 to 1.27 percent in 2001, accounting for a 86.69 percent compounded annual growth rate, over 1996-2001. Using estimates of the impact of cell phone penetration on national output, without fixed effects, we obtain a compounded annnual growth effect of 27.6 percent for Tanzania due to mobile phone penetration, or an average of 16.2 percent for all countries. Using country-specific fixed effects, the growth effect of mobile phones for Tanzania is 4.3 percent, or an average of 2.48 percent for all countries. The finding from Tables 11 and 12 that the resulting impact on growth is much lower for the fixed effects model, is consistent with what Roller and Waverman (2001) find, and other earlier literature. Allowing for country-specific effects, mobile phones contribute positively to national output, on average being 2.48 percent (Table 11), much higher than that with landlines. Table 12 contains the growth impacts of landline phones. It shows that landlines contribute, on average, about 1.62 percent to growth of GDP in developing countries, under either assumption of price measure or country-specific fixed effects, lower than that contributed by mobile phones.
While the estimates of cell phone and landline contribution to growth are not huge, they are significant, and policy makers need to create a conducive competitive climate for the growth of this industry segment. Being green field projects, setting up telecom infrastructure requires huge investment, especially in developing countries. This does not, however, imply that governments need to subsidize their expansion. Our results do not suggest subsidies. However, developing countries such as India, do set upper limit on Foreign Direct Investment
11 The CAGR growth effect of mobile and landline phones reported respectively in Tables 11 and 12, is calculated
as follows for each country:
11/1
3
k
t
tkt anpenetratioCell
npenetratioCellnpenetratioCell
where t is the first year for which the relevant data are available, k is the number of years for which data are
available, and â3 is the estimate of cell or landline phone penetration.
Kala Seetharam Sridhar, Varadharajan Sridhar. Telecommunications infrastructure and economic growth: evidence from developing countries
Механізм регулювання економіки, 2009, № 2 112
and cite security concerns for restricting the flow of foreign investment in the telecom sector. Foreign investors also are reluctant to invest when telecom policies are not transparent and stable (Sridhar, 2000). Policy makers and regulators should promote a conducive and competitive climate for foreign investment so that the capital investment required for building telecom infrastructure can be met.
Table 11 – Compounded Annual Growth Rate (CAGR) of GDP Per Capita
for Developing Countries and the Contribution of Cell Phones to GDP
Country Time period CAGR,GDP per capita
CAGR, cell penetration
Contribution of cell CAGR over relevant time period, a
3=0.007
Armenia 1998-2001 4.63% 33.65% 0.38% Benin 1998-2000 1.71% 102.25% 1.67% Bangladesh 1998-2001 2.98% 60.69% 0.98% Cote d'Ivoire 1998-2001 -3.25% 62.48% 1.03% Indonesia 1996-2001 -0.97% 49.45% 1.15% India 1998-2001 2.95% 51.37% 0.74% Kenya 1995-2001 1.07% 111.93% 12.89% Madagascar 1998-2000 1.11% 67.11% 0.85% Mozambique 1998-2001 3.06% 115.33% 3.41% Pakistan 1998-2001 2.06% 53.83% 0.80% Senegal 1998-2001 2.27% 78.11% 1.55% Tanzania 1996-2001 2.09% 86.69% 4.33% Average 1.64% 72.74% 2.48%
Note: a3=0.007 (cell phone model, with fixed effects (either measure of price), Table 10)
Summary of Findings and Limitations: In this study, we investigate the simultaneous
relationship between telecommunications and the economic growth, using data for developing countries. We estimate a system of equations that endogenize economic growth and telecom penetration (respectively production function and demand for telecom services), along with supply of telecom investment and growth in telecom penetration. We find significant effects of main landline and cell phone penetration on economic growth, when we control for the effects of capital and labor. Traditional economic factors explain demand for main land phones, as they do for mobile phones. There are data limitations that could limit the value of the estimations. The cell phone sample is quite small since data on cell phone related information are reliable and available for developing countries (not so for developed countries) only post 1996. Further, license fees and interconnect agreements that act as entry barriers affecting telecom investment and penetration, are important especially in the context of developing economies, as Singh (2002), points out. Again, however, these detailed data are not available for developing economies. Because of data limitations, we are unable to empirically model threshold effects. Government deficit, as used by Roller and Waverman (2001), may have been a good indicator of governments’ ability to invest in telecom given the ITU database, but reliable estimates of government deficit were not available either from ITU or from WDI. Data on central government debt, as a proportion of GDP, available from WDI, seemed to be highly erratic across countries, time periods and sparse. So we were unable to
Розділ 2 Інноваційні процеси в економіці
Механізм регулювання економіки, 2009, № 2 113
use a good measure of this indicator to determine the supply of telecom investment. We were unable to use a dummy for regulatory market structure, relevant for the supply equation, since time-series data on them were not available. Finally, land area of countries is relevant for determining the extent of changein telephone penetration, but is mostly time-invariant. Hence we were unable to use this variable in the models, especially those with country-specific fixed effects in our panel data models. More robust estimation is possible with access to better data.
Table 12 – Compounded Annual Growth Rate (GR) of GDP Per Capita for Developing
Countries and the Contribution of Main line Phones to GDP (%)
Country Period GR, GDP
GR LP CM Country Period GR,
GDP GR LP CM
Armenia 94-01 5.91 -1.52 -0.20 Mauritania 91-99 1.47 8.94 1.69 Benin 93-00 2.35 11.37 2.11 Malawi 91-92 -4.99 3.08 0.44 Bangladesh 93-01 2.95 7.96 1.50 Niger 91-95 -2.16 4.56 0.69 Cote d'Ivoire 91-01 -0.25 10.55 2.19 Nigeria 91-98 1.31 3.94 0.61 Cameroon 91-97 -1.97 7.16 1.17 Nicaragua 91-97 0.70 14.36 2.70 Congo, Rep. 91-94 -4.27 3.53 0.51 Pakistan 91-01 1.28 8.39 1.67 Ethiopia 91-01 1.92 4.76 0.80 Senegal 91-01 1.31 12.98 3.08
Ghana 99-01 3.61 56.96 11.90 Sierra Leone 92-96 -0.26 5.23 0.80
Gambia 91-95 -1.16 10.97 1.84 Chad 92-97 -2.22 7.82 1.29 Indonesia 91-01 1.99 15.46 4.01 Togo 91-01 -0.88 12.31 2.85 India 91-01 3.75 16.95 4.62 Tanzania 91-01 0.75 4.19 0.70 Kenya 92-01 -0.46 2.41 0.37 Uganda 91-98 2.79 5.95 0.99 Kyrgyz Rep. 95-01 3.25 -0.22 -0.03 Ukraine 92-99 -8.05 4.00 0.63 Lesotho 91-00 2.53 6.91 1.12 Yemen 91-98 1.22 5.07 0.79 Moldova 94-01 -1.12 1.87 0.28 Zambia 91-97 -1.35 0.00 0.00 Madagascar 91-00 1.20 3.66 0.57 Zimbabwe 91-00 -0.13 6.52 1.14 Mozambique 91-01 3.91 3.22 0.52 Average 0.45 8.16 1.62
GDP =GDP per capita, LP=Landline penetration, CM=Contribution of Mainlines to GDP; a
3=0.14; a
3=0.14 (Estimate with or without fixed effects (either measure of price), Tables 8
and 9)
Concluding Remarks Everything said and done, there is no doubt regarding the fact that most of the developing
economies have leap-frogged in cellular telephony as a quick and inexpensive way of increasing telecom penetration. Most of these economies have significantly deregulated their telecom sector, and invest86ment to increase telecom penetration (especially using the wireless services) does not seem to be the big issue any more. The big question that continues to haunt many of these economies is how improved ICT and telecom infrastructure can be used to accelerate their economic growth and alleviate poverty. This, it may be realized, is largely possible only by reducing the digital divide, and empowering residents of developing countries through information regarding prices, job opportunities, and markets. This is not a substitute for actual economic growth, and also may not offset negative economic effects caused by overarching exogenous shocks, but a good enabler for economic growth to trickle down, once it occurs.
Kala Seetharam Sridhar, Varadharajan Sridhar. Telecommunications infrastructure and economic growth: evidence from developing countries
Механізм регулювання економіки, 2009, № 2 114
1. Alleman, J., Hunt, C., Michaels, D., Mueller, M., Rappaport, P., & Taylor, L. [2002]. Telecommunications and economic development: Empirical Evidence from South Africa. Technical report. International Telecommunication Society, Sydney. http://www.colorado.edu/engineering/alleman/print_files/soafrica_paper.pdf
2. Bayes, A., Braun, J.V., & Akhter, R. [1999]. Village pay phone and poverty reduction: Insights from a Grameen Bank initiative in Bangladesh. Center for Development Research (AEF), Universitat Bonn, Bonn, Germany, Discussion papers on development policy No. 8. http://www.zef.de/publications.htm.
3. Chatterjee, S., Thachenkary, C.S., & Katz, J.L. [1998]. Modeling the Economic Impacts of Broadband Residential Services. Computer Networks & ISDN Systems 30(14): 1295-1310.
4. Cronin, F.J., Parker, E.B., Colleran, E.K., & Gold, M.A. [1991]. Telecommunications infrastructure and economic growth: An analysis of causality. Telecommunications Policy (December): 529-535.
5. Cronin, F.J., Parker, E.B., Colleran, E.K., & Gold, M.A. [1993a.] Telecommunications infra-structure investment and economic development. Telecommunications Policy (August): 415-430.
6. The Economist, The real digital divide, Mar 10th 2005, (accessed August 12, 2005). http://www.economist.com/printedition/displaystory.cfm?Story_ID=3742817
7. Eggleston, K., Jensen, R., & Zeckhauser, R. [2002]. Information and communication technologies, markets, and economic development. Department of Economics working paper, Tufts University. (RePEc:tuf:tuftec:0203)
8. Garbade, K. D., & Silber, W.L. [1978]. Technology, communication and the performance of financial markets: 1840-1975. Journal of Finance 33 (3): 819-831.
9. Gourieroux, C., Monfort, A., & Trognon, A. [1984]. Pseudo Maximum Likelihood Methods: Applications to Poisson Models. Econometrica 52: 701-720.
10. Greene, William. [2000]. Econometric Analysis. New Jersey: Prentice-Hall. 11. Gurbaxani, V. [1990]. Diffusion in Computing Networks: The Case of Bitnet. Communications of
the ACM, December, 33(12), 65-75. 12. Hardy, A. [1980]. The role of the telephone in economic development. Telecommunications Policy.
4(4): 278-286. Infodev. [2003]. ICT for Development: Contributing to Millennium Development Goals: Lessons Learned from 17 infodev Projects. Washington, DC, U.S.A.: World Bank. www.infodev.org (accessed Aug 1, 2005).
13. International Telecommunications Union (ITU). [2003a.] Year Book of Statistics: Telecommunication Services. Geneva, Switzerland: ITU.
14. Jain, P., & Sridhar, V. [2003]. Analysis of Competition and Market Structure of Basic Telecommunication Services in India. Communications & Strategies. 52 (4): 271-293.
15. Jha, Raghbendra, & Majumdar, Sumit. [1999]. A Matter of Connections: OECD Telecommunications Sector Productivity and the Role of Cellular Technology Diffusion. Information Economics and Policy 11: 243-69.
16. Jhunjhunwala, A. [2000]. Unleashing Telecom and Internet in India. India Telecom Conference, Asia/Pacific Research Center, Stanford University. http://www.tenet.res.in/papers/unleash.html (accessed March 3, 2003.)
17. Kim, D.H., Juhn, Jae-Ho., & Ha, Won-Gyu. [1997]. Dynamic Modeling of Competitive On-line Services in Korea. System Dynamics: An International Journal of Policy Modeling 9 (2): 1-23.
18. Leff, N.H. [1984]. Externalities, Information costs, and Social Benefit-Cost Analysis for Economic Development: An Example from Telecommunication. Economic Development and Cultural Change 32(2): 255-276.
19. Norton, S.W. [1992]. Transaction Costs, Telecommunications, and the Microeconomics of Macroeconomic Growth. Economic Development and Cultural Change 41(1): 175-196.
20. Parker, S. (2005), Wireless technology helping to shrink digital divide, Voice of America, May. http://www.voanews.com/english/2005-05-06-voa57.cfm. (accessed August 12, 2005).
21. Rai, A., Ravichandran, T., & Samaddar, S. (1998). How to Anticipate the Internet’s Global Diffusion. Communications of the ACM, October, 41(10), 97-106.
22. Rogers, E. (1983). Diffusion of Innovations, New York, NY: Free Press.
Розділ 2 Інноваційні процеси в економіці
Механізм регулювання економіки, 2009, № 2 115
23. Roller, L.H. & Waverman, L. [2001]. Telecommunications infrastructure and economic development: A simultaneous approach. American Economic Review 91 (4): 909-923.
24. Souter, D. [1999]. The Role of Information and Communication Technologies in Democratic Development. Info: Journal of Policy, Regulation, and Strategy for Telecommunications Information and Media 1 (5) October: 405-417.
25. Sridhar, V. [2000]. Create FDI-friendly conditions in Telecom. http://www.economictimes.com (accessed December 11, 2000).
26. Sridhar, V. [2003]. Tariff Forbearance for Competition, Economic Times, http://www.economictimes.com (accessed May 19, 2003).
27. Sridhar, Kala S., & Sridhar, V. [2003]. The Effect of Telecommuting on Suburbanization: Empirical Evidence, Journal of Regional Analysis and Policy 33 (1), 2003: 1-25.
28. Sridhar, V., Rameshan, P., & Sahadevan, K.G. [2000]. Indian Telecom: Analysis of Pricing, Technology & Policy, IIML Monograph Series 01. Indian Institute of Management, Lucknow.
29. Singh, Nirvikar, 2002. “Information Technology as an Engine of Broad-Based Growth in India,” in The Knowledge Economy in India, ed. Frank-Jürgen Richter and Parthasarathi Banerjee. London: Palgrave Macmillan.
30. Waverman, Leonard, Meschi, M., & Fuss, M. [2005]. The Impact of Telecoms on Economic Growth in Developing Countries, Vodafone Policy Paper Series 2 (March): 10-23.
31. Wong, Poh-Kam. [2002]. ICT Production and Diffusion in Asia: Digital Dividends or Digital Divide? Information Economics and Policy 14: 167-187.
32. World Bank. [2003]. World Development Indicators Online (WDI Online), 2003. Washington, DC: World Bank. http://www.worldbank.org (accessed May 2004).
33. World Economic Forum. The Global Information Technology Report, 2003-04. Geneva, Switzerland: World Economic Forum. www.weforum.org/
34. On line Annex at the journal web site: http://www.usc.es/economet/eaa.htm.
Received 29.04.2009
Кала Сітхарам Срідхар, Варадхараян Срідхар Телекомунікаційна інфраструктура та економічне зростання:
досвід країн, що розвиваються У роботі на основі емпіричного аналізу розглядаються питання взаємозв’язків між рівнем
телефонізації та економічним зростанням в країнах, що розвиваються. Використовуючи трьох ступеневий метод найменших квадратів в статті оцінюється система рівнянь котра включає показники економічного зростання та рівень телефонізації країни. Показується, що традиційні фактори попиту (доходи, мотивація, ін.) пояснюють попит як на традиційний (стільниковий) так і на мобільний зв'язок. При моделюванні економічного зростання запропоновано використовувати функцію Коба-Дугласа, з такими головними пояснюючими змінними як зайнятість населення та рівень капіталізації країни (капітал на душу населення). Крім традиційних факторів доходів та зайнятості до моделі було включено і нові: рівні телефонізації (стільниковий та мобільний), використання мережі Інтернет, а також часові змінні. Дослідження було проведено для більш як тридцяти країн за період часу з 1991-2001 роки (кількість країн, так же як і часовий період відрізняються в роботі в залежності від моделі яка використовується і наявної інформації). Перехідні економіки та країни, що розвиваються були проранговані за допомогою індексу розвитку телекомунікайної мережі, найкращі показники виявилися в Індії - найгірші в Республіці Чад. В роботі доведено, що як провідниковий так і мобільний зв'язок позитивно пов’язаний з ростом національного доходу. Рівень статистичної значущості економетричних показників по моделях економічного зростання знаходиться на досить високому рівні. Середні показники надійності статистичних оцінок знаходяться в 95% інтервалі надійності, що говорить про правильну специфікацію вибраних моделей.
Kala Seetharam Sridhar, Varadharajan Sridhar. Telecommunications infrastructure and economic growth: evidence from developing countries
Механізм регулювання економіки, 2009, № 2 116
Незначними недоліками роботи, котрі могли вплинути на точність розрахунків є обмеження інформації в часі для мобільного зв’язку для країн, що розвиваються. Інформація про рівні телефонізації мобільним зв’язком країн, що розвиваються доступні лише після 1996 року. Крім того, статистична інформація про ліцензовані платежі і плату за підключення також не доступна для країн, що розвиваються. В наслідок чого як eконометричні оцінки так і значущість показників можуть змінюватися з використанням більш повних даних і за більший часовий період. Більш точні розрахунки можуть бути виконані з використанням повнішої статистичної інформації.
Значним питанням, що потребує вирішення пошук шляхів вдосконалення використання інформаційного та телекомунікаційного секторів для стимулювання економічного зростання в країнах, що розвиваються. Використання інформаційних та телекомунікаційних технологій не вирішить всі проблеми з бідністю та економічним зростанням, а розглядається як фактор, котрий сприяє пришвидшенню темпів не лише економічного зростання, але й економічного розвитку країни. Авторами зроблено пропозиції по вдосконаленню рівня телекомунікацій в країнах, що розвиваються. Запропоновано шляхи вирішення проблемних питань пов’язаних зі стимулюванням економічного зростання в країнах, розвиваються.
Ключові слова: економічне зростання, зворотній зв’язок, країни, що розвиваються, телекомунікації, телефони.