Embed Size (px)
Citation preview

Telecommunications Industry UpdatePresentation to WTA
Frank GallagherColorado Springs, ColoradoSeptember 13, 2016

2
Overview
September 2016WTA 2016 Fall Meeting
Purpose
▫ Snapshot of industry fundamentals
▫ Summary of financial impact of regulatory trends
▫ Perspectives on sustainable, constructive strategic directions
Background perspective
▫ Investment banker
▫ Strategic advisory services
Four messages
▫ Industry fundamentals and valuations suffering ongoing pressure
▫ Regulatory changes are driving major RLEC strategic change
▫ Strongest companies across the industry are concentrating on scale, growth, diversification and higher-value services
▫ RLECs will be required to increasingly focus on long-term strategic value improvement and evolution of the business plan

3
September 2016WTA 2016 Fall Meeting

4
Telecom Trends at a Glance
Industry continues to go through a fundamental transformation from voice to data
Year-over-year (“YoY”) access line loss rates have been “stable” for the last two years
▫ The five large public RLECs reported average line loss of -3.8% in 2Q16
▫ ≈50% of US households had landline voice service at YE 2015, down from 92% at YE 2004
Broadband subscribership declined in 2Q16
▫ Average YoY subscribers declined by -1.7% in 2Q16
▫ Revenue generating units (access lines, high-speed data, and video subs) continue to decline
Cable MSOs reported slightly declining RGUs of 0.3% for 2Q16 (largely due to Cable One and WOW!)
RLEC RGU decline improved compared to prior quarters and was -1.9% in 2Q16
YoY large carrier revenue change was -1.2% in 2Q16 compared to -0.9% in 1Q16
▫ CenturyLink reported the only top line revenue growth among the RLECs (excluding acquisitions)
EBITDA(1) margins (a measure of operating cash flow) under pressure
▫ Median industry EBITDA margin held steady at 34.5% in 2Q16
▫ EBITDA margins declined for the five large carries held steady
September 2016WTA 2016 Fall Meeting
Source: Company filings, Wall Street Equity Research, and press releases(1) EBITDA is defined as Earnings Before Interest, Taxes, Depreciation, and Amortization

5
Broadband Data and Video Trends
Cable continues to dominate broadband customer additions
▫ YoY net adds of 3.3M for cable and -140K for RLECs in 2Q16
▫ Cable sub growth of 6.8% in 2Q16
▫ Telco sub decline of -1.7% in 1Q16
▫ Cable broadband market share is approaching 66%
▫ ≈79% of US households get broadband service at home, up from 20% in 2004
Cable continues to take share from DSL; FiOS and U-verse account for ≈60% of telco broadband subs
Cable broadband subs (48.2 million) exceed video subs (41.4 million)
Relatively stable competitive dynamics in spite of rising prices
▫ Video subscriber losses continued in 2Q16
▫ Cable lost 400K subscribers YoY, while AT&T and Verizon added subscribers
▫ Cable revenue growth (2.6%) as well as EBITDA growth positive (4.8%) in 2Q16
Pay TV RGUs continue to decline (-0.3% in 2Q16); subs have declined since 4Q09
▫ Approximate video market share: cable 52%, satellite 36%, telco 12%
Broadband Data
Video
Source: UBS Equity Research, and company data
September 2016WTA 2016 Fall Meeting

6
Illustration of an ILEC Strategic Assessment
Strategic assessment of an ILEC that relied on state and federal regulation
▫ Changed illustration to preserve confidentiality for client
▫ Operates two ILECs with modest other non-regulated services
▫ Original model reflects virtuallyunchanged revenues and costs over projection period
Modified analysis assumed . . .
▫ 1% annual regulated revenue declines
▫ 100 basis point annual decline in margin
▫ Assumed 15% EBITDA multiple contraction annually from 5.0x in 2015 to 4.24x in 2034
▫ Comparison of valuation at present with valuation contraction if no strategic change
Conclusion: strategic initiatives necessary, based on current operations, or divest
September 2016WTA 2016 Fall Meeting

7
Wireless Industry Update and Trends
Source: Company filings, UBS Equity Research, Bank of America Merrill Lynch Research, and press releases
September 2016WTA 2016 Fall Meeting
Primary Trends
AT&T & Verizon remain dominant carriers controlling ≈66% of subs• Sprint and T-Mobile each hold ≈15% shares
Current battlefield is mobile video 5G launches expected for 2020 and capex is moving toward this event
SubscribersConnection growth rate slowing as penetration exceeds 100%All major carriers experience net subscriber gains in 2Q16 Postpaid subscribership increased ≈4.0% YoY ≈19% of wireless subs are prepaid
ARPU and Data
Sector ARPU declined by 7.0%, compared to a 6.3% decline in 2Q16• Aggressive service discounts and phone payment plans
T-Mobile declined by 3.9% (best) while Verizon declined by 9% (worst) Increasing demand driving data growth
Devices ≈75% of handset sales on equipment installment plans (EIP)• EIP devices represent ≈53% of postpaid subscribers
88% smartphone penetrationConnected device net adds continue to outpace smartphones
Financials Service revenue declined for AT&T, VZW, and Sprint T-Mobile was the only company to grow at 9.1%Average national carrier EBITDA margin increased in 2Q16• Growth reflects the change to EIP device sales
-10%
-5%
0%
5%
10%
15%
1Q13 1Q14 1Q15 1Q16
Total Service Revenue Growth
Service ARPU Growth
EBITDA Margin
-15%
-10%
-5%
0%
5%
1Q13 1Q14 1Q15 1Q16
0%
10%
20%
30%
40%
50%
1Q13 1Q14 1Q15 1Q16

8
September 2016WTA 2016 Fall Meeting

9
Assessing the RLEC Timeline from Telecom Act to Present
Long-term trends
▫ Movement toward models with assumptions, creating winners and losers
▫ “Sufficient and predictable” support is shifted to a capped budget
▫ Loss of political and intellectual “bench” in legislative and regulatory bodies
▫ Federal trends are influencing state outcomes
▫ Less predictability and fracturing of high-cost system
▫ Revision to the allowed federal rate of return
September 2016WTA 2016 Fall Meeting
1996
Telecom ActSection 254
2000
Rural Task Force affirms RLEC
diversity and use of embedded
costs
2001
Rural reforms of ICC/USF based
on assumed diversity
2011
FCC reforms of USF/ICC
2015/2016
FCC work on rural mechanisms and models / ROR

10
Notable Recent Developments
FCC is pushing for models to “simplify” the regime, but winners accepting the model will put pressure on overall funding
FCC has reduced the federal allowed rate of return
▫ Reduction of ROR level to 9.75% v. the current 11.25%, lowered annually by 0.25%
▫ Likely to affect subsequent state processes where commissions/legislatures are limited
Trade organizations working with FCC on A-CAM (alternative CAF model)
▫ Cost consultants developing forecasting models using current A-CAM model
▫ Precise returns are not yet clear
▫ “Political” problem is that the rural coalition’s interests are splintering
No movement on the contribution mechanism
Potential for increased municipal broadband activity
Legal challenges to key “reforms” and orders
September 2016WTA 2016 Fall Meeting

11
Projecting the Future Based on Federal Trends
Not possible to predict future of rural regulation with certainty but . . .
▫ Support funding is not likely to grow appreciably, and more likely will fall short of emerging obligations
▫ Again, new regulation is reducing the effective lobby power of rural carriers
▫ Political and regulatory support will likely weaken further
Rural model is changing
▫ From voice-centric services to data-centric services
▫ From predictable regulatory support systems to lesser or unpredictable regimes
▫ From low-cost capital to higher-cost (higher-risk) capital
▫ From primarily residential services to growing percentage of business/carrier services
Strategic model of the future
▫ Relies on no/lower regulatory support mechanisms
▫ Becomes less uniform in terms of services to low-cost versus high-cost customers
▫ Requires defensible network and services versus competitors
▫ Increases the need for cost and capital management
▫ Rewards companies that identify and execute on a clearly-defined strategic plan
September 2016WTA 2016 Fall Meeting

12
September 2016WTA 2016 Fall Meeting

13
Telco Strategic Approaches
Strategic approaches to …▫ Increase scale of ops & revenue base in target markets; almost always foundational▫ Enhance strategic flexibility and optionality to improve long-term viability▫ Reduce reliance on support and voice revenues
Pure-play telco transactions are important but often transitional strategic steps
Common transaction criteria within the industry include▫ Focus on sustainable data-centric services (Internet, transport, and fiber-to-tower)▫ Meaningful synergy/cost saving opportunities ▫ Strong growth and/or diversification potential ▫ High-quality, well-positioned network▫ Reasonable price relative to strategic value (cash-flow accretive)▫ Positive impact on overall financial position
Increase scope and scale of landline operations through M&A
Rationalize cost structures over a larger revenue base
Increase Scope & Scale
Reduce regulatory exposure
Geographic diversification
Expand network assets and business lines-CLEC & fiber
Enter business services-data centers, managed services, cloud services
Diversification
Grow telco scope and scale
Simultaneously pursue business diversification
Hybrid
September 2016WTA 2016 Fall Meeting

14
Every Large Carrier is Engaged in a Dramatic Transformation
M&A activity allows us to discern strategic thinking of companies
▫ Companies re-position through divestitures, acquisitions, partnerships, JVs, etc.
▫ Major strategic change is a consistent pattern over time
▫ Most often accelerates when there are fundamental new industry forces
Focus on larger carriers with lessons for smaller carriers
▫ Large carriers have opportunities that are different from those at RLECs
▫ Large-carrier M&A is instructive and creates “movement” that may offer opportunities for RLECs
Small carriers are contending with essentially the same forces as large carriers
▫ Similar migrations to diversity and gain scale
▫ RLECs have more meaningful regulatory risk
A principle can be articulated for a fundamentally changing industry▫ A proactive transformative strategy is needed in such an industry,
▫ To continuously increase the scale/scope of operations,
▫ With a view to supporting better market control, and flexible options,
▫ While stabilizing and/or improving company valuation
September 2016WTA 2016 Fall Meeting

15
CenturyLink
Pattern in M&A and strategic activity
▫ More than two decade history of major and transformative acquisitions of wireline assets
▫ Extraordinary team whose skill set is acquisitions
▫ Improve properties and generate better revenues
▫ Recent thrust toward diversification
Strategic goals
▫ Conservative capitalization to preserve ability to acquire in a timely way
▫ Recent acquisitions have been stock-for-stock
▫ Gain wireline scale which provides strategic flexibility and optionality
▫ Improve and upgrade plant, notably in defensible markets
▫ Increased exposure to more competitive urban / suburban markets where competition is “more mature”
▫ More enterprise data centric
▫ Focused on regaining revenue growth
September 2016WTA 2016 Fall Meeting
16
CenturyLink
CenturyLink has undergone a focused and remarkable transformation
Significant acquisition history, but transformative acquisitions since 2008
▫ Embarq – 7.5 million access lines
▫ Qwest – 10.3 million access lines
▫ Savvis – $3.2 billion for data services
September 2016WTA 2016 Fall Meeting
Source: Company filings, press releases, and Charlesmead analysis
68% legacy telecom to 38%

17
Frontier Communications Corp.
Pattern in M&A and strategic activity
▫ Long history of acquisitions of wireline assets to gain scale
▫ No apparent geographic limitations
▫ Focus on broadband-ready plant and “lead with broadband” services
Strategic goals
▫ Gain wireline scale which provides strategic flexibility and optionality while leveraging core competencies
We “like the scale deals because they involve businesses that we know, that we run today. . . We know what the underlying operating issue are. We know what the economics are.”
▫ Drive cash flow growth through scale economies and enhanced operating efficiency
▫ Revenue and customer stability / growth through increased market share in underserved acquired markets (80% broadband share in residential markets; 83% of households can get 6 Mbps and 55% can get 20 Mbps)
▫ Increased exposure to more competitive urban / suburban markets
September 2016WTA 2016 Fall Meeting

18
Frontier Communications Corp.
Tracking strategic progress and transformation
▫ Serve 29 states across the U.S. post-acquisition of VZ ops in CA/TX/FL
▫ Significant ongoing growth in customer base through wireline acquisitions
Acquired and integrated operations with approx. 2.5 million RGUs (no video) by YE 2006
Prior to VZ CA/TX/FL deal, approx. 6.9 million RGUs (incl. AT&T CT ops)
Pro forma for CA/TX/FL approx. 13.9 million RGUs (incl. 1.8 million video subs)
▫ Post-acquisition pro forma revenues approx. $11.7 billion, up from $2.0 billion at YE 2006
September 2016WTA 2016 Fall Meeting
21% data/internet to 42%

19
Consolidated Communications
Pattern in M&A and strategic activity
▫ History of acquiring wireline assets to gain scale
▫ Acquisitions often include diversification opportunities
▫ No apparent geographic limitations; focus on relatively sizeable opportunities resulting in “clusters” across the U.S. (CA, IL, KS, TX, PA, MN/IA) with some critical mass
▫ Emphasis on video / IPTV and broadband plant that is video-capable
▫ Significant focus on fiber-rich targets
Strategic goals
▫ Gain wireline scale which provides strategic flexibility and optionality while leveraging core competencies; expand platform for future opportunities
▫ Drive cash flow growth through scale economies and enhanced operating efficiency
▫ Increased exposure to more competitive urban / suburban markets
▫ Reduce reliance on regulatory revenue streams
September 2016WTA 2016 Fall Meeting

20
Consolidated Communications
September 2016
Source: Company filings, press releases, and Charlesmead analysis
WTA 2016 Fall Meeting
9% broadband/data/internet to 51%
Tracking strategic progress and transformation
▫ Multiple operating clusters in seven states across the U.S.; larger, more diversified
▫ Emphasis on business, fiber (regional networks, FTTT), and data services
Data/internet/broadband has grown from 9% of revenues in 2005 to approx. 51% in 2015
Pro forma for Enventis, 78% of revenues from business and broadband services
Voice revs are approx. 40% of total from approx. 80% in 2005
21
BHT Holdings Acquires Tri County Telephone Association
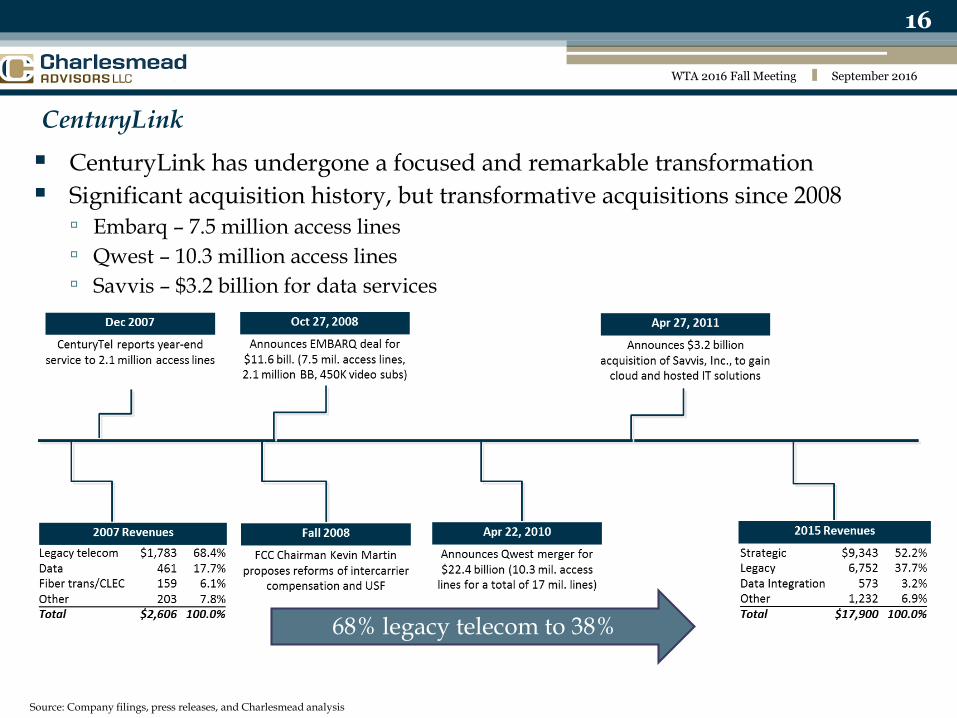
Announced: September 19, 2014
Target: Tri County Telephone Association, Inc., a Wyoming cooperative association
Buyer: BHT Holdings, Inc., a privately-held Wyoming corporation
Price: $46 million, including $29 million in cash payments to cooperative members, retirement of debt, commitments to network enhancements, and rate reductions
Valuation Metrics: Not disclosed
Closed: December 31, 2014
September 2016WTA 2016 Fall Meeting
Charlesmead Advisors provided valuation analyses to TCT in this transaction.
Tri County Telephone Service Territory
Strategic Import▫ Unique “privatization” of a cooperative▫ Operating focus potentially more aligned
with competitive markets▫ Greater strategic flexibility in pursuing
growth opportunities▫ Incentives aligned with value creation
Source: Tri County Telephone Association & BHT Holdings, Inc.

22
Ritter Communications Acquires Millington Telephone Co.
September 2016WTA 2016 Fall Meeting
Announced: September 25, 2012
Target: Millington Telephone Company, Inc. and Millington CATV, Inc.
Buyer: Ritter Communications Holdings, Inc.
Price: Not disclosed
Valuation: Not disclosed
Closed: December 11, 2012
Charlesmead Advisors served as exclusive financial advisor to Ritter Communications in this transaction.
Source: Ritter Communications press release
Strategic Import▫ Enhanced scope & scale▫ Further diversification into CATV▫ Increased exposure to more urban markets
(Memphis)
Combined Service Territory Map
Fayetteville
Fort Smith
Little Rock
Hot Springs
MemphisSomerville
Brownsville
BlythevilleJonesboro
MarkedTree
MountainHome
Millington
Ritter Counties Served
Ritter Fiber Network
Millington Service Territory
Interstate Highways
Legend

23
EATEL Acquires Vision Communications and Venyu Solutions
September 2016WTA 2016 Fall Meeting
Vision Communications
▫ Announced: September 20, 2011
▫ Closed: January 5, 2012
▫ Price: Undisclosed
▫ Assets: Headquartered in Larose, Vision serves residential and commercial customers in central and southern Lafourche and southern Jefferson Parishes; ≈9,850 access lines
Venyu Solutions
▫ Closed: August 31, 2013
▫ Price: Undisclosed
▫ Assets: Venyu is a national provider of data center, managed hosting, cloud, virtualization, and data protection solutions
Strategic Import▫ Enhanced scope & scale▫ Diversification into CATV & data
centers/managed services▫ Reduced regulatory exposure▫ Geographic diversification – telco and data
centers
EATEL Pro Forma Service Territory
Charlesmead Advisors served as exclusive financial advisor to EATEL in these transactions.
Source: EATEL Corporation
EATEL Markets
Vision Markets
Venyu Facilities
Legend
`

24
Internet Infrastructure - Selected Carrier Investments
September 2016WTA 2016 Fall Meeting
> Comporium has been the principal investor since founding in 2007
> Operates four data centers in South Carolina providing an integrated suite of managed services/infrastructure solutions for business applications
> Services include colocation, dedicated Internet access, data backup & recovery, network monitoring, virtualized dedicated services, and security
> Acquired 2012: Two data centers and disaster recovery space located within a 120,000 square foot facility in Winston-Salem, North Carolina; 30,000 square-foot facility in Raleigh; currently expanding into Charlotte
> Remote hands, cloud services, managed database, firewall, VPNs, data protection, advanced server, desktop, network, and application monitoring
> Formed through the combination of several acquisitions
> Vital Support Systems (Des Moines) – June 2012. Three data centers totaling 130,000 sq. ft. in Madison; Des Moines and Cedar Falls, IA
> OneNeck IT Services (Scottsdale) – June 2011: leading hosted application management and MSP offering a suite of ERP outsourcing solutions
> VISI (Twin Cities) acquired March 2010. Operates two data centers and over 70,000 gross square feet; serving 10,000 business and residential customers
> Acquired 2013: Operates data center facilities in Baton Rouge and Shreveport-Bossier City, Louisiana; currently expanding operations
> Offers cloud hosting, colocation, managed hosting, colocation hosting, cloud backup, and disaster recovery
ILEC Data Center Description
Source: Company filings, press releases, and investor presentations.
BLM Acquisition Corp.
> Acquired June 2015 by 32 rural telcos from Catalyst Investors
> Plan to provide telecom, broadband, and IT services to suburban and rural populations throughout the United States

25
September 2016WTA 2016 Fall Meeting

26
Illustrative Strategy Based on Value Creation
September 2016WTA 2016 Fall Meeting
Current and next slide highlight strategic “logic”
This initial slide outlines illustrative assumptions
▫ No change in business growth rates
▫ No change in valuation multiples
▫ Percentage contribution from illustrative segment revenues
▫ ILEC plus end-user broadband (DSL/fiber) in illustration starts at 65% of total revenues
▫ Goal is to change the telco’s underlying valuation, not through passive financial investments, but through strategic investments in core businesses supporting customer-enterprises and data services
Assumed % of Yr 0
revenues
Assumed annual
revenue growth
EBITDA
margins
EBITDA as %
of total rev
Assumed
EBITDA multiple
Base year
EBITDA
ILEC voice 40% -5% 35% 14.0% 5.0x 14.00$
Broadband / DSL 25% 2% 30% 7.5% 6.0x 7.50$
Fiber to the tower 10% 10% 70% 7.0% 6.5x 7.00$
Fiber transport 10% 10% 60% 6.0% 7.0x 6.00$
Data center 15% 15% 37% 5.6% 11.0x 5.55$
100% 40.1% 40.05$

27
Illustrative Valuation with Growth Initiatives
September 2016WTA 2016 Fall Meeting
Value is created through cash-flow growth and higher-multiple businesses
Strategic value transformation is the goal
▫ LEC/Broadband change from 44% of value in Year 0 to 23% in Year 7
▫ LEC/Broadband cash flows contract by 13% over 7 years (LEC voice declines by 30%)
▫ Total value rises in Year 7 v. Year 0 by 65% in spite of net ILEC/BB contraction
▫ 7-year valuation CAGR is 7.4% and YOY growth rate is accelerating
Key message is that the new segments have growth opportunities AND higher valuations which can dramatically alter the long-term viability and valuation of the communications service provider
ILEC (Voice) Broadband Fiber-to-the-Tower Fiber Transport Data Center

28
Regulatory Changes are Driving RLEC Strategic Change
The 2011 Transformation Order has fundamentally altered the financial model
▫ Loss of terminating access and contracting USF have changed the income statement
▫ Complexity and unpredictability have increased balance sheet risk
▫ Valuation of the RLEC business continues to be pressured
Constructive responses for rural carriers include
▫ Acquisitions to increase scale and geographic diversity
▫ Significant services in support of wireless towers
▫ Fiber transport
▫ Data centers
Cooperatives
▫ Evaluating acquisitions
▫ Considering data centers
▫ Assessing structural changes including privatizing
September 2016WTA 2016 Fall Meeting

29
Summary
Regulatory changes are ongoing and significant
▫ Changing balance sheet and income statement risk
▫ Driving new strategic choices
▫ New changes have the potential to raise the RLEC risk
Data opportunities are significant
▫ Good growth
▫ Sustainable demand
▫ Exceptional valuations
Strategic planning is critical
▫ Viability of long-term business
▫ Preservation or creation of value
September 2016WTA 2016 Fall Meeting

30
Representative Transactions (1)
September 2016WTA 2016 Fall Meeting
(1) Includes transactions completed by Charlesmead professionals at predecessor firms.
Have Acquired
Heartland
Communications from
Advisor to Buyers
August 2016
Has Sold Spectrum
Licenses to
Advisor to Seller
December 2013
Advisor to Buyer
August 2013
Has Acquired Has Sold its Wireless
Partnership Interest to
Advisor to Seller
November 2013
Have Sold Their
Equity Interest in
BPB BIDCO to
Advisor to Sellers
May 2014
Has Sold Its Wireless
Tower Portfolio to
Advisor to Seller
December 2013
Has Acquired
Advisor to Buyer
December 2011
Has Acquired
Advisor to Buyer
January 2012
Has Acquired
Spectrum from
Advisor to Buyer
February 2012
Has Sold Spectrum
Licenses to
Advisor to Seller
July 2012
Has Acquired
Advisor to Buyer
December 2012
Has Sold Its Wireless
Operation to
Advisor to Seller
July 2013
Has SoldFremont Telcom Company and
Fretel Communications, LLC to
Advisor to Seller
January 2013
Advisor to Seller
April 2013
Has Sold Certain
Wireless Assets to
Advisor to Seller
June 2013
Has Sold Spectrum
Licenses to
Has Sold Its Wireless
Tower Portfolio to
Advisor to Seller
December 2012
Has sold Its Wireless
Operation to
Advisor to Seller
May 2015
Has Sold Spectrum
Licenses to
Advisor to Seller
January 2015
Has Sold Its North
Carolina Operations to
Advisor to Seller
May 2015
Has Sold its
Operation to
Valuation for Seller
December 2014
Big Horn Telecom
Holdings, Inc.
Has sold Tower
Assets to
Advisor to Seller
July 2015
Has Sold Certain
Arkansas and
Oklahoma
Operations to
Advisor to Seller
December 2015
Advisor to Sellers
March 2014
Have Sold Their
Wireless Partnership
Interests to
Has Sold Spectrum
Licenses to
Advisor to Seller
May 2016
Advisor to Seller
February 2016
Has Sold Spectrum
Licenses to
Advisor to Seller
March 2016
Has Sold Spectrum
Licenses to