Embed Size (px)
Citation preview
Telecommunications Industry Overview
A case study on decreasing performance, strategic uncertainty anddiminishing shareholder value?
Marius van Wyk (August 2021)
1
Executive Summary
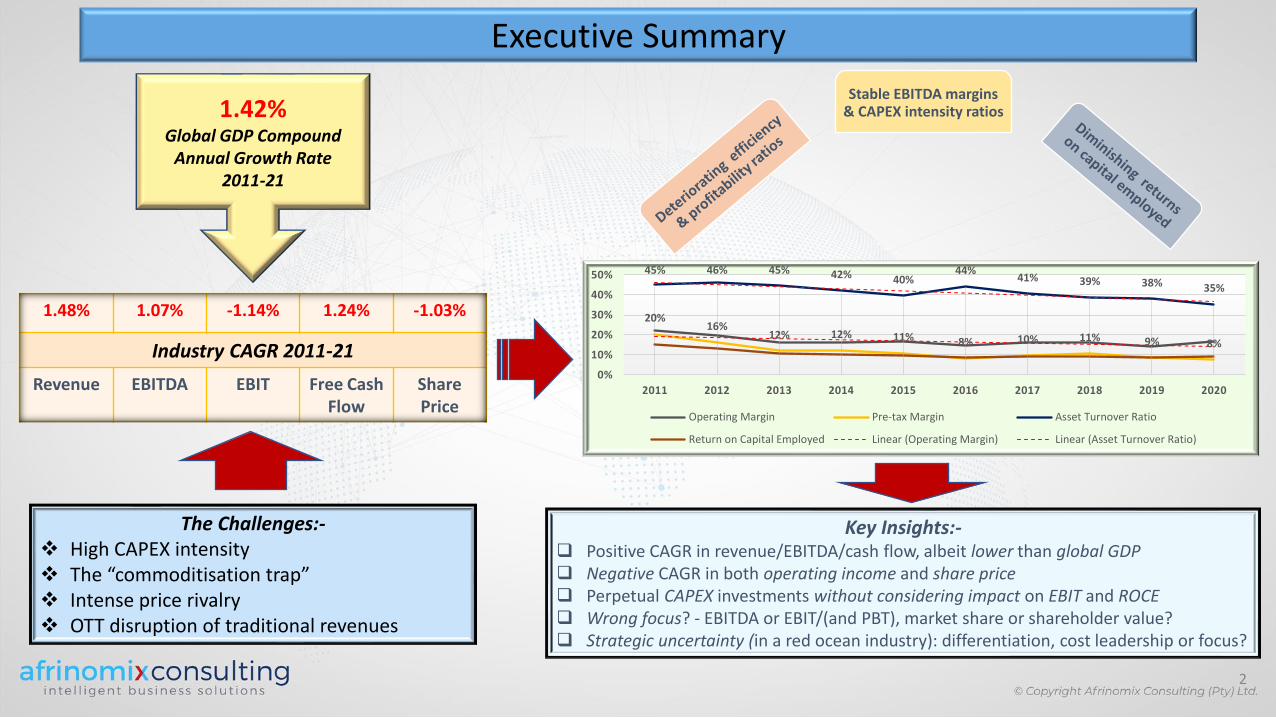
The Challenges:-❖ High CAPEX intensity❖ The “commoditisation trap”❖ Intense price rivalry❖ OTT disruption of traditional revenues
1.42%Global GDP Compound
Annual Growth Rate2011-21
1.48% 1.07% -1.14% 1.24% -1.03%
Industry CAGR 2011-21
Revenue EBITDA EBIT Free CashFlow
Share Price
Stable EBITDA margins & CAPEX intensity ratios
Key Insights:-❑ Positive CAGR in revenue/EBITDA/cash flow, albeit lower than global GDP ❑ Negative CAGR in both operating income and share price ❑ Perpetual CAPEX investments without considering impact on EBIT and ROCE❑ Wrong focus? - EBITDA or EBIT/(and PBT), market share or shareholder value?❑ Strategic uncertainty (in a red ocean industry): differentiation, cost leadership or focus?
2
20%16%
12% 12% 11% 8% 10% 11% 9% 8%
45% 46% 45% 42% 40%44%
41% 39% 38% 35%
0%
10%
20%
30%
40%
50%
2011 2012 2013 2014 2015 2016 2017 2018 2019 2020
Operating Margin Pre-tax Margin Asset Turnover Ratio
Return on Capital Employed Linear (Operating Margin) Linear (Asset Turnover Ratio)
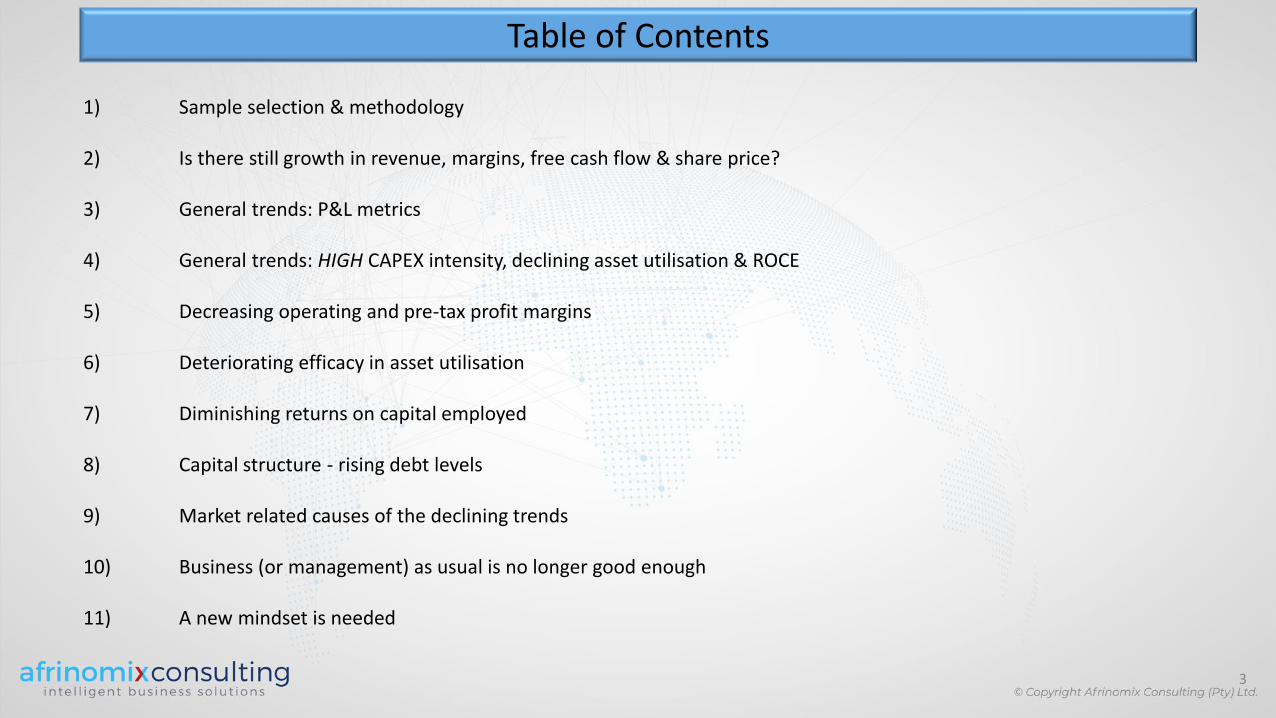
Table of Contents
1) Sample selection & methodology
2) Is there still growth in revenue, margins, free cash flow & share price?
3) General trends: P&L metrics
4) General trends: HIGH CAPEX intensity, declining asset utilisation & ROCE
5) Decreasing operating and pre-tax profit margins
6) Deteriorating efficacy in asset utilisation
7) Diminishing returns on capital employed
8) Capital structure - rising debt levels
9) Market related causes of the declining trends
10) Business (or management) as usual is no longer good enough
11) A new mindset is needed
3
Sample selection & methodology
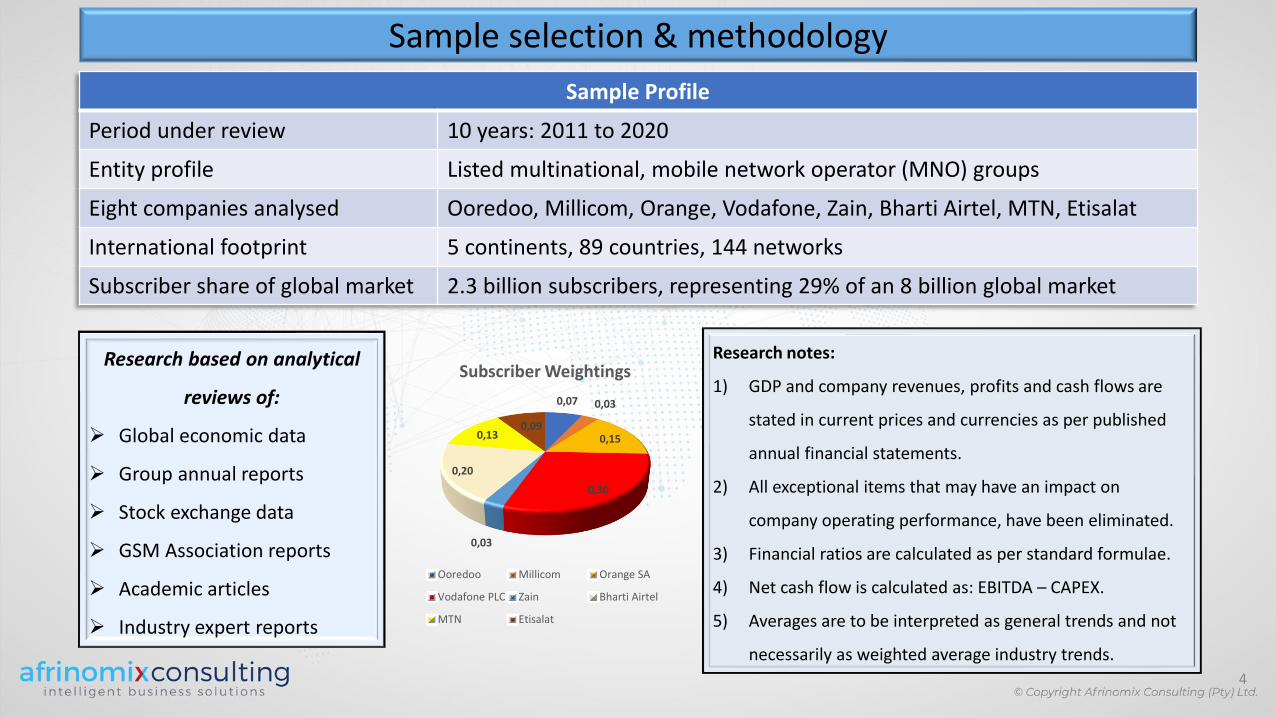
Sample Profile
Period under review 10 years: 2011 to 2020
Entity profile Listed multinational, mobile network operator (MNO) groups
Eight companies analysed Ooredoo, Millicom, Orange, Vodafone, Zain, Bharti Airtel, MTN, Etisalat
International footprint 5 continents, 89 countries, 144 networks
Subscriber share of global market 2.3 billion subscribers, representing 29% of an 8 billion global market
Research based on analytical
reviews of:
➢ Global economic data
➢ Group annual reports
➢ Stock exchange data
➢ GSM Association reports
➢ Academic articles
➢ Industry expert reports
Research notes:
1) GDP and company revenues, profits and cash flows are
stated in current prices and currencies as per published
annual financial statements.
2) All exceptional items that may have an impact on
company operating performance, have been eliminated.
3) Financial ratios are calculated as per standard formulae.
4) Net cash flow is calculated as: EBITDA – CAPEX.
5) Averages are to be interpreted as general trends and not
necessarily as weighted average industry trends.
0,07 0,03
0,15
0,30
0,03
0,20
0,130,09
Subscriber Weightings
Ooredoo Millicom Orange SA
Vodafone PLC Zain Bharti Airtel
MTN Etisalat
4
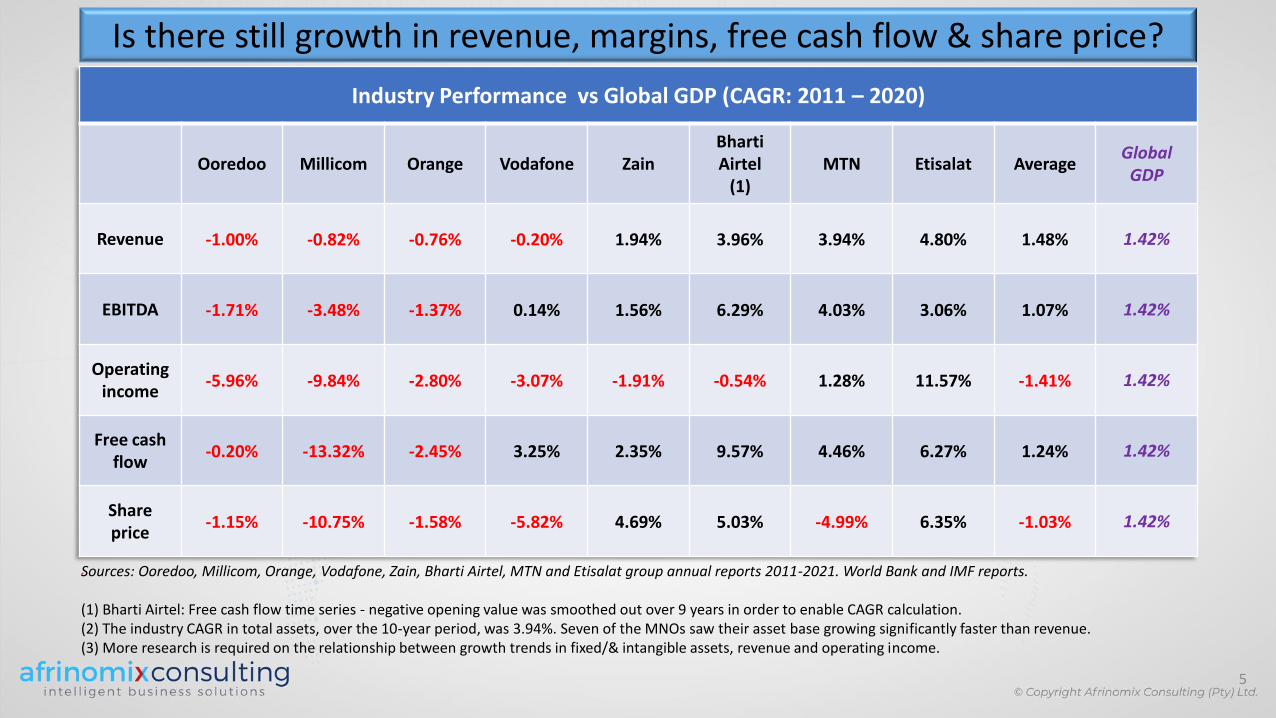
Is there still growth in revenue, margins, free cash flow & share price?
Industry Performance vs Global GDP (CAGR: 2011 – 2020)
Ooredoo Millicom Orange Vodafone ZainBharti Airtel
(1)MTN Etisalat Average
Global GDP
Revenue -1.00% -0.82% -0.76% -0.20% 1.94% 3.96% 3.94% 4.80% 1.48% 1.42%
EBITDA -1.71% -3.48% -1.37% 0.14% 1.56% 6.29% 4.03% 3.06% 1.07% 1.42%
Operating income
-5.96% -9.84% -2.80% -3.07% -1.91% -0.54% 1.28% 11.57% -1.41% 1.42%
Free cash flow
-0.20% -13.32% -2.45% 3.25% 2.35% 9.57% 4.46% 6.27% 1.24% 1.42%
Share price
-1.15% -10.75% -1.58% -5.82% 4.69% 5.03% -4.99% 6.35% -1.03% 1.42%
Sources: Ooredoo, Millicom, Orange, Vodafone, Zain, Bharti Airtel, MTN and Etisalat group annual reports 2011-2021. World Bank and IMF reports.
(1) Bharti Airtel: Free cash flow time series - negative opening value was smoothed out over 9 years in order to enable CAGR calculation. (2) The industry CAGR in total assets, over the 10-year period, was 3.94%. Seven of the MNOs saw their asset base growing significantly faster than revenue. (3) More research is required on the relationship between growth trends in fixed/& intangible assets, revenue and operating income.
5

General trends: P&L metrics
0%
5%
10%
15%
20%
25%
30%
35%
40%
45%
2011 2012 2013 2014 2015 2016 2017 2018 2019 2020
P&L - profitability metrics
EBITDA% EBIT% PBT% Linear (EBITDA%) Linear (EBIT%) Linear (PBT%)
➢ EBITDA margin:- Fairly stable, decreasing by 1% from 41% to 40% over the 10 years under review. The OPEX to revenue ratio is thereforereasonably consistent.
➢ Operating margin:- Decreasing by 5% from 22% to 17%, which is indicative of increasing depreciation/amortisation costs on a continuouslyexpanding asset base. Total operating costs as percentage of revenue is therefore increasing at a higher rate than OPEX (above the line) costs.
➢ Pre-tax margin:- Decreasing by 12% from 20% to 8%, which is the combined effect of faster growing depreciation/amortisation costs and theinterest on continuously growing borrowings.
These P&L trends clearly indicate a divergent increase in below the line costs (depreciation/amortisation & interest). For more detail onindividual MNO performance trends, see slides #8 to #13.
6
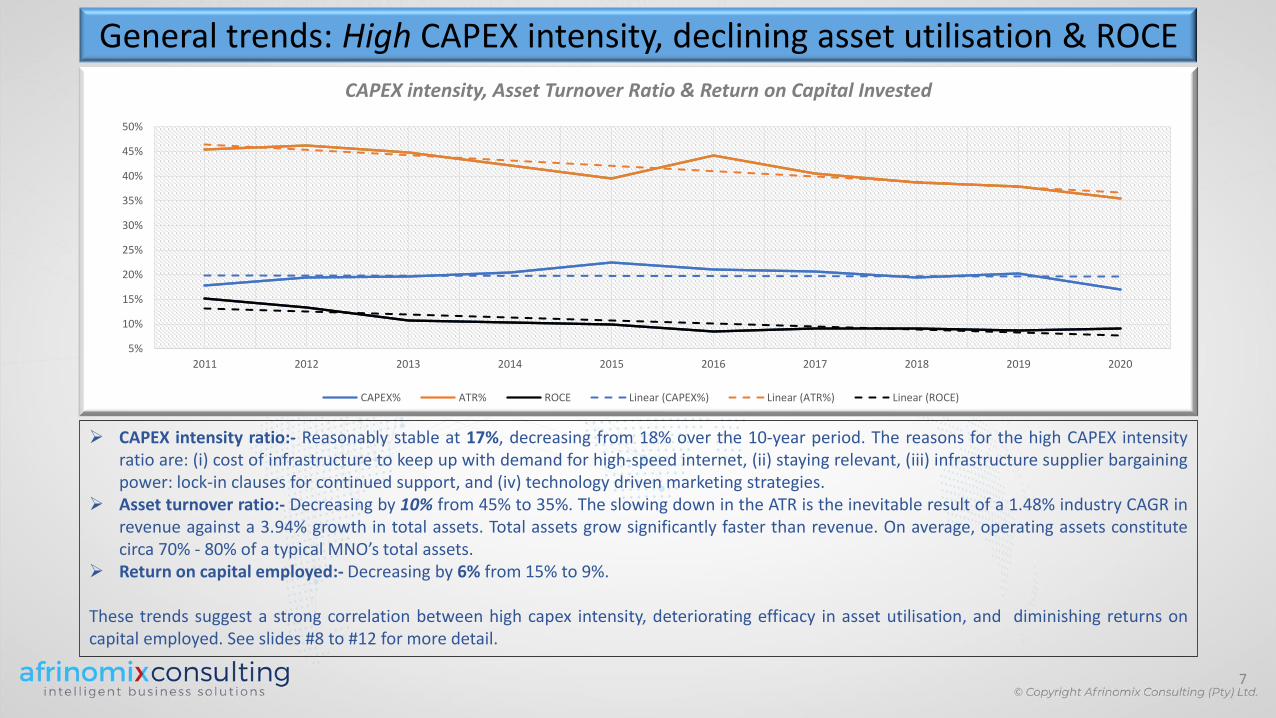
General trends: High CAPEX intensity, declining asset utilisation & ROCE
7
5%
10%
15%
20%
25%
30%
35%
40%
45%
50%
2011 2012 2013 2014 2015 2016 2017 2018 2019 2020
CAPEX intensity, Asset Turnover Ratio & Return on Capital Invested
CAPEX% ATR% ROCE Linear (CAPEX%) Linear (ATR%) Linear (ROCE)
➢ CAPEX intensity ratio:- Reasonably stable at 17%, decreasing from 18% over the 10-year period. The reasons for the high CAPEX intensityratio are: (i) cost of infrastructure to keep up with demand for high-speed internet, (ii) staying relevant, (iii) infrastructure supplier bargainingpower: lock-in clauses for continued support, and (iv) technology driven marketing strategies.
➢ Asset turnover ratio:- Decreasing by 10% from 45% to 35%. The slowing down in the ATR is the inevitable result of a 1.48% industry CAGR inrevenue against a 3.94% growth in total assets. Total assets grow significantly faster than revenue. On average, operating assets constitutecirca 70% - 80% of a typical MNO’s total assets.
➢ Return on capital employed:- Decreasing by 6% from 15% to 9%.
These trends suggest a strong correlation between high capex intensity, deteriorating efficacy in asset utilisation, and diminishing returns oncapital employed. See slides #8 to #12 for more detail.
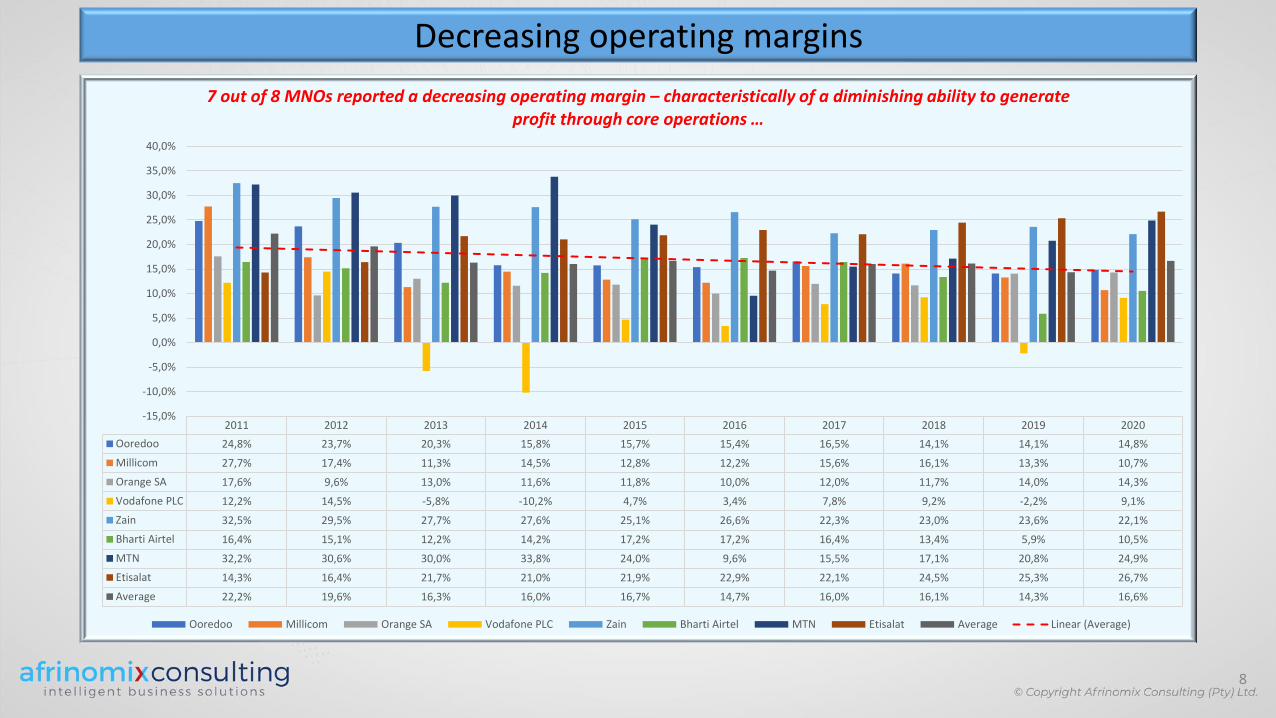
Decreasing operating margins
2011 2012 2013 2014 2015 2016 2017 2018 2019 2020
Ooredoo 24,8% 23,7% 20,3% 15,8% 15,7% 15,4% 16,5% 14,1% 14,1% 14,8%
Millicom 27,7% 17,4% 11,3% 14,5% 12,8% 12,2% 15,6% 16,1% 13,3% 10,7%
Orange SA 17,6% 9,6% 13,0% 11,6% 11,8% 10,0% 12,0% 11,7% 14,0% 14,3%
Vodafone PLC 12,2% 14,5% -5,8% -10,2% 4,7% 3,4% 7,8% 9,2% -2,2% 9,1%
Zain 32,5% 29,5% 27,7% 27,6% 25,1% 26,6% 22,3% 23,0% 23,6% 22,1%
Bharti Airtel 16,4% 15,1% 12,2% 14,2% 17,2% 17,2% 16,4% 13,4% 5,9% 10,5%
MTN 32,2% 30,6% 30,0% 33,8% 24,0% 9,6% 15,5% 17,1% 20,8% 24,9%
Etisalat 14,3% 16,4% 21,7% 21,0% 21,9% 22,9% 22,1% 24,5% 25,3% 26,7%
Average 22,2% 19,6% 16,3% 16,0% 16,7% 14,7% 16,0% 16,1% 14,3% 16,6%
-15,0%
-10,0%
-5,0%
0,0%
5,0%
10,0%
15,0%
20,0%
25,0%
30,0%
35,0%
40,0%
7 out of 8 MNOs reported a decreasing operating margin – characteristically of a diminishing ability to generate profit through core operations …
Ooredoo Millicom Orange SA Vodafone PLC Zain Bharti Airtel MTN Etisalat Average Linear (Average)
8
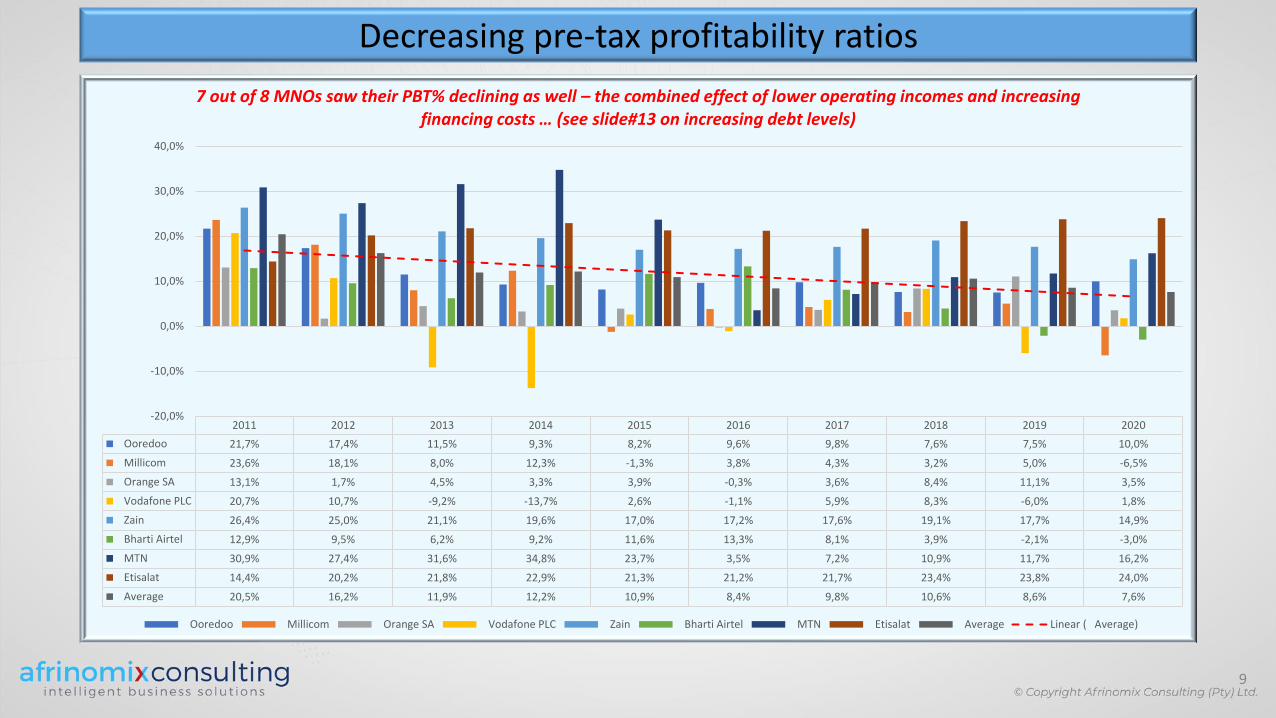
Decreasing pre-tax profitability ratios
2011 2012 2013 2014 2015 2016 2017 2018 2019 2020
Ooredoo 21,7% 17,4% 11,5% 9,3% 8,2% 9,6% 9,8% 7,6% 7,5% 10,0%
Millicom 23,6% 18,1% 8,0% 12,3% -1,3% 3,8% 4,3% 3,2% 5,0% -6,5%
Orange SA 13,1% 1,7% 4,5% 3,3% 3,9% -0,3% 3,6% 8,4% 11,1% 3,5%
Vodafone PLC 20,7% 10,7% -9,2% -13,7% 2,6% -1,1% 5,9% 8,3% -6,0% 1,8%
Zain 26,4% 25,0% 21,1% 19,6% 17,0% 17,2% 17,6% 19,1% 17,7% 14,9%
Bharti Airtel 12,9% 9,5% 6,2% 9,2% 11,6% 13,3% 8,1% 3,9% -2,1% -3,0%
MTN 30,9% 27,4% 31,6% 34,8% 23,7% 3,5% 7,2% 10,9% 11,7% 16,2%
Etisalat 14,4% 20,2% 21,8% 22,9% 21,3% 21,2% 21,7% 23,4% 23,8% 24,0%
Average 20,5% 16,2% 11,9% 12,2% 10,9% 8,4% 9,8% 10,6% 8,6% 7,6%
-20,0%
-10,0%
0,0%
10,0%
20,0%
30,0%
40,0%
7 out of 8 MNOs saw their PBT% declining as well – the combined effect of lower operating incomes and increasing financing costs … (see slide#13 on increasing debt levels)
Ooredoo Millicom Orange SA Vodafone PLC Zain Bharti Airtel MTN Etisalat Average Linear ( Average)
9
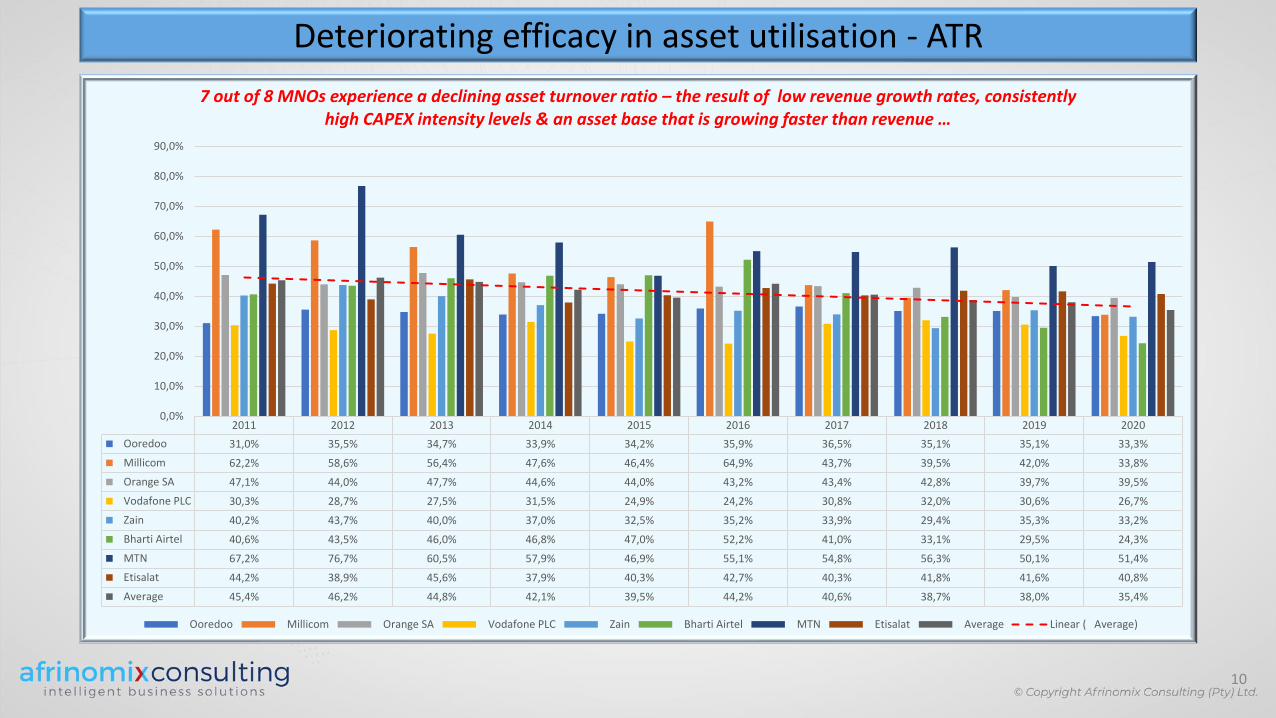
Deteriorating efficacy in asset utilisation - ATR
2011 2012 2013 2014 2015 2016 2017 2018 2019 2020
Ooredoo 31,0% 35,5% 34,7% 33,9% 34,2% 35,9% 36,5% 35,1% 35,1% 33,3%
Millicom 62,2% 58,6% 56,4% 47,6% 46,4% 64,9% 43,7% 39,5% 42,0% 33,8%
Orange SA 47,1% 44,0% 47,7% 44,6% 44,0% 43,2% 43,4% 42,8% 39,7% 39,5%
Vodafone PLC 30,3% 28,7% 27,5% 31,5% 24,9% 24,2% 30,8% 32,0% 30,6% 26,7%
Zain 40,2% 43,7% 40,0% 37,0% 32,5% 35,2% 33,9% 29,4% 35,3% 33,2%
Bharti Airtel 40,6% 43,5% 46,0% 46,8% 47,0% 52,2% 41,0% 33,1% 29,5% 24,3%
MTN 67,2% 76,7% 60,5% 57,9% 46,9% 55,1% 54,8% 56,3% 50,1% 51,4%
Etisalat 44,2% 38,9% 45,6% 37,9% 40,3% 42,7% 40,3% 41,8% 41,6% 40,8%
Average 45,4% 46,2% 44,8% 42,1% 39,5% 44,2% 40,6% 38,7% 38,0% 35,4%
0,0%
10,0%
20,0%
30,0%
40,0%
50,0%
60,0%
70,0%
80,0%
90,0%
7 out of 8 MNOs experience a declining asset turnover ratio – the result of low revenue growth rates, consistently high CAPEX intensity levels & an asset base that is growing faster than revenue …
Ooredoo Millicom Orange SA Vodafone PLC Zain Bharti Airtel MTN Etisalat Average Linear ( Average)
10
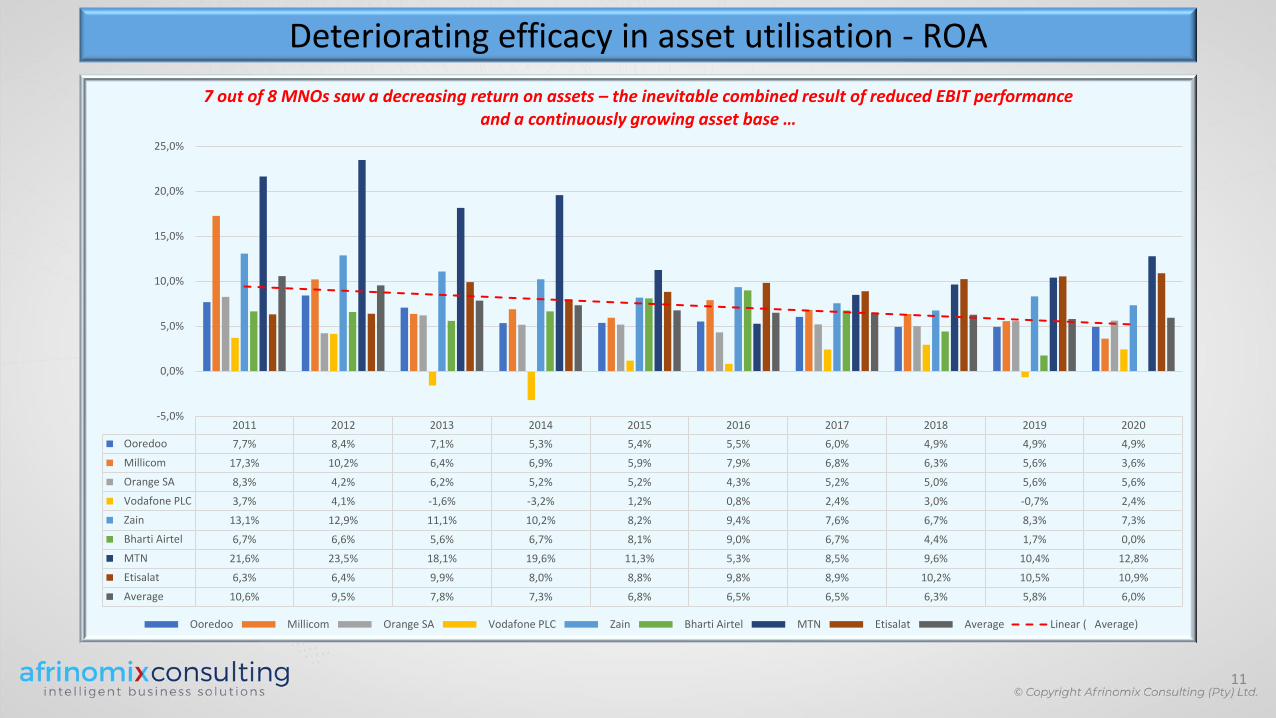
Deteriorating efficacy in asset utilisation - ROA
2011 2012 2013 2014 2015 2016 2017 2018 2019 2020
Ooredoo 7,7% 8,4% 7,1% 5,3% 5,4% 5,5% 6,0% 4,9% 4,9% 4,9%
Millicom 17,3% 10,2% 6,4% 6,9% 5,9% 7,9% 6,8% 6,3% 5,6% 3,6%
Orange SA 8,3% 4,2% 6,2% 5,2% 5,2% 4,3% 5,2% 5,0% 5,6% 5,6%
Vodafone PLC 3,7% 4,1% -1,6% -3,2% 1,2% 0,8% 2,4% 3,0% -0,7% 2,4%
Zain 13,1% 12,9% 11,1% 10,2% 8,2% 9,4% 7,6% 6,7% 8,3% 7,3%
Bharti Airtel 6,7% 6,6% 5,6% 6,7% 8,1% 9,0% 6,7% 4,4% 1,7% 0,0%
MTN 21,6% 23,5% 18,1% 19,6% 11,3% 5,3% 8,5% 9,6% 10,4% 12,8%
Etisalat 6,3% 6,4% 9,9% 8,0% 8,8% 9,8% 8,9% 10,2% 10,5% 10,9%
Average 10,6% 9,5% 7,8% 7,3% 6,8% 6,5% 6,5% 6,3% 5,8% 6,0%
-5,0%
0,0%
5,0%
10,0%
15,0%
20,0%
25,0%
7 out of 8 MNOs saw a decreasing return on assets – the inevitable combined result of reduced EBIT performance and a continuously growing asset base …
Ooredoo Millicom Orange SA Vodafone PLC Zain Bharti Airtel MTN Etisalat Average Linear ( Average)
11

Diminishing returns on capital employed
1 2 3 4 5 6 7 8 9 10
Ooredoo 10,5% 10,7% 9,3% 7,3% 7,5% 7,1% 8,3% 7,1% 7,4% 7,5%
Millicom 27,4% 16,1% 9,5% 10,4% 10,7% 9,8% 8,7% 8,6% 7,5% 4,4%
Orange SA 11,5% 6,4% 8,4% 6,7% 6,8% 5,9% 7,5% 7,3% 7,5% 7,6%
Vodafone PLC 4,5% 4,9% -2,0% -4,0% 1,5% 1,1% 3,3% 4,0% -0,8% 3,1%
Zain 17,4% 17,8% 14,6% 13,7% 11,7% 12,6% 9,9% 10,0% 12,3% 10,1%
Bharti Airtel 8,9% 9,6% 7,7% 9,6% 12,0% 9,9% 9,2% 6,4% 2,6% 4,0%
MTN 31,1% 32,9% 24,4% 26,7% 15,7% 7,4% 11,6% 13,7% 17,6% 18,6%
Etisalat 9,5% 9,1% 14,4% 11,6% 13,2% 14,8% 13,5% 16,3% 16,1% 17,6%
Average 15,1% 13,4% 10,8% 10,3% 9,9% 8,6% 9,0% 9,2% 8,8% 9,1%
As a result of the low/no revenue & EBITDA growth, decreasing operating income, consistently high CAPEX investments, 7 out of 8 MNOs saw a significant decrease in their return on capital employed …
Ooredoo Millicom Orange SA Vodafone PLC Zain Bharti Airtel MTN Etisalat Average Linear ( Average)
12
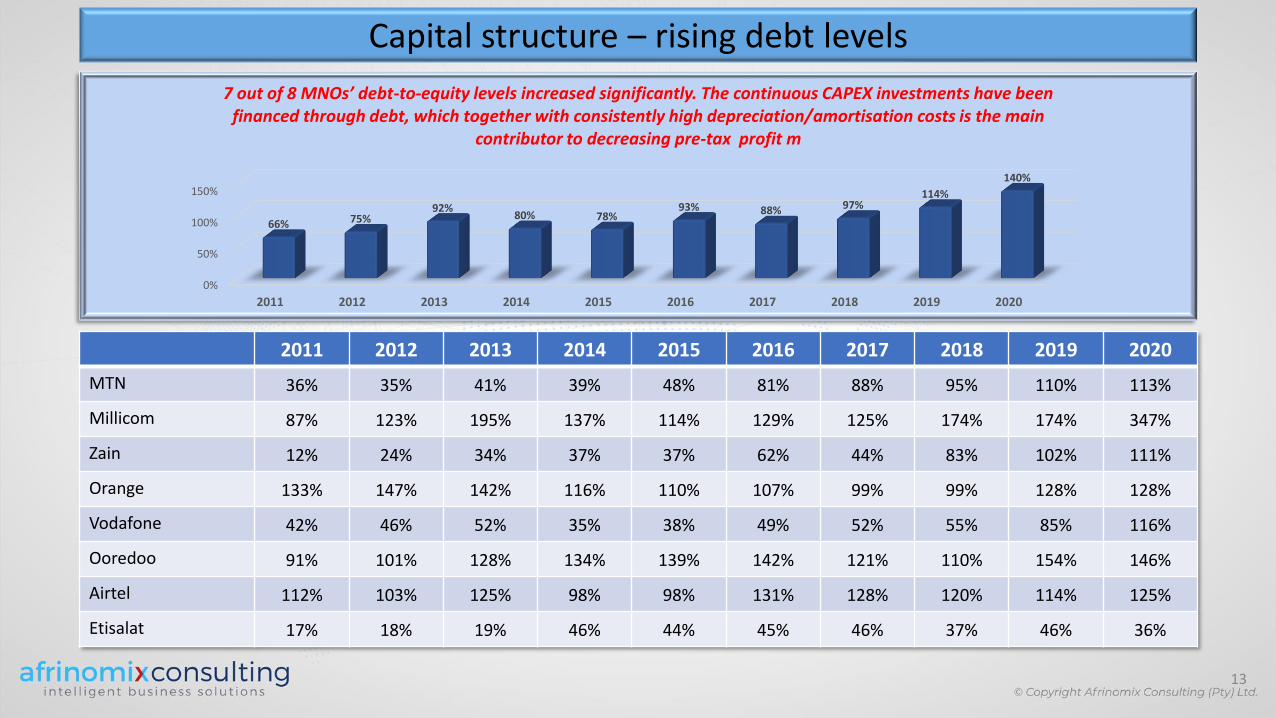
Capital structure – rising debt levels
2011 2012 2013 2014 2015 2016 2017 2018 2019 2020
MTN 36% 35% 41% 39% 48% 81% 88% 95% 110% 113%
Millicom 87% 123% 195% 137% 114% 129% 125% 174% 174% 347%
Zain 12% 24% 34% 37% 37% 62% 44% 83% 102% 111%
Orange 133% 147% 142% 116% 110% 107% 99% 99% 128% 128%
Vodafone 42% 46% 52% 35% 38% 49% 52% 55% 85% 116%
Ooredoo 91% 101% 128% 134% 139% 142% 121% 110% 154% 146%
Airtel 112% 103% 125% 98% 98% 131% 128% 120% 114% 125%
Etisalat 17% 18% 19% 46% 44% 45% 46% 37% 46% 36%
0%
50%
100%
150%
2011 2012 2013 2014 2015 2016 2017 2018 2019 2020
66% 75%92%
80% 78%93% 88% 97%
114%
140%
7 out of 8 MNOs’ debt-to-equity levels increased significantly. The continuous CAPEX investments have been financed through debt, which together with consistently high depreciation/amortisation costs is the main
contributor to decreasing pre-tax profit m
13
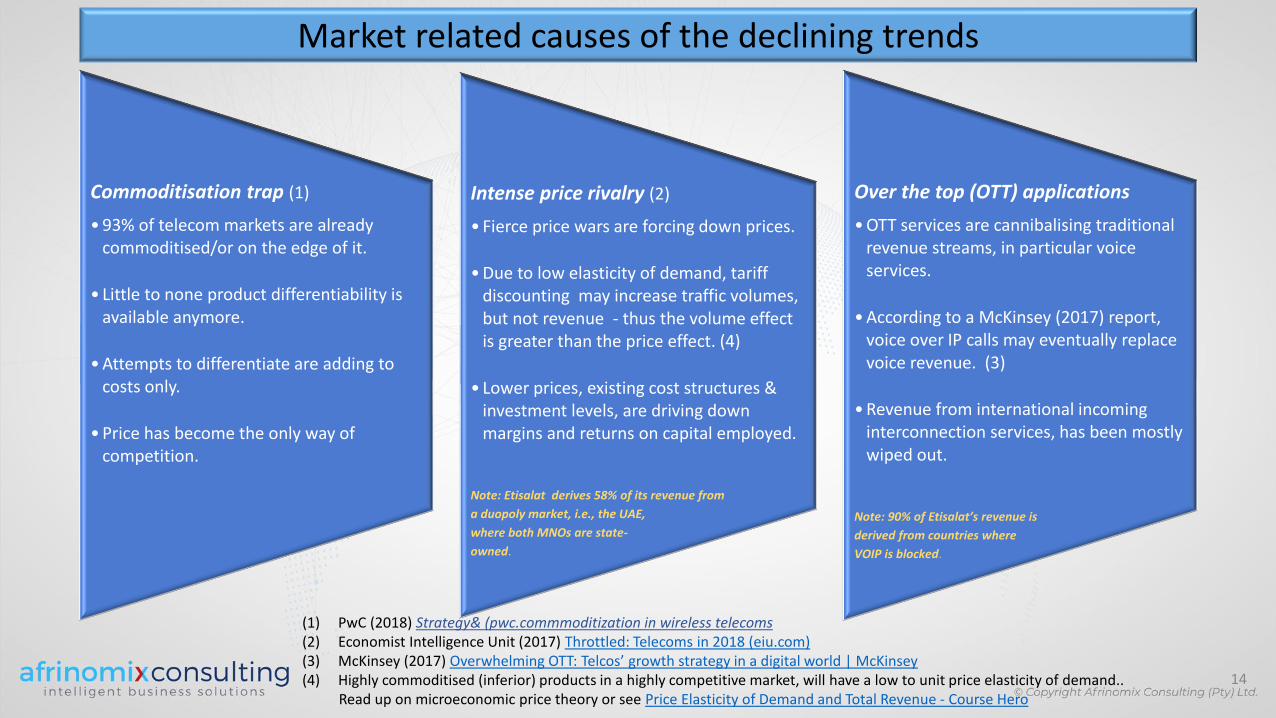
Market related causes of the declining trends
14
Commoditisation trap (1)
• 93% of telecom markets are already commoditised/or on the edge of it.
• Little to none product differentiability is available anymore.
• Attempts to differentiate are adding to costs only.
• Price has become the only way of competition.
Intense price rivalry (2)
• Fierce price wars are forcing down prices.
• Due to low elasticity of demand, tariff discounting may increase traffic volumes, but not revenue - thus the volume effect is greater than the price effect. (4)
• Lower prices, existing cost structures & investment levels, are driving down margins and returns on capital employed.
Note: Etisalat derives 58% of its revenue from
a duopoly market, i.e., the UAE,
where both MNOs are state-
owned.
Over the top (OTT) applications
• OTT services are cannibalising traditional revenue streams, in particular voice services.
• According to a McKinsey (2017) report, voice over IP calls may eventually replace voice revenue. (3)
• Revenue from international incoming interconnection services, has been mostly wiped out.
Note: 90% of Etisalat’s revenue is
derived from countries where
VOIP is blocked.
(1) PwC (2018) Strategy& (pwc.commmoditization in wireless telecoms(2) Economist Intelligence Unit (2017) Throttled: Telecoms in 2018 (eiu.com)(3) McKinsey (2017) Overwhelming OTT: Telcos’ growth strategy in a digital world | McKinsey(4) Highly commoditised (inferior) products in a highly competitive market, will have a low to unit price elasticity of demand..
Read up on microeconomic price theory or see Price Elasticity of Demand and Total Revenue - Course Hero

When business (management) as usual is no longer good enough
15
Strategy CAPEX investment Finance
▪ Strategic uncertainty in extremely competitive
markets: Differentiation, cost leadership or focus?
▪ Flawed pricing models focusing on competition,
sales & market share, with little (or no) consideration
to full cost and investment recovery.
▪ Uncertainty on how to deal with the market share
and/or profitability (shareholder value) dichotomy.
▪ Porter’s Five Forces: A strategy designed to focus on
the strongest force only is fatally flawed.
▪ Does current strategy and business model consider
the impact of ESG on enterprise risk and therefore
value?
▪ Judging by the finance & CAPEX investment issues,
finance appears not to be a strategic business
partner.
▪ Strategic alignment, value-based management &
ccompetitive advantage: reality or perception?
▪ Perpetual CAPEX investments without understanding
its full impact on:-
➢ operating margin,
➢ value creation,
➢ returns on investment,
➢ impact on capital structure,
➢ borrowing cost, and eventually
➢ enterprise value.
▪ Continuously increasing capex does not necessarily
result in sustainable competitive advantage.
▪ Silo-ed planning, analysis & EPM.
▪ Still focussing on the wrong metrics, i.e., EBITDA%.
▪ Can current capital structures be considered
sustainable, particularly in a highly competitive
low/no growth telecom industry?
▪ IFRS/statutory compliance-oriented planning,
analytics & reporting.
▪ Traditional spreadsheet-based FP&A still widely
used.
▪ Current business planning cycles are not keeping up
with rapid change & volatility – resulting in slow time
to market and delays in taking corrective actions.
▪ Single dimension P&L formats for a multi-
dimensional reality - consisting of revenue streams,
product units, value segments, S&D channels, do
NOT support optimal decision-making.
▪ Impact of business decisions on enterprise value not
being considered: just an oversight, or a fatal flaw?
A new mindset is needed
16
Managing a business from EBITDA margin to operating and pre-tax profit margins, from value destruction to value
optimisation, management needs to measure the impact of their strategic decisions on the company’s enterprise value; in real-
time, all the time.
Executives need to challenge their reliance on traditional management concepts such as competitive advantage, strategic
alignment and value-based management. In today’s highly competitive, rapidly changing, complex and uncertain business
landscape, management can no longer afford to remain a prisoner of past beliefs and practices.
Value-based management now encompasses profit, people and planet, which is why enterprise value is becoming the key
indicator on the reporting dashboard of a 21st century company. Strategic alignment, traditionally linking strategy and
organisational functions, now also requires links to capital investment and funding. Sustainable competitive advantage without
the ability to think faster than the competition, is nothing but a mirage.
Organisational agility, multidimensional perspectives, smart CAPEX, strategic finance, connected planning & analysis – these are
the imperatives for premium business decisions, and optimised enterprise value.