Embed Size (px)
Citation preview
1 1 For updated information, please visit www.ibef.org
Telecommunications AUGUST
2012

2 2
Contents
Advantage India
Market overview and trends
Growth drivers
Success stories: Airtel, Vodafone
Opportunities
Useful information
For updated information, please visit www.ibef.org
Telecommunications AUGUST
2012
3 3
Telecommunications
For updated information, please visit www.ibef.org ADVANTAGE INDIA
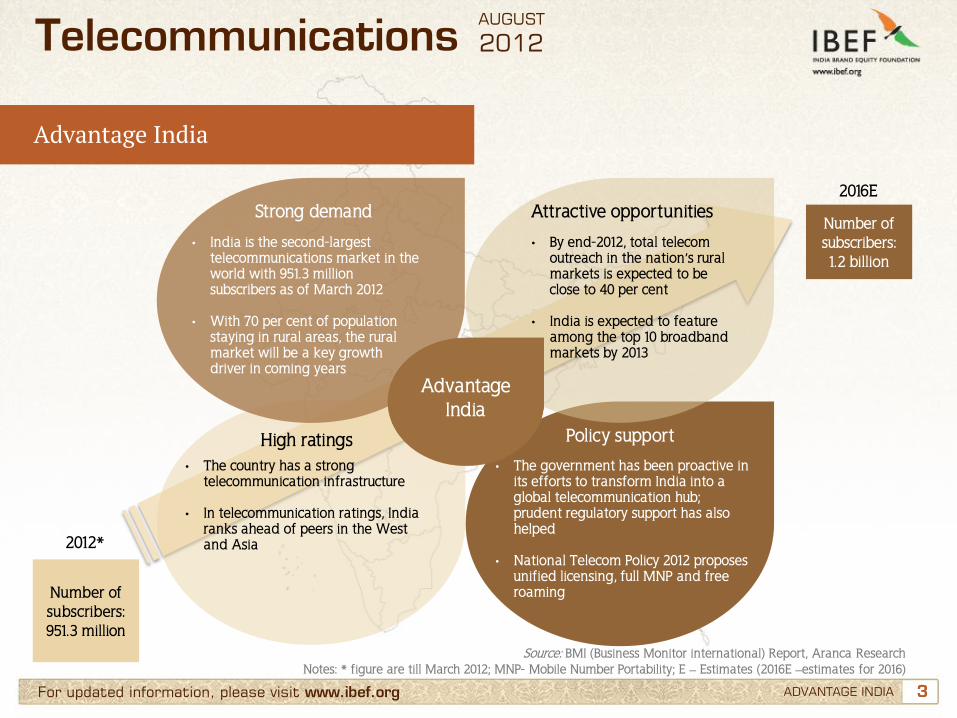
Advantage India
Advantage India
• India is the second-largest telecommunications market in the world with 951.3 million subscribers as of March 2012
• With 70 per cent of population staying in rural areas, the rural market will be a key growth driver in coming years
• By end-2012, total telecom outreach in the nation’s rural markets is expected to be close to 40 per cent
• India is expected to feature among the top 10 broadband markets by 2013
• The country has a strong telecommunication infrastructure
• In telecommunication ratings, India ranks ahead of peers in the West and Asia
• The government has been proactive in its efforts to transform India into a global telecommunication hub; prudent regulatory support has also helped
• National Telecom Policy 2012 proposes unified licensing, full MNP and free roaming
Number of subscribers: 1.2 billion
2016E
Number of subscribers: 951.3 million
2012*
Source: BMI (Business Monitor international) Report, Aranca Research Notes: * figure are till March 2012; MNP- Mobile Number Portability; E – Estimates (2016E –estimates for 2016)
Strong demand Attractive opportunities
High ratings Policy support
AUGUST
2012
4 4
Contents
Advantage India
Market overview and trends
Growth drivers
Success stories: Airtel, Vodafone
Opportunities
Useful information
For updated information, please visit www.ibef.org
Telecommunications AUGUST
2012
5 5 For updated information, please visit www.ibef.org MARKET OVERVIEW AND TRENDS
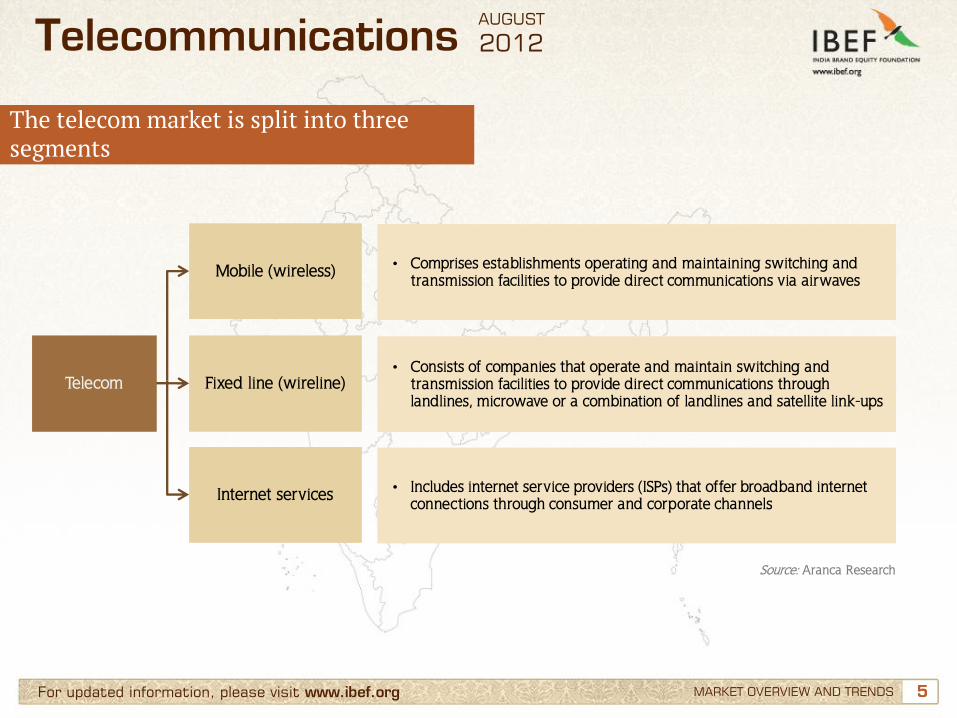
The telecom market is split into three segments
Telecom
• Comprises establishments operating and maintaining switching and transmission facilities to provide direct communications via airwaves
Mobile (wireless)
Fixed line (wireline)
Internet services
• Consists of companies that operate and maintain switching and transmission facilities to provide direct communications through landlines, microwave or a combination of landlines and satellite link-ups
• Includes internet service providers (ISPs) that offer broadband internet connections through consumer and corporate channels
Source: Aranca Research
Telecommunications AUGUST
2012
6 6 For updated information, please visit www.ibef.org
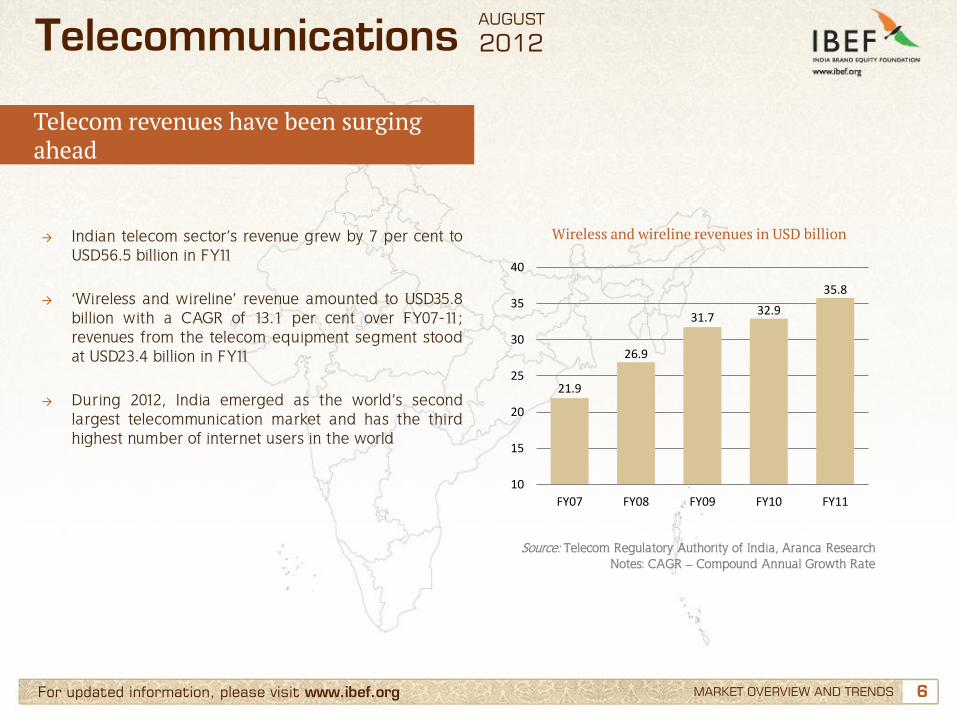
Telecom revenues have been surging ahead
MARKET OVERVIEW AND TRENDS
→ Indian telecom sector’s revenue grew by 7 per cent to
USD56.5 billion in FY11
→ ‘Wireless and wireline’ revenue amounted to USD35.8 billion with a CAGR of 13.1 per cent over FY07-11; revenues from the telecom equipment segment stood at USD23.4 billion in FY11
→ During 2012, India emerged as the world’s second largest telecommunication market and has the third highest number of internet users in the world
Wireless and wireline revenues in USD billion
Source: Telecom Regulatory Authority of India, Aranca Research Notes: CAGR – Compound Annual Growth Rate
Telecommunications
21.9
26.9
31.7 32.9
35.8
10
15
20
25
30
35
40
FY07 FY08 FY09 FY10 FY11
AUGUST
2012
7 7
1.7
2.2 2.5
3.2
3.6
0.0
1.0
2.0
3.0
4.0
2006 2007 2008 2009 2010
CAGR: 20.6%
For updated information, please visit www.ibef.org MARKET OVERVIEW AND TRENDS
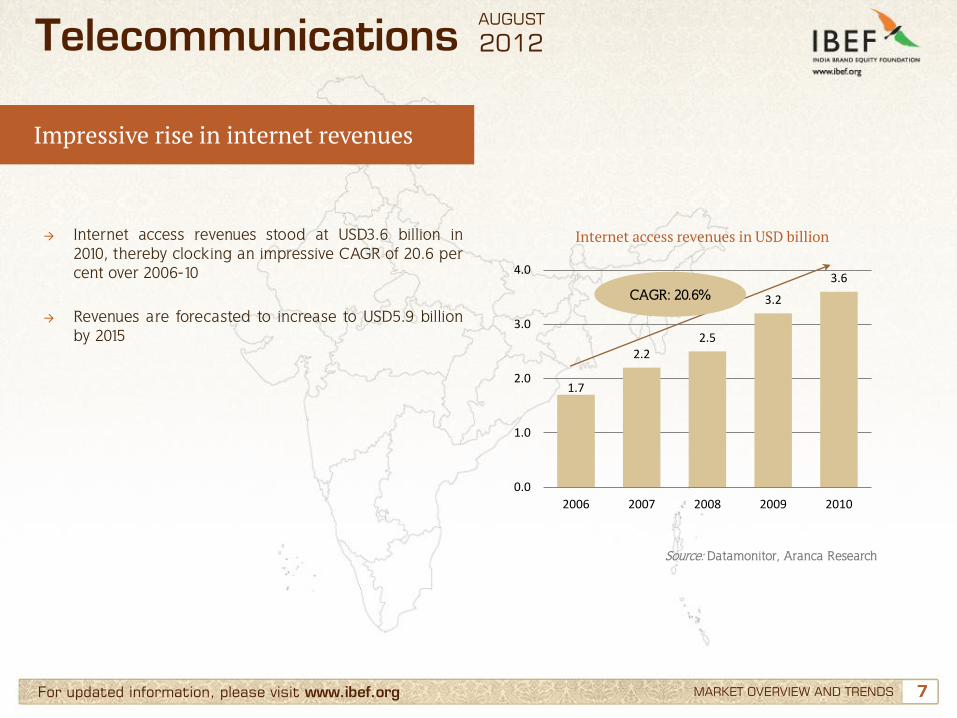
→ Internet access revenues stood at USD3.6 billion in 2010, thereby clocking an impressive CAGR of 20.6 per cent over 2006-10
→ Revenues are forecasted to increase to USD5.9 billion
by 2015
Internet access revenues in USD billion
Source: Datamonitor, Aranca Research
Telecommunications
Impressive rise in internet revenues
AUGUST
2012
8 8 For updated information, please visit www.ibef.org
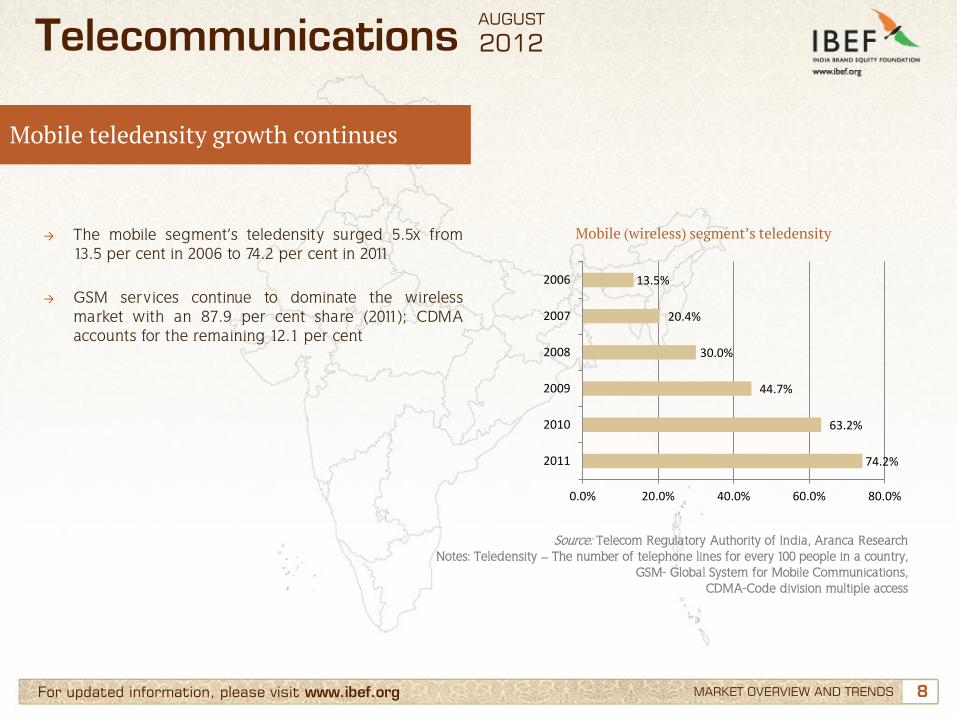
Mobile teledensity growth continues
MARKET OVERVIEW AND TRENDS
→ The mobile segment’s teledensity surged 5.5x from 13.5 per cent in 2006 to 74.2 per cent in 2011
→ GSM services continue to dominate the wireless market with an 87.9 per cent share (2011); CDMA accounts for the remaining 12.1 per cent
Mobile (wireless) segment’s teledensity
Source: Telecom Regulatory Authority of India, Aranca Research Notes: Teledensity – The number of telephone lines for every 100 people in a country,
GSM- Global System for Mobile Communications, CDMA-Code division multiple access
Telecommunications
74.2%
63.2%
44.7%
30.0%
20.4%
13.5%
0.0% 20.0% 40.0% 60.0% 80.0%
2011
2010
2009
2008
2007
2006
AUGUST
2012
9 9 For updated information, please visit www.ibef.org MARKET OVERVIEW AND TRENDS
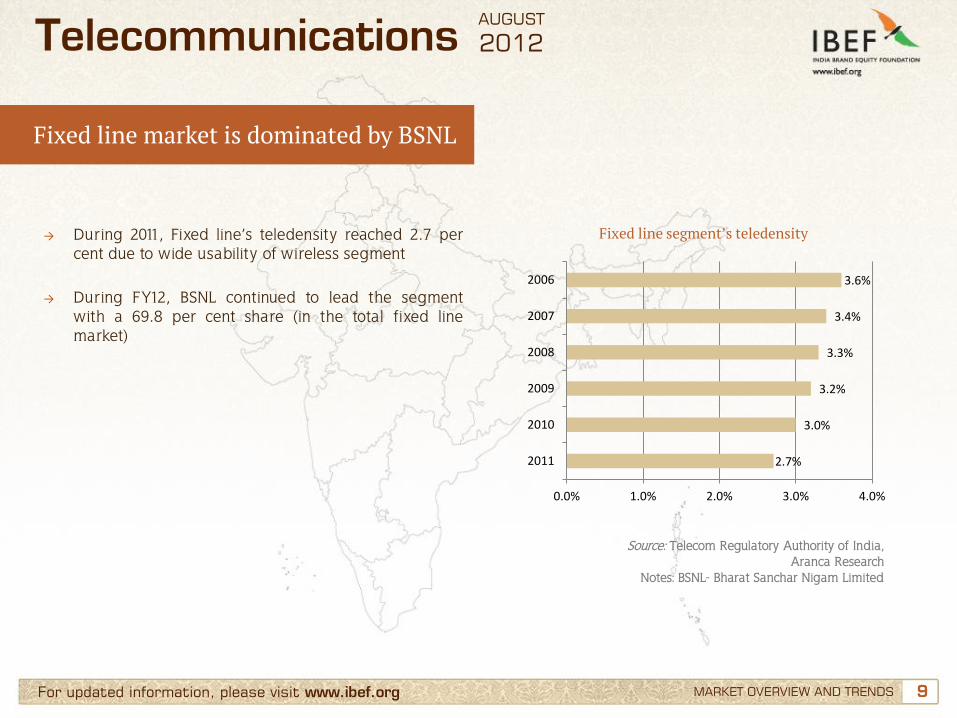
→ During 2011, Fixed line’s teledensity reached 2.7 per cent due to wide usability of wireless segment
→ During FY12, BSNL continued to lead the segment with a 69.8 per cent share (in the total fixed line market)
Fixed line segment’s teledensity
Source: Telecom Regulatory Authority of India, Aranca Research
Notes: BSNL- Bharat Sanchar Nigam Limited
Telecommunications
Fixed line market is dominated by BSNL
2.7%
3.0%
3.2%
3.3%
3.4%
3.6%
0.0% 1.0% 2.0% 3.0% 4.0%
2011
2010
2009
2008
2007
2006
AUGUST
2012
10 10 For updated information, please visit www.ibef.org
Strong growth in mobile subscriptions
MARKET OVERVIEW AND TRENDS
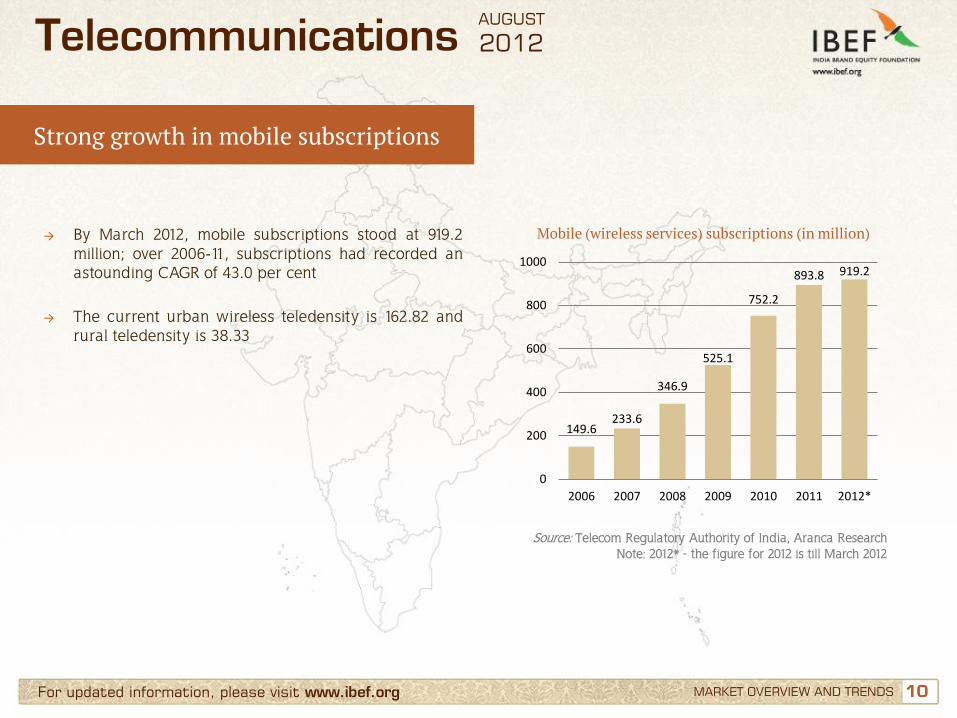
→ By March 2012, mobile subscriptions stood at 919.2 million; over 2006-11, subscriptions had recorded an astounding CAGR of 43.0 per cent
→ The current urban wireless teledensity is 162.82 and rural teledensity is 38.33
Mobile (wireless services) subscriptions (in million)
Source: Telecom Regulatory Authority of India, Aranca Research Note: 2012* - the figure for 2012 is till March 2012
Telecommunications
149.6 233.6
346.9
525.1
752.2
893.8 919.2
0
200
400
600
800
1000
2006 2007 2008 2009 2010 2011 2012*
AUGUST
2012
11 11 For updated information, please visit www.ibef.org MARKET OVERVIEW AND TRENDS
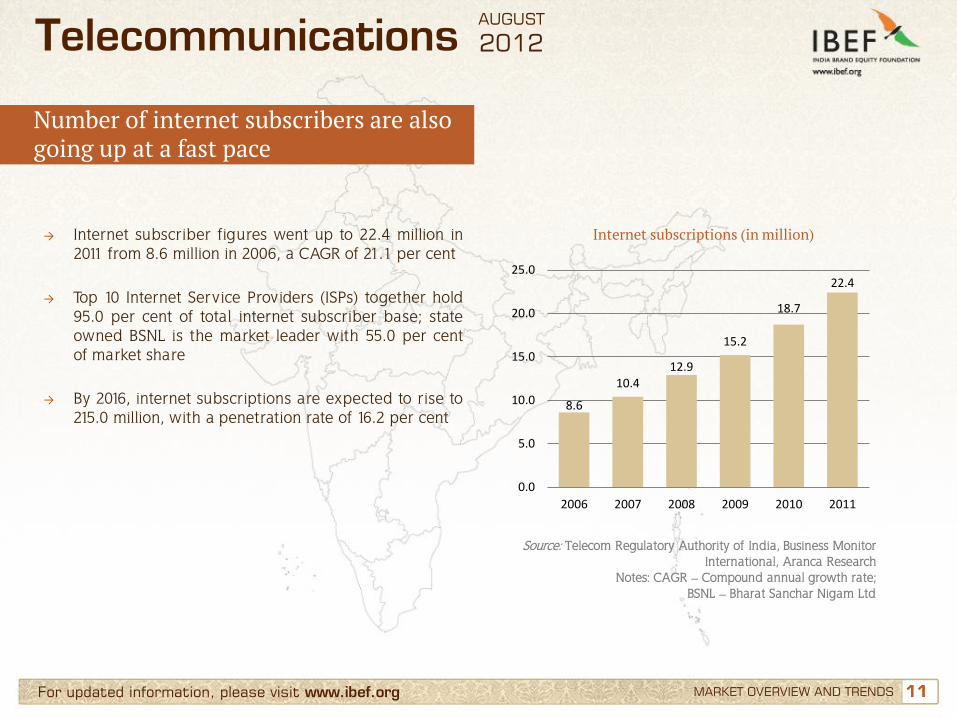
→ Internet subscriber figures went up to 22.4 million in 2011 from 8.6 million in 2006, a CAGR of 21.1 per cent
→ Top 10 Internet Service Providers (ISPs) together hold 95.0 per cent of total internet subscriber base; state owned BSNL is the market leader with 55.0 per cent of market share
→ By 2016, internet subscriptions are expected to rise to 215.0 million, with a penetration rate of 16.2 per cent
Internet subscriptions (in million)
Source: Telecom Regulatory Authority of India, Business Monitor International, Aranca Research
Notes: CAGR – Compound annual growth rate; BSNL – Bharat Sanchar Nigam Ltd
Telecommunications
Number of internet subscribers are also going up at a fast pace
8.6
10.4 12.9
15.2
18.7
22.4
0.0
5.0
10.0
15.0
20.0
25.0
2006 2007 2008 2009 2010 2011
AUGUST
2012
12 12 For updated information, please visit www.ibef.org MARKET OVERVIEW AND TRENDS
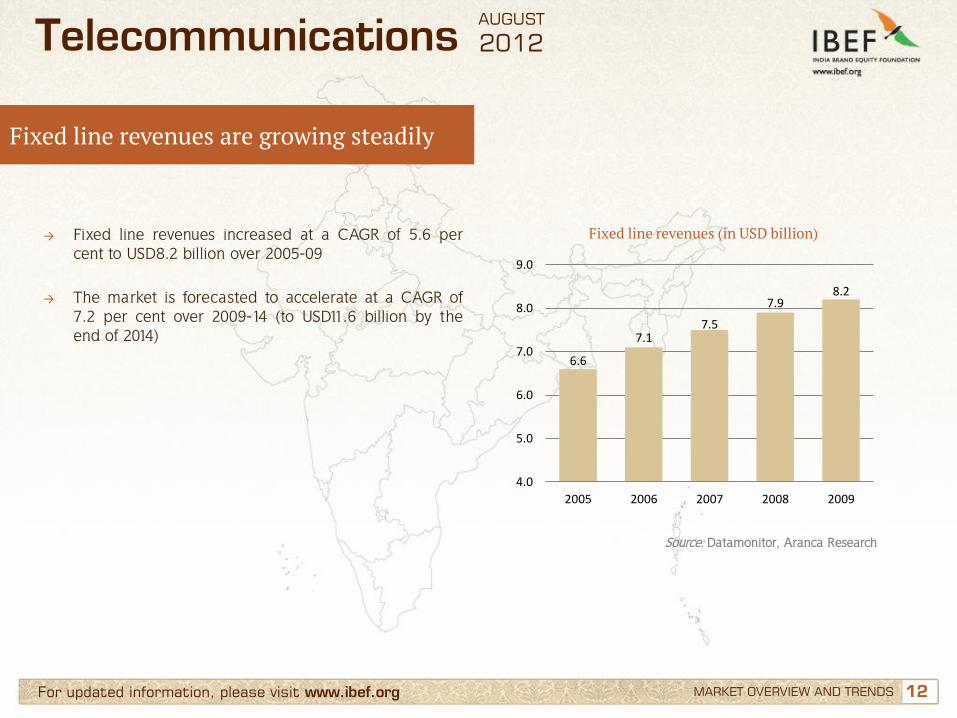
→ Fixed line revenues increased at a CAGR of 5.6 per cent to USD8.2 billion over 2005-09
→ The market is forecasted to accelerate at a CAGR of 7.2 per cent over 2009-14 (to USD11.6 billion by the end of 2014)
Fixed line revenues (in USD billion)
Source: Datamonitor, Aranca Research
Telecommunications
Fixed line revenues are growing steadily
6.6
7.1 7.5
7.9 8.2
4.0
5.0
6.0
7.0
8.0
9.0
2005 2006 2007 2008 2009
AUGUST
2012
13 13 For updated information, please visit www.ibef.org MARKET OVERVIEW AND TRENDS
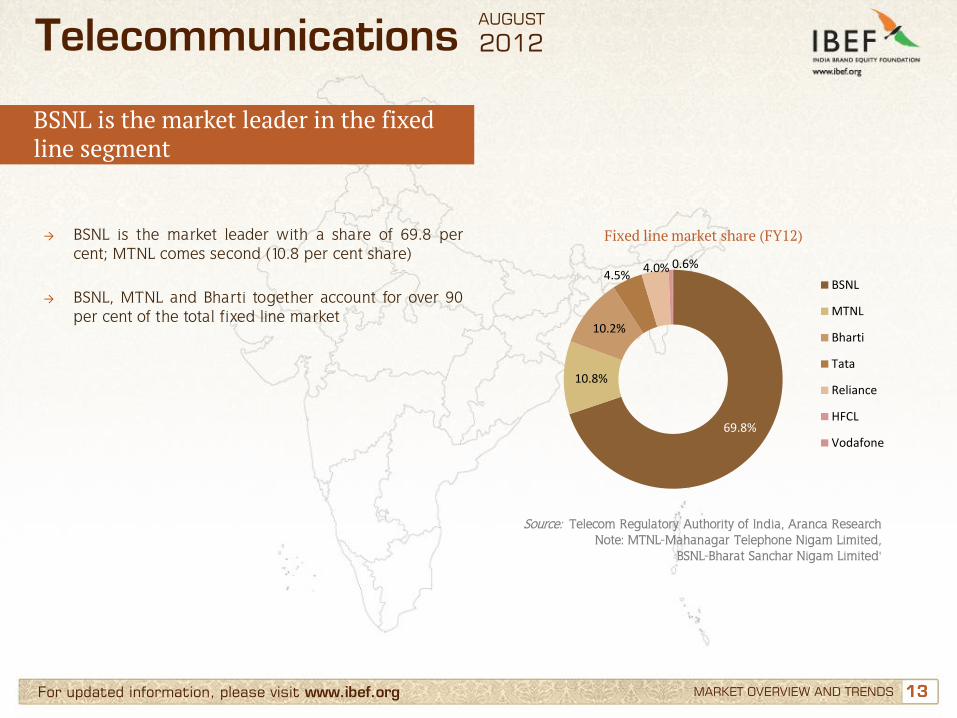
→ BSNL is the market leader with a share of 69.8 per cent; MTNL comes second (10.8 per cent share)
→ BSNL, MTNL and Bharti together account for over 90 per cent of the total fixed line market
Fixed line market share (FY12)
Source: Telecom Regulatory Authority of India, Aranca Research Note: MTNL-Mahanagar Telephone Nigam Limited,
BSNL-Bharat Sanchar Nigam Limited'
Telecommunications
BSNL is the market leader in the fixed line segment
69.8%
10.8%
10.2%
4.5% 4.0% 0.6%
BSNL
MTNL
Bharti
Tata
Reliance
HFCL
Vodafone
AUGUST
2012
14 14 For updated information, please visit www.ibef.org MARKET OVERVIEW AND TRENDS
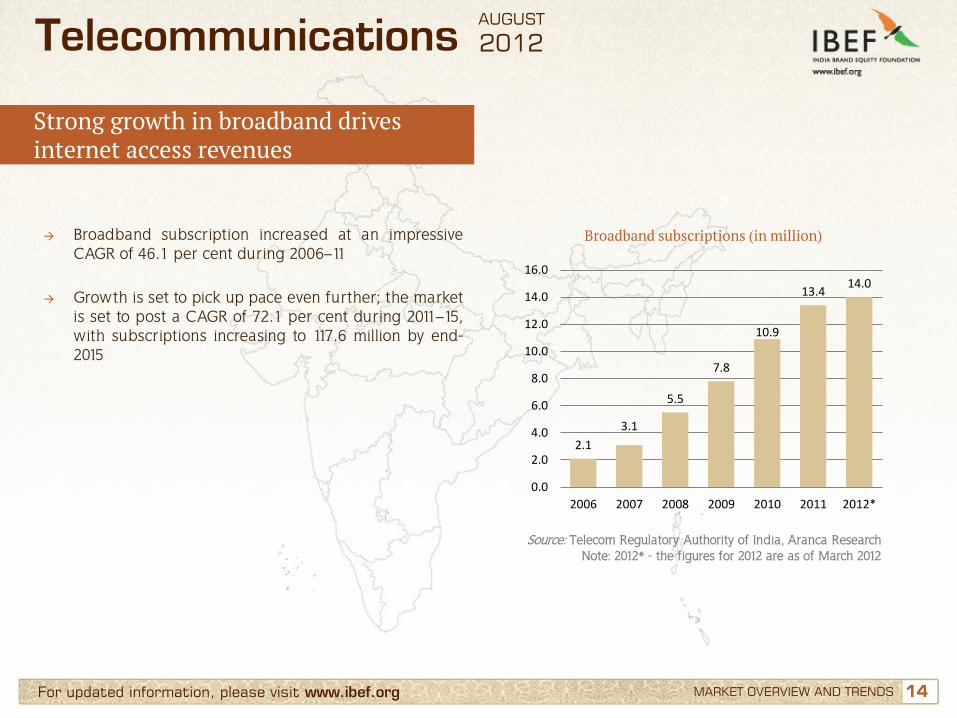
→ Broadband subscription increased at an impressive CAGR of 46.1 per cent during 2006–11
→ Growth is set to pick up pace even further; the market is set to post a CAGR of 72.1 per cent during 2011–15, with subscriptions increasing to 117.6 million by end-2015
Broadband subscriptions (in million)
Source: Telecom Regulatory Authority of India, Aranca Research Note: 2012* - the figures for 2012 are as of March 2012
Telecommunications
Strong growth in broadband drives internet access revenues
2.1
3.1
5.5
7.8
10.9
13.4 14.0
0.0
2.0
4.0
6.0
8.0
10.0
12.0
14.0
16.0
2006 2007 2008 2009 2010 2011 2012*
AUGUST
2012
15 15 For updated information, please visit www.ibef.org MARKET OVERVIEW AND TRENDS
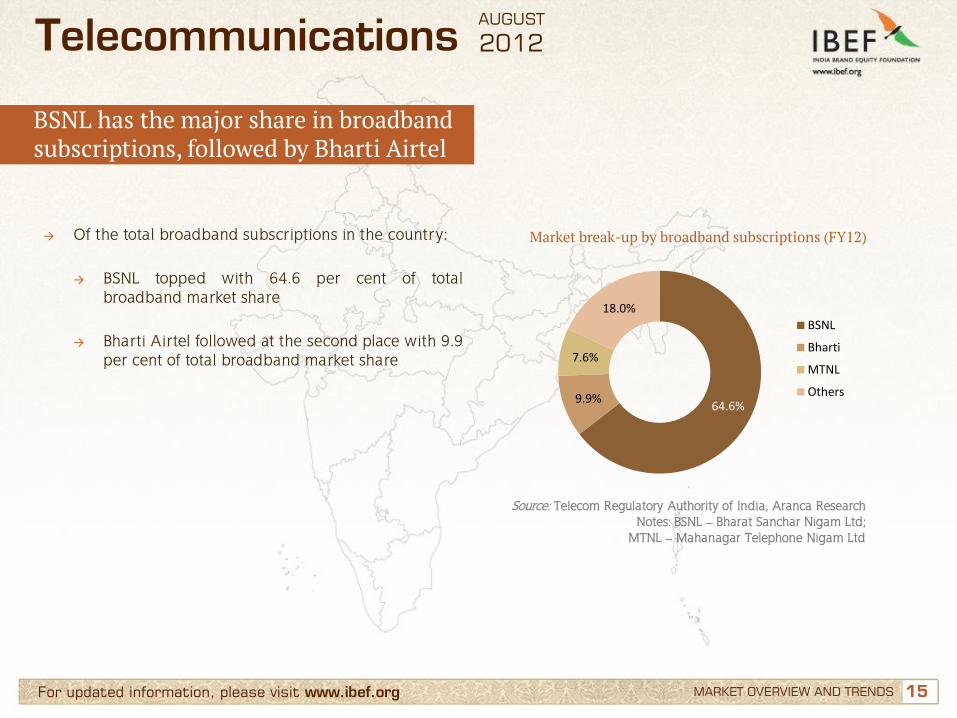
→ Of the total broadband subscriptions in the country:
→ BSNL topped with 64.6 per cent of total broadband market share
→ Bharti Airtel followed at the second place with 9.9 per cent of total broadband market share
Market break-up by broadband subscriptions (FY12)
Source: Telecom Regulatory Authority of India, Aranca Research Notes: BSNL – Bharat Sanchar Nigam Ltd;
MTNL – Mahanagar Telephone Nigam Ltd
Telecommunications
BSNL has the major share in broadband subscriptions, followed by Bharti Airtel
64.6% 9.9%
7.6%
18.0%
BSNL
Bharti
MTNL
Others
AUGUST
2012
16 16 For updated information, please visit www.ibef.org MARKET OVERVIEW AND TRENDS
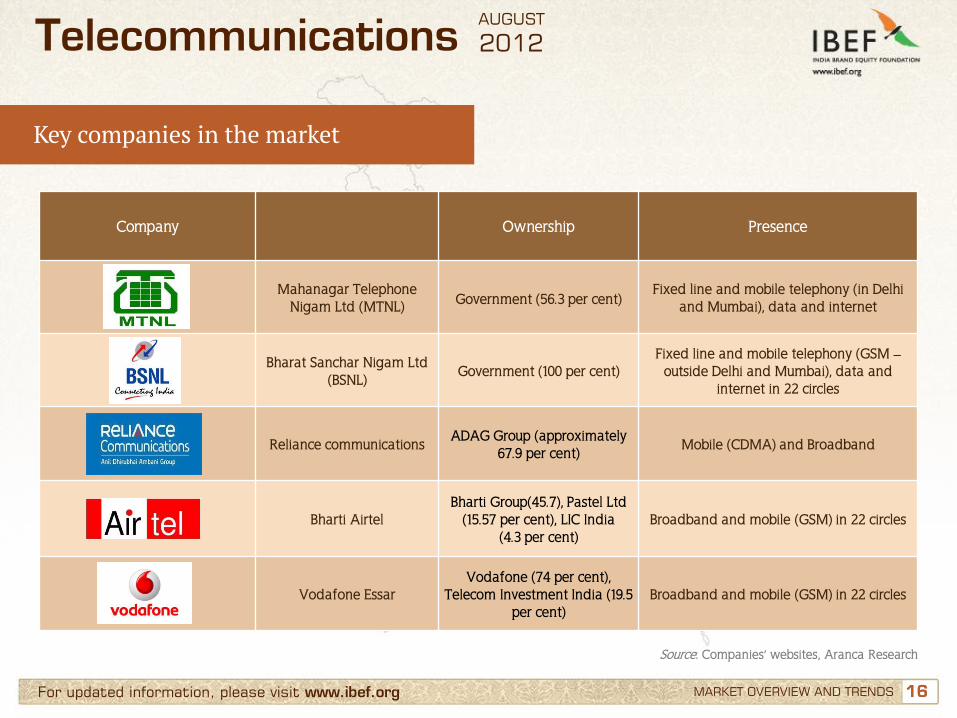
Key companies in the market
Telecommunications
Company Ownership Presence
Mahanagar Telephone Nigam Ltd (MTNL) Government (56.3 per cent)
Fixed line and mobile telephony (in Delhi and Mumbai), data and internet
Bharat Sanchar Nigam Ltd (BSNL)
Government (100 per cent) Fixed line and mobile telephony (GSM –
outside Delhi and Mumbai), data and internet in 22 circles
Reliance communications ADAG Group (approximately
67.9 per cent) Mobile (CDMA) and Broadband
Bharti Airtel Bharti Group(45.7), Pastel Ltd
(15.57 per cent), LIC India (4.3 per cent)
Broadband and mobile (GSM) in 22 circles
Vodafone Essar Vodafone (74 per cent),
Telecom Investment India (19.5 per cent)
Broadband and mobile (GSM) in 22 circles
Source: Companies’ websites, Aranca Research
AUGUST
2012
17 17 For updated information, please visit www.ibef.org MARKET OVERVIEW AND TRENDS
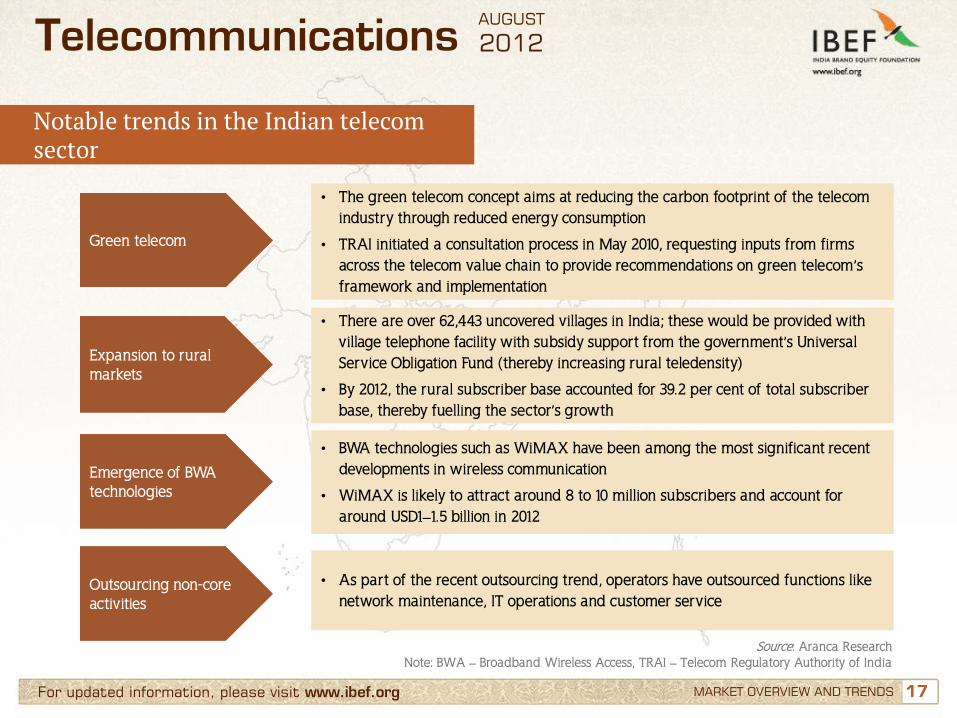
Notable trends in the Indian telecom sector
Telecommunications
Green telecom
• The green telecom concept aims at reducing the carbon footprint of the telecom industry through reduced energy consumption
• TRAI initiated a consultation process in May 2010, requesting inputs from firms across the telecom value chain to provide recommendations on green telecom’s framework and implementation
Expansion to rural markets
• There are over 62,443 uncovered villages in India; these would be provided with village telephone facility with subsidy support from the government’s Universal Service Obligation Fund (thereby increasing rural teledensity)
• By 2012, the rural subscriber base accounted for 39.2 per cent of total subscriber base, thereby fuelling the sector’s growth
Emergence of BWA technologies
• BWA technologies such as WiMAX have been among the most significant recent developments in wireless communication
• WiMAX is likely to attract around 8 to 10 million subscribers and account for around USD1–1.5 billion in 2012
Outsourcing non-core activities
• As part of the recent outsourcing trend, operators have outsourced functions like network maintenance, IT operations and customer service
Source: Aranca Research Note: BWA – Broadband Wireless Access, TRAI – Telecom Regulatory Authority of India
AUGUST
2012
18 18
Contents
Advantage India
Market overview and trends
Growth drivers
Success stories: Airtel, Vodafone
Opportunities
Useful information
For updated information, please visit www.ibef.org
Telecommunications AUGUST
2012
19 19 For updated information, please visit www.ibef.org GROWTH DRIVERS
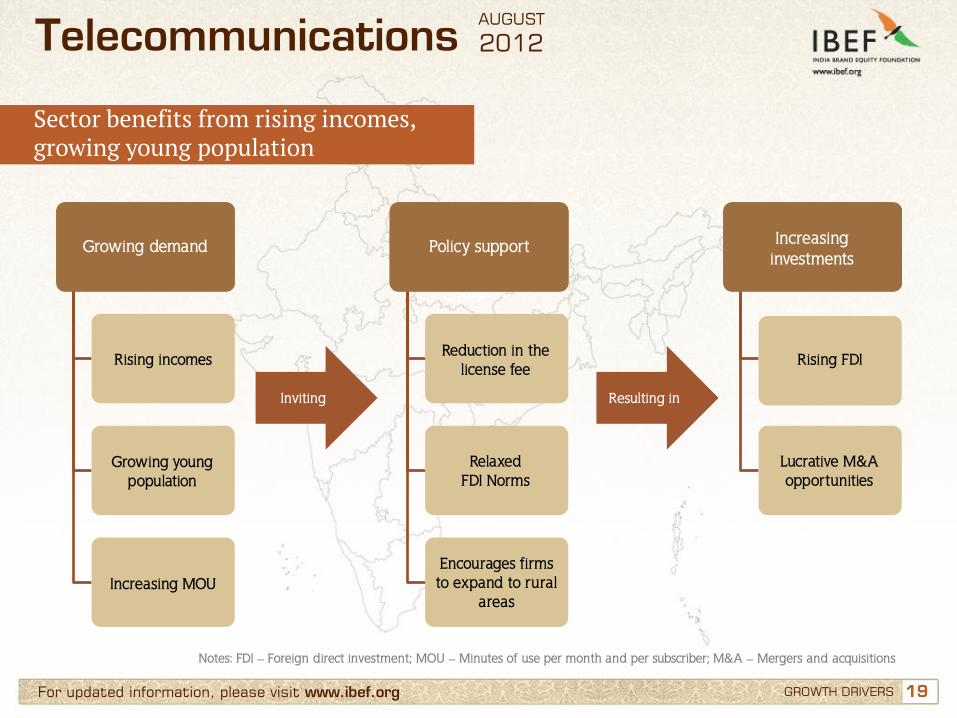
Sector benefits from rising incomes, growing young population
Strong
government
support
Inviting Resulting in
Growing demand Policy support Increasing investments
Rising incomes Reduction in the
license fee Rising FDI
Growing young population
Relaxed FDI Norms
Lucrative M&A opportunities
Increasing MOU Encourages firms to expand to rural
areas
Telecommunications
Notes: FDI – Foreign direct investment; MOU – Minutes of use per month and per subscriber; M&A – Mergers and acquisitions
AUGUST
2012
20 20 For updated information, please visit www.ibef.org
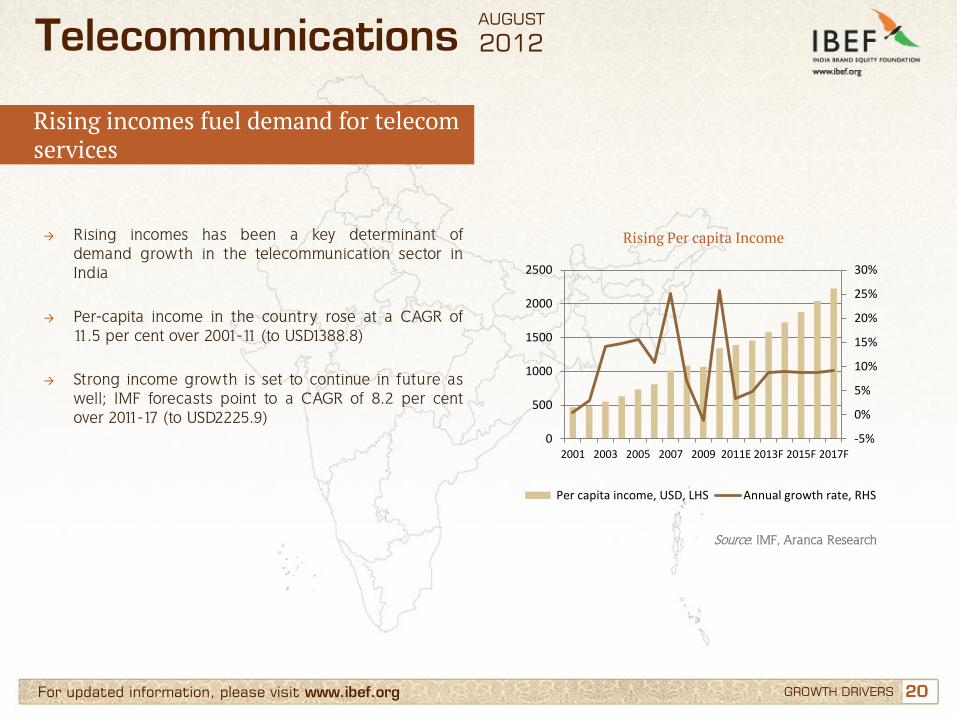
Rising incomes fuel demand for telecom services
GROWTH DRIVERS
Telecommunications
→ Rising incomes has been a key determinant of demand growth in the telecommunication sector in India
→ Per-capita income in the country rose at a CAGR of 11.5 per cent over 2001-11 (to USD1388.8)
→ Strong income growth is set to continue in future as well; IMF forecasts point to a CAGR of 8.2 per cent over 2011-17 (to USD2225.9)
Rising Per capita Income
Source: IMF, Aranca Research
-5%
0%
5%
10%
15%
20%
25%
30%
0
500
1000
1500
2000
2500
2001 2003 2005 2007 2009 2011E 2013F 2015F 2017F
Per capita income, USD, LHS Annual growth rate, RHS
AUGUST
2012
21 21 For updated information, please visit www.ibef.org GROWTH DRIVERS
Telecommunications
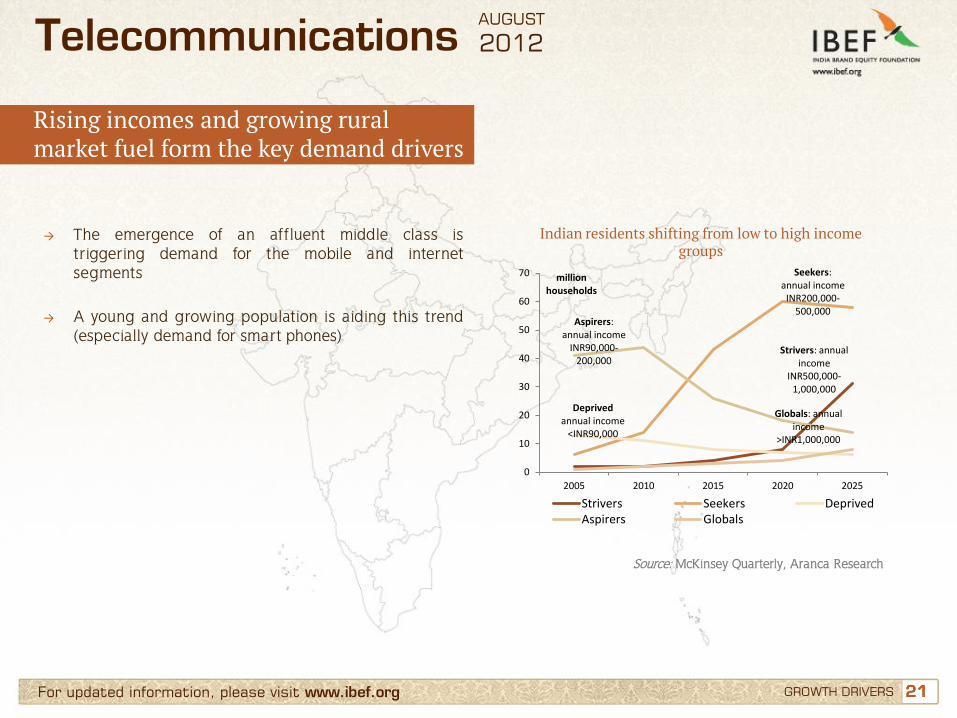
Rising incomes and growing rural market fuel form the key demand drivers
→ The emergence of an affluent middle class is triggering demand for the mobile and internet segments
→ A young and growing population is aiding this trend (especially demand for smart phones)
Indian residents shifting from low to high income groups
Source: McKinsey Quarterly, Aranca Research
Strivers: annual income
INR500,000-1,000,000
Seekers: annual income
INR200,000-500,000
Deprived annual income
<INR90,000
Aspirers: annual income
INR90,000-200,000
Globals: annual income
>INR1,000,000
0
10
20
30
40
50
60
70
2005 2010 2015 2020 2025
million households
Strivers Seekers DeprivedAspirers Globals
AUGUST
2012
22 22 For updated information, please visit www.ibef.org GROWTH DRIVERS
Telecommunications
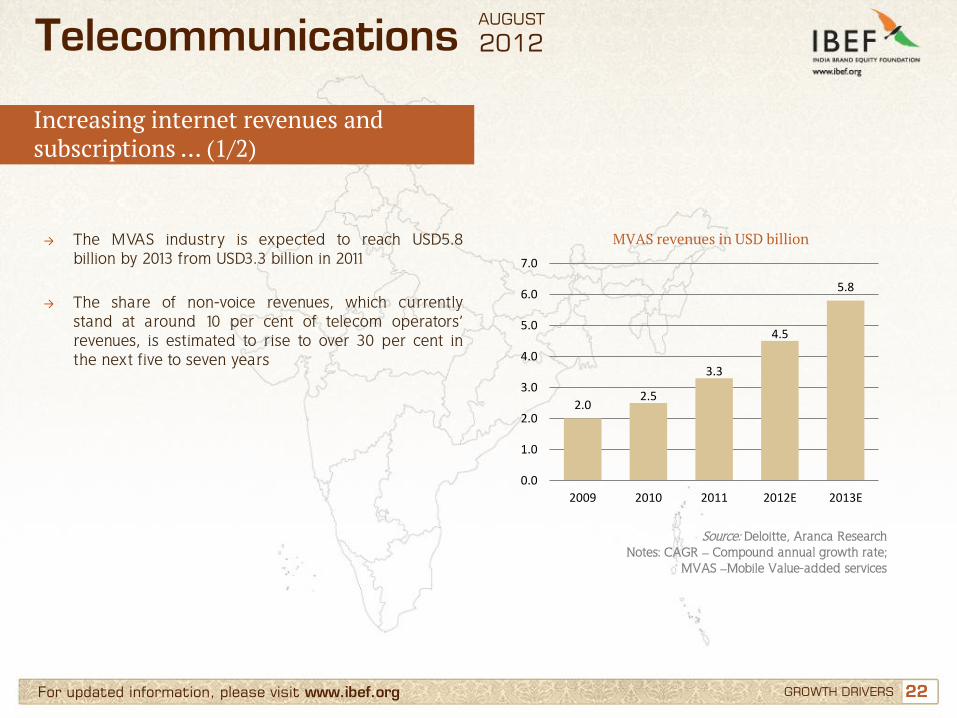
Increasing internet revenues and subscriptions … (1/2)
→ The MVAS industry is expected to reach USD5.8 billion by 2013 from USD3.3 billion in 2011
→ The share of non-voice revenues, which currently
stand at around 10 per cent of telecom operators’ revenues, is estimated to rise to over 30 per cent in the next five to seven years
MVAS revenues in USD billion
Source: Deloitte, Aranca Research Notes: CAGR – Compound annual growth rate;
MVAS –Mobile Value-added services
2.0 2.5
3.3
4.5
5.8
0.0
1.0
2.0
3.0
4.0
5.0
6.0
7.0
2009 2010 2011 2012E 2013E
AUGUST
2012
23 23 For updated information, please visit www.ibef.org GROWTH DRIVERS
Telecommunications
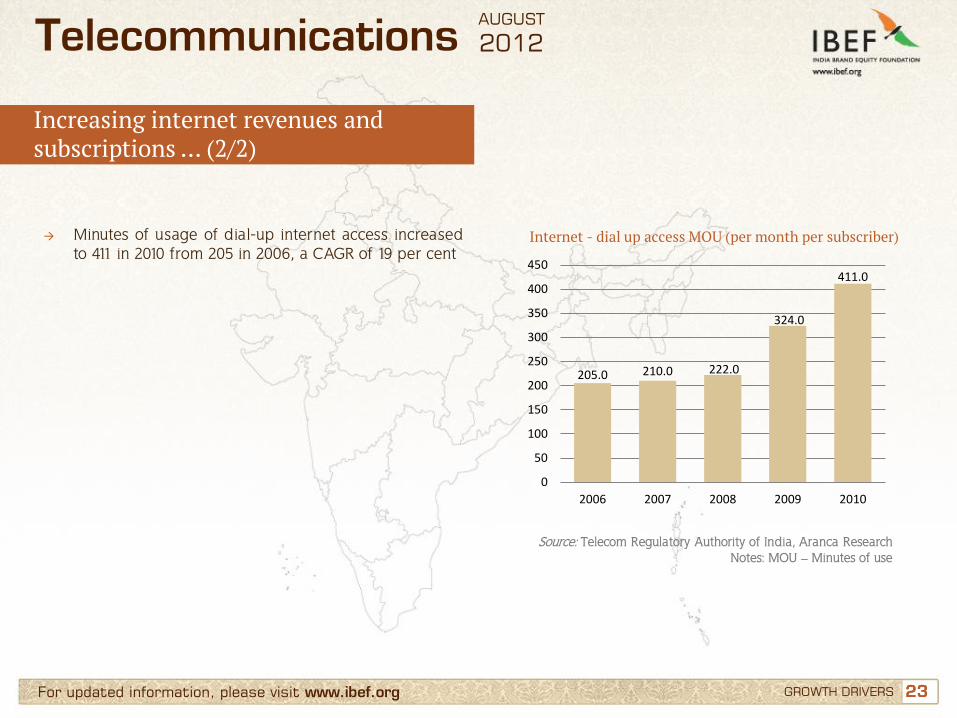
Increasing internet revenues and subscriptions … (2/2)
→ Minutes of usage of dial-up internet access increased to 411 in 2010 from 205 in 2006, a CAGR of 19 per cent
Internet - dial up access MOU (per month per subscriber)
Source: Telecom Regulatory Authority of India, Aranca Research Notes: MOU – Minutes of use
205.0 210.0 222.0
324.0
411.0
0
50
100
150
200
250
300
350
400
450
2006 2007 2008 2009 2010
AUGUST
2012
24 24 For updated information, please visit www.ibef.org GROWTH DRIVERS
Telecommunications
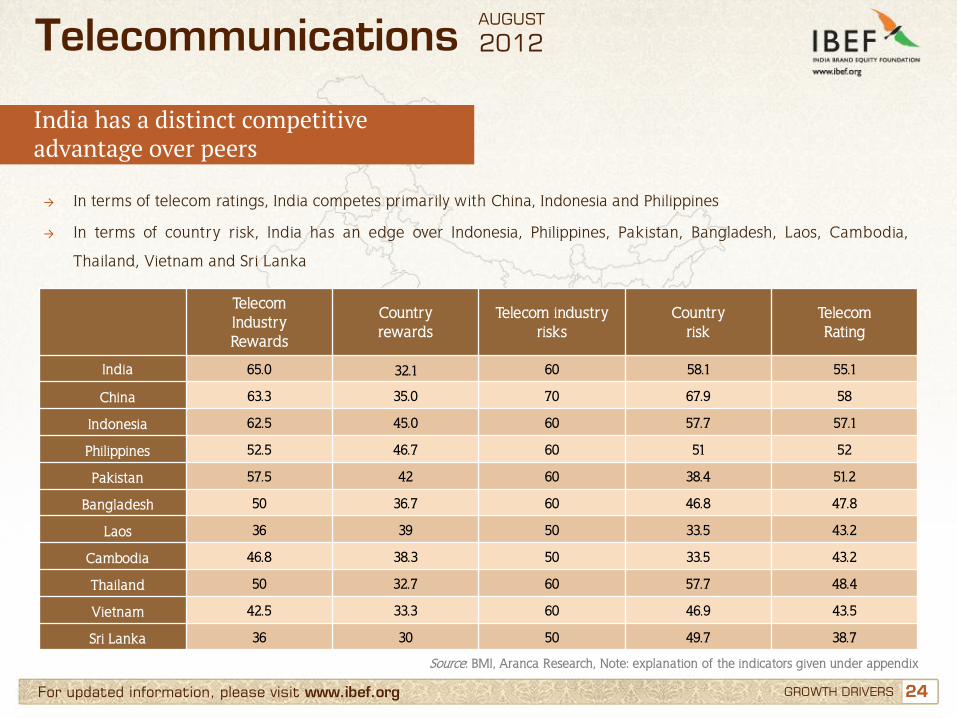
India has a distinct competitive advantage over peers
→ In terms of telecom ratings, India competes primarily with China, Indonesia and Philippines
→ In terms of country risk, India has an edge over Indonesia, Philippines, Pakistan, Bangladesh, Laos, Cambodia,
Thailand, Vietnam and Sri Lanka
Telecom Industry Rewards
Country rewards
Telecom industry risks
Country risk
Telecom Rating
India 65.0 32.1 60 58.1 55.1
China 63.3 35.0 70 67.9 58
Indonesia 62.5 45.0 60 57.7 57.1
Philippines 52.5 46.7 60 51 52
Pakistan 57.5 42 60 38.4 51.2
Bangladesh 50 36.7 60 46.8 47.8
Laos 36 39 50 33.5 43.2
Cambodia 46.8 38.3 50 33.5 43.2
Thailand 50 32.7 60 57.7 48.4
Vietnam 42.5 33.3 60 46.9 43.5
Sri Lanka 36 30 50 49.7 38.7
Source: BMI, Aranca Research, Note: explanation of the indicators given under appendix
AUGUST
2012
25 25 For updated information, please visit www.ibef.org GROWTH DRIVERS
Telecommunications
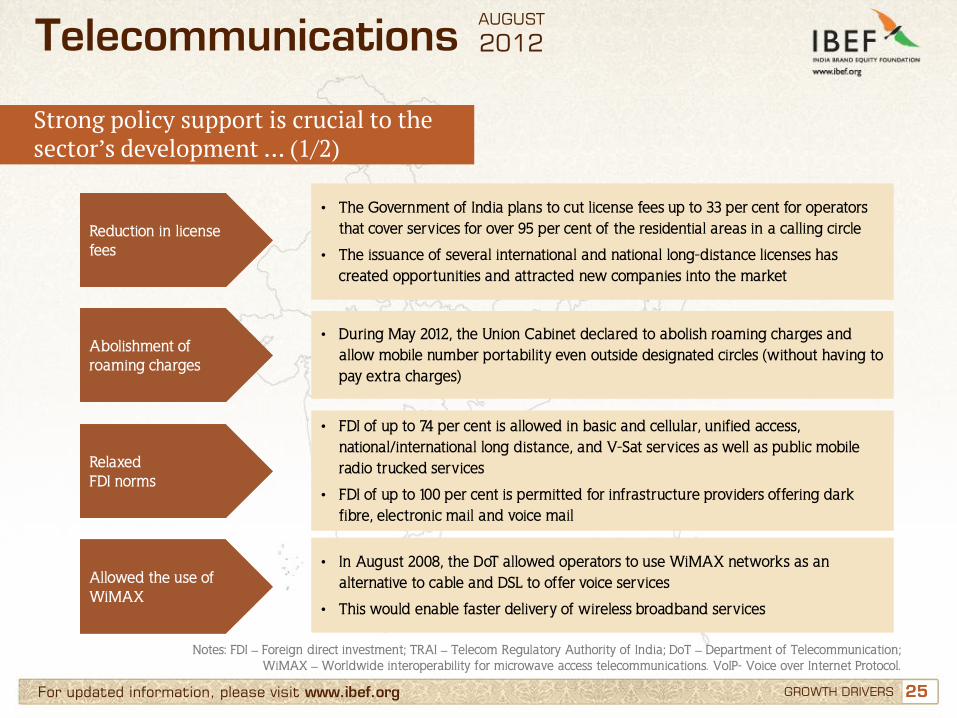
Strong policy support is crucial to the sector’s development … (1/2)
Reduction in license fees
• The Government of India plans to cut license fees up to 33 per cent for operators that cover services for over 95 per cent of the residential areas in a calling circle
• The issuance of several international and national long-distance licenses has created opportunities and attracted new companies into the market
Abolishment of roaming charges
• During May 2012, the Union Cabinet declared to abolish roaming charges and allow mobile number portability even outside designated circles (without having to pay extra charges)
Relaxed FDI norms
• FDI of up to 74 per cent is allowed in basic and cellular, unified access, national/international long distance, and V-Sat services as well as public mobile radio trucked services
• FDI of up to 100 per cent is permitted for infrastructure providers offering dark fibre, electronic mail and voice mail
Allowed the use of WiMAX
• In August 2008, the DoT allowed operators to use WiMAX networks as an alternative to cable and DSL to offer voice services
• This would enable faster delivery of wireless broadband services
Notes: FDI – Foreign direct investment; TRAI – Telecom Regulatory Authority of India; DoT – Department of Telecommunication; WiMAX – Worldwide interoperability for microwave access telecommunications. VoIP- Voice over Internet Protocol.
AUGUST
2012
26 26 For updated information, please visit www.ibef.org GROWTH DRIVERS
Telecommunications
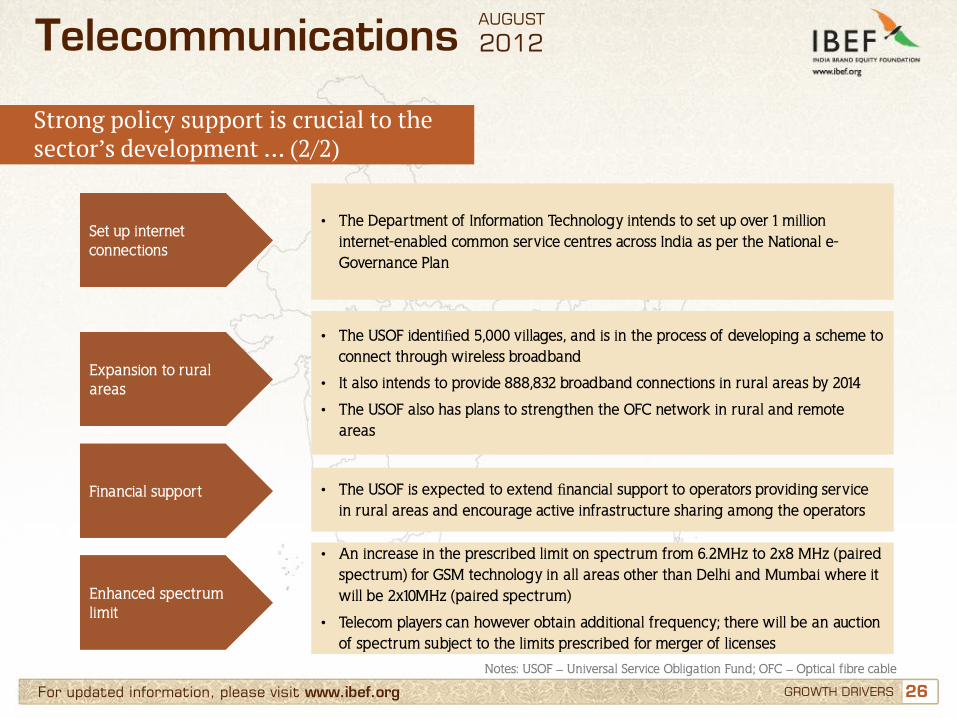
Strong policy support is crucial to the sector’s development … (2/2)
Set up internet connections
• The Department of Information Technology intends to set up over 1 million internet-enabled common service centres across India as per the National e-Governance Plan
Expansion to rural areas
• The USOF identified 5,000 villages, and is in the process of developing a scheme to connect through wireless broadband
• It also intends to provide 888,832 broadband connections in rural areas by 2014
• The USOF also has plans to strengthen the OFC network in rural and remote areas
Financial support • The USOF is expected to extend financial support to operators providing service in rural areas and encourage active infrastructure sharing among the operators
Notes: USOF – Universal Service Obligation Fund; OFC – Optical fibre cable
Enhanced spectrum limit
• An increase in the prescribed limit on spectrum from 6.2MHz to 2x8 MHz (paired spectrum) for GSM technology in all areas other than Delhi and Mumbai where it will be 2x10MHz (paired spectrum)
• Telecom players can however obtain additional frequency; there will be an auction of spectrum subject to the limits prescribed for merger of licenses
AUGUST
2012
27 27 For updated information, please visit www.ibef.org GROWTH DRIVERS
Telecommunications
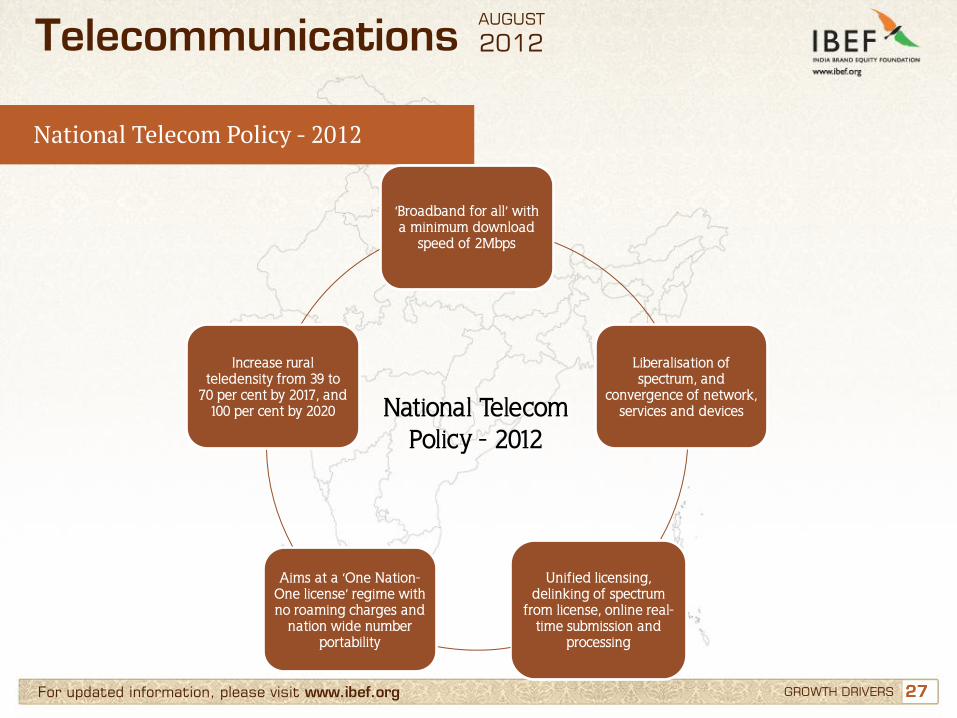
National Telecom Policy - 2012
‘Broadband for all’ with a minimum download
speed of 2Mbps
Liberalisation of spectrum, and
convergence of network, services and devices
Unified licensing, delinking of spectrum
from license, online real-time submission and
processing
Aims at a ‘One Nation-One license’ regime with no roaming charges and
nation wide number portability
Increase rural teledensity from 39 to
70 per cent by 2017, and 100 per cent by 2020 National Telecom
Policy - 2012
AUGUST
2012
28 28 For updated information, please visit www.ibef.org GROWTH DRIVERS
Telecommunications
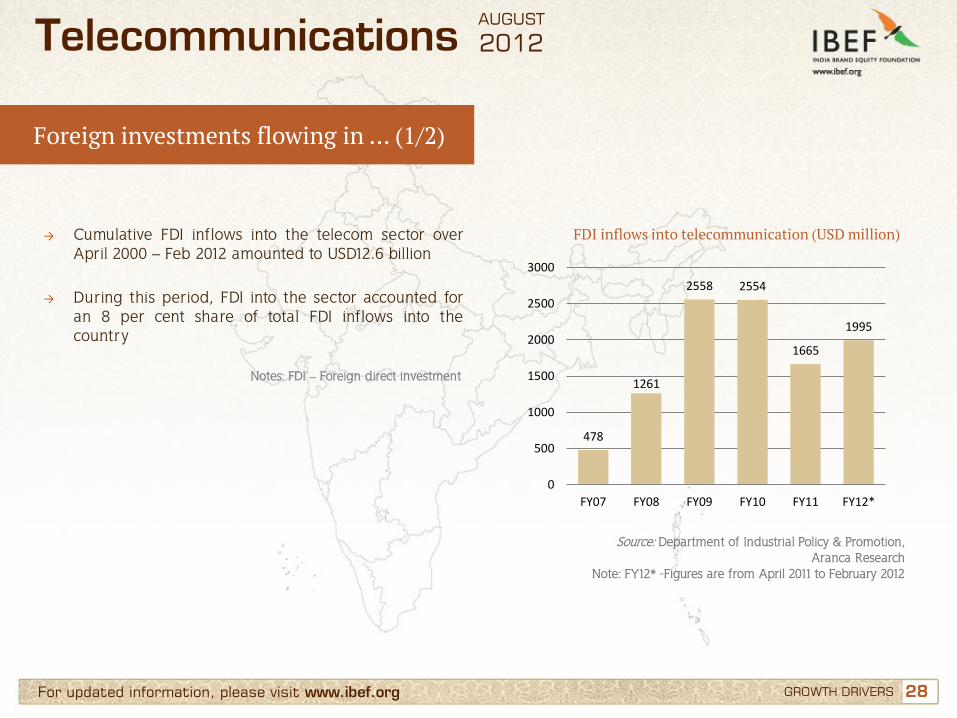
Foreign investments flowing in … (1/2)
→ Cumulative FDI inflows into the telecom sector over April 2000 – Feb 2012 amounted to USD12.6 billion
→ During this period, FDI into the sector accounted for
an 8 per cent share of total FDI inflows into the country
FDI inflows into telecommunication (USD million)
Source: Department of Industrial Policy & Promotion, Aranca Research
Note: FY12* -Figures are from April 2011 to February 2012
Notes: FDI – Foreign direct investment
478
1261
2558 2554
1665
1995
0
500
1000
1500
2000
2500
3000
FY07 FY08 FY09 FY10 FY11 FY12*
AUGUST
2012

29 29 For updated information, please visit www.ibef.org GROWTH DRIVERS
Telecommunications
Foreign investments flowing in … (2/2)
→ In 2010, the telecom sector’s M&A deal value stood at USD14.6 billion (29.4 per cent of the total M&A deal value)
Source: Thomson Banker, Deal Tracker, Aranca Research Notes: M&A – Merger and acquisition
Merger and Acquisition deals (2010 to 2012)
Target Acquirer
Acquisition price (USD
million)
Division acquired
Qualcomm India Pvt Ltd
Bharti Airtel Ltd
(2012)
165
Broadband wireless access
Zain’s African
operations
Bharti Airtel Ltd (2010)
11 Entire business
Radiacion Kavveri Telecom
Products Ltd (2011)
27.5 Telecom unit
Kavveri Telecom Products Ltd
Investor Group (2010)
9.9 -
Tata AutoComp Mobility
Trimble Navigation Ltd
(2010) 5.1 -
Eduexel Infotainment Ltd
Discovery Infoways Ltd
(2010) 0.9 -
AUGUST
2012
30 30
Contents
Advantage India
Market overview and trends
Growth drivers
Success stories: Airtel, Vodafone
Opportunities
Useful information
For updated information, please visit www.ibef.org
Telecommunications AUGUST
2012
31 31 For updated information, please visit www.ibef.org SUCCESS STORIES: AIRTEL, VODAFONE
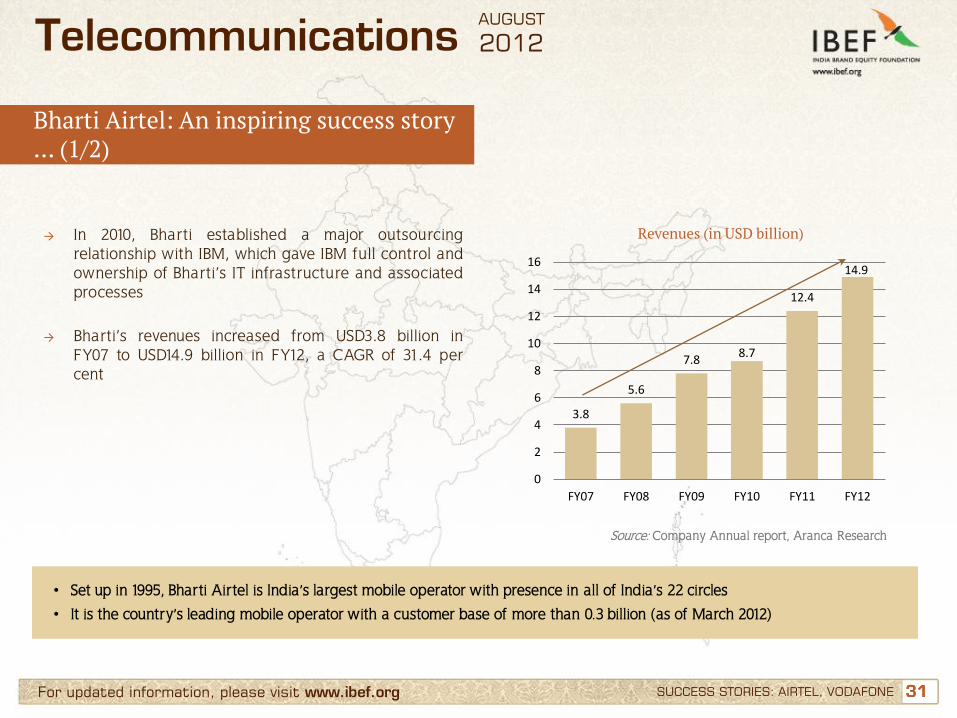
Bharti Airtel: An inspiring success story … (1/2)
Telecommunications
• Set up in 1995, Bharti Airtel is India’s largest mobile operator with presence in all of India’s 22 circles
• It is the country’s leading mobile operator with a customer base of more than 0.3 billion (as of March 2012)
→ In 2010, Bharti established a major outsourcing relationship with IBM, which gave IBM full control and ownership of Bharti’s IT infrastructure and associated processes
→ Bharti’s revenues increased from USD3.8 billion in FY07 to USD14.9 billion in FY12, a CAGR of 31.4 per cent
Revenues (in USD billion)
Source: Company Annual report, Aranca Research
3.8
5.6
7.8 8.7
12.4
14.9
0
2
4
6
8
10
12
14
16
FY07 FY08 FY09 FY10 FY11 FY12
AUGUST
2012
32 32 For updated information, please visit www.ibef.org SUCCESS STORIES: AIRTEL, VODAFONE
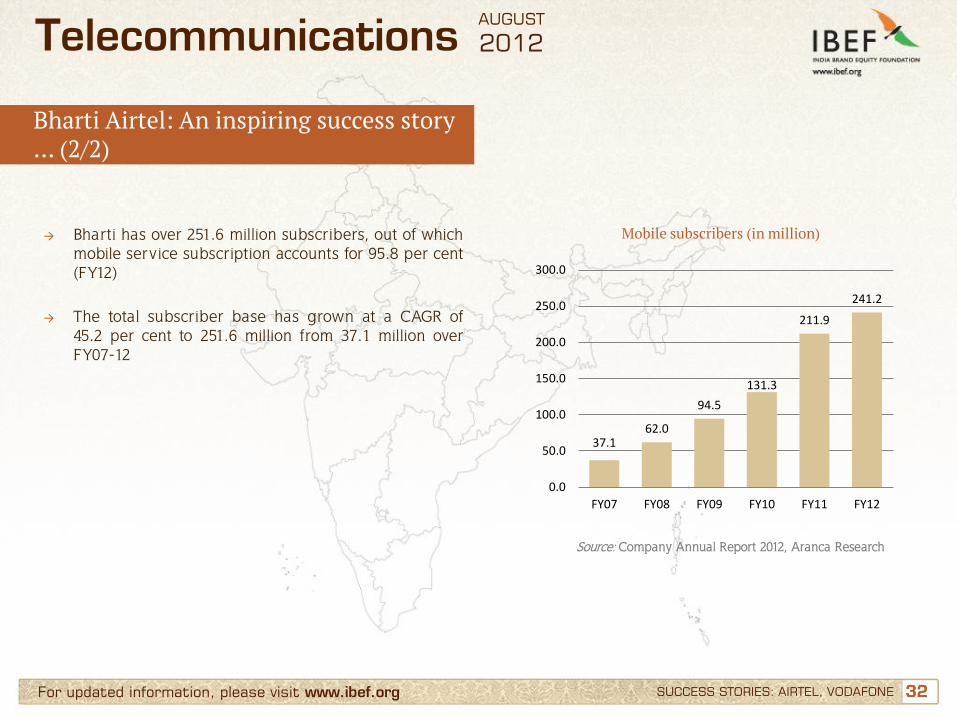
Bharti Airtel: An inspiring success story … (2/2)
Telecommunications
→ Bharti has over 251.6 million subscribers, out of which mobile service subscription accounts for 95.8 per cent (FY12)
→ The total subscriber base has grown at a CAGR of 45.2 per cent to 251.6 million from 37.1 million over FY07-12
Mobile subscribers (in million)
Source: Company Annual Report 2012, Aranca Research
37.1 62.0
94.5
131.3
211.9
241.2
0.0
50.0
100.0
150.0
200.0
250.0
300.0
FY07 FY08 FY09 FY10 FY11 FY12
AUGUST
2012
33 33 For updated information, please visit www.ibef.org SUCCESS STORIES: AIRTEL, VODAFONE
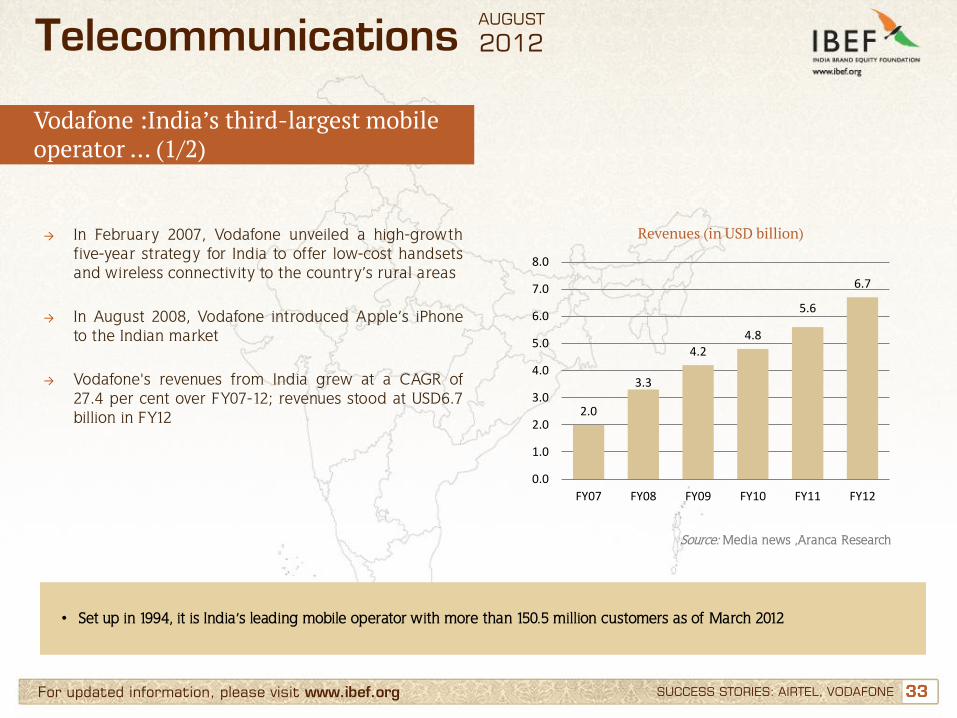
Vodafone :India’s third-largest mobile operator … (1/2)
Telecommunications
• Set up in 1994, it is India’s leading mobile operator with more than 150.5 million customers as of March 2012
→ In February 2007, Vodafone unveiled a high-growth five-year strategy for India to offer low-cost handsets and wireless connectivity to the country’s rural areas
→ In August 2008, Vodafone introduced Apple’s iPhone to the Indian market
→ Vodafone's revenues from India grew at a CAGR of 27.4 per cent over FY07-12; revenues stood at USD6.7 billion in FY12
Revenues (in USD billion)
Source: Media news ,Aranca Research
2.0
3.3
4.2 4.8
5.6
6.7
0.0
1.0
2.0
3.0
4.0
5.0
6.0
7.0
8.0
FY07 FY08 FY09 FY10 FY11 FY12
AUGUST
2012
34 34 For updated information, please visit www.ibef.org SUCCESS STORIES: AIRTEL, VODAFONE
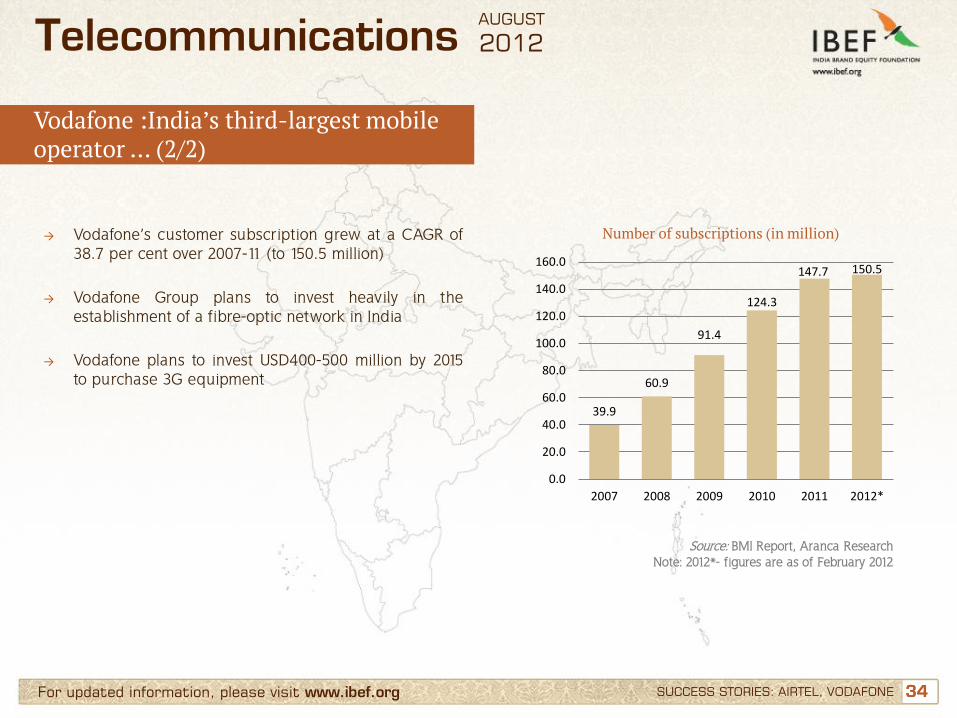
Vodafone :India’s third-largest mobile operator … (2/2)
Telecommunications
→ Vodafone’s customer subscription grew at a CAGR of 38.7 per cent over 2007-11 (to 150.5 million)
→ Vodafone Group plans to invest heavily in the establishment of a fibre-optic network in India
→ Vodafone plans to invest USD400-500 million by 2015
to purchase 3G equipment
Number of subscriptions (in million)
Source: BMI Report, Aranca Research Note: 2012*- figures are as of February 2012
39.9
60.9
91.4
124.3
147.7 150.5
0.0
20.0
40.0
60.0
80.0
100.0
120.0
140.0
160.0
2007 2008 2009 2010 2011 2012*
AUGUST
2012
35 35
Contents
Advantage India
Market overview and trends
Growth drivers
Success stories: Airtel, Vodafone
Opportunities
Useful information
For updated information, please visit www.ibef.org
Telecommunications AUGUST
2012
36 36 For updated information, please visit www.ibef.org OPPORTUNITIES
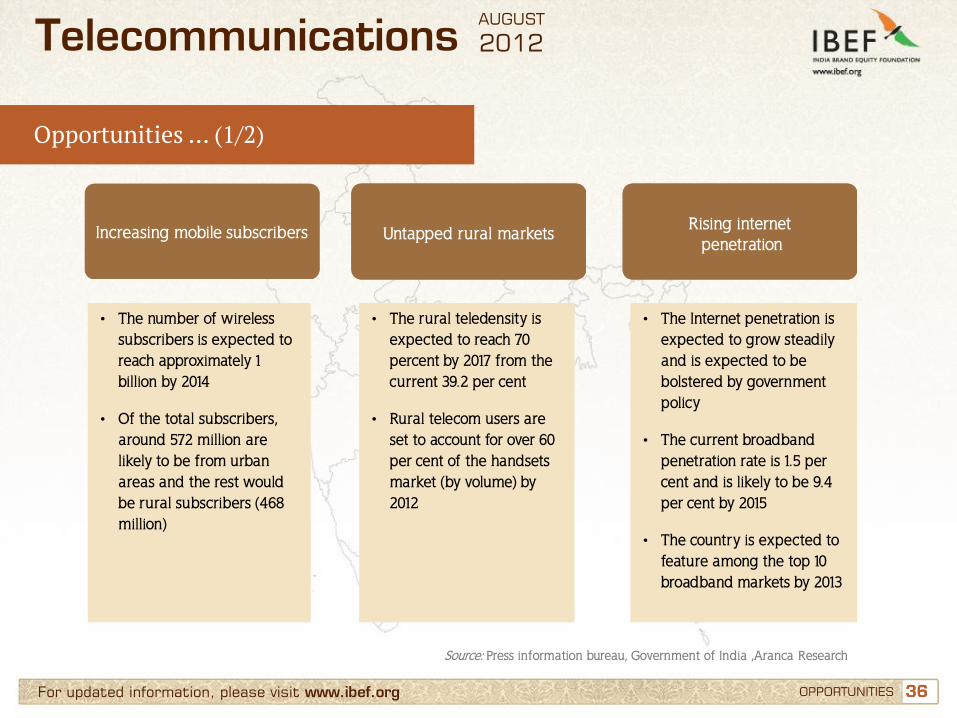
Opportunities … (1/2)
• The number of wireless subscribers is expected to reach approximately 1 billion by 2014
• Of the total subscribers, around 572 million are likely to be from urban areas and the rest would be rural subscribers (468 million)
• The rural teledensity is expected to reach 70 percent by 2017 from the current 39.2 per cent
• Rural telecom users are set to account for over 60 per cent of the handsets market (by volume) by 2012
• The Internet penetration is expected to grow steadily and is expected to be bolstered by government policy
• The current broadband penetration rate is 1.5 per cent and is likely to be 9.4 per cent by 2015
• The country is expected to feature among the top 10 broadband markets by 2013
Increasing mobile subscribers Untapped rural markets Rising internet penetration
Telecommunications
Source: Press information bureau, Government of India ,Aranca Research
AUGUST
2012
37 37 For updated information, please visit www.ibef.org OPPORTUNITIES
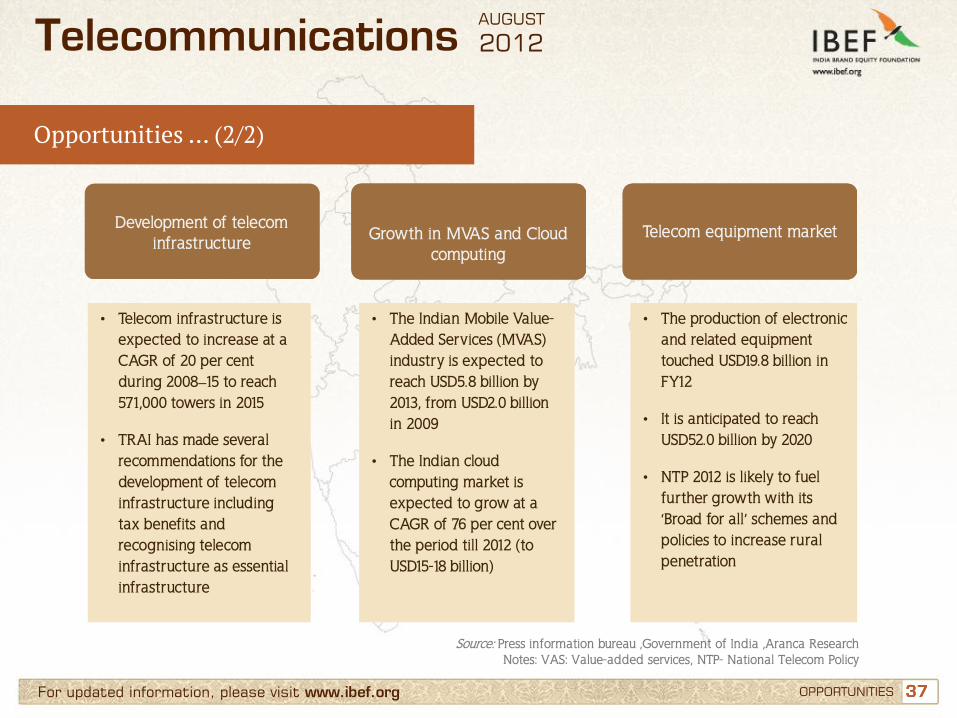
Opportunities … (2/2)
• Telecom infrastructure is expected to increase at a CAGR of 20 per cent during 2008–15 to reach 571,000 towers in 2015
• TRAI has made several recommendations for the development of telecom infrastructure including tax benefits and recognising telecom infrastructure as essential infrastructure
• The Indian Mobile Value-Added Services (MVAS) industry is expected to reach USD5.8 billion by 2013, from USD2.0 billion in 2009
• The Indian cloud computing market is expected to grow at a CAGR of 76 per cent over the period till 2012 (to USD15-18 billion)
• The production of electronic and related equipment touched USD19.8 billion in FY12
• It is anticipated to reach USD52.0 billion by 2020
• NTP 2012 is likely to fuel further growth with its ‘Broad for all’ schemes and policies to increase rural penetration
Development of telecom infrastructure Growth in MVAS and Cloud
computing Telecom equipment market
Telecommunications
Source: Press information bureau ,Government of India ,Aranca Research Notes: VAS: Value-added services, NTP- National Telecom Policy
AUGUST
2012
38 38
Contents
Advantage India
Market overview and trends
Growth drivers
Success stories: Airtel, Vodafone
Opportunities
Useful information
For updated information, please visit www.ibef.org
Telecommunications AUGUST
2012
39 39 For updated information, please visit www.ibef.org USEFUL INFORMATION
Industry Associations
Telecommunications
Association Of Unified Telecom Service Providers Of India (AUSPI) B-601, Gauri Sadan 5, Hailey Road, New Delhi – 110 001, India Tel: 91 11 23358585 Fax: 91 11 23327397 Website: http://www.auspi.in/ Association Of Competitive Telecom Operators (ACTO) 601, Nirmal Tower, 26, Barakhamba Road, Connaught Place, New Delhi – 110 001, India Tel.: 91 11 43565353 / 43575353 Fax: 91 11 43515353 E-mail: [email protected] Website: www.acto.in Internet & Mobile Association Of India (IAMAI) F-36, Basement, East of Kailash, New Delhi – 110 065, India Tel: 91 11 46570328 E-mail: [email protected] Website: www.iwww.iamai.in
AUGUST
2012
40 40 For updated information, please visit www.ibef.org
Appendix
BMI telecoms business environment ratings → Industry rewards: it considers Average revenue per users, number of subscribers, subscriber growth, and number
of operators
→ Country rewards: it considers urban/rural split, age range, GDP per capita, USD
→ Industry risks: it considers regulatory independence
→ Country risk: it rates the country on short-term external risk, policy continuity, legal framework corruption
→ Telecom ratings: overall rating of the above indicators
USEFUL INFORMATION
Telecommunications AUGUST
2012
41 41 For updated information, please visit www.ibef.org
Glossary … (1/2)
→ BWA: Broadband wireless access
→ CAGR : Compound annual growth rate
→ DoT: Department of Telecommunication
→ FDI: Foreign direct investment
→ FTTH: Fibre to the home
→ FY: Indian financial year (April to March)
→ IMF: International Monetary Fund
→ INR: Indian Rupee
→ IPTV Internet protocol television
→ M&A: Mergers and acquisitions
→ MoU: Minutes of use per month and per subscriber
→ MPEG: Moving Picture Experts Group
USEFUL INFORMATION
Telecommunications AUGUST
2012
42 42 For updated information, please visit www.ibef.org
Glossary … (2/2)
→ OFC: Optical fibre cable
→ TRAI: Telecom Regulatory Authority of India
→ USOF: Universal Service Obligation Fund
→ USD: US Dollar → Conversion rate used: USD1 = INR48, HKD1 = USD0.128, GBP1 = USD1.854
→ VAS: Value-added services
→ WiMAX: Worldwide Interoperability for microwave access telecommunications
→ Wherever applicable, numbers have been rounded off to the nearest whole number
USEFUL INFORMATION
Telecommunications AUGUST
2012
43
India Brand Equity Foundation (IBEF) engaged Aranca to prepare this presentation and the same has been prepared by Aranca in consultation with IBEF. All rights reserved. All copyright in this presentation and related works is solely and exclusively owned by IBEF. The same may not be reproduced, wholly or in part in any material form (including photocopying or storing it in any medium by electronic means and whether or not transiently or incidentally to some other use of this presentation), modified or in any manner communicated to any third party except with the written approval of IBEF. This presentation is for information purposes only. While due care has been taken during the compilation of this
presentation to ensure that the information is accurate to the best of Aranca and IBEF’s knowledge and belief, the content is not to be construed in any manner whatsoever as a substitute for professional advice. Aranca and IBEF neither recommend nor endorse any specific products or services that may have been mentioned in this presentation and nor do they assume any liability or responsibility for the outcome of decisions taken as a result of any reliance placed on this presentation. Neither Aranca nor IBEF shall be liable for any direct or indirect damages that may arise due to any act or omission on the part of the user due to any reliance placed or guidance taken from any portion of this presentation.
Disclaimer
For updated information, please visit www.ibef.org DISCLAIMER
Telecommunications AUGUST
2012