Embed Size (px)
Citation preview

Telecommunication Markets in the Nordic
Countries
1
- Per 31.12.2011 -

About the Nordstat database
Established 2007 A descriptive database A selected number of variables that is comparable between the
Nordic countries A dynamic database that will change and grow with developments in
the telecom markets The figures are collected, gathered and validated by the Nordic
working group on statistics and definitions – Nordstat
If not stated otherwise the sources for all figures are the NRA and national statistical agency of each country
If not stated otherwise graphs includes figures for both private and business For more detailed information see the statistical portal under ’Tables’:
http://www.statistik.pts.se/PTSnordic/NordicCountries2011/indexNordic.html 2

Mobile Services
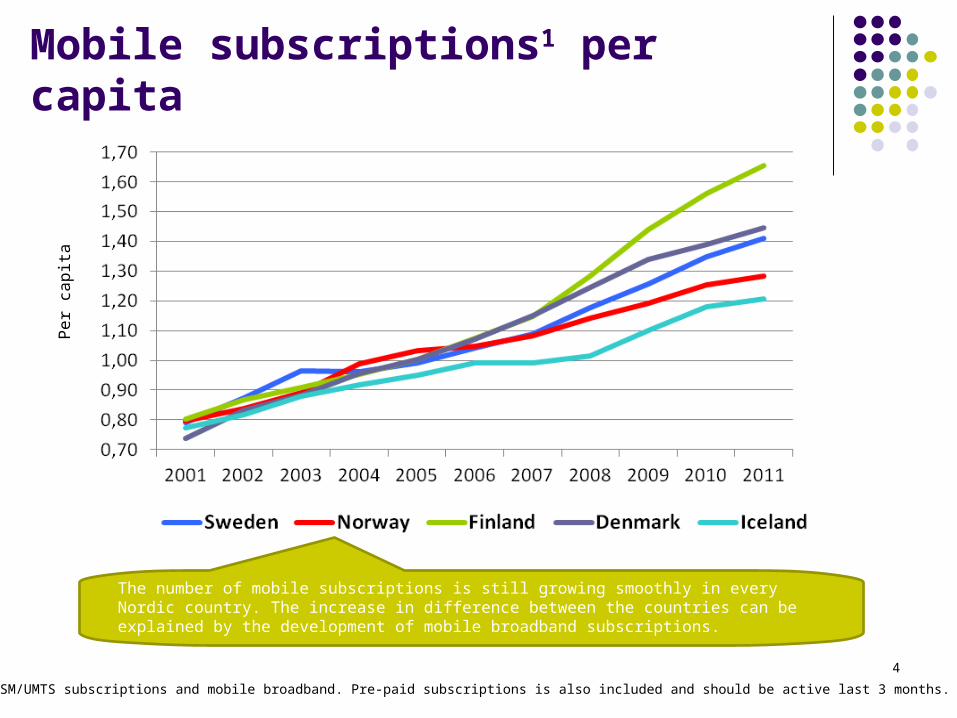
Mobile subscriptions1 per capita
The number of mobile subscriptions is still growing smoothly in every Nordic country. The increase in difference between the countries can be explained by the development of mobile broadband subscriptions.
41Including GSM/UMTS subscriptions and mobile broadband. Pre-paid subscriptions is also included and should be active last 3 months.
Pe
r ca
pita

1 Subscriptions is the average of the number of subscriptions at the beginning and end of each year. Exclusive mobile broadband subscriptions.
5
Mobile call minutes per subscription¹ in a year
Finland still has the highest usage of mobile telephony for speech. Finland also has the lowest penetration and usage of fixed telephony and of broadband telephony (VoIP). Denmark has the lowest minutes per subscription, but the highest use of SMS messages together with Sweden.
Min
utes
per
yea
r
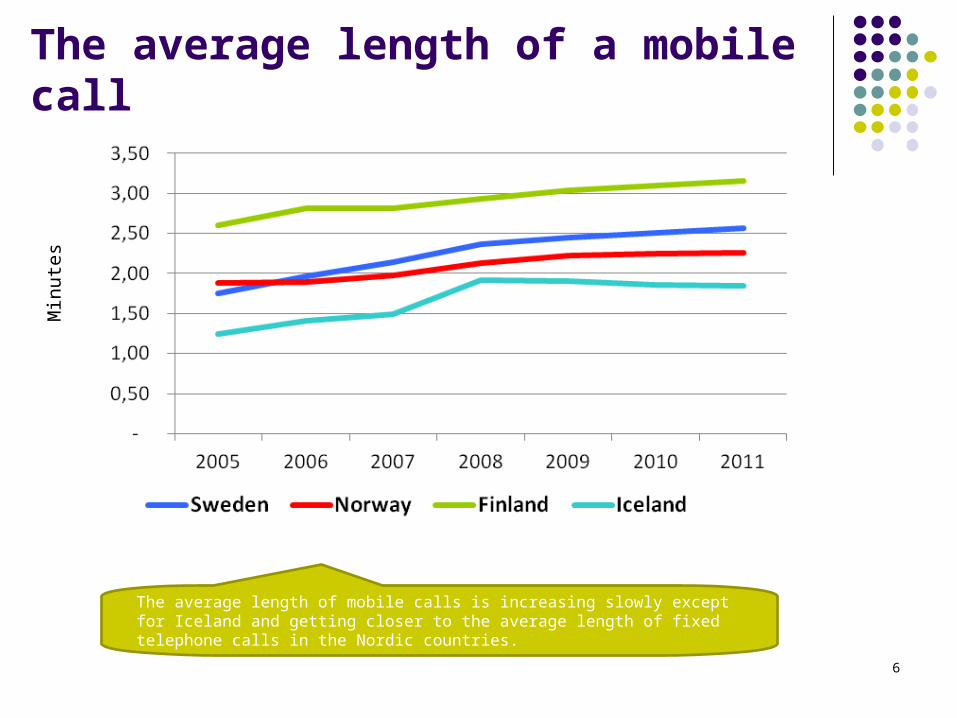
The average length of a mobile call
6
The average length of mobile calls is increasing slowly except for Iceland and getting closer to the average length of fixed telephone calls in the Nordic countries.
Min
utes

Average number of SMS messages sent per subscription1 in a year
SM
S p
er y
ear
7
Average number of SMS messages send per subscription in a year are decreasing in Denmark after a strong growth during the beginning of the decade. Number of SMS are also decreasing in Norway. The number of SMS messages has been increasing fast in Sweden, but in the last two years the development has been stabilizing. In Finland and Iceland the use of SMS messages have been quite modest.
1 Subscriptions is the average of the number of subscriptions at the beginning and end of each year. Exclusive mobile broadband subscriptions.

Data volume transferred over mobile networks, average Gbyte per subscription¹
Gby
te p
er y
ear
1Includes subscriptions and data traffic for both mobile and mobile broadband. 8
Data volumes transferred over mobile networks have increased fast in every Nordic country. The growth in data traffic is still above 50 percent yearly in all countries. It is the dedicated data subscriptions which generates most of the data traffic in mobile networks. Norway and Iceland has the lowest number of dedicated data subscriptions per capita, and Finland and Sweden the highest. This may be one of the reasons behind the relatively large difference in Gbyte per subscription. Sweden and Finland has fewer fixed broadband subscriptions per capita than the other countries.
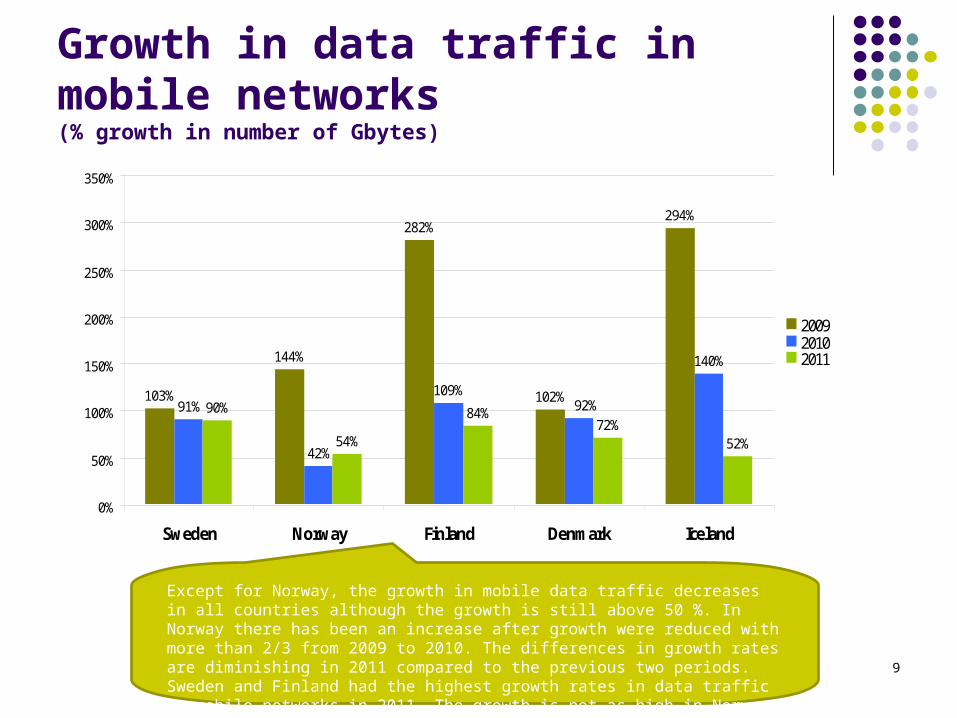
Growth in data traffic in mobile networks (% growth in number of Gbytes)
9
Except for Norway, the growth in mobile data traffic decreases in all countries although the growth is still above 50 %. In Norway there has been an increase after growth were reduced with more than 2/3 from 2009 to 2010. The differences in growth rates are diminishing in 2011 compared to the previous two periods. Sweden and Finland had the highest growth rates in data traffic in mobile networks in 2011. The growth is not as high in Norway and Iceland in 2011 than in the other Nordic countries.
103%
144%
282%
102%
294%
91%
42%
109%
140%
90%
54%
84%72%
52%
92%
0%
50%
100%
150%
200%
250%
300%
350%
Sweden Norway Finland Denmark Iceland
200920102011

Data volume transferred over mobile networks, average Gbyte per mobile broadband subscription¹
Gby
te p
er y
ear
1Includes data traffic for all mobile networks but only dedicated data subscriptions. Subscriptions is the average of the number of subscriptions at the beginning and end of each year. In 2011 Swedish and Danish dedicated data subscriptions used approx. 80 percent of the totale mobile data volume and in Iceland and Norway the dedicated data subscriptions used 90 and 73 percent of the total volume.
10
Swedish users have significantly higher usage than the rest of the Nordic countries using almost twice as much data per mobile broadband subscription as users in Denmark, which has the third highest volume per subscription. Finland, Sweden and Denmark has significant growth in data volume per subscription in 2011, while Norway and Iceland has more modest growth rates.
25,5
19,1
23,3
17,2 17,4
35,3
18,7
26,5
21,3 21,4
55,6
22,7
34,17
29,6
23,2
-
10
20
30
40
50
60
Sweden Norway Finland Denmark Iceland
2009
2010
2011

Fixed Call Services
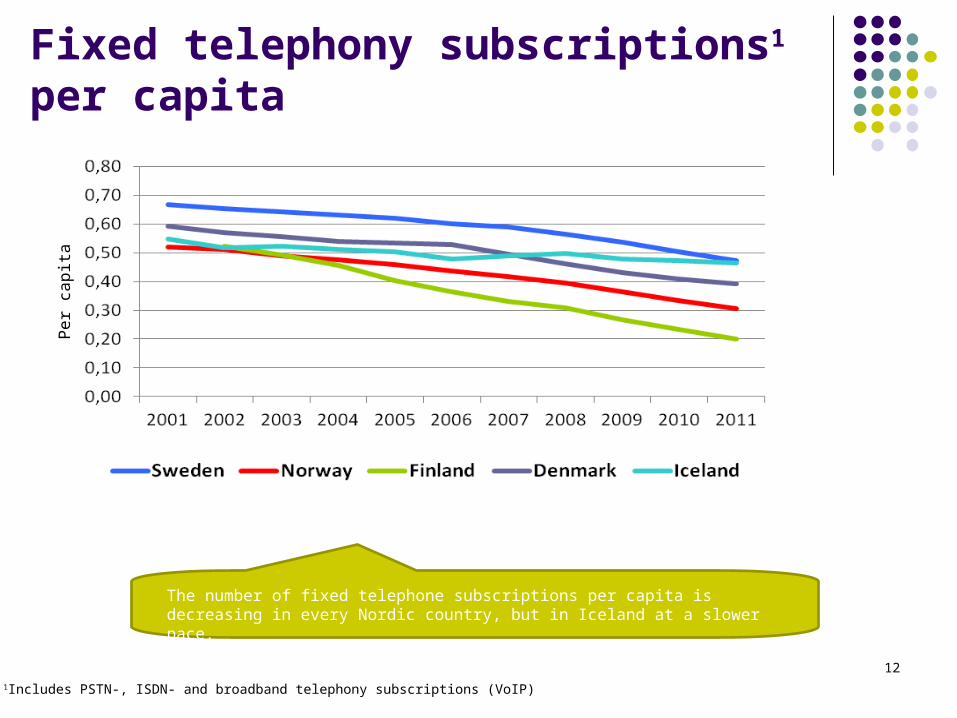
Fixed telephony subscriptions1 per capita
12
The number of fixed telephone subscriptions per capita is decreasing in every Nordic country, but in Iceland at a slower pace.
1Includes PSTN-, ISDN- and broadband telephony subscriptions (VoIP)
Pe
r ca
pita
13
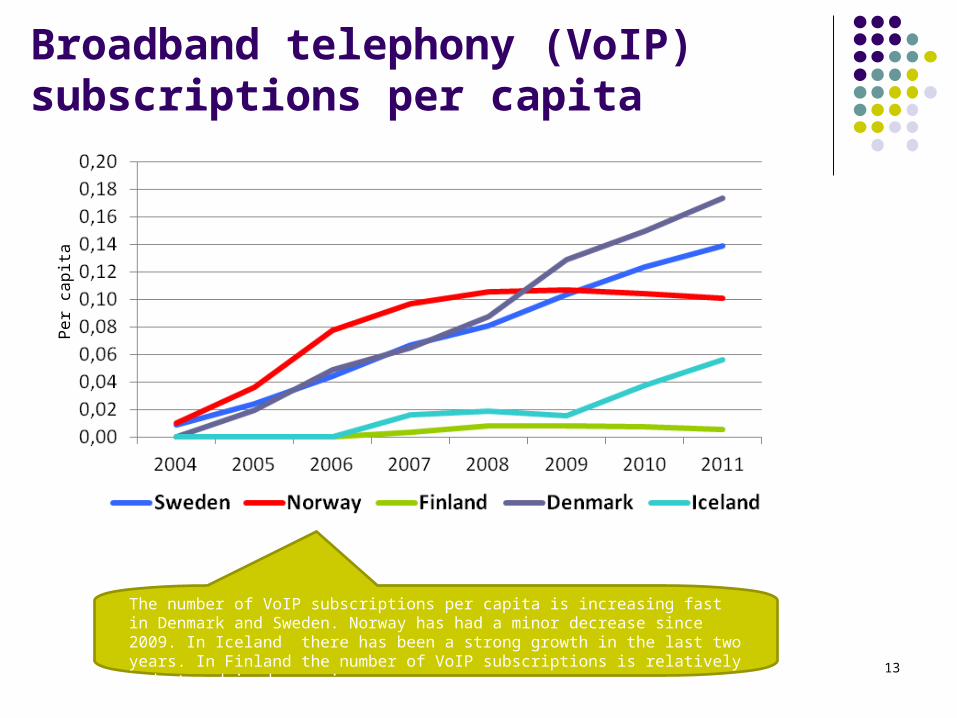
Broadband telephony (VoIP) subscriptions per capita
The number of VoIP subscriptions per capita is increasing fast in Denmark and Sweden. Norway has had a minor decrease since 2009. In Iceland there has been a strong growth in the last two years. In Finland the number of VoIP subscriptions is relatively modest and is decreasing.
Pe
r ca
pita

14
Share of broadband telephony (VoIP) of all fixed telephony subscriptions1
The share of broadband telephony of all fixed telephony subscriptions in the end of 2011 were 44 percent in Denmark, 33 per cent in Norway and almost 30 per cent in Sweden. In Finland and Iceland the share of broadband telephony of all fixed telephony subscriptions is relatively modest.
1All fixed telephony subscriptions include PSTN-, ISDN- and broadband telephony subscriptions (VoIP).
15
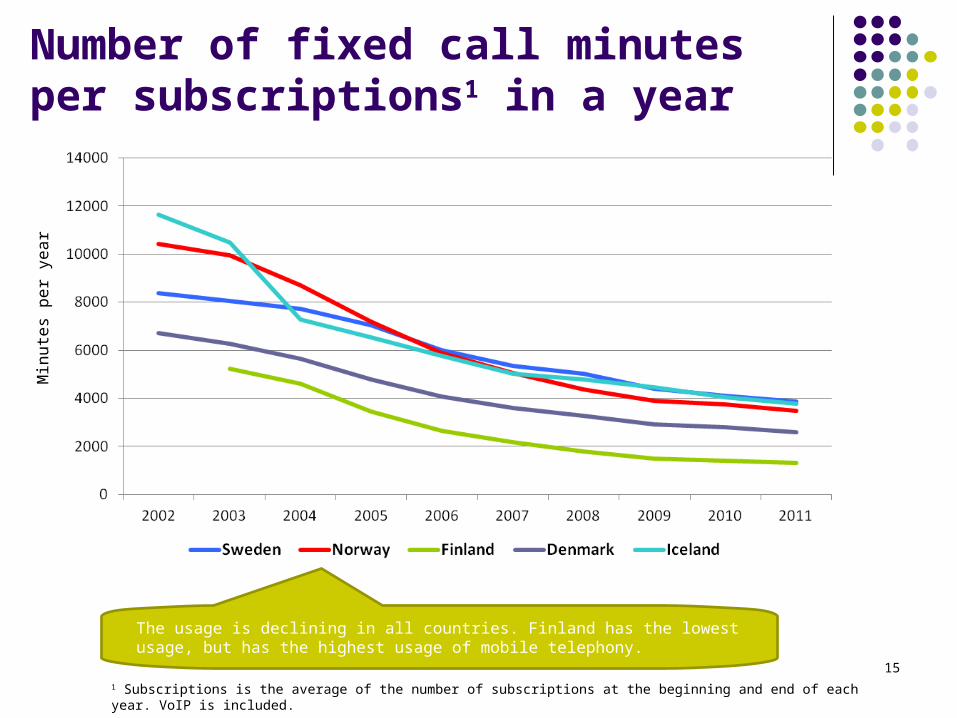
Number of fixed call minutes per subscriptions1 in a year
The usage is declining in all countries. Finland has the lowest usage, but has the highest usage of mobile telephony.
1 Subscriptions is the average of the number of subscriptions at the beginning and end of each year. VoIP is included.
Min
ute
s p
er
yea
r

16
Share of mobile minutes of all originated minutes
The graph shows that the usage of mobile telephony are more and more dominant also in terms of minutes. The share of mobile minutes of all originated minutes is a little more than 90 percent in Finland. In Denmark and Norway the share of mobile minutes where a little less than 70 percent and in Sweden and Iceland almost 57 percent.
1All originated minutes are the sum of all fixed minutes and all mobile minutes.

Broadband

Number of fixed broadband subscriptions per capita
18
The growth has stagnated in all countries. All Nordic countries are within the OECD top 15 on broadband penetration. Sweden and Finland has fewer fixed broadband subscriptions per capita than the other countries, but have high penetration rates on mobile broadband subscriptions.
Pe
r ca
pita

19
Number of broadband subscriptions per capita (incl. mobile broadband1)
When adding the growth in mobile broadband to fixed broadband the graph then shows that Finlands has the highest penetration rate with 0,67 subscriptions per capita. The rest of the countries lies within a spread of just 0,07 points.
1Includes only dedicated data subscriptions.
Pe
r ca
pita

Norway 8Mbps or
more
20
Number of fixed broadband subscription with a marketed capacity of 10 Mbps or more per capita
The graphs shows broadband penetration for subscriptions with speeds of 10 Mbps or more downstream. There are rather big differences between the countries. Iceland and Denmark are ”taking-off” with respectively 0,30 and 0,25 fixed broadband subscriptions per capita with 10 Mbps or more. Norway and Finland have more or less half of Iceland’s number of subscriptions with 10 Mbps or more per capita and Sweden have 0,19.
Iceland only xDSL1
Pe
r ca
pita
1Many subscriptions are advertised with speeds up to for example 12 Mbit/s. Actual speed depends on factors like distance from the central exchange etc. This is the case for xDSL subscriptions also elswhere in the Nordic countries.

21
Number of mobile broadband subscriptions1 per capita
The graph shows the number of dedicated mobile broadband subscriptions in relation to the total population. 37 out of a 100 inhabitants has a mobile broadband subscription in Finland, 20 in Sweden,16 in Denmark,14 in Norway and 13 in Iceland. As with the mobile data traffic, the growth rates for the total number of mobile broadband subscriptions is decreasing and at the same time the differences between the countries are diminishing. In 2010 mobile broadband subscriptions grew 80 percent in Finland, 72 percent in Iceland, and in Denmark, Sweden and Norway 36, 30 and 33 percent respectively. In 2011 Norway, Iceland and Finland grew with more or less 22 percent and Denmark and Sweden grew approx. 14 percent.
Pe
r ca
pita
1Includes only dedicated data subscriptions.

22
Number of mobile broadband subscriptions1
+ “add-on” data packages per capita
The graph shows that when including ”add-on” data packages together with mobile broadband subscriptions Finland is ”taking-off” with 66 out of a 100 inhabitants having an “add-on” subscription or a mobile broadband subscription.
Pe
r ca
pita
1Only dedicated data subscriptions. Finnish data is exclusive ”add-on” data packages before 2011.
-
0,10
0,20
0,30
0,40
0,50
0,60
0,70
2008 2009 2010 2011Sweden Norway Finland Denmark Iceland

23
Share of broadband technologies 2010 - 2011
(all technologies incl. mobile broadband1)
1Fibre incl. ”fibre + LAN” in Sweden and Denmark and incl. ”fibre + LAN” + ”fibre + ethernet” in Finland. Mobile broadband only includes dedicated data subscriptions. ”Add-on” data packages not included.
Sweden has the highest share of fibre, which is growing in all the Nordic countries between 2010 and 2011. The share of xDSL subscriptions is falling in all the countries. The share of broadband via cable-modem continues to be very stable and highest in Norway and Denmark. Mobile broadband is gaining in share in all countries and in Finland mobile broadband is more than half of all broadband subscriptions.
34% 30%41% 36% 35% 31%
42% 39%
66%60%
13%12%
21%21%
8%7%
19%19%
0%0%
17%18%
11%13%
1%1%
9%10%
8%11%
0%0%
0%0%
5%5%
1% 1%0%
0%
36% 39%
25% 28%
51% 55%
27% 30%24% 27%
0%
20%
40%
60%
80%
100%
Sweden Norway Finland Denmark Iceland
DSL Cable television Radio Fibre Other fixed access Mobile broadband

24
Share of fixed broadband technologies 2010 - 2011
(only fixed broadband1)
1Fibre incl. ”fibre + LAN” in Sweden, Finland and Denmark.
53% 50%55%
50%
71% 70%
58% 56%
87%83%
20%20%
28%29%
15% 16%
26% 27%
0%0%
26% 30%
15% 18% 1% 2%12% 14%
11%15%
0% 0% 0% 0%10% 11%
2% 1% 0% 0%
0%
20%
40%
60%
80%
100%
Sweden Norway Finland Denmark Iceland
DSL Cable television Radio Fibre Other fixed access

Market Shares

Sweden Norway Finland Denmark Iceland
Operator 2010 2011Operator 2010 2011Operator 2010 2011Operator 2010 2011Operator 2010 2011
TeliaSonera
40.9 %40.1% Telenor 50.7 % 51.0 % Elisa 39.0 % 39.0 % TDC 41.2 % 42.6% Síminn 41.8 % 39.7%
Tele2 31.4%30.6% TeliaSonera
26.4 % 24.9 % TeliaSonera
36.0 % 35.0 % Telenor 26.1 % 24.9% Vodafone 30.9% 29.3%
Sum 72.3%70.8% Sum 77.1 % 75.9% Sum 75.0% 74.0% Sum 67.3% 67.5% Sum 72.7% 69.0%
26
Market shares of mobile subscriptions1, two largest operators - 2010 - 2011
1Including mobile broadband subscriptions. Market shares including subsidiaries.
Market shares of mobile subscriptions for the two largest operators are quite stabile for all countries in 2010 and 2011. Denmark is the only country where the total market share for the two largest operators has been rising a bit in 2011. Denmark also has the lowest total market share with 67.5 percent while Norway tops the list with 75.9 percent in 2011 falling from 77.1 percent in 2010.

Sweden Norway Finland Denmark Iceland
Operator 2010 2011Operator 2010 2011Operator 2010 2011Operator 2010 2011Operator 2010 2011
TeliaSonera
37.7% 38.0% Telenor 49.4% 48.2 % Elisa 29.0 % 30.0 % TDC 61,6% 59.8% Síminn 52,2% 50.6%
Comhem 18.0% 18.1% NextGen-
Tel211.3% 10.5 % Telia
Sonera30.0 % 31.0 % Telenor 12,1% 10.0% Vodafone 30,4% 31.8%
Sum 55.7% 56.2 % Sum 60.7 % 58.7 % Sum 59.0% 61.0 % Sum 73.7% 69.8 % Sum 82.6% 82.4 %
27
Market shares of fixed broadband subscriptions1, two largest operators- 2010 - 2011
1Market shares including subsidiaries. 2NextGenTel and Get same market share in 2011.
Market shares of fixed broadband subscriptions shows a little more variation between the countries. With a little more than 56 percent Sweden has the lowest total market share together with Norway and Finland having market shares at 59 percent and 61 percent in 2011. Denmarks total market share is 70 percent, and it contains TDC’s market share at 60 percent which is the single largest national market share of fixed broadband for any operator (incl. subsidiaries) in the Nordic countries. Iceland tops the list with a total market share of 82 percent for the two largest operators.

Sweden Norway Finland Denmark Iceland
Operator 2010 2011Operator 2010 2011Operator 2010 2011Operator 2010 2011Operator 2010 2011
TeliaSonera
62.0% 61.3% Telenor 66.7% 65.8 % Elisa 38.0% 36.0% TDC 73.2% 70.8% Síminn 70.3% 67.8%
Tele2 12.3% 11.3% Telio Telecom
5.9% 6.2 % TeliaSonera
22.0% 23.0%TeliaSonera2 6.7% 6.1% Vodafone 23.6% 24.3%
Sum 74.2% 72.6 % Sum 72.6 % 72.0 % Sum 60.0% 59.0 % Sum 79.9% 76.9 % Sum 93.9% 92.1 %
28
Market shares of fixed telephony subscriptions1, two largest operators- 2010 - 2011
1Including VoIP subscriptions. Market shares including subsidiaries.2 Including DLG Tele. Telenor’s market share fell from 7.6% at the end of 2010 to 5.8% at the end of 2011.
The highest total market shares of fixed telephony subscriptions for the two largest operators in 2011 is 92 percent in Iceland. Norway, Sweden and Denmark has totale market shares between 72 and 77 percent and Finland is lowest with 60 percent. In Denmark, Sweden and Norway there are big differences between the largest and the second largest operators – from 50 to almost 65 percentage points.
![1 Roadmap to Achieve 31.12.2011 RBM Targets: COMORES January 2011 – December 2011 [Planning Template]](https://img.pdfslide.us/doc/110x75/551d9d84497959293b8bef2e/1-roadmap-to-achieve-31122011-rbm-targets-comores-january-2011-december-2011-planning-template.jpg)
![1 Roadmap to Achieve 31.12.2011 RBM Targets Sudan January 2011 – December 2011 [Planning Template]](https://img.pdfslide.us/doc/110x75/56649e755503460f94b75ba1/1-roadmap-to-achieve-31122011-rbm-targets-sudan-january-2011-december.jpg)


![1 Roadmap to Achieve 31.12.2011 RBM Targets RWANDA January 2011 – December 2011 [Planning Template]](https://img.pdfslide.us/doc/110x75/56649ca15503460f949600a3/1-roadmap-to-achieve-31122011-rbm-targets-rwanda-january-2011-december.jpg)
![1 Roadmap to Achieve 31.12.2011 RBM Targets ETHIOPIA January 2011 – December 2011 [ETHIOPIA]](https://img.pdfslide.us/doc/110x75/56649f3d5503460f94c5cc26/1-roadmap-to-achieve-31122011-rbm-targets-ethiopia-january-2011-december.jpg)


![[Nordic Built Challenge 17.12.2013] Trine Pertou Mach, Nordic Built: Nordic Built](https://img.pdfslide.us/doc/110x75/547174dcb4af9f980a8b4ad9/nordic-built-challenge-17122013-trine-pertou-mach-nordic-built-nordic-built.jpg)