Embed Size (px)
Citation preview
Analysts who prepared this report are registered as research analysts in Korea but not in any other jurisdiction, including tAnalysts who prepared this report are registered as research analysts in Korea but not in any other jurisdiction, including tAnalysts who prepared this report are registered as research analysts in Korea but not in any other jurisdiction, including tAnalysts who prepared this report are registered as research analysts in Korea but not in any other jurisdiction, including the U.S. he U.S. he U.S. he U.S.
PLEASE SEE ANALYST CERTIFICATIONS AND IMPORTANT PLEASE SEE ANALYST CERTIFICATIONS AND IMPORTANT PLEASE SEE ANALYST CERTIFICATIONS AND IMPORTANT PLEASE SEE ANALYST CERTIFICATIONS AND IMPORTANT DISCLOSURES & DISCLAIMERS IN APPENDIX 1 AT THE END OF REPORT.DISCLOSURES & DISCLAIMERS IN APPENDIX 1 AT THE END OF REPORT.DISCLOSURES & DISCLAIMERS IN APPENDIX 1 AT THE END OF REPORT.DISCLOSURES & DISCLAIMERS IN APPENDIX 1 AT THE END OF REPORT.
SKT to acquire CJ HelloVision
SK Telecom (SKT) will seek to acquire CJ HelloVision, according to media reports. Although
details have not yet been disclosed, current circumstances suggest the acquisition is highly
likely to materialize, in our view.
Reportedly, SKT will take over a 30% stake in CJ HelloVision from the 54% stake currently held by
its parent company, CJ O Shopping; the acquisition price (which includes a control premium) is
expected to be about W1.5tr. SKT will also participate in CJ Corporation’s rights offering via third-
party allotment to secure a 2% stake for W150bn. In addition, SKT and CJ Corporation will jointly
establish two funds, one to support content firms and the other to support startups, contributing
W500bn to each. In our view, the acquisition should help SKT secure dominance in the pay-TV and
fixed-line communications markets, in addition to its existing leadership in mobile communications.
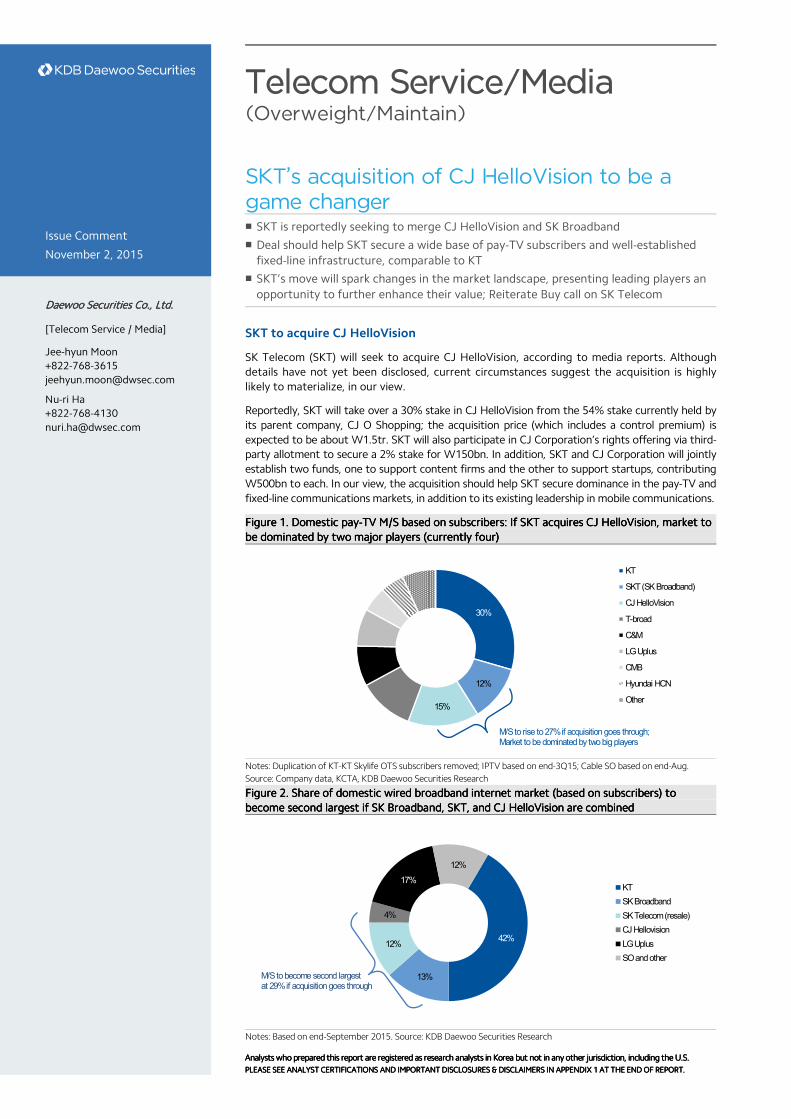
Figure Figure Figure Figure 1111. . . . Domestic payDomestic payDomestic payDomestic pay----TVTVTVTV M/SM/SM/SM/S based onbased onbased onbased on subscrsubscrsubscrsubscribers: If ibers: If ibers: If ibers: If SKTSKTSKTSKT acquires CJ acquires CJ acquires CJ acquires CJ HelloVisionHelloVisionHelloVisionHelloVision, market to , market to , market to , market to
be be be be dominated by two major players (currently dominated by two major players (currently dominated by two major players (currently dominated by two major players (currently four)four)four)four)
Notes: Duplication of KT-KT Skylife OTS subscribers removed; IPTV based on end-3Q15; Cable SO based on end-Aug.
Source: Company data, KCTA, KDB Daewoo Securities Research
Figure Figure Figure Figure 2222. . . . Share of dShare of dShare of dShare of domestic wired omestic wired omestic wired omestic wired broadband broadband broadband broadband internet internet internet internet marketmarketmarketmarket (based on (based on (based on (based on subscriberssubscriberssubscriberssubscribers) to ) to ) to ) to
become second largest ifbecome second largest ifbecome second largest ifbecome second largest if SK Broadband, SKSK Broadband, SKSK Broadband, SKSK Broadband, SKT, T, T, T, and CJ and CJ and CJ and CJ HelloVisionHelloVisionHelloVisionHelloVision are combinedare combinedare combinedare combined
Notes: Based on end-September 2015. Source: KDB Daewoo Securities Research
Telecom Service/Media (Overweight/Maintain)
SKT’s acquisition of CJ HelloVision to be a game changer � SKT is reportedly seeking to merge CJ HelloVision and SK Broadband
� Deal should help SKT secure a wide base of pay-TV subscribers and well-established
fixed-line infrastructure, comparable to KT
� SKT’s move will spark changes in the market landscape, presenting leading players an
opportunity to further enhance their value; Reiterate Buy call on SK Telecom
Issue Comment
November 2, 2015
Daewoo Securities CDaewoo Securities CDaewoo Securities CDaewoo Securities Co., Ltd.o., Ltd.o., Ltd.o., Ltd.
[Telecom Service / Media]
Jee-hyun Moon
+822-768-3615
Nu-ri Ha
+822-768-4130
30%
12%
15%
KT
SKT (SK Broadband)
CJ HelloVision
T-broad
C&M
LG Uplus
CMB
Hyundai HCN
Other
M/S to rise to 27% if acquisition goes through; Market to be dominated by two big players
42%
13%
12%
4%
17%
12%
KT
SK Broadband
SK Telecom (resale)
CJ Hellovision
LG Uplus
SO and other
M/S to become second largest at 29% if acquisition goes through
Telecom Service/Media
2
November 2, 2015
KDB Daewoo Securities Research
Reasons for SKT’s interest in cable SOs: 1) Improvement in EV
1) Goal to increase EV to W100tr via media convergence strategy
SKT’s CEO Jang Dong-hyun, who took office this year, announced his intention to increase the
company’s enterprise value (EV) to W100tr and become one of the top 100 companies in the
world by 2018—two years ahead of the original timeline laid out in the company’s “Vision
2020.” To accomplish this goal, he presented three major strategies for innovating next-
generation platforms. One of those strategies is media convergence.
To become an integrated media platform, SKT aims to increase the number of mobile and
fixed-line media subscribers to 15mn. Currently, SK Broadband’s IPTV (B tv) subscribers are
estimated at 3.35mn, while monthly net users of its mobile media service (B tv Mobile) are
estimated at 2.7mn (based on KoreanClick data). Pursuing M&As appears to be the only way
to achieve the subscriber target in the planned timeframe.
In particular, the growing personalization of media consumption is sharply driving up mobile
data usage. According to Cisco, the percentage of video content in global mobile traffic will
climb to 72% in 2019 from 55% in 2014. Having an integrated media platform will be
increasingly important for SKT’s overall business model, which is largely dependent on
charging for communication and data usage.
Figure Figure Figure Figure 3333. . . . SKSKSKSKTTTT’’’’s s s s Vision 2020: Vision 2020: Vision 2020: Vision 2020: Aiming Aiming Aiming Aiming to achieve EVto achieve EVto achieve EVto achieve EV of W100trof W100trof W100trof W100tr and position as one of worldand position as one of worldand position as one of worldand position as one of world’’’’s top s top s top s top
100 100 100 100 companies by companies by companies by companies by 2018 2018 2018 2018
Source: Company data, KDB Daewoo Securities Research
Figure Figure Figure Figure 4444. . . . SKTSKTSKTSKT announced announced announced announced a a a a ““““Next PlatformNext PlatformNext PlatformNext Platform”””” innovation strategy in Aprinnovation strategy in Aprinnovation strategy in Aprinnovation strategy in April il il il 2015201520152015
Source: KDB Daewoo Securities Research
Telecom Service/Media
3
November 2, 2015
KDB Daewoo Securities Research
2) In need of household subscriber base to provide life value and IoT services
The media platform business will also be critical to SKT’s other next-generation platform
strategies: life value and IoT services. Given that households are the subscribers for fixed-line
broadband and media set-top box services, an increase in media service subscribers should
lead directly to the expansion of home-based services.
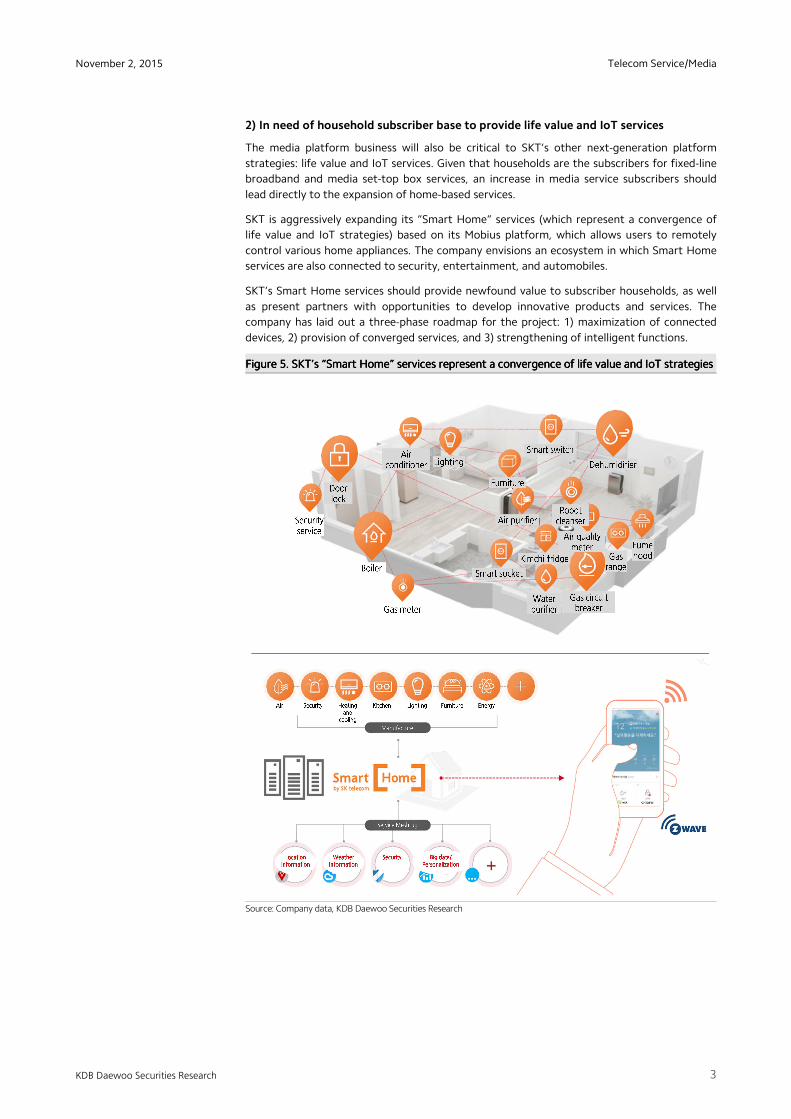
SKT is aggressively expanding its “Smart Home” services (which represent a convergence of
life value and IoT strategies) based on its Mobius platform, which allows users to remotely
control various home appliances. The company envisions an ecosystem in which Smart Home
services are also connected to security, entertainment, and automobiles.
SKT’s Smart Home services should provide newfound value to subscriber households, as well
as present partners with opportunities to develop innovative products and services. The
company has laid out a three-phase roadmap for the project: 1) maximization of connected
devices, 2) provision of converged services, and 3) strengthening of intelligent functions.
Figure Figure Figure Figure 5555. . . . SKTSKTSKTSKT’’’’s s s s ““““Smart HomeSmart HomeSmart HomeSmart Home”””” servicesservicesservicesservices represent a convergence of life value represent a convergence of life value represent a convergence of life value represent a convergence of life value and IoT strategiesand IoT strategiesand IoT strategiesand IoT strategies
Source: Company data, KDB Daewoo Securities Research
Telecom Service/Media
4
November 2, 2015
KDB Daewoo Securities Research
Reasons for SKT’s interest in cable SOs: 2) Regulatory changes
1) Improvements in bundled products: Promotion of equal bundling
Since the introduction of the handset distribution act in October 2014, the government has
also revised regulations related to fixed-line telecom and pay-TV services, with one of the
major aims being to improve bundled products. On August 6th, the Ministry of Science, ICT
and Future Planning (MSIP) and the Korea Communications Commission (KCC) jointly released
regulatory changes affecting bundled products; the changes were designed to monitor
intensifying competition arising from the expansion of telcos into the pay-TV market via IPTV
services and to ensure fair competition.
Among the changes, the promotion of equal bundling appears to have given SKT a good
reason to focus its attention on the cable SO industry. Equal bundling allows the sale of
bundled products that combine SKT’s mobile services and cable SOs’ broadband internet and
TV services. To boost the sale of such products, the government came up with the details of
prohibited practices related to equal bundling. As such, SKT now can bundle its products with
those of cable SOs. Against this backdrop, SKT appears to have decided that pursuing equal
bundling via the acquisition of an affiliated firm (CJ HelloVision)—rather than simply working
with a non-affiliated cable SO—would be a better choice in terms of managing its businesses
and creating synergies.
2) Restriction on combined subscriber market share would not hinder the acquisition
Pay-TV services are a domestically regulated, licensed industry, with the most important
regulation being market share restriction.
In 1H, the enforcement decree of the Internet Multimedia Broadcasting Business Act was
revised to restrict the size of a pay-TV operator’s subscriber market share—based on the
combined number of subscribers to all of its pay-TV services—to no more than one-third of
the market. Assuming SKT acquires CJ HelloVision, their combined market share would reach
only 27%, leaving room for further market share growth (of around 6%p).
Why CJ HelloVision? 1) Business background
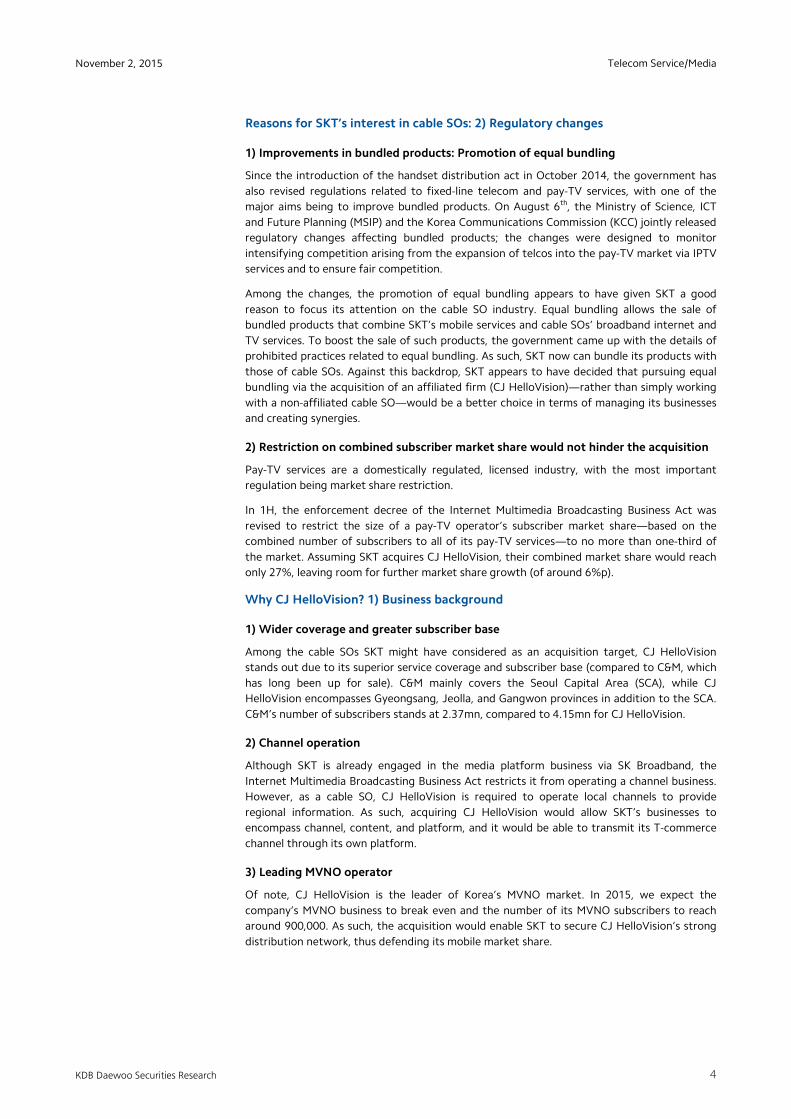
1) Wider coverage and greater subscriber base
Among the cable SOs SKT might have considered as an acquisition target, CJ HelloVision
stands out due to its superior service coverage and subscriber base (compared to C&M, which
has long been up for sale). C&M mainly covers the Seoul Capital Area (SCA), while CJ
HelloVision encompasses Gyeongsang, Jeolla, and Gangwon provinces in addition to the SCA.
C&M’s number of subscribers stands at 2.37mn, compared to 4.15mn for CJ HelloVision.
2) Channel operation
Although SKT is already engaged in the media platform business via SK Broadband, the
Internet Multimedia Broadcasting Business Act restricts it from operating a channel business.
However, as a cable SO, CJ HelloVision is required to operate local channels to provide
regional information. As such, acquiring CJ HelloVision would allow SKT’s businesses to
encompass channel, content, and platform, and it would be able to transmit its T-commerce
channel through its own platform.
3) Leading MVNO operator
Of note, CJ HelloVision is the leader of Korea’s MVNO market. In 2015, we expect the
company’s MVNO business to break even and the number of its MVNO subscribers to reach
around 900,000. As such, the acquisition would enable SKT to secure CJ HelloVision’s strong
distribution network, thus defending its mobile market share.
Telecom Service/Media
5
November 2, 2015
KDB Daewoo Securities Research
Figure Figure Figure Figure 6666. . . . CJ CJ CJ CJ HelloVisionHelloVisionHelloVisionHelloVision broadcasting coverage: broadcasting coverage: broadcasting coverage: broadcasting coverage: WWWWidespread idespread idespread idespread
throughout the country throughout the country throughout the country throughout the country
Figure Figure Figure Figure 7777. . . . CJ CJ CJ CJ HelloVision’HelloVision’HelloVision’HelloVision’ssss number of subscribernumber of subscribernumber of subscribernumber of subscribers s s s to to to to
broadcasting/broadband/MVNO broadcasting/broadband/MVNO broadcasting/broadband/MVNO broadcasting/broadband/MVNO
Source: Company data, KDB Daewoo Securities Research Source: Company data, KDB Daewoo Securities Research
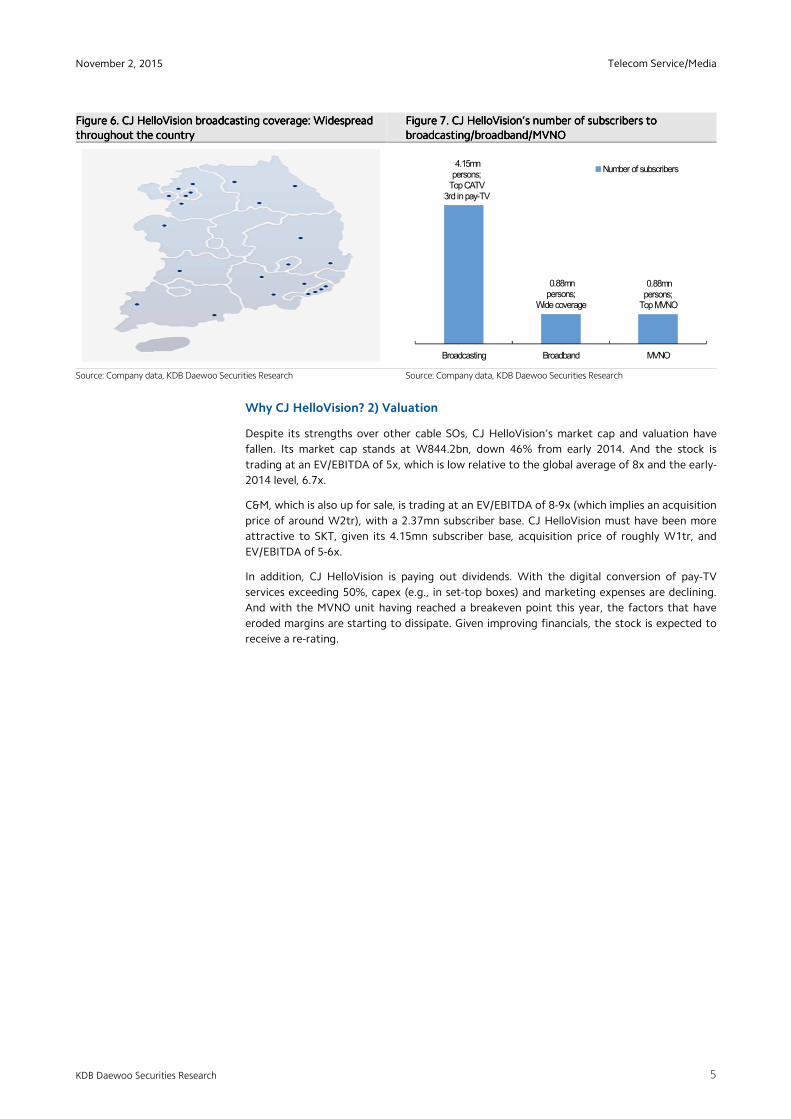
Why CJ HelloVision? 2) Valuation
Despite its strengths over other cable SOs, CJ HelloVision’s market cap and valuation have
fallen. Its market cap stands at W844.2bn, down 46% from early 2014. And the stock is
trading at an EV/EBITDA of 5x, which is low relative to the global average of 8x and the early-
2014 level, 6.7x.
C&M, which is also up for sale, is trading at an EV/EBITDA of 8-9x (which implies an acquisition
price of around W2tr), with a 2.37mn subscriber base. CJ HelloVision must have been more
attractive to SKT, given its 4.15mn subscriber base, acquisition price of roughly W1tr, and
EV/EBITDA of 5-6x.
In addition, CJ HelloVision is paying out dividends. With the digital conversion of pay-TV
services exceeding 50%, capex (e.g., in set-top boxes) and marketing expenses are declining.
And with the MVNO unit having reached a breakeven point this year, the factors that have
eroded margins are starting to dissipate. Given improving financials, the stock is expected to
receive a re-rating.
4.15mn persons;
Top CATV3rd in pay-TV
0.88mn persons;
Wide coverage
0.88mn persons;
Top MVNO
Broadcasting Broadband MVNO
Number of subscribers
Telecom Service/Media
6
November 2, 2015
KDB Daewoo Securities Research
Figure Figure Figure Figure 8888. . . . Domestic payDomestic payDomestic payDomestic pay----TVTVTVTV companiescompaniescompaniescompanies’’’’ market cap: CJ market cap: CJ market cap: CJ market cap: CJ HelloVisionHelloVisionHelloVisionHelloVision has fallenhas fallenhas fallenhas fallen 46% compared to 46% compared to 46% compared to 46% compared to
early 2014early 2014early 2014early 2014
Source: Thomson Reuters, KDB Daewoo Securities Research
Figure Figure Figure Figure 9999. . . . Domestic payDomestic payDomestic payDomestic pay----TVTVTVTV companiescompaniescompaniescompanies’’’’ valuation: CJ valuation: CJ valuation: CJ valuation: CJ HelloVisionHelloVisionHelloVisionHelloVision is undervaluedis undervaluedis undervaluedis undervalued,,,, as as as as EV/EBITDA EV/EBITDA EV/EBITDA EV/EBITDA
has fallen has fallen has fallen has fallen sincesincesincesince early 2014early 2014early 2014early 2014
Source: Source: Thomson Reuters, KDB Daewoo Securities Research
0
500
1,000
1,500
2,000
1/14 4/14 7/14 10/14 1/15 4/15 7/15 10/15
(Wbn)CJ Hellovison KT Skylife Hyundai HCN
2
3
4
5
6
7
8
1/14 4/14 7/14 10/14 1/15 4/15 7/15 10/15
(x)
CJ Hellovision KT Skylife Hyundai HCN
Telecom Service/Media
7
November 2, 2015
KDB Daewoo Securities Research
Why CJ HelloVision? 3) Addressing the strategic needs of SK Group and CJ Group
1) Strategic cooperation between SK Group and CJ Group
We believe the M&A deal will address strategic needs for both SK Group and CJ Group. First,
SKT aims to increase the value of SK Group, which is telecom-based. And given the possibility
that its 20% ownership stake in SK Hynix may change, SKT must have concluded that it needs
to expand its in-house business to boost corporate value.
At the same time, CJ Group is reportedly pushing to acquire Coway, while reinforcing the
content business units (e.g., CJ E&M, and CJ CGV). We believe CJ Group will use proceeds
from the CJ HelloVision sale to finance M&A deals and focus on its global content business.
Furthermore, SKT plans to continue the strategic partnership with CJ Group by participating
in CJ Corporation’s rights offering, and the two companies plan to jointly establish funds to
support content firms and start-ups.
2) SKT is already investing in content with CJ E&M
SKT has already made investments in the content and commerce businesses together with CJ
E&M, in an effort to boost the value of content. Both companies broadcast popular dramas on
TV and mobile platforms and provide services that enable consumers to directly purchase
fashion items through mobile shopping malls.
Post-acquisition outlook
1) KT and SKT to dominate telecom/broadcast market; Consolidation trend to accelerate
There are still many players in the domestic pay-TV service market. The regulatory
environment is harsh, with significant barriers to market entry, and overseas expansion is not
a viable option. Under these circumstances, the only way a pay-TV service provider can hope
to obtain excess profits is through the easing of regulations and the achievement of
economies of scale through consolidation.
In the limited domestic market, deregulation could provide a big boost to companies. Now
that the government has lifted regulations on pay-TV services somewhat, private companies
need to make efforts at consolidation. With SKT moving in that direction, the consolidation
trend will likely accelerate going forward.
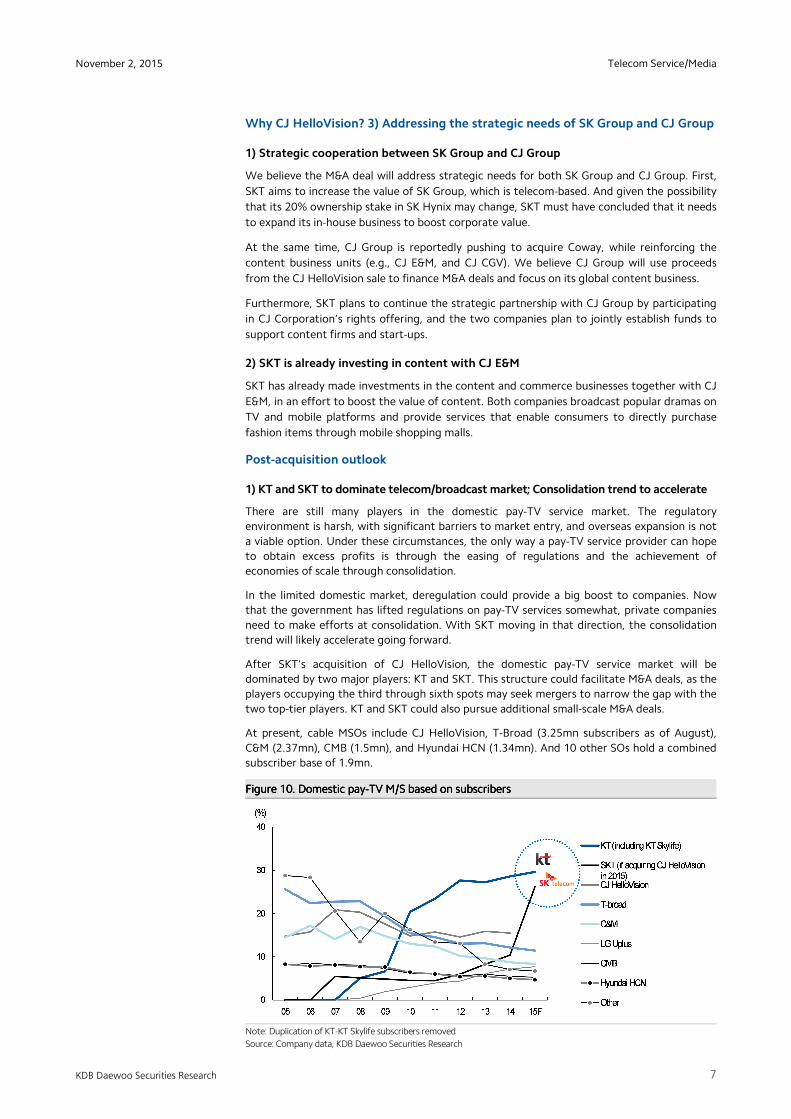
After SKT’s acquisition of CJ HelloVision, the domestic pay-TV service market will be
dominated by two major players: KT and SKT. This structure could facilitate M&A deals, as the
players occupying the third through sixth spots may seek mergers to narrow the gap with the
two top-tier players. KT and SKT could also pursue additional small-scale M&A deals.
At present, cable MSOs include CJ HelloVision, T-Broad (3.25mn subscribers as of August),
C&M (2.37mn), CMB (1.5mn), and Hyundai HCN (1.34mn). And 10 other SOs hold a combined
subscriber base of 1.9mn.
Figure Figure Figure Figure 10101010. . . . Domestic payDomestic payDomestic payDomestic pay----TVTVTVTV M/SM/SM/SM/S based on based on based on based on subscriberssubscriberssubscriberssubscribers
Note: Duplication of KT-KT Skylife subscribers removed
Source: Company data, KDB Daewoo Securities Research
Telecom Service/Media
8
November 2, 2015
KDB Daewoo Securities Research
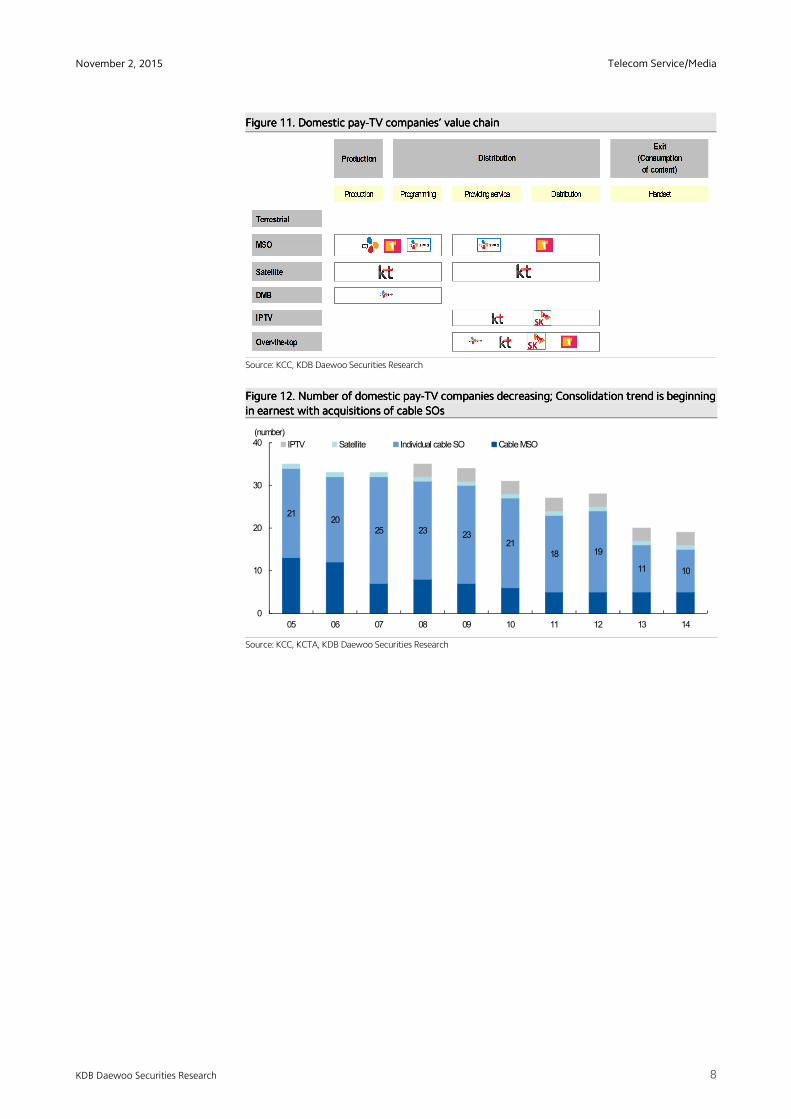
Figure Figure Figure Figure 11111111. . . . Domestic payDomestic payDomestic payDomestic pay----TVTVTVTV compancompancompancompaniesiesiesies’’’’ value chainvalue chainvalue chainvalue chain
Source: KCC, KDB Daewoo Securities Research
Figure Figure Figure Figure 12121212. . . . Number of domesticNumber of domesticNumber of domesticNumber of domestic paypaypaypay----TVTVTVTV companiescompaniescompaniescompanies decreasing; Consolidation trend is decreasing; Consolidation trend is decreasing; Consolidation trend is decreasing; Consolidation trend is beginningbeginningbeginningbeginning
in earnest within earnest within earnest within earnest with acquisitions of acquisitions of acquisitions of acquisitions of cable SOscable SOscable SOscable SOs
Source: KCC, KCTA, KDB Daewoo Securities Research
2120
25 23 2321
18 19
11 10
0
10
20
30
40
05 06 07 08 09 10 11 12 13 14
(number)
IPTV Satellite Individual cable SO Cable MSO
Telecom Service/Media
9
November 2, 2015
KDB Daewoo Securities Research
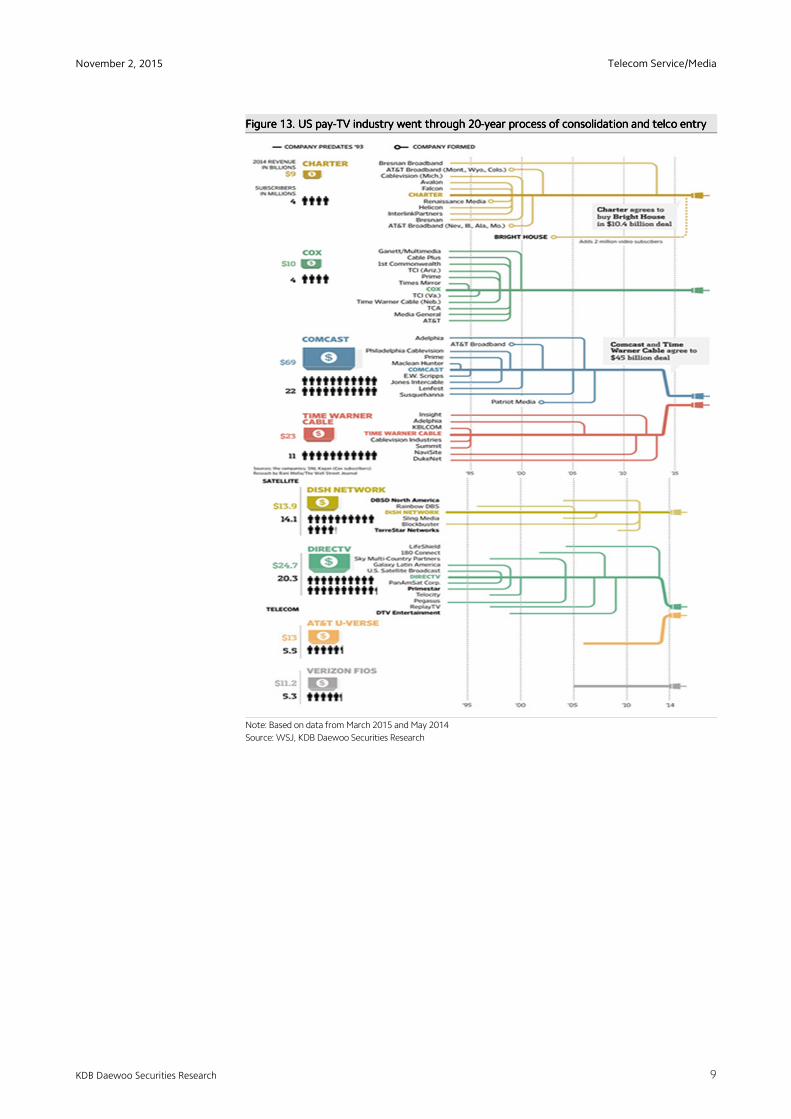
Figure Figure Figure Figure 13131313. . . . US US US US paypaypaypay----TVTVTVTV industry industry industry industry went throughwent throughwent throughwent through 20202020----yearyearyearyear process of consolidation and telco entryprocess of consolidation and telco entryprocess of consolidation and telco entryprocess of consolidation and telco entry
Note: Based on data from March 2015 and May 2014
Source: WSJ, KDB Daewoo Securities Research
Telecom Service/Media
10
November 2, 2015
KDB Daewoo Securities Research
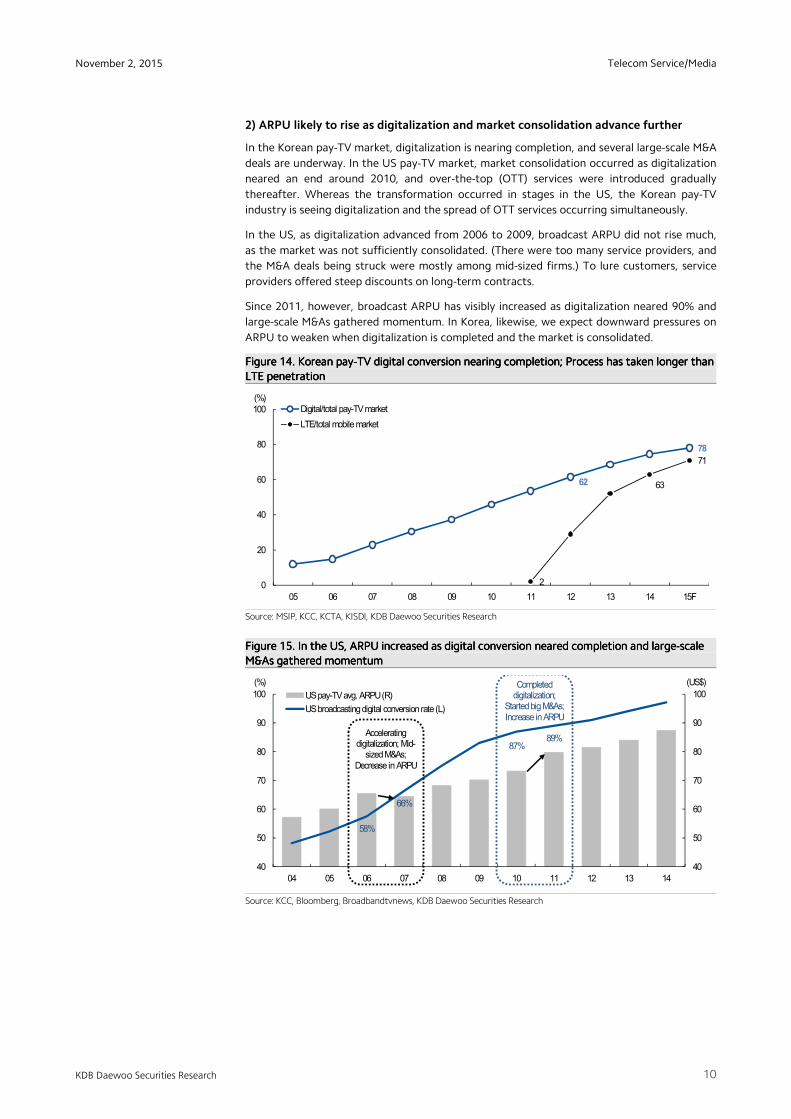
2) ARPU likely to rise as digitalization and market consolidation advance further
In the Korean pay-TV market, digitalization is nearing completion, and several large-scale M&A
deals are underway. In the US pay-TV market, market consolidation occurred as digitalization
neared an end around 2010, and over-the-top (OTT) services were introduced gradually
thereafter. Whereas the transformation occurred in stages in the US, the Korean pay-TV
industry is seeing digitalization and the spread of OTT services occurring simultaneously.
In the US, as digitalization advanced from 2006 to 2009, broadcast ARPU did not rise much,
as the market was not sufficiently consolidated. (There were too many service providers, and
the M&A deals being struck were mostly among mid-sized firms.) To lure customers, service
providers offered steep discounts on long-term contracts.
Since 2011, however, broadcast ARPU has visibly increased as digitalization neared 90% and
large-scale M&As gathered momentum. In Korea, likewise, we expect downward pressures on
ARPU to weaken when digitalization is completed and the market is consolidated.
Figure Figure Figure Figure 14141414. . . . Korean payKorean payKorean payKorean pay----TVTVTVTV digital codigital codigital codigital conversion nversion nversion nversion nearingnearingnearingnearing completioncompletioncompletioncompletion;;;; Process has Process has Process has Process has taken longer than taken longer than taken longer than taken longer than
LTE penetrationLTE penetrationLTE penetrationLTE penetration
Source: MSIP, KCC, KCTA, KISDI, KDB Daewoo Securities Research
Figure Figure Figure Figure 15151515. . . . In the US,In the US,In the US,In the US, ARPUARPUARPUARPU increasedincreasedincreasedincreased asasasas digital conversion digital conversion digital conversion digital conversion neared completion neared completion neared completion neared completion and and and and largelargelargelarge----scale scale scale scale
M&As gathered momentumM&As gathered momentumM&As gathered momentumM&As gathered momentum
Source: KCC, Bloomberg, Broadbandtvnews, KDB Daewoo Securities Research
62
78
2
63
71
0
20
40
60
80
100
05 06 07 08 09 10 11 12 13 14 15F
(%)Digital/total pay-TV market
LTE/total mobile market
58%
66%
87%89%
40
50
60
70
80
90
100
40
50
60
70
80
90
100
04 05 06 07 08 09 10 11 12 13 14
(US$)(%)
US pay-TV avg. ARPU (R)
US broadcasting digital conversion rate (L)
Accelerating digitalization; Mid-
sized M&As; Decrease in ARPU
Completed digitalization;
Started big M&As;Increase in ARPU
Telecom Service/Media
11
November 2, 2015
KDB Daewoo Securities Research
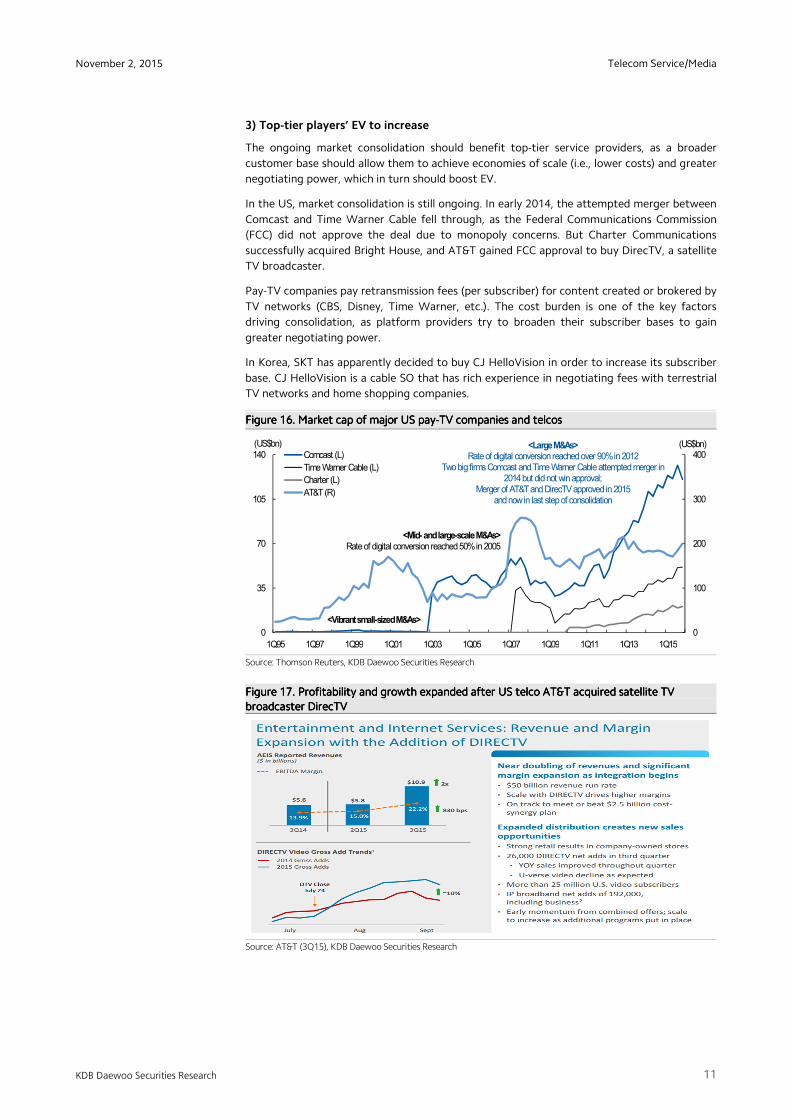
3) Top-tier players’ EV to increase
The ongoing market consolidation should benefit top-tier service providers, as a broader
customer base should allow them to achieve economies of scale (i.e., lower costs) and greater
negotiating power, which in turn should boost EV.
In the US, market consolidation is still ongoing. In early 2014, the attempted merger between
Comcast and Time Warner Cable fell through, as the Federal Communications Commission
(FCC) did not approve the deal due to monopoly concerns. But Charter Communications
successfully acquired Bright House, and AT&T gained FCC approval to buy DirecTV, a satellite
TV broadcaster.
Pay-TV companies pay retransmission fees (per subscriber) for content created or brokered by
TV networks (CBS, Disney, Time Warner, etc.). The cost burden is one of the key factors
driving consolidation, as platform providers try to broaden their subscriber bases to gain
greater negotiating power.
In Korea, SKT has apparently decided to buy CJ HelloVision in order to increase its subscriber
base. CJ HelloVision is a cable SO that has rich experience in negotiating fees with terrestrial
TV networks and home shopping companies.
Figure Figure Figure Figure 16161616. . . . Market cap of mMarket cap of mMarket cap of mMarket cap of majorajorajorajor USUSUSUS paypaypaypay----TV companiesTV companiesTV companiesTV companies and telcosand telcosand telcosand telcos
Source: Thomson Reuters, KDB Daewoo Securities Research
Figure Figure Figure Figure 17171717.... PPPProfitability and growthrofitability and growthrofitability and growthrofitability and growth expandedexpandedexpandedexpanded after US telco AT&after US telco AT&after US telco AT&after US telco AT&TTTT acquired acquired acquired acquired satellite TV satellite TV satellite TV satellite TV
broadcasterbroadcasterbroadcasterbroadcaster DirecTVDirecTVDirecTVDirecTV
Source: AT&T (3Q15), KDB Daewoo Securities Research
0
100
200
300
400
0
35
70
105
140
1Q95 1Q97 1Q99 1Q01 1Q03 1Q05 1Q07 1Q09 1Q11 1Q13 1Q15
(US$bn)(US$bn)Comcast (L)
Time Warner Cable (L)
Charter (L)
AT&T (R)
<Vibrant small-sizedM&As>
<LargeM&As>Rateof digital conversion reached over 90% in 2012
Two big firms Comcast and Time Warner Cable attempted merger in 2014 but did not win approval;
Merger of AT&T and DirecTV approved in 2015 and now in last step of consolidation
<Mid-and large-scale M&As>Rate of digital conversion reached50% in 2005
Telecom Service/Media
12
November 2, 2015
KDB Daewoo Securities Research
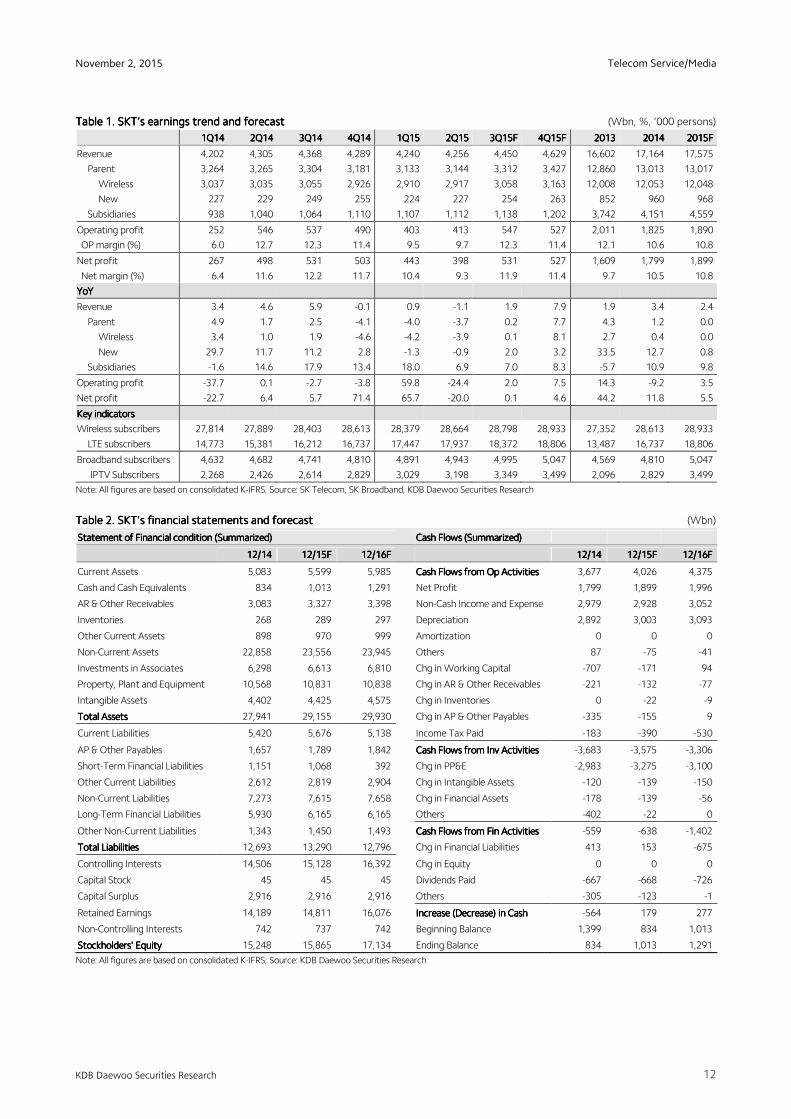
Table Table Table Table 1111. SKT. SKT. SKT. SKT’’’’s s s s earnings trend and forecast earnings trend and forecast earnings trend and forecast earnings trend and forecast (Wbn, %, ‘000 persons)
1Q141Q141Q141Q14 2Q142Q142Q142Q14 3Q143Q143Q143Q14 4Q144Q144Q144Q14 1Q151Q151Q151Q15 2Q152Q152Q152Q15 3Q153Q153Q153Q15FFFF 4Q154Q154Q154Q15FFFF 2013201320132013 2014201420142014 2015F2015F2015F2015F
Revenue 4,202 4,305 4,368 4,289 4,240 4,256 4,450 4,629 16,602 17,164 17,575
Parent 3,264 3,265 3,304 3,181 3,133 3,144 3,312 3,427 12,860 13,013 13,017
Wireless 3,037 3,035 3,055 2,926 2,910 2,917 3,058 3,163 12,008 12,053 12,048
New 227 229 249 255 224 227 254 263 852 960 968
Subsidiaries 938 1,040 1,064 1,110 1,107 1,112 1,138 1,202 3,742 4,151 4,559
Operating profit 252 546 537 490 403 413 547 527 2,011 1,825 1,890
OP margin (%) 6.0 12.7 12.3 11.4 9.5 9.7 12.3 11.4 12.1 10.6 10.8
Net profit 267 498 531 503 443 398 531 527 1,609 1,799 1,899
Net margin (%) 6.4 11.6 12.2 11.7 10.4 9.3 11.9 11.4 9.7 10.5 10.8
YoYYoYYoYYoY
Revenue 3.4 4.6 5.9 -0.1 0.9 -1.1 1.9 7.9 1.9 3.4 2.4
Parent 4.9 1.7 2.5 -4.1 -4.0 -3.7 0.2 7.7 4.3 1.2 0.0
Wireless 3.4 1.0 1.9 -4.6 -4.2 -3.9 0.1 8.1 2.7 0.4 0.0
New 29.7 11.7 11.2 2.8 -1.3 -0.9 2.0 3.2 33.5 12.7 0.8
Subsidiaries -1.6 14.6 17.9 13.4 18.0 6.9 7.0 8.3 -5.7 10.9 9.8
Operating profit -37.7 0.1 -2.7 -3.8 59.8 -24.4 2.0 7.5 14.3 -9.2 3.5
Net profit -22.7 6.4 5.7 71.4 65.7 -20.0 0.1 4.6 44.2 11.8 5.5
Key indicatorsKey indicatorsKey indicatorsKey indicators
Wireless subscribers 27,814 27,889 28,403 28,613 28,379 28,664 28,798 28,933 27,352 28,613 28,933
LTE subscribers 14,773 15,381 16,212 16,737 17,447 17,937 18,372 18,806 13,487 16,737 18,806
Broadband subscribers 4,632 4,682 4,741 4,810 4,891 4,943 4,995 5,047 4,569 4,810 5,047
IPTV Subscribers 2,268 2,426 2,614 2,829 3,029 3,198 3,349 3,499 2,096 2,829 3,499
Note: All figures are based on consolidated K-IFRS, Source: SK Telecom, SK Broadband, KDB Daewoo Securities Research
TableTableTableTable 2222. . . . SKTSKTSKTSKT’’’’s s s s financial statements and forecast financial statements and forecast financial statements and forecast financial statements and forecast (Wbn)
Statement of Financial Statement of Financial Statement of Financial Statement of Financial ccccondition (Summarized)ondition (Summarized)ondition (Summarized)ondition (Summarized)
Cash Flows (SummarizedCash Flows (SummarizedCash Flows (SummarizedCash Flows (Summarized))))
12/1412/1412/1412/14 12/15F12/15F12/15F12/15F 12/16F12/16F12/16F12/16F
12/1412/1412/1412/14 12/15F12/15F12/15F12/15F 12/16F12/16F12/16F12/16F
Current Assets 5,083 5,599 5,985
Cash Flows from Op ActivitiesCash Flows from Op ActivitiesCash Flows from Op ActivitiesCash Flows from Op Activities 3,677 4,026 4,375
Cash and Cash Equivalents 834 1,013 1,291
Net Profit 1,799 1,899 1,996
AR & Other Receivables 3,083 3,327 3,398
Non-Cash Income and Expense 2,979 2,928 3,052
Inventories 268 289 297
Depreciation 2,892 3,003 3,093
Other Current Assets 898 970 999
Amortization 0 0 0
Non-Current Assets 22,858 23,556 23,945
Others 87 -75 -41
Investments in Associates 6,298 6,613 6,810
Chg in Working Capital -707 -171 94
Property, Plant and Equipment 10,568 10,831 10,838
Chg in AR & Other Receivables -221 -132 -77
Intangible Assets 4,402 4,425 4,575
Chg in Inventories 0 -22 -9
Total AssetsTotal AssetsTotal AssetsTotal Assets 27,941 29,155 29,930
Chg in AP & Other Payables -335 -155 9
Current Liabilities 5,420 5,676 5,138
Income Tax Paid -183 -390 -530
AP & Other Payables 1,657 1,789 1,842
Cash Flows from Inv ActivitiesCash Flows from Inv ActivitiesCash Flows from Inv ActivitiesCash Flows from Inv Activities -3,683 -3,575 -3,306
Short-Term Financial Liabilities 1,151 1,068 392
Chg in PP&E -2,983 -3,275 -3,100
Other Current Liabilities 2,612 2,819 2,904
Chg in Intangible Assets -120 -139 -150
Non-Current Liabilities 7,273 7,615 7,658
Chg in Financial Assets -178 -139 -56
Long-Term Financial Liabilities 5,930 6,165 6,165
Others -402 -22 0
Other Non-Current Liabilities 1,343 1,450 1,493
Cash Flows from Fin ActivitiesCash Flows from Fin ActivitiesCash Flows from Fin ActivitiesCash Flows from Fin Activities -559 -638 -1,402
Total LiabilitiesTotal LiabilitiesTotal LiabilitiesTotal Liabilities 12,693 13,290 12,796
Chg in Financial Liabilities 413 153 -675
Controlling Interests 14,506 15,128 16,392
Chg in Equity 0 0 0
Capital Stock 45 45 45
Dividends Paid -667 -668 -726
Capital Surplus 2,916 2,916 2,916
Others -305 -123 -1
Retained Earnings 14,189 14,811 16,076
Increase (Decrease) in CashIncrease (Decrease) in CashIncrease (Decrease) in CashIncrease (Decrease) in Cash -564 179 277
Non-Controlling Interests 742 737 742
Beginning Balance 1,399 834 1,013
Stockholders' EquityStockholders' EquityStockholders' EquityStockholders' Equity 15,248 15,865 17,134
Ending Balance 834 1,013 1,291
Note: All figures are based on consolidated K-IFRS; Source: KDB Daewoo Securities Research
Telecom Service/Media
13
November 2, 2015
KDB Daewoo Securities Research
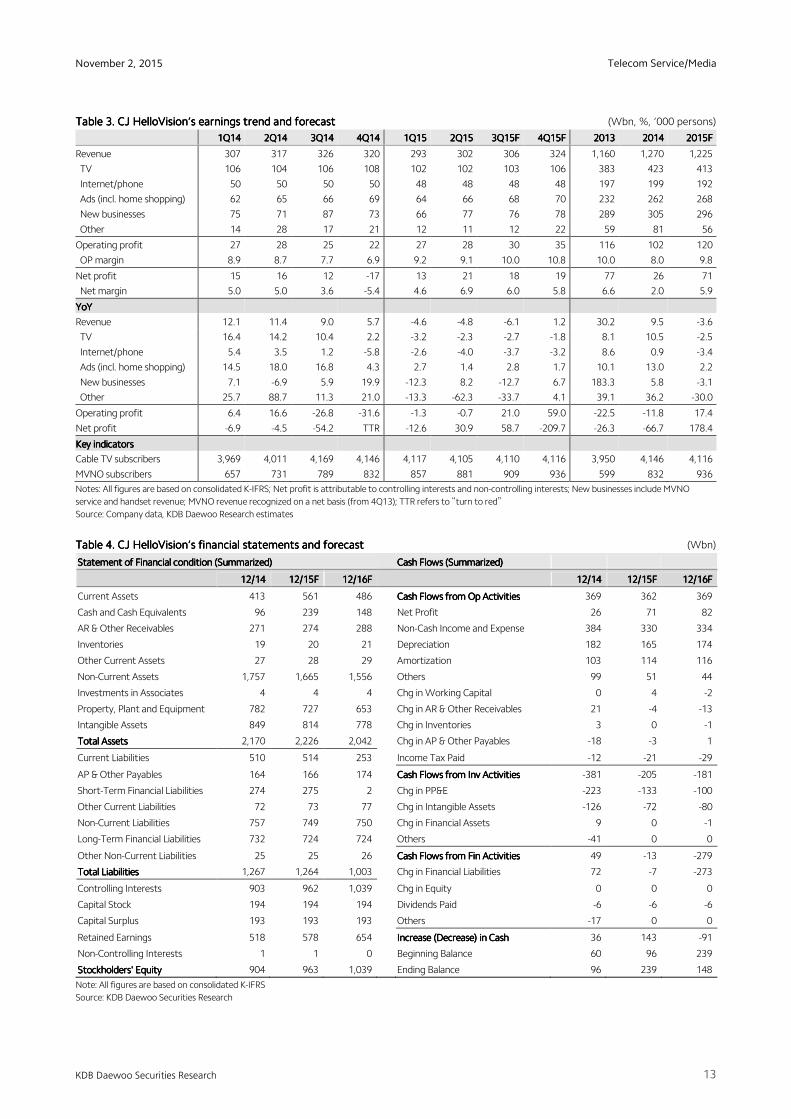
TableTableTableTable 3333. . . . CJ CJ CJ CJ HelloVision’HelloVision’HelloVision’HelloVision’ssss earnings trend and forecastearnings trend and forecastearnings trend and forecastearnings trend and forecast (Wbn, %, ‘000 persons)
1Q141Q141Q141Q14 2Q142Q142Q142Q14 3Q143Q143Q143Q14 4Q144Q144Q144Q14 1Q151Q151Q151Q15 2Q152Q152Q152Q15 3Q153Q153Q153Q15FFFF 4Q154Q154Q154Q15FFFF 2013201320132013 2014201420142014 2015F2015F2015F2015F
Revenue 307 317 326 320 293 302 306 324 1,160 1,270 1,225
TV 106 104 106 108 102 102 103 106 383 423 413
Internet/phone 50 50 50 50 48 48 48 48 197 199 192
Ads (incl. home shopping) 62 65 66 69 64 66 68 70 232 262 268
New businesses 75 71 87 73 66 77 76 78 289 305 296
Other 14 28 17 21 12 11 12 22 59 81 56
Operating profit 27 28 25 22 27 28 30 35 116 102 120
OP margin 8.9 8.7 7.7 6.9 9.2 9.1 10.0 10.8 10.0 8.0 9.8
Net profit 15 16 12 -17 13 21 18 19 77 26 71
Net margin 5.0 5.0 3.6 -5.4 4.6 6.9 6.0 5.8 6.6 2.0 5.9
YoYYoYYoYYoY
Revenue 12.1 11.4 9.0 5.7 -4.6 -4.8 -6.1 1.2 30.2 9.5 -3.6
TV 16.4 14.2 10.4 2.2 -3.2 -2.3 -2.7 -1.8 8.1 10.5 -2.5
Internet/phone 5.4 3.5 1.2 -5.8 -2.6 -4.0 -3.7 -3.2 8.6 0.9 -3.4
Ads (incl. home shopping) 14.5 18.0 16.8 4.3 2.7 1.4 2.8 1.7 10.1 13.0 2.2
New businesses 7.1 -6.9 5.9 19.9 -12.3 8.2 -12.7 6.7 183.3 5.8 -3.1
Other 25.7 88.7 11.3 21.0 -13.3 -62.3 -33.7 4.1 39.1 36.2 -30.0
Operating profit 6.4 16.6 -26.8 -31.6 -1.3 -0.7 21.0 59.0 -22.5 -11.8 17.4
Net profit -6.9 -4.5 -54.2 TTR -12.6 30.9 58.7 -209.7 -26.3 -66.7 178.4
Key indicatorsKey indicatorsKey indicatorsKey indicators
Cable TV subscribers 3,969 4,011 4,169 4,146 4,117 4,105 4,110 4,116 3,950 4,146 4,116
MVNO subscribers 657 731 789 832 857 881 909 936 599 832 936
Notes: All figures are based on consolidated K-IFRS; Net profit is attributable to controlling interests and non-controlling interests; New businesses include MVNO
service and handset revenue; MVNO revenue recognized on a net basis (from 4Q13); TTR refers to “turn to red”
Source: Company data, KDB Daewoo Research estimates
TableTableTableTable 4444. . . . CJ CJ CJ CJ HelloVision’HelloVision’HelloVision’HelloVision’ssss financial statements and forecastfinancial statements and forecastfinancial statements and forecastfinancial statements and forecast (Wbn)
Statement of Financial Statement of Financial Statement of Financial Statement of Financial ccccondition (Summarized)ondition (Summarized)ondition (Summarized)ondition (Summarized)
Cash Cash Cash Cash Flows (SummarizedFlows (SummarizedFlows (SummarizedFlows (Summarized))))
12/1412/1412/1412/14 12/15F12/15F12/15F12/15F 12/16F12/16F12/16F12/16F
12/1412/1412/1412/14 12/15F12/15F12/15F12/15F 12/16F12/16F12/16F12/16F
Current Assets 413 561 486
Cash Flows from Op ActivitiesCash Flows from Op ActivitiesCash Flows from Op ActivitiesCash Flows from Op Activities 369 362 369
Cash and Cash Equivalents 96 239 148
Net Profit 26 71 82
AR & Other Receivables 271 274 288
Non-Cash Income and Expense 384 330 334
Inventories 19 20 21
Depreciation 182 165 174
Other Current Assets 27 28 29
Amortization 103 114 116
Non-Current Assets 1,757 1,665 1,556
Others 99 51 44
Investments in Associates 4 4 4
Chg in Working Capital 0 4 -2
Property, Plant and Equipment 782 727 653
Chg in AR & Other Receivables 21 -4 -13
Intangible Assets 849 814 778
Chg in Inventories 3 0 -1
Total AssetsTotal AssetsTotal AssetsTotal Assets 2,170 2,226 2,042
Chg in AP & Other Payables -18 -3 1
Current Liabilities 510 514 253
Income Tax Paid -12 -21 -29
AP & Other Payables 164 166 174
Cash Flows from Inv ActivitiesCash Flows from Inv ActivitiesCash Flows from Inv ActivitiesCash Flows from Inv Activities -381 -205 -181
Short-Term Financial Liabilities 274 275 2
Chg in PP&E -223 -133 -100
Other Current Liabilities 72 73 77
Chg in Intangible Assets -126 -72 -80
Non-Current Liabilities 757 749 750
Chg in Financial Assets 9 0 -1
Long-Term Financial Liabilities 732 724 724
Others -41 0 0
Other Non-Current Liabilities 25 25 26
Cash Flows from Fin ActivitiesCash Flows from Fin ActivitiesCash Flows from Fin ActivitiesCash Flows from Fin Activities 49 -13 -279
Total LiabilitiesTotal LiabilitiesTotal LiabilitiesTotal Liabilities 1,267 1,264 1,003
Chg in Financial Liabilities 72 -7 -273
Controlling Interests 903 962 1,039
Chg in Equity 0 0 0
Capital Stock 194 194 194
Dividends Paid -6 -6 -6
Capital Surplus 193 193 193
Others -17 0 0
Retained Earnings 518 578 654
Increase (Decrease) in CashIncrease (Decrease) in CashIncrease (Decrease) in CashIncrease (Decrease) in Cash 36 143 -91
Non-Controlling Interests 1 1 0
Beginning Balance 60 96 239
Stockholders' EquityStockholders' EquityStockholders' EquityStockholders' Equity 904 963 1,039
Ending Balance 96 239 148
Note: All figures are based on consolidated K-IFRS
Source: KDB Daewoo Securities Research
Telecom Service/Media
14
November 2, 2015
KDB Daewoo Securities Research
APPENDIX 1
Important Disclosures & Disclaimers
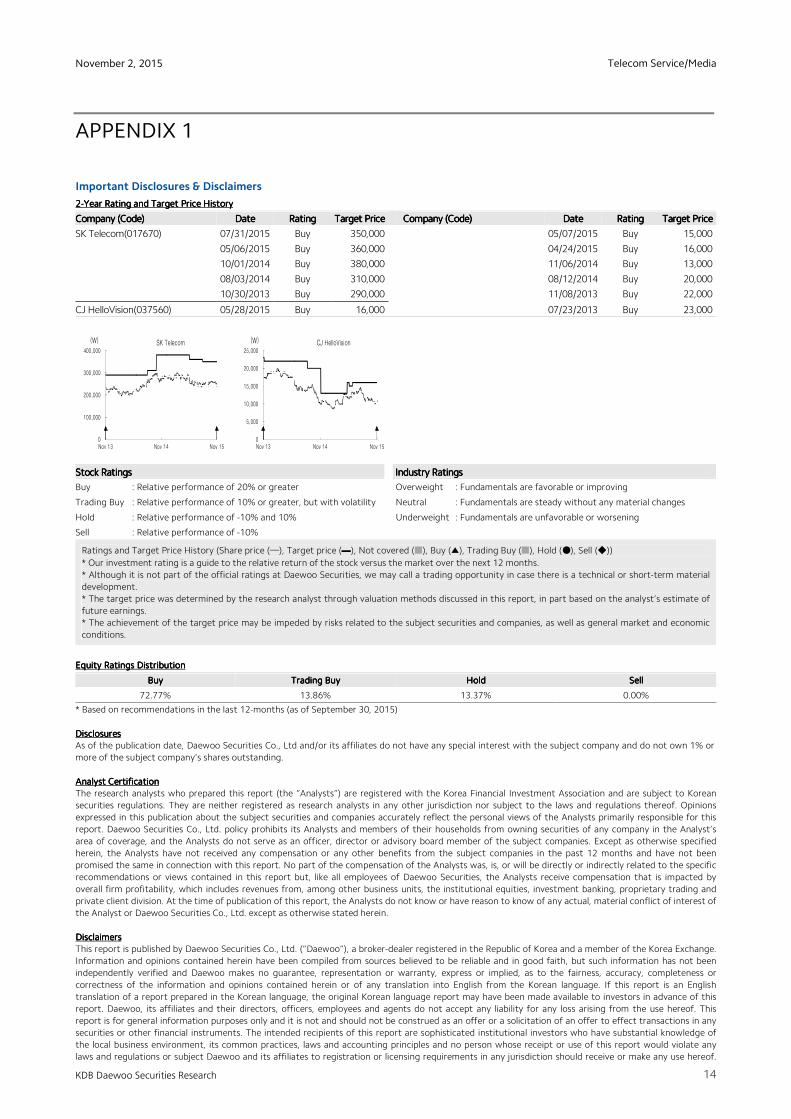
2222----Year Rating and Target Price HistoryYear Rating and Target Price HistoryYear Rating and Target Price HistoryYear Rating and Target Price History
Company (Code)Company (Code)Company (Code)Company (Code) DateDateDateDate RatingRatingRatingRating Target PriceTarget PriceTarget PriceTarget Price Company (Code)Company (Code)Company (Code)Company (Code) DateDateDateDate RatingRatingRatingRating Target PriceTarget PriceTarget PriceTarget Price
SK Telecom(017670) 07/31/2015 Buy 350,000 05/07/2015 Buy 15,000
05/06/2015 Buy 360,000 04/24/2015 Buy 16,000
10/01/2014 Buy 380,000 11/06/2014 Buy 13,000
08/03/2014 Buy 310,000 08/12/2014 Buy 20,000
10/30/2013 Buy 290,000 11/08/2013 Buy 22,000
CJ HelloVision(037560) 05/28/2015 Buy 16,000 07/23/2013 Buy 23,000
Equity Ratings DistributionEquity Ratings DistributionEquity Ratings DistributionEquity Ratings Distribution
BuyBuyBuyBuy Trading BuyTrading BuyTrading BuyTrading Buy HoldHoldHoldHold SellSellSellSell
72.77% 13.86% 13.37% 0.00%
* Based on recommendations in the last 12-months (as of September 30, 2015)
DisclosuresDisclosuresDisclosuresDisclosures
As of the publication date, Daewoo Securities Co., Ltd and/or its affiliates do not have any special interest with the subject company and do not own 1% or
more of the subject company's shares outstanding.
Analyst Analyst Analyst Analyst CertificationCertificationCertificationCertification
The research analysts who prepared this report (the “Analysts”) are registered with the Korea Financial Investment Association and are subject to Korean
securities regulations. They are neither registered as research analysts in any other jurisdiction nor subject to the laws and regulations thereof. Opinions
expressed in this publication about the subject securities and companies accurately reflect the personal views of the Analysts primarily responsible for this
report. Daewoo Securities Co., Ltd. policy prohibits its Analysts and members of their households from owning securities of any company in the Analyst’s
area of coverage, and the Analysts do not serve as an officer, director or advisory board member of the subject companies. Except as otherwise specified
herein, the Analysts have not received any compensation or any other benefits from the subject companies in the past 12 months and have not been
promised the same in connection with this report. No part of the compensation of the Analysts was, is, or will be directly or indirectly related to the specific
recommendations or views contained in this report but, like all employees of Daewoo Securities, the Analysts receive compensation that is impacted by
overall firm profitability, which includes revenues from, among other business units, the institutional equities, investment banking, proprietary trading and
private client division. At the time of publication of this report, the Analysts do not know or have reason to know of any actual, material conflict of interest of
the Analyst or Daewoo Securities Co., Ltd. except as otherwise stated herein.
DisclaimersDisclaimersDisclaimersDisclaimers
This report is published by Daewoo Securities Co., Ltd. (“Daewoo”), a broker-dealer registered in the Republic of Korea and a member of the Korea Exchange.
Information and opinions contained herein have been compiled from sources believed to be reliable and in good faith, but such information has not been
independently verified and Daewoo makes no guarantee, representation or warranty, express or implied, as to the fairness, accuracy, completeness or
correctness of the information and opinions contained herein or of any translation into English from the Korean language. If this report is an English
translation of a report prepared in the Korean language, the original Korean language report may have been made available to investors in advance of this
report. Daewoo, its affiliates and their directors, officers, employees and agents do not accept any liability for any loss arising from the use hereof. This
report is for general information purposes only and it is not and should not be construed as an offer or a solicitation of an offer to effect transactions in any
securities or other financial instruments. The intended recipients of this report are sophisticated institutional investors who have substantial knowledge of
the local business environment, its common practices, laws and accounting principles and no person whose receipt or use of this report would violate any
laws and regulations or subject Daewoo and its affiliates to registration or licensing requirements in any jurisdiction should receive or make any use hereof.
Stock RatingsStock RatingsStock RatingsStock Ratings Industry Industry Industry Industry RatingsRatingsRatingsRatings
Buy : Relative performance of 20% or greater Overweight : Fundamentals are favorable or improving
Trading Buy : Relative performance of 10% or greater, but with volatility Neutral : Fundamentals are steady without any material changes
Hold : Relative performance of -10% and 10% Underweight : Fundamentals are unfavorable or worsening
Sell : Relative performance of -10%
Ratings and Target Price History (Share price (─), Target price (▬), Not covered (■), Buy (▲), Trading Buy (■), Hold (●), Sell (◆))
* Our investment rating is a guide to the relative return of the stock versus the market over the next 12 months.
* Although it is not part of the official ratings at Daewoo Securities, we may call a trading opportunity in case there is a technical or short-term material
development.
* The target price was determined by the research analyst through valuation methods discussed in this report, in part based on the analyst’s estimate of
future earnings.
* The achievement of the target price may be impeded by risks related to the subject securities and companies, as well as general market and economic
conditions.
0
100,000
200,000
300,000
400,000
Nov 13 Nov 14 Nov 15
(W) SK Telecom
0
5,000
10,000
15,000
20,000
25,000
Nov 13 Nov 14 Nov 15
(W) CJ HelloVision
Telecom Service/Media
15
November 2, 2015
KDB Daewoo Securities Research
Information and opinions contained herein are subject to change without notice and no part of this document may be copied or reproduced in any manner or
form or redistributed or published, in whole or in part, without the prior written consent of Daewoo. Daewoo, its affiliates and their directors, officers,
employees and agents may have long or short positions in any of the subject securities at any time and may make a purchase or sale, or offer to make a
purchase or sale, of any such securities or other financial instruments from time to time in the open market or otherwise, in each case either as principals or
agents. Daewoo and its affiliates may have had, or may be expecting to enter into, business relationships with the subject companies to provide investment
banking, market-making or other financial services as are permitted under applicable laws and regulations. The price and value of the investments referred to
in this report and the income from them may go down as well as up, and investors may realize losses on any investments. Past performance is not a guide to
future performance. Future returns are not guaranteed, and a loss of original capital may occur.
DistributionDistributionDistributionDistribution
United Kingdom: This report is being distributed by Daewoo Securities (Europe) Ltd. in the United Kingdom only to (i) investment professionals falling within
Article 19(5) of the Financial Services and Markets Act 2000 (Financial Promotion) Order 2005 (the “Order”), and (ii) high net worth companies and other
persons to whom it may lawfully be communicated, falling within Article 49(2)(A) to (E) of the Order (all such persons together being referred to as “Relevant
Persons”). This report is directed only at Relevant Persons. Any person who is not a Relevant Person should not act or rely on this report or any of its
contents.
United States: This report is distributed in the U.S. by Daewoo Securities (America) Inc., a member of FINRA/SIPC, and is only intended for major institutional
investors as defined in Rule 15a-6(b)(4) under the U.S. Securities Exchange Act of 1934. All U.S. persons that receive this document by their acceptance
thereof represent and warrant that they are a major institutional investor and have not received this report under any express or implied understanding that
they will direct commission income to Daewoo or its affiliates. Any U.S. recipient of this document wishing to effect a transaction in any securities discussed
herein should contact and place orders with Daewoo Securities (America) Inc., which accepts responsibility for the contents of this report in the U.S. The
securities described in this report may not have been registered under the U.S. Securities Act of 1933, as amended, and, in such case, may not be offered or
sold in the U.S. or to U.S. persons absent registration or an applicable exemption from the registration requirements.
Hong Kong: This document has been approved for distribution in Hong Kong by Daewoo Securities (Hong Kong) Ltd., which is regulated by the Hong Kong
Securities and Futures Commission. The contents of this report have not been reviewed by any regulatory authority in Hong Kong. This report is for
distribution only to professional investors within the meaning of Part I of Schedule 1 to the Securities and Futures Ordinance of Hong Kong (Cap. 571, Laws
of Hong Kong) and any rules made thereunder and may not be redistributed in whole or in part in Hong Kong to any person.
All Other Jurisdictions: Customers in all other countries who wish to effect a transaction in any securities referenced in this report should contact Daewoo or
its affiliates only if distribution to or use by such customer of this report would not violate applicable laws and regulations and not subject Daewoo and its
affiliates to any registration or licensing requirement within such jurisdiction.
Telecom Service/Media
16
November 2, 2015
KDB Daewoo Securities Research
KDB Daewoo Securities International Network
Daewoo Securities Co. Ltd. (Seoul)Daewoo Securities Co. Ltd. (Seoul)Daewoo Securities Co. Ltd. (Seoul)Daewoo Securities Co. Ltd. (Seoul) Daewoo Securities (Hong Kong) Ltd. Daewoo Securities (Hong Kong) Ltd. Daewoo Securities (Hong Kong) Ltd. Daewoo Securities (Hong Kong) Ltd. Daewoo Securities (America) Inc. Daewoo Securities (America) Inc. Daewoo Securities (America) Inc. Daewoo Securities (America) Inc.
Head Office
34-3 Yeouido-dong, Yeongdeungpo-gu
Seoul 150-716
Korea
Two International Finance Centre
Suites 2005-2012
8 Finance Street, Central
Hong Kong, China
320 Park Avenue
31st Floor
New York, NY 10022
United States
Tel: 82-2-768-3026 Tel: 85-2-2845-6332 Tel: 1-212-407-1000
Daewoo Securities (Europe) Ltd. Daewoo Securities (Europe) Ltd. Daewoo Securities (Europe) Ltd. Daewoo Securities (Europe) Ltd. Daewoo Securities (Singapore) Pte. Ltd. Daewoo Securities (Singapore) Pte. Ltd. Daewoo Securities (Singapore) Pte. Ltd. Daewoo Securities (Singapore) Pte. Ltd. Tokyo BranchTokyo BranchTokyo BranchTokyo Branch
41st Floor, Tower 42
25 Old Broad St.
London EC2N 1HQ
United Kingdom
Six Battery Road #11-01
Singapore, 049909
7th Floor, Yusen Building
2-3-2 Marunouchi, Chiyoda-ku
Tokyo 100-0005
Japan
Tel: 44-20-7982-8000 Tel: 65-6671-9845 Tel: 81-3- 3211-5511
Beijing Representative OfficeBeijing Representative OfficeBeijing Representative OfficeBeijing Representative Office Shanghai Shanghai Shanghai Shanghai Representative OfficeRepresentative OfficeRepresentative OfficeRepresentative Office Ho Chi Minh Representative Office Ho Chi Minh Representative Office Ho Chi Minh Representative Office Ho Chi Minh Representative Office
2401A, 24th Floor, East Tower, Twin Towers
B-12 Jianguomenwai Avenue
Chaoyang District, Beijing 100022
China
Room 38T31, 38F SWFC
100 Century Avenue
Pudong New Area, Shanghai 200120
China
Suite 2103, Saigon Trade Center
37 Ton Duc Thang St,
Dist. 1, Ho Chi Minh City,
Vietnam
Tel: 86-10-6567-9299 Tel: 86-21-5013-6392 Tel: 84-8-3910-6000
Daewoo Investment Advisory (Beijing) Co., Ltd.Daewoo Investment Advisory (Beijing) Co., Ltd.Daewoo Investment Advisory (Beijing) Co., Ltd.Daewoo Investment Advisory (Beijing) Co., Ltd. Daewoo Securities (Mongolia) LLCDaewoo Securities (Mongolia) LLCDaewoo Securities (Mongolia) LLCDaewoo Securities (Mongolia) LLC PT. Daewoo PT. Daewoo PT. Daewoo PT. Daewoo Securities IndonesiaSecurities IndonesiaSecurities IndonesiaSecurities Indonesia
2401B, 24th Floor, East Tower, Twin Towers
B-12 Jianguomenwai Avenue,
Chaoyang District, Beijing 100022
China
#406, Blue Sky Tower, Peace Avenue 17
1 Khoroo, Sukhbaatar District
Ulaanbaatar 14240
Mongolia
Equity Tower Building Lt.50
Sudirman Central Business District Jl.
Jendral Sudirman Kav. 52-53, Jakarta Selatan
Indonesia 12190
Tel: 86-10-6567-9699 Tel: 976-7011-0807 Tel: 62-21-515-1140


![[2016 Outlook] Telecom Service](https://img.pdfslide.us/doc/110x75/58ecead81a28abb1248b467f/2016-outlook-telecom-service.jpg)