Embed Size (px)
Citation preview
Telecom Regulatory Authority of India
STUDY PAPER ON
SHAREHOLDING PATTERN, FINANCING PATTERN AND CAPITAL
STRUCTURE OF INDIAN PRIVATE TELECOM ACCESS SERVICE PROVIDERS
8th SEPTEMBER, 2016
Mahanagar Doorsanchar Bhawan
Jawahar Lal Nehru Marg
New Delhi-110002
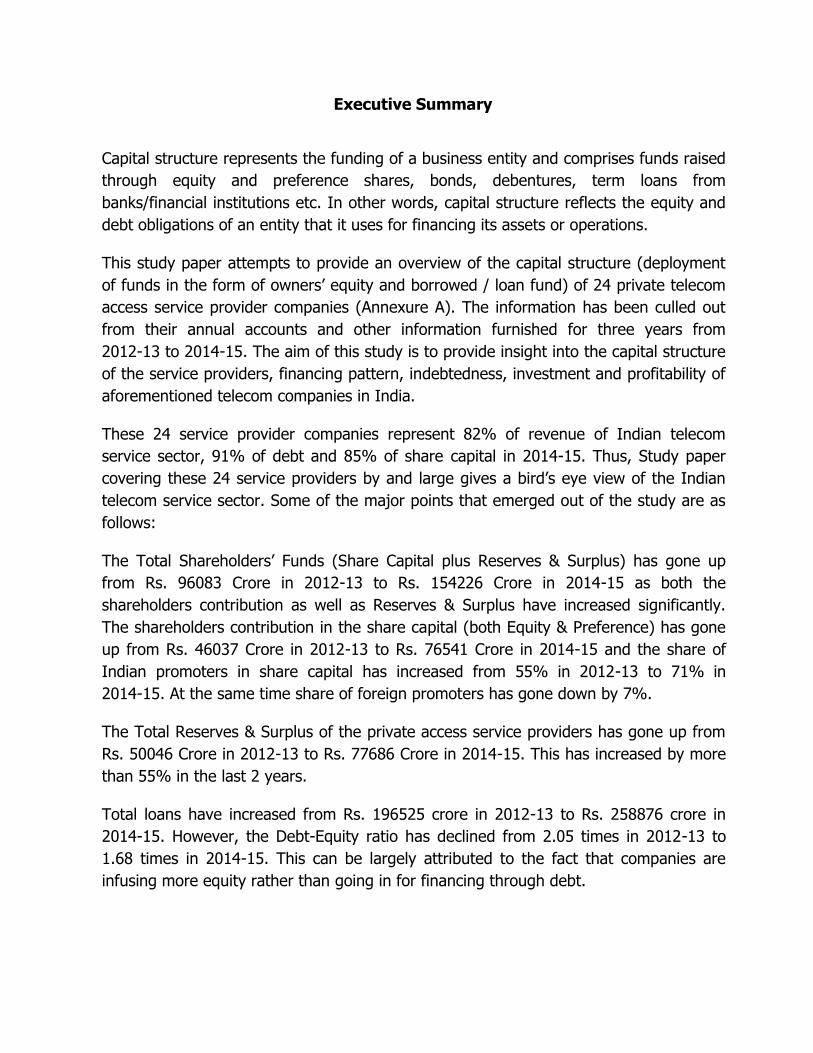
Executive Summary
Capital structure represents the funding of a business entity and comprises funds raised
through equity and preference shares, bonds, debentures, term loans from
banks/financial institutions etc. In other words, capital structure reflects the equity and
debt obligations of an entity that it uses for financing its assets or operations.
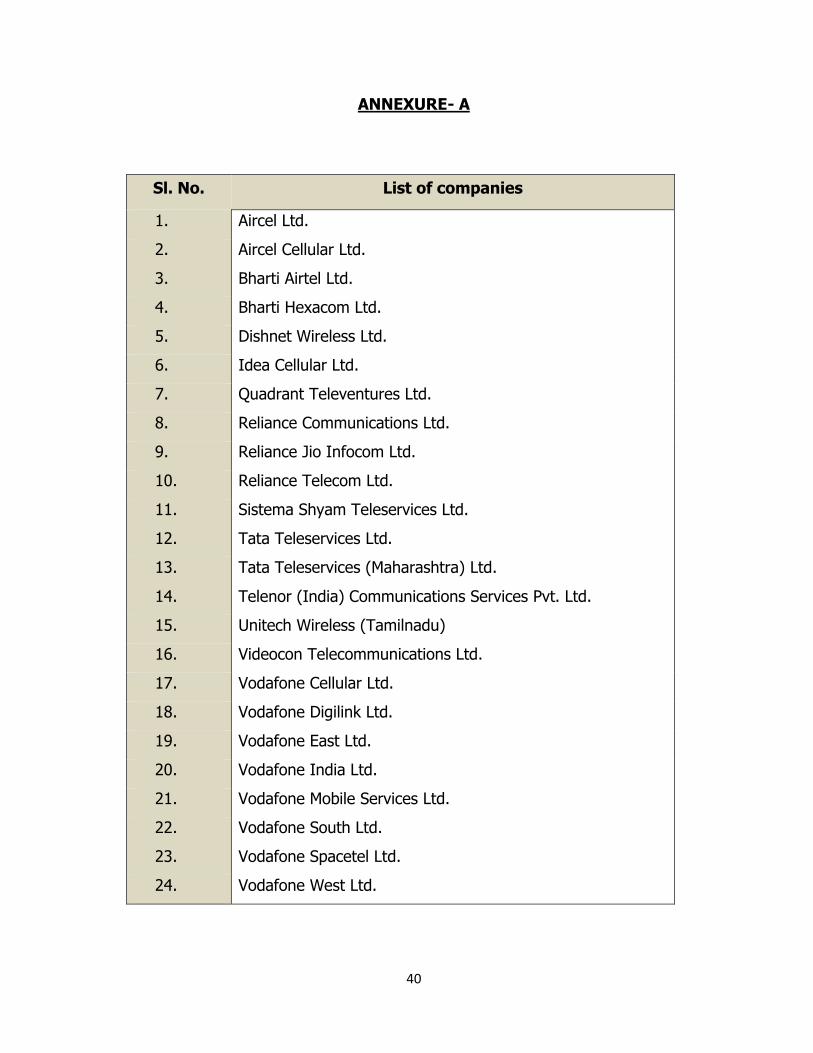
This study paper attempts to provide an overview of the capital structure (deployment
of funds in the form of owners’ equity and borrowed / loan fund) of 24 private telecom
access service provider companies (Annexure A). The information has been culled out
from their annual accounts and other information furnished for three years from
2012-13 to 2014-15. The aim of this study is to provide insight into the capital structure
of the service providers, financing pattern, indebtedness, investment and profitability of
aforementioned telecom companies in India.
These 24 service provider companies represent 82% of revenue of Indian telecom
service sector, 91% of debt and 85% of share capital in 2014-15. Thus, Study paper
covering these 24 service providers by and large gives a bird’s eye view of the Indian
telecom service sector. Some of the major points that emerged out of the study are as
follows:
The Total Shareholders’ Funds (Share Capital plus Reserves & Surplus) has gone up
from Rs. 96083 Crore in 2012-13 to Rs. 154226 Crore in 2014-15 as both the
shareholders contribution as well as Reserves & Surplus have increased significantly.
The shareholders contribution in the share capital (both Equity & Preference) has gone
up from Rs. 46037 Crore in 2012-13 to Rs. 76541 Crore in 2014-15 and the share of
Indian promoters in share capital has increased from 55% in 2012-13 to 71% in
2014-15. At the same time share of foreign promoters has gone down by 7%.
The Total Reserves & Surplus of the private access service providers has gone up from
Rs. 50046 Crore in 2012-13 to Rs. 77686 Crore in 2014-15. This has increased by more
than 55% in the last 2 years.
Total loans have increased from Rs. 196525 crore in 2012-13 to Rs. 258876 crore in
2014-15. However, the Debt-Equity ratio has declined from 2.05 times in 2012-13 to
1.68 times in 2014-15. This can be largely attributed to the fact that companies are
infusing more equity rather than going in for financing through debt.
The infusion of funds in Fixed Assets (Gross Block including Capital work in Progress) by
the private access service providers has increased from Rs. 360590 crore in 2012-13 to
Rs. 505934 crore in 2014-15.
The Interest coverage ratio has also shown improvement because the cost of debt
(Interest Charges) has declined from Rs. 17563 Crore to in 2012-13 Rs. 16199 Crore in
2014-15, which indicates that lesser use of loan funds.
At the same time, the growth in total revenue has contributed to the growth in
operating margin i.e. Earnings before Interest, Tax, Depreciation and Amortization
(EBITDA) and the EBITDA margin has gone up from 19.77 % to 28.50% during this
period. Similarly the Profit before Finance Charges and Tax (PBIT) stood at Rs. 28996
crore as on March 2015.
The study covers the following areas:
(A) SHAREHOLDING PATTERN
(B) RESERVES & SURPLUS
(C) FINANCING PATTERN
(D) DEBT COVERAGE
(E) INVESTMENT IN FIXED ASSETS
(F) CAPITAL STRUCTURE & PROFITABILITY OF 5 MAJOR PRIVATE TELECOM ACCESS
SERVICE PROVIDERS
(G) CONCLUSION
****************************
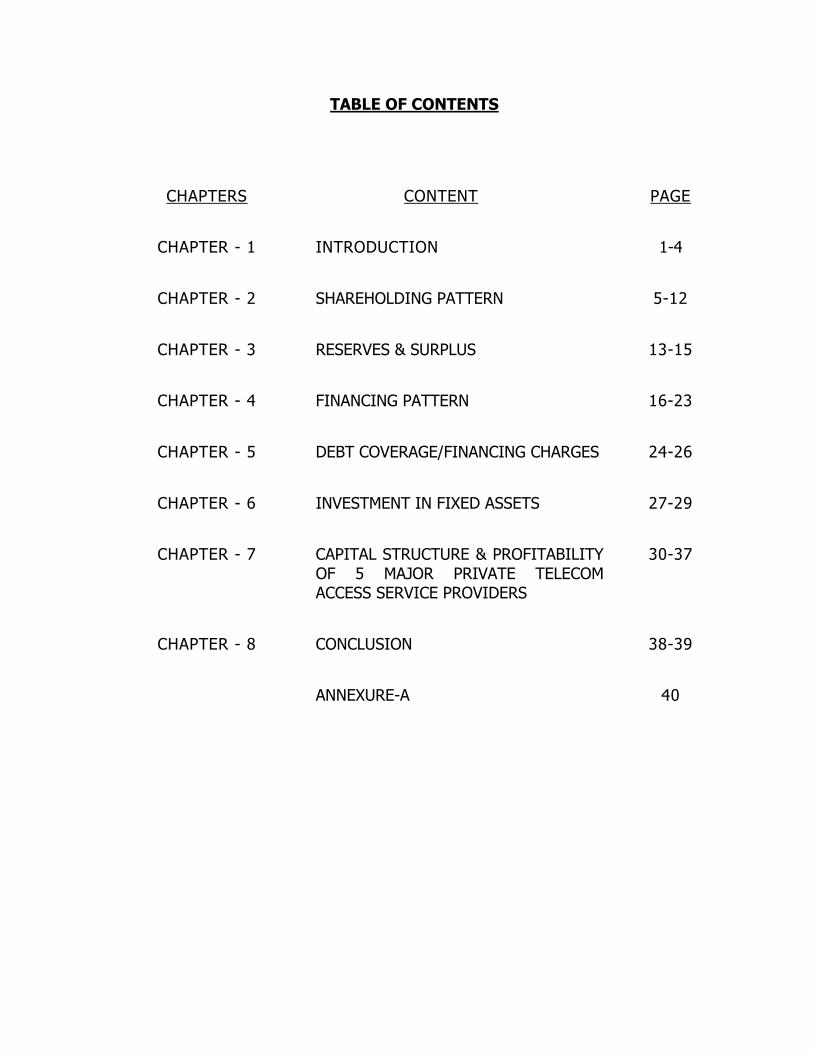
TABLE OF CONTENTS
CHAPTERS CONTENT PAGE
CHAPTER - 1 INTRODUCTION 1-4
CHAPTER - 2 SHAREHOLDING PATTERN 5-12
CHAPTER - 3 RESERVES & SURPLUS 13-15
CHAPTER - 4 FINANCING PATTERN 16-23
CHAPTER - 5 DEBT COVERAGE/FINANCING CHARGES 24-26
CHAPTER - 6 INVESTMENT IN FIXED ASSETS 27-29
CHAPTER - 7 CAPITAL STRUCTURE & PROFITABILITY OF 5 MAJOR PRIVATE TELECOM ACCESS SERVICE PROVIDERS
30-37
CHAPTER - 8 CONCLUSION 38-39
ANNEXURE-A 40
1
CHAPTER – 1
1. INTRODUCTION
The telecom sector is a vibrant and important sector which has been recognized world-
over as an important tool for socio economic development of a nation. Telecom services
have been an instrument of empowerment, connecting people across the globe and
increasing access. The role of a dynamic, responsive, business oriented telecom sector
in promoting growth is well recognised and extensively documented. Over time,
telecommunications has evolved as a basic infrastructure like electricity & power,
transportation, roads etc. The telecom sector is highly dynamic both in terms of new
technologies and break through innovations. Telecommunication sector is recognised as
capital intensive sector not just because of investment required for creation, expansion
and maintenance of the telecom network but also for acquisition of air waves
(presently in major parts of world, Radio Frequency Spectrum is assigned through
competitive auction process).
The Indian telecom sector has registered a phenomenal growth during the last decade
or so and has emerged as a fastest growing sector of the economy. There is stiff
competition in the access service segment mainly due to a large number of telecom
service providers (8 to 10) in each Licensed Service Area (LSA). The tariff forbearance
regulatory regime has allowed the telecom service providers to innovate so far as tariffs
are concerned. Low tariffs have also contributed to the explosive growth in the number
of subscribers by the making the telecom services affordable. Additionally, in the recent
past, there has been an uptake in data usage among subscribers indicating
transformation in subscribers’ usage pattern. The share of data revenue rose to 22% in
quarter ended March 2016 as compared to 12% in quarter ended December 2013. In
the 3 years ended on March 2015, average annual growth in gross revenue was 8.2%
while that of subscribers during the same year was 5.7%.
1.1 SIGNIFICANT EVENTS OF INDIAN TELECOM INDUSTRY
The major events, regulatory and policy developments in the telecom sector in India
since the opening of the sector for private participation are enumerated below:
Year Significant Events
1990-95
(i) In the early 1990s the Indian telecom sector, which was owned and controlled by the Government, was liberalized and private sector participation was permitted through a gradual process.
2
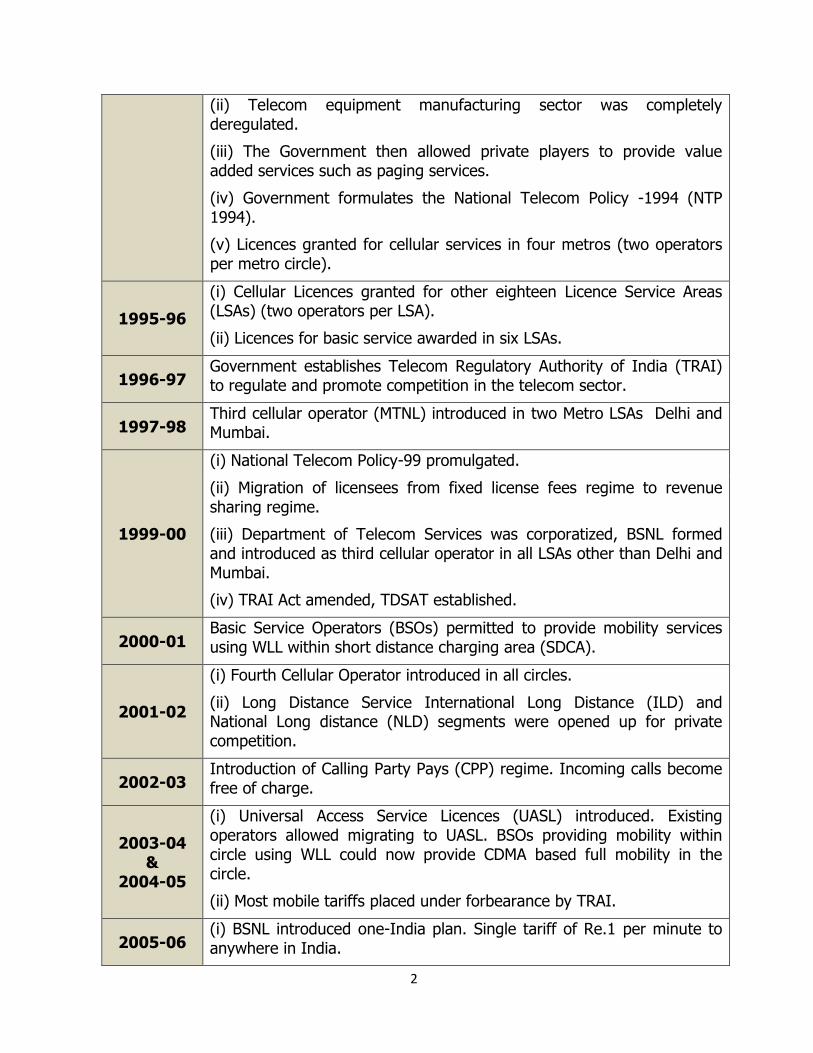
(ii) Telecom equipment manufacturing sector was completely deregulated.
(iii) The Government then allowed private players to provide value added services such as paging services.
(iv) Government formulates the National Telecom Policy -1994 (NTP 1994).
(v) Licences granted for cellular services in four metros (two operators per metro circle).
1995-96
(i) Cellular Licences granted for other eighteen Licence Service Areas (LSAs) (two operators per LSA).
(ii) Licences for basic service awarded in six LSAs.
1996-97 Government establishes Telecom Regulatory Authority of India (TRAI) to regulate and promote competition in the telecom sector.
1997-98 Third cellular operator (MTNL) introduced in two Metro LSAs Delhi and Mumbai.
1999-00
(i) National Telecom Policy-99 promulgated.
(ii) Migration of licensees from fixed license fees regime to revenue sharing regime.
(iii) Department of Telecom Services was corporatized, BSNL formed and introduced as third cellular operator in all LSAs other than Delhi and Mumbai.
(iv) TRAI Act amended, TDSAT established.
2000-01 Basic Service Operators (BSOs) permitted to provide mobility services using WLL within short distance charging area (SDCA).
2001-02
(i) Fourth Cellular Operator introduced in all circles.
(ii) Long Distance Service International Long Distance (ILD) and National Long distance (NLD) segments were opened up for private competition.
2002-03 Introduction of Calling Party Pays (CPP) regime. Incoming calls become free of charge.
2003-04 &
2004-05
(i) Universal Access Service Licences (UASL) introduced. Existing operators allowed migrating to UASL. BSOs providing mobility within circle using WLL could now provide CDMA based full mobility in the circle.
(ii) Most mobile tariffs placed under forbearance by TRAI.
2005-06 (i) BSNL introduced one-India plan. Single tariff of Re.1 per minute to anywhere in India.
3
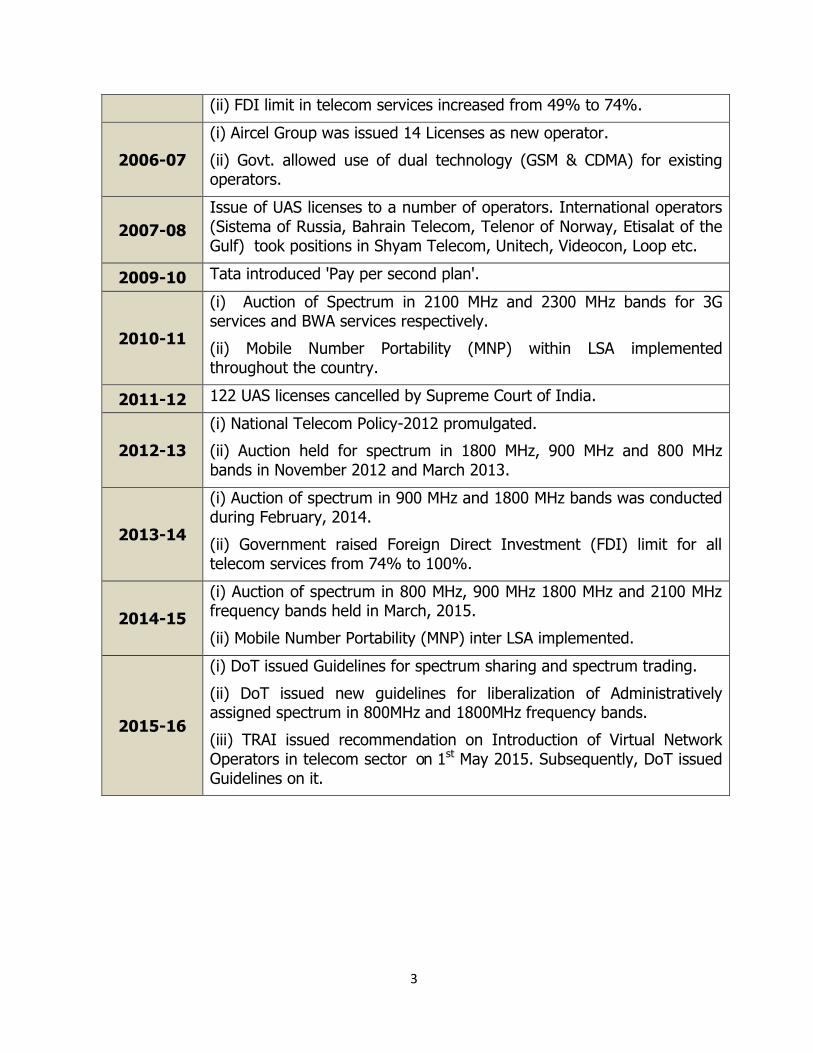
(ii) FDI limit in telecom services increased from 49% to 74%.
2006-07
(i) Aircel Group was issued 14 Licenses as new operator.
(ii) Govt. allowed use of dual technology (GSM & CDMA) for existing operators.
2007-08
Issue of UAS licenses to a number of operators. International operators (Sistema of Russia, Bahrain Telecom, Telenor of Norway, Etisalat of the Gulf) took positions in Shyam Telecom, Unitech, Videocon, Loop etc.
2009-10 Tata introduced 'Pay per second plan'.
2010-11
(i) Auction of Spectrum in 2100 MHz and 2300 MHz bands for 3G services and BWA services respectively.
(ii) Mobile Number Portability (MNP) within LSA implemented throughout the country.
2011-12 122 UAS licenses cancelled by Supreme Court of India.
2012-13
(i) National Telecom Policy-2012 promulgated.
(ii) Auction held for spectrum in 1800 MHz, 900 MHz and 800 MHz bands in November 2012 and March 2013.
2013-14
(i) Auction of spectrum in 900 MHz and 1800 MHz bands was conducted during February, 2014.
(ii) Government raised Foreign Direct Investment (FDI) limit for all telecom services from 74% to 100%.
2014-15
(i) Auction of spectrum in 800 MHz, 900 MHz 1800 MHz and 2100 MHz frequency bands held in March, 2015.
(ii) Mobile Number Portability (MNP) inter LSA implemented.
2015-16
(i) DoT issued Guidelines for spectrum sharing and spectrum trading.
(ii) DoT issued new guidelines for liberalization of Administratively assigned spectrum in 800MHz and 1800MHz frequency bands.
(iii) TRAI issued recommendation on Introduction of Virtual Network Operators in telecom sector on 1st May 2015. Subsequently, DoT issued Guidelines on it.
4
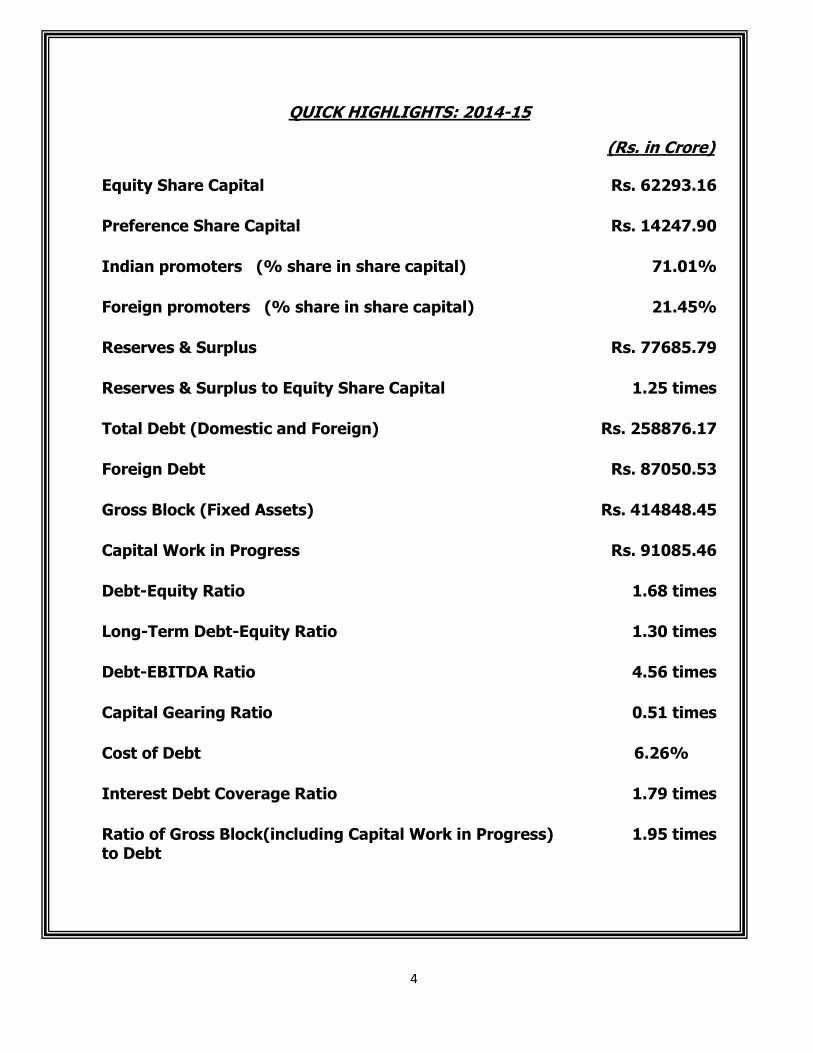
QUICK HIGHLIGHTS: 2014-15
(Rs. in Crore)
Equity Share Capital Rs. 62293.16
Preference Share Capital Rs. 14247.90
Indian promoters (% share in share capital) 71.01%
Foreign promoters (% share in share capital) 21.45%
Reserves & Surplus Rs. 77685.79
Reserves & Surplus to Equity Share Capital 1.25 times
Total Debt (Domestic and Foreign) Rs. 258876.17
Foreign Debt Rs. 87050.53
Gross Block (Fixed Assets) Rs. 414848.45
Capital Work in Progress Rs. 91085.46
Debt-Equity Ratio 1.68 times
Long-Term Debt-Equity Ratio 1.30 times
Debt-EBITDA Ratio 4.56 times
Capital Gearing Ratio 0.51 times
Cost of Debt 6.26%
Interest Debt Coverage Ratio 1.79 times
Ratio of Gross Block(including Capital Work in Progress) to Debt
1.95 times
5
CHAPTER - 2
2. SHAREHOLDING PATTERNS
Funds or capital is the life line of an enterprise for running its business and operations.
The financing of the capital can be done either through equity funds / share capital (i.e.
Owners’ Fund) or through debt (Loan Fund).
The capital of the company is divided into small units called shares which refer to the
portion of a company's equity that has been subscribed by the members /shareholders
for cash or equivalent items of capital value. The Memorandum of Association of the
company states the amount of capital with which the company is registered and the
number of shares into which the share capital of the company is divided. Share capital
is the total amount of capital subscribed and paid by its shareholders for achieving the
objectives of the company as stated in its Memorandum of Association. Equity funds are
contributed by its members in the total capital of the company and thereby they have
ownership right in the company.
There are broadly two categories of share capital which are issued to shareholders (i)
Equity Share Capital and; and (ii) Preference Share Capital.
2.1 EQUITY SHARE CAPITAL
Equity share capital can be (i) with voting rights; or (ii) with differential rights as to
dividend, voting or otherwise prescribed. Equity shareholders share profit in the form of
dividend and sometimes bonus shares are allotted depending upon availability of profits.
In the event of winding up of the company, the equity share holders are paid by the
company in the last after repayment of all its debts and liabilities including payment to
preference shareholders.
2.2 PREFERENCE SHARE CAPITAL
Preference share capital means that part of the issued share capital of the company
which carries or would carry a preferential right with respect to— (a) payment of
dividend, either as a fixed amount or an amount calculated at a fixed rate; and (b)
repayment, in the case of a winding up or repayment of capital. Preference shares are
offered as part of share capital and holders of these shares are called Preference
shareholders. Preference shares are quasi-debt and combine features of equity and
debt. Preference share capital is security issued by a company and does not carry voting
rights like equity shares. Preference shares carry equity risk as the principal is not
secured; however, they entitle holders to a dividend similar to fixed deposit interest and
they have a set tenure at the end of which the company redeems the principal amount.
6
The Companies pay dividend on preference shares only when they earn a profit
however, in the case of cumulative preference shares, if the company does not pay
dividend in one year, the holder has the right to the payment in the next year.
The advantage to the preference shareholders as compared to investment in
debentures or other form of securities is that the income from dividend is tax-free in the
hands of investors (though companies pay dividend distribution tax on such dividend)
whereas interest income from non-convertible debentures (NCDs) is taxed, therefore
the net earnings from preference shares will be higher than earnings from NCDs and
tax-free bonds. However, the credit rating of the company issuing preference shares is
also important, while investing in preference shares, therefore, investors of such
company have to weigh the advantages from tax saving vis-a-vis risk involved in
investing in preference shares.
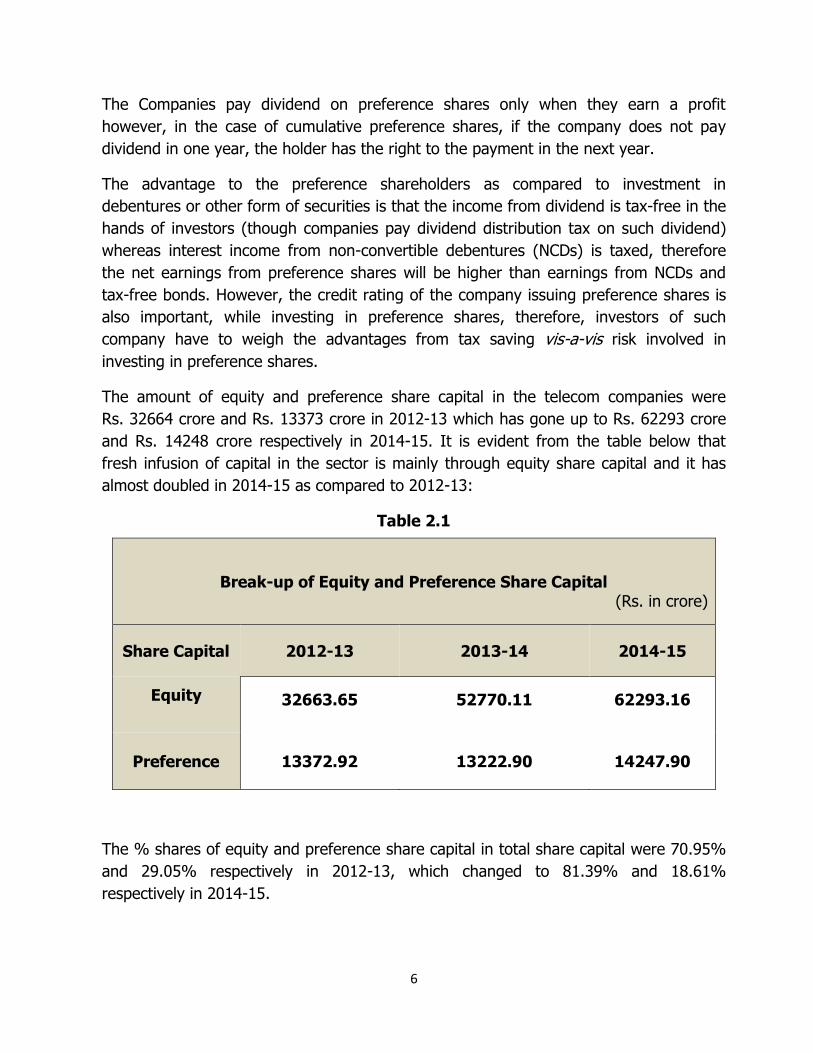
The amount of equity and preference share capital in the telecom companies were
Rs. 32664 crore and Rs. 13373 crore in 2012-13 which has gone up to Rs. 62293 crore
and Rs. 14248 crore respectively in 2014-15. It is evident from the table below that
fresh infusion of capital in the sector is mainly through equity share capital and it has
almost doubled in 2014-15 as compared to 2012-13:
Table 2.1
Break-up of Equity and Preference Share Capital
(Rs. in crore)
Share Capital 2012-13 2013-14 2014-15
Equity 32663.65
52770.11
62293.16
Preference 13372.92 13222.90 14247.90
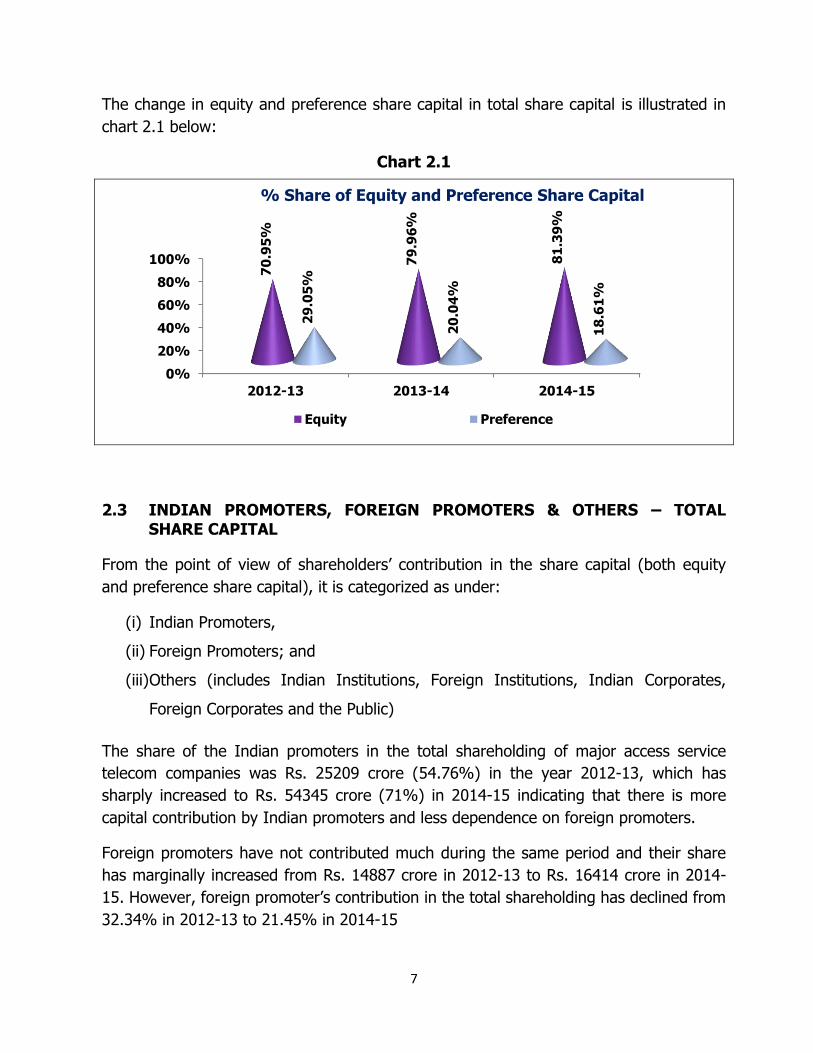
The % shares of equity and preference share capital in total share capital were 70.95%
and 29.05% respectively in 2012-13, which changed to 81.39% and 18.61%
respectively in 2014-15.
7
The change in equity and preference share capital in total share capital is illustrated in
chart 2.1 below:
Chart 2.1
2.3 INDIAN PROMOTERS, FOREIGN PROMOTERS & OTHERS – TOTAL SHARE CAPITAL
From the point of view of shareholders’ contribution in the share capital (both equity
and preference share capital), it is categorized as under:
(i) Indian Promoters,
(ii) Foreign Promoters; and
(iii) Others (includes Indian Institutions, Foreign Institutions, Indian Corporates,
Foreign Corporates and the Public)
The share of the Indian promoters in the total shareholding of major access service
telecom companies was Rs. 25209 crore (54.76%) in the year 2012-13, which has
sharply increased to Rs. 54345 crore (71%) in 2014-15 indicating that there is more
capital contribution by Indian promoters and less dependence on foreign promoters.
Foreign promoters have not contributed much during the same period and their share
has marginally increased from Rs. 14887 crore in 2012-13 to Rs. 16414 crore in 2014-
15. However, foreign promoter’s contribution in the total shareholding has declined from
32.34% in 2012-13 to 21.45% in 2014-15
0%
20%
40%
60%
80%
100%
2012-13 2013-14 2014-15
70
.95
%
79
.96
%
81
.39
%
29
.05
%
20
.04
%
18
.61
%
% Share of Equity and Preference Share Capital
Equity Preference
8
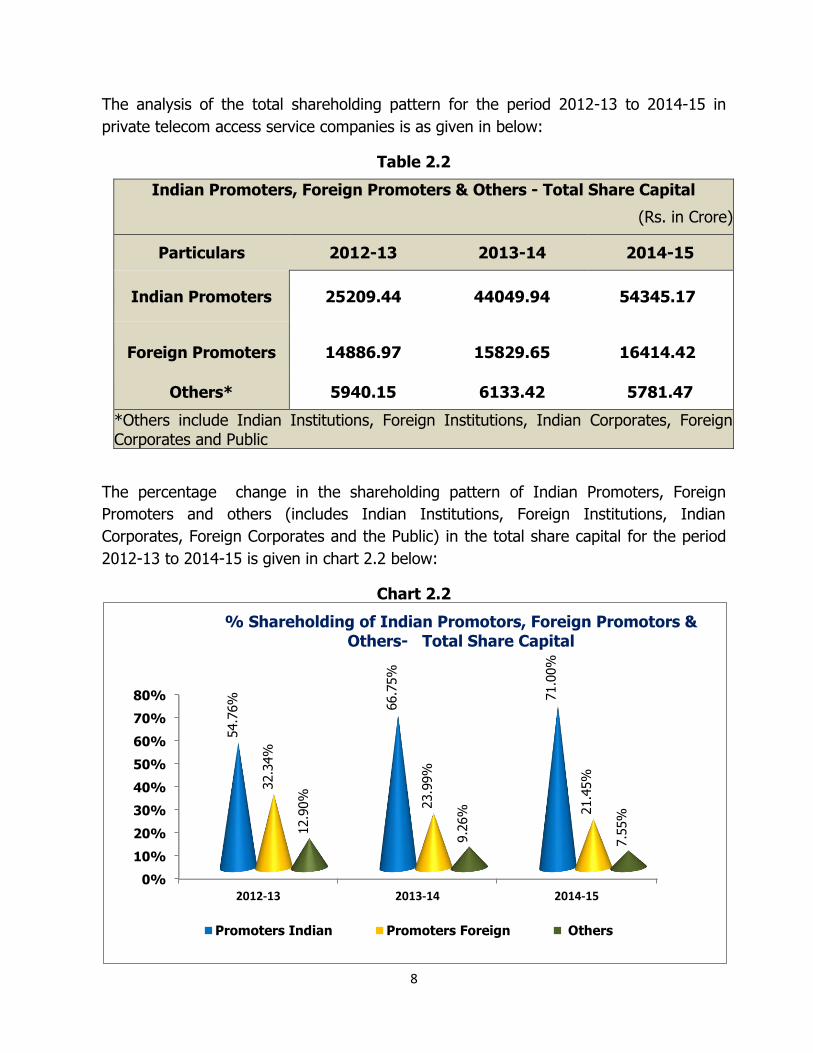
The analysis of the total shareholding pattern for the period 2012-13 to 2014-15 in
private telecom access service companies is as given in below:
Table 2.2
Indian Promoters, Foreign Promoters & Others - Total Share Capital
(Rs. in Crore)
Particulars 2012-13 2013-14 2014-15
Indian Promoters 25209.44 44049.94 54345.17
Foreign Promoters 14886.97 15829.65 16414.42
Others* 5940.15 6133.42 5781.47
*Others include Indian Institutions, Foreign Institutions, Indian Corporates, Foreign Corporates and Public
The percentage change in the shareholding pattern of Indian Promoters, Foreign
Promoters and others (includes Indian Institutions, Foreign Institutions, Indian
Corporates, Foreign Corporates and the Public) in the total share capital for the period
2012-13 to 2014-15 is given in chart 2.2 below:
Chart 2.2
0%
10%
20%
30%
40%
50%
60%
70%
80%
2012-13 2013-14 2014-15
54.7
6%
66.7
5%
71.0
0%
32.3
4%
23.9
9%
21.4
5%
12.9
0%
9.2
6%
7.5
5%
% Shareholding of Indian Promotors, Foreign Promotors &
Others- Total Share Capital
Promoters Indian Promoters Foreign Others
9
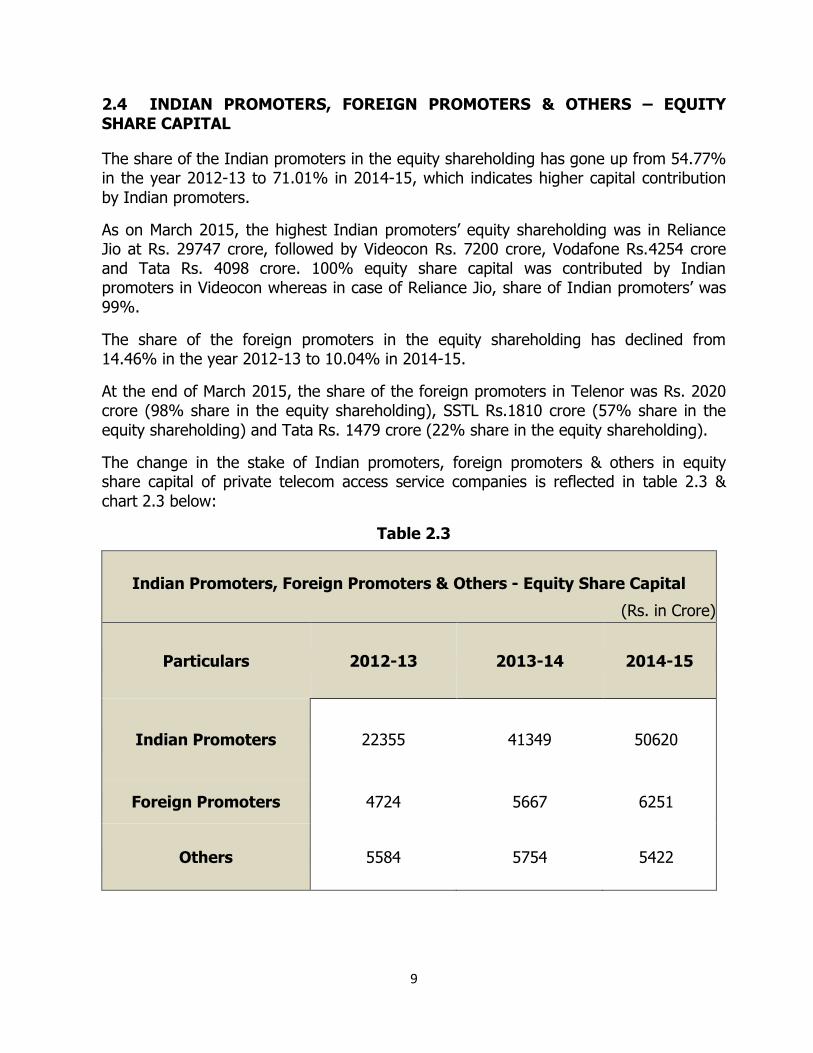
2.4 INDIAN PROMOTERS, FOREIGN PROMOTERS & OTHERS – EQUITY SHARE CAPITAL
The share of the Indian promoters in the equity shareholding has gone up from 54.77% in the year 2012-13 to 71.01% in 2014-15, which indicates higher capital contribution
by Indian promoters.
As on March 2015, the highest Indian promoters’ equity shareholding was in Reliance Jio at Rs. 29747 crore, followed by Videocon Rs. 7200 crore, Vodafone Rs.4254 crore and Tata Rs. 4098 crore. 100% equity share capital was contributed by Indian promoters in Videocon whereas in case of Reliance Jio, share of Indian promoters’ was 99%.
The share of the foreign promoters in the equity shareholding has declined from 14.46% in the year 2012-13 to 10.04% in 2014-15.
At the end of March 2015, the share of the foreign promoters in Telenor was Rs. 2020 crore (98% share in the equity shareholding), SSTL Rs.1810 crore (57% share in the
equity shareholding) and Tata Rs. 1479 crore (22% share in the equity shareholding).
The change in the stake of Indian promoters, foreign promoters & others in equity share capital of private telecom access service companies is reflected in table 2.3 &
chart 2.3 below:
Table 2.3
Indian Promoters, Foreign Promoters & Others - Equity Share Capital
(Rs. in Crore)
Particulars 2012-13 2013-14 2014-15
Indian Promoters 22355 41349 50620
Foreign Promoters 4724 5667 6251
Others 5584 5754 5422
10
Chart 2.3
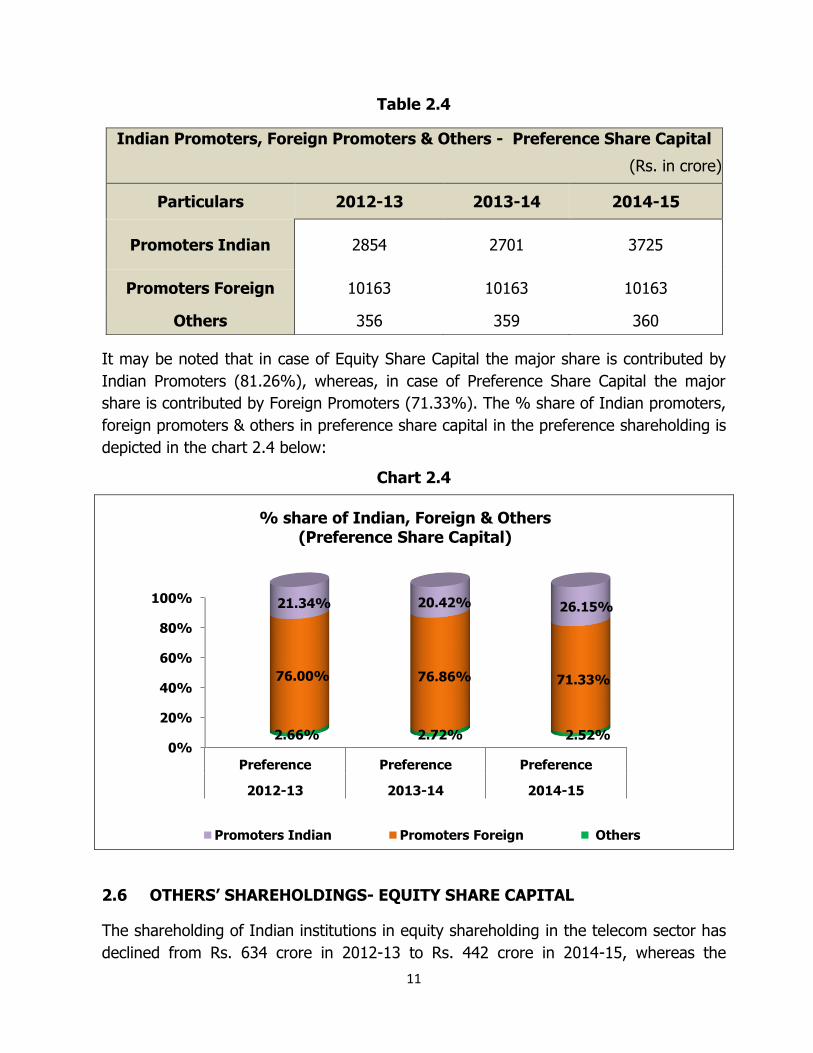
2.5 INDIAN PROMOTERS, FOREIGN PROMOTERS & OTHERS –PREFERENCE
SHARE CAPITAL
The trend indicates that the preference shareholding of Indian promoters and others
have increased from 24% in the year 2012-13 to 26.67% in 2014-15.
The share of the foreign promoters in the total preference shareholding has declined
from 76% in the year 2012-13 to 71.33% in 2014-15.
The change in the share of Indian promoters, foreign promoters & others in preference
share capital in the preference shareholding for the period 2012-13 to 2014-15 is given
in the table 2.4:
0%
20%
40%
60%
80%
100%
120%
Equity Equity Equity
2012-13 2013-14 2014-15
17.10% 10.90% 8.70%
14.46%
10.74% 10.04%
68.44% 78.36% 81.26%
% share of Indian, Foreign & other Equity Share Capital
Promoters Indian Promoters Foreign Others
11
Table 2.4
It may be noted that in case of Equity Share Capital the major share is contributed by
Indian Promoters (81.26%), whereas, in case of Preference Share Capital the major
share is contributed by Foreign Promoters (71.33%). The % share of Indian promoters,
foreign promoters & others in preference share capital in the preference shareholding is
depicted in the chart 2.4 below:
Chart 2.4
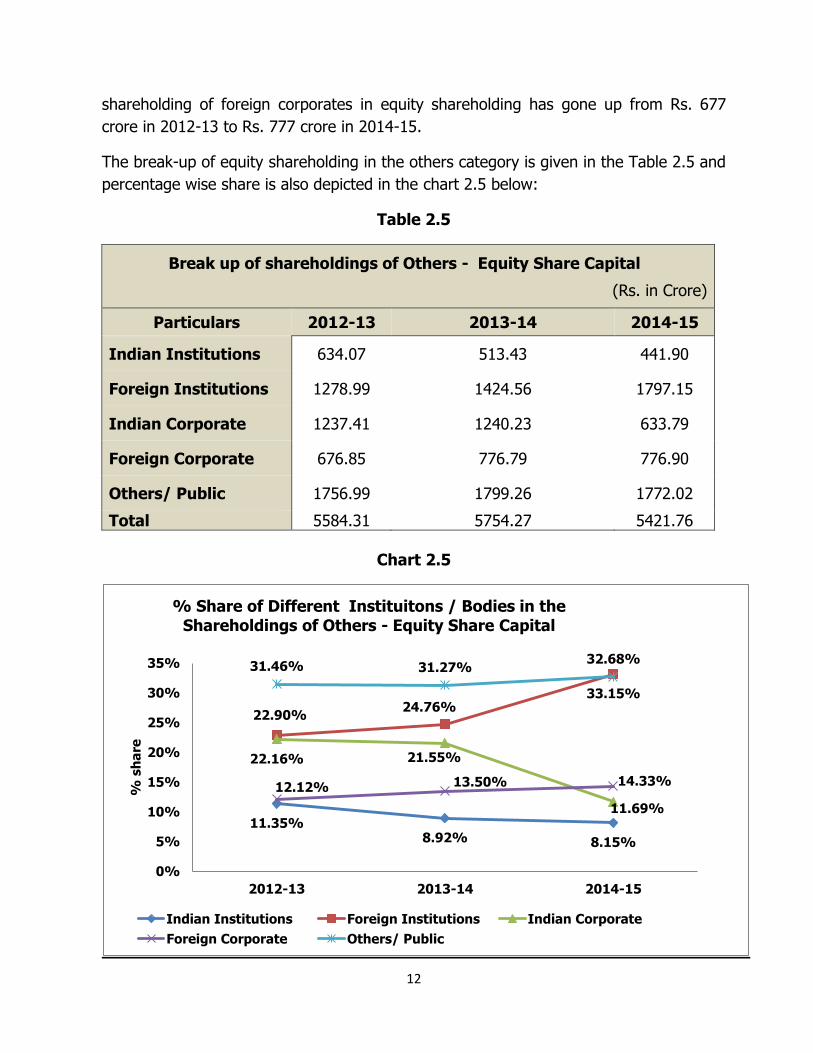
2.6 OTHERS’ SHAREHOLDINGS- EQUITY SHARE CAPITAL
The shareholding of Indian institutions in equity shareholding in the telecom sector has
declined from Rs. 634 crore in 2012-13 to Rs. 442 crore in 2014-15, whereas the
0%
20%
40%
60%
80%
100%
Preference Preference Preference
2012-13 2013-14 2014-15
2.66% 2.72% 2.52%
76.00% 76.86% 71.33%
21.34% 20.42% 26.15%
% share of Indian, Foreign & Others (Preference Share Capital)
Promoters Indian Promoters Foreign Others
Indian Promoters, Foreign Promoters & Others - Preference Share Capital
(Rs. in crore)
Particulars 2012-13 2013-14 2014-15
Promoters Indian 2854 2701 3725
Promoters Foreign 10163 10163 10163
Others 356 359 360
12
shareholding of foreign corporates in equity shareholding has gone up from Rs. 677
crore in 2012-13 to Rs. 777 crore in 2014-15.
The break-up of equity shareholding in the others category is given in the Table 2.5 and
percentage wise share is also depicted in the chart 2.5 below:
Table 2.5
Break up of shareholdings of Others - Equity Share Capital
(Rs. in Crore)
Particulars 2012-13 2013-14 2014-15
Indian Institutions 634.07 513.43 441.90
Foreign Institutions 1278.99 1424.56 1797.15
Indian Corporate 1237.41 1240.23 633.79
Foreign Corporate 676.85 776.79 776.90
Others/ Public 1756.99 1799.26 1772.02
Total 5584.31 5754.27 5421.76
Chart 2.5
11.35% 8.92% 8.15%
22.90% 24.76%
33.15%
22.16% 21.55%
11.69%
12.12% 13.50% 14.33%
31.46% 31.27% 32.68%
0%
5%
10%
15%
20%
25%
30%
35%
2012-13 2013-14 2014-15
% s
ha
re
% Share of Different Instituitons / Bodies in the Shareholdings of Others - Equity Share Capital
Indian Institutions Foreign Institutions Indian Corporate
Foreign Corporate Others/ Public
13
CHAPTER - 3
3. RESERVES & SURPLUS
Reserves and Surplus consists of General Reserves (the aggregate amount of corporate
earning that has been reinvested in the business, the surplus transferred from the profit
and loss account), the share premium reserve and other reserves created by revaluation
of assets or restructuring of business or for specific purposes etc. The term Reserves
and Surplus does not automatically connote cash. In fact, a company can have large
Reserves and Surplus and little cash or it can have plenty of cash and little Reserves
and Surplus.
The Reserves are internal source of funds and can be used in the form of ploughing
back of income for the expansion of the business, diversification of business etc;
however, certain reserves are set aside for specific purposes and some specific funds
represent book adjustments due to the impact of mergers & acquisitions or revaluation
of assets. Reserves & Surplus of a company include the following components:
(i) General Reserve
(ii) Profit & Loss Account (credit balance)
(iii) Capital Reserve
(iv) Securities Premium Reserve
(v) Revaluation Reserve
(vi) Debenture Redemption Reserve
(vii) Reserve for business restructuring
(viii) Employee Stock Option Plan (ESOP)
(ix) Other Reserves
Out of all the components of Reserves & Surplus, only the General Reserve and Profit &
Loss Account (credit balance) represent retained earnings that can be used for growth
and expansion of business; these are also called free reserves. Other components of
Reserves & Surplus can be used only for the specific purpose for which the reserve has
been created. Further, Revaluation Reserves and Reserves for Business Restructuring
represent adjustment entries in the books and do not translate into actual reserves till
the revalued assets are disposed off and the excess revalued amount is realized by the
company.
Sometimes companies show a huge amount as Reserves & Surplus in their balance
sheet which can be created by revaluation of assets or business restructuring. These
figures of Reserves & Surplus do not convey a correct picture of the financial soundness
of the company. It is therefore important to further examine the share of different
components of Reserves & Surplus to understand how much of these Reserves are
14
available for ploughing back in the business for expansion of business or diversification
of business.
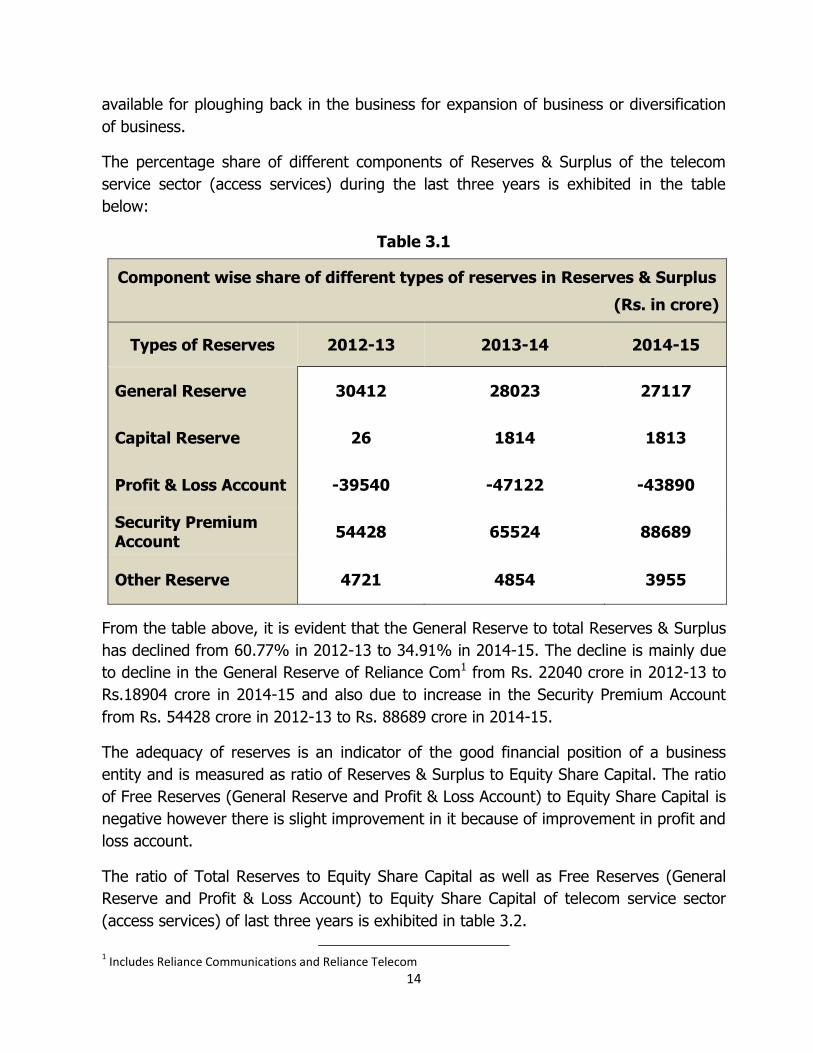
The percentage share of different components of Reserves & Surplus of the telecom
service sector (access services) during the last three years is exhibited in the table
below:
Table 3.1
Component wise share of different types of reserves in Reserves & Surplus
(Rs. in crore)
Types of Reserves 2012-13 2013-14 2014-15
General Reserve 30412 28023 27117
Capital Reserve 26 1814 1813
Profit & Loss Account -39540 -47122 -43890
Security Premium Account
54428 65524 88689
Other Reserve 4721 4854 3955
From the table above, it is evident that the General Reserve to total Reserves & Surplus
has declined from 60.77% in 2012-13 to 34.91% in 2014-15. The decline is mainly due
to decline in the General Reserve of Reliance Com1 from Rs. 22040 crore in 2012-13 to
Rs.18904 crore in 2014-15 and also due to increase in the Security Premium Account
from Rs. 54428 crore in 2012-13 to Rs. 88689 crore in 2014-15.
The adequacy of reserves is an indicator of the good financial position of a business
entity and is measured as ratio of Reserves & Surplus to Equity Share Capital. The ratio
of Free Reserves (General Reserve and Profit & Loss Account) to Equity Share Capital is
negative however there is slight improvement in it because of improvement in profit and
loss account.
The ratio of Total Reserves to Equity Share Capital as well as Free Reserves (General
Reserve and Profit & Loss Account) to Equity Share Capital of telecom service sector
(access services) of last three years is exhibited in table 3.2.
1 Includes Reliance Communications and Reliance Telecom
15
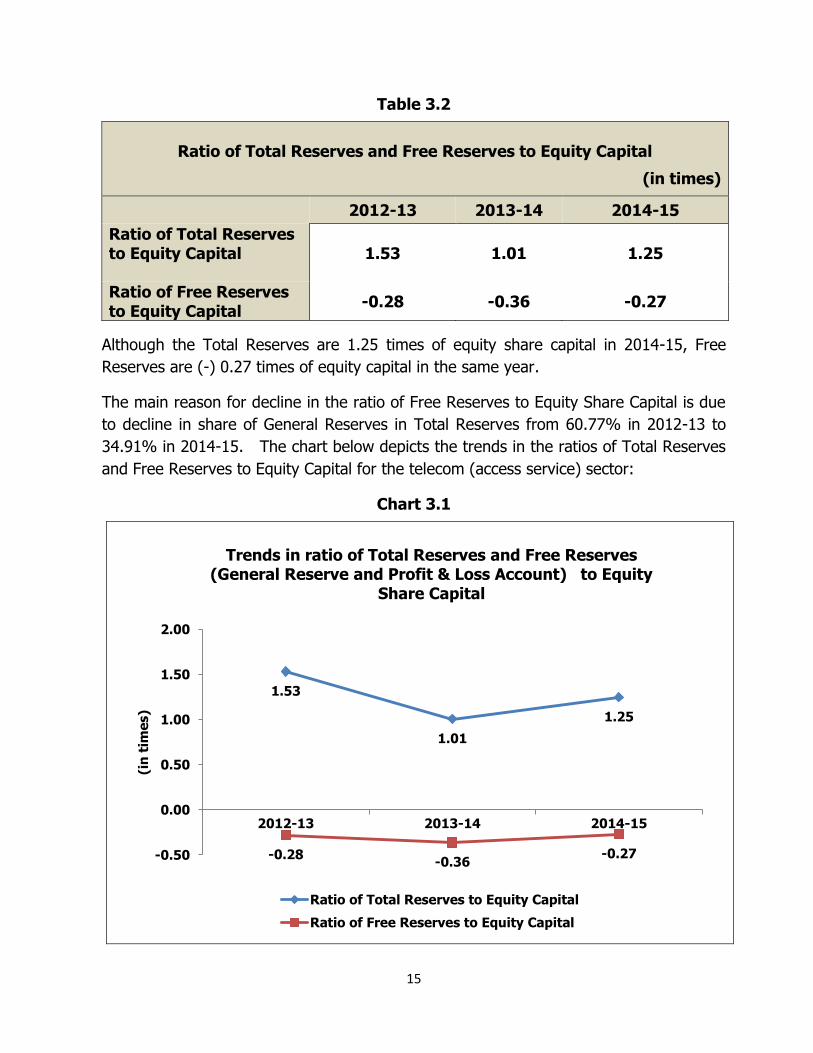
Table 3.2
Ratio of Total Reserves and Free Reserves to Equity Capital
(in times)
2012-13 2013-14 2014-15
Ratio of Total Reserves to Equity Capital
1.53 1.01 1.25
Ratio of Free Reserves to Equity Capital
-0.28 -0.36 -0.27
Although the Total Reserves are 1.25 times of equity share capital in 2014-15, Free
Reserves are (-) 0.27 times of equity capital in the same year.
The main reason for decline in the ratio of Free Reserves to Equity Share Capital is due
to decline in share of General Reserves in Total Reserves from 60.77% in 2012-13 to
34.91% in 2014-15. The chart below depicts the trends in the ratios of Total Reserves
and Free Reserves to Equity Capital for the telecom (access service) sector:
Chart 3.1
1.53
1.01
1.25
-0.28 -0.36
-0.27 -0.50
0.00
0.50
1.00
1.50
2.00
2012-13 2013-14 2014-15
(in
tim
es)
Trends in ratio of Total Reserves and Free Reserves
(General Reserve and Profit & Loss Account) to Equity Share Capital
Ratio of Total Reserves to Equity Capital
Ratio of Free Reserves to Equity Capital
16
CHAPTER – 4
4. FINANCING PATTERN
Capital structure represents the funding of a business entity and comprises funds raised
through equity and preference shares, bonds, debentures, term loans from
banks/financial institutions etc.
The decision regarding right combination of capital mix (combination of debt and
equity) is of critical importance because of its impact on profitability and solvency. An
ideal capital structure of a company would be which maximizes the shareholder’s wealth
and promote business growth of the entity.
Debt repayment capacity plays a crucial role while taking a decision on the mix for
capital structure. Company should have the ability to generate sufficient income to have
enough cash to pay the creditors towards fixed charges (Interest) and principal
repayment. The excessive dependence on debt threatens the solvency of the company.
If the company opts for more debt, it may trigger off a high interest burden, devouring
profits and depressing earnings per share and this could endanger the survival of the
company.
4.1 REQUIREMENT FOR DEBT
To ensure regular cash flows for operations, expansion of network, introduction of new
technologies and services and acquisition and retention of customers, infusion of funds
is required particularly when the business operations are not able to generate sufficient
cash/funds due to low profitability, sluggish growth or intense competition. Investments
in telecom have a long gestation period. When a new telecom business is started, funds
are blocked for a long time without significant returns being earned on such funds. In
the early stages, therefore, equity could be a better option for financing the business
entity in the telecom sector. On the other hand, there are some strategic advantages by
funding through debt over funding by equity. It has been a common practice that to
meet the requirement for additional funds for expansion, companies generally rely on
long term loans / debts rather than own funds / equity.
4.2 STRATEGIC ADVANTAGES OF FUNDING THROUGH DEBT OVER EQUITY2
Financing through loan / debt can be in the form of short-term loans or long-term loans.
The lender is paid interest on the debt / loan funds as an opportunity cost. When the
cost of debt procurement is less than the average rate of return (IRR) of the company,
2 Equity refers to sum of Equity share capital, Preference share capital and Reserves & Surplus
17
it is beneficial to have funds in the form of debt. In such cases the share of debt in the
capital structure of the company goes up, the Weighted Average Cost of Capital (WACC)
of the company declines.
When a company procures additional debt in the form of loans, bonds or preferred
stock for acquisition of assets (tangible and /or intangible assets) on which it expects to
earn a return higher than the interest cost payable on such debt, its shareholders earn a
higher return on their capital. If on the other hand, the company earns lesser return on
such acquired assets than the cost of procurement of debt, shareholders get a lesser
return or no return.
Funding though debt is also advantageous because interest charges paid for debts
service are deductible expenses to determine taxable profits. Therefore, tax benefit on
payment of interest on debts is an incentive for procuring funds through debt e.g. if
interest charges are 8.50% and the corporate tax rate is 33.99% (including 10%
surcharge), the effective interest rate will be 5.61% i.e. {8.5% *(1-33.99%)}.
However, when the indebtedness of the company increases, the credit rating of such
company in the financial market could be downgraded and consequently, the cost of
procurement of debt (interest charges) will go up due to increase in risk for investors of
such company.
4.3 SOURCES OF DEBT
The sources of debt financing for a company are short- term loans and long- term
loans. Debt funding can be done through:
(i) Loans from the Indian banks and financial institutions,
(ii) Loans from the foreign banks and foreign financial institutions,
(iii) Inter-corporate loans
(iv) Deposits from Public
(v) Loans in the form of vendor credits
The debt position of the 24 private telecom access service providers for the years
2012-13 to 2014-15 is given in Table 4.1.
18
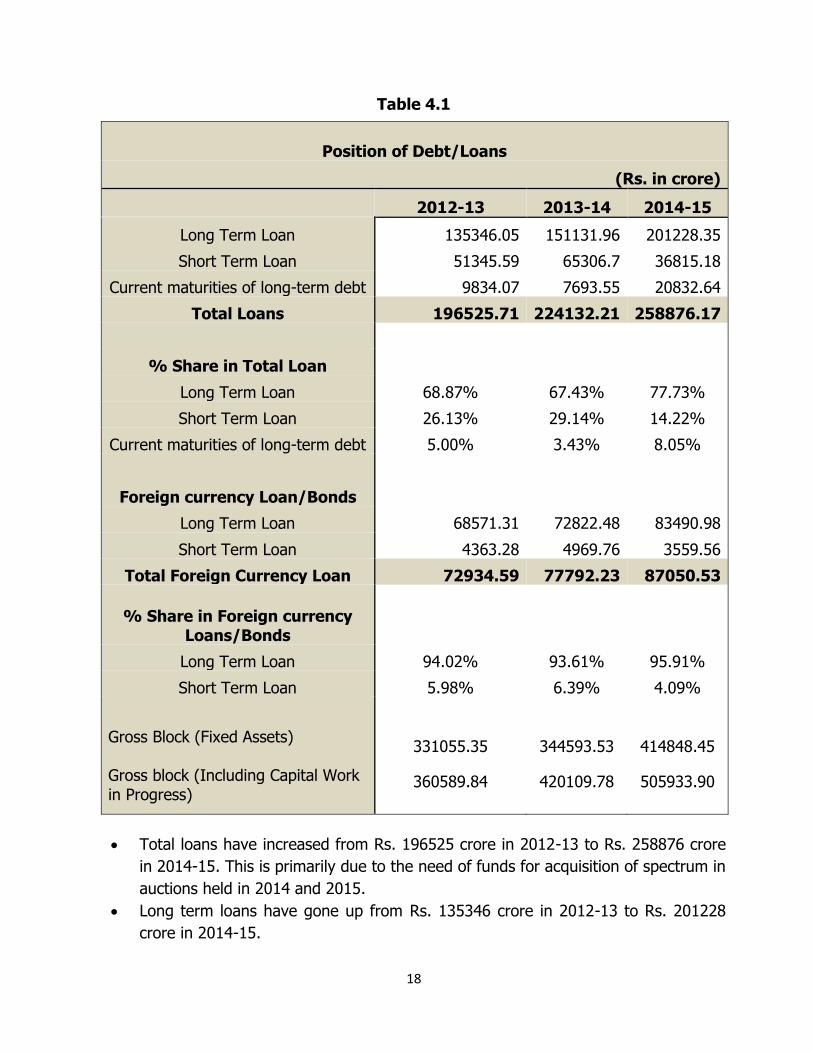
Table 4.1
Position of Debt/Loans
(Rs. in crore)
2012-13 2013-14 2014-15
Long Term Loan 135346.05 151131.96 201228.35
Short Term Loan 51345.59 65306.7 36815.18
Current maturities of long-term debt 9834.07 7693.55 20832.64
Total Loans 196525.71 224132.21 258876.17
% Share in Total Loan
Long Term Loan 68.87% 67.43% 77.73%
Short Term Loan 26.13% 29.14% 14.22%
Current maturities of long-term debt 5.00% 3.43% 8.05%
Foreign currency Loan/Bonds
Long Term Loan 68571.31 72822.48 83490.98
Short Term Loan 4363.28 4969.76 3559.56
Total Foreign Currency Loan 72934.59 77792.23 87050.53
% Share in Foreign currency Loans/Bonds
Long Term Loan 94.02% 93.61% 95.91%
Short Term Loan 5.98% 6.39% 4.09%
Gross Block (Fixed Assets)
Gross block (Including Capital Work in Progress)
331055.35
360589.84
344593.53
420109.78
414848.45
505933.90
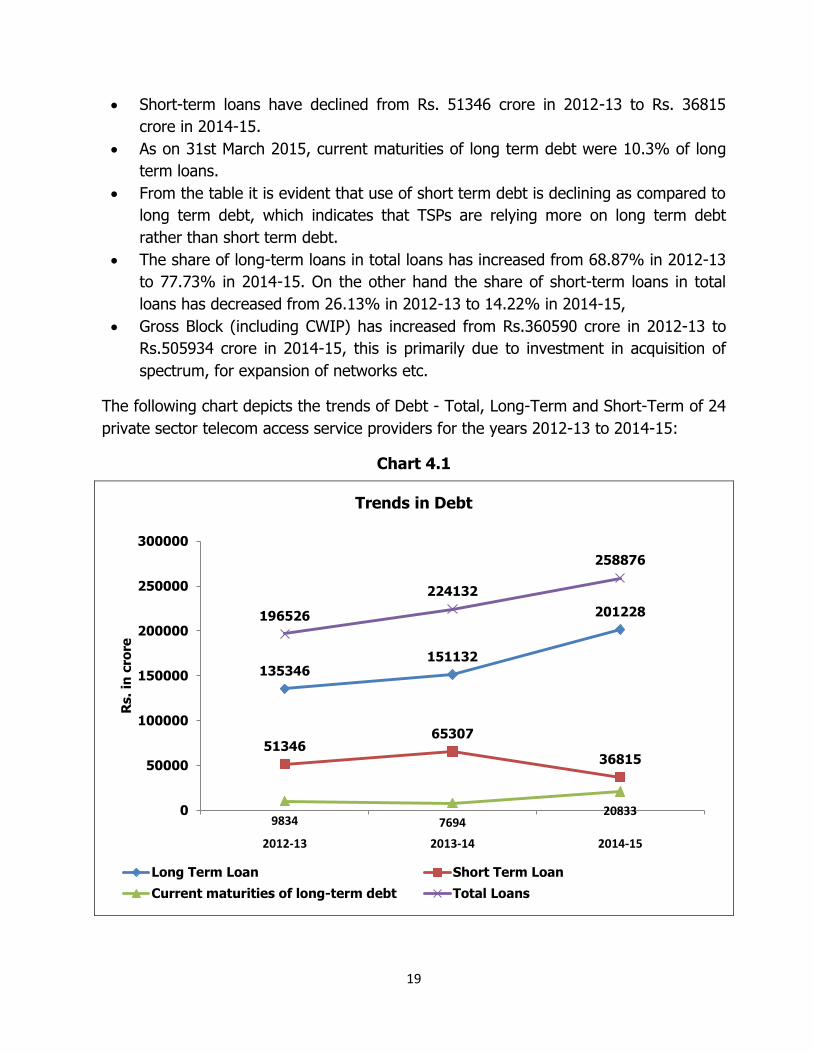
Total loans have increased from Rs. 196525 crore in 2012-13 to Rs. 258876 crore
in 2014-15. This is primarily due to the need of funds for acquisition of spectrum in
auctions held in 2014 and 2015.
Long term loans have gone up from Rs. 135346 crore in 2012-13 to Rs. 201228
crore in 2014-15.
19
Short-term loans have declined from Rs. 51346 crore in 2012-13 to Rs. 36815
crore in 2014-15.
As on 31st March 2015, current maturities of long term debt were 10.3% of long
term loans.
From the table it is evident that use of short term debt is declining as compared to
long term debt, which indicates that TSPs are relying more on long term debt
rather than short term debt.
The share of long-term loans in total loans has increased from 68.87% in 2012-13
to 77.73% in 2014-15. On the other hand the share of short-term loans in total
loans has decreased from 26.13% in 2012-13 to 14.22% in 2014-15,
Gross Block (including CWIP) has increased from Rs.360590 crore in 2012-13 to
Rs.505934 crore in 2014-15, this is primarily due to investment in acquisition of
spectrum, for expansion of networks etc.
The following chart depicts the trends of Debt - Total, Long-Term and Short-Term of 24
private sector telecom access service providers for the years 2012-13 to 2014-15:
Chart 4.1
135346 151132
201228
51346 65307
36815
9834 7694 20833
196526
224132
258876
0
50000
100000
150000
200000
250000
300000
2012-13 2013-14 2014-15
Rs.
in c
rore
Trends in Debt
Long Term Loan Short Term Loan
Current maturities of long-term debt Total Loans
20
4.4 FOREIGN CURRENCY LOANS
The quantum of foreign currency loan has gone up from Rs. 72934.59 crore in
2012-13 to Rs. 87050.53 crore in 2014-15 as evident from Table 4.1 above.
Long term foreign currency loan has gone up from Rs. 68571.31 crore in 2012-13 to
Rs.83490.98 crore in 2014-15 which constitutes 96% share of total foreign currency
loans.
As on 31st March 2015, Reliance Communications (Rs. 19737 crore), Aircel (Rs. 20171
crore), Vodafone (Rs. 13615 crore) and Reliance Jio (Rs. 9694 crore) have the major
share (jointly 73%) in outstanding foreign currency loans/bonds.
4.5 CAPITAL STRUCTURE
Capital structure consists of total long term investment in a business entity. It includes
funds raised through equity and preference shares, bonds, debentures, term loans from
financial institutions etc. Thus, capital structure is the mixture of different sources of
funds that the company uses.
The capital structure (combination of debt and equity) of a company needs to be
determined within the debt capacity of the company i.e. its ability to generate income to
have enough cash to pay its liability towards fixed charges (interest) and principal.
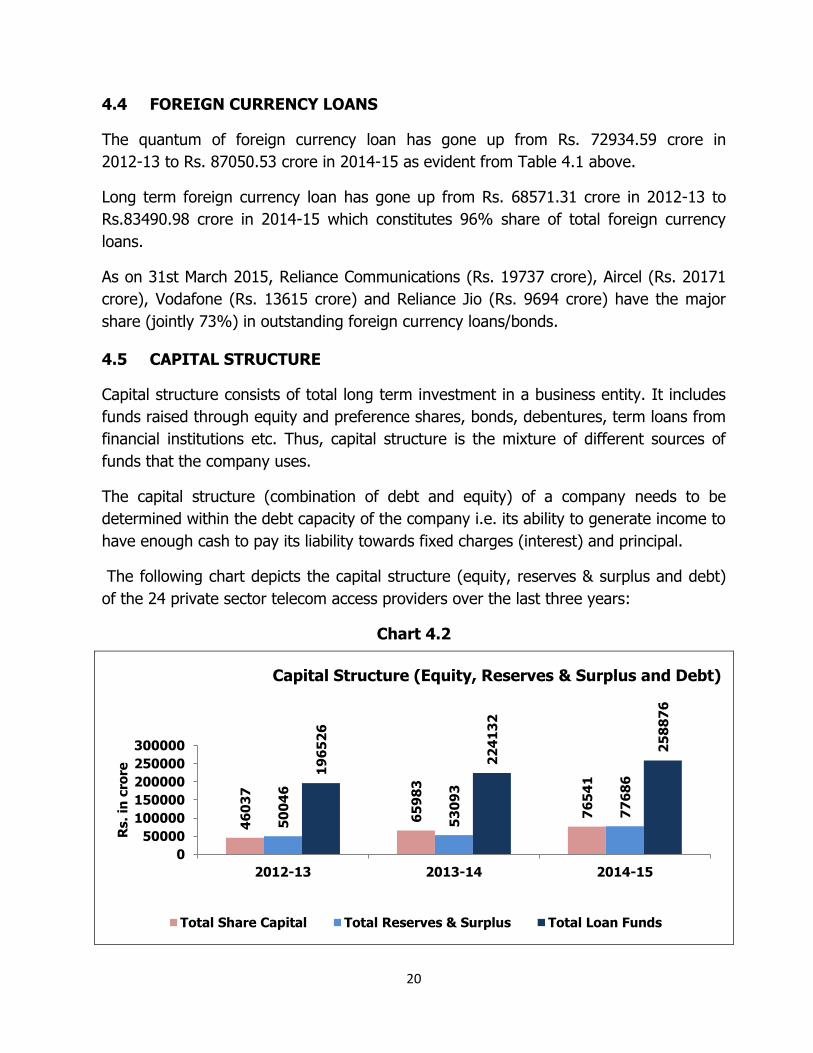
The following chart depicts the capital structure (equity, reserves & surplus and debt)
of the 24 private sector telecom access providers over the last three years:
Chart 4.2
46
03
7
65
98
3
76
54
1
50
04
6
53
09
3
77
68
6 1
96
52
6
22
41
32
25
88
76
0
50000
100000
150000
200000
250000
300000
2012-13 2013-14 2014-15
Rs.
in c
rore
Capital Structure (Equity, Reserves & Surplus and Debt)
Total Share Capital Total Reserves & Surplus Total Loan Funds
21
Shareholder’s funds (i.e. share capital + reserves and surplus) has increased form
Rs.96083 crore in 2012-13 to Rs.154226 crore in 2014-15 and showing a growth of
61%. On the other debt has increased by Rs. 62350 crore during the same period, a
increase of 32%. It indicates that companies are deploying more of their own funds
rather than financing through debt.
4.6 DEBT-EQUITY RATIO
The relationship between borrowed funds and owner’s capital (equity) is a commonly
used measure of the long-term financial solvency of a company. This relationship is
depicted by the debt-equity ratio. This ratio measures the relative claims of outsiders
and owners against the company’s assets. It indicates the relationship between the
external equities (or) outsider’s funds and the internal equities (or) the share holders’
funds. Lower values of debt-to-equity ratio are favourable indicating less risk. Higher
debt-to-equity ratio is unfavourable because it means that the business relies more on
external borrowings and thus it is at a higher risk, especially at higher interest rates.
The debt-equity ratio based on the financial data of 24 private telecom access service
companies during the last three years are given below:
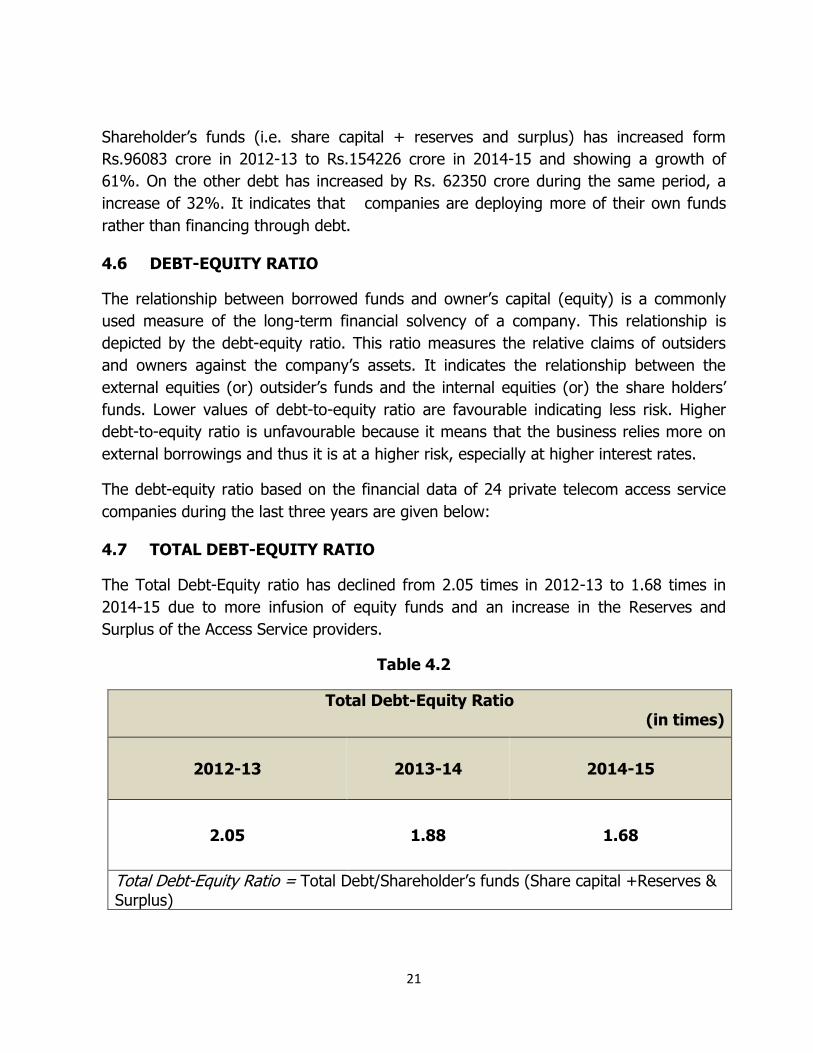
4.7 TOTAL DEBT-EQUITY RATIO
The Total Debt-Equity ratio has declined from 2.05 times in 2012-13 to 1.68 times in
2014-15 due to more infusion of equity funds and an increase in the Reserves and
Surplus of the Access Service providers.
Table 4.2
Total Debt-Equity Ratio (in times)
2012-13 2013-14 2014-15
2.05 1.88 1.68
Total Debt-Equity Ratio = Total Debt/Shareholder’s funds (Share capital +Reserves & Surplus)
22
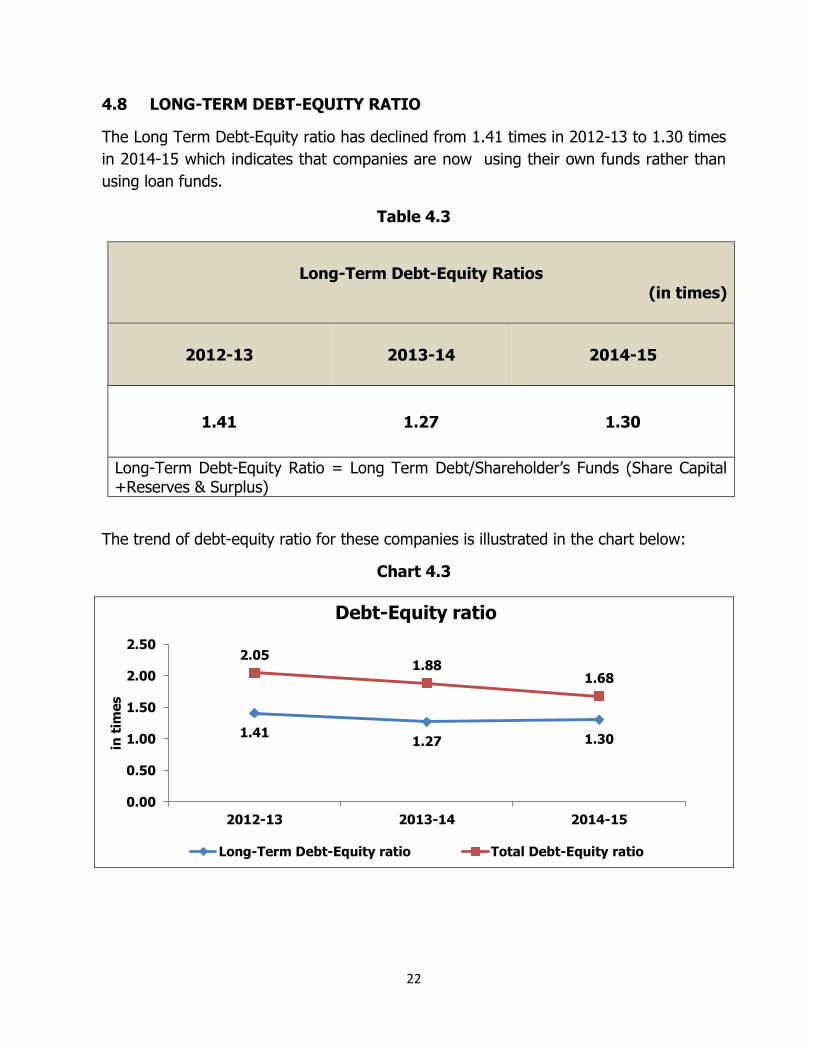
4.8 LONG-TERM DEBT-EQUITY RATIO
The Long Term Debt-Equity ratio has declined from 1.41 times in 2012-13 to 1.30 times
in 2014-15 which indicates that companies are now using their own funds rather than
using loan funds.
Table 4.3
Long-Term Debt-Equity Ratios (in times)
2012-13 2013-14 2014-15
1.41 1.27 1.30
Long-Term Debt-Equity Ratio = Long Term Debt/Shareholder’s Funds (Share Capital +Reserves & Surplus)
The trend of debt-equity ratio for these companies is illustrated in the chart below:
Chart 4.3
1.41 1.27 1.30
2.05 1.88
1.68
0.00
0.50
1.00
1.50
2.00
2.50
2012-13 2013-14 2014-15
in t
ime
s
Debt-Equity ratio
Long-Term Debt-Equity ratio Total Debt-Equity ratio
23
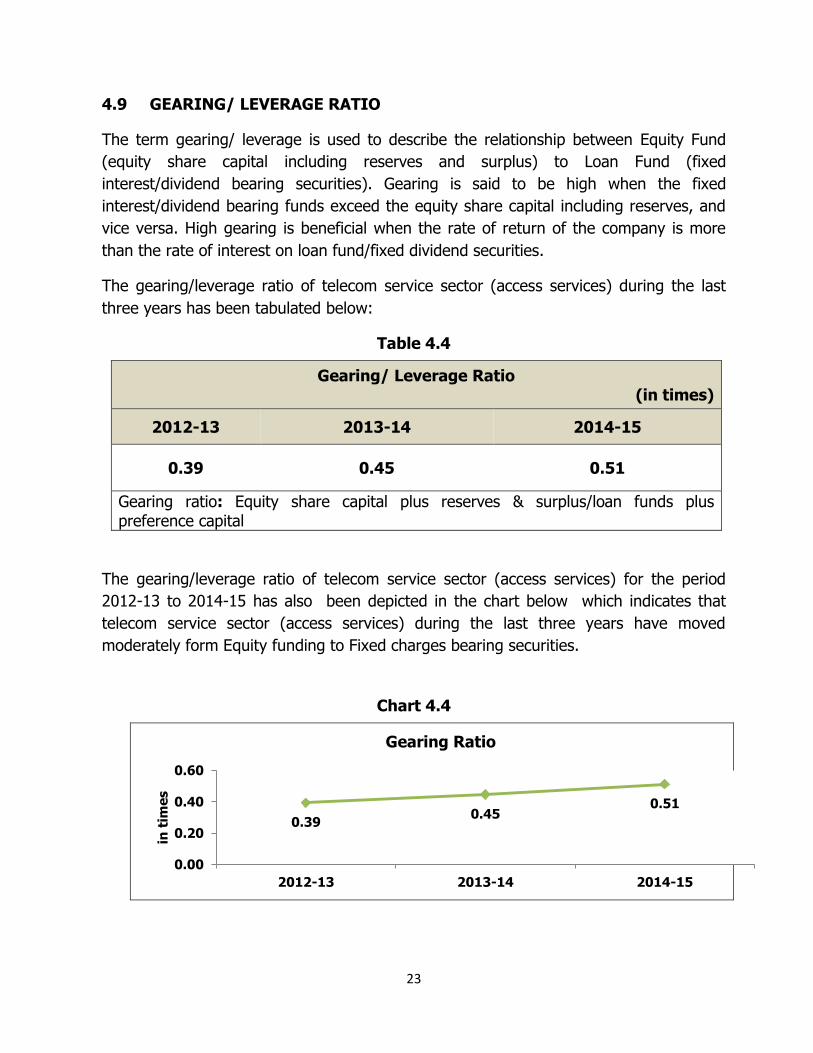
4.9 GEARING/ LEVERAGE RATIO
The term gearing/ leverage is used to describe the relationship between Equity Fund
(equity share capital including reserves and surplus) to Loan Fund (fixed
interest/dividend bearing securities). Gearing is said to be high when the fixed
interest/dividend bearing funds exceed the equity share capital including reserves, and
vice versa. High gearing is beneficial when the rate of return of the company is more
than the rate of interest on loan fund/fixed dividend securities.
The gearing/leverage ratio of telecom service sector (access services) during the last
three years has been tabulated below:
Table 4.4
Gearing/ Leverage Ratio (in times)
2012-13 2013-14 2014-15
0.39 0.45 0.51
Gearing ratio: Equity share capital plus reserves & surplus/loan funds plus preference capital
The gearing/leverage ratio of telecom service sector (access services) for the period
2012-13 to 2014-15 has also been depicted in the chart below which indicates that
telecom service sector (access services) during the last three years have moved
moderately form Equity funding to Fixed charges bearing securities.
Chart 4.4
0.39 0.45
0.51
0.00
0.20
0.40
0.60
2012-13 2013-14 2014-15
in t
ime
s
Gearing Ratio
24
CHAPTER – 5
5 DEBT COVERAGE/FINANCING CHARGES
A company generally raises debt from various sources and the debt may be in the form
of debentures or loans borrowed from financial or public institutions or banks for a
certain period of time at a specific rate of interest. Debt coverage ratio indicates the
capacity of the company to repay the principal as well as interest charges on the debt
so raised by the company.
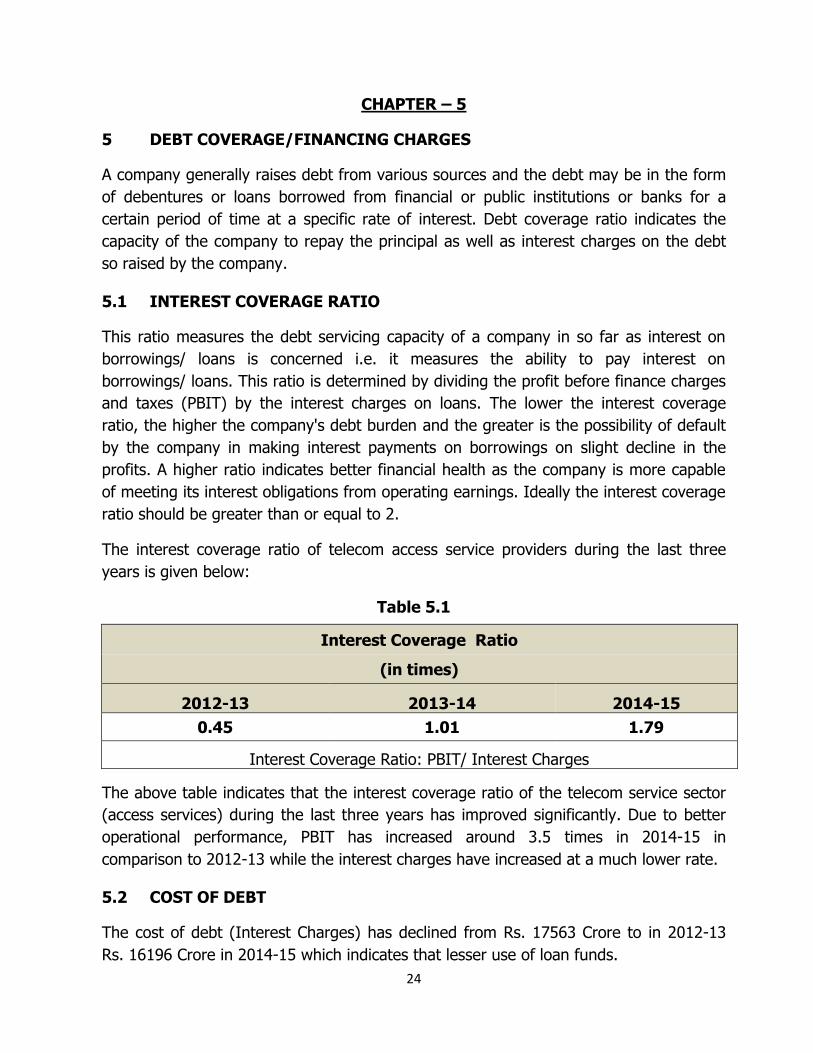
5.1 INTEREST COVERAGE RATIO
This ratio measures the debt servicing capacity of a company in so far as interest on
borrowings/ loans is concerned i.e. it measures the ability to pay interest on
borrowings/ loans. This ratio is determined by dividing the profit before finance charges
and taxes (PBIT) by the interest charges on loans. The lower the interest coverage
ratio, the higher the company's debt burden and the greater is the possibility of default
by the company in making interest payments on borrowings on slight decline in the
profits. A higher ratio indicates better financial health as the company is more capable
of meeting its interest obligations from operating earnings. Ideally the interest coverage
ratio should be greater than or equal to 2.
The interest coverage ratio of telecom access service providers during the last three
years is given below:
Table 5.1
Interest Coverage Ratio
(in times)
2012-13 2013-14 2014-15
0.45 1.01 1.79
Interest Coverage Ratio: PBIT/ Interest Charges
The above table indicates that the interest coverage ratio of the telecom service sector
(access services) during the last three years has improved significantly. Due to better
operational performance, PBIT has increased around 3.5 times in 2014-15 in
comparison to 2012-13 while the interest charges have increased at a much lower rate.
5.2 COST OF DEBT
The cost of debt (Interest Charges) has declined from Rs. 17563 Crore to in 2012-13
Rs. 16196 Crore in 2014-15 which indicates that lesser use of loan funds.
25
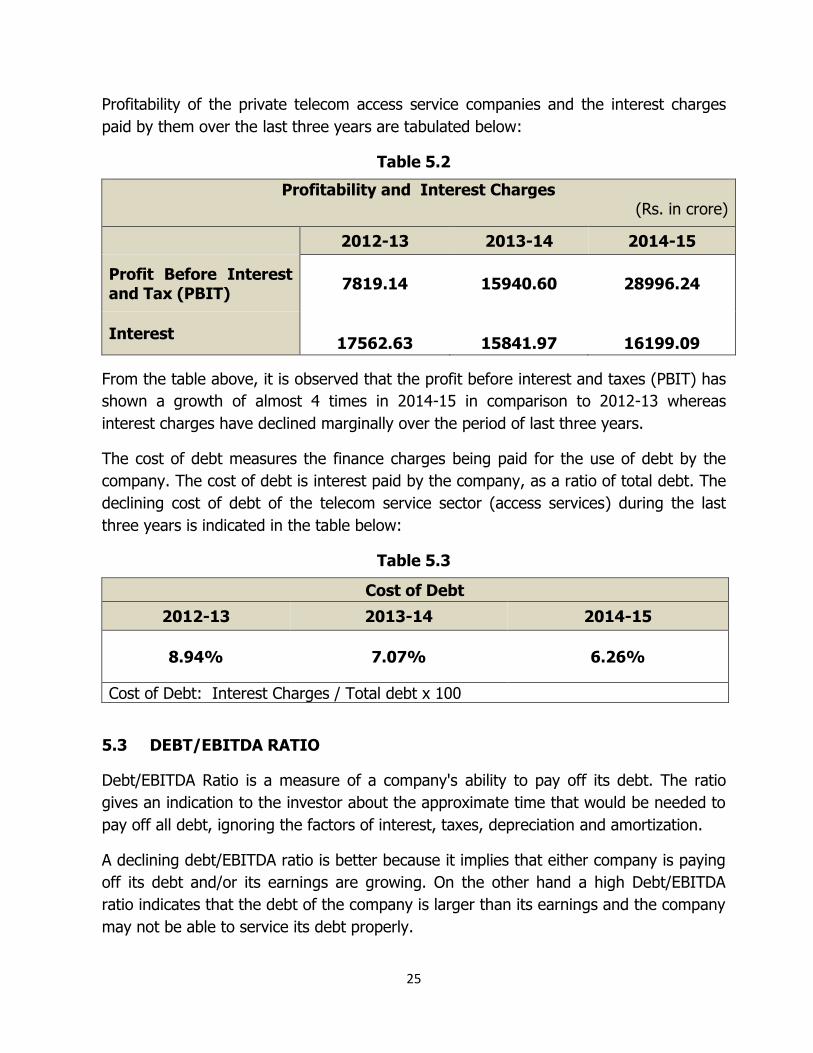
Profitability of the private telecom access service companies and the interest charges
paid by them over the last three years are tabulated below:
Table 5.2
Profitability and Interest Charges (Rs. in crore)
2012-13 2013-14 2014-15
Profit Before Interest and Tax (PBIT)
7819.14 15940.60 28996.24
Interest
17562.63
15841.97
16199.09
From the table above, it is observed that the profit before interest and taxes (PBIT) has
shown a growth of almost 4 times in 2014-15 in comparison to 2012-13 whereas
interest charges have declined marginally over the period of last three years.
The cost of debt measures the finance charges being paid for the use of debt by the
company. The cost of debt is interest paid by the company, as a ratio of total debt. The
declining cost of debt of the telecom service sector (access services) during the last
three years is indicated in the table below:
Table 5.3
Cost of Debt
2012-13 2013-14 2014-15
8.94% 7.07% 6.26%
Cost of Debt: Interest Charges / Total debt x 100
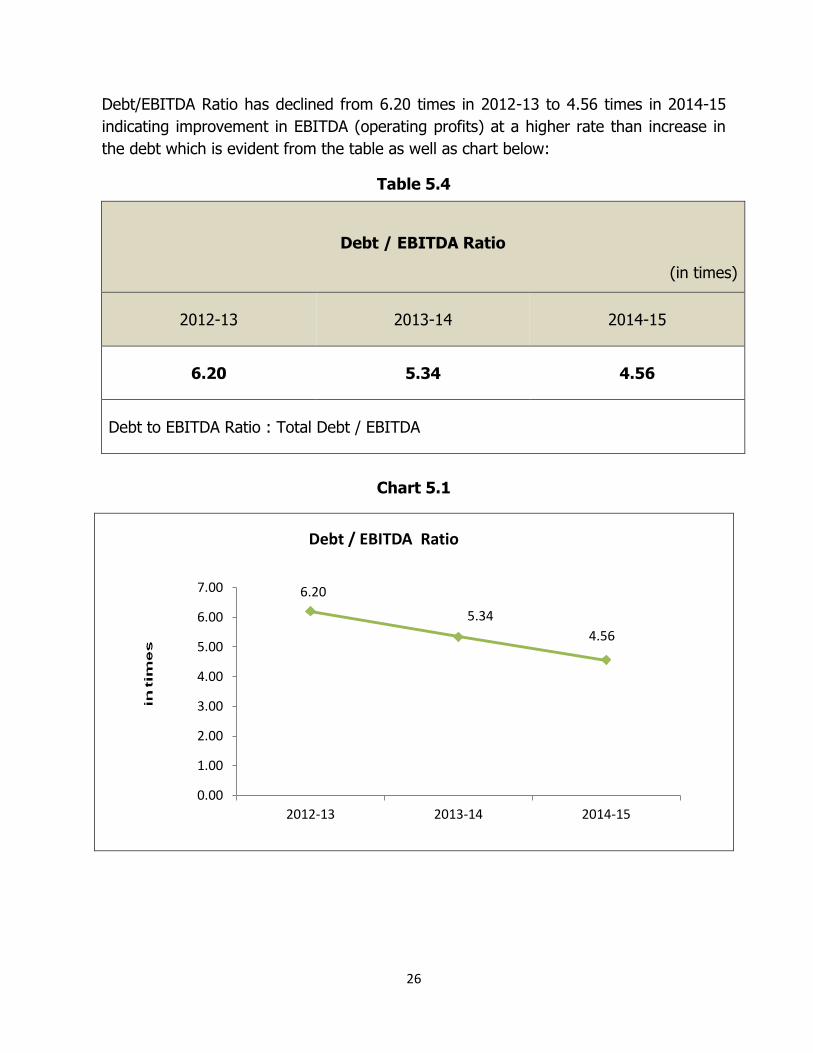
5.3 DEBT/EBITDA RATIO
Debt/EBITDA Ratio is a measure of a company's ability to pay off its debt. The ratio
gives an indication to the investor about the approximate time that would be needed to
pay off all debt, ignoring the factors of interest, taxes, depreciation and amortization.
A declining debt/EBITDA ratio is better because it implies that either company is paying
off its debt and/or its earnings are growing. On the other hand a high Debt/EBITDA
ratio indicates that the debt of the company is larger than its earnings and the company
may not be able to service its debt properly.
26
Debt/EBITDA Ratio has declined from 6.20 times in 2012-13 to 4.56 times in 2014-15
indicating improvement in EBITDA (operating profits) at a higher rate than increase in
the debt which is evident from the table as well as chart below:
Table 5.4
Debt / EBITDA Ratio
(in times)
2012-13 2013-14 2014-15
6.20 5.34 4.56
Debt to EBITDA Ratio : Total Debt / EBITDA
Chart 5.1
6.20
5.34
4.56
0.00
1.00
2.00
3.00
4.00
5.00
6.00
7.00
2012-13 2013-14 2014-15
Debt / EBITDA Ratio
27
CHAPTER – 6
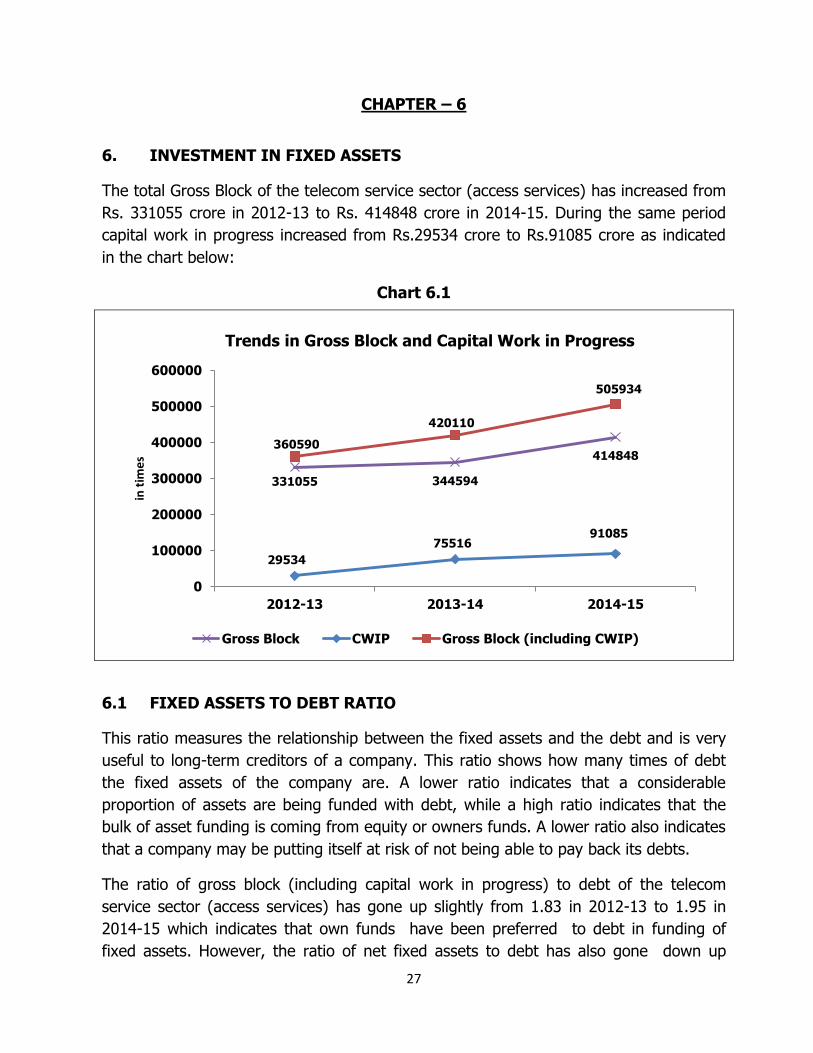
6. INVESTMENT IN FIXED ASSETS
The total Gross Block of the telecom service sector (access services) has increased from
Rs. 331055 crore in 2012-13 to Rs. 414848 crore in 2014-15. During the same period
capital work in progress increased from Rs.29534 crore to Rs.91085 crore as indicated
in the chart below:
Chart 6.1
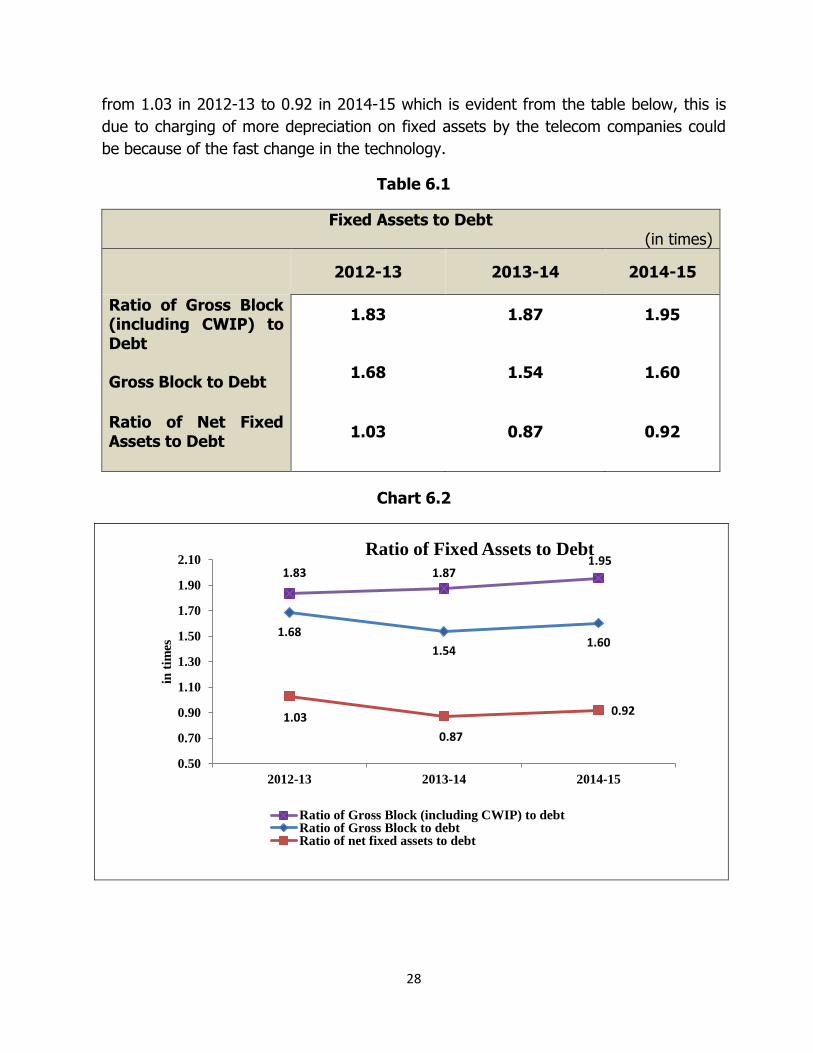
6.1 FIXED ASSETS TO DEBT RATIO
This ratio measures the relationship between the fixed assets and the debt and is very
useful to long-term creditors of a company. This ratio shows how many times of debt
the fixed assets of the company are. A lower ratio indicates that a considerable
proportion of assets are being funded with debt, while a high ratio indicates that the
bulk of asset funding is coming from equity or owners funds. A lower ratio also indicates
that a company may be putting itself at risk of not being able to pay back its debts.
The ratio of gross block (including capital work in progress) to debt of the telecom
service sector (access services) has gone up slightly from 1.83 in 2012-13 to 1.95 in
2014-15 which indicates that own funds have been preferred to debt in funding of
fixed assets. However, the ratio of net fixed assets to debt has also gone down up
331055 344594
414848
29534
75516 91085
360590
420110
505934
0
100000
200000
300000
400000
500000
600000
2012-13 2013-14 2014-15
in t
ime
s
Trends in Gross Block and Capital Work in Progress
Gross Block CWIP Gross Block (including CWIP)
28
from 1.03 in 2012-13 to 0.92 in 2014-15 which is evident from the table below, this is
due to charging of more depreciation on fixed assets by the telecom companies could
be because of the fast change in the technology.
Table 6.1
Fixed Assets to Debt (in times)
2012-13 2013-14 2014-15
Ratio of Gross Block (including CWIP) to Debt
Gross Block to Debt
1.83
1.68
1.87
1.54
1.95
1.60
Ratio of Net Fixed Assets to Debt
1.03 0.87 0.92
Chart 6.2
1.83 1.87 1.95
1.68
1.54 1.60
1.03
0.87
0.92
0.50
0.70
0.90
1.10
1.30
1.50
1.70
1.90
2.10
2012-13 2013-14 2014-15
in t
imes
Ratio of Fixed Assets to Debt
Ratio of Gross Block (including CWIP) to debtRatio of Gross Block to debtRatio of net fixed assets to debt
29
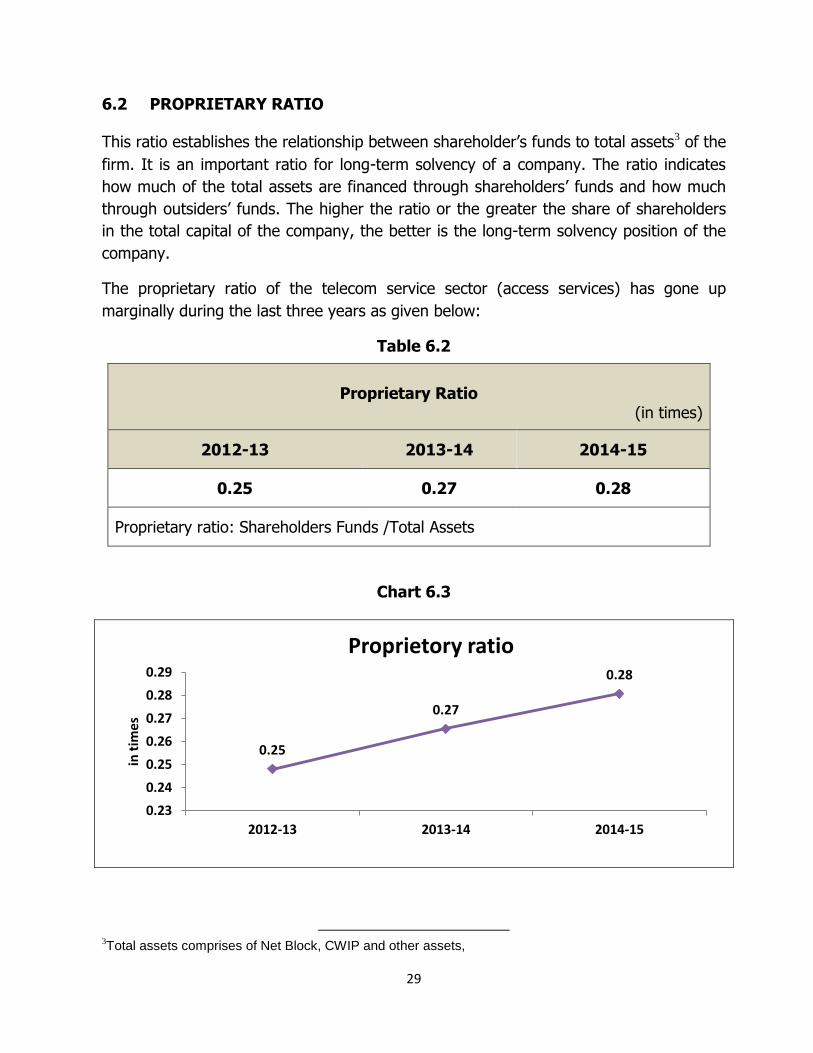
6.2 PROPRIETARY RATIO
This ratio establishes the relationship between shareholder’s funds to total assets3 of the
firm. It is an important ratio for long-term solvency of a company. The ratio indicates
how much of the total assets are financed through shareholders’ funds and how much
through outsiders’ funds. The higher the ratio or the greater the share of shareholders
in the total capital of the company, the better is the long-term solvency position of the
company.
The proprietary ratio of the telecom service sector (access services) has gone up
marginally during the last three years as given below:
Table 6.2
Proprietary Ratio
(in times)
2012-13 2013-14 2014-15
0.25 0.27 0.28
Proprietary ratio: Shareholders Funds /Total Assets
Chart 6.3
3Total assets comprises of Net Block, CWIP and other assets,
0.25
0.27
0.28
0.23
0.24
0.25
0.26
0.27
0.28
0.29
2012-13 2013-14 2014-15
in t
ime
s
Proprietory ratio
30
CHAPTER – 7
7. CAPITAL STRUCTURE & PROFITABILITY OF 5 MAJOR TELECOM ACCESS
SERVICE PROVIDERS
The capital structure, debt-equity ratio, capital gearing and profitability profile of 5
major private telecom access service companies for 3 years ended March 2015 have
been discussed in the following sections.
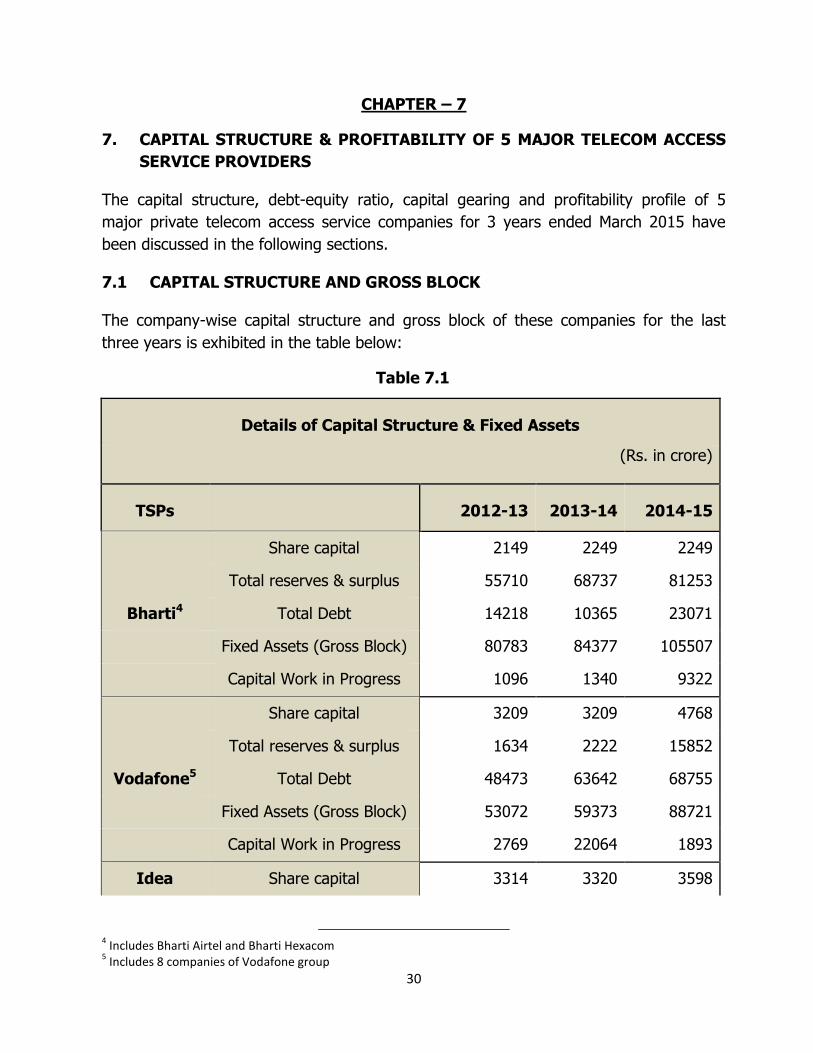
7.1 CAPITAL STRUCTURE AND GROSS BLOCK
The company-wise capital structure and gross block of these companies for the last
three years is exhibited in the table below:
Table 7.1
Details of Capital Structure & Fixed Assets
(Rs. in crore)
TSPs
2012-13 2013-14 2014-15
Bharti4
Share capital 2149 2249 2249
Total reserves & surplus 55710 68737 81253
Total Debt 14218 10365 23071
Fixed Assets (Gross Block) 80783 84377 105507
Capital Work in Progress 1096 1340 9322
Vodafone5
Share capital 3209 3209 4768
Total reserves & surplus 1634 2222 15852
Total Debt 48473 63642 68755
Fixed Assets (Gross Block) 53072 59373 88721
Capital Work in Progress 2769 22064 1893
Idea Share capital 3314 3320 3598
4 Includes Bharti Airtel and Bharti Hexacom
5 Includes 8 companies of Vodafone group
31
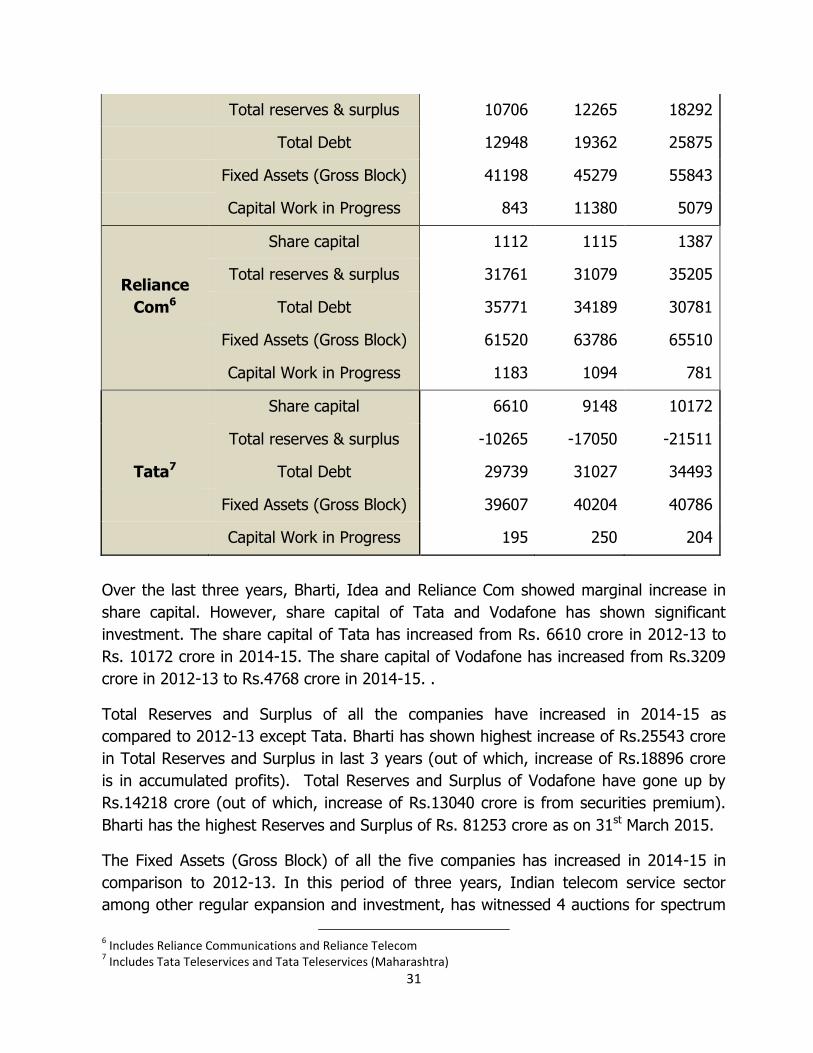
Total reserves & surplus 10706 12265 18292
Total Debt 12948 19362 25875
Fixed Assets (Gross Block) 41198 45279 55843
Capital Work in Progress 843 11380 5079
Reliance
Com6
Share capital 1112 1115 1387
Total reserves & surplus 31761 31079 35205
Total Debt 35771 34189 30781
Fixed Assets (Gross Block) 61520 63786 65510
Capital Work in Progress 1183 1094 781
Tata7
Share capital 6610 9148 10172
Total reserves & surplus -10265 -17050 -21511
Total Debt 29739 31027 34493
Fixed Assets (Gross Block) 39607 40204 40786
Capital Work in Progress 195 250 204
Over the last three years, Bharti, Idea and Reliance Com showed marginal increase in
share capital. However, share capital of Tata and Vodafone has shown significant
investment. The share capital of Tata has increased from Rs. 6610 crore in 2012-13 to
Rs. 10172 crore in 2014-15. The share capital of Vodafone has increased from Rs.3209
crore in 2012-13 to Rs.4768 crore in 2014-15. .
Total Reserves and Surplus of all the companies have increased in 2014-15 as
compared to 2012-13 except Tata. Bharti has shown highest increase of Rs.25543 crore
in Total Reserves and Surplus in last 3 years (out of which, increase of Rs.18896 crore
is in accumulated profits). Total Reserves and Surplus of Vodafone have gone up by
Rs.14218 crore (out of which, increase of Rs.13040 crore is from securities premium).
Bharti has the highest Reserves and Surplus of Rs. 81253 crore as on 31st March 2015.
The Fixed Assets (Gross Block) of all the five companies has increased in 2014-15 in
comparison to 2012-13. In this period of three years, Indian telecom service sector
among other regular expansion and investment, has witnessed 4 auctions for spectrum
6 Includes Reliance Communications and Reliance Telecom
7 Includes Tata Teleservices and Tata Teleservices (Maharashtra)
32
(one each in 2012, 2013, 2014 and 2015), momentum in roll-out for 4G/LTE services,
change in technology (i.e. gradual shifting to IP based network).
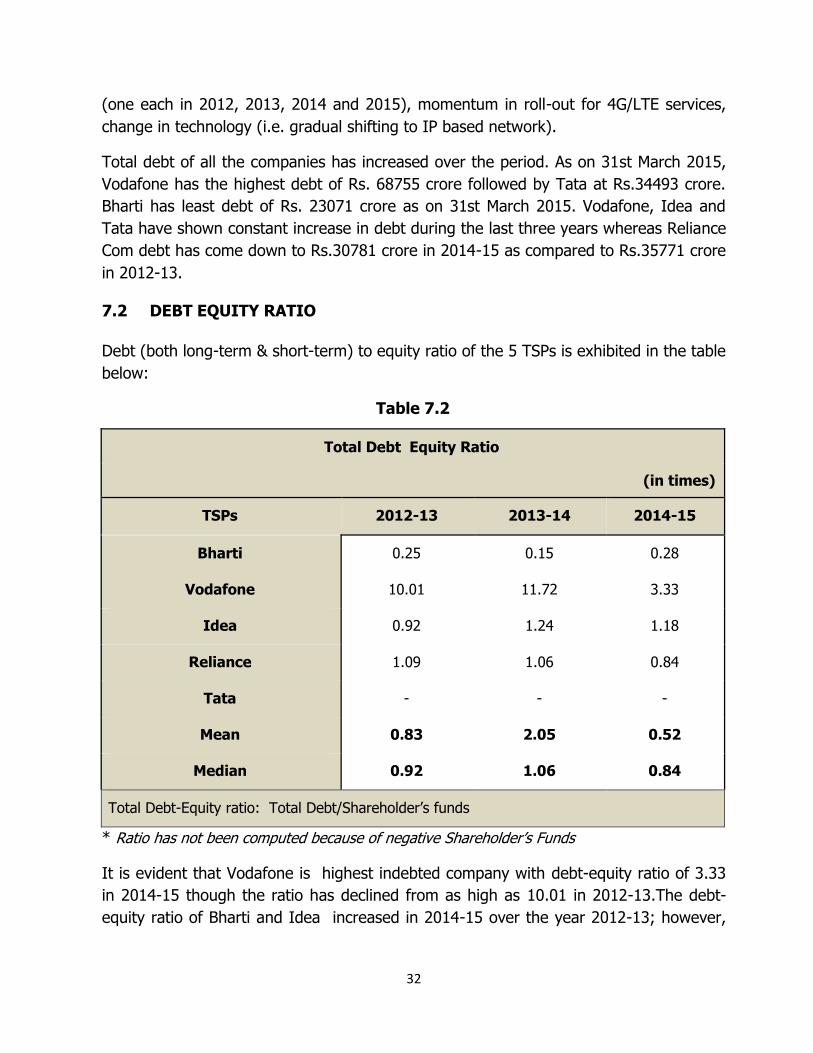
Total debt of all the companies has increased over the period. As on 31st March 2015,
Vodafone has the highest debt of Rs. 68755 crore followed by Tata at Rs.34493 crore.
Bharti has least debt of Rs. 23071 crore as on 31st March 2015. Vodafone, Idea and
Tata have shown constant increase in debt during the last three years whereas Reliance
Com debt has come down to Rs.30781 crore in 2014-15 as compared to Rs.35771 crore
in 2012-13.
7.2 DEBT EQUITY RATIO
Debt (both long-term & short-term) to equity ratio of the 5 TSPs is exhibited in the table
below:
Table 7.2
Total Debt Equity Ratio
(in times)
TSPs 2012-13 2013-14 2014-15
Bharti 0.25 0.15 0.28
Vodafone 10.01 11.72 3.33
Idea 0.92 1.24 1.18
Reliance 1.09 1.06 0.84
Tata - - -
Mean 0.83 2.05 0.52
Median 0.92 1.06 0.84
Total Debt-Equity ratio: Total Debt/Shareholder’s funds
* Ratio has not been computed because of negative Shareholder’s Funds
It is evident that Vodafone is highest indebted company with debt-equity ratio of 3.33
in 2014-15 though the ratio has declined from as high as 10.01 in 2012-13.The debt-
equity ratio of Bharti and Idea increased in 2014-15 over the year 2012-13; however,
33
the mean and median value of debt equity ratio have declined in 2014-15 as compared
to 2012-13.
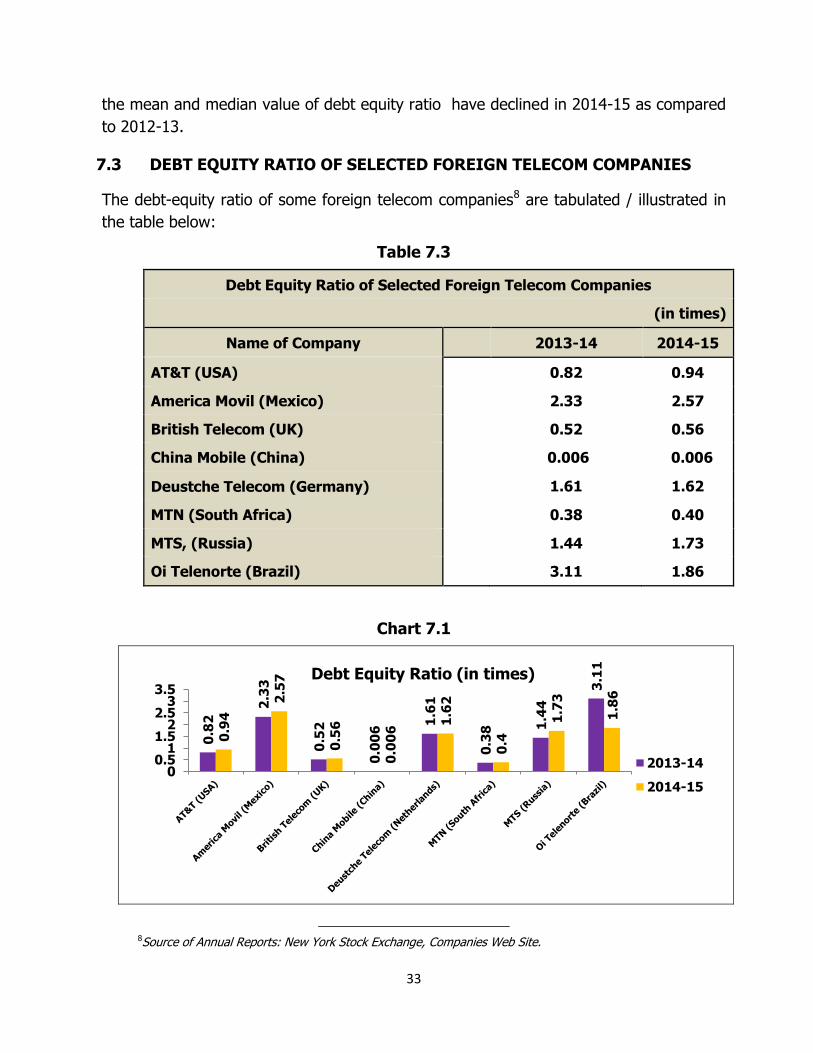
7.3 DEBT EQUITY RATIO OF SELECTED FOREIGN TELECOM COMPANIES
The debt-equity ratio of some foreign telecom companies8 are tabulated / illustrated in
the table below:
Table 7.3
Debt Equity Ratio of Selected Foreign Telecom Companies
(in times)
Name of Company
2013-14 2014-15
AT&T (USA)
0.82 0.94
America Movil (Mexico)
2.33 2.57
British Telecom (UK)
0.52 0.56
China Mobile (China)
0.006 0.006
Deustche Telecom (Germany)
1.61 1.62
MTN (South Africa)
0.38 0.40
MTS, (Russia)
1.44 1.73
Oi Telenorte (Brazil)
3.11 1.86
Chart 7.1
8Source of Annual Reports: New York Stock Exchange, Companies Web Site.
0.8
2 2
.33
0.5
2
0.0
06
1.6
1
0.3
8 1.4
4
3.1
1
0.9
4
2.5
7
0.5
6
0.0
06
1.6
2
0.4
1.7
3
1.8
6
00.5
11.5
22.5
33.5
2013-14
2014-15
Debt Equity Ratio (in times)
34
From the above data it is evident that there is no unexpected and rapid increase in the
debt-equity ratio of foreign telecom companies except Oi Telenorte, Brazil. In 2014-15,
debt-equity ratio of America Movil was highest followed by Oi Telenorte, Brazil. China
Mobile was having lowest debt-equity ratio which indicates that this company is least
indebted company among all above companies.
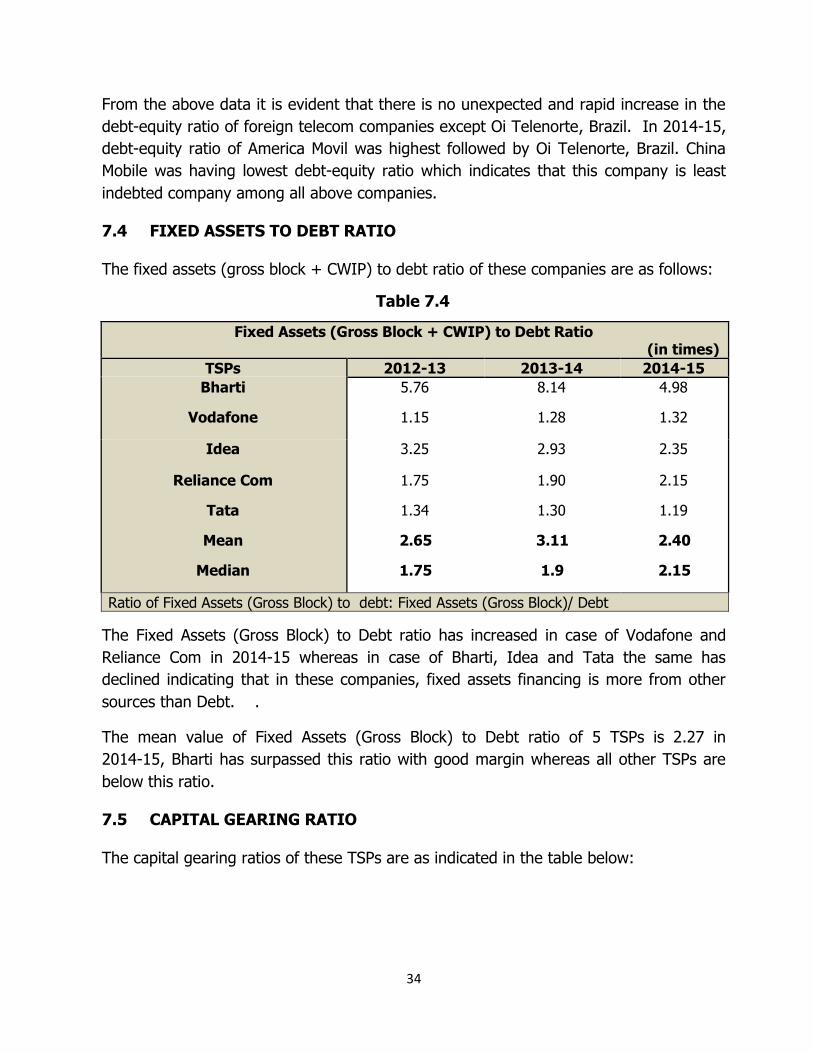
7.4 FIXED ASSETS TO DEBT RATIO
The fixed assets (gross block + CWIP) to debt ratio of these companies are as follows:
Table 7.4
Fixed Assets (Gross Block + CWIP) to Debt Ratio (in times)
TSPs 2012-13 2013-14 2014-15
Bharti 5.76 8.14 4.98
Vodafone 1.15 1.28 1.32
Idea 3.25 2.93 2.35
Reliance Com 1.75 1.90 2.15
Tata 1.34 1.30 1.19
Mean 2.65 3.11 2.40
Median 1.75 1.9 2.15
Ratio of Fixed Assets (Gross Block) to debt: Fixed Assets (Gross Block)/ Debt
The Fixed Assets (Gross Block) to Debt ratio has increased in case of Vodafone and
Reliance Com in 2014-15 whereas in case of Bharti, Idea and Tata the same has
declined indicating that in these companies, fixed assets financing is more from other
sources than Debt. .
The mean value of Fixed Assets (Gross Block) to Debt ratio of 5 TSPs is 2.27 in
2014-15, Bharti has surpassed this ratio with good margin whereas all other TSPs are
below this ratio.
7.5 CAPITAL GEARING RATIO
The capital gearing ratios of these TSPs are as indicated in the table below:
35
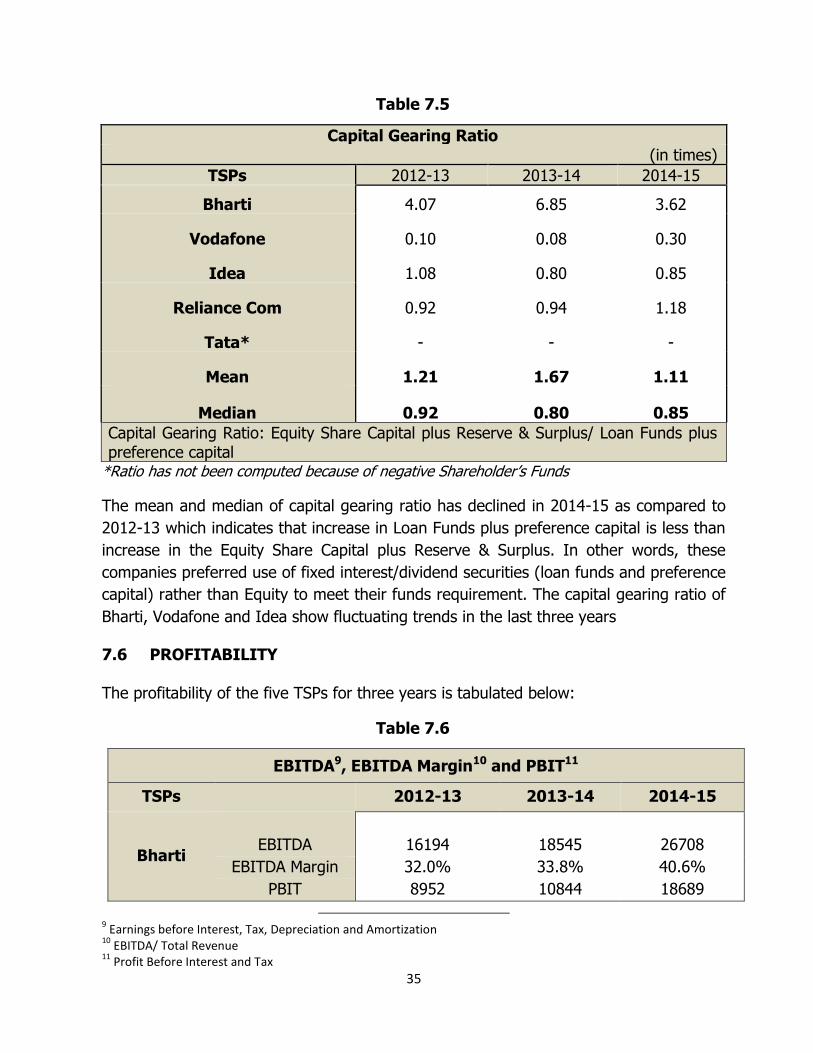
Table 7.5
Capital Gearing Ratio (in times)
TSPs 2012-13 2013-14 2014-15
Bharti 4.07 6.85 3.62
Vodafone 0.10 0.08 0.30
Idea 1.08 0.80 0.85
Reliance Com 0.92 0.94 1.18
Tata* - - -
Mean 1.21 1.67 1.11
Median 0.92 0.80 0.85
Capital Gearing Ratio: Equity Share Capital plus Reserve & Surplus/ Loan Funds plus preference capital
*Ratio has not been computed because of negative Shareholder’s Funds
The mean and median of capital gearing ratio has declined in 2014-15 as compared to
2012-13 which indicates that increase in Loan Funds plus preference capital is less than
increase in the Equity Share Capital plus Reserve & Surplus. In other words, these
companies preferred use of fixed interest/dividend securities (loan funds and preference
capital) rather than Equity to meet their funds requirement. The capital gearing ratio of
Bharti, Vodafone and Idea show fluctuating trends in the last three years
7.6 PROFITABILITY
The profitability of the five TSPs for three years is tabulated below:
Table 7.6
EBITDA9, EBITDA Margin10 and PBIT11
TSPs 2012-13 2013-14 2014-15
Bharti
EBITDA 16194 18545 26708
EBITDA Margin 32.0% 33.8% 40.6%
PBIT 8952 10844 18689
9 Earnings before Interest, Tax, Depreciation and Amortization
10 EBITDA/ Total Revenue
11 Profit Before Interest and Tax
36
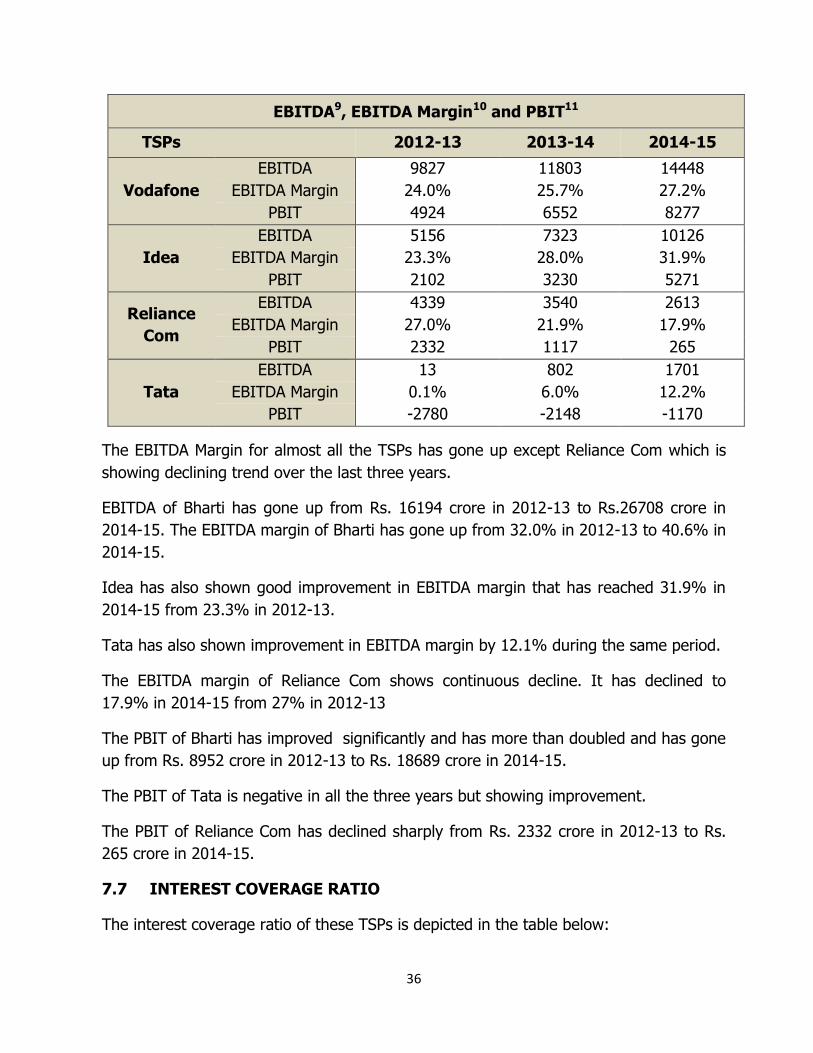
EBITDA9, EBITDA Margin10 and PBIT11
TSPs 2012-13 2013-14 2014-15
Vodafone
EBITDA 9827 11803 14448
EBITDA Margin 24.0% 25.7% 27.2%
PBIT 4924 6552 8277
Idea
EBITDA 5156 7323 10126
EBITDA Margin 23.3% 28.0% 31.9%
PBIT 2102 3230 5271
Reliance
Com
EBITDA 4339 3540 2613
EBITDA Margin 27.0% 21.9% 17.9%
PBIT 2332 1117 265
Tata
EBITDA 13 802 1701
EBITDA Margin 0.1% 6.0% 12.2%
PBIT -2780 -2148 -1170
The EBITDA Margin for almost all the TSPs has gone up except Reliance Com which is
showing declining trend over the last three years.
EBITDA of Bharti has gone up from Rs. 16194 crore in 2012-13 to Rs.26708 crore in
2014-15. The EBITDA margin of Bharti has gone up from 32.0% in 2012-13 to 40.6% in
2014-15.
Idea has also shown good improvement in EBITDA margin that has reached 31.9% in
2014-15 from 23.3% in 2012-13.
Tata has also shown improvement in EBITDA margin by 12.1% during the same period.
The EBITDA margin of Reliance Com shows continuous decline. It has declined to
17.9% in 2014-15 from 27% in 2012-13
The PBIT of Bharti has improved significantly and has more than doubled and has gone
up from Rs. 8952 crore in 2012-13 to Rs. 18689 crore in 2014-15.
The PBIT of Tata is negative in all the three years but showing improvement.
The PBIT of Reliance Com has declined sharply from Rs. 2332 crore in 2012-13 to Rs.
265 crore in 2014-15.
7.7 INTEREST COVERAGE RATIO
The interest coverage ratio of these TSPs is depicted in the table below:
37
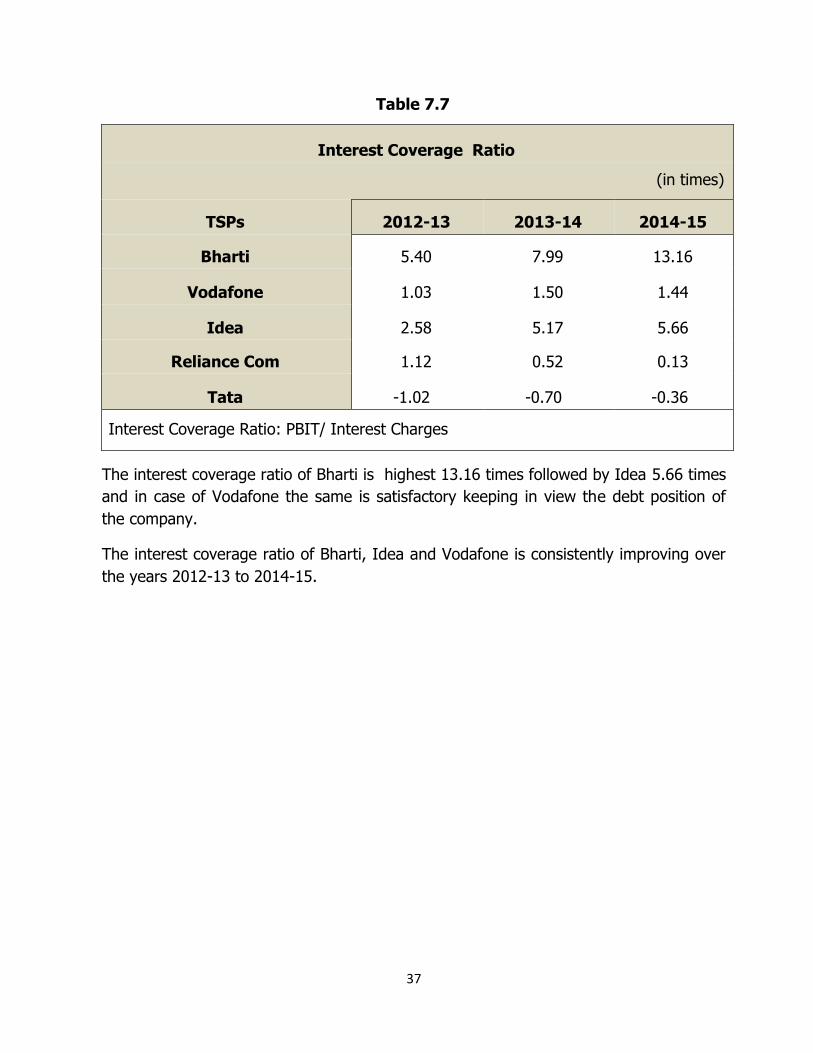
Table 7.7
Interest Coverage Ratio
(in times)
TSPs 2012-13 2013-14 2014-15
Bharti 5.40 7.99 13.16
Vodafone 1.03 1.50 1.44
Idea 2.58 5.17 5.66
Reliance Com 1.12 0.52 0.13
Tata -1.02 -0.70 -0.36
Interest Coverage Ratio: PBIT/ Interest Charges
The interest coverage ratio of Bharti is highest 13.16 times followed by Idea 5.66 times
and in case of Vodafone the same is satisfactory keeping in view the debt position of
the company.
The interest coverage ratio of Bharti, Idea and Vodafone is consistently improving over
the years 2012-13 to 2014-15.
38
CHAPTER - 8
8. CONCLUSION
The analysis gives an insight on the trend of financial position, borrowed funds,
leverage, debt service and profitability of the 24 private access service provider
companies. Following are the broad highlights:
8.1 DEPLOYMENT OF OWN FUNDS
With the growth and maturity in the telecom service sector, the telcos are now investing
more from their own coffers rather than relying on borrowed funds over the period of
three years ending March 2015.
The share of Indian promoters in share capital has increased from 55% in 2012-13 to
71% in 2014-15 at the same time share of foreign promoters has gone down by 7%.
Increase of Rs.30504 crore in share capital over the period of three years is a sign of
confidence shown by the shareholders in the Indian telecom service sector. Reserves
and Surplus has also gone up significantly.
8.2 DEPENDENCY ON DEBT
Total loans have increased from Rs. 196525 crore in 2012-13 to Rs. 258876 crore in
2014-15, however, the Debt-Equity ratio has declined from 2.05 times to in 2012-13 to
1.68 times in 2014-15, this is mainly because the companies are infusing more equities
than the financing through debt. Not only the debt-equity ratio is in comfortable zone
but also the Interest coverage ratio has also shown improvement.
8.3 INVESTMENT IN GROSS BLOCK
As earlier stated with the expansion in the sector, the infusion of funds in Fixed Assets
(Gross Block including Capital work in Progress) of the telecom service sector (access
services) has increased which is evident as the Fixed Assets have increased from Rs.
360590 crore in 2012-13 to Rs. 505934 crore in 2014-15.
The ratio of Fixed Assets (Gross Block including Capital work in Progress) to Debt has
gone up from 1.83 times in 2012-13 to 1.95 times in 2014-15 indicating that financing
of fixed assets through debt is showing declining trend.
8.4 PROFITABILITY
There has been a change in the dynamics of the telecom sector over the course of the
last three years for period ending on March 2015. The significant increase in the growth
39
of data usage, stable MoU per subscriber, continuous positive growth in revenue,
improvement in profitability indicators; all these indicate the step-up in the sector’s
financial performance in comparison to the period of year 2008 to 2012.
The growth in total revenue has contributed to the growth in EBITDA. The EBITDA
margin has gone up from 19.77 % to 28.50% during this period. Similarly the Profit
before Finance Charges and Tax (PBIT) stood at Rs. 28996 crore as on March 2015.
8.5 POLICY INITIATIVES
Significant increase in share capital and debt in last three years is primarily due to the
requirement of funds for financing the spectrum purchase. Between 2012 and 2015, four
spectrum auctions have been held for multiple spectrum bands. Though the access
telecom service sector has shown improvement in overall financial performance, it is
expected that fund infusion through share capital and debt would continue in the near
future as the TSPs generally have opted for instalment option for spectrum acquired for
which they will need the funds on a yearly basis beside annual recurring/routine
operating and capital expenditure.
In the recent past, news about spectrum sharing/trading (e.g. Bharti Airtel-Videocon,
Bharti Airtel-Aircel, Reliance Communications-Sistema Shyam, Reliance Communications -
Reliance Jio) has come at regular intervals. This could indicate consolidation in the
sector.
Government had introduced various initiatives in last three years for facilitating the
growth of telecom service sector such as spectrum trading, spectrum sharing, spectrum
liberalization, introduction of virtual network operator, FDI limit was raised to 100% for
all telecom services etc. These policy initiatives may further fuel the growth of the
sector and act as catalyst for increase in the tele density and bridging the digital divide.
************************************************
40
ANNEXURE- A
Sl. No. List of companies
1. Aircel Ltd.
2. Aircel Cellular Ltd.
3. Bharti Airtel Ltd.
4. Bharti Hexacom Ltd.
5. Dishnet Wireless Ltd.
6. Idea Cellular Ltd.
7. Quadrant Televentures Ltd.
8. Reliance Communications Ltd.
9. Reliance Jio Infocom Ltd.
10. Reliance Telecom Ltd.
11. Sistema Shyam Teleservices Ltd.
12. Tata Teleservices Ltd.
13. Tata Teleservices (Maharashtra) Ltd.
14. Telenor (India) Communications Services Pvt. Ltd.
15. Unitech Wireless (Tamilnadu)
16. Videocon Telecommunications Ltd.
17. Vodafone Cellular Ltd.
18. Vodafone Digilink Ltd.
19. Vodafone East Ltd.
20. Vodafone India Ltd.
21. Vodafone Mobile Services Ltd.
22. Vodafone South Ltd.
23. Vodafone Spacetel Ltd.
24. Vodafone West Ltd.