Embed Size (px)
Citation preview
0
Ministry of Micro, Small and Medium EnterprisesG o v e r n m e n t o f I n d i a
TelanganaState Profile
2015-16
M S M E - D e v e l o p m e n t I n s t i t u t e(Ministry of MSME, Govt. of India,)HYDERABADPhone : 040-23078131-32-33Fax: 040-23078857e-mail: [email protected] http://[email protected]
1
CONTENTS
S.No
Topic Page Number1 Over view 22 Demography 33 Climate 74 Agriculture 85 Live stock & Fisheries 106 Horticulture 117 Irrigation 128 Forest 139 Industry 1310 Mining 2111 Infrastructure 2412 Energy 2513 Transport and Communications 2714 Education 2815 Banks 2916 Tourism 2917 State Economy 31
2
1. OverviewThe state of Telangana emerged as 29th state in the Indian Union as per the Andhra
Pradesh Reorganization Act, 2014 (No. 6 of 2014) of Parliament, which received
the assent of the President of India on the 1st March, 2014 and came into existence with
effect from 2nd June, 2014. The said Andhra Pradesh Reorganization Act, 2014 was received
an amendment called the Andhra Pradesh Reorganization (Amendment) Act, 2014 (No. 19
of 2014) on the 17th July, 2014, transferring certain mandals and villages (327) of
Khammam district to residual Andhra Pradesh, enforcing this amendment with effect from
29th May, 2014.
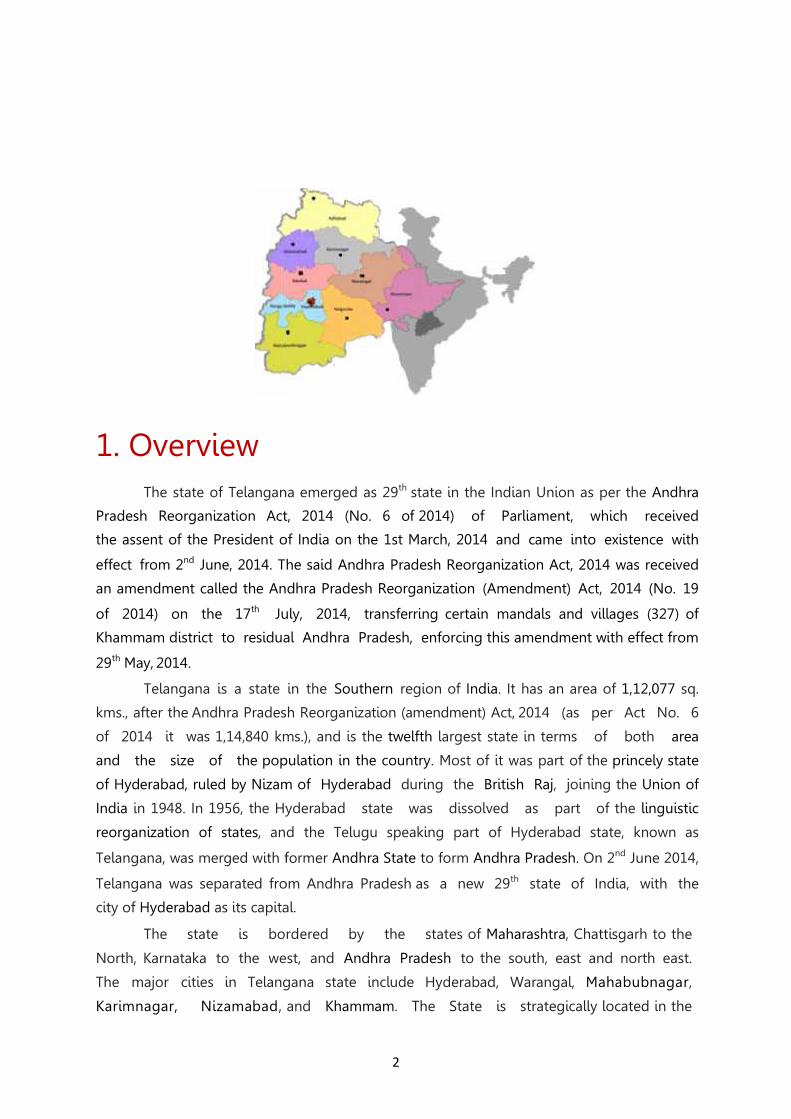
Telangana is a state in the Southern region of India. It has an area of 1,12,077 sq.
kms., after the Andhra Pradesh Reorganization (amendment) Act, 2014 (as per Act No. 6
of 2014 it was 1,14,840 kms.), and is the twelfth largest state in terms of both area
and the size of the population in the country. Most of it was part of the princely state
of Hyderabad, ruled by Nizam of Hyderabad during the British Raj, joining the Union of
India in 1948. In 1956, the Hyderabad state was dissolved as part of the linguistic
reorganization of states, and the Telugu speaking part of Hyderabad state, known as
Telangana, was merged with former Andhra State to form Andhra Pradesh. On 2nd June 2014,
Telangana was separated from Andhra Pradesh as a new 29th state of India, with the
city of Hyderabad as its capital.
The state is bordered by the states of Maharashtra, Chattisgarh to the
North, Karnataka to the west, and Andhra Pradesh to the south, east and north east.
The major cities in Telangana state include Hyderabad, Warangal, Mahabubnagar,
Karimnagar, Nizamabad, and Khammam. The State is strategically located in the
2
1. OverviewThe state of Telangana emerged as 29th state in the Indian Union as per the Andhra
Pradesh Reorganization Act, 2014 (No. 6 of 2014) of Parliament, which received
the assent of the President of India on the 1st March, 2014 and came into existence with
effect from 2nd June, 2014. The said Andhra Pradesh Reorganization Act, 2014 was received
an amendment called the Andhra Pradesh Reorganization (Amendment) Act, 2014 (No. 19
of 2014) on the 17th July, 2014, transferring certain mandals and villages (327) of
Khammam district to residual Andhra Pradesh, enforcing this amendment with effect from
29th May, 2014.
Telangana is a state in the Southern region of India. It has an area of 1,12,077 sq.
kms., after the Andhra Pradesh Reorganization (amendment) Act, 2014 (as per Act No. 6
of 2014 it was 1,14,840 kms.), and is the twelfth largest state in terms of both area
and the size of the population in the country. Most of it was part of the princely state
of Hyderabad, ruled by Nizam of Hyderabad during the British Raj, joining the Union of
India in 1948. In 1956, the Hyderabad state was dissolved as part of the linguistic
reorganization of states, and the Telugu speaking part of Hyderabad state, known as
Telangana, was merged with former Andhra State to form Andhra Pradesh. On 2nd June 2014,
Telangana was separated from Andhra Pradesh as a new 29th state of India, with the
city of Hyderabad as its capital.
The state is bordered by the states of Maharashtra, Chattisgarh to the
North, Karnataka to the west, and Andhra Pradesh to the south, east and north east.
The major cities in Telangana state include Hyderabad, Warangal, Mahabubnagar,
Karimnagar, Nizamabad, and Khammam. The State is strategically located in the
3
Deccan plateau in a semi arid region. The climate is predominantly hot and dry.
2. DemographyPOPULATION:
The Government of India, in exercise of powers conferred under the provisions of
the Census Act, 1948, conducting the population census across the country once in a
decade and releasing the results in different phases. Accordingly, the Government of
India has conducted the population census in the year 2011 and released the final
results, up to the village level, in different classifications. An attempt is made in this
chapter to present the results of the population census, 2011 conducted in Telangana
State, excluding (327) revenue villages that were transferred to the state of Andhra
Pradesh as per the Andhra Pradesh Reorganization (Amendment) Act, 2014 (No. 19
of 2014) along with certain comparisons with that of the earlier censuses. Accordingly, the
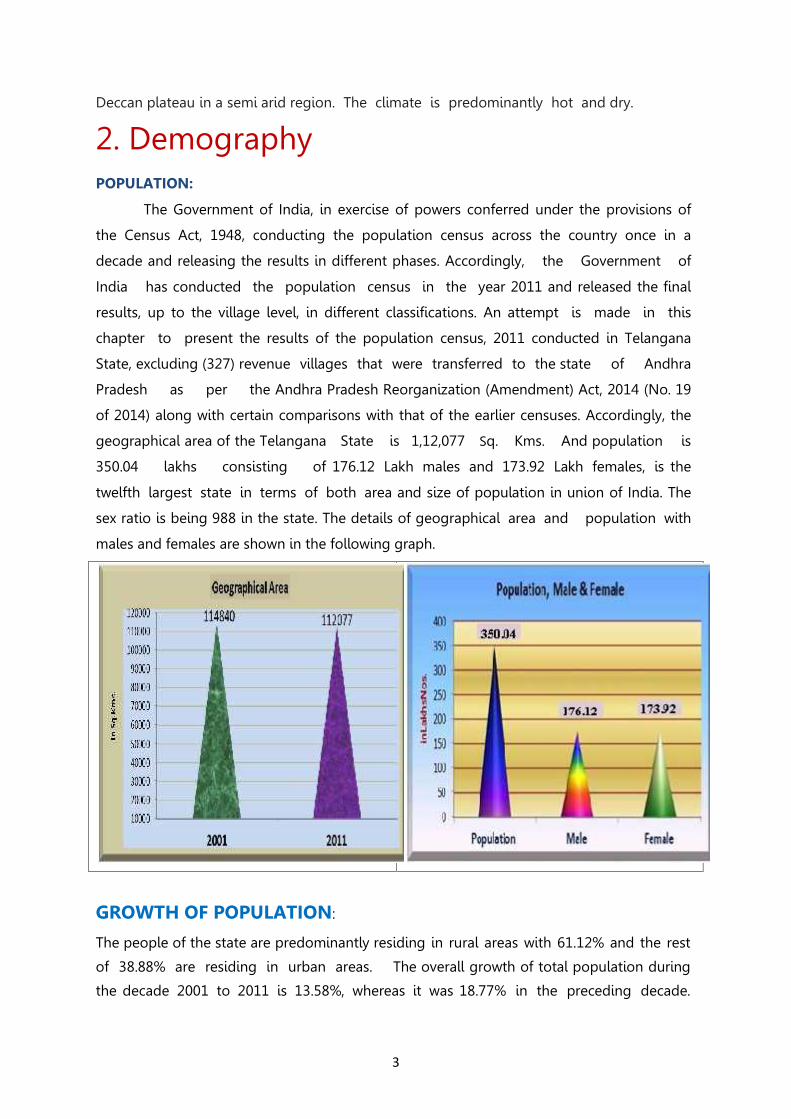
geographical area of the Telangana State is 1,12,077 Sq. Kms. And population is
350.04 lakhs consisting of 176.12 Lakh males and 173.92 Lakh females, is the
twelfth largest state in terms of both area and size of population in union of India. The
sex ratio is being 988 in the state. The details of geographical area and population with
males and females are shown in the following graph.
GROWTH OF POPULATION:
The people of the state are predominantly residing in rural areas with 61.12% and the rest
of 38.88% are residing in urban areas. The overall growth of total population during
the decade 2001 to 2011 is 13.58%, whereas it was 18.77% in the preceding decade.
4
The growth of the population in urban areas has been witnessing a significant increase.
Urban population in the State grew by 38.12% during the decade 2001 to 2011 as
compared with 25.13% in the preceding decade. In sharp contrast, rural population in the
state grew by a modest 2.13% as per the 2011 census, which is much higher than the
United Nations estimates of world population growth at 1.23%. Around 30% of total
urban population is residing in the capital city of Hyderabad alone.
SEX RATIO:
The sex ratio is defined as the number of females per 1,000 males. This ratio for the
state is 988 according to 2011 Census. One distinguishing feature is that the sex ratio in the
districts of Nizamabad, Adilabad, Karimnagar and Khammam is over 1,000. The sex ratio
has been witnessing an improvement in the State from 967 in 1991 to 971 in 2001 and
further to 988 in 2011. Despite a favorable sex ratio of the total population, the sex ratio
of children in the age group of 0-6 years is declined from 957 in 2001 to 932 in
2011. The sex ratio of the SC population at 1,008 in 2011 is much higher than the
State average of 988 in all districts, except Rangareddy, Hyderabad and
Mahabubnagar districts. The sex ratio of ST population at 977 is marginally lower than the
State average of 988, but it is higher in Adilabad, Karimnagar, Nizamabad and Khammam
districts.
DENSITY OF POPULATION:
The density of population is defined, in general, as average number of persons
residing per square kilometer of area. The density of population in the State ranges
from 170 to 18,172 per square kilometer. Adilabad district has the lowest density of
170 per sq. kilometer and Hyderabad district with highest density of 18,172 per sq.
kilometer. The districts of Adilabad, Khammam and Mahabubnagar have lower density of
population with 170, 197 and 220 per sq. kilometer respectively, as compared ith the
State average of 312 per sq. kilometer.
LITERACY RATE:
According to the Census of India, the literacy rate is defined as the total
percentage of the population of an area at a particular time, aged seven years or above who
can read and write with understanding.
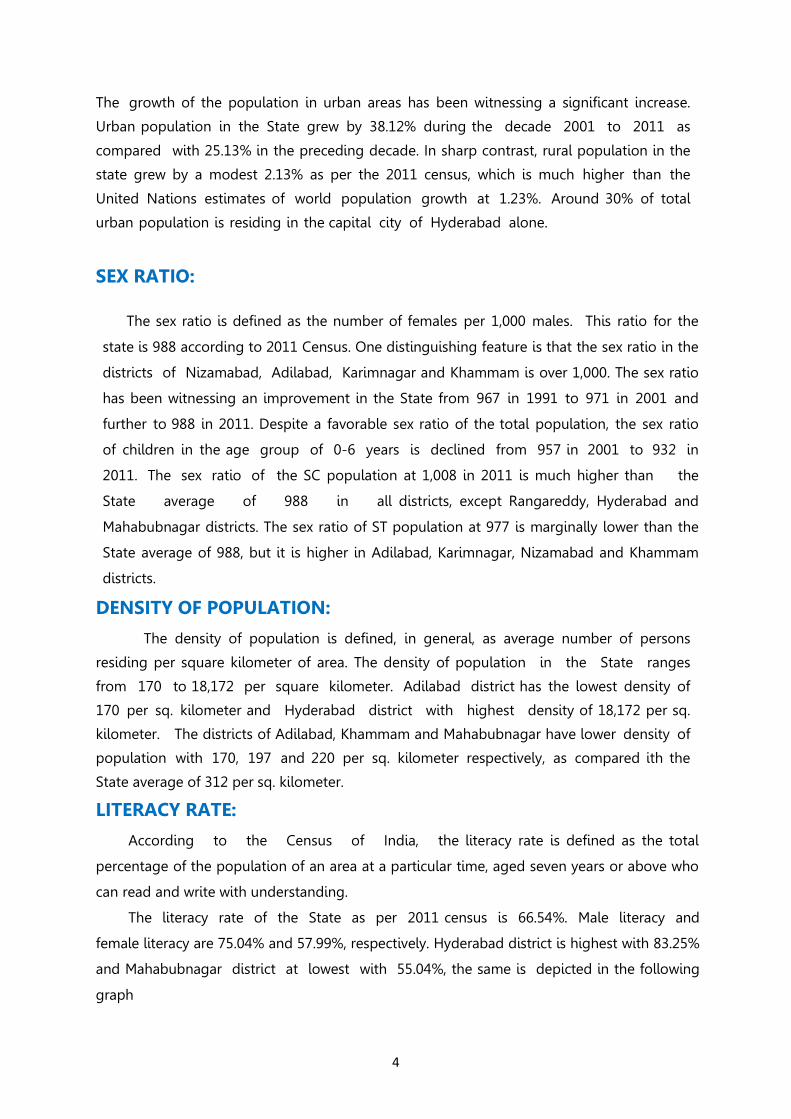
The literacy rate of the State as per 2011 census is 66.54%. Male literacy and
female literacy are 75.04% and 57.99%, respectively. Hyderabad district is highest with 83.25%
and Mahabubnagar district at lowest with 55.04%, the same is depicted in the following
graph
5
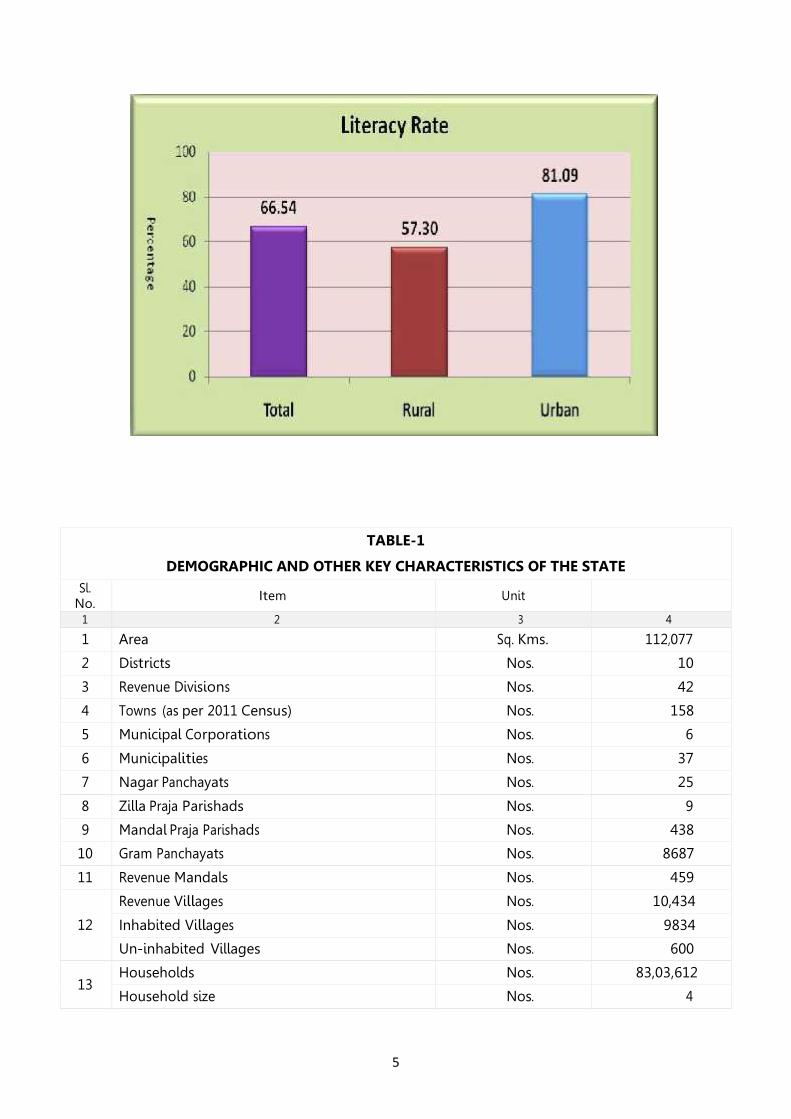
TABLE-1
DEMOGRAPHIC AND OTHER KEY CHARACTERISTICS OF THE STATESl.
No.Item Unit
1 2 3 4
1 Area Sq. Kms. 112,077
2 Districts Nos. 10
3 Revenue Divisions Nos. 42
4 Towns (as per 2011 Census) Nos. 158
5 Municipal Corporations Nos. 6
6 Municipalities Nos. 37
7 Nagar Panchayats Nos. 25
8 Zilla Praja Parishads Nos. 9
9 Mandal Praja Parishads Nos. 438
10 Gram Panchayats Nos. 8687
11 Revenue Mandals Nos. 459
12
Revenue Villages Nos. 10,434
Inhabited Villages Nos. 9834
Un-inhabited Villages Nos. 600
13Households Nos. 83,03,612
Household size Nos. 4
6
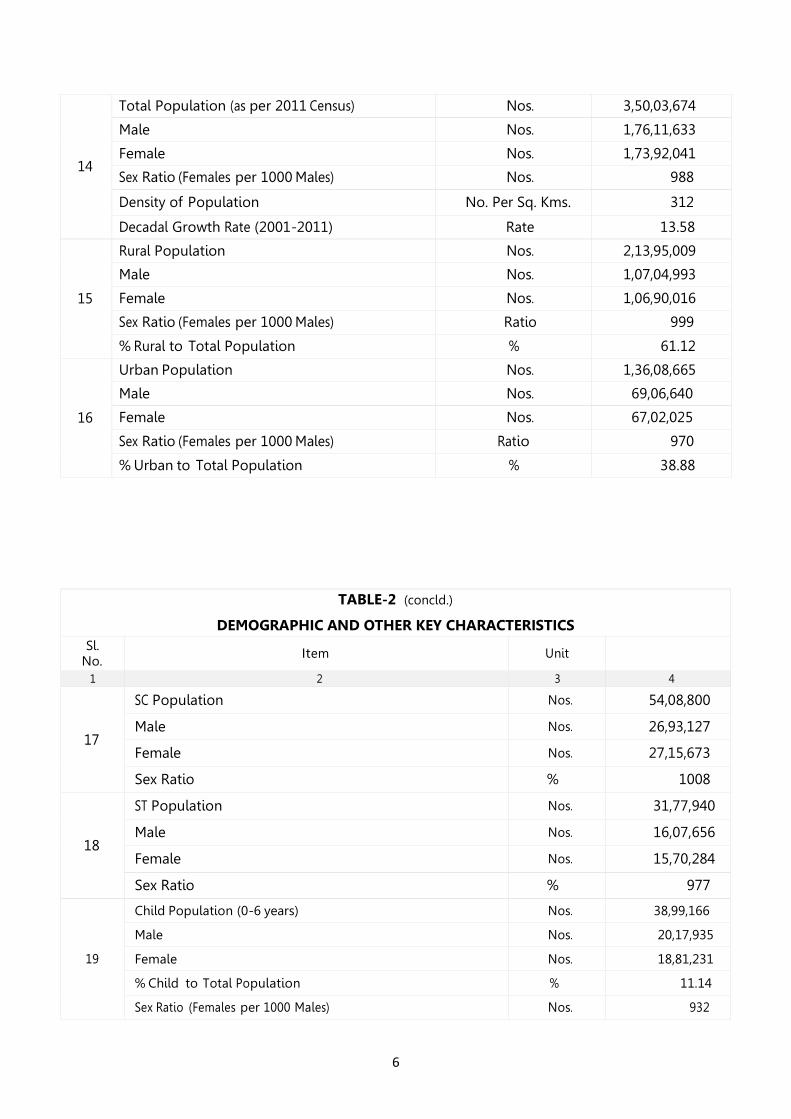
14
Total Population (as per 2011 Census) Nos. 3,50,03,674
Male Nos. 1,76,11,633
Female Nos. 1,73,92,041
Sex Ratio (Females per 1000 Males) Nos. 988
Density of Population No. Per Sq. Kms. 312
Decadal Growth Rate (2001-2011) Rate 13.58
15
Rural Population Nos. 2,13,95,009
Male Nos. 1,07,04,993
Female Nos. 1,06,90,016
Sex Ratio (Females per 1000 Males) Ratio 999
% Rural to Total Population % 61.12
16
Urban Population Nos. 1,36,08,665
Male Nos. 69,06,640
Female Nos. 67,02,025
Sex Ratio (Females per 1000 Males) Ratio 970
% Urban to Total Population % 38.88
TABLE-2 (concld.)
DEMOGRAPHIC AND OTHER KEY CHARACTERISTICSSl.
No.Item Unit
1 2 3 4
17
SC Population Nos. 54,08,800
Male Nos. 26,93,127
Female Nos. 27,15,673
Sex Ratio % 1008
18
ST Population Nos. 31,77,940
Male Nos. 16,07,656
Female Nos. 15,70,284
Sex Ratio % 977
19
Child Population (0-6 years) Nos. 38,99,166
Male Nos. 20,17,935
Female Nos. 18,81,231
% Child to Total Population % 11.14
Sex Ratio (Females per 1000 Males) Nos. 932
7
20
Literates Nos. 2,06,96,778
Male Nos. 1,17,01,729
Female Nos. 89,95,049
21
Literacy Rate % 66.54
Male % 75.04
Female % 57.99
22
Total Workers Nos. 1,63,41,942
Main Workers Nos. 1,37,19,871
Marginal Workers Nos. 26,22,063
23
Public Representatives:
Member of Parliament (MPs) (Rajya Sabha) Nos. 7
Member of Parliament (MPs) (Lok Sabha) Nos. 17
Member of Legislative Council (MLCs) ( *Nominated ) Nos. 30+3*=33
Member of Legislative Assembly (MLAs) ( * Nominated) Nos. 119+1*=120
Zilla Parishad Territorial Constituency Members (ZPTCs) Nos. 438
Mandal Parishad Presidents (MPPs) Nos. 438
Mandal Parishad Territorial Constituency Members (MPTCs) Nos. 6,456
Sarpanchas Nos. 8,687
3.ClimateTelangana state is geographically located in a semi-arid area and has a
predominantly hot and dry climate. Summers start in March, and peak in May with average
high temperatures in the 42 °C (108 °F) range. The monsoons enter in the state in June and
lasts until September with about 715 mm of precipitation. A dry, mild winter starts in
late November and lasts until early February with little humidity and average temperatures in
the 22–23 °C (72–73 °F) range. This area is also prone to hailstorms in the month of
April and May, some times
RAIN FALL:The average annual rainfall in the state is about 906.6 mm and 80% of annual
rainfall is received from the south-west monsoons (June-September). The rainfall in
the state is erratic and uncertain and distribution of the rainfall is uneven in various
mandals, thus, making agriculture a proverbial gamble in monsoons. Of the rainfall
received during the period from 2004-05 to 2013-14, the annual actual rainfall received
was lowest in 2004-05 with 614 mm, where as it was the highest in 2013-14 with
1212.2 mm as against normal rainfall of 906.6 mm in the state.
8
4.AgricultureThe Economy of Telangana is mainly driven by agriculture. Agriculture plays a
pivotal role in the economy of the state and the better performance of this sector is vital for
inclusive growth. Sustainable growth in Agriculture continues to be core agenda of the
Government and occupies center stage in state economy embodying three thrust areas viz.,
(i) to promote inclusive growth, (ii) to enhance rural income, and (iii) to sustain food
security. About 55.49 percent of the State‟s population is dependent on some form or the
other on farm activity for livelihoods, it is imperative to increase the farm incomes and
ensuring sustainable growth in Telangana to reduce poverty. The share of agriculture to
state GSDP in 2014-15 is 9.3 percent at current prices. The pressure on agricultural
land is ever increasing for industrialization, urbanization, housing,
infrastructure and others. All these factors are forcing for conversion of agricultural land
to non-agricultural uses. The scope for expansion of the area available for cultivation is
coming down to that extent, ultimately decrease in net area sown. Paddy is the
major food crop and staple food of the state. Other important crops grown are Maize,
Jowar, Redgram, Greengram, Bengalgram, Groundnut, Soyabean, Mango, Cotton, Chillies,
Sugarcane etc., and agriculture has been the chief source of income for the state's
economy. During 2013-14, production of total food grains was recorded at 107.49 lakh
tonnes. Of the total food grains production, production of cereals and millets was 102.78 lakh
tonnes, pulses 4.71 lakh tonnes. Production of oil seeds was 8.81 lakh tonnes, Chillies2.80
lakh tonnes, Turmeric 2.52 lakh tonnes etc.
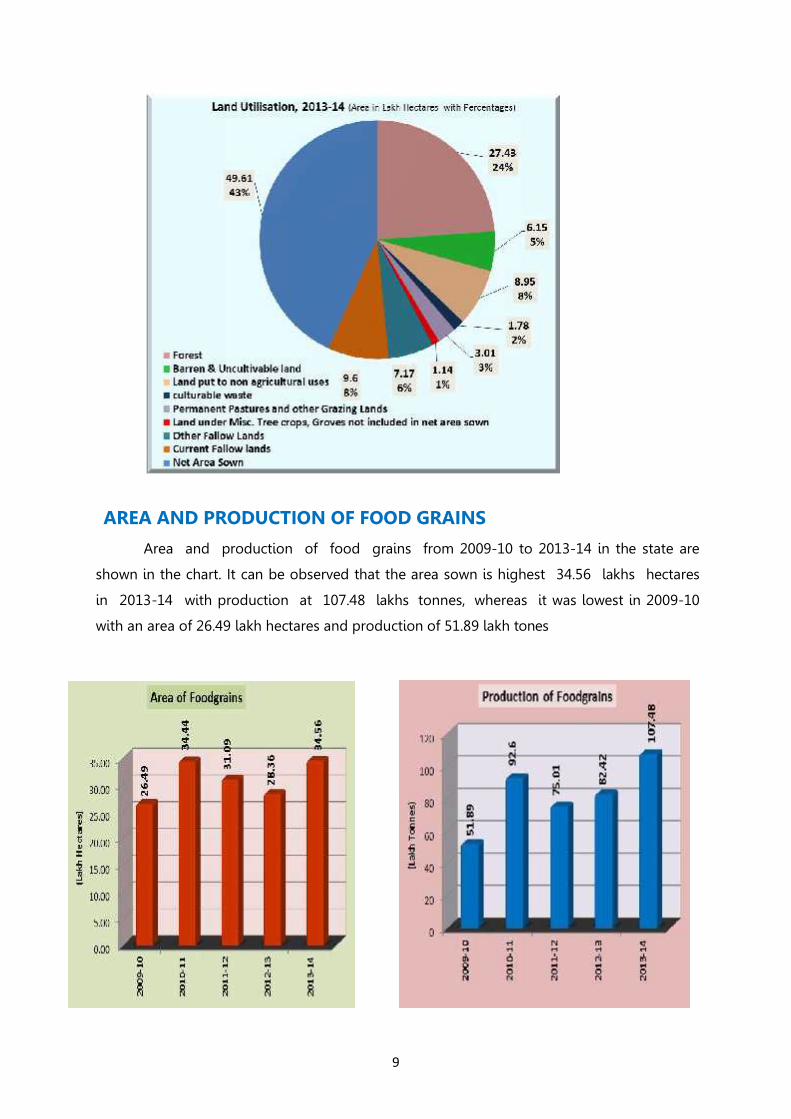
LAND UTILISATION
The total geographical area of the State is 112.07 lakh hectares, of which the area
under forest cover is 27.43 lakh hectares, constituting 23.89% of the land. About 43.20%
area is under cultivation (49.61 lakh hectares), 8.36% is current fallow lands (9.60 lakh
hectares), 7.79% of land is put to non-agricultural uses (8.95 lakh hectares), 5.36% is
barren and uncultivable (6.15 lakh hectares) and 6.24% falls under other fallows (7.17
lakh hectares). The remaining 5.16% is under culturable waste, permanent pastures and
other grazing lands, and land under miscellaneous tree crops and groves are not included
in the net area sown (5.93 lakh hectares). The pattern of land use under various categories is
indicated in the following chart.
9
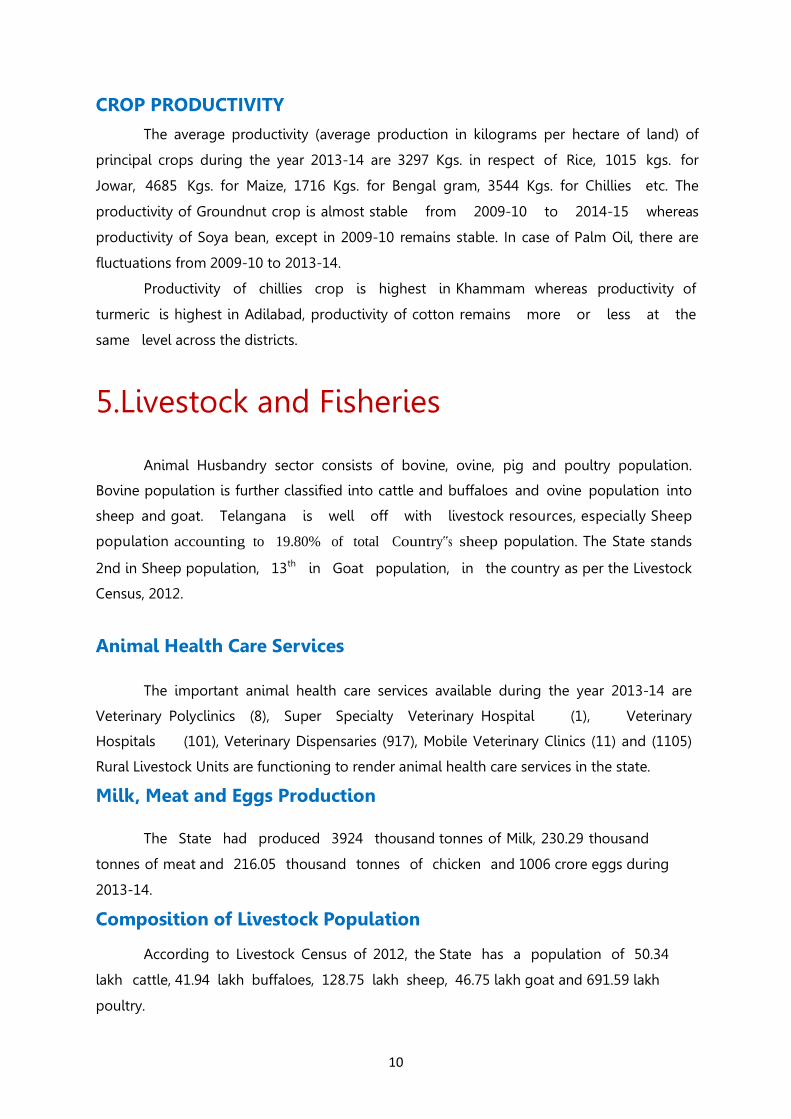
AREA AND PRODUCTION OF FOOD GRAINS
Area and production of food grains from 2009-10 to 2013-14 in the state are
shown in the chart. It can be observed that the area sown is highest 34.56 lakhs hectares
in 2013-14 with production at 107.48 lakhs tonnes, whereas it was lowest in 2009-10
with an area of 26.49 lakh hectares and production of 51.89 lakh tones
10
CROP PRODUCTIVITY
The average productivity (average production in kilograms per hectare of land) of
principal crops during the year 2013-14 are 3297 Kgs. in respect of Rice, 1015 kgs. for
Jowar, 4685 Kgs. for Maize, 1716 Kgs. for Bengal gram, 3544 Kgs. for Chillies etc. The
productivity of Groundnut crop is almost stable from 2009-10 to 2014-15 whereas
productivity of Soya bean, except in 2009-10 remains stable. In case of Palm Oil, there are
fluctuations from 2009-10 to 2013-14.
Productivity of chillies crop is highest in Khammam whereas productivity of
turmeric is highest in Adilabad, productivity of cotton remains more or less at the
same level across the districts.
5.Livestock and Fisheries
Animal Husbandry sector consists of bovine, ovine, pig and poultry population.
Bovine population is further classified into cattle and buffaloes and ovine population into
sheep and goat. Telangana is well off with livestock resources, especially Sheep
population accounting to 19.80% of total Country‟s sheep population. The State stands
2nd in Sheep population, 13th in Goat population, in the country as per the Livestock
Census, 2012.
Animal Health Care Services
The important animal health care services available during the year 2013-14 are
Veterinary Polyclinics (8), Super Specialty Veterinary Hospital (1), Veterinary
Hospitals (101), Veterinary Dispensaries (917), Mobile Veterinary Clinics (11) and (1105)
Rural Livestock Units are functioning to render animal health care services in the state.
Milk, Meat and Eggs Production
The State had produced 3924 thousand tonnes of Milk, 230.29 thousand
tonnes of meat and 216.05 thousand tonnes of chicken and 1006 crore eggs during
2013-14.
Composition of Livestock Population
According to Livestock Census of 2012, the State has a population of 50.34
lakh cattle, 41.94 lakh buffaloes, 128.75 lakh sheep, 46.75 lakh goat and 691.59 lakh
poultry.
11
Fisheries
Fisheries sector is one of the fast growing sectors, provides cheap and nutritious food
and source of livelihood for a large section of economically backward population of the state.
The production of inland fish and prawn during the year 2013-14 is 249633 MTs, in
terms of value it is Rs. 247987 lakhs and its contribution is 0.6% in GSDP. Production of
inland fish, including prawns is given in the following chart
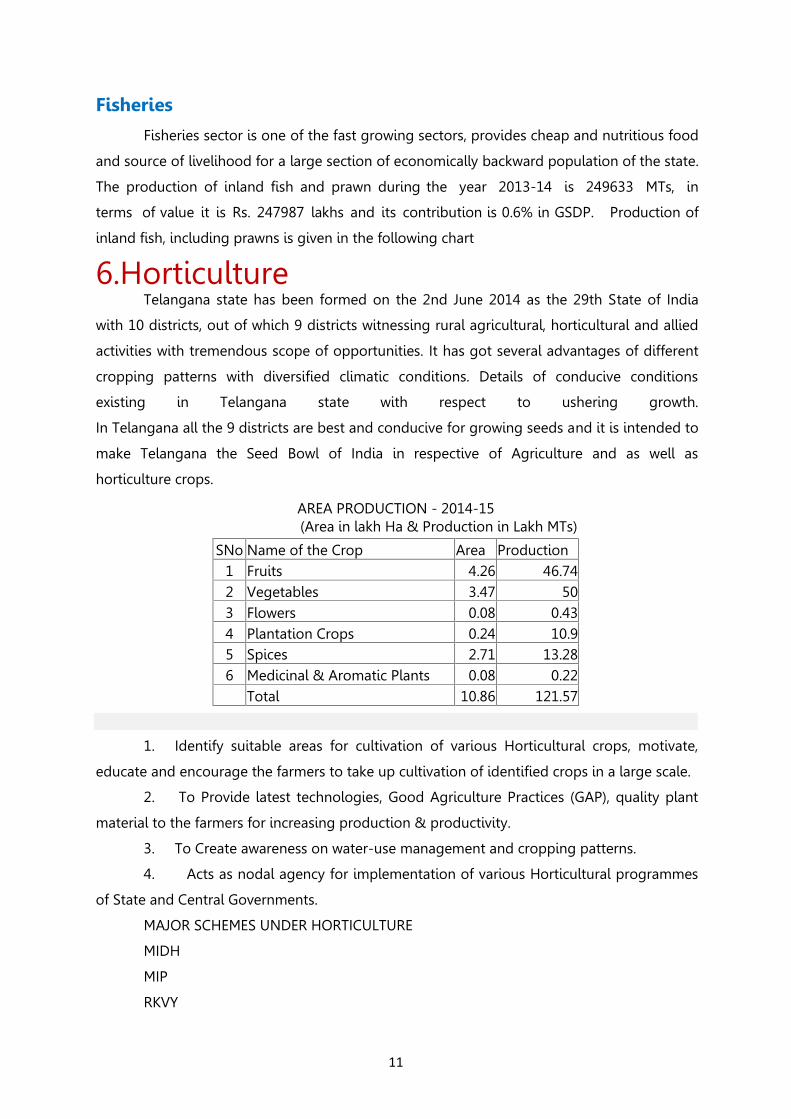
6.HorticultureTelangana state has been formed on the 2nd June 2014 as the 29th State of India
with 10 districts, out of which 9 districts witnessing rural agricultural, horticultural and allied
activities with tremendous scope of opportunities. It has got several advantages of different
cropping patterns with diversified climatic conditions. Details of conducive conditions
existing in Telangana state with respect to ushering growth.
In Telangana all the 9 districts are best and conducive for growing seeds and it is intended to
make Telangana the Seed Bowl of India in respective of Agriculture and as well as
horticulture crops.
AREA PRODUCTION - 2014-15(Area in lakh Ha & Production in Lakh MTs)
SNo Name of the Crop Area Production1 Fruits 4.26 46.742 Vegetables 3.47 503 Flowers 0.08 0.434 Plantation Crops 0.24 10.95 Spices 2.71 13.286 Medicinal & Aromatic Plants 0.08 0.22
Total 10.86 121.57
1. Identify suitable areas for cultivation of various Horticultural crops, motivate,
educate and encourage the farmers to take up cultivation of identified crops in a large scale.
2. To Provide latest technologies, Good Agriculture Practices (GAP), quality plant
material to the farmers for increasing production & productivity.
3. To Create awareness on water-use management and cropping patterns.
4. Acts as nodal agency for implementation of various Horticultural programmes
of State and Central Governments.
MAJOR SCHEMES UNDER HORTICULTURE
MIDH
MIP
RKVY
12
POLY HOUSE STATE PLAN
HORTICULTURE FARMS
GOVT. GARDENS
For more details visit Web site : horticulture.ts.nic.in
7.Irrigation
Irrigation is the artificial application of water to the land or soil. It is used to assist in the
growing of agricultural crops, maintenance of landscapes, and re-vegetation of disturbed
soils in dry areas and during periods of inadequate rainfall. Irrigation is one of the most
important critical inputs for enhancing the productivity that is required at different critical
stages of plant growth. One cannot imagine agriculture without irrigation. Two
important rivers of India, the Godavari and Krishna are flowing through the state and
providing irrigation. Major sources of irrigation in the state are canals, tanks, tubewells,
dug wells etc.
There are 6.30 lakh dug wells, 6.53 lakh tube wells, 0.50 lakh surface flow and lift
irrigation sources are catering to the needs of agriculture.
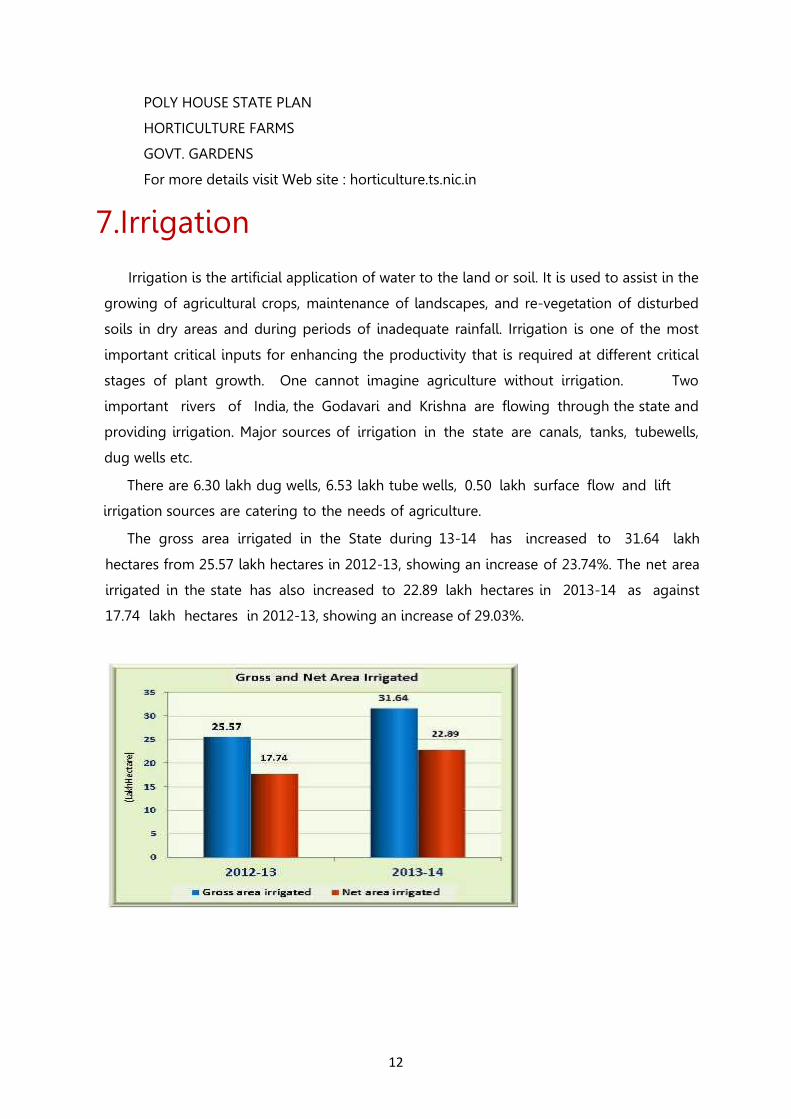
The gross area irrigated in the State during 13-14 has increased to 31.64 lakh
hectares from 25.57 lakh hectares in 2012-13, showing an increase of 23.74%. The net area
irrigated in the state has also increased to 22.89 lakh hectares in 2013-14 as against
17.74 lakh hectares in 2012-13, showing an increase of 29.03%.
13
8.Forests
The Central Deccan Plateau dry deciduous forests eco-region covers much of the state,
including Hyderabad. The characteristic vegetation is woodlands of Hardwickiabinata
and Albiziaamara. Over 80% of the original forest cover has been cleared for agriculture,
timber harvesting, or cattle grazing, but large blocks of forest can be found in
Nagarjunsagar- Srisailam Tiger Reserve and elsewhere. The more humid Eastern Highlands
moist deciduous forests cover the Eastern Ghats in the eastern part of the state.
Forests cover is critical for living environment, as it influences the quality and quantity
of air and water and plays a major role in supporting livelihood activities of rural poor,
contributing to the economy of the State, mitigating the threat of Global warming besides
conserving the fertile soil and vulnerable Wildlife.
Forestry and logging contribution to state GSDP at current prices is 0.9% and 5.02% in
Agriculture sector GSDP for the year 2014-15. The core objective of forest sector is to
enhance green cover by integrating it with livelihood.
The Geographical area of the Telangana State for the year 2013-14 (Combined
State) is 1,14,840 Sq. kms., and stood at 12th position in India, having 29,242 Sq. kms.,
forest area which accounts for 25.46% of total geographical area, including social forestry.
Out of 29,242 Sq.kms., Reserved Forest area is 21,024 Sq.kms., Protected Forest forms 7468
Sq.kms., and the rest of 750 q. kms., are unclassified. The total revenue realized during
2013-14 is Rs. 148.28 crores on sale of forest produce in the state.
9.IndustriesThe State of Telangana is home for several major manufacturing industries in bulk
drugs, pharmaceuticals, agro-processing, cement & mineral-based industries, high precision
engi- neering, textiles, leather, apparels, automobiles and auto components industry, spices,
horticulture, poultry farming, biotechnology, defense equipment etc.
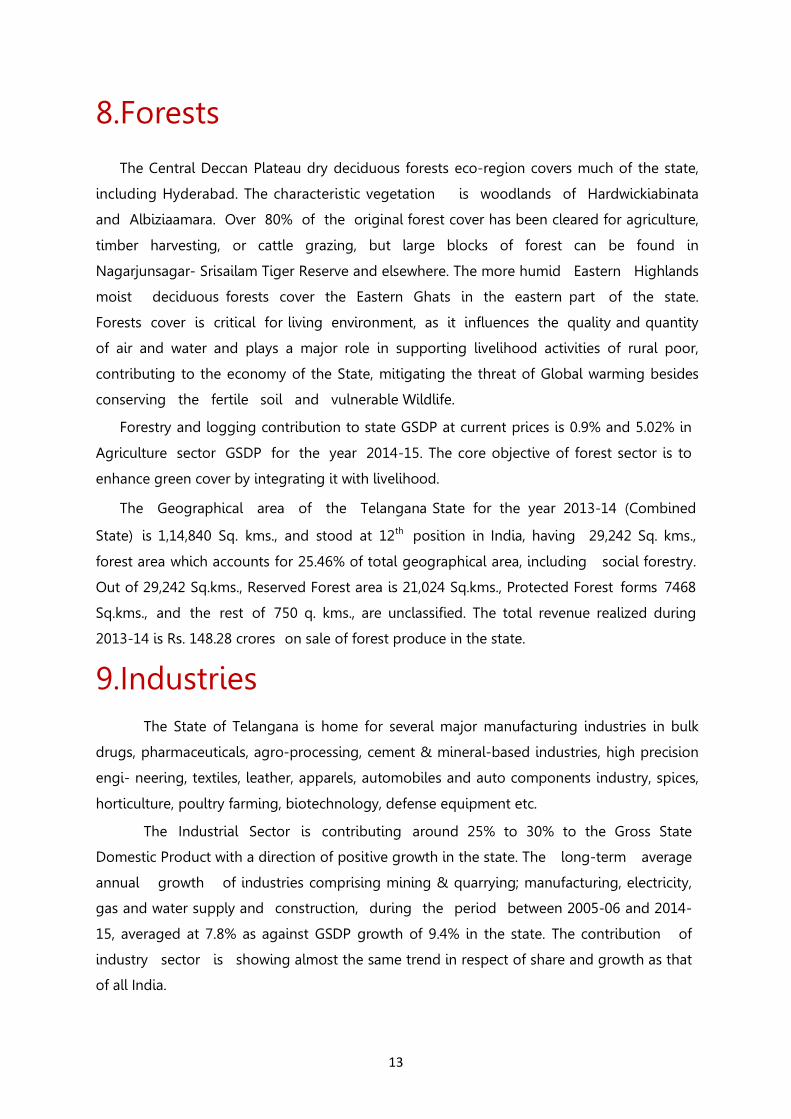
The Industrial Sector is contributing around 25% to 30% to the Gross State
Domestic Product with a direction of positive growth in the state. The long-term average
annual growth of industries comprising mining & quarrying; manufacturing, electricity,
gas and water supply and construction, during the period between 2005-06 and 2014-
15, averaged at 7.8% as against GSDP growth of 9.4% in the state. The contribution of
industry sector is showing almost the same trend in respect of share and growth as that
of all India.
14
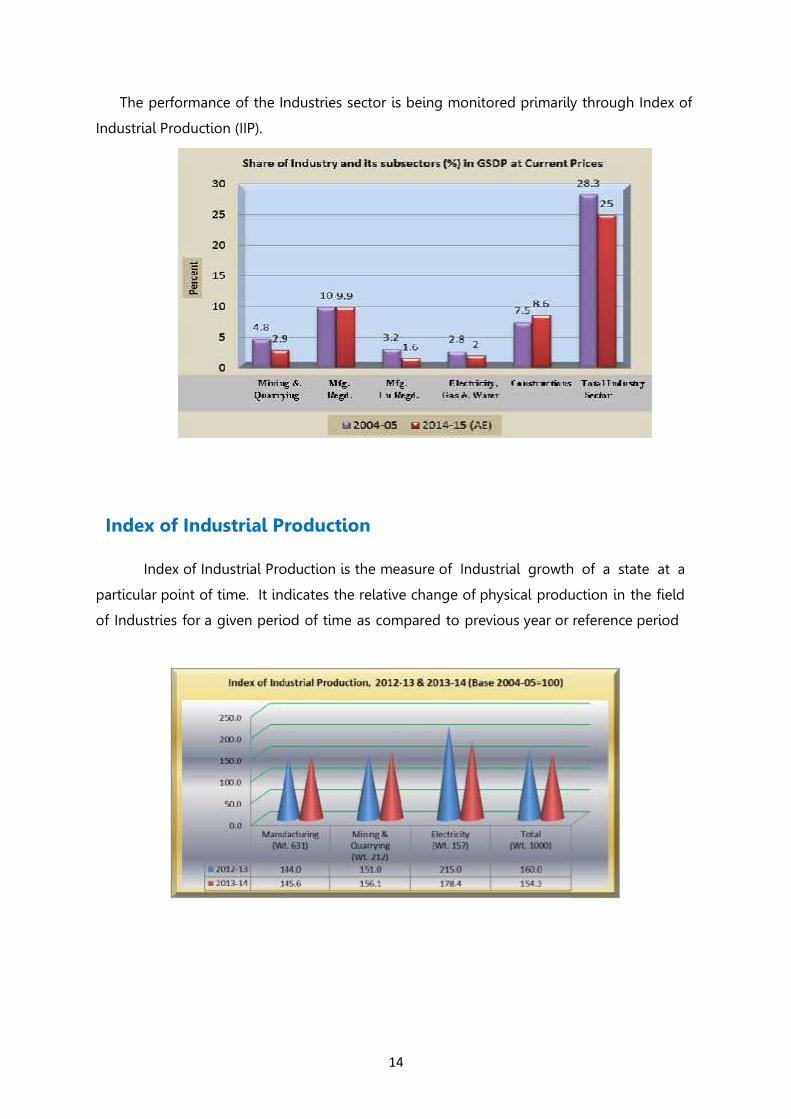
The performance of the Industries sector is being monitored primarily through Index of
Industrial Production (IIP).
Index of Industrial Production
Index of Industrial Production is the measure of Industrial growth of a state at a
particular point of time. It indicates the relative change of physical production in the field
of Industries for a given period of time as compared to previous year or reference period
14
The performance of the Industries sector is being monitored primarily through Index of
Industrial Production (IIP).
Index of Industrial Production
Index of Industrial Production is the measure of Industrial growth of a state at a
particular point of time. It indicates the relative change of physical production in the field
of Industries for a given period of time as compared to previous year or reference period
15
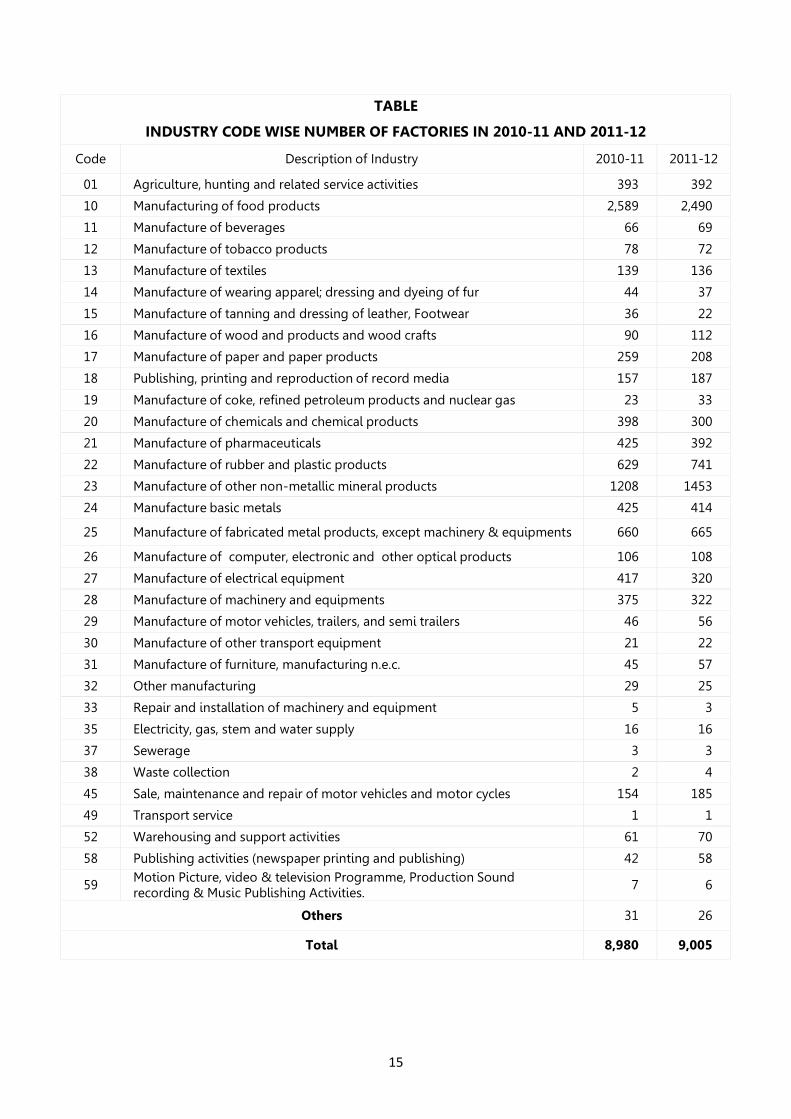
TABLE
INDUSTRY CODE WISE NUMBER OF FACTORIES IN 2010-11 AND 2011-12
Code Description of Industry 2010-11 2011-12
01 Agriculture, hunting and related service activities 393 392
10 Manufacturing of food products 2,589 2,490
11 Manufacture of beverages 66 69
12 Manufacture of tobacco products 78 72
13 Manufacture of textiles 139 136
14 Manufacture of wearing apparel; dressing and dyeing of fur 44 37
15 Manufacture of tanning and dressing of leather, Footwear 36 22
16 Manufacture of wood and products and wood crafts 90 112
17 Manufacture of paper and paper products 259 208
18 Publishing, printing and reproduction of record media 157 187
19 Manufacture of coke, refined petroleum products and nuclear gas 23 33
20 Manufacture of chemicals and chemical products 398 300
21 Manufacture of pharmaceuticals 425 392
22 Manufacture of rubber and plastic products 629 741
23 Manufacture of other non-metallic mineral products 1208 1453
24 Manufacture basic metals 425 414
25 Manufacture of fabricated metal products, except machinery & equipments 660 665
26 Manufacture of computer, electronic and other optical products 106 108
27 Manufacture of electrical equipment 417 320
28 Manufacture of machinery and equipments 375 322
29 Manufacture of motor vehicles, trailers, and semi trailers 46 56
30 Manufacture of other transport equipment 21 22
31 Manufacture of furniture, manufacturing n.e.c. 45 57
32 Other manufacturing 29 25
33 Repair and installation of machinery and equipment 5 3
35 Electricity, gas, stem and water supply 16 16
37 Sewerage 3 3
38 Waste collection 2 4
45 Sale, maintenance and repair of motor vehicles and motor cycles 154 185
49 Transport service 1 1
52 Warehousing and support activities 61 70
58 Publishing activities (newspaper printing and publishing) 42 58
59 Motion Picture, video & television Programme, Production Soundrecording & Music Publishing Activities.
7 6
Others 31 26
Total 8,980 9,005
16
T-SWIFT:
The Act envisages creation of “TELANGANA STATE-WIDE INVESTMENT FACILITATION (T-SWIFT) BOARD under the Chairmanship of the Chief Secretary to Government and the SecretaryIndustries as the Member Convener and Commissioner of Industries as the Nodal Officer.
This Board on receipt of Application and Self Certification from a Mega Project will arrangein- principle approval within 15 days to enable implementation of the Project. The Board will pursuewith the respective Departments and arrange the clearances, subsequently, before commencement ofthe production.
Government gave approval to all SME Units including SC/ST Entrepreneurs established underIIPP 2010-2015 Policy to avail Reimbursement of Sales Tax, Pavala Vaddi Incentive andReimbursement of Power cost for the remaining period under the old policy and one additional yearunder the T-IDEA Policy 2014.
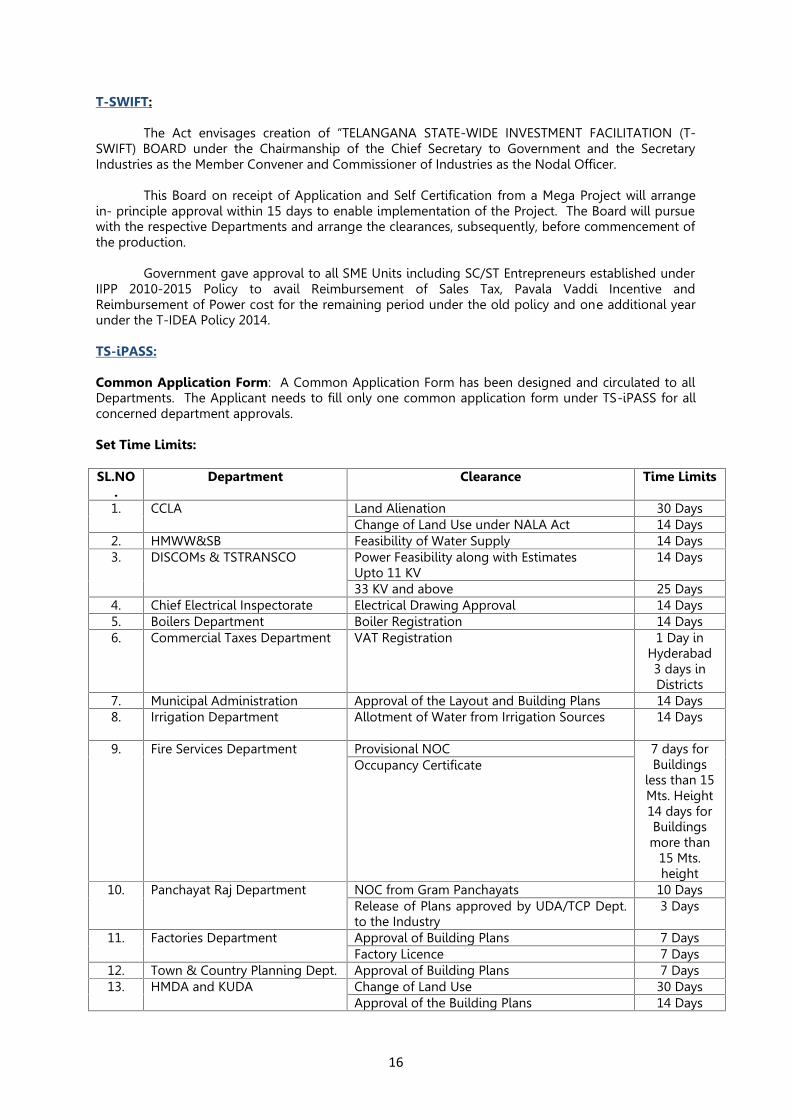
TS-iPASS:
Common Application Form: A Common Application Form has been designed and circulated to allDepartments. The Applicant needs to fill only one common application form under TS-iPASS for allconcerned department approvals.
Set Time Limits:
SL.NO.
Department Clearance Time Limits
1. CCLA Land Alienation 30 DaysChange of Land Use under NALA Act 14 Days
2. HMWW&SB Feasibility of Water Supply 14 Days3. DISCOMs & TSTRANSCO Power Feasibility along with Estimates
Upto 11 KV14 Days
33 KV and above 25 Days4. Chief Electrical Inspectorate Electrical Drawing Approval 14 Days5. Boilers Department Boiler Registration 14 Days6. Commercial Taxes Department VAT Registration 1 Day in
Hyderabad3 days inDistricts
7. Municipal Administration Approval of the Layout and Building Plans 14 Days8. Irrigation Department Allotment of Water from Irrigation Sources 14 Days
9. Fire Services Department Provisional NOC 7 days forBuildings
less than 15Mts. Height14 days forBuildingsmore than
15 Mts.height
Occupancy Certificate
10. Panchayat Raj Department NOC from Gram Panchayats 10 DaysRelease of Plans approved by UDA/TCP Dept.to the Industry
3 Days
11. Factories Department Approval of Building Plans 7 DaysFactory Licence 7 Days
12. Town & Country Planning Dept. Approval of Building Plans 7 Days13. HMDA and KUDA Change of Land Use 30 Days
Approval of the Building Plans 14 Days
17
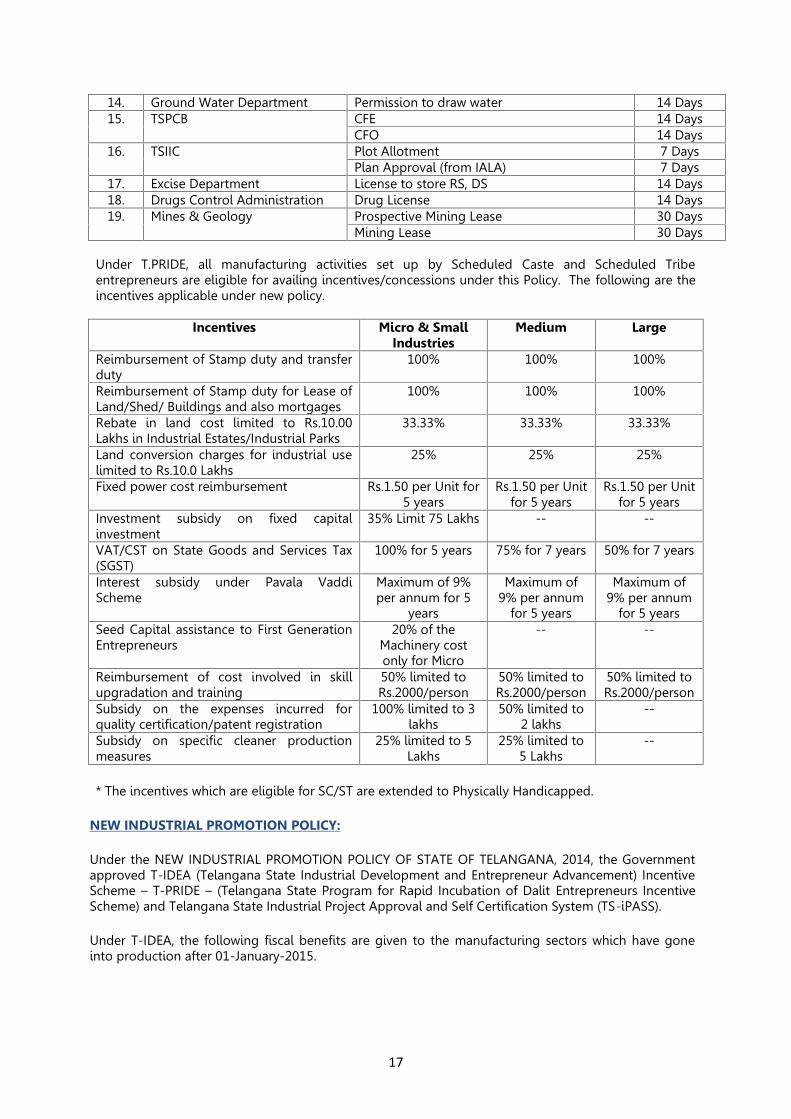
14. Ground Water Department Permission to draw water 14 Days15. TSPCB CFE 14 Days
CFO 14 Days16. TSIIC Plot Allotment 7 Days
Plan Approval (from IALA) 7 Days17. Excise Department License to store RS, DS 14 Days18. Drugs Control Administration Drug License 14 Days19. Mines & Geology Prospective Mining Lease 30 Days
Mining Lease 30 Days
Under T.PRIDE, all manufacturing activities set up by Scheduled Caste and Scheduled Tribeentrepreneurs are eligible for availing incentives/concessions under this Policy. The following are theincentives applicable under new policy.
Incentives Micro & SmallIndustries
Medium Large
Reimbursement of Stamp duty and transferduty
100% 100% 100%
Reimbursement of Stamp duty for Lease ofLand/Shed/ Buildings and also mortgages
100% 100% 100%
Rebate in land cost limited to Rs.10.00Lakhs in Industrial Estates/Industrial Parks
33.33% 33.33% 33.33%
Land conversion charges for industrial uselimited to Rs.10.0 Lakhs
25% 25% 25%
Fixed power cost reimbursement Rs.1.50 per Unit for5 years
Rs.1.50 per Unitfor 5 years
Rs.1.50 per Unitfor 5 years
Investment subsidy on fixed capitalinvestment
35% Limit 75 Lakhs -- --
VAT/CST on State Goods and Services Tax(SGST)
100% for 5 years 75% for 7 years 50% for 7 years
Interest subsidy under Pavala VaddiScheme
Maximum of 9%per annum for 5
years
Maximum of9% per annum
for 5 years
Maximum of9% per annum
for 5 yearsSeed Capital assistance to First GenerationEntrepreneurs
20% of theMachinery costonly for Micro
-- --
Reimbursement of cost involved in skillupgradation and training
50% limited toRs.2000/person
50% limited toRs.2000/person
50% limited toRs.2000/person
Subsidy on the expenses incurred forquality certification/patent registration
100% limited to 3lakhs
50% limited to2 lakhs
--
Subsidy on specific cleaner productionmeasures
25% limited to 5Lakhs
25% limited to5 Lakhs
--
* The incentives which are eligible for SC/ST are extended to Physically Handicapped.
NEW INDUSTRIAL PROMOTION POLICY:
Under the NEW INDUSTRIAL PROMOTION POLICY OF STATE OF TELANGANA, 2014, the Governmentapproved T-IDEA (Telangana State Industrial Development and Entrepreneur Advancement) IncentiveScheme – T-PRIDE – (Telangana State Program for Rapid Incubation of Dalit Entrepreneurs IncentiveScheme) and Telangana State Industrial Project Approval and Self Certification System (TS-iPASS).
Under T-IDEA, the following fiscal benefits are given to the manufacturing sectors which have goneinto production after 01-January-2015.
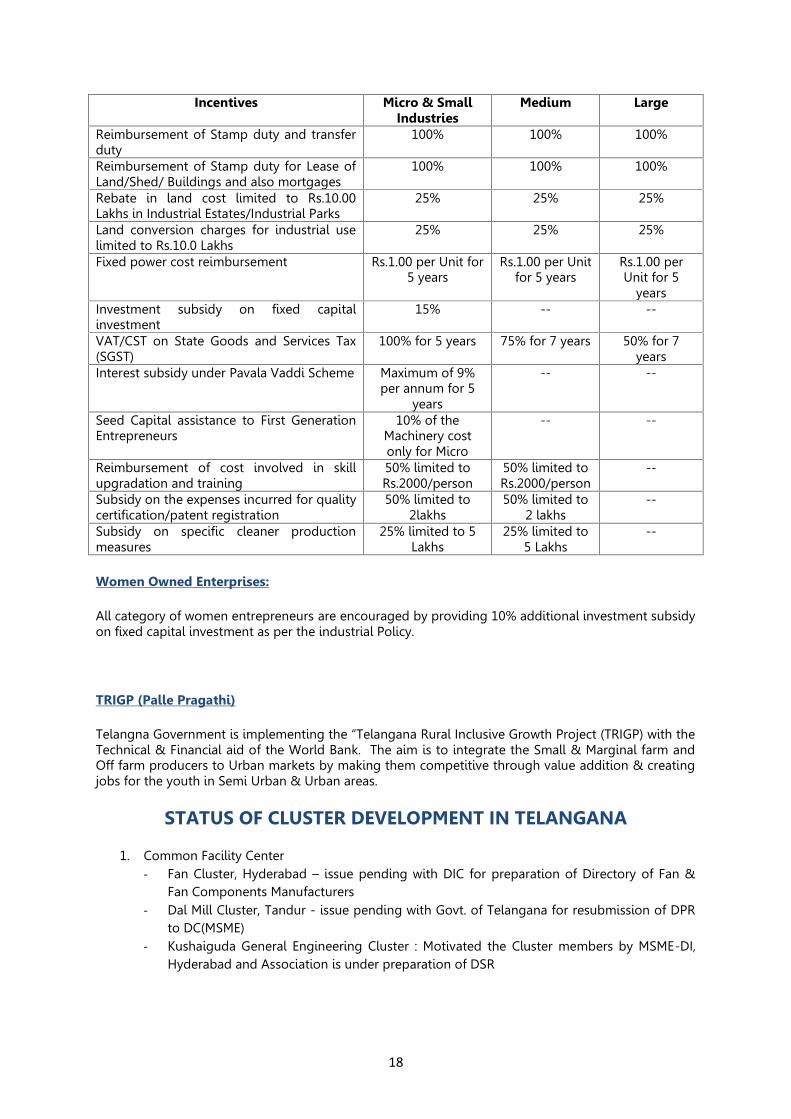
18
Incentives Micro & SmallIndustries
Medium Large
Reimbursement of Stamp duty and transferduty
100% 100% 100%
Reimbursement of Stamp duty for Lease ofLand/Shed/ Buildings and also mortgages
100% 100% 100%
Rebate in land cost limited to Rs.10.00Lakhs in Industrial Estates/Industrial Parks
25% 25% 25%
Land conversion charges for industrial uselimited to Rs.10.0 Lakhs
25% 25% 25%
Fixed power cost reimbursement Rs.1.00 per Unit for5 years
Rs.1.00 per Unitfor 5 years
Rs.1.00 perUnit for 5
yearsInvestment subsidy on fixed capitalinvestment
15% -- --
VAT/CST on State Goods and Services Tax(SGST)
100% for 5 years 75% for 7 years 50% for 7years
Interest subsidy under Pavala Vaddi Scheme Maximum of 9%per annum for 5
years
-- --
Seed Capital assistance to First GenerationEntrepreneurs
10% of theMachinery costonly for Micro
-- --
Reimbursement of cost involved in skillupgradation and training
50% limited toRs.2000/person
50% limited toRs.2000/person
--
Subsidy on the expenses incurred for qualitycertification/patent registration
50% limited to2lakhs
50% limited to2 lakhs
--
Subsidy on specific cleaner productionmeasures
25% limited to 5Lakhs
25% limited to5 Lakhs
--
Women Owned Enterprises:
All category of women entrepreneurs are encouraged by providing 10% additional investment subsidyon fixed capital investment as per the industrial Policy.
TRIGP (Palle Pragathi)
Telangna Government is implementing the “Telangana Rural Inclusive Growth Project (TRIGP) with theTechnical & Financial aid of the World Bank. The aim is to integrate the Small & Marginal farm andOff farm producers to Urban markets by making them competitive through value addition & creatingjobs for the youth in Semi Urban & Urban areas.
STATUS OF CLUSTER DEVELOPMENT IN TELANGANA
1. Common Facility Center- Fan Cluster, Hyderabad – issue pending with DIC for preparation of Directory of Fan &
Fan Components Manufacturers- Dal Mill Cluster, Tandur - issue pending with Govt. of Telangana for resubmission of DPR
to DC(MSME)- Kushaiguda General Engineering Cluster : Motivated the Cluster members by MSME-DI,
Hyderabad and Association is under preparation of DSR
19
2. Soft Interventions
Implementing Agency for DSRs : TPC Ltd., Hyderabad
Approval for conducting DSR
- Granite Processing Cluster, Bauvpet (V), Karimnagar- Rice Mill Cluster, Miryalguda, Nalgonda dist.- Granite Cluster, Khammam- Cotton Ginning Cluster, Adilabad- Rice Milling Cluster, Nizamabad- Brass Metal Cluster, Pembarthy, Warangal Dist. – Application submitted to DC(MSME) for
DSR approval.
INFRASTRUCTURE DEVELOPMENT PROJECTS
a) Madikonda Industrial Estate at Madikonda, Warangal dist. –
Total project cost –Rs. 1061.19 ; GoI Grant – Rs.735.60. Out of which first instalment released- Rs. 2crores; Implementing Agency – TSIIC – Utilisation Certificate submitted to DC(MSME), New Delhi
b) Automotive Engineering Cluster for Toopran Mandal, Medak dist.-
Total cost –Rs.940.82; GoI Grant – Rs.752.65; Out of which first instalment released – Rs.62.88 Lakhs
c) New Food Park Cluster, Buggapadu, Khammam District – Awaiting for online application forforwarding DPR to DC(MSME) for inprinciple approval
d) Geetha Nagar Navjeevan Nagar Micro Industrial Association prepared the DSR & DPR for IDProject and also acquired 44.09 guntas at Ravalkole (V), Medchal, Ranga Reddy District.Awaiting for online application for forwarding the DPR to DC(MSME) for inprinciple approval.
20
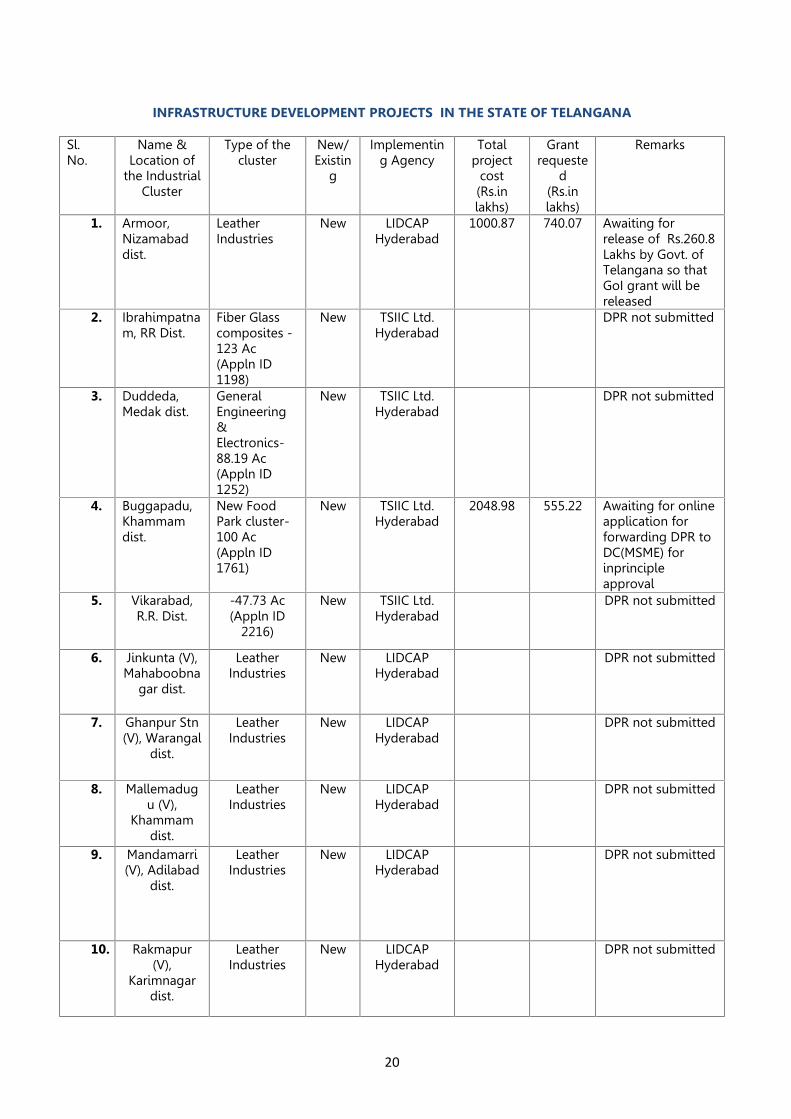
INFRASTRUCTURE DEVELOPMENT PROJECTS IN THE STATE OF TELANGANA
Sl.No.
Name &Location of
the IndustrialCluster
Type of thecluster
New/Existin
g
Implementing Agency
Totalproject
cost(Rs.inlakhs)
Grantrequeste
d(Rs.inlakhs)
Remarks
1. Armoor,Nizamabaddist.
LeatherIndustries
New LIDCAPHyderabad
1000.87 740.07 Awaiting forrelease of Rs.260.8Lakhs by Govt. ofTelangana so thatGoI grant will bereleased
2. Ibrahimpatnam, RR Dist.
Fiber Glasscomposites -123 Ac(Appln ID1198)
New TSIIC Ltd.Hyderabad
DPR not submitted
3. Duddeda,Medak dist.
GeneralEngineering&Electronics-88.19 Ac(Appln ID1252)
New TSIIC Ltd.Hyderabad
DPR not submitted
4. Buggapadu,Khammamdist.
New FoodPark cluster-100 Ac(Appln ID1761)
New TSIIC Ltd.Hyderabad
2048.98 555.22 Awaiting for onlineapplication forforwarding DPR toDC(MSME) forinprincipleapproval
5. Vikarabad,R.R. Dist.
-47.73 Ac(Appln ID
2216)
New TSIIC Ltd.Hyderabad
DPR not submitted
6. Jinkunta (V),Mahaboobna
gar dist.
LeatherIndustries
New LIDCAPHyderabad
DPR not submitted
7. Ghanpur Stn(V), Warangal
dist.
LeatherIndustries
New LIDCAPHyderabad
DPR not submitted
8. Mallemadugu (V),
Khammamdist.
LeatherIndustries
New LIDCAPHyderabad
DPR not submitted
9. Mandamarri(V), Adilabad
dist.
LeatherIndustries
New LIDCAPHyderabad
DPR not submitted
10. Rakmapur(V),
Karimnagardist.
LeatherIndustries
New LIDCAPHyderabad
DPR not submitted
21
10.MiningTelangana region has rich natural resources. About 20 per cent of the country‟s coal
deposits in the country are also found here. The Singareni Collieries Company Limited excavates coal
from these mines for industrial needs and to cater thermal power stations. Telangana is also rich in
limestone deposits that cater to cement factories. Telangana has other mineral resources like bauxite and
mica.
Minerals and mineral industries have significant macro links with the economy of a country. Mining
activity generates employment opportunities; is obviously an important source of tax revenue and
contributes to state income thereby leading to economic growth.
Mining is one of the core sectors that drive growth in an economy. Not only does it contribute to
GDP, it also acts as a catalyst for the growth of other core industries like power, steel, cement, etc.,
which, in turn, are critical for the overall development of the economy.
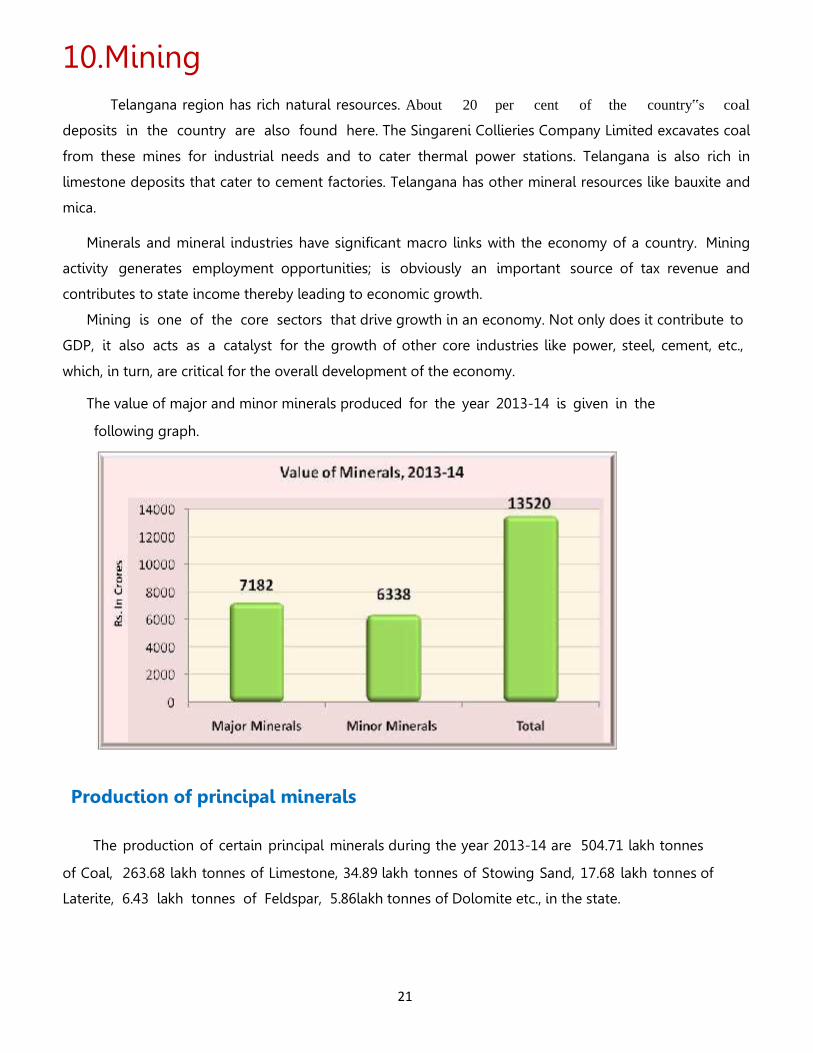
The value of major and minor minerals produced for the year 2013-14 is given in the
following graph.
Production of principal minerals
The production of certain principal minerals during the year 2013-14 are 504.71 lakh tonnes
of Coal, 263.68 lakh tonnes of Limestone, 34.89 lakh tonnes of Stowing Sand, 17.68 lakh tonnes of
Laterite, 6.43 lakh tonnes of Feldspar, 5.86lakh tonnes of Dolomite etc., in the state.
22
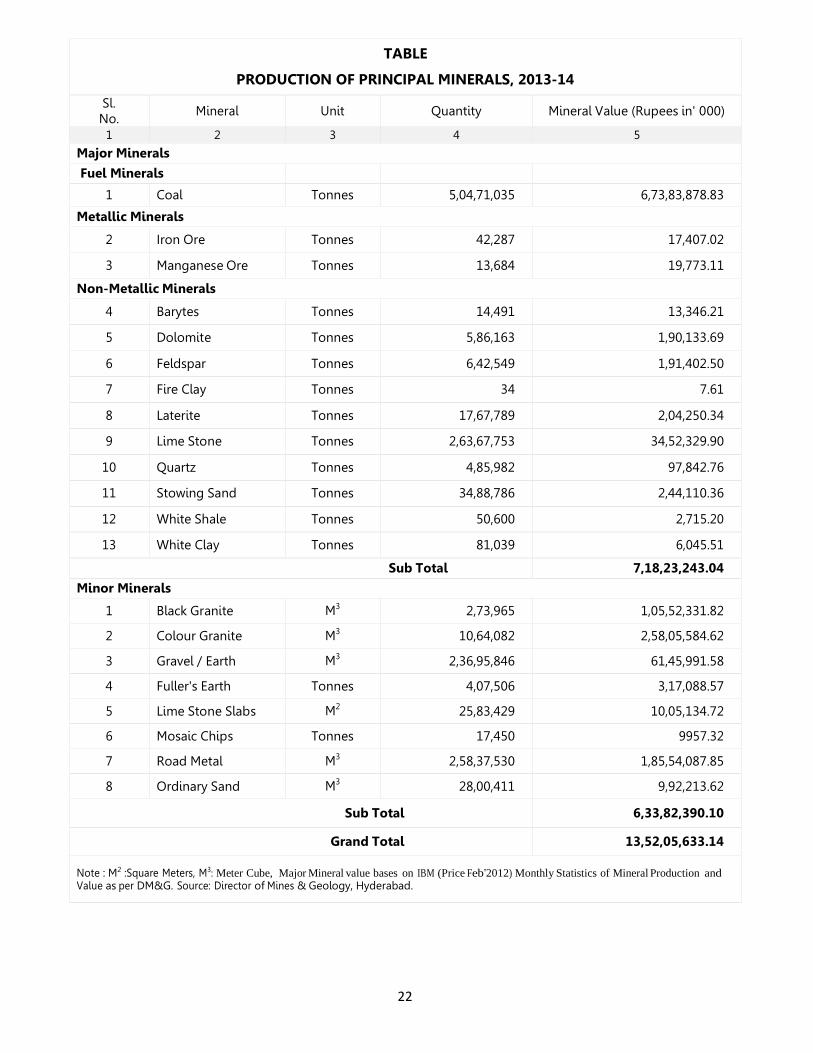
TABLE
PRODUCTION OF PRINCIPAL MINERALS, 2013-14
Sl.No.
Mineral Unit Quantity Mineral Value (Rupees in' 000)
1 2 3 4 5
Major Minerals
Fuel Minerals
1 Coal Tonnes 5,04,71,035 6,73,83,878.83
Metallic Minerals
2 Iron Ore Tonnes 42,287 17,407.02
3 Manganese Ore Tonnes 13,684 19,773.11
Non-Metallic Minerals
4 Barytes Tonnes 14,491 13,346.21
5 Dolomite Tonnes 5,86,163 1,90,133.69
6 Feldspar Tonnes 6,42,549 1,91,402.50
7 Fire Clay Tonnes 34 7.61
8 Laterite Tonnes 17,67,789 2,04,250.34
9 Lime Stone Tonnes 2,63,67,753 34,52,329.90
10 Quartz Tonnes 4,85,982 97,842.76
11 Stowing Sand Tonnes 34,88,786 2,44,110.36
12 White Shale Tonnes 50,600 2,715.20
13 White Clay Tonnes 81,039 6,045.51
Sub Total 7,18,23,243.04
Minor Minerals
1 Black Granite M3 2,73,965 1,05,52,331.82
2 Colour Granite M3 10,64,082 2,58,05,584.62
3 Gravel / Earth M3 2,36,95,846 61,45,991.58
4 Fuller's Earth Tonnes 4,07,506 3,17,088.57
5 Lime Stone Slabs M2 25,83,429 10,05,134.72
6 Mosaic Chips Tonnes 17,450 9957.32
7 Road Metal M3 2,58,37,530 1,85,54,087.85
8 Ordinary Sand M3 28,00,411 9,92,213.62
Sub Total 6,33,82,390.10
Grand Total 13,52,05,633.14
Note : M2 :Square Meters, M3: Meter Cube, Major Mineral value bases on IBM (Price Feb‟2012) Monthly Statistics of Mineral Production andValue as per DM&G. Source: Director of Mines & Geology, Hyderabad.
23
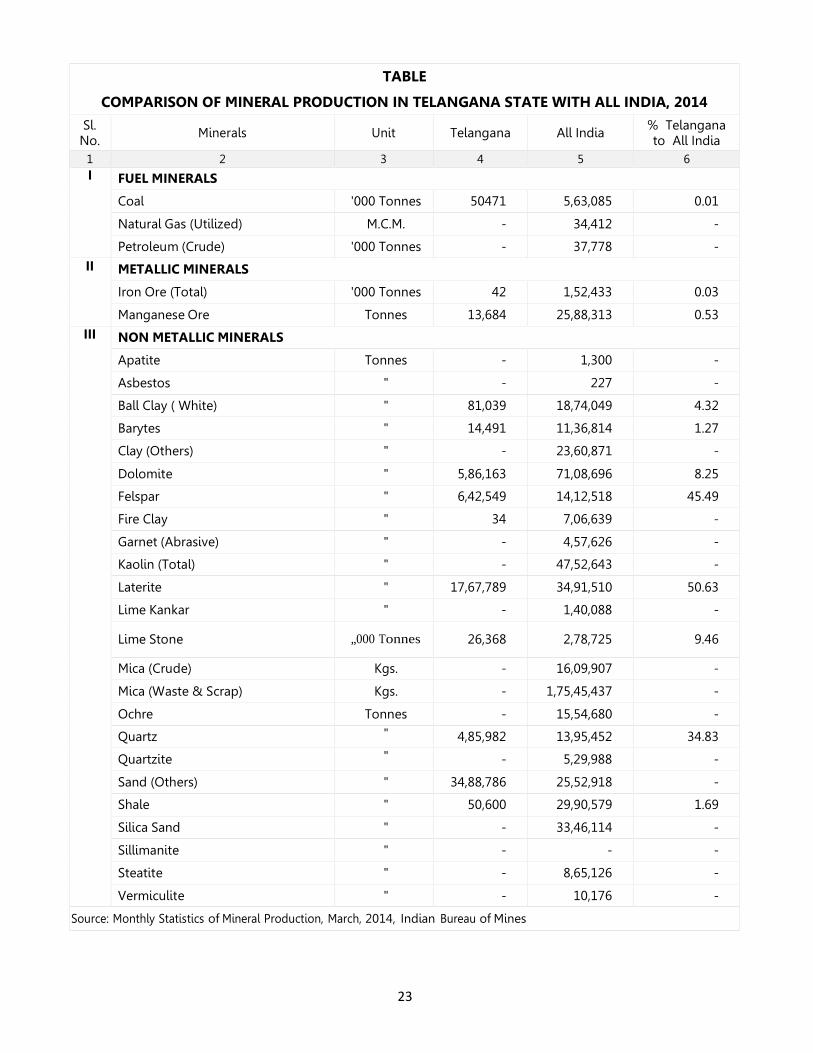
TABLE
COMPARISON OF MINERAL PRODUCTION IN TELANGANA STATE WITH ALL INDIA, 2014
Sl.No.
Minerals Unit Telangana All India % Telanganato All India
1 2 3 4 5 6I FUEL MINERALS
Coal '000 Tonnes 50471 5,63,085 0.01
Natural Gas (Utilized) M.C.M. - 34,412 -
Petroleum (Crude) '000 Tonnes - 37,778 -
II METALLIC MINERALS
Iron Ore (Total) '000 Tonnes 42 1,52,433 0.03
Manganese Ore Tonnes 13,684 25,88,313 0.53
III NON METALLIC MINERALS
Apatite Tonnes - 1,300 -
Asbestos " - 227 -
Ball Clay ( White) " 81,039 18,74,049 4.32
Barytes " 14,491 11,36,814 1.27
Clay (Others) " - 23,60,871 -
Dolomite " 5,86,163 71,08,696 8.25
Felspar " 6,42,549 14,12,518 45.49
Fire Clay " 34 7,06,639 -
Garnet (Abrasive) " - 4,57,626 -
Kaolin (Total) " - 47,52,643 -
Laterite " 17,67,789 34,91,510 50.63
Lime Kankar " - 1,40,088 -
Lime Stone „000 Tonnes 26,368 2,78,725 9.46
Mica (Crude) Kgs. - 16,09,907 -
Mica (Waste & Scrap) Kgs. - 1,75,45,437 -
Ochre Tonnes - 15,54,680 -
Quartz " 4,85,982 13,95,452 34.83
Quartzite " - 5,29,988 -
Sand (Others) " 34,88,786 25,52,918 -
Shale " 50,600 29,90,579 1.69
Silica Sand " - 33,46,114 -
Sillimanite " - - -
Steatite " - 8,65,126 -
Vermiculite " - 10,176 -
Source: Monthly Statistics of Mineral Production, March, 2014, Indian Bureau of Mines
24
11.InfrastructureTSIIC (Telangana State Industrial Infrastructure Corporation) also known as TSIIC is a Telangana State
Government initiative for providing infrastructure through development of industrial areas.
TSIIC was established in the year 2014 for identifying and developing potential growth centers in the
Telangana State fully equipped with developed plots/sheds, roads, drainage, water, power and other
infrastructural facilities; providing social infrastructure, like housing for workers near industrial zones, co-
coordinating with the agencies concerned for providing communication, transport and other facilities.
The Corporation also has active projects in the Public-Private Partnership Mode.
Telangana Industrial Parks
The Industrial Areas ranges from 15 acres to 2500 acres. The Corporation has presence in each and
every Mandal Head Quarters of the District. A large number of leading industrial houses have their
presence in these Industrial Areas. Some of them are BPL Engg., Kirby Building Products, Asian Paints,
GVK, ITW Signode, Aurobindo Pharma, Widia India, Raasi Refractories, Lanco Kondapally Power
Corporation, and BSES Andhra Power etc.
INDUSTRIAL AREA LOCAL AUTHORITY(IALA)IN THE INDUSTRIAL PARK
In order to enable effective maintenance of civic services in Industrial Parks, the Government has
empowered APIIC Industrial Parks with Local Authority status duly amending the Acts under section 147
of APPR Act 1994, u/s 389-B of AP Municipalities Act, 1965 and u/s 679-F of Hyderabad Municipal
Corporation Act, 1955 in the year 1994.
Accordingly, the Government have been notifying TSIIC-Industrial Areas falling under
Municipalities, Municipal Corporations and Gram Panchayats from time to time directing the TSIIC Ltd., to
exercise/perform certain statutory powers/functions such as assessment, levy and collection of Property
taxes/Advertisement tax, sanction of Building permits, removal of encroachments, management and
maintenance of Civic Services in the Industrial Areas, subject to the condition that TSIIC Ltd., shall remit
35% (50% in case of Cyberabad) of the Property tax/Revenues collected to the Local Bodies concerned.
Thus, TSIIC is exercising/performing the statutory powers/functions of the Local Bodies with effect
from 01-10-1994 onwards in 116 Nos. Industrial Areas (Phase wise)/Mini Industrial Estates/Commercial
Complexes falling under Municipalities, Municipal Corporations and Gram Panchayats in the State,
through its officers nominated as Executive Authority under the relevant Acts.
To promote “Local Self-Governance” of the Industrial Areas, TSIIC has evolved the concept of
Industrial Areas Service Societies involving the tax payers community in the notified Industrial Areas in the
Management/Maintenance of Industrial Areas. The Service Societies registered under the Telangana
Public Societies Registration Act, 1350F and the Societies Registration Act, 1860 and AP Societies
Registration Act, 2001 have been nominated by TSIIC as its Nodal Agencies to assist in collection of
Property taxes and maintenance of civic Services in the Industrial Areas. They participate in all decisions
25
which concern them in order to coordinate the functioning of the IALA, in different development activities
within the IALA area and also to bring transparency in the working of the IALAs.
Thus the TSIIC has nominated 44 Nos. of Service Societies as Nodal Agencies to TSIIC Ltd., in respect of 86
Industrial Parks, out of which 116 areas notified by Government.
The experience of industrial units that are located in the existing IALAs has universally been very
positive. In numerous interactions with them, they have expressed extreme satisfaction with the services
they receive through the IALAs.
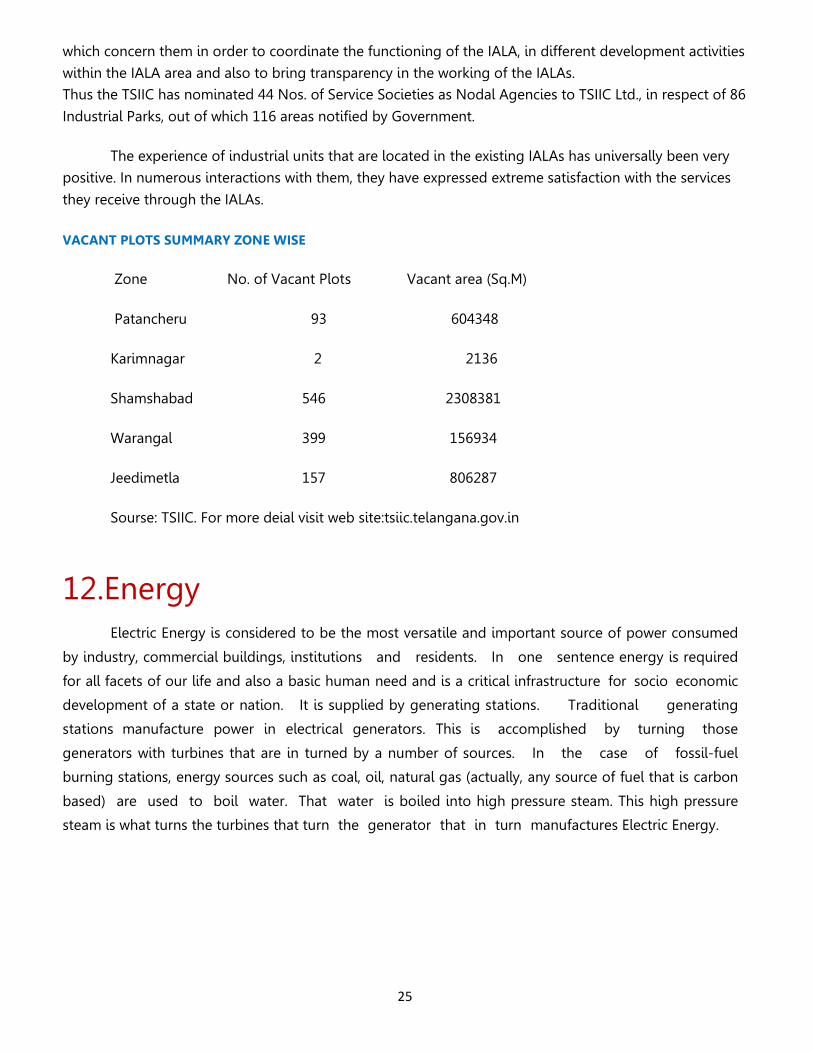
VACANT PLOTS SUMMARY ZONE WISE
Zone No. of Vacant Plots Vacant area (Sq.M)
Patancheru 93 604348
Karimnagar 2 2136
Shamshabad 546 2308381
Warangal 399 156934
Jeedimetla 157 806287
Sourse: TSIIC. For more deial visit web site:tsiic.telangana.gov.in
12.EnergyElectric Energy is considered to be the most versatile and important source of power consumed
by industry, commercial buildings, institutions and residents. In one sentence energy is required
for all facets of our life and also a basic human need and is a critical infrastructure for socio economic
development of a state or nation. It is supplied by generating stations. Traditional generating
stations manufacture power in electrical generators. This is accomplished by turning those
generators with turbines that are in turned by a number of sources. In the case of fossil-fuel
burning stations, energy sources such as coal, oil, natural gas (actually, any source of fuel that is carbon
based) are used to boil water. That water is boiled into high pressure steam. This high pressure
steam is what turns the turbines that turn the generator that in turn manufactures Electric Energy.
26
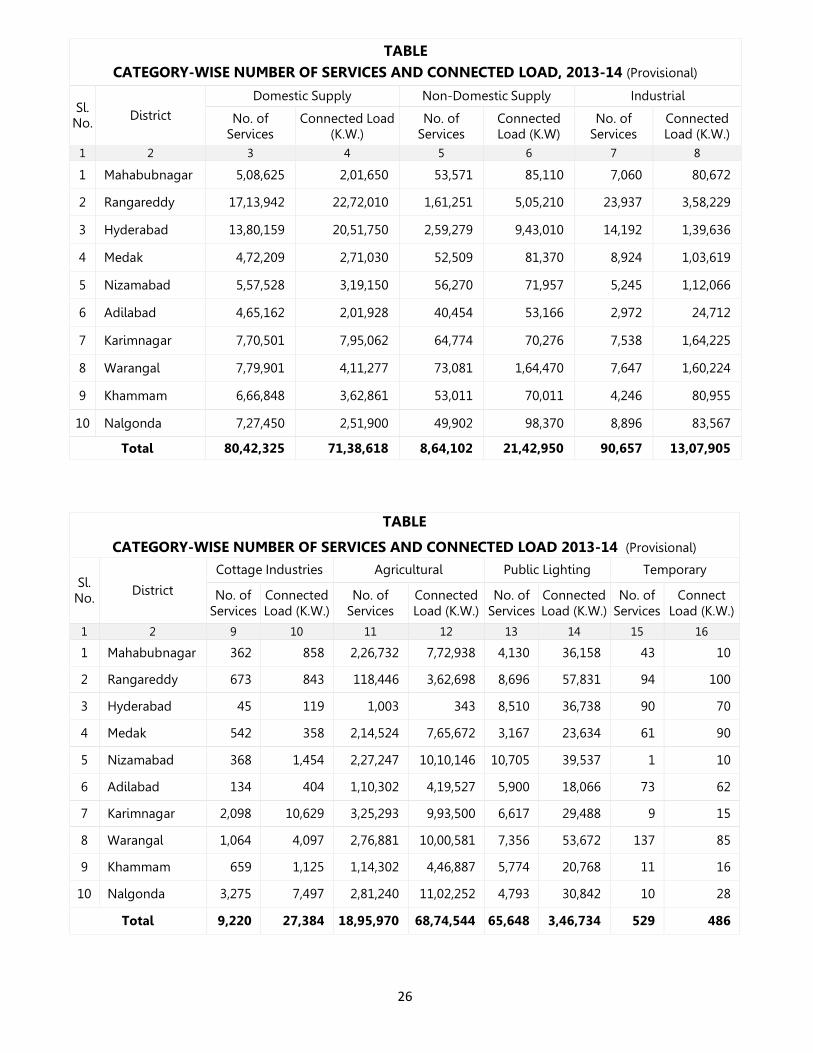
TABLECATEGORY-WISE NUMBER OF SERVICES AND CONNECTED LOAD, 2013-14 (Provisional)
Sl.No. District
Domestic Supply Non-Domestic Supply Industrial
No. ofServices
Connected Load(K.W.)
No. ofServices
ConnectedLoad (K.W)
No. ofServices
ConnectedLoad (K.W.)
1 2 3 4 5 6 7 8
1 Mahabubnagar 5,08,625 2,01,650 53,571 85,110 7,060 80,672
2 Rangareddy 17,13,942 22,72,010 1,61,251 5,05,210 23,937 3,58,229
3 Hyderabad 13,80,159 20,51,750 2,59,279 9,43,010 14,192 1,39,636
4 Medak 4,72,209 2,71,030 52,509 81,370 8,924 1,03,619
5 Nizamabad 5,57,528 3,19,150 56,270 71,957 5,245 1,12,066
6 Adilabad 4,65,162 2,01,928 40,454 53,166 2,972 24,712
7 Karimnagar 7,70,501 7,95,062 64,774 70,276 7,538 1,64,225
8 Warangal 7,79,901 4,11,277 73,081 1,64,470 7,647 1,60,224
9 Khammam 6,66,848 3,62,861 53,011 70,011 4,246 80,955
10 Nalgonda 7,27,450 2,51,900 49,902 98,370 8,896 83,567
Total 80,42,325 71,38,618 8,64,102 21,42,950 90,657 13,07,905
TABLE
CATEGORY-WISE NUMBER OF SERVICES AND CONNECTED LOAD 2013-14 (Provisional)
Sl.No.
District
Cottage Industries Agricultural Public Lighting Temporary
No. ofServices
ConnectedLoad (K.W.)
No. ofServices
ConnectedLoad (K.W.)
No. ofServices
ConnectedLoad (K.W.)
No. ofServices
ConnectLoad (K.W.)
1 2 9 10 11 12 13 14 15 16
1 Mahabubnagar 362 858 2,26,732 7,72,938 4,130 36,158 43 10
2 Rangareddy 673 843 118,446 3,62,698 8,696 57,831 94 100
3 Hyderabad 45 119 1,003 343 8,510 36,738 90 70
4 Medak 542 358 2,14,524 7,65,672 3,167 23,634 61 90
5 Nizamabad 368 1,454 2,27,247 10,10,146 10,705 39,537 1 10
6 Adilabad 134 404 1,10,302 4,19,527 5,900 18,066 73 62
7 Karimnagar 2,098 10,629 3,25,293 9,93,500 6,617 29,488 9 15
8 Warangal 1,064 4,097 2,76,881 10,00,581 7,356 53,672 137 85
9 Khammam 659 1,125 1,14,302 4,46,887 5,774 20,768 11 16
10 Nalgonda 3,275 7,497 2,81,240 11,02,252 4,793 30,842 10 28
Total 9,220 27,384 18,95,970 68,74,544 65,648 3,46,734 529 486
27
13.Transport and CommunicationsRoads
Availability of the transport road network plays an important role in the economic development
and, therefore, the kilometerage of paved roads existing in a country is often used as an index to
assess the extent of its develop- ment. The proper development of the transport road network not only
reduces the cost of transportation, both in terms of money and time, but also helps in the integration
of various parts of the state or country. The transport road network contributes to the development of
the state by bringing in direct benefits in the development of some sectors, such as agriculture,
industry, minerals and commerce As such a systematic development of Roads is one of the important
pre-requisites for development and acceleration of economic growth.The importance is much more in a
State like Telangana whose economy is from service sector and has chosen manufacturing as its future,
where the rail connectivity is poor and where the rural areas are hardly covered by the rail
network.
Among the different modes of domestic transport systems, road transport carries more than
80% of the goods and passenger traffic. The network of roads, particularly from rural to urban
facilitates speedy movement of goods and services and ensures higher growth trends, social integrity
and wellbeing of the society. The productivity and efficiency of Road transport is directly linked with the
availability and quality of Road network.
RailwaysIndian Railways have a history and rich heritage spanning over 150 years. Indian Railways is a
state owned public utility of Government of India under the Ministry of Railways. As a national common
carrier transporting passenger and goods over vast network of 65,436 kms., route lengths and it has been
playing a key role in countrys “ as well as states‟ social and economic development. It is a cheap and
affordable means of transportation for millions of passengers. As a carrier of bulk freight namely ores
and minerals, iron and steel, Cement, mineral oils, food grains, fertilizers etc., and the importance of Indian
Railways for development of Agriculture, Industry and for the benefit of common men is well recognized.
As on 31.03.2014, the Indian railways are rendering its services by establishing 228 railway
stations with a route kilometerage of 1753 in the state.
Transport:
Road Transport plays a prominent role in the economic development of the State. The Transport
Department plays a key role in issuing driving licences, registration of motor vehicles, issue of transport
permits, levy and collection of motor vehicle tax, enforcement of vehicle violations and acts as nodal
agency for road safety. During the year 2013-14, the State has registry of more than 71.94 lakh
vehicles, of which 8.22 lakh are transport vehicles, 63.68 are non-transport vehicles. Out of the
total vehicles,52.84 lakh are two wheelers.
28
14.Education
Education in its general sense is a form of learning in which the knowledge, skills, values, beliefs
and habits of a group of people are transferred from one generation to the next through story telling,
discussion, teaching, training, or research. Education may also include informal transmission of
such information from one human being to another through a set of instructions in the process of making
them educated about the society, surroundings, environment etc.
Telangana state has multiple institutes of higher education universities along withnumerous
primary and secondary schools. The state is home to a number of institutes, which impart higher
education. The higher education includes many colleges, universities and research institutes providing
professional education in the fields of arts, humanities, science, engineer- ing, law, medicine, pharmacy,
business, and veterinary sciences, with undergraduate and post-graduation. These institutions are
producing lakhs of professional scholars, every year who in turn give direction to the state in
transforming its objectives into reality. There is a saying that today‟s children are tomorrow‟s citizens
and the future of the state would be as directed by them.
Junior Colleges
All put together, there are 3,007 Junior Colleges functioning during the year 2013-14 in the
state. The number of students enrolled are 4,15,026 consisting of 2,09,939 boys and 2,05,087
girls and a total of 26,333 lecturers are imparting education in these colleges.
Degree Colleges
There are 171 Degree Colleges are functioning in the state with enrolment 1,47,564 students,
consisting of 75,351 Men and 72,213 Women 4,211 Lecturers are imparting education in these
colleges.
Engineering Colleges
Engineering colleges are primarily estab- lished to produce engineers and technicians with
technical knowledge and adequate skills with an objective to meet the technical skills
requirements as per the needs of the industry There are about 350 engineering colleges in the State
with a total intake of 1,71,679 students. Apart from engineering, there are 195 polytechnic colleges
are functioning with strength of 45,250 students, during 2013-14.
29
15.BanksAn Institution, such as the banking system, which touches and should touch the lives of
millions, has necessarily to be inspired by a larger social purpose and has to sub serve
national priorities and objectives. There are 4383 bank branches in the state as on 31-12-2014,
including nationalized banks, foreign banks, regional rural banks and private banks. On an average one
bank branch is available for every (8) thousand population in the state. Their credit-deposit ratio is
94.01%.
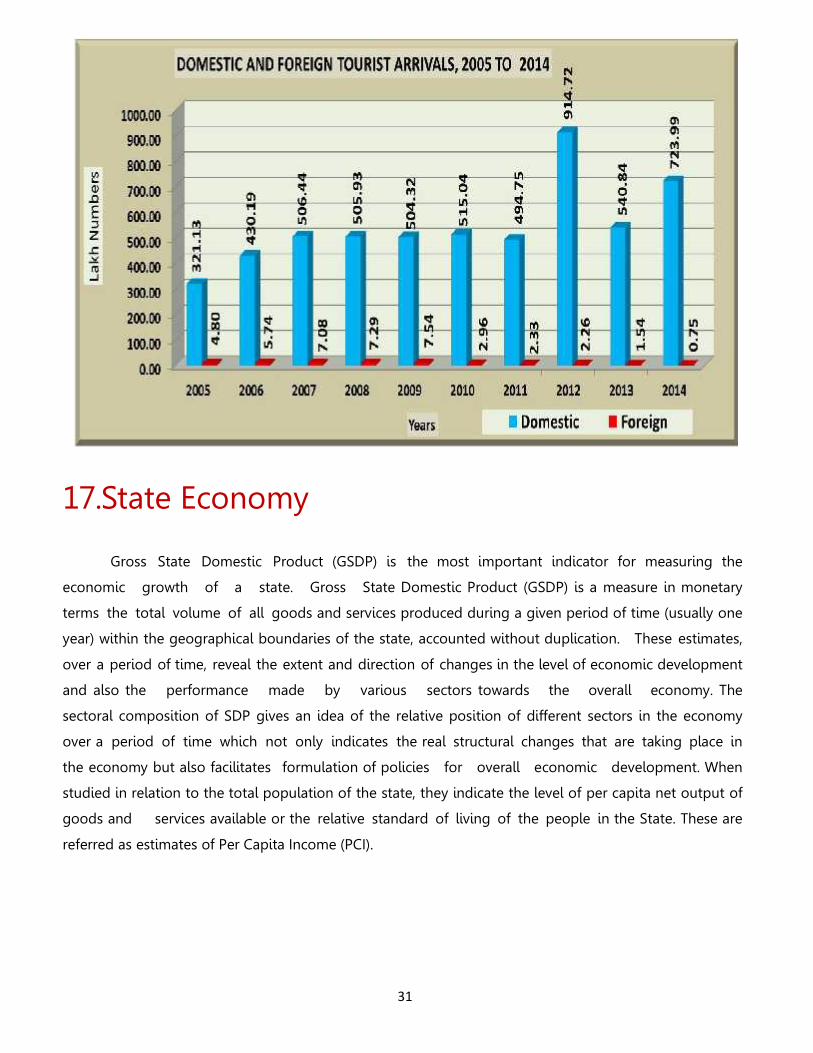
16.Tourism
The tourism in the present day, has become increasingly significant and organized (industry) as more
and more people with increased disposable income, higher propensity to spend and changing social
mores trot cities and countries due to variety of reasons. Along with the evolution of tourism, its definition
has also formalized over the years and in the present parlance a visitor is considered to be a traveler
taking a trip to a main destination outside their usual environment, for less than a year, for any main
purpose (business, leisure or other personal purpose) other than to be employed by a resident entity
in the country or place visited A visitor (domestic, inbound or outbound) is classified as a tourist (or
overnight visitor), if his/her trip includes an overnight stay, or as a same-day visitor (or
excursionist) otherwise. A traveler on the other hand is someone who moves between different
geographic locations, for any purpose and any duration. The visitor is a particular type of traveller and
consequently tourism is a subset of travel. However, "Tourism" refers to all activities of visitors, including
both "tourists (over-night visitors)" and "same-day visitors".
In the context of Telangana, its culture combines cultural customs from Persian traditions
embedded during Moghuls, Qutub Shahis and Nizams rule with prominent and predominantly
south Indian traditions and customs. The State has a rich tradition in classical music. It has a rich
painting and folk arts such as Burrakatha, shadow puppet show, and Perini Shiva Tandavam, Gusadi
Dance, Kolatam etc. Telangana has a variety of tourist attractions including historical places,
monuments, forts, waterfalls, forests and temples. Lakhs of tourists, including foreign tourists visit
these tourist attractions every year and carrying their experiences, customs and traditions of Indian
heritage, sweet memories to their native states or countries
30
Rural TourismTelangana has a tremendous potential for Rural Tourism and is a fascinating canvas of myriad
colors, cultures and customs. Handicrafts represent, perhaps, the oldest traditions of living culture and
Telangana has some of the richest sources of handicrafts
Wildlife and Eco Tourism
Telangana has rich forests and wild life sanctuaries, which provide scope for eco-tourism and
wildlife tourism that cover Alisagar Deer park in Nizamabad, the Eturunagaram Sanctuary and Pakhal
Wildlife Sanctuary in Warangal, Kawal Wildlife Sanctuary, Jannaram, Pranahitha
Wildlife Sanctuary and Sivaram Wildlife Sanctuary in Adilabad, Mahavir Harina Vanasthali
National Park, Vansthalipuram and Nehru Zoological park in Hyderabad, Manjira Bird Sanctuary in
Sangareddy, and Pocharam Sanctuary in Medak, Shamirpet Deer Park in Rangareddy.
Heritage Tourism
Telangana is a historic land dotted with a number of forts, which have a potential to be developed
into classic heritage tourism sites. Some famous forts, where Tourism Department is taking up projects
to develop amenities for tourists are Golconda Fort, Medak Fort, Khammam Fort, Nizamabad Fort,
Elagandula Fort, Karimnagar and Bhongir Fort, Nalgonda. Warangal Fort and Golconda Fort also host
Sound and Light shows which take us back to a magnificient past. More shows of this kind will
highlight the rich heritage of Telangana. Telangana State Tourism Development Corporation (TSTDC)
organizes all the above tourist packages and also connects the neighboring States. TSTDC also
maintains Haritha Hotel chains, wayside amenities, river cruises and water fleet in different locations. Any
trip to Telangana State is incomplete without a taste of its cuisine, including the famous Hyderabadi
Biryani, Qubani-ka-Meetha, Haleem,Osmania Biscuits and Irani Chai.
Medical Tourism
Hyderabad has the potential to emerge as a global medical tourism hub, in view of the world class
treatment at affordable prices offered in the leading hospitals located in the city. Steps are being
taken to prepare a comprehensive plan for this purpose and to conduct road shows abroad. An
attempt is made in this chapter to present domestic and foreign tourists visited the state in the
following graphs and subsequent data tables.
31
17.State Economy
Gross State Domestic Product (GSDP) is the most important indicator for measuring the
economic growth of a state. Gross State Domestic Product (GSDP) is a measure in monetary
terms the total volume of all goods and services produced during a given period of time (usually one
year) within the geographical boundaries of the state, accounted without duplication. These estimates,
over a period of time, reveal the extent and direction of changes in the level of economic development
and also the performance made by various sectors towards the overall economy. The
sectoral composition of SDP gives an idea of the relative position of different sectors in the economy
over a period of time which not only indicates the real structural changes that are taking place in
the economy but also facilitates formulation of policies for overall economic development. When
studied in relation to the total population of the state, they indicate the level of per capita net output of
goods and services available or the relative standard of living of the people in the State. These are
referred as estimates of Per Capita Income (PCI).
32
Anticipated GSDP during 2014-15
The anticipated Gross State Domestic Product at constant (2004-05) prices for the year
2014-15 is estimated at Rs.2,17,432 crores, as against Rs.2,06,427 crores for 2013-14, reflecting a
growth of 5.3%. The state has recorded a growth rate of 4.1% in 2012-13, 4.8% in 2013-14, and it was
5.3% in 2014-15 at constant prices. The state GSDP at constant (2004-05) prices recorded double digit
growth from 2005-06 to 2008-09 and 2010-11, there after it is experiencing steep downward
trend in subsequent years with a low growth of 1.1% in 2009-10. The GSDP at current prices for
the year 2014-15 is estimated at Rs. 4,30,599 crores, as against Rs. 3,91,751 crores for 2013-14 with a
growth rate of 9.9%. GSDP of the State at Current and Constant (2004-05) prices are shown in
the graph given below.
Trends in Sectoral Growth
The growth rate of GSDP denotes the performance of a State‟s economy; while the performance
of each sector reflects the change in the magnitude and composition of GSDP of the State economy
over time. The change in the relative sectoral shares in GSDP manifests the structural change in the
overall economy. The economy has been broadly classified as Agricul- ture, Industry and Services.
The Agriculture Sector consists of agriculture, livestock, forestry and fisheries. The Industry Sector
contains mining and quarrying, manufacturing, electricity, gas and water supply and construction sectors.
The Services Sector consists of trade, hotels and restaurants; transport by other means and storage;
railways; communications; banking and insurance; real estate, ownership of dwellings and business
services; public administration and other services. The sectoral analysis reveals that during the year
2014-15, the growth rate of GSDP is highest in services sector with 9.7% followed by Industry sector
with a growth of 4.1% and agriculture sector expected a negative growth of (-) 10.3%. The growth
estimate of 5.3% would have been better, but for the negative growth of -10.3% recorded in agriculture
and allied sector, attributed mainly to the adverse seasonal conditions. Agriculture as such was
badly hit due to this and recorded negative growth of (-) 21.3%, which was partially compensated
by the positive growth trends in Livestock (6.5%), Forestry & Logging (2.7%) and Fisheries (11.4%).
Consequently, the contribution of Agriculture sector declined to 12.8% from 15.1% in the previous year.
The contribution of Industry sector is estimated to be 24.3% without much variation compared to the
past year and the Services sector is estimated to contribute a higher percent of 62.9%, as against
60.3% in 2013-14. The percentage contribution of various sectors of the GSDP at current and constant
(2004-05) prices for the year 2014-15 are as shown in the graph below.
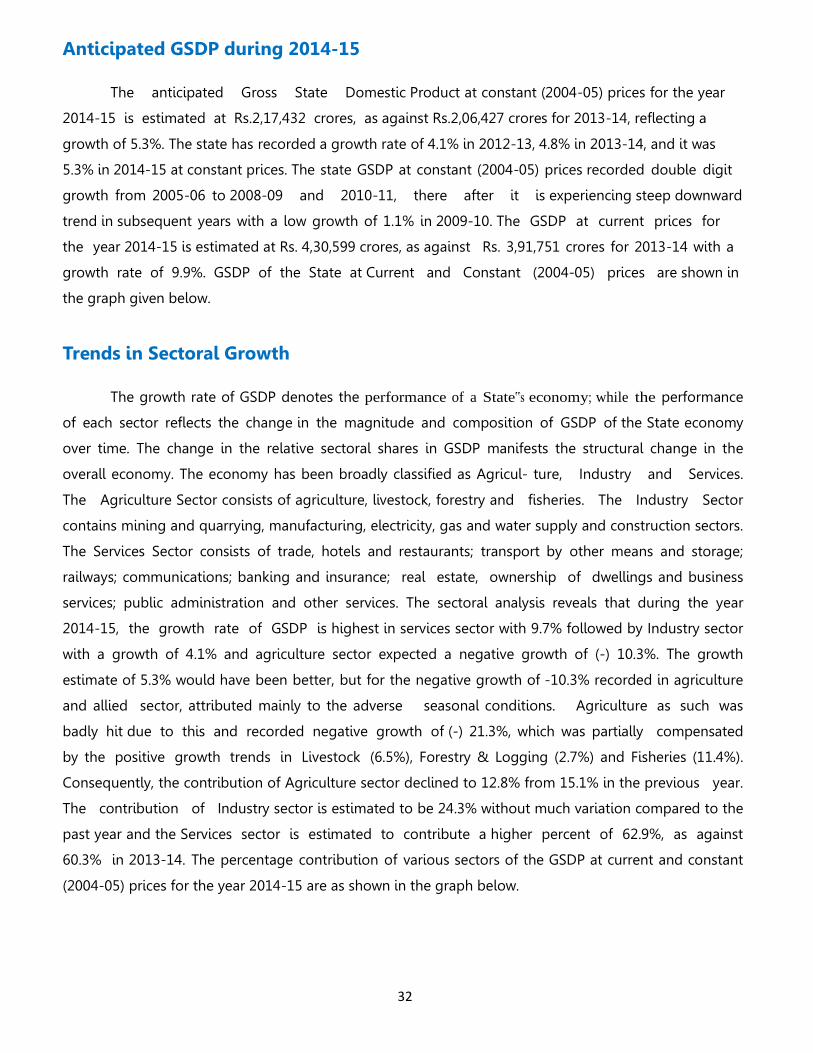
33
The structural composition of the state economy witnessed significant changes during the last
decade. During the period form 2005-06 to 2014-15, Agriculture sector recorded highest growth
rate of 25.2% in 2005-06, the Services sectors with 18.3% in 2010-11 and Industry sector with 17.1%
in 2006-07. Within the Agriculture sector, the only Livestock sector show positive growth rate, while
other three subsectors have registered a mixed growth over the years. Within the services sector,
transport by other means and storage; communications; banking and insurance; real estate, ownership of
dwellings and business services and other services, have registered a positive growth, while trade, hotels
and restaurants; railways and public administration have shown mixed growth over the years. Within the
industry sector also, all the sub-sectors have registered mixed trend of growth during the period
2005-06 to 2014-15.
Structure of the Economy
The composition of GSDP is changing significantly over the years. The Agriculture sector is
largely depending on the vagaries of seasonal conditions and receipt of rainfall. At current prices, the
share of Agriculture sector in GSDP is ranging from 16.5% and 20.6 percent during the period from
2005-06 to 2014-15. The State witnessed the falling share of agriculture sector in overall GSDP as well
as fluctuating trend of growth rates during last few years. Agriculture sector has been experiencing
a decelerating trend in the State in recent years, and its declining share in state GSDP is
consistent with normal development path of any economy. The decline in the share of agricultural
sector is almost compensated by the Services sector, which increased its share from 51% to 57%
during said period. The share of Industry sector is floating between 25% and 30% during the period
from 2004-05 to 2014-15. The sector wise shares of the GSDP at constant (2004-05) prices and current
prices is depicted in the following Chart.
34
Percapita Income:
The per capita income gives a better picture about the level of development in a State, which is
considered to be a proxy indicator for the standard of living of the people. As per the Advance Estimates
for 2014-15, the Per Capita Income of the State at current prices increased to Rs. 1,03,889, from Rs.
95,361 in 2013-14, registering a growth of 8.9%, which is higher than the National Per Capita
Income of Rs. 88,533. The Per Capita Income at constant (2004-05) prices has also gone up
from Rs. 48,881 in 2013-14 to Rs. 51,017 in 2014-15, registering a growth rate of 4.4%. The Per Capita
Income in the State has remained consistently higher than the National Per Capita Income throughout
the period from 2004-05 to 2014-15. The Per Capita Income of the state increased from about Rs.
24,409 in 2004-05 to Rs. 1,03,889 at current prices in 2014-15. In Telangana, six out of ten districts have
per capita income lower than the State Per Capita Income. The districts that have higher per capita
income than the state average are Hyderabad, Rangareddy, Medak and Khammam. This indicates
that economic growth is not evenly distributed but concentrated in and around urban areas in the
state.
--------*-------*-------*--------
35
13.
State
Economy