Embed Size (px)
Citation preview

I
I
1. R.port No. 2. Gov.rnlllent Acc ••• lon No.
FHWA/TX-85/45+357-1
... Titl. ond Subtitl.
A STUDY OF THE EFFECTS OF INTERFACE CONDITION ON THIN BONDED PCC OVERLAYS
7. Authorl.l
Kandiah Kai1asananthan, B. Frank McCullough, and D. W. Fowler 9. P.rforlllino Oroonizotion NOIII. ond Addr •••
TEl
II~fiiHir L0070S0
3.
: PAGE -
5. R.port Dot.
December 1984 6. P.rformino Oroonizotion Cod.
8. P.rforlllino Oroonizotion R.port No.
Research Report 357-1
10. Worlc Unit No.
11. Controct or Gront No. Center for Transportation Research The University of Texas at Austin Austin, Texas 78712-1075 Research Study 3-8-83-357
13. Typ. of R.port ond P.riod Cov.r.d ~~~---------------~---~~~--------------------------------------------~ 12. Spon.orino Ao.ncy NOIII. ond Addr ...
Texas State Department of Highways and Public Transportation; Transportation Planning Division
P. O. Box 5051 Austin, Texas 78763 IS. Suppl ..... ntory Not ..
Interim
14. Spon.orino Ao.ncy Cod.
Study conducted in cooperation with the U. S. Department of Transportation, Federal Highway Administration
Research Study Title: "Thin-Bonded Concrete Overlay" 16. Ab.troct
The purpose of this study was to verify the feasibility of using thin bonded PCC overlays and to evaluate their performance when exposed to traffic and environmental conditions in Houston.
Laboratory experiments were performed and a test section was constructed; cores were taken and analyzed to determine the correlation between laboratory findings and findings from the field, so as to arrive at useful conclusions that would enable the Texas State Department of Highways and Public Transportation to design overlays for future rehabilitation programs on CRCP.
17. K.y Word.
rigid pavement, PCC overlay, rehabilitation, resurfacing, factorial experiments
18. Oi.trlbutlon Stat_ent
No restrictions. This document is available to the public through the National Technical Information Service, Springfield, Virginia
19. S.curity Clo .. lf. (of thl. r.port) 20. Security CI ...... (of thi. p ... ) 21. No. of p.... 22. Pric.
Unclassified Unclassified 94
Form DOT F 1700.7 , .... ,

2
A STUDY OF THE EFFECTS OF INTERFACE CONDITION ON THIN BONDED PCC OVERLAYS
by
Kandiah Kailasananthan B. Frank McCullough
D. W. Fowler
Research Report Number 357-1
Thin-Bonded Concrete Overlay
Research Project 3-8-83-357
conducted for
Texas State Department of Highways and Public Transportation
in cooperation wit.h the U.S. Department of Transportation
Federal Highway Administration
by the
Center for Transportation Research Bureau of Engineering Research
The University of Texas at Austin
December 1984

The contents of this report reflect tne views of the autnors, who are
responsible for the facts and the accuracy of the data presented herein. The
contents do not necessarily reflect toe official views or policies of the
Federal Highway Administration. This report does not constitute a standard,
specification, or regulation.
ii
•
PREFACE
This is the first report produced under Research Study 357, "Thin Bonded
Concrete Overlay." The long range goal of this project is to assist the
Texas State Department of Highways and Public Transportation in establishing
criteria for adopting thin bonded concrete overlay for rehabilitating
distressed but structurally satisfactory concrete pavements and in developing
construction specifications and design procedures for thin bonded concrete
overlays with various alternative materials.
This report presents the results of a series of laboratory tests and
tests on field cores from a recently completed thin bonded concrete overlay
project in Houston.
The research approach was to construct test slabs in the laboratory, to
simulate field slabs and field conditions and test the sample cores for
in terface bond strength, and bond between reinforc ing steel bar sand
concrete. Interface bond strength was also tested on sample cores from the
fied slab.
Many persons have contributed significantly to this work, and the
authors are grateful to them all. Special mention needs to be made of Mr. W.
V. Ward and the Houston Urban Office staff, who provided assistance through
all stages of this study. Thanks are also due to Mr. Jim Long, Mr. Jeff
Kessel and Mr. Moussa Bagate for their assistance in carrying out the
laboratory experiements, and Lyn Gabbert for her help in typing the
manuscript.
iii


•
LIST OF REPORTS
Report 357-1, "A Study of the Effects of Interface Condition on Thin Bonded
PCC Overlay,1I by Kandiah Kailasananthan, B. F. McCullough, and D. W. Fowler,
presents the findings of the laboratory experiments on thin bonded overlay
which were conducted as a prelude to completing the Houston 610 Loop
experimental section and the results of the experiments on the field cores
obtained from the test section. October 1984.
v


-
ABSTRACT
The purpose of this study was to verify the feasibility of using thin
bonded PCC overlays and to evaluate their performance when exposed to
traffic and environmental conditions in Houston.
Laboratory experiments were performed and a test section was
constructed; cores were taken and analyzed to determine the correlation
between laboratory findings and findings from the field, so as to arrive at
useful conclusions that would enable the Texas State Department of Highways
and Public Transportation to design overlays for future rehabilitation
programs on CRCP.
KEYWORDS: Rigid pavement, PCC overlay, rehabilitation, resurfacing,
factorial experiments.
vii


r I I 1
-
SUMMARY
A series of laboratory experiments was conducted to study the effects of
thin bonded concrete overlays at the interface. The study was designed to
find a suitable bonding medium and to find the optimum treatment for the
original surface. The study was extended to find whether or not the position
of the steel affects the bonding capabilities of the thin bonded overlay.
A lOOO-foot test section was constructed; cores were obtained from these
sections after one month exposure to traffic conditions in Houston, and
they were further tested in the laboratory.
The study showed agreement between field and laboratory findings.
ix


tr
IMPLEMENTATION STATEMENT
This study provided several results which can be implemented by the
Texas State Department of Highways and Public Transportation. One concerns
the optimum treatment for the original surface. It should be, at least, sand
blasted, and it is better to mill the surface and then sandblast and airblast
to get rid of all loose material and to present a good, clean, dry surface.
The overlay should be well compacted. Less well compacted overlays may allow
small voids to form underneath, thus weakening the bond.
When an overlay is placed in dry weather, the interface can be dry and
no grout is needed. When an overlay is placed in wet weather, it is better
to use grout and Daraweld as a bonding material.
In addition, it was found that the position of the steel does not affect
the bonding capabilities of the reinforcing steel. It can be placed directly
on the surface of the existing pavement, rather than at the middepth of the
overlay, thus saving construction time and cost.
xi


•
TABLE OF CONTENTS
PREFACE
LIST OF REPORT
ABSTRACT.
SUMMARY
IMPLEMENTATION STATEMENT
CHAPTER 1. INTRODUC'IlON
Background Objective of Study Scope of Study Rehabilitation History of Resurfacing
CHAPTER 2. OVERLAY TYPES
Interface Bonded Interface Partially Bonded Interface Unbonded Interface Other Interfaces
Types of Concrete Resurfacings Plain Concrete Conventionally Reinforced Concrete Continuously Reinforced Concrete Fibrous Concrete Prestressed Concrete
xiii
iii
v
vii
ix
xi
1 3 4 4 5
9 9 9
10 10 10 11 12 12 12 13

•
CHAPTER 3. EXPERIMENTAL PROGRAM
Laboratory Experiments Slab Model Overlay Experiment
Experiment Design Preparation Procedure
Cylinder Overlay Experiments Design of Experiment
Bond PullOut Test Thickness of Overlay Curing Periods Position of Steel
Experimental Section Information Description of Field Core Experiments Coeff1cient of Thermal Expansion Tests Direct Shear Test Splitting Tensile Test
Variables Overlay Type Depth of Samples from Top
CHAPTER 4. CONSTRUCTiON OF EXPERIMENTAL SECTION
Sequence of Construction Description of Construction • Cores
CHAPTER 5. RESULTS OF TESTING PROGRAM
Instrumentation Apparatus to Measure Direct Shear
Berry Strain Gauge Laboratory Experiments
Slab Overlay Experiments Cylinder Overlay Experiment 1 Cylinder Overlay Exper1ment II Bond PullOut Test •
Field Core Experiments Coefficient of Thermal Expansion • Direct Shear Test Splitting Tensile Test •
Computer Analysis Results
xiv
15 16 16 17 19 19 23 24 24 24 25 28 28 31 32 32 32 32
35 35 37
39 39 42 43 43 44 44 44 46 46 46 47 47
1

CHAPTER 6. DISCUSSION OF RESULTS
Laboratory Expp.riments Slab Overlay Experiment Cylinder Overlay Experiment I Cylinder Overlay Experiment II Bond PullOut Test
Field Cores Experiments Thermal Coeff~cient Tests Direct Shear Test
Splitting Tensile Strength Summary
CHAPTER 7. CONCLUSlON AND RECOMMENDATION
Conclusions Recommendations
REFERENCES •
APPENDIX
xv
49 49 49 50 53 53 53 53 55 57
61 62
63
65

CHAPTER 1. INTRODUCTION
This chapter presents the background, objective, and scope of the study.
The concept of rehabilitation and the history of resurfacing are also
discussed.
BACKGROUND
Now that most of the nation I s Interstate Highway System is completed,
the general interest of the highway administrators is now shifting from
construction to maintenance, rehabilitation, and resurfacing. Although the
rehabilitation of portland cement concrete (PCC) pavements has generally been
accomplished by using bituminous materials for resurfacing, PCC has been used
to resurface existing pavements for more than 60 years. Performance data
indicate that a relatively low-maintenance service life of 20 years can be
expected from PCC resurfacing, and many such resurfacings have provided 30 to
40 years of service. Generally, PCC resurfacings have not been as
widespread as asphaltic concrete resurfacings because of their higher initial
cost and construction complexity, but several developments within the last 10
to 15 years have caused the states to reevaluate the use of PCC resurfacings.
Thp.se are
(1) imprOVed construction equipment and procedures;
(2) improved reinforcing techniques, such as continuous reinforcement,
fibrous reinforcement, and prestressing;
(3) the uncertain future supply of asphalt and its rapidly increasing
cost;
(4) the trend toward selection of resurfacing type based on life-cycle
costs rather than initial costa, and
(5) the large traffic volumes on some highways, which present traffic
handling conditions that are expensive and dangerous and encourage
keeping work on a facility at a minimum.
1 RB.357-l/0l

2
PCC offers a wide range of resurfacing altE'!rnatives, including plain
concrete, conventionally reinforced concrete, continuously reinforced
concretp., fibrous concrete, and prestressed concrete, which can be used with
three interfaces: bonded, partially bonded, and unbonded (Refs 6 and 7).
Unbonded plain, conventionally reinforced, and continuously reinforced
concrete resurfacings have been widely used for highways whereas partially
bonded plain and conventionally reinforced concrete resurfacings have been
used extensively for airport pavements. Recent developments in surface
cleaning techniques have resulted in new emphasis on the use of thin, bonded
overlay, especially when the primary need for resurfacing is to improve the
rideability or the surfacing texture of the existing pavement in terms of
skid resistance.
A major problem with PCC resurfacing is reflection cracking (Refs 1 and
2). Thermal movements and load-induced deflections at joints or cracks in
the existing pavements can cause cracking to occur through the resurfacing,
which in turn creates potential maintenance problems. The various
resurfacing alternatives permit the selection and design of a resurfacing
type and interface that will minimize these detrimental effects.
Due to changing economic considerations and uncertainty in future
availability of asphalt concrete, increasing interest is being expressed in
the use of PCC overlays over existing pavements. Unbonded concrete overlays
and bonded concrete overlays, both reinforced and unreinforced and of various
thicknesses, have been constructed by a number of agencies.
OBJECTIVE OF STUDY
The purpose of this study is to evaluate the performance of various
types of thin overlays placed over existing concrete pavements to determine
the circumstances under which such overlays may bp. effective. The types of
overlay considered were
RR357-l/01

b
3
(1) plain concrete, with one level of thickness, 2 inches;
(2) reinforced concrete, with two levels of thickness, 2 and 3 inches;
and
(3) fibrous concrete, with two levels of thickness, 2 and 3 inches.
SCOPE OF THE STUDY
For this experimental study, a 1,000-foot section on 1-610 Eastbound
between Cullen Blvd. and Calais Street in Houston was selected for a field
study. The test section was used to evaluate thin bonded PCC resurfacing
and to determine its performance when it is exposed to extra heavy traffic
loads and to Houstonls conditions. Laboratory experiments were performed to
pred ict the behavior of materials used on the test sec t ion; this was
essential selecting the critical variables.
REHABILITATION
Rehabilitation is defined as tiThe restoration, resurfacing, or repair of
highways and highway facilities to restore the serviceability, as nearly as
possible, to the original constructed level of service or as subsequently
improved ," (Ref 4)
This definition of rehabilitation implies that the repair or restoration
of the project provides a level of serviceability equal to its level when
it was placed in service. Since the present and future projected traffic
levels are, in most instances, greater than the initial estimates, it may be
necessary to increase the structural capacity of the pavement for the
rehabilitation to achieve its intent of providing satisfactory
serviceability-performance for some given time period into the future.
The concrete resur fac ings have been used for one or more of the
following purposes:
RR357-1/01
4
(1) to restore the rideability of the existing pavement,
(2) to provide an appropriate surface texture to the existing pavement,
or
(3) to restore or increase the load-carrying capacity and/or fatigue
life of the existing pavement.
HISTORY OF RESURFACING
The network of vehicular pavements in this country, from city streets
and farm to market roads to the primary highway system and the Interstate
Highway system, has been developed through a c'ontinual process of
construction. These pavements, adequate when constructed, soon experienced
ever increasing loadings, in terms of both numbe.r and weight. These
loadings, combined with the adverse effects of the environment on the
performance of construction materials, have resulted in various states of
distress. The fact that the nations' economy depends on the pavement network
has led the engineer in a continual search for ways to economically maintain
the pavement system with minimal disruption to the traffic flows, thus
minimizing the user's cost.
Out of necessity, pavement rehabilitation during World War II was
minimal and, with the increase in the volume and weight of truck traffic
during this period, a tremendous backlog of vehicular pavement
rehabilitation work developed. It was obvious that priority had to be given
to the upgrading of the nation's pavement network. Many of the original
pavements had been constructed with lanes 8 to 10 feet wide and these had to
be widened as well as resur faced. Concrete played an important role in the
rehabilitation; however, it was during this period that bituminous concrete
resurfacing received the most attention because it produced a dramatic
improvement in the rideability of the existing surface and could be
constructed with less disruption to the traffic flow. Experience had shown
that a concrete thickness of 4 to 5 inches minimum was necessary to prevent
excessive cracking due to curling or warping, unless the surfacing could be
RR357-l/0l
1 ;
f

L
5
successfully bonded to the existing pavement. During and immediately
following World War II, concrete resurfacing played an important role in the
continual upgrading of military air field pavements. Many of the original
air field pavements were constructed of 8 to 10 inches of plain or reinforced
concrete, generally using standard highway practices. With the rapid
increase in aircraft weight and traffic, these original pavements soon had to
be resurfaced to increase their load carrying ability. During the Korean War
period, an extensive research program was carried on by the Corps of
Engineers to develop a system methodology for the design of concrete
resurfacing.
The resurgence was insti.gated both by new designs and decreased demand
for concrete materials. The designs have involved continuous or fiber
reinforcement, the former being intended for new construction. However, with
the Interstate Highway system nearing completion, new construction is
decreasing significantly, and empnasis is shifting to rehabilitation.
Concrete advocates have turned their attention to overlays, aided by two
additional developments -- the uncertain future supply of asphalt and the
questionable service life of asphalt overlays on concrete. While both are
subject to interpretation and evaluation by individual agencies, the supply
problem is more a matter of time. Performance, on the other hand, is
subjective. Each agency has its own criteria for adequate service, i.e.,
what is expected of an overlay on a given pavement in terms of performance
and life. Thus, each agency may evaluate the economic advantages and
disadvantages of concrete overlays differently.
Many highway engineers have begun to base their recommendations regarding
resurfacing on a total-cost economic analysis, which includes initial cost,
maintenance and repair costs, and present worth of future resurfacings during
the life of the resurfacing. These are often presented in terms of
Itannualized costs. 1t
The most important consideration 1S cost. While the price of asphal t
has increased more than concrete over the past few years, there is still a
considerable gap between them. However, this gap may continue to narrow as
RR357-1/01

6
world supplies of petroleum decrease. In addition, initial cost should not
be the primary criterion: long-term performance must be considered.
The r@surgence of consideration of concrete resurfacing is evidenced by
the number of concrete resurfacing projects that have been constructed in the
last 10 years. Although some of this increased activity can be attributed to
emphasis being placed on the Federal Highway 4-R Program of rehabilitation,
restoration, resurfacing, and reconstruction, other factors, such as the use
of continuously reinforced concrete, fibrous concrete, and prestressed
concrete as resurfacing material s and the development of improved bonding
techniques, have broadened the application of concrete resurfacings and
attracted the attention of engineers. Recent resurfacings utilizing many of
these materials and construction techniques have been constructed as test or
trial sections to collect data for the extensive pavement resurfacing program
facing the highway engineer in the future.
Recent innovations in construction equipment, especially in surface
milling machines, have resulted in renewed interest in the use of thin
bonded-concrete resurfacings to upgrade existing pavements. Because of these
recent developments, thin bonded-resurfacing has received more attention than
the other types of resurfacing, which are essentially unchanged over the last
several years insofar as construction techniques are concerned.
RR357-l/0l

CHAPTER 2. OVERLAY TYPES
This chapter develops the basic concept of resurfacing types in terms
of interface types and resurfacing types.
INTERFACE
Experience has shown that the performance of a resurfacing can be
influenced by the condition of the pavement at the time of resurfacing, which
can vary from structurally sound to badly distressed. Thus the existing
pavement conditions will influence the selection of the interface treatment.
The interface types are characterized by the degree of bond between existing
pavement and the overlay and, as used herein, are termed bonded, partially
bonded, and unbonded. In the following paragraphs, each of the interface
types are discussed further.
Bonded Interface
For a bonded interface, steps are taken during preparation of the
existing pavement and resurfacing construction to insure a complete bond so
that a monolithic structure results. The steps include meticulous cleaning
of the existing pavement, application of a bonding medium, careful placement
and consolidation of the resurfacing concrete, and protection throughout the
cure period. Joints must be provided in the bonded resurfacing coinciding
with those in t.he existing pavement to minimize uncontrolled cracking.
Intermediate cracks in the existing pavement can be expected to reflect
through the resurfacing.
Partially Bonded Interface
In this case, no speC1al attempt to achieve or prevent bond between the
resurfacing and existing pavement is required. Minimal surface preparation
is necessary and normal concrete mixtures, construction practices, and curing
R&357-1/02 7

..
8
procedures are used. Joints in the resurfacing that coincide with or are
located within 12 inches of joints in the existing pavement are required, to
minimize uncontrolled cracking. If the existing pavement is nf long-pane 1
design (over 20 feet), intermediate joints or reinforcement are desirable in
the resurfacing to minimize the effects of reflection cracking. Intermediate
cracks in the existing pavement can be expected to reflect through the
resurfacing.
Unbonded Interface
For an unbonded interface, a positive separation course (unbonding
medium) is used between the existing pavement and the resurfacing. Normal
paving concrete mixtures, construction methods, jointing layouts, and curing
procedures are used for the resurfacing.
Other Interfaces
Concrete may be used to resurface existing flexible pavements (termed
"whi te-topping"). Generally concrete resurfacing is cast directly on the
existing flexible pavement; however, portions of existing flexible pavement
may be removed and replaced with concrete (inlay resurfac1ng). Levelling
cnurses may be used when the existing surface is badly distorted. Concrete
may also be used to resurface existing concrete pavements that nave
previously received two or more asphaltic concrete resurfacings resulting in
a thick (4-inch) interlayer. Although these resemble unbonded resurfacings,
tnick interlayers create design problems. Finally, the existing concrete may
be broken up and an unbonding medium applied before a concrete resurfacing.
TYPES OF CONCRETE RESURFACINGS
Concrete resurfacings include plain concrete and all types of reinforced
concrete. Although the predominant type of resurfacing has been plain and
conventionally reinforced concrete, a review of past practices reveals that
RR357-l/02
d

I
I J..,
9
there have been few, if any, standards established regarding the selection of
resurfacing types. Instead, it appears that the final selections of
resurfacing type is based on local experience, evaluation of the condition of
existing pavement, the causes of the distress mechanism leading to the need
for the resurfacing, and an economic analysis. Nevertheless, past practices
have led to the identification of certain factors helpful in the selection of
resurfacing type. These factors are described for each of the resurfacing
types that can be used.
Plain Concrete
Plain concrete may be combined with each of the three interfaces to
resurface existing concrete and flexible pavements. Joints must be provided
in bonded plain concrete resurfacings must coincide with joints in the
existing pavement, to prevent reflection cracking in the resurfacings. For
partially bonded plain concrete resurfacings. joints that match or fall
within 12 inches of joints in the existing pavement must be provided. Both
bonded and partially bonded plain concrete resurfacings are generally
restricted to structurally sound existing pavements. When unbonded plain
concrete resurfacing is used, there is no requirement to match joints in the
existing pavement because the unbonding medium effectively minimizes
reflection cracking. For this reason, unbonded plain concrete resurfacings
are generally used when the existing pavement is distressed or when it is not
economically feasible to match joints.
It is generally considered that thin plain concrete resurfacings must be
bonded to existing pavement to minimize distress in the resurfacing caused by
warping. Thin, bonded plain concrete resurfacings are normally used to
restore the rideability or surface texture of p.xisting structurally sound
concrete pavements. Although a thicker bonded plain concrete resurfacing can
be used to strengthen an existing pavement, the required thickness will be
such that a partially bonded or unbonded resurfacing is practical and
probably more economical because of the lesser cost for surface preparation
and construction.
RR357-1/02

10
conventionally Reinforced Concrete
Reinforced concrete, which contains distributed steel in the panels, may
be combined with any of the three interface types to resurface existing
pavements. For bonded resurfacing, joints must be provided in the
resurfacing that coincide with tnose in the existing pavement. The matching
of joints in a partially bonded reinforced concrete resurfacing with those in
an exis ting pavement ~s preferred but not essential, because the
reinforcement will control reflection cracking resulting from intermediate
cracking in the existing pavement, making it possible to resurface distressed
pavements with both bonded and partially bonded reinforced concrete.
Unbonded reinforced concrete resurfacing is used when the existing pavement
is badly distressed or distorted and a levelling course is needed.
Continuously Reinforced Concrete
Continuously reinforced concrete (CRC) contains continuous longitudinal
steel reinforcement with no intermediate transverse joints. Transverse
reinforcement mayor may not be used. From both design and construction
standpoints, bonded CRC resurfacings were not considered practical by many
engineers and so only a few have been constructed. Minimum thickness, steel
requirements, and jointing requirements for CRe resurfacings are essentially
the same as for CRC pavements. Partially bonded and unbonded CRe
resurfacings are used to restore the rideability and to increase the load
carrying capacity of existing pave1D.P.nts. eRC resurfacings are particularly
applicable for existing pavements exhibiting structural distress and when it
is not practical to match the joint patterns.
Fibrous Concrete
Fibrous concrete utilizes short, small-diameter fibers randomly
dispersed into the concrete during m~x1ng to provide omni-directional
reinforcements. Several types of fibers for reinforcement nave been
researched, but steel fibers are most commonly used in pavement applications.
Fibrous concrete nas been used witn each of the three interface types to
RR357-1/02

! 1,
11
resurface existing pavements. When a bonded fibrous concrete resurfacing is
used, joints in the resurfacing must coincide with those in the base
pavement. When a partially bonded resurfacing is used, the matching of
joints in the existing pavement is preferred but not essential, because the
fiber reinforcement effectively controls reflective cracking.
As with plain concrete, thin fibrous concrete resurfacings should be
bonded to the existing concrete to minimize effects of warping stresses. The
ability of the fiber reinforcement to control reflection cracking permits the
use of fibrous concrete resurfacings on existing pavements that exhibit some
degree of structural cracking. Because there has been little use of fibrous
concrete resurfacing, it must still be considered to be experimental or in
the development stage.
Prestressed Concrete
The strength of concrete and its load-carrying ability can be
dramatically increased through prestressing; that is, application to the
concrete during construction of a significantly high compressive force which
offset tensile stresses caused by applied loadings. Prestressed concrete is
used widely for structural members and it has been used extensively for
pavement applications outside of the U.S., but there has been little use for
pavements in the U. S. as a resurfacing material; its use in the U. S. has
been limited to a few airfield applications. On one highway, construction
with prestressed concrete simulated a resurfacing and for this synthesis has
been considered to be a resurfacing of a flexible pavement. Prestressed
concrete surfacings in the U.S. have been post tensioned, which requires the
use of a friction reducing material (unbonding medium) at the interface. The
inherent high strength of prestressed concrete resurfacings makes them
practically applicable for restoring or increasing the load-carrying capacity
of existing pavement. Because of the limited use for resurfacing at this
time, prestressed concrete must be considered as experimental or in the
development stage.
RR357-1/02


CHAPTER 3. EXPERIMENTAL PROGRAM.
This chapter deals with the experimental program. Details of the
laboratory experiments and project information on the experimental section
are given, together with a description of the field core experiments.
The experimental program on this research project consisted of two
parts. First, a set of laboratory experiments were performed to help in
identifying critical variables to be used on the main project at the Houston
610 South Loop. The second part of the project was the actual physical
construction of the experimental sections, monitoring deflections and
measuring crack. width, etc., periodically. The scope of this report is
limited to
(1) the laboratory experiments,
(2) the physical construction of the section, and
(3) the laboratory experiments performed on the field cores obtained at
these sections.
LABORATORY EXPERIMENTS
The following experiments were performed in the laboratory.
(1) Slab Model Overlay Experiment;
(2) Cylinder Overlay Experiments;
(a) Cylinder Overlay Experiment I
(b) Cylinder Overlay Experiment II; and
(3) Bond PullOut Test.
The details of each of these experiments are discussed in this section.
RR357-1/03 13

14
SLAB MODEL OVERLAY EXPERIMENT
ThE! objective of this experiment was to study the behavior of bond
strength at the interface with respect to
(1) different surface treatments, such as sand blasting and thE!
original surface without any treatment,
(2) different bonding agents (cement grout and epoxy), and
(3) large temperature cycles.
Since this report covers only a part of a large project, the study scope
was limited to basic procedures which would provide useful guidelines in
selecting a suitable bonding material and an economical surface treatment at
the interface. Thus, the study was not structured along statistical lines
but, rather, consisted of a series of exploratory probes to determine useful
information, to allow decision making in the main project.
The CRCP pavement on Houston Loop 610 has experienced distress
including considerable transverse and longitudinal cracking. To simulate
that condition, four slabs were selected which had a few hairline cracks on
the surface. They represented poor pavement sections which had experienced
fatigue failure due to severe traffic conditions. The slabs were of 6.0 feet
by 3.0 feet. They were subjected to large temperature cycles to study the
effect of possible debonding at the interface. Each slab was cut into two
smaller slabs of 3.0 feet by 3.0 feet, to enable easier handling.
Experiment Design
The variables considered were (1) bonding medium (grout or epoxy), (2)
environment, (3) surface preparation, (4) locations of cores, and (5) curing
period.
Bonding Medium. The bonding media considered were epoxy resin and
cement grout. The epoxy consisted of resin and hardener, which were mixed
RR357-1/03

15
together. The cement grout had a water-cement ratio of 0.62 (seven gallons
of water per bag of cement).
Environment.
experimental design.
Two levels of environment were included in the
One was room temperature and the other was large
temperature cycles, which consisted of a high temperature of 95°F and a lnw
temperature of 30°F. The high temperature, 95°F, was the mean high
temperature which Houston experiences and the low temperature, 30°F, was the
mean low temperature. To create these environments four slabs were exposed,
alternately, to hot and cold environmental chambers. The temperatures of
these rooms were controllable adjusting the thermostats. Thermometers kept
in these rooms were read every half hour to ensure that a of thermal
equilibrium was reached. Four slabs were kept at room temperature and the
remaining four were shifted between the hot and cold chambers every twenty
four hours.
Surface Preparations.
considered: no treatment and
Two kinds of
sandblasting
sur face preparat ions were
the surface. In actual
construction, the surface has to be scarified before subjecting it to sand
and air blasting, but it was not practical to scarify the slab surfaces to
simulate field conditions, and it may be inferred that the field performance
will be better than predicted from the laboratory findings.
Curing Period. Three cur ing periods were studied: one, seven, and
twenty-eight days. It is an accepted practice in the field of portland
cement concrete designs to study the strength after 24 hours, 7 days and 28
days. These strengths are useful for determining a feasible optimum time
period for closing the sections for traffic after the placement of the
overlay.
Figure 3.1 shows the factorial arrangement of the experiment in the four
factors described above.
Preparation Procedure
Location of Cores. Cores were obtained from three locations: edge,
corner, and interior. The cores were selected so that each variable was well
represented. The locations of the cores are given in Fig A.l in Appendix A.
RR357-1/03

~.,
lolL
.. .. ..,. I'> I'>
Cement Grout Epoxy Resin
Normal Sand Blasted Normal Sand Blasted -ci I I day e -Q)
~ F 17 days ... e 00
z ~ 12Bdays -I day
Fig 3.1. Factors affecting interface bond strength.
~ 0\

17
The surfaces of four of the eight slabs obtained by cutting the original
four slabs were sandblasted and tne surfaces of the remaining four slabs were
not subjected to any kind of special treatment. For the interface of two of
the slabs with sandblasted surfaces and two of the slabs with unprepared
surfaces, a uniform thickness layer of epoxy was spread evenly with a plastic
spatula. Grout was spread uniformly on the surfaces of the remaining four
slabs. Care was taken to insure that the dry surface absorbed the grout and
that there was no bonding of the grout before the concrete was placed. The
concrete used was the same asphalt specified for the Houston 610 project.
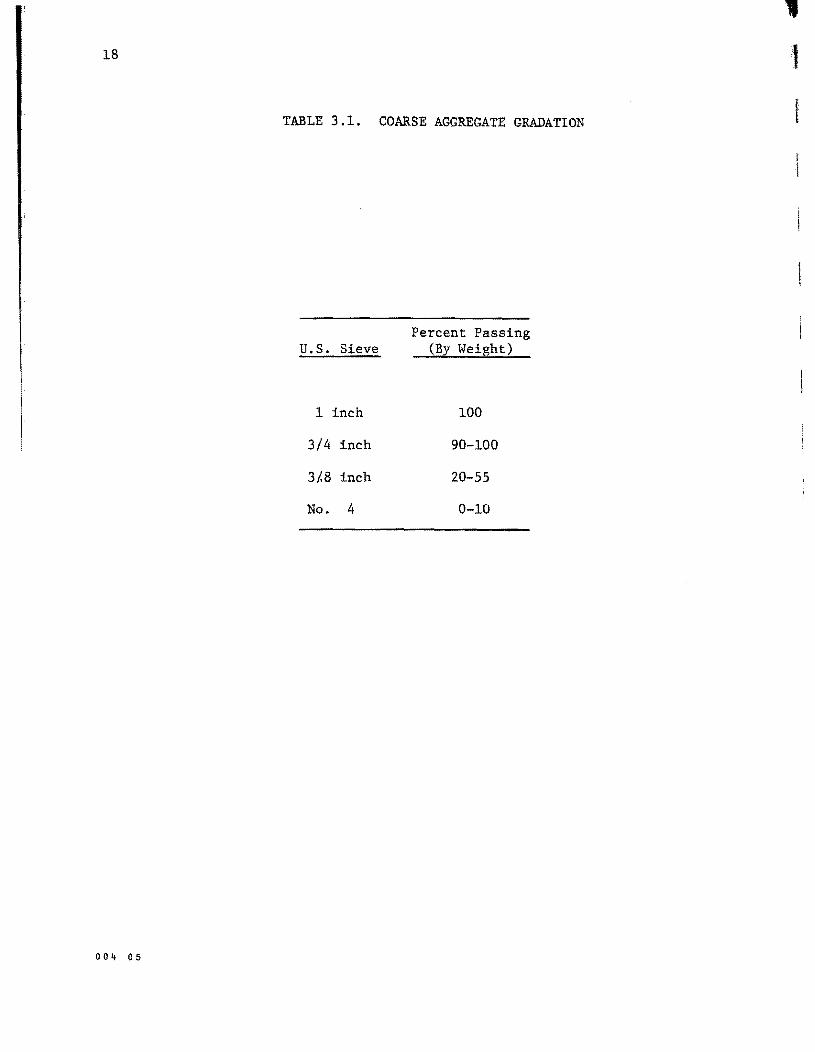
The coarse aggregate gradation was as presented in Table 3.1.
CYLINDER OVERLAY EXPERIMENTS
Two sets of cylinder overlay experiments were performed. In the first
set the objective was to compare the performances of interface surfaces with
a grout layer and a non-grout surface. In the second set of experiment; the
primary objective was to evaluate the performance of (1) a dry interface
surface against that of a surface that was wet when an overlay was placed;
(2) grout with "Daraweld" at the interface against a no-grout condition at
the interface, and (3) high temperature placement against placement at room
temperature.
Design of Experiment
Cylinder Overlay ExperimP-nt I. The variable considered was the bonding
medium. The surfaces of six cylinders were sandblasted. The cylinders were
4 inches in diameter and 8 inches in length. On three of these cy linders,
grout with a water cement ratio of 0.62 was brushed on the sandblasted
surface. This was followed by a 2-inch-overlay layer. On the other three
cylinders, a 2-inch concrete layer was placed directly on tne sandblasted
surface. The cylinders were kept outside the laboratory and were exposed
directly to the environment to simulate field conditions. A wet cotton
blanket was kept on top of the cylinders and adequate care was taken to
insure that the blanket was wet throughout the duration of the experiment.
RR357-1/03
1
18 1
TABLE 3.1. COARSE AGGREGATE GRADATION
Percent Passing U.S. Sieve (By Weight)
1 inch 100
3/4 inch 90-100
3/.8 inch 20-55
No. 4 0-10
004 05

r i
I I 1
19
As the overlay section was to be opened to traffic on the fourth day, the
cylinders were tested for direct shear at the interface on the fourth day.
Cylinder Overlay Experiment II. The variables considered in tnis study
were (1) surface condition, (2) bonding media, and (3) environment. The
factorial design of tne experiment is shown in Fig 3.2.
(a) Surface Condition. The surfaces of twenty-one cylinders were
sandblasted; it was not practical to scarify the surfaces of the cylinders
using milling equipment, even though the actual surfaces of tbe test
sections were to be milled to a depth of 1/8 incb. Thus, field results
should be better than the laboratory results , since there should be better
aggregate interlocking with milled surfaces.
Two surface conditions, dry and wet, were considered. The dry surface
was expected to absorb the grout faster than the wet surface. This variable
was considered to determine whether this phenomena would result in a
significant difference in shear strength at the interface.
(b) Bonding Agent. Two bonding agents were used: one was a grout with a
water-cement ratio of 0.62 with "Daraweld-C" added, and the other was a plain
surface. Daraweld is a bonding agent for concrete. The manufacturer claims
it will form a bond, between two surfaces, new and, or old and new concrete
stronger than the concrete be~ng bonded. It is a ready-to-use, non-setting,
milk-white liquid with a viscosity only slightly greater than that of water
and a weight of 90 pounds per gallon (Ref 5).
When mixed with cement and sand, Daraweld-C
adhesive bonding agent which will adhere to most
forms a strong, higbly
substances. Daraweld-C
bonding when cured is expected to withstand intermittent or continued
exposure to water. Mix proportions used were
Daraweld 1 part
Cement 5 parts
Sand 2.5 parts
Water As required by specification
RR357-1/03

o o .0-
N
'"
High Temperature Placement
Room Temperature
Grouted
x X
x X
Dry
Non-Grouted
X X
x X
Grouted
X X
x X
Wet
Non-Grouted
X X
X
X
Fig 3.2. Factorial represention of cylinder overlay Experiment II.
N o
1111

21
The cement and sand should be mixed together first. Then the Daraweld-C and
water are thoroughly mixed with the cement and sand. Since Daraweld-C
bonding grout has a short pot life, it should be used within 30 to 40
minutes, and it should not be retempered.
(c) Environment. The experiment was also designed to study difference
in shear strength at the interface when the surfaces are exposed to high
temperatures as opposed to room temperatures, in order to be able to predict
how the overlaid sections would behave in summer months, when the temperature
reachps 90°F or higher. Twelve cylinders representing all the other
variables were kept in a heat chamber at a temperature of 100° F and the
remaining nine were kept at room temperature. The cylinders were designed to
be exposed to these environments for four days as the test sections were to
be opened to traffic on the fourth day after the overlay was placed.
BOND PULL OUT TEST
The restoration of pavements usually requires reconstruction of a
portion or all of the surface. When new reinforcement is used in the
concrete, there is an implied requirement for additional clear cover for the
re inforcement. If bars can be placed directly on the existing surface J
additional cover is provided besides expediting construction, and thereby
reducing cost. But, with rebars placed directly on the surface of the
pavement, the rebars do not have full encasement perimeter bonding the new
overlay.
The objective of this experiment was to determine the degree of
structural integrity of a slab reestablished through restoration methods and
teChniques and to study the degree of impact the position of rebars has on
shear strength at the interface. The test program was designed to provide
data for evaluating the effect of following conditions:
(1) surface preparation of the base slab's top surface prior to the
placement of overlay
RR357-1/03
22
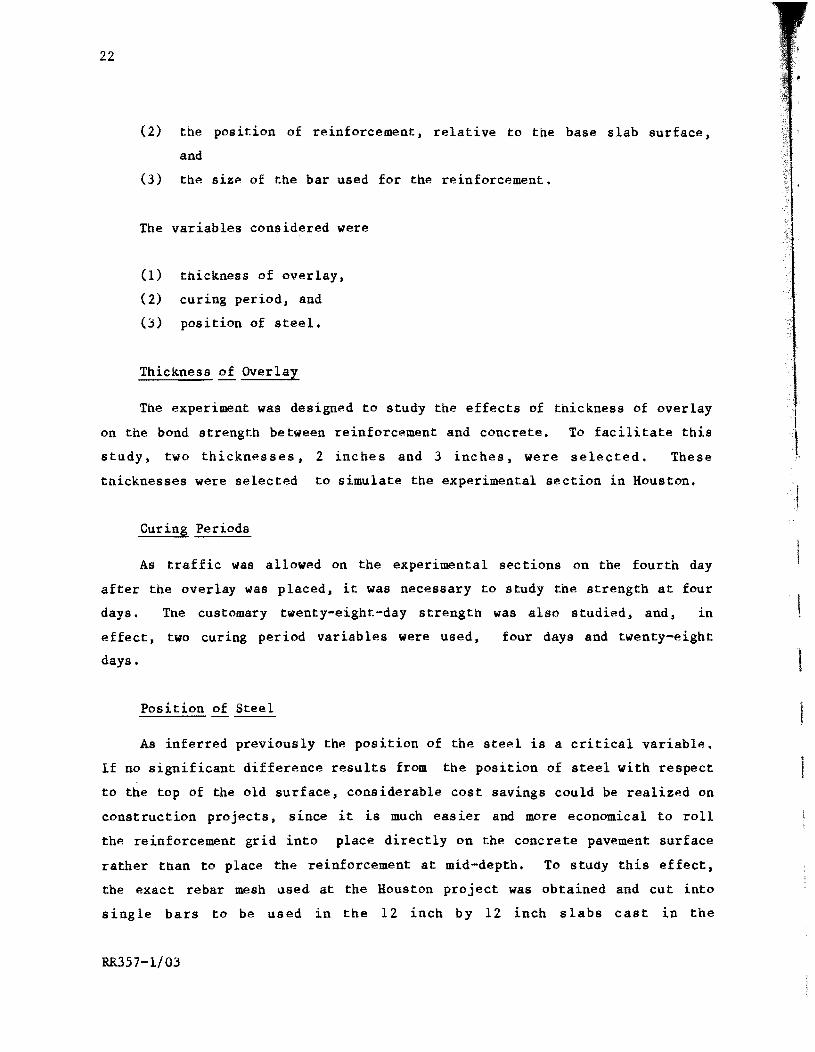
(2) the position of reinforcement, relative to the base slab surface,
and
(3) the size of the bar used for the reinforcement.
The variables considered were
(1) thickness of overlay,
(2) curing period, and
(~) position of steel.
Thickness of Overlay
The experiment was designed to study the effects of thickness of overlay
on the bond strength between reinforcement and concrete. To facilitate this
study, two thicknes ses, 2 inches and 3 inches, were selected. These
tnicknesses were selected to simulate the experimental section in Houston.
Curing Periods
As traffic was allowed on the experimental sections on the fourth day
after the overlay was placed, it was necessary to study the strength at four
days. Tne customary twenty-eight-day strength was also studied, and, in
effect, two curing period variables were used, four days and twenty-@ight
days.
position of Steel
As inferred previously the position of the steel is a critical variable.
If no significant difference results from the position of steel with respect
to the top of the old surface, considerable cost savings could be realized on
construction projects, since it is much easier and more economical to roll
the reinforcement grid into place directly on the concrete pavement surface
rather than to place the reinforcement at mid-depth. To stUdy this effect,
the exact rebar mesh used at the Houston project was obtained and cut into
single bars to be used in the 12 inch by 12 inch slabs cast in the
RR357-l/03

23
laboratory. To simulate the actual site condition, a 3-inch length of
transverse reinforcement was used on either side of the main reinforcement.
The length of the main reinforcement was cut in such a manner that it
provided an adequate grip for pulling the bars out.
Twelve slabs, 12 inches by 12 inches by 3 inches thick, were cast. The
surfaces of these slabs were scarified before the final set of concrete.
After four days of curing the surfaces of the slabs were air blasted to
remove all loose particles. A grout with Daraweld-C was used as the bonding
medium. The grout mix was brusned on with a bristle brush. Care was taken to
insure that the grout thickness did not exceed 1/8 inch. On these 12 slabs,
steel bars were laid on tne 3-inch thick base slab before adding the overlay.
Twelve more slabs, 12 inches by 12 inches by 6 inches, were cast with tne
rebars at mid-depth. The s labs were cured under normal laboratory
conditions. So, in effect, two reinforcement locations were used: (1) the
surface of the slab, and (2) mid-depth of the slab. The factorial
representation of the variables is presented in Fig 3.3.
EXPERIMENTAL SECTION INFORMATION
The thin bonded overlay experimental section was located on 1-610 in the
eastbound lanes between Cullen Blvd. and Calais Street. The overlay was 1000
feet long and four lanes wide. The plan of the test section is shown in
Fig 3.4. The concrete was placed in 200 foot test sections. Lanes one and
two (the inside two lanes) were included in Phase 1 of the repair; Phase 2
consisted of the repairs of lanes three and four. The original pavement
consisted of 8 incnes of CRCP on 6 inches of cement-treated base. A 2-incn
non-reinforced concrete overlay was placed on one of the sections. and, on
two other sections, 2 and 3-incn reinforced concrete overlays were placed.
On the remaining two sections, 2 and 3-inch fibrous concrete was placed.
The grout was delivered in agitator trucks and sprayed on the dry surface
immediately prior to paving. The water-cement ratio of the mixture was
approximately 0.6, i.e., 7 gallons of water per bag of cement. The grout
consisted of a water reducing plasticizer, Daraweld-C. A cross section of
RR357-l/03

<:> <:> ..,.
on Surface of
Old Slob
Mid-Depth of
Slob
4
x X X
X X X
2/1
28
X X X
X X X
4
X X X
X )(
X
Fig 3.3. Factorial representation of bond pullout test.
3"
28
X X X
X X X
N J::-

<::> .<::> J!"
'" ..,
Lane I
~"f--- -tI..~ - - P.?tltll
2." 2" 311 3" 2"
~~---I----~-- -- l<t~ -----t.~
Reinforced Fiber Fiber --+",'1,10- ----It.iI'I..~
I Shoulder
20~ 20~
I~QI4 160 ft _+. 200ft -I-I.. 180 ft _I .. 180ft "1_1_ 160 It -11Clf 1__ 1000 tt ... ,
Fig 3.4. Plan of test section.
N I.n

26
ttle typical pavement structure after the overlay was placed is shown in
Fig 3.5.
DESCRIPTION OF FIELD CORE EXPERIMENTS
A month after the overlays were placed and the test sections were
exposed to the Houston traff ic and environmental conditions, cores were
obtained by random sampling representing all the variables. The following
tests were performed on the cores:
(1) thermal coefficient tests,
(2) direct shear tests at the interface, and
(3) splitting tensile tests.
COEFFICIE~T OF THERMAL EXPANSION TESTS
When a new layer of concrete is bonded to an existing concrete surface,
both the new and old concretes are assumed to behave as a composite having
the same physical properties. However, due to the difference in the ages of
the two materials, there is likely to be some difference in their properties.
If the difference in the thermal properties of the new and old concrete is
significant, then the two materials will expand or contract differently,
which may cause additional stresses at the interface and, then, additional
cracking.
This experiment was designed to determine whether there is a significant
difference between the thermal properties of the old and the new concrete
and also to determine their coefficients of thermal expansion.
One of tbe field cores obtained bad a longitudinal crack and it was
split in two. A thermometer was embedded between the two portions at the
center of the core and electrically connected to a thermostat. The core was
placed alternately in the hot and cold temperature chambers to determine how
RR357-l/03
,I

<:> o ... ,->
'"
2~3"
811
611
~ f·\D:~: : ?):X~T;~Z:7.:~ ~ "~',~-~:-.::: :~~~:-~.~;~:~;:~!:;':;:~ .:§/~.::}~ ~:~;:~~:~:.)::~ i ~:: ... , .... ·0," .... .. o ...... (II ......... 6 ••••• 0., -_' .. 0.# ..... '.0 ...... .,.."" , "" ........ ..
;·~·.:::~:~·;:·:5:·=~·::-::·::::;·~<~~~:~; ::.:: ~;'~;'::'::.\;::~:::;::::; ~:.~ /:;'~ .. ;: ::.:(:.~~. ~::/.:,,; ....... :: ~ ~ .::. ~.:·o -;0·:,: 0 .. ' ;.,-:0 ~ •• * ...... ; "!'": ~ .. c:': :: ~ .':~~ .... ' .•. -: .-)" .... ::."0:_ .. ~ ... -: ...... ,.~; .,: ~ :",.
~ .... ":~ ~; ·0"::." : : .. : ; ... ;.: ~,: ~ ~,,-." : .. ·0· .. •. ~ ~.;= -:. ..• ~ "~>1l. ,,",";' ... :~ '. ::::;: ""." ". : :~~ 1l ... !. !,: ~;.o ~:"." ~ ~ '.' ••• ".'*-: .... : ~.' "'. 0"....... ... .. .",,~ ..... :~ ... , ......... "--: .... " .. "",, .. ~
.... , .. ca:- ... " .... 0" & .......... ., CRCP ... · .. " .. -0 ... O ... ,.,.. .... Q· ... .::11 .. ',
f'!": ~; ~~:~q:: .. :. :.: .~: ~ ... :, ~7::-:. ~:t"; .;:~.~ ~ .. ~.:; .~ ;.~ :. ~ ::-:~ :!. ~ :.b.;*.:· ... :::o :;,.:. :"~~ • -: .. ~~.; f' .... ;.~ .. ;, .... : •• .. 0 .. ·~ .. ~·.:, .. P .. #; .. : ,.: .. o~,:~o~~ .. \ •.. ,,,:.::. · .. -;" .. "..: .. ~·.:·;3:-:~:·.~ ............ "," .. ,,, ........... : •• _- .. " 0-'. """,,_ f .c: ........ - .~. q .................. " • - ....... , -.:."'.., .. ; ". ," ... 0" .. - ... , ". " •••• " .......... " .. " -." ." •• .t," ............... , .... a ...... ·0 .... . ... 0.. •• • .. 0"·0 ••• ,,: ....... " ..• 0" "0," .O·-·~, .. ~ ... ·.:.Q., •.•. , .. o,.t#-,., ...... Q. "·0 .. .,. ••• ' ...... . ........... . · ..... 0·,.' .. 0·· -." .............. "0 ..... " .•. "f."-·"!.·;" .' •.• ; •. ,",,0" 0 ... _ ...... ·0.· ... ·.: ~.':' •. '.~.; • .; ~ .~~~ , .. ~ .. "! •• ,:.~ ••• j ••• ·, • .: .......... O ... 't.:CI •• O ........ · ... ~. : ... ~~.-= ......... , ... ':..! .. ':.: •• :. ;'.:' .... Q,._ .. ~ ..... O ..• : .. O:.O:.:~. ~.o ••. ,· .... ,~ ",: •• ~." .. "."
o .... " ......... _"'.'. "t.- O". 11 .... 0., •• !'~.~.o ......... 0 10 _ ........ t. I ......... 0.,_ .*. o.O;~ ': :::.~::-::~~ ::~:.:;:;:~\ ::0: :t.;~·~.;:~ :.: ~ ,:; -;".~~: io'-:-: • .:.~. ·f·.~·~~:.\~_.~ 'r; /i\!';':':~:';; :~. ;: :.: :.: :.:~:):~:~:~ :~:~:::~:~:~:::~:~::::::::::::::::::::: ::::: ~: ~: ~: ~: ~: ~: ~: ~: ~: ~:~:~: ~: ~: ~: ~: ~: ~: ~: ~: . . .. . . . . ... .. ~ .. . ,:~?CEMENT TREATED SUBBASE }( ... "... " . . ... -....................... . : : : : : : :-: . : . :-: . : . : .. > : .,: : : : : : : : : : : : : : : : : : : : : : : : : :: : : : : : : : :': : : . : . : . : . : . : . :! : . : . : : : : : : : : : : : : : : : : : : : : : : : : : .. " . . . . .. .
SUBGRADE
Fig 3.5. Cross-section of typical pavement structure.
N '-J
'"
28
long it takes the center temperature to achieve equilibrium, and this time
was used as a standard to measure the temperature.
Three more cores were obtained and five plugs were affixed to the core
with epoxy. The distances between Plug A and Plug B represented a length of
2 inches at room temperature on the overlaid portion. Similarly, the
distance between Plug C and Plug D represented a length of 2 inches at room
temperature on the old concrete portion. The distances were measured at
different temperatures by means of a strain gauge. The range of temperatures
selected was from 30°F to 95°F. A regression analysis using the SPSS program
was performed and the results were tabulated.
The distance between Plugs D and E was 4 incnes at room temperature and
the distances were also measured by means of the strain gage at various
temperatures within the selected temperature scale. The temperature in each
of the cores was measured a thermocouple connected to the standard core,
which had the thermometer embedded at the center. A regression analysis
using SPSS was performed for the data obtained and the coefficient of thermal
expansion of the old concrete was obtained:
tt = to + to at
where
tt = to =
t '"
Thus
RR357-l/03
length at higher temperature,
length at lower temperature,
difference between high temperature and low temperature.
= at
I
l

29
Letting
R.t 10 10 = K
then
K = at.
The slope of the regression between K and the temperature gave the
coefficient of thermal expansion of the old concrete. This experiment was
repeated twice for each core. Tne average of six slopes obtained was used to
determine the coefficient of thermal expansion of tne old concrete. The
thermal coefficients of expansion similarly obtained were compared for
significant differences. The detailed results are tabulated in Table A.B.
DIRECT SHEAR TEST
The shear strengtn at thp. interface of thin bonded overlay systems
primarily contributes to the success and feasibility of this type of system.
If this shear strength is greater than the actual stress wnich is
experienced at the section due to traffic and environmental conditions, there
is less chance of failure and the overlay will remain bonded to the old
pavement. However, if the shear stress at the interface due to traffic and
environment exceeds the shear strength of concrete at the interface, then the
bond between old concrete and the overlay will fail, and the two will behave
like two independent units and no longer can be considered as monolithic.
Thus, the basic design assumptions will be violated.
To study the variations in the shear strength at the interfaces, twenty
nine cores were randomlY,selected along the length and breadth of the
section. These cores represented all the variables. Again, it should be
emphasized that since only a few cores represented each variable, no det.ailed
RR357-1/03

30
statistical analysis was feasible, but a discussion on the mean of these
results is discussed in Chapter 6. The device used to determine the shear
strength at the interface was fabricated at the Center for Transportation
Research.
SPLITTING TENSILE TEST
When portland cement concrete overlays are placed on existing rigid
pavements and bonded at the interface, there probably is a large difference
between the age of the existing concrete and that of the overlaid concrete.
This experiment was des igned to study (1) whether a significant
difference in the tensile strength exists between the new and the old
concrete, (2) the variation of tensile strength with depth, and (3) the
variation of tensile strength among the portland cement concrete, reinforced
concrete, and the fiber reinforced concrete overlays.
Variables
After the shear strength of concrete was determined, ten of the cores
were each cut into approximately 2-inch lengths with a diamond saw. The
two variables were (1) overlay type and (2) depth of sample from top.
Overlay ~
The three different types of overlays which the samples represented were
(1) plain concrete, (2) reinforced concrete, and (3) fiber reinforced
concrete.
Depth £!. Samples from Top
Each core was divided into four sections indicated by A, B, C, and D,
used
RR357-1/U3
1

31
(1) A indicates overlay,
(2) B indicates 0 to 2 inches from intarfaca,
(3) C indicates 2 to 6 inches from interface, and
(4) D indicates 6 to B inches from interface.
The forty samples obtained by cutting these cores were subjected to the
indirect tensilp. strength test. The results ara discussed in Chapter 6 and
the measurements are tabulated in Table A.B.
R.R357-1/03


CHAPTER 4. CONSTRUCTION OF EXPERIMENTAL SECTION
This chapter deals with the construction of the experimental section.
The surface preparation, the sequence of placing concrete, the equipment
used, and the control tests performed to ensure the quality of concrete are
dealt with in this chapter.
SEQUENCE OF CONSTRUCTION
The existing concrete pavement surface was scarified by a milling
machine to a depth greater than 1/8 inch. Then sand blasting equipment was
used to remove all dirt, oil, and other foreign material, as well as any
laitance or loose concrete from the surface and edges against which new
concrete was to be placed. The entire surface was cleaned with compressed
air just prior to the application of the bonding agent, which was a water
cement grout.
The prepared surface was dry to allow absorption of the bonding grout.
The bonding grout was applied by means of brushes. Care was exercised by the
contractor to insure that all parts received a thorough, even coating and
that no excess grout collected in pockets. The grout application rate was
limited to prevent drying of the grout before it was covered with the new
concrete,
DESCRIPTION OF CONSTRUCTION
Generally, the concrete used had seven sacks of cement per cubic yard,
1/2 inch coarse aggregate, and 4.5 gallons of water per sack. The concrete
was shipped 6 cubic yard to a load. However, for the fiber reinforced
concrete, 8 sacks of cement per cubic yard and 5 gallons of water per sack
were used. To control the temperature, ice was added to all loads.
RR357-1/04 33

34
On July 22, 1983, 200 feet of 2-inch non-reinforced concrete was placed
~n lanes 1 and 2. The concrete was supplied in six trucks. To each load,
150 oz of "Mighty 150", a plasticizing agent, was added. The average slump
was 3.75 inches and the average air content was 4.0 percent. The average
seven-day flexural strength obtained from the beam test was 823 psi.
On July 26, 1983, 200 feet of 2-inch steel reinforced concrete was
placed in lanes 1 and 2. The wue fabric size used was 6 inches by 12 inches
with end laps of 12 inches and edge laps of 6 inches. Tne concrete was
transported in six trucks with an average slump of 4.3 inches and an average
air content of 2.3 percent. An average of 150 oz of "Mighty 150" was added
at the site to each truckload before the slump was recorded.
On July 28, 1983, a 3-inch steel-reinforced overlay was placed in lanes
1 and 2. The concrete was transported in eight trucks. The average slump
recorded was 5.2 inches and the average air content was 5.2 percent. Two
beams prepared from concrete from the fifth truck had an average seven-day
flexural strength of 870 psi. To each of the truckloads an average of 150 oz
of "Mighty 150" was added before the slump was recorded.
On August 3, 1983, 200 feet of 2-inch fiber-reinforced concrete was
placed in lanes 1 and 2. The fibers were added in 66 pounds bags at the rate
of 2 bags per minute. The specifications required 85 pounds of fibers per
cubic yard of concrete. The concrete was transported in six trucks. The
average slump was 4.5 inches and the average air content was 4.6 percent.
Out of concrete transported in the fourth truck, two beams were cast which
had an average seven-day flexural strength of 920 psi.
On August 15, 1983, 200 feet of 2-inch non-reinforced and 200 feet of 2-
inch steel-reinforced concrete were placed in lanes 3 and 4. The average
slump was 3.9 inches and the average air content was 4.0 percent. Two beams
each were cast from the concrete transported by the sixth and the eighth
truck. The average seven-day flexural strengths were found to be 730 psi and
798 psi, respectively.
On August 20, 1983, the work resumed, after the area was affected by
Hurricane Alicia. The concrete was transported in nine trucks. The average
slump was 3.6 inches and the average air content was 3.1 percent. Two beams
RR357-1/04

35
were cast out of concrete transported by the second truck and the average
flexural strength was 840 psi.
On August 27, 1983, 200 feet of 3-inch fiber-reinforced and 200 feet of
2-inch fiber-reinforced concrete were placed in lanes 3 and 4. The concrete
was transported by fifteen trucks. Most of the concrete in the eleventh,
twelfth, and thirteenth trucks was not used because the concrete screed had
to be moved back to refinish some concrete. Part of the twelfth truck was
dumped, but the rest was sent back to the plant. The average slump recorded
was 4.8 inches and the average air content was 5.0 percent. One beam each
was cast from concrete out of the eighth and the fifteenth trucks. The
average seven-day flexural strengths were found to be 838 psi and 898 psi
respectively. These two lanes were opened to traffic on the eVF!ning of
September 3, 1983, giving the last concrete placed six curing days.
To ensure that the concrete reached its design strength, two control
tests were performed during the construction phase of the overlay. One was
the slump test and the other was the flexural test on the beams. The air
content of the concrete was also measured. Table A.l2 gives the results of
the slump tests and the flexible strength tests. The slump ranged from 2.5
inches to 8 inches. The flexural strength ranged from 730 psi to 992 psi;
the mean strength was 872 psi.
CORES
Twenty-nine cores, randomly distributed throughout the section, were
obtained as shown in Table A.I0. The cores exhibited rigid bond at the
interface. There were not many visible voids in the overlaid portion of the
concrete.
RR357-1/04

CHAPTER 5. RESULTS OF TESTING PROGRAM
This chapter describes the apparatus developed at the Center for
Transportation Research to test the shear strength at the interface of the
core. The results of the experimental programs are also given in this
chapter.
INSTRUMENTATION
Apparatus ~Measure Direct Shear
In all the laboratory experiments except the bond pull out test and in
the experiments with the field cores, the shear stress at the interface was
measured and defined as a function of bond strength. Several types of
instruments have been used in the past to determine direct shear on cylinders
by various agencies. After investigating available test apparatus, it was
decided to develop an instrument which would facilitate measuring the direct
snear stress at the interface.
Figures 5.l(a) to 5,l(d) illustrate the instrument developed by the
Center for Transportation Research. Figure 5.1(a) shows the sample in the
machine, ready to be tested. Figure 5.l(b) shows the load being applied.
Figure 5.Hc) shows a specimen failing in shear. Figure 5.l(d) shows a
sample after failure.
The instrument consisted of a flat piece of steel 04.5 inchAs by 4.5
inches by 0.375 inch) welded to a semicircular section of pipe 4.5 inches
long and 4.0 inches in diameter. Another steel plate (3.5 inches by 4.5
inches by 0.375 inch) was welded to another semicircular section of pipe with
a diameter of 4.0 inches and length of 4.5 inches. The semicircular sections
of pipes were each also held onto the plates by means of two rectangular
plates welded to either side of the semicircular sections of pipes. These
plates gave more rigidity to the instrument. Four holes were drilled in both
plates, aligned in such a manner that a bolt could be easily seatAd though
RR357-1/05 37

38
Fig 5.1(a), Sample be~ng placed.
Fig 5.1(b). Sample being tested.

39
Fig 5.l(c). Sample at failure.
Fig 5.1(d). Sample after failure.

40
the holes. The holes in the longer plate, which was also the bottom plate,
were threaded so that four bolts could be bolted to keep the sample between
tne two semicircular section of pipes. When the sample was housed between
the pipes, the overlaid portion of the core visible in Fig 5.l(b) projected
out. Another semicircular section of pipe, with a diameter of 4 inches and
length of 3 inches, which had a thick steel plate 1/4 inch thick welded to
it, was placed above the projecting area of the core. The thick steel plate
had a depression at the center so that it could easily house a small sphere
through which it was feasible to transfer the load.
This instrument was clamped to the table ofa universal testing machine
by means of two C-clamps and the load was applied in a uniform manner. The
plotter ploted the loading automatically on graph paper as the loading
progressed. The load at failure was obtained from the graph paper.
The diameter of each core was measured by a surface gauge accurate to
one-thousandtn of an inch. A surface gauge was attached to a stand and
initially set to zero when the plunger touched the top surface of a 4-inch
brass scale. The core was rolled under the plunger and the reading + 4
inches gave the actual diameter of the core. For these experiments, the core
diameter was obtained as an average of four measurements at the interface.
BERRY STRAIN GAGE
A Berry strain gage was used to measure the distance between two plugs
affixed onto the field cores which were used to determine the thermal co
efficient of expansion of the concrete. Five plugs were affixed onto the
cores by means of epoxy resin. Five plugs were used on each core. Two
plugs were affixed on the overlaid region 2 inches apart. Two more plugs
were affixed 2 inches apart on the surface of the original pavement. These
two sets were used to compare the thermal coefficient of expansion of the old
concrete with the new concrete. At a distance of 6 inches from one of these
plugs, another plug was at tached. This was done to insure that a better
measure for the coefficient of thermal expansion. The length of the standard
RR357-1/05
·l·~~··.···.··· ... ··
"
: ~ :,:'!,
l
1
1
1
1 t
l
1
l t
l
l
l
l .#

41
bar and the distances between these plugs were measured by the use of a Berry
strain gage, at different temperatures.
LABORATORY EXPERIMENTS
Four laboratory experiments were performed.
below.
Slab Overlay Experiments
The results are given
Figure A.l in the Appendix shows the locations of cores. The letters
E, C, and I denote the locations of cores: Edge, ~orner or lnterior; and the
subscripts denote the number of days after which the core was taken. The
cores were 4 inches in diameter. The recorded data of the observations are
in Table A. 1 •
Attempts to core on the first and sevento days proved to be a failure.
Due to the heavy vibrations of the coring machine, the core broke at the
interface, thus destroying the specimens for determining the first and the
seventh day shear strengths at the interface. However, the mean shear stress
at the interface for the sixteen cores obtained after the 28th day was 204
psi. The mean shear stress at the interface for the cores obtained from the
slabs which were subjected to high temperature cycles was 237 psi and for
those which were kept at room temperature was 173 psi. The mean stress for
cores obtained from corner locations was 180 psi, for those from toe edge,
167 psi, and for those for the interior, 271 psi. The lowest shear stress at
the interface recorded was 115 psi, and the highest was 324 psi.
A subjective attempt to study the effect of corner curling involved
using a "Swiss-hanuner" at different locations on the slabs. Due to the non
repetitive nature of the experiment and due to toe lack of reliability of the
instrument, no useful conclusion could be made, but, in general, the results
did show weaker bonding in the corners and edges than at the interior.
RR357-1/05

42
Cylinder Overlay Experiment l
The recorded data for this experiment are given 1n Table A.2. The mean
shear stress at the non-grouted interface was 227 psi and at the grouted
interface was 218 psi. The standard deviation of the shear stress at the
interfaces without grout was found to be 29 psi, and that for the grouted
interfaces was found to be 5 psi. The coefficient of variation, which is a
measure of relative dispersion expressed as a percentage, for the direct
shear at the interface for the grouted cylinder was 2.3 percent and for the
non-grouted cylinder was 12.8 percent. The lowest shear stress recorded was
191 psi.
Cylinder Overlay Experiment ~
The recorded data for these experiments are given in Table A.3. The
maximum shear stress, 356 psi, was found on tbe cylinder which had a dry
surface and grout with Daraweld-C as a bonding medium and was exposed to a
temperature of 1000 F. The least stress, III psi, was obtained for the
cylinders which had a wet surface and no layer of grout at the interface.
The mean shear strength for the cylinders with a layer of grout at the
interface was 272 psi. The mean shear strength for the cylinders without a
layer of grout at the interface was 127 psi, when both the cylinders were
exposed to high temperatures.
Bond PullOut Test
All bars failed in tension before they could be pulled out after four
days, indicating that the bond strength is higher than the tensile strength
of steel, regardless of the positioning of the bars. The detailed results
are given in Table A.7. Figures 5.2(a) and 5.2(b) show the sample during
testing and at failure, respectively.
RR.357-1/05

43
Fig 5.2(a). Sampl e being tested.
Fig 5.2(b). Sample at failure.

44
FIELD CORE EXPERIMENTS
The results of the three laboratory tests performed on the field cores
are given below.
Coefficient of Thermal Expansion
The results of this test are shown in Table A.8 The mean thermal
coefficient of expansion of concrete was found to be 5.333 x 10⁻⁶/°F.
Direct Shear Test
The detailed observations for this experiment are given in Table A.5.
The average shear strength at failure was 202.0 psi. The highest strength at
the interface was exhibited by the core which had a 2-inch plain concrete
overlay and was located on one of the outer lanes. The interface of this
section had a grout with Daraweld-C as a bonding agent.
The lowest shear strength 79 psi, at the interface was found on core 10,
which was obtained from the sec tion which had a 3-inch reinforced concrete
overlay was on the inside lane, and also had a grouted layer at the
interface.
The mean shear strength at the interface for cores with a plain concrete
overlay was found to be 275.0 psi. The mean shear strength at the interface
for cores with reinforced concrete was found to be 185 psi and for steel
fibrous concrete was found to be 150 psi.
The cores with a 2-inch over 1.ay had a mean strength of 223 psi, and
those with a 3-inch overlay had a mean strength of 105 psi.
The cores from inner lanes had a mean strength of 186 psi and those
obtained from outer lanes had a mean strength of 220 psi. Cores with grout
with Darawe1d-C as a bonding agent had a mean shear strength of 135 psi, and
those with no grout at the interface had a strength of 213 psi. The lowest
shear strength at the interface was found to be 79 psi J which is about 300
percent higher than the critical stress that would be experienced at the
interface.
RR357-l/05
1 ..
J J
.' I
sf

45
Splitting Tensile Test
The data for this experiment are given in Table A.6. The cores with
plain concrete as the overlay had a mean tensile strength of 543 psi at the
interface. The cores which had a reinforced concrete overlay had a mean
strength of 458 psi at the interface. The mean strength at interface for the
cores with a fibrous concrete overlay was 520 psi. The existing CRCP had a
mean tensile strength of 498 psi with a standard deviation of 89 psi.
Samples from core 26 with a full-depth crack exhibited relatively low
tensile strengths (347 psi and 360 psi). Another core, with a crack but with
a fibrous concrete overlay had a strength of 491 psi.
COMPUTER ANALYSIS RESULTS
Theoretical analysis to determine critical shear stresses at the
interface were done using a computer program called ELSYM.5. Analysis were
done for continuous ly reinforced pavement and jointed reinforced concrete
pavement. In each case, overlays of 2 and 4-inch thickness under strong and
weak subgrade support conditions were modelled. The cross sect10ns of the
pavements assumed are given in Figs 5.3 and 5.4. The only cause of distress
considered in this study was loading. A simulated 18,000 pound single axle
load was cons idered. Temperature and moisture differential were not taken
into account in evaluating the worst stress at the interface. These stresses
could, however, be easily modelled and analyzed using finite element analysis
technique. A quick computation under the simplified conditions applicable to
the case under study, namely same coefficient of thermal expansion of
0.53 x 10⁻⁵ for overlay material and existing slab, and a typical shrinkage
strain of 0.39 x 10⁻³ in./in., yields a combined interface shear stress of
157 psi (including shear due to wheel load). The range of the shear stresses
at the interfac@ was from 16 psi to 24 psi, with a mean shear stress of 19
psi and a standard deviation of 3 psi.
RR357-1/05

46
EI = 4,000 ksi EI = 4.000 ksi 8-10
11
ILI= .15 8-1011
ILl = .15
611 E2= 200 ksi
6" E2= 100 ksi
IL2=·20 IL2=.20
E3= 20 ksi E3=12 ksi fL3=.45 CD JL3=.45
(a) Strong support. (b) Weak support.
Fig 5.3. Rigid pavement structures analyzed (before overlay).
2-4'1 EI =4200 ksi 2-4" E, =4200 ksi jLl=·15 jLl =.15
8-1011 E2 =4000 ksi E2 = 4000 ksi
k=.l5 8-10" jL2=.I5 i
1 E3=200 ksi E3=100 ksi 6" 6" jL3=·20 JL3=.20
E4= 20 ksi E4=12 ksi CD
jL4=.45 JL4=.45
(a) Strong support. (b) Heal<:. support.
Fig 5.4. Rigid pavement structures analyzed (after oveday).
004 06

CHAPTER 6. DISCUSSION OF RESULTS
In tllis chapter both. the laboratory and the field core results are
discussed in general and summarized.
LABORATORY EXPERIMENTS
Slab OVerlay Experiment
Since the mean shear strengtn at the interface for the sixteen cores was
204 psi and the worst condition shear stress at the interface found from
computer analyses was 24 psi, the thin bonded PCC overlay is feasible and has
a factor of safety against shear failure of over 8. The worst case of shear
strength obtained was 115 psi. Even this would yield a factor of safety
greater than 4.
The cores obtained at interior regions generally exhibited more strength.
at the interface than cores obtained from either the corners or the edges.
The overlaid portion of the slab separated from tne original slab in those
slabs which had epoxy as the bonding medium. This may be attributed to the
fact that the epoxy may have hardened before the concrete was placed or
that the performance of epoxy resins is affected by the semi-liquid form of
fresh concrete. Among the slabs exposed to temperature cycles, the one with
grout at the interface had better bonding than the one with epoxy, which
separated from the existing surface.
Cylinder Overlay Experiment ~
Tne mean shear strength of concrete at the non-grouted interface was
higher than at the grouted interface by 9 psi, but the grouted interface
exhibited a lower standard deviation, 5 psi, against the non-grouted
interface, with 29 psi.
The coefficient of variation also was lower for the grouted cylinders
than for the cylinders without grout at the interface, but the lowest stress
RR357-1/06 47

48
obtained was 191 psi for a cylinder without grout at the interface. Since
the worst stress obtained from the computer analysis was 24 psi, the factor
of safety is greater than 7. Thus, it may be economical and feasible to
place a concrete overlay directly on the treated old surface rather than to
apply grout before placing the overlay. Figure 6.1 shows the mean shear
stress at interface for Cylinder Overlay Experiment 1.
Cylinder Overlay Experiment II
A suomary tabulation of this experiment is given in Table 6.1. The
maximum shear strength, 356 psi, was found on the cylinder which had a dry
surface and grout with Daraweld-C as a bonding medium and was exposed to a
temperature of 100°F. The least strength , 111 psi, was obtained for thp.
cylinder which had a wet surface and no grout at interface. It is seen that
the presence of grout on a wP.t surface affects the bond shear at the
interface significantly. Even the shear for the worst condition, which was
III psi, had a factor of safety of more than 4, since the theoretically
predicted shear stress is only 24 psi. This result was also established 1n
the previous experiment. The shear stress for each cylinder is tabulated in
the Appendix. Exposure to high temperature does not seem to have a great
effect on the mean snear strength at the interface in any of the cases,
except on those cylinders which had a wet surface and did not have grout at
the interface prior to the placement of the overlay, which had a 30 percent
reduction in strength at the interface.
There was also a significant difference in the mean shear strength at
the interface between the cylinders which had wet surfaces with grout (with a
mean shear strength of 272 psi) and those witn wet surfaces without grout
(with a mean shear strength of 127 psi) when exposed to the same high
temperatures. The shear strength at thp. interface tor tne cylinders which
had a dry surface was generally higher. This may be due to the fact that the
grout was absorbed by the dry surface and resulted in a stronger bond.
The increase in the shear strength at the interface from applying grout
does not seem to be high enough to economically justify the use of grout. If
RR357-l/06

i , ! ....L
o L{)
C\J
o o C\J
Isd •
004 07
o L{)
o o o L{)
'SS3~.lS ~"3HS
r-:::> 0 0:: (!)
r-:::> 0 0:: (!)
0 Z
o
49
· H
~
c:: Q)
~ ~ Q) c:l. >:
r£l
>. ttl
r-I ~ Q)
:> 0
~ Q) '0 c::
..-l r-I >. u
· r-I · \D
eo ..-l ~

<:> <:> .ji:'
<:> 0>
TABLE 6.1. CYLINDER OVERLAY EXPERIMENT II: SHEAR STRENGTH IN PSI
HIGH TEMPERATURE
PLACEMENT
ROOM TEMPERATURE
DRY GROUTED I NON GROUTED
(PSI) (PSI)
i =289 x=243
i=282 i = 217
WET GROUTED INON-GROUTED
(PSI) (PSI)
x = 272 i= 127
')(=268 i = 196
VI o

51
the surface is dry, i. e • , the overlay is being placed under dry weather
conditions, it may be economical to omit the grout. On the other hand, if
the overlay is being placed under wet weather conditions, it is advisable to
apply grout before placing tne overlay.
Bond PullOut Test
All bars failed in tension before they could be pulled out. This test
demonstrated that the location of rebars has no bearing on the bond strength
at the interface, and that tne bars will not lose anchorage when laid on
existing surface and then covered with overlay.
The bond strength at the interface was not evaluated as a part of this
experiment. It is evident from the test results that the capacity at the
interface was adequate for the bars tested. Additional tests are recommended
to determine a numerical value or range for the bond capac i ty at the
interface. Figure 6.2 shows the mean load at failure for the different
variables considered.
FIELD CORES EXPERIMENTS
The results of the field core experiments are discussed in this section.
Thermal Coefficient Tests
The thermal coefficient of expansion was found to be 5 x lO-6/o F• There
is no significant difference in the thermal coefficients of expansion of the
new and the old concretes. As a result, there seem to be no serious
problems at the interface duE'! to the concretes' expanding differently and
inducing additional tensile stresses.
Direct Shear Test
Since the cores from the inner lane had a mean strength of 186 psi and
those obtained from outer lanes had a mean strength of 220 psi, it could be
RR357-1/0b

o o ~
N .,.
A --1 I I
3inT I 3 iii I
I 12 in.
I
A PLAN
h/2--I:~ h/23_ ...................... ..i.
h 3 in. T
.i ~~~ ........ ~ ...... ..
3~n._~
I:·:·:·:·:·:·:;:j OV ER LAY W/////A OLD CONCRETE SECTION A- A
h = 2" or 3"
REBA R
II in.
Note: All bars fai led in tension
-e.. I before pull out.
i
-e.. I
t=J ~~I------~---~----~ 8,
LOAD AT FAILURE, Ib
Fig 6.2. Bond pullout test.
I.rt f',)

53
concluded that lane location does not have a significant effect on the
shear strength at the interface. Figure 6.3 shows the mean shear strength
obtained under the different conditions.
Since the cores with grout and Daraweld-C as a bonding agent had a mean
shear strength of 135 psi, and those with no grout at the interface had a
strength of 213 psi, it may be concluded that the dry surface without grout
during dry weather conditions results in to higher shear strength at the
interface. This result agrees with the laboratory findings that the dry
surface with no grout at the interface gave rise to higher shear strength at
the interface.
The lowest shear strength obtained was 79 psi and as against the worst
shear stress expected at the interface of 24 psi, giving a factor of safety
greater than 3.
From the results, it could be inferred that the performance of the plain
concrete overlay was better than most of the reinforced concrete overlay.
Further experiments must be performed to verify whether the contact area of
reinforcement affects the bonding of an overlay.
SPLITTING TENSILE STRENGTH
The cores with plain concrete exhibited the highest tensile strength
followed by the fibrous and the reinforced concrete cores in that order (see
Table A. 8). There was a full-depth crack in core number 26. This may be
the reason it gave low strengths. The samples from a cracked core of fibrous
concrete gave a higher strength. This may be because the fibers were
oriented in different directions. Normal concrete may be weaker in tension in
a direction normal to the crack.
Due to the improved performance of fibrous concrete, further tests
should be conducted with repeated loadings to determine how the fibrous
concrete behaves in fatigue. If this could be proved to be a viable
al ternative to re inforced concre te or a p lain concrete overlay, the
considerable labor cost involved in placing reinforcement mesh could be
easily saved.
RR357-l/06

C> C> ..,. C> tJ)
PLAIN 350r CONCRETE
300 -rn 0-
A 250
r"""'1 en t~{: en LaJ :=:=:=:=:: t ...... ..) a:: 200 I-en a:: « LaJ ::t: (/J
~ 1"":':':1 1"'::::::1 150 :}~{ ?t~ .... ,. ,. .. ,.
100
I r" "j 50:::::::;:~ l:::::::;)
REINFORCED CONCRETE
II II FIBROUS CONCRETE
NO NO GROUT GROUT GROUT GROUT GROUT
Fig 6.3. Field cores.
lJ1 ~

55
The tensile strength of concrete seems to increase with depth. All
samples tested snowed this. In tne region immediately below the interface,
tne average tensile strength was found to be 472 psi, and the tensile
strengtn for the bottom most layers was found to be 550 psi. This may be due
to the fact that bottom layers receive more compaction and are consolidated
more, by the weight of the upper layers. The mean tensile strengths of the
different types of concrete are given in Fig 6.4. The results of tnis
experiment are g~ven in Table A.6.
Tne tensile strengtn of tne RC overlay was found to be about 16 percent
less tnan existing concrete at a depth of 8 inches. The tens He strength of
fibrous concrete overlay was found to be about 10 percent less than the
existing concrete at a depth of 8 inches.
These results suggest that fibrous concrete is likely to perform better
as an overlay tnan reinforced concrete at least in tne initial stages.
Further experiments must be conducted to determine whether these differences
will decrease with age.
SUMMARY
The summary of the results is given in tnis section.
(1) The performance of epoxy was affected by the wet concrete. Possibly
the epoxy hardened before the overlay was placed, thus affecting
its bonding capacity.
(2) Cement grout proved to be a better bonding agent than the epoxy.
(3) The bonding at the interior was better than at the edge and corner.
(4) The grouted interface may withstand thermal cycling effects better
than the epoxy at the interface.
(5) A grouted surface gave a reduced possibility of failure due to a
smaller coefficient of variation of the shear stress at interface.
(6) The least snear strengtn obtained at the laboratories was much
greater than the worst shear at the interface based on tneoretical
predictions.
RR357-1/06

0
0 ..,- 550.- \.J1
(j\ N -
._ 525 fI) ~ - . - - - - - - - - --
~ [~~~~~~~~I Plain Concrete en 500 1 r········ .j ••• oooooooooo •• · ......... ......... . · ......... ......................... ...
~ I I" ........ ·1 ~ am Steel Reinforced ............ ......... . ............... . · ............... · ......... · ......... ::::::::::::::::: Concrete ................. ... · ............. · ......... ....................... . ....
en 475r- I" ........ ·1 ~~ F·b R·
· .................. ............... .. .. .. . .. .. .. . . .. .. .................. .. I er ean-
W I I········· .j ~ forced Conaete .................... .. .. .. .. .. .. .. .. .. .. .. .. .. .. .. .. .. .. .. .. .. .. .. .. .. .. .. .. .. ..
-l .. .. .. .. .. .. .. .. .. ..
en 450 z w .... 425
400 I 1·;·;·;·;·;·;·;·;·;·;1
Fig 6.4. Splitting tensile test on field cores .
. - - -

57
(7) The dry interface gave a higher shear stress at the interface.
(8) High temperature placement did not seem to have a greater effect on
the shear stress at the interface.
(9) If the overlay is being placed during dry weather conditions, the
grout can be omitted, but, if the overlay is being placed during
wet weather conditions, it is better to have a layer of grout.
(10) The location of rebars, i. e ., at the original surface or at mid
depth of the overlay, was not critical as far as bond at interface
is concerned. Hence, the bar can be placed at the surface.
(11) The coefficient of thermal expansion of old concrete was found to
be 5.33:.> x 10-6 rF. There was no significant difference in the
coefficients of thermal expansion of new and old concretes.
(12) When no bonding agent was used, the shear strength obtained when
overlaid on a dry surface was higher than that obtained when
overlaid on a wet surface.
(13) The performance of plain concrete seemed to be better than that of
reinforced concrete overlay. Further experiments must be conducted
to verify whether the contact area of reinforcement affects the
bonding of overlay.
(14) The most critical shear strength obtained was 300 percent more than
the most critical shear stress obtained through computer analysis.
(15) Plain concrete exhibited the highest tensile strength and the
reinforced concrete the lowest at the interface.
(16) Fibrous concrete had a higher tensile stress than the reinforced
concrete.
(17) The tensile strength of overlay and that of the concrete at 12
B.R357-1/06
inches from the resurfaced layer were closer in value in the case
of fibrous concrete reinforced concrete, which indicates that a
fibrous concrete overlay is more 1 iltely to behave as a monolithic
unit than a reinforced concrete overlay.


CHAPTER 7. CONCLUSIONS AND RECOMMENDATIONS
The conclusions that emerge from the several tests and the theoretical
analysis described in previous chapters are presented here. These
conclusions are based on limited tests and apply only when the conditions of
these tests regarding the materials used, environmental aspects and design
specifications are met.
recommendations is given.
CONCLUSIONS
Aftp.r presenting the conclusions, a set of
(1) Adding an overlay to an aged pavement improves the structural
quality of the pavement as measured by the reduction in deflection
both at cracks and at mid-span positions.
(2) Overlaying on dry surface results in better bond strength at the
interface than overlaying on a wet surface. Specifically,
overlaying when the surface is wet results in the weakest interface
bond strength. Under this condition, it is advisable to apply a
grouting agent or to dry the surface before overlaying. If the
surface is dry, there is no need for using a grouting agent.
(3) Roughening the surface as by milling or scarifying helps produce a
better bond.
(4) The effect of positioning overlay reinforcemP.nts on interface bond
strength is insignificant. Hence reinforcing bars can be placed on
the original surface in the interests of cost saving.
(5) Fiber reinforced overlay is a good alternative to plain or bar
reinforced PCC overlay.
(6) The experience with TBCO as gained during this research is
encouraging, leading to the conclusion that THCO appears to be a
feasible alternative to other metnods of resurfacing.
RR357-1/07 59

60
RECOMMENDATIONS
This study has answered some questions, but therp. are many more
questions of interest to pavement designers, constructors and administrators.
It is suggested that the following studies be taken to understand the scope
and limitations of Taco as a rehabilitation resurfacing stratp.gy:
0) the experimental section should be monitored for a length of time
to gain an understanding of the pp.rformance behavior of TaCO; (2) more experiments should be designed and analyzed to know the
relative merits of:
(a) various types of coarse aggregatp.s,
(b) different grouting agents,
(c) surface preparation tp.chniques,
(d) using Taco at different stages of decay of the existing
pavement,
(e) using Tceo under different environmental, traffic and support
conditions, and
(f) relative degrees of dryness vis-a-vis grouting agent usage.
(3) relative economics of using alternatives need to be investigated,
e.g., is it cost effective to dry a wet pavement (before
overlaying) than to apply a grouting agent?
(4) the effects of temperature gradient, such as due to different
layers being at different levels from surface, needs to bp.
investigated.
RR357-1/07
-

--
REFERENCES
1. "Arkansas Reflec tion Cracking Analysis and Overlay Design ProcedurF!,"
University of Arkansas, Arkansas State Highway and Transportation
Department, Austin Research Engineers, Inc., Report No. NA3/1,
February 1982.
2. "Overlay Design and Reflection Cracking Analysis for Rigid Pavements,
Volume 2 - Design Procedure, II Report No. FHWA-RD-77-76, Austin
Research Engineers, Inc., August 1977.
3. Schnitter, 0., W. R. Hudson, and B. F. McCullough, "A Rigid Pavement
Over lay Des ign Procedure for Texas SDHPT," Research Report 177 -13,
CE'!nter for Transportation Research, The University of TE'!xas at
Austin, May 1978.
4. SDHPT - Texas - Operational Planning Document.
5. Daraweld - A Users Guide.
6. TemplE'!, W. M., and M. Rasoulian, "Tnin Bonded PCC Resurfacing, Interim
Report No.1," Louisiana Department of Transportation.
7. "Resurfacing with Portland Cement Concrete, II NCHRP Report 20-5, Topic
13-04, Septpmber 1982.
8. Ahlborn, Gale, "ELSYMS 3/72-3, Elastic Layered System with One to Ten
Normal IdE'!ntical Circular Uniform Loads," Insitute of
Transportation and Traffic EnginF!ering, University of California at
Berkeley, 1972.
RR357-1/RR 61


APPENDIX A
m


-
C0 S 0 C0 G G 0 G 8 C9 0 q J
2.5 2.0 4.5 in. 6.0 in. in. 4.0 in. in. 4.0 in.
- - -36.0 in.
Legend: C: Corner E: Edge I: Interior
Subscripts: Curing Period in Days.
8 0 8 S
2.5 1,,--/
in. 6.0 in
Fig A.I. Locations of cores. 0011 21
65
c: 0 ...t,w
c: 0 ...t
c: 0 ...t
.S Q '!it
.5 c 0 q u:) '!it rtl
.. . S
~ c' q '!it
C Q '!it~
c' .-0 ...t~ It
~ ,9riginal Steel
Reinforc 4.5 in. ment
e-
Layout

66
004 10
TABLE A.1. RESULTS OF SHEAR STRESS OF CORES OBTAINED FROM SLAB (28 DAYS)
Code: SB: Sand Blasted
Serial No.
1
2
3
4
5
6
7
8
9
10
11
12
13
14
15
16
G: Grout (cement) R: Room Temperature C: Cycled (cold to hot temperature)
Identification Code
SBGRI
SBGRE
SBGCI
SBGCE
SBGCC
SBGRI
SBGCC
SBGCI
SBGCC
SBGRE
SBGRE
SBGRC
SBGRC
SBGCE
SBGRI
SBGRC
Load at Failure
(lb)
1775
2275
3675
2025
2250
3925
4025
3600
1700
1450
2250
1950
2000
2475
4075
1650
Shear Strength
(psi)
141
181
293
161
179
312
320
287
135
115
179
155
159
197
.324
131
d

0011 11
TABLE A.2. RESULTS OF CYLINDER OVERLAY EXPERIMENT I
Serial No.
1
2
3
4
5
6
Surface Treatment
No Grout
No Grout
No Grout
Grouted
Grouted
Grouted
Load at Failure
(lb)
2800
3275
2400
2250
2800
2650
Diameter (in. )
4.002
4.025
4.001
4.003
4.001
4.002
Shear Stress (psi)
231
261
131
213
228
211
67

68
TABLE A.4. SHEAR TEST ON CORES
Load at Shear Core Core Area 2 Failures Strength
No Diameter (inches) (lb) (psi)
1 4.006 12.609 3200 253.79 2 4.004 12.597 saved ~aved 3 4.004 12.597 saved saved 4 4.015 12.666 3050 240.80 5 4.015 12.666 4400 347.39 6 4.011 12.641 4500 355.98 7 4.011 12.641 5150 407.40 8 4.013 12.653 3000 237.10 9 4.013 12.653 3650 288.47 10 4.011 12.641 1000 79.11 11 4.000 12.571 2800 222.73 12 4.006 12.609 3800 301.37 13 4.021 12.703 3025 238.13 14 4.014 12.659 1050 82.94 15 4.016 12.672 saved saved 16 4.020 12.697 2100 165.39 17 4.010 12.634 3100 247.37 18 4.015 12.672 1800 142.05 19 4.014 12.659 saved saved 20 4.008 12.622 1450 114.88 21 4.023 12.717 saved saved 22 4.012 12.647 1400 110.70 23 4.010 12.634 1200 94.98 24 4.019 12.691 1650 130.01 25 4.015 12.666 2600 205.27
*26 4.010 12.634 1200 94.98 27 4.012 12.647 2100 166.05 28 4.045 12.672 2500 197.29 29 4.008 12.622 saved saved
*Indicates a core with crack.
004 13

004 19
TABLE A.3. CYLINDER OVERLAY EXPERIMENT II: SHEAR STRESS AT FAILURE (PSI)
Bonding Agent
Surface Grouted Non Grouted Condition Temperature (psi) (psi)
356 245 (1) (2)
266 190
Dry High (3) (6)
246 293 (11) (7)
x = 289 x = 243
295 253 (15) (12)
322 155 (18) (13)
Dry Room 230 242 (21) (14)
x·. = 282 x = 242
222 142 (4) (8)
280 111 (5) (9)
Wet High 313 (10)
x == 272 x == 127
271 265 (17) (19)
Wet Room 264 126 (16) (20)
x = 268 x ;= 196
Figures in parentheses indicate core numbers.
69

70
TALBE A.S. SHEAR STRENGTH (PSI): FACTORIAL REPRESENTATION OF SHEAR STRESS
RESULTS OF FIELD CORES
Overlay Type
Plain Concrete Reinforced Concrete Fibrous Concrete
Bonding Thickness Agent (inches) Inside Outside Inside Outside Inside Outside --
238 347 356 165 111 247 (13) (5) (6) (16) (22) (17)
407 233 95 166 Grout (7) (11) (26) (27) and 2 Darawe1d
301 (12)
83 (14)
79 115 130
Grout (10) (20) (24)
and 3 95 Darawe1d (23)
254 241 (1) (4)
No Grout 2 205 237 (25) (8)
197 142 (28) (18)
Note: Figures within brackets are core numbers.
001t 18

71
TABLE A.6. RESULTS OF THE INDIRECT TENSILE STRESS OF THE CORES
51 Core Plain Concrete Reinforced Concrete Fibrous Concrete
No. No. A B C D A B ~ .JL .Jl.- ..JL --
I 2 543
2 5 423 550
3 7 405 647
4 8 480
5 9 553 511 439
6 10 467 442 532
7 12 408 443 686
8 14 501 631 480
9 17 673 538
10 18 430 525
11 20 403 478
12 22 575
13 24 343 411 541 701
14 25 543 416
15 26 *491 *360 *347
16 27 437 483 369 506
17 29 654 548
Note: A; overlay; B; A" to 2" from interface; C; 2" to 6" f;r;o11) ;i.nterface; D: 6" to 811 from interface.
*Indicate$ a core with cracks,
004 14

72
TABLE A.7. BOND PULL OUT TEST
Load at Rebar Sl 2_in. 3"",in. Failure Size No Overlay Overlay Mid-depth (lb)
113 1 X 9,040
113 2 X 9,000
112 3 X 7,900
#2 4 X 8,000
113 5 X 10,380
113 6 X 9,300 ".
112 7 X 7,800
fl3 8 X 9,000
112 9 X 8,000
112 10 X 8,080
tl3 11 X 10,400
113 12 X 10,440
001+ 15

r
73
TABLE A.8. THERMAL COEFFICIENT OF CONCRETE CORES
Core Temperature Distance, Thermal Coefficient Number (,OF) "DE" of Expansion
40 6.0018 70 6.0024 -6
24 92 6.0033 5.2 x 10
118 6.0042
40 6.0015
23 70 6.0028 -6 90 6.0036 7.0 x 10
118 6.0048
40 6.0843
10 70 6.0852 -6 84 6.0857 5.9 x 10
118 6.0071
37 6.0014
24 60 6.0019 -6 77 6.0023 4.2 x 10
100 6.0030
37 6.0805
23 60 6.0806 -6 74 6.0810 5.3 x 10
100 6.0825
37 6.0842
10 60 6.0849 -6 74 6.0854 6.5 x 10
100 6.0866
Mean thermal coefficient of expans;i.on = 5,3 :x 10-6, OF
001+ 16

74
TABLE A.9. CALCULATED MAXIMUM SHEAR STRESSES (PSI) AT THE INTERFACE
Existing Pavement
Overlay CRCP (8 in. ) JRCP (10 in.) Thickness (in. ) Strong Weak Strong Weak
2 21 24 18 20
4 18 16 18 16
Note: * Grand mean, N = 19 psi ** Standard deviation, cr = 3 psi
004 17

75
TABLE A.lO. SUMMARY OF CONSTRUCTION SCHEDULE
Out In I
Lane 4 I Lane 3 Lane 2 I Lane 1
Date: 8/15/83 Date: 7/22/83
Slump: Min Max Mean Slump: Min Max Mean 2/1
2.75" 4.50/1 3.9" 3.25" 4.0/1 3.75/1 NRC
Test: 730 psi Test: 955 psi
798 psi Core II: 13
Core II: 7. 19. 28. 1. 5. 25. 16*. 9* Interface
Interface: I
Date: 8/26/83 Date: 7/26/83
Slump: Min Max Mean Slump : Min Max Mean 2"
2.50" 4.50" 3.61" 3.0" 6.0" 4.3" RC
Test: 840 psi Test: 878 psi
Core #: 20. 23 Core #: 6. 8. 11. 12. 14. 15. 18. 21
Interface Interface
Date: 8/27/83 Date: 7/28/83
Slump: Min Max Mean Slump: Min Max Mean 3"
3.75" 6.00" 4.8" 2.5" 6.5" .'>.1" RC
Test: (1) 838 psi Test: 992 psi
(2) 898 psi Core Ii: 2, 4. 10
Core #: 3. 17. 27. 29 Interface
!Interface i
Date: 8/1/83
Slump: Min Max Mean 3"
3.75" 8.0" 5.2" FC
Test: 870 psi
Core Ii: 24
Interface
Date: 8/3/83
Slump: Min Max Mean 2/1
3.0" 5.25" 4.5" FC
Test: 920 psi
Core Ii: 26
I Interface

![Alternative Concrete Masonry Unit · 2018. 5. 10. · [15] ASTM C496 / C496M-17, Standard Test Method for Splitting Tensile Strength of Cylindrical Concrete Specimens, ASTM International,](https://img.pdfslide.us/doc/110x75/6131b0b31ecc51586944e4ea/alternative-concrete-masonry-unit-2018-5-10-15-astm-c496-c496m-17-standard.jpg)