Embed Size (px)
Citation preview
TEKSING TOWARD STAAR © 2014
TEKS/STAAR-BASED
LESSONS
TEACHER GUIDE
®MATHEMATICS
TEKSING TOWARD STAAR
Scope and SequenceSix Weeks 1
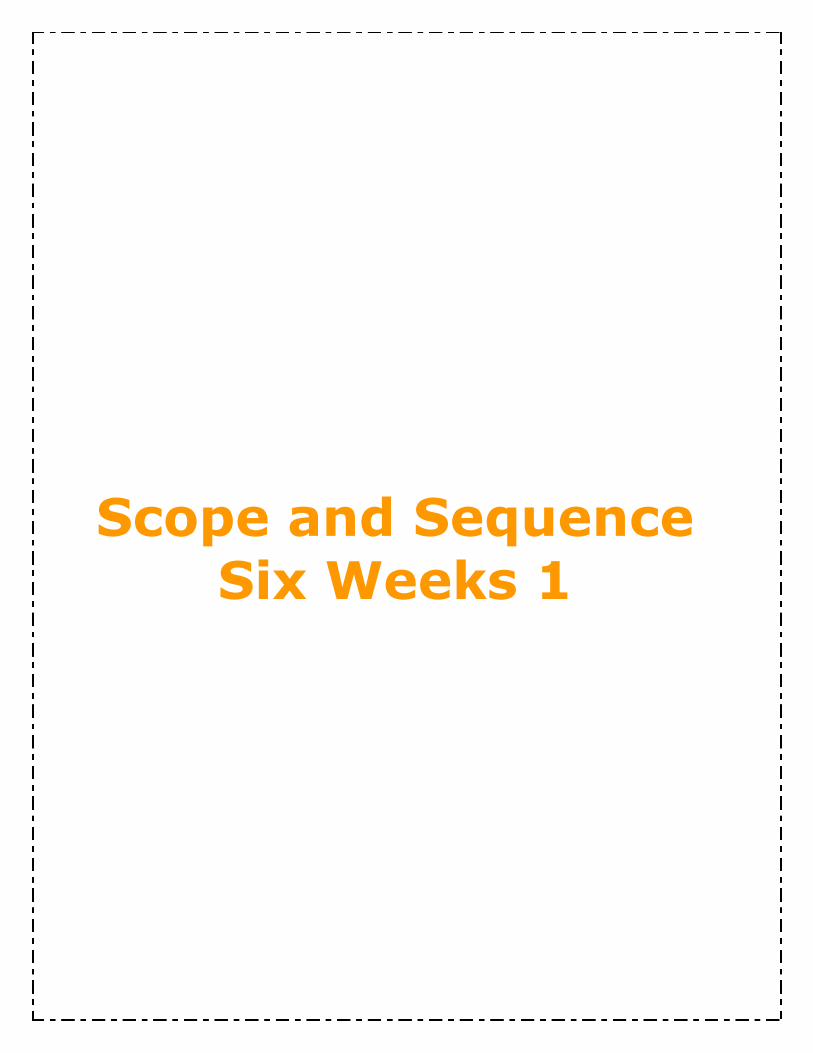
GRADE 7 MATERIALS LIST - SIX WEEKS 3
TEKSING TOWARD STAAR © 2014 Page 1
SIX WEEKS LESSON ITEM QUANTITY
3 1 Number cards (copy on cardstock, cutapart, and place in baggie)
Percent cards (copy on cardstock, cutapart, and place in baggie)
1 set per pair of students
1 set per pair of students
3 2 No materials needed
3 3 Centimeter grid paper0.5 centimeter grid paperCircle Pi circles (copy on cardstock, cutapart, and place in baggie)Circular object
Measuring tapeSafety compassCentimeter ruler
1 per pair of students1 per pair of students1 set per group of 4
students1 per group of 4 plus 3
extra1 per student1 per student1 per student
3 4 4 colored tiles using 4 colors in a bagPennyNumber cube
1 per pair of students1 per pair of students1 per pair of students
3 5 No materials needed
3 6 No materials needed
3 7 Rectangular prismMetric rulerButcher paper
1 per pair of students1 per pair of students2 sheets per pair of
students
3 8 Number cubesButcher paperColored Markers
2 per pair of students1 per pair of students2 sheets per pair of
students
3 9 No materials needed
TEKSING TOWARD STAAR SCOPE AND SEQUENCEGrade 7 Mathematics
TEKSING TOWARD STAAR 2014 Page 1
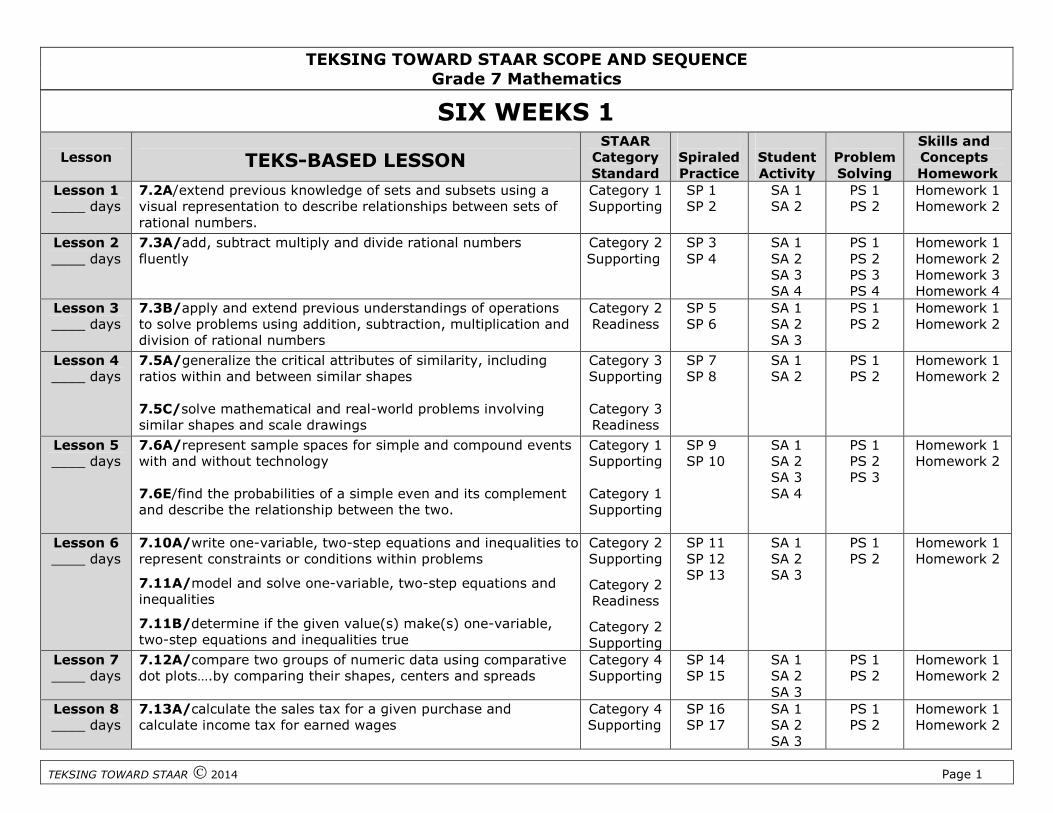
SIX WEEKS 1
Lesson TEKS-BASED LESSONSTAAR
CategoryStandard
SpiraledPractice
StudentActivity
ProblemSolving
Skills andConceptsHomework
Lesson 1____ days
7.2A/extend previous knowledge of sets and subsets using avisual representation to describe relationships between sets ofrational numbers.
Category 1Supporting
SP 1SP 2
SA 1SA 2
PS 1PS 2
Homework 1Homework 2
Lesson 2____ days
7.3A/add, subtract multiply and divide rational numbersfluently
Category 2Supporting
SP 3SP 4
SA 1SA 2SA 3SA 4
PS 1PS 2PS 3PS 4
Homework 1Homework 2Homework 3Homework 4
Lesson 3____ days
7.3B/apply and extend previous understandings of operationsto solve problems using addition, subtraction, multiplication anddivision of rational numbers
Category 2Readiness
SP 5SP 6
SA 1SA 2SA 3
PS 1PS 2
Homework 1Homework 2
Lesson 4____ days
7.5A/generalize the critical attributes of similarity, includingratios within and between similar shapes
7.5C/solve mathematical and real-world problems involvingsimilar shapes and scale drawings
Category 3Supporting
Category 3Readiness
SP 7SP 8
SA 1SA 2
PS 1PS 2
Homework 1Homework 2
Lesson 5____ days
7.6A/represent sample spaces for simple and compound eventswith and without technology
7.6E/find the probabilities of a simple even and its complementand describe the relationship between the two.
Category 1Supporting
Category 1Supporting
SP 9SP 10
SA 1SA 2SA 3SA 4
PS 1PS 2PS 3
Homework 1Homework 2
Lesson 6____ days
7.10A/write one-variable, two-step equations and inequalities torepresent constraints or conditions within problems
7.11A/model and solve one-variable, two-step equations andinequalities
7.11B/determine if the given value(s) make(s) one-variable,two-step equations and inequalities true
Category 2Supporting
Category 2Readiness
Category 2Supporting
SP 11SP 12SP 13
SA 1SA 2SA 3
PS 1PS 2
Homework 1Homework 2
Lesson 7____ days
7.12A/compare two groups of numeric data using comparativedot plots….by comparing their shapes, centers and spreads
Category 4Supporting
SP 14SP 15
SA 1SA 2SA 3
PS 1PS 2
Homework 1Homework 2
Lesson 8____ days
7.13A/calculate the sales tax for a given purchase andcalculate income tax for earned wages
Category 4Supporting
SP 16SP 17
SA 1SA 2SA 3
PS 1PS 2
Homework 1Homework 2
TEKSING TOWARD STAAR SCOPE AND SEQUENCEGrade 7 Mathematics
TEKSING TOWARD STAAR 2014 Page 2
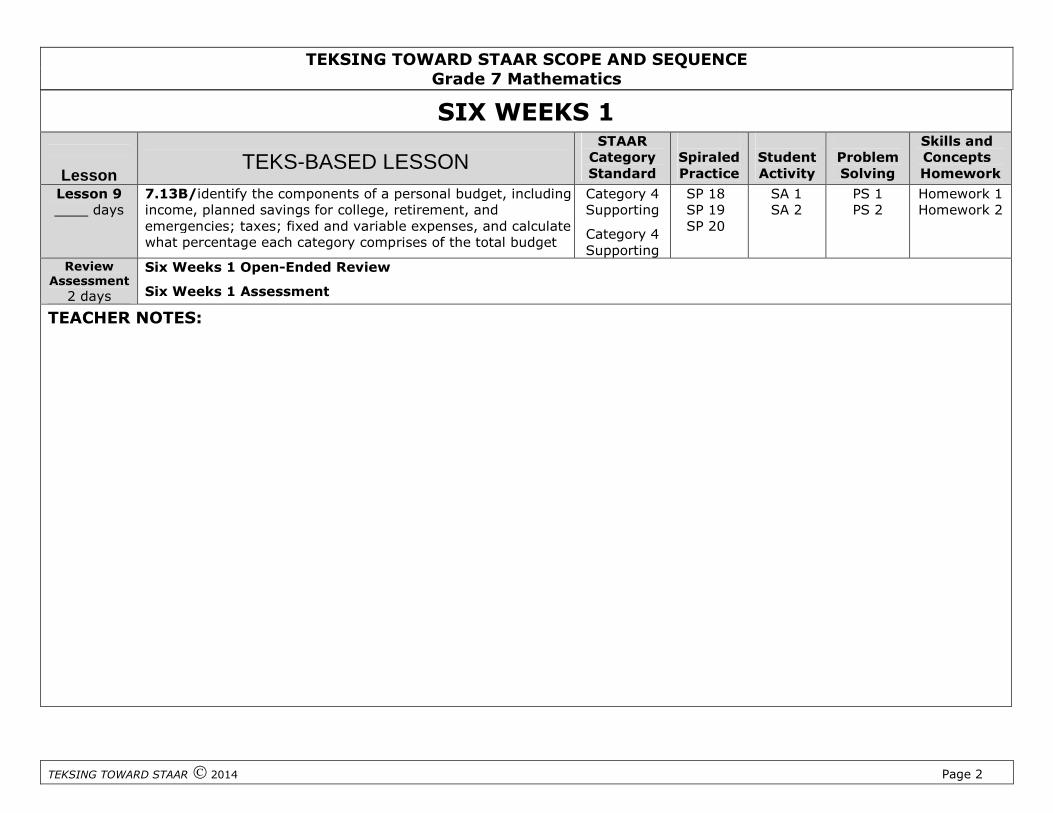
SIX WEEKS 1
LessonTEKS-BASED LESSON
STAARCategoryStandard
SpiraledPractice
StudentActivity
ProblemSolving
Skills andConceptsHomework
Lesson 9____ days
7.13B/identify the components of a personal budget, includingincome, planned savings for college, retirement, andemergencies; taxes; fixed and variable expenses, and calculatewhat percentage each category comprises of the total budget
Category 4Supporting
Category 4Supporting
SP 18SP 19SP 20
SA 1SA 2
PS 1PS 2
Homework 1Homework 2
ReviewAssessment
2 days
Six Weeks 1 Open-Ended Review
Six Weeks 1 Assessment
TEACHER NOTES:

Materials List
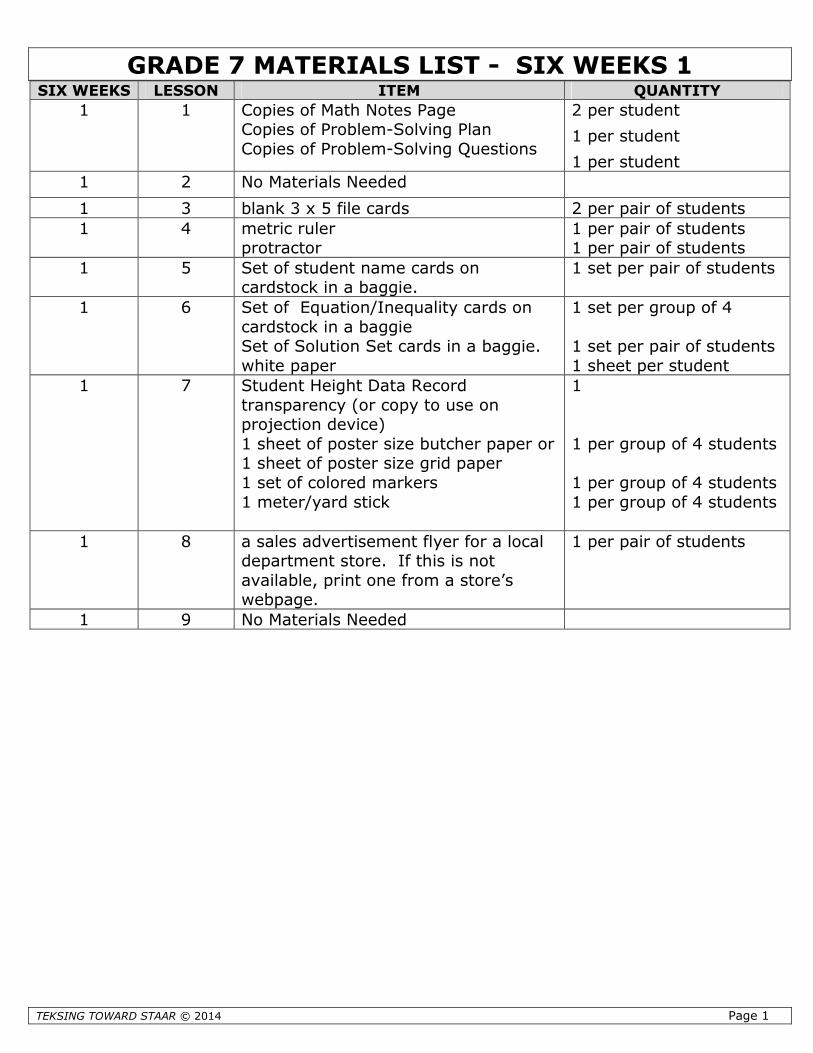
GRADE 7 MATERIALS LIST - SIX WEEKS 1
TEKSING TOWARD STAAR © 2014 Page 1
SIX WEEKS LESSON ITEM QUANTITY
1 1 Copies of Math Notes PageCopies of Problem-Solving PlanCopies of Problem-Solving Questions
2 per student
1 per student
1 per student
1 2 No Materials Needed
1 3 blank 3 x 5 file cards 2 per pair of students
1 4 metric rulerprotractor
1 per pair of students1 per pair of students
1 5 Set of student name cards oncardstock in a baggie.
1 set per pair of students
1 6 Set of Equation/Inequality cards oncardstock in a baggieSet of Solution Set cards in a baggie.white paper
1 set per group of 4
1 set per pair of students1 sheet per student
1 7 Student Height Data Recordtransparency (or copy to use onprojection device)1 sheet of poster size butcher paper or1 sheet of poster size grid paper1 set of colored markers1 meter/yard stick
1
1 per group of 4 students
1 per group of 4 students1 per group of 4 students
1 8 a sales advertisement flyer for a localdepartment store. If this is notavailable, print one from a store’swebpage.
1 per pair of students
1 9 No Materials Needed
Mini-AssessmentAnswer Key
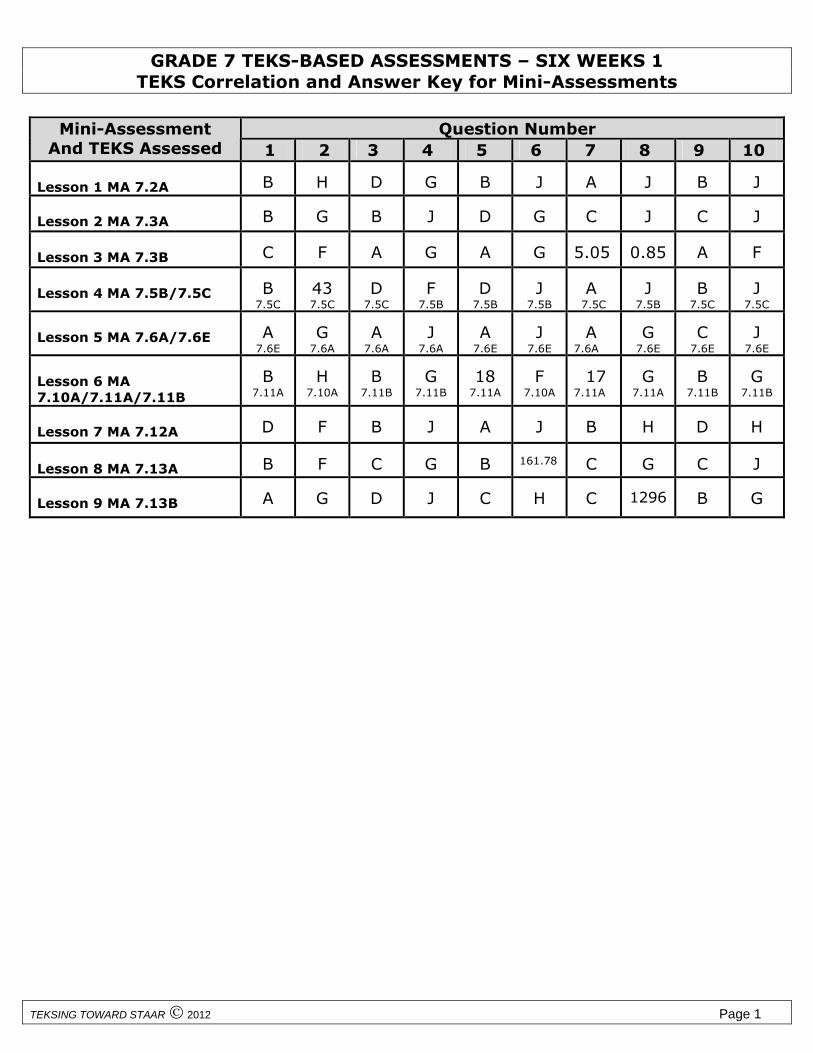
GRADE 7 TEKS-BASED ASSESSMENTS – SIX WEEKS 1TEKS Correlation and Answer Key for Mini-Assessments
TEKSING TOWARD STAAR 2012 Page 1
Question NumberMini-AssessmentAnd TEKS Assessed 1 2 3 4 5 6 7 8 9 10
Lesson 1 MA 7.2A B H D G B J A J B J
Lesson 2 MA 7.3A B G B J D G C J C J
Lesson 3 MA 7.3B C F A G A G 5.05 0.85 A F
Lesson 4 MA 7.5B/7.5C B7.5C
437.5C
D7.5C
F7.5B
D7.5B
J7.5B
A7.5C
J7.5B
B7.5C
J7.5C
Lesson 5 MA 7.6A/7.6E A7.6E
G7.6A
A7.6A
J7.6A
A7.6E
J7.6E
A7.6A
G7.6E
C7.6E
J7.6E
Lesson 6 MA7.10A/7.11A/7.11B
B7.11A
H7.10A
B7.11B
G7.11B
187.11A
F7.10A
177.11A
G7.11A
B7.11B
G7.11B
Lesson 7 MA 7.12A D F B J A J B H D H
Lesson 8 MA 7.13A B F C G B 161.78 C G C J
Lesson 9 MA 7.13B A G D J C H C 1296 B G
Six Weeks 1Lesson 1
STAAR Category 1 Grade 7 Mathematics TEKS 7.2A
TEKSING TOWARD STAAR © 2014 Page 1
7.2A Lesson and Assessment
Lesson Focus
For TEKS 7.2A, students should be able to demonstrate an understanding of how to representprobabilities and numbers. Students are expected to apply mathematical process standardsto represent and use rational numbers in a variety of forms.
Students are also expected to extend previous knowledge of sets and subsets using a visualrepresentation to describe relationships between sets of rational numbers.
Process Standards Incorporated Into Lesson
7.1B Use a problem-solving model that incorporates analyzing given information,formulating a plan or strategy, determining a solution, justifying the solution, andevaluating the problem-solving process and the reasonableness of the solution
7.1D Communicate mathematical ideas, reasoning and their implications using multiplerepresentations, including symbols, diagrams, graphs, and language as appropriate
7.1F Analyze mathematical relationships to connect and communicate mathematical ideas
Materials Needed for Lesson
1. Math BackgroundPer Student: 1 Math Notes page
2. Problem Solving 1Per Student: 1 copy of Problem-solving Plan for math notebook, 1 copy of Problem-solvingQuestions
3. Per Student: 1 copy of all pages for student activities for this lesson, Skills and ConceptsHomework, and mini-assessment for this lesson
Math Background-Understanding Rational Numbers
A group of items or numbers is called a set. A part of that set is called a subset. The set of numberswe use in our every day lives is the set of real numbers. These are the numbers that are located on anumber line. One subset of the real numbers is the set of whole numbers. Whole numbers are thenumbers 0, 1, 2, 3, 4… Each of these numbers has an opposite 0, -1, -2, -3, -4… When the wholenumbers and their opposites are joined together the set of integers is created.
The set of integers are indicated in set notation as {…-4, -3, -2, -1, 0, 1, 2, 3, 4…}. These numbers areused to label a number line with the negative numbers located to the left of zero and the positivenumbers located to the right of zero.
-5 -4 -3 -2 -1 0 1 2 3 4 5
STAAR Category 1 Grade 7 Mathematics TEKS 7.2A
TEKSING TOWARD STAAR © 2014 Page 2
If zero is removed from the set of whole numbers, the set of natural numbers or counting numbers
is created. The natural numbers can be indicated in set notation as 1, 2, 3, 4, 5, 6, 7,... .
The whole numbers, counting numbers, and integers are all subsets of a larger set called the rational
numbers. When a number of the forma
bis created where a and b are both integers but 0b , then
the set of rational numbers is created. For example, the ratio of 2 to 3 creates2
3, so
2
3is a rational
number. The ratio of 10 to 2 creates10
or 52
which is a whole number as well as a rational number.
A mixed number like 31
2is a rational number because it can be rewritten as an improper fraction,
7
2,
which is the ratio of two integers.
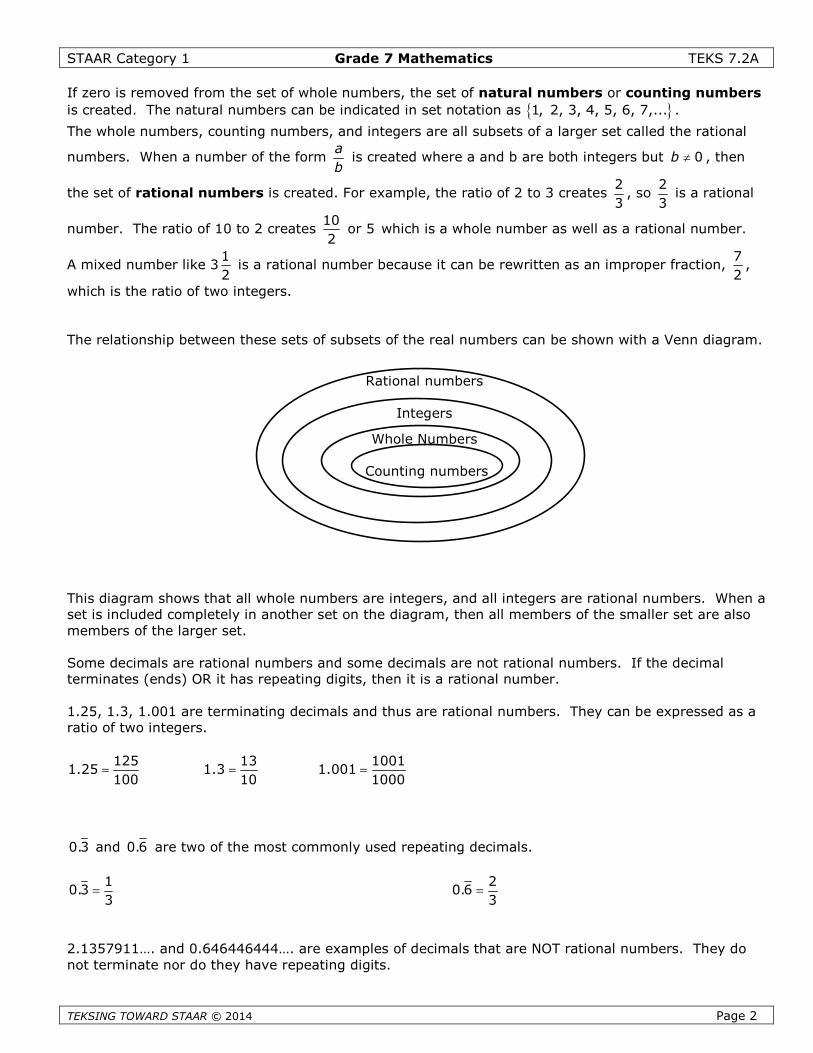
The relationship between these sets of subsets of the real numbers can be shown with a Venn diagram.
This diagram shows that all whole numbers are integers, and all integers are rational numbers. When aset is included completely in another set on the diagram, then all members of the smaller set are alsomembers of the larger set.
Some decimals are rational numbers and some decimals are not rational numbers. If the decimalterminates (ends) OR it has repeating digits, then it is a rational number.
1.25, 1.3, 1.001 are terminating decimals and thus are rational numbers. They can be expressed as aratio of two integers.
1251.25
100
131.3
10
10011.001
1000
0.3 and 0.6 are two of the most commonly used repeating decimals.
10.3
3
20.6
3
2.1357911…. and 0.646446444…. are examples of decimals that are NOT rational numbers. They donot terminate nor do they have repeating digits.
Rational numbers
Integers
Whole Numbers
Counting numbers
STAAR Category 1 Grade 7 Mathematics TEKS 7.2A
TEKSING TOWARD STAAR © 2014 Page 3
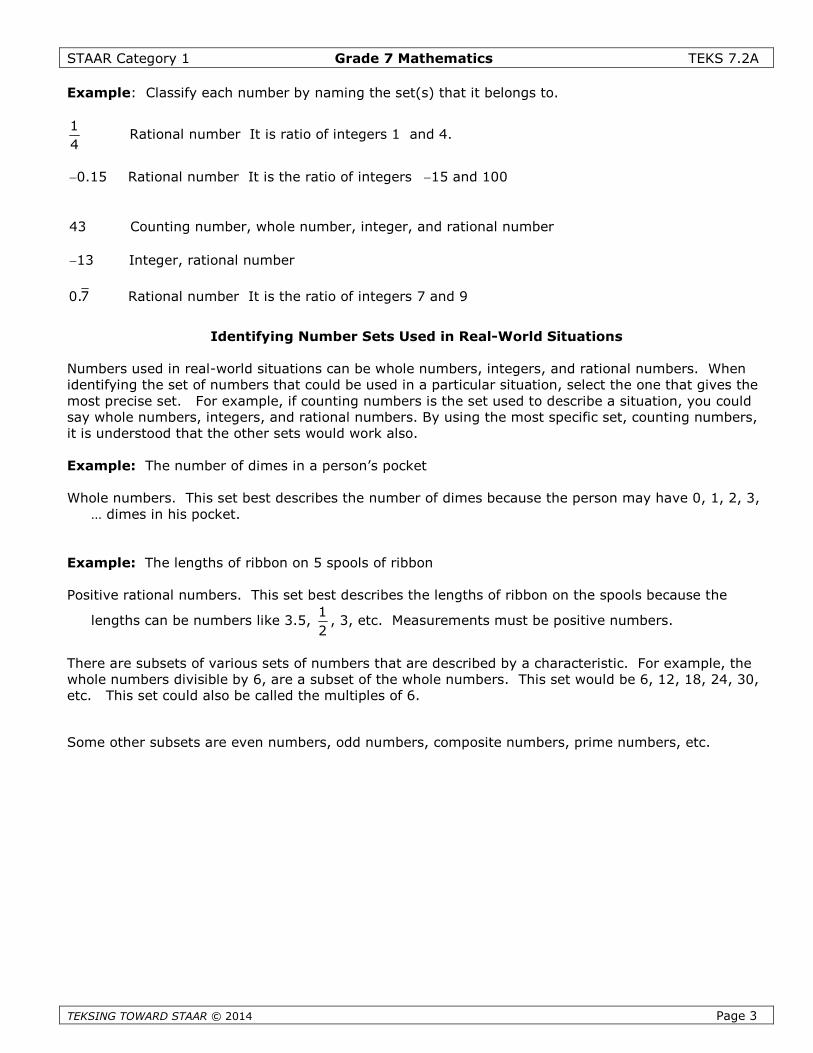
Example: Classify each number by naming the set(s) that it belongs to.
1
4Rational number It is ratio of integers 1 and 4.
0.15 Rational number It is the ratio of integers 15 and 100
43 Counting number, whole number, integer, and rational number
13 Integer, rational number
0.7 Rational number It is the ratio of integers 7 and 9
Identifying Number Sets Used in Real-World Situations
Numbers used in real-world situations can be whole numbers, integers, and rational numbers. Whenidentifying the set of numbers that could be used in a particular situation, select the one that gives themost precise set. For example, if counting numbers is the set used to describe a situation, you couldsay whole numbers, integers, and rational numbers. By using the most specific set, counting numbers,it is understood that the other sets would work also.
Example: The number of dimes in a person’s pocket
Whole numbers. This set best describes the number of dimes because the person may have 0, 1, 2, 3,… dimes in his pocket.
Example: The lengths of ribbon on 5 spools of ribbon
Positive rational numbers. This set best describes the lengths of ribbon on the spools because the
lengths can be numbers like 3.5,1
2, 3, etc. Measurements must be positive numbers.
There are subsets of various sets of numbers that are described by a characteristic. For example, thewhole numbers divisible by 6, are a subset of the whole numbers. This set would be 6, 12, 18, 24, 30,etc. This set could also be called the multiples of 6.
Some other subsets are even numbers, odd numbers, composite numbers, prime numbers, etc.
STAAR Category 1 Grade 7 Mathematics TEKS 7.2A
TEKSING TOWARD STAAR © 2014 Page 4
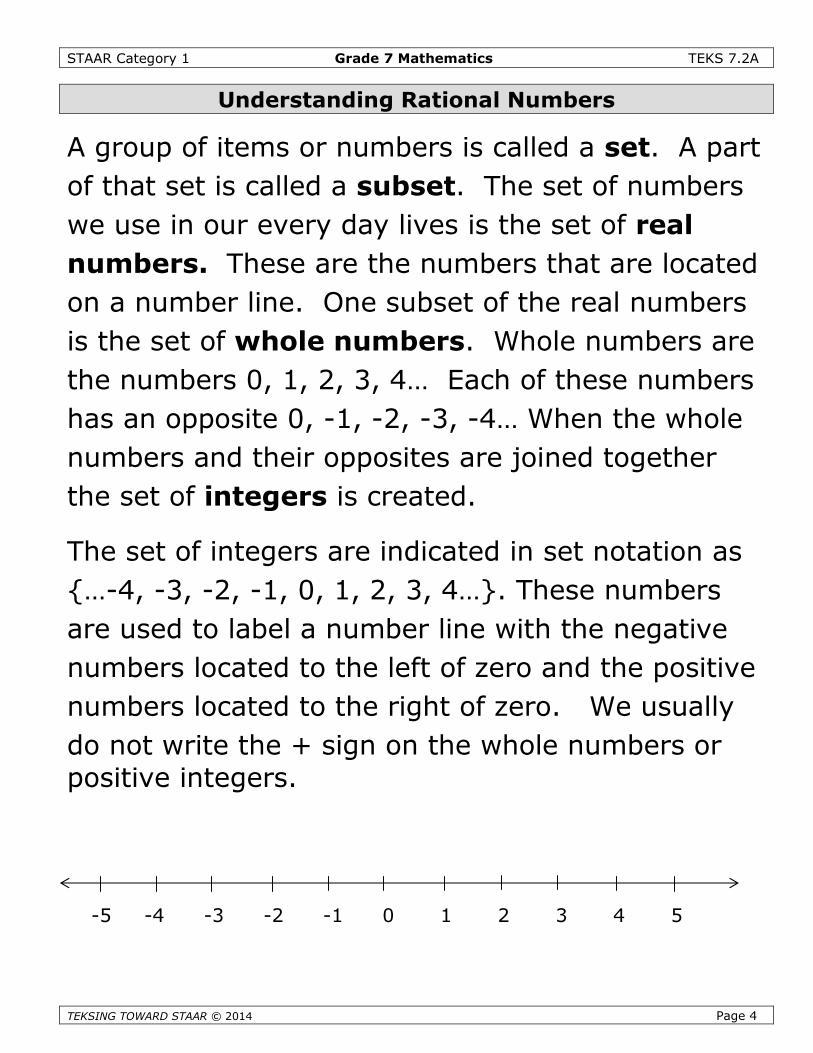
Understanding Rational Numbers
A group of items or numbers is called a set. A part
of that set is called a subset. The set of numbers
we use in our every day lives is the set of real
numbers. These are the numbers that are located
on a number line. One subset of the real numbers
is the set of whole numbers. Whole numbers are
the numbers 0, 1, 2, 3, 4… Each of these numbers
has an opposite 0, -1, -2, -3, -4… When the whole
numbers and their opposites are joined together
the set of integers is created.
The set of integers are indicated in set notation as
{…-4, -3, -2, -1, 0, 1, 2, 3, 4…}. These numbers
are used to label a number line with the negative
numbers located to the left of zero and the positive
numbers located to the right of zero. We usually
do not write the + sign on the whole numbers orpositive integers.
-5 -4 -3 -2 -1 0 1 2 3 4 5
STAAR Category 1 Grade 7 Mathematics TEKS 7.2A
TEKSING TOWARD STAAR © 2014 Page 5
If zero is removed from the set of whole numbers,the set of natural numbers or countingnumbers is created. The natural numbers can beindicated in set notation as 1, 2, 3, 4, 5, 6, 7,... .
When a number of the forma
bis created where a
and b are both integers but 0b , then the set of
rational numbers is created. The ratio of 2 to 3
creates2
3, so
2
3is a rational number. The ratio of
10 to 2 creates10
or 52
which is a whole number
as well as a rational number. Any rational number
can be plotted on a number line.
A mixed number like 31
2is a rational number
because it can be rewritten as an improper fraction,7
2, which is the ratio of two integers.
STAAR Category 1 Grade 7 Mathematics TEKS 7.2A
TEKSING TOWARD STAAR © 2014 Page 6
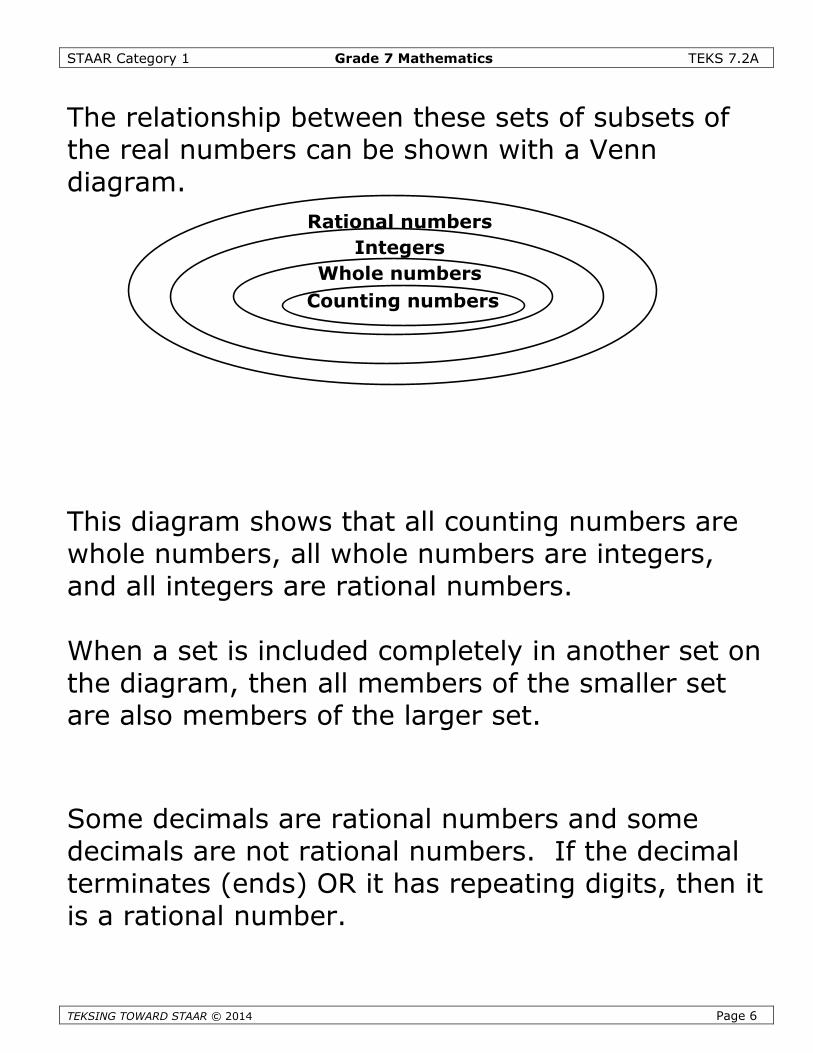
The relationship between these sets of subsets ofthe real numbers can be shown with a Venndiagram.
This diagram shows that all counting numbers arewhole numbers, all whole numbers are integers,and all integers are rational numbers.
When a set is included completely in another set onthe diagram, then all members of the smaller setare also members of the larger set.
Some decimals are rational numbers and somedecimals are not rational numbers. If the decimalterminates (ends) OR it has repeating digits, then itis a rational number.
Rational numbers
Integers
Whole numbers
Counting numbers
STAAR Category 1 Grade 7 Mathematics TEKS 7.2A
TEKSING TOWARD STAAR © 2014 Page 7
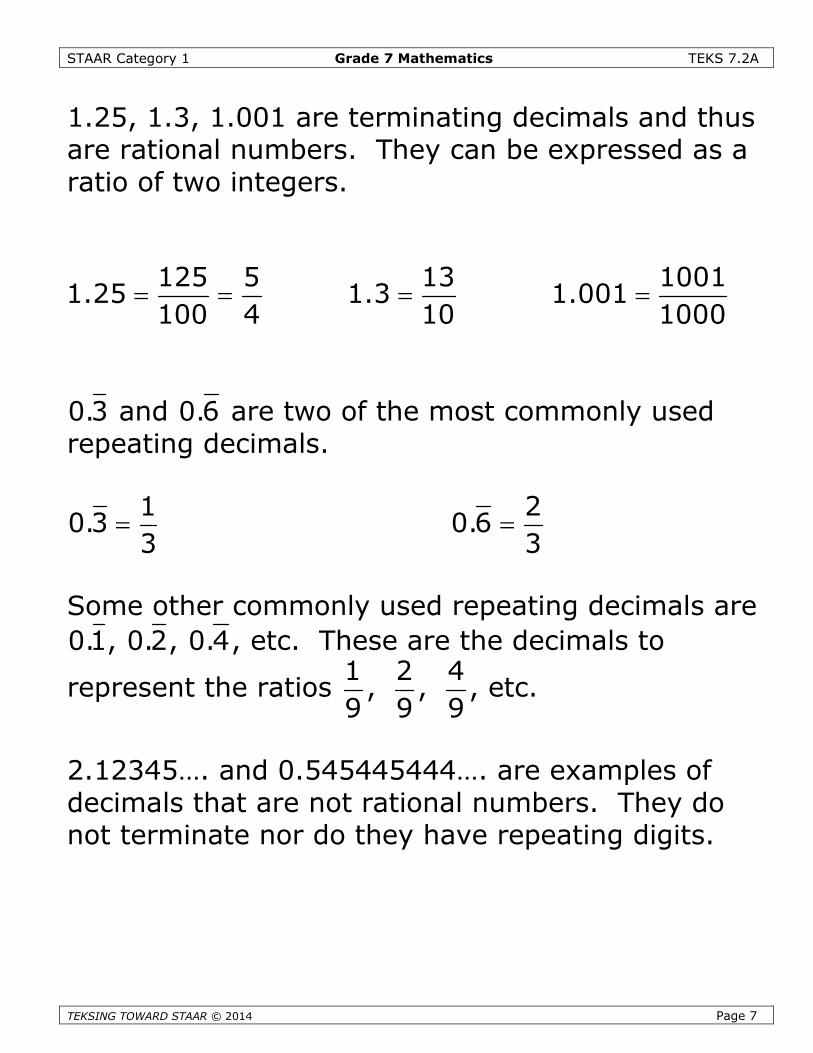
1.25, 1.3, 1.001 are terminating decimals and thusare rational numbers. They can be expressed as aratio of two integers.
125 51.25
100 4
131.3
10
10011.001
1000
0.3 and 0.6 are two of the most commonly usedrepeating decimals.
10.3
3
20.6
3
Some other commonly used repeating decimals are
0.1, 0.2, 0.4, etc. These are the decimals to
represent the ratios1 2 4
, ,9 9 9
, etc.
2.12345…. and 0.545445444…. are examples ofdecimals that are not rational numbers. They donot terminate nor do they have repeating digits.
STAAR Category 1 Grade 7 Mathematics TEKS 7.2A
TEKSING TOWARD STAAR © 2014 Page 8
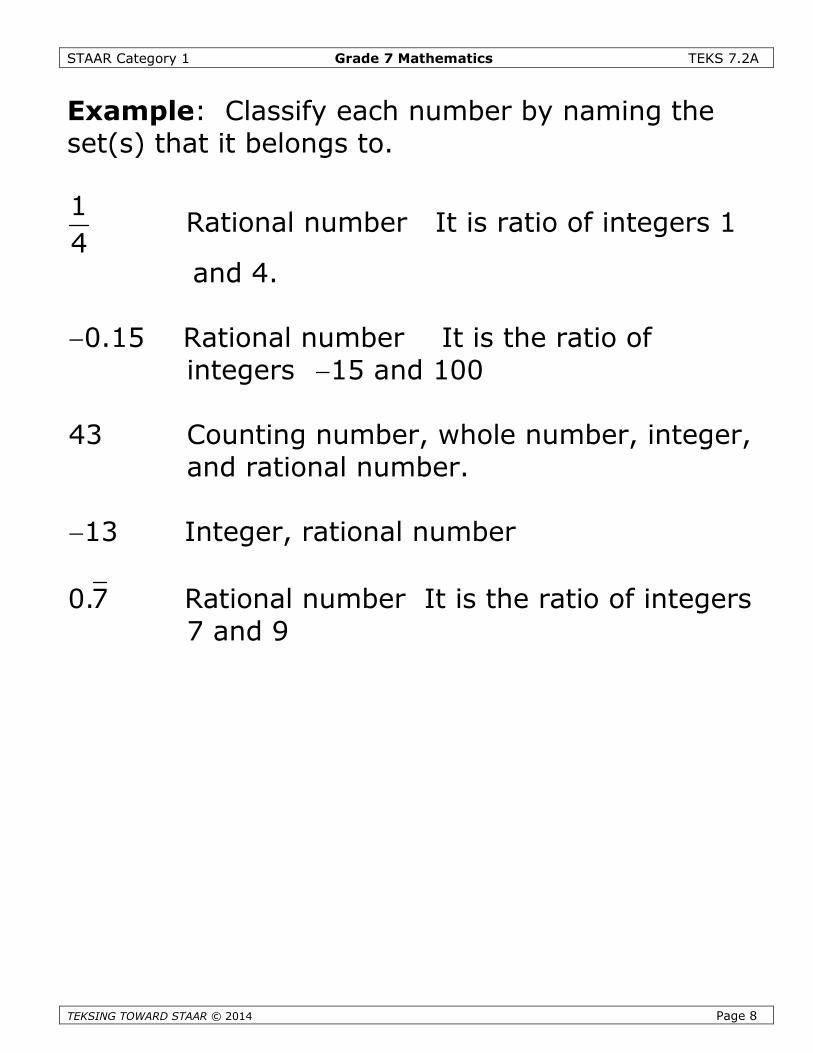
Example: Classify each number by naming theset(s) that it belongs to.
1
4Rational number It is ratio of integers 1
and 4.
0.15 Rational number It is the ratio ofintegers 15 and 100
43 Counting number, whole number, integer,and rational number.
13 Integer, rational number
0.7 Rational number It is the ratio of integers7 and 9
STAAR Category 1 Grade 7 Mathematics TEKS 7.2A
TEKS
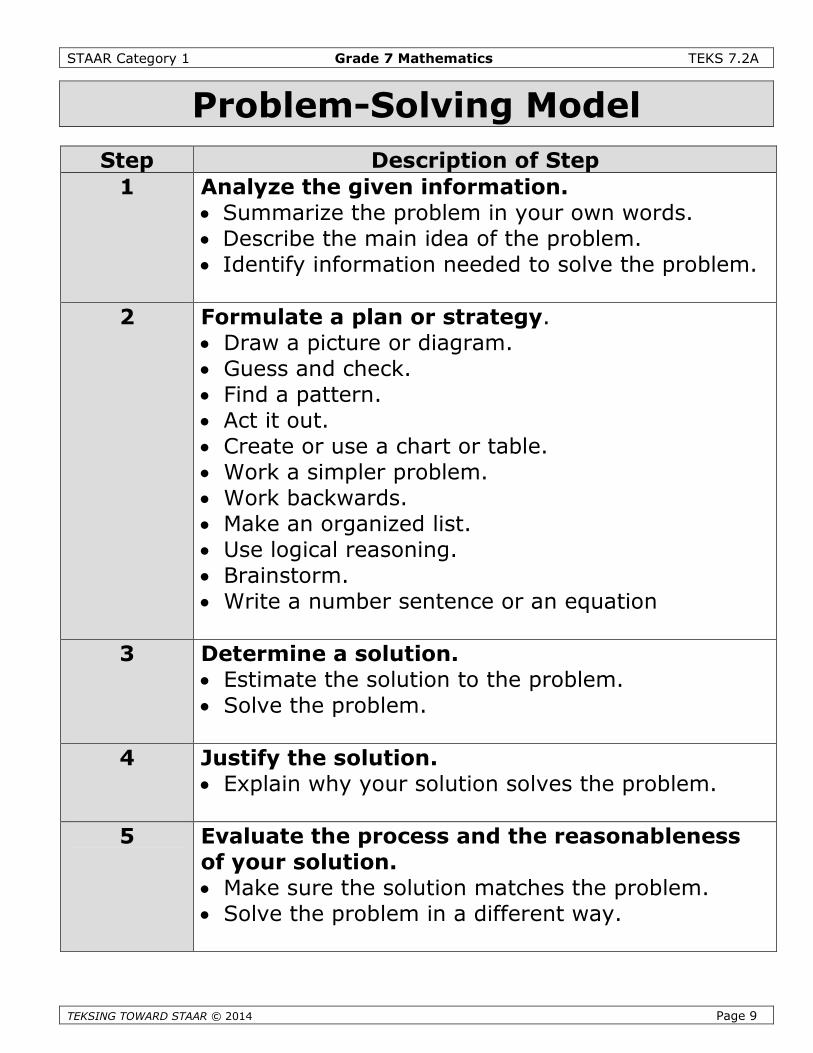
Problem-Solving Model
Step Description of Step1 Analyze the given information.
Summarize the problem in your own words. Describe the main idea of the problem. Identify information needed to solve the problem.
2 Formulate a plan or strategy. Draw a picture or diagram. Guess and check. Find a pattern. Act it out. Create or use a chart or table. Work a simpler problem. Work backwards. Make an organized list. Use logical reasoning. Brainstorm. Write a number sentence or an equation
3 Determine a solution. Estimate the solution to the problem. Solve the problem.
4 Justify the solution. Explain why your solution solves the problem.
ING TOWARD STAAR © 2014 Page 9
5 Evaluate the process and the reasonablenessof your solution. Make sure the solution matches the problem. Solve the problem in a different way.
STAAR Category 1 Grade 7 Mathematics TEKS 7.2A
TEKSING TOWARD STAAR © 2014 Page 10
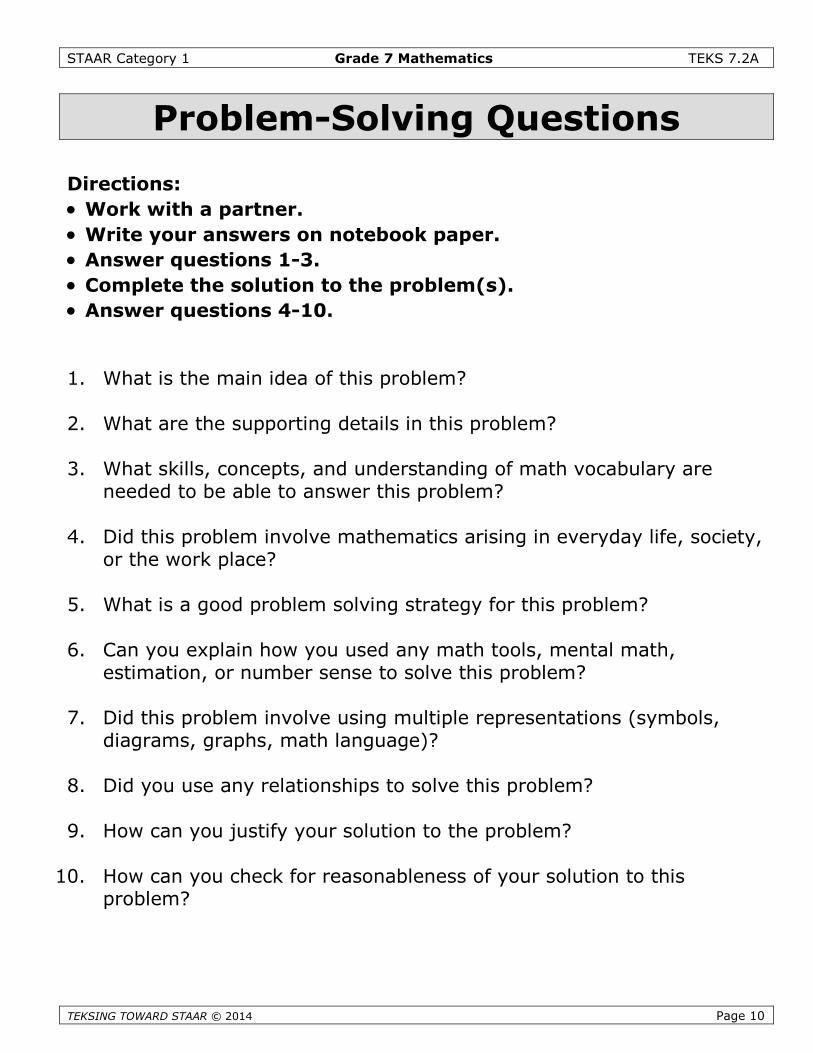
Problem-Solving Questions
Directions:
Work with a partner.
Write your answers on notebook paper.
Answer questions 1-3.
Complete the solution to the problem(s).
Answer questions 4-10.
1. What is the main idea of this problem?
2. What are the supporting details in this problem?
3. What skills, concepts, and understanding of math vocabulary areneeded to be able to answer this problem?
4. Did this problem involve mathematics arising in everyday life, society,or the work place?
5. What is a good problem solving strategy for this problem?
6. Can you explain how you used any math tools, mental math,estimation, or number sense to solve this problem?
7. Did this problem involve using multiple representations (symbols,diagrams, graphs, math language)?
8. Did you use any relationships to solve this problem?
9. How can you justify your solution to the problem?
10. How can you check for reasonableness of your solution to thisproblem?
STAAR Category 1 Grade 7 Mathematics TEKS 7.2A
TEKSING TOWARD STAAR © 2014 Page 11
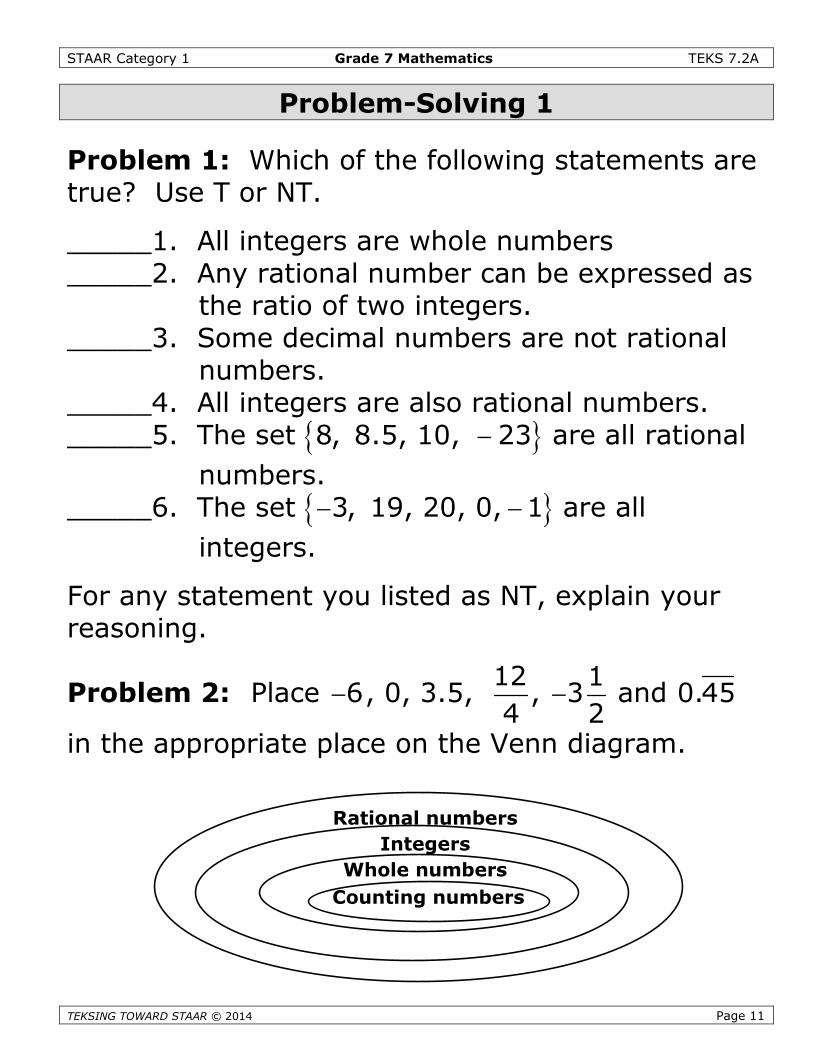
Problem-Solving 1
Problem 1: Which of the following statements aretrue? Use T or NT.
_____1. All integers are whole numbers_____2. Any rational number can be expressed as
the ratio of two integers._____3. Some decimal numbers are not rational
numbers._____4. All integers are also rational numbers._____5. The set 8, 8.5, 10, 23 are all rational
numbers._____6. The set 3, 19, 20, 0, 1 are all
integers.
For any statement you listed as NT, explain yourreasoning.
Problem 2: Place 6 , 0, 3.5,12
4,
13
2 and 0.45
in the appropriate place on the Venn diagram.
Rational numbers
Integers
Whole numbers
Counting numbers
STAAR Category 1 Grade 7 Mathematics TEKS 7.2A
TEKSING
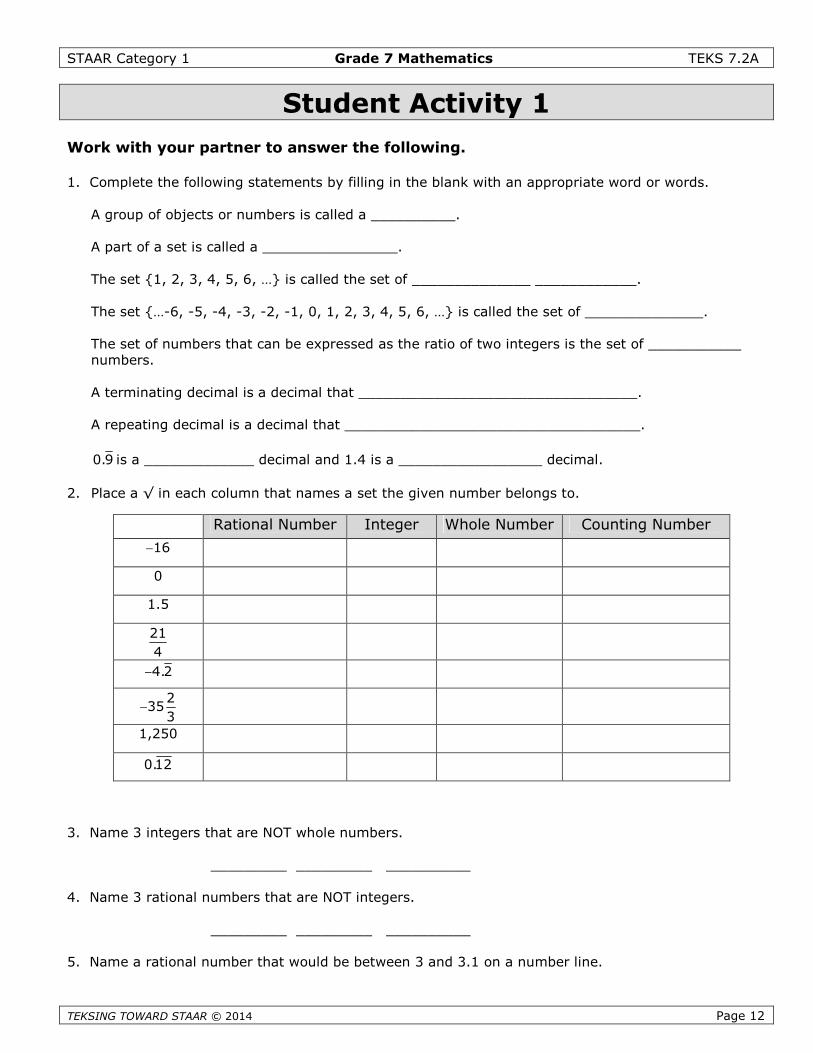
Student Activity 1
Work with your partner to answer the following.
1. Complete the following statements by filling in the blank with an appropriate word or words.
A group of objects or numbers is called a __________.
A part of a set is called a ________________.
The set {1, 2, 3, 4, 5, 6, …} is called the set of ______________ ____________.
The set {…-6, -5, -4, -3, -2, -1, 0, 1, 2, 3, 4, 5, 6, …} is called the set of ______________.
The set of numbers that can be expressed as the ratio of two integers is the set of ___________numbers.
A terminating decimal is a decimal that _________________________________.
A repeating decimal is a decimal that ___________________________________.
0.9 is a _____________ decimal and 1.4 is a _________________ decimal.
2. Place a √ in each column that names a set the given number belongs to.
3. Nam
4. Nam
5. Nam
Rational Number Integer Whole Number Counting Number
16
0
1.5
21
4
4.2
235
3
1,250
TOWARD STAAR © 2014 Page 12
e 3 integers that are NOT whole numbers.
_________ _________ __________
e 3 rational numbers that are NOT integers.
_________ _________ __________
e a rational number that would be between 3 and 3.1 on a number line.
0.12
STAAR Category 1 Grade 7 Mathematics TEKS 7.2A
TEKSING TOWARD STAAR © 2014 Page 13
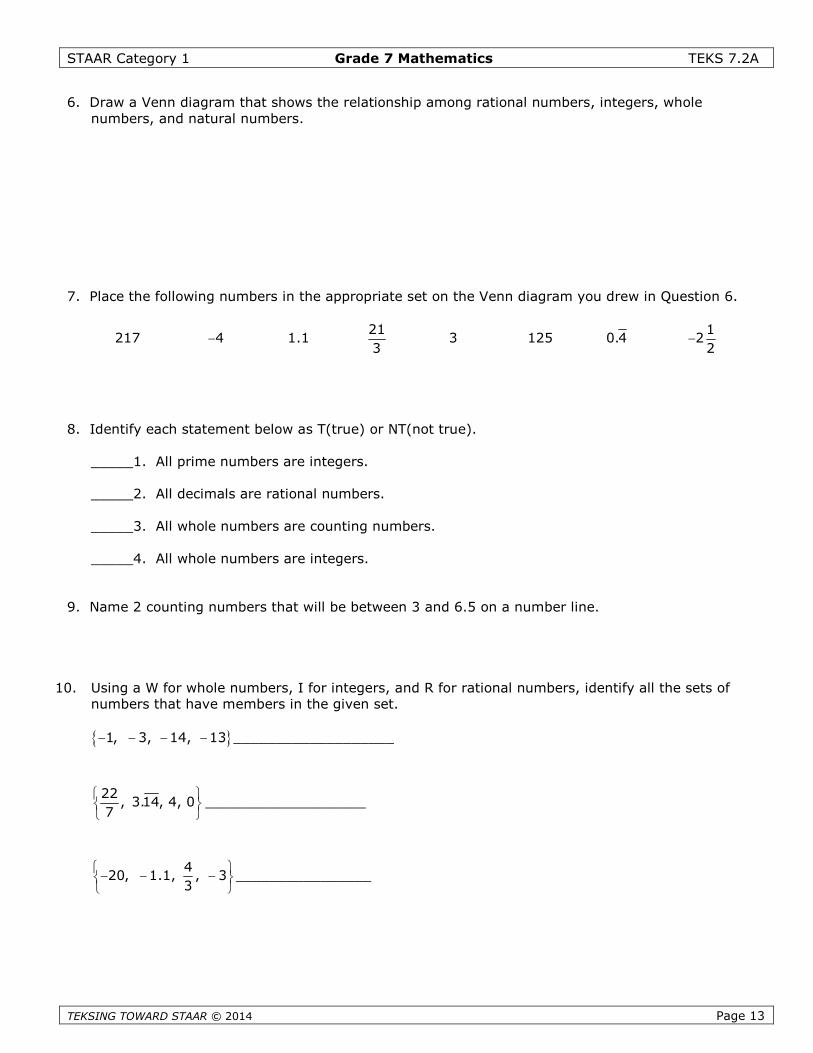
6. Draw a Venn diagram that shows the relationship among rational numbers, integers, wholenumbers, and natural numbers.
7. Place the following numbers in the appropriate set on the Venn diagram you drew in Question 6.
217 4 1.121
33 125 0.4
12
2
8. Identify each statement below as T(true) or NT(not true).
_____1. All prime numbers are integers.
_____2. All decimals are rational numbers.
_____3. All whole numbers are counting numbers.
_____4. All whole numbers are integers.
9. Name 2 counting numbers that will be between 3 and 6.5 on a number line.
10. Using a W for whole numbers, I for integers, and R for rational numbers, identify all the sets ofnumbers that have members in the given set.
1, 3, 14, 13 ___________________
22, 3.14, 4, 0
7
___________________
420, 1.1, , 3
3
________________
STAAR Category 1 Grade 7 Mathematics TEKS 7.2A
TEKSING TOWARD STAAR © 2014 Page 14
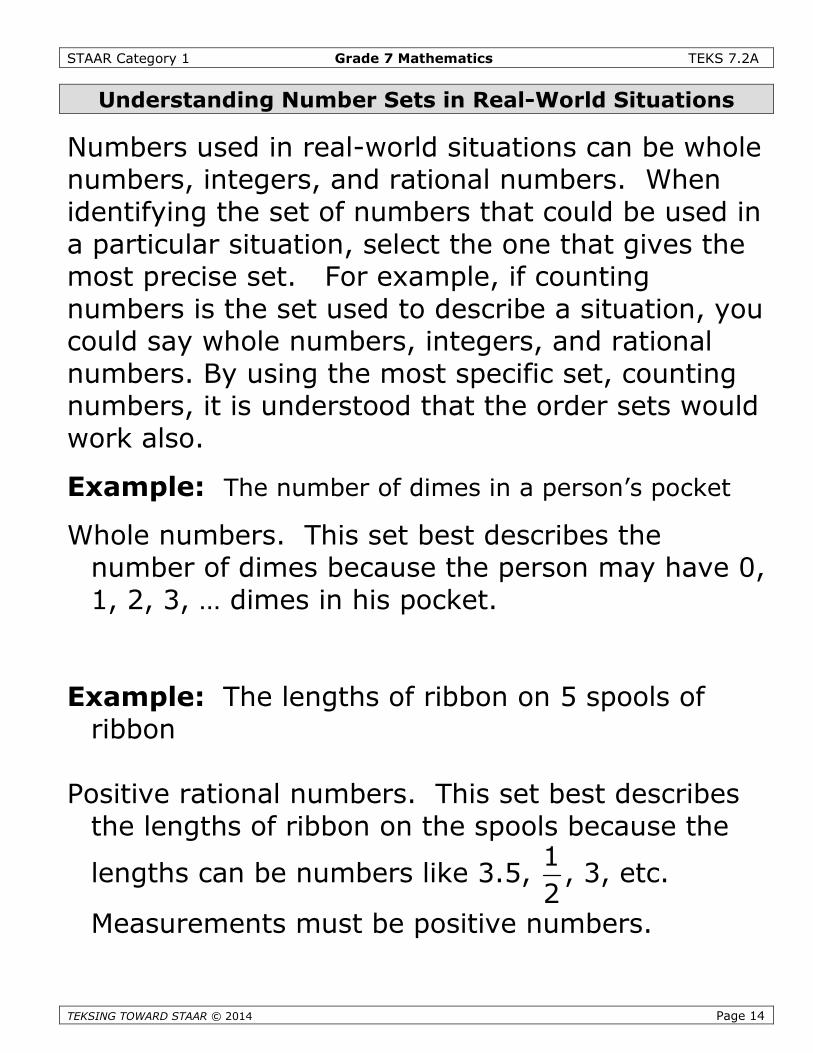
Understanding Number Sets in Real-World Situations
Numbers used in real-world situations can be wholenumbers, integers, and rational numbers. Whenidentifying the set of numbers that could be used ina particular situation, select the one that gives themost precise set. For example, if countingnumbers is the set used to describe a situation, youcould say whole numbers, integers, and rationalnumbers. By using the most specific set, countingnumbers, it is understood that the order sets wouldwork also.
Example: The number of dimes in a person’s pocket
Whole numbers. This set best describes thenumber of dimes because the person may have 0,1, 2, 3, … dimes in his pocket.
Example: The lengths of ribbon on 5 spools ofribbon
Positive rational numbers. This set best describesthe lengths of ribbon on the spools because the
lengths can be numbers like 3.5,1
2, 3, etc.
Measurements must be positive numbers.
STAAR Category 1 Grade 7 Mathematics TEKS 7.2A
TEKSING TOWARD STAAR © 2014 Page 15
There are subsets of various sets of numbers thatare described by a characteristic. For example, thewhole numbers divisible by 6 are a subset of thewhole numbers. This set would be 6, 12, 18, 24,30, etc. This set could also be called the multiplesof 6.
Some other subsets are even numbers, oddnumbers, composite numbers, prime numbers, etc.All of these subsets we have studied in priorgrades.
STAAR Category 1 Grade 7 Mathematics TEKS 7.2A
TEKSING TOWARD STAAR © 2014 Page 16
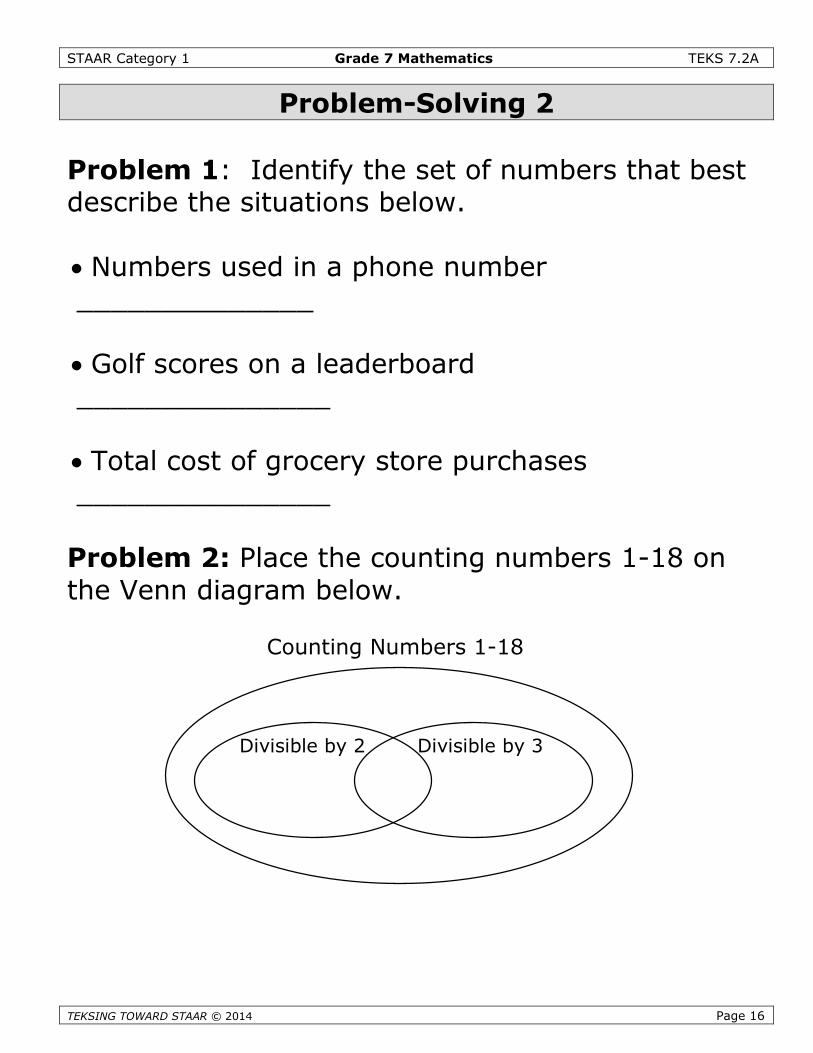
Problem-Solving 2
Problem 1: Identify the set of numbers that bestdescribe the situations below.
Numbers used in a phone number______________
Golf scores on a leaderboard_______________
Total cost of grocery store purchases_______________
Problem 2: Place the counting numbers 1-18 onthe Venn diagram below.
Counting Numbers 1-18
Divisible by 2 Divisible by 3

STAAR Category 1 Grade 7 Mathematics TEKS 7.2A
TEKSING TOWARD STAAR © 2014 Page 17
Student Activity 2
Work with your partner to answer the following.
1. Identify the set of numbers that best describes each situation
The amount of the ingredients used to make brownies
The number of homeruns hit by a baseball team during the last game of the season
A board game has a spinner with 3 sections- Lose your Turn, Move Forward, Move Backward and anumber cube with the numbers 1-6. The number of moves you make after a spin and a roll
The number of students on a school bus when it arrives at school in the morning
The number of seconds recorded for the times of the participants running the 100 meter dash at atrack meet
The balance in a person’s check register
The height of a person in centimeters
2. How can you show the relationship among the set of rational numbers, integers, whole numbers,and counting numbers?
3. Fill in the following Venn diagrams with the counting numbers 1 to 20.
Counting Numbers 1 to 20
Numbersdivisibleby 3
Numbersdivisibleby 5
Counting Numbers 1 to 20
EvenNumbers
Numbersdivisibleby 7
STAAR Category 1 Grade 7 Mathematics TEKS 7.2A
TEKSING TOWARD STAAR © 2014 Page 18
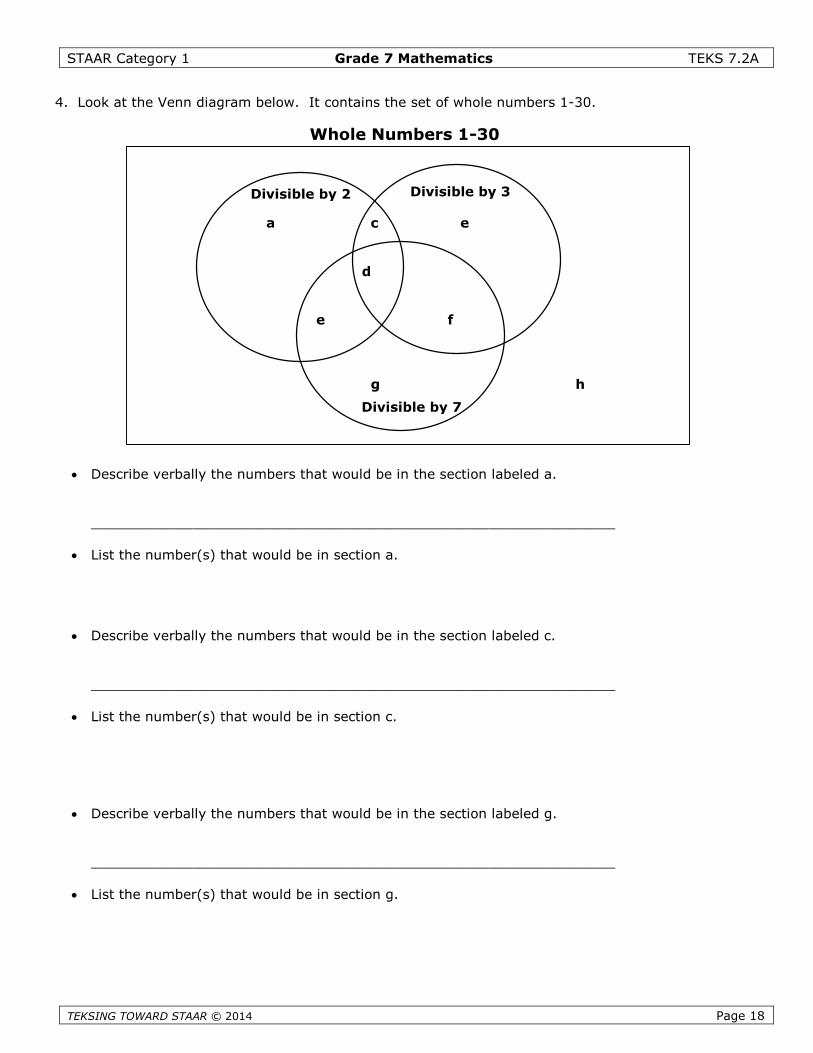
4. Look at the Venn diagram below. It contains the set of whole numbers 1-30.
Describe verbally the numbers that would be in the section labeled a.
______________________________________________________________
List the number(s) that would be in section a.
Describe verbally the numbers that would be in the section labeled c.
______________________________________________________________
List the number(s) that would be in section c.
Describe verbally the numbers that would be in the section labeled g.
______________________________________________________________
List the number(s) that would be in section g.
a c e
d
e f
g h
Divisible by 2
Divisible by 7
Divisible by 3
Whole Numbers 1-30
STAAR Category 1 Grade 7 Mathematics TEKS 7.2A
TEKSING TOWARD STAAR © 2014 Page 19
Describe verbally the numbers that would be in the section labeled d.
______________________________________________________________
List the number(s) that would be in section d.
Describe verbally the numbers that would be in the section labeled b.
______________________________________________________________
List the number(s) that would be in section b.
Describe verbally the numbers that would be in the section labeled h.
______________________________________________________________
List the number(s) that would be in section h.
Describe verbally the numbers that would be in the section labeled f.
______________________________________________________________
List the number(s) that would be in section f.
Describe verbally the numbers that would be in the section labeled e.
______________________________________________________________
List the number(s) that would be in section e.
Are all the whole numbers 1-30 found in at least one of the sections? Explain your answer.
Were any of the sections empty? Explain
STAAR Category 1 Grade 7 Mathematics TEKS 7.2A
TEKSING TOWARD STAAR © 2014 Page 20
NAME___________________ DATE_____________________ SCORE ___/5
7.2A Skills and Concepts Homework 1
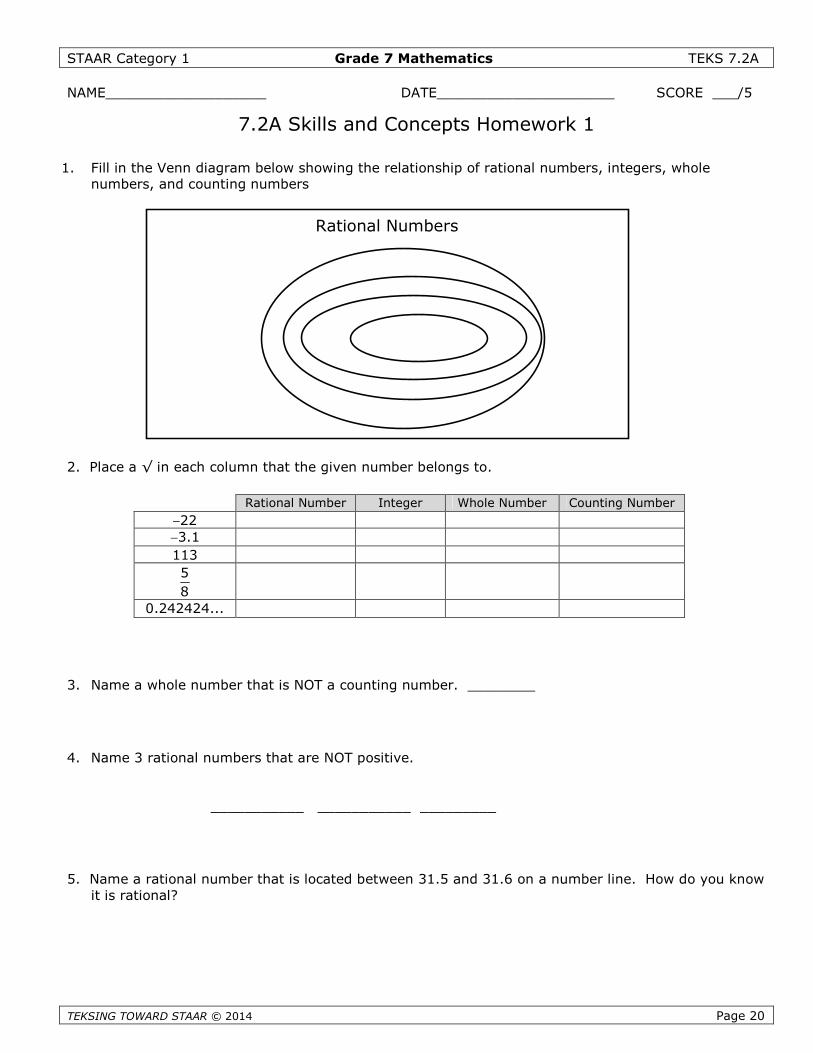
1. Fill in the Venn diagram below showing the relationship of rational numbers, integers, wholenumbers, and counting numbers
2. Place a √ in each column that the given number belongs to.
3. Name a whole number that is NOT a counting number. ________
4. Name 3 rational numbers that are NOT positive.
___________ ___________ _________
5. Name a rational number that is located between 31.5 and 31.6 on a number line. How do you knowit is rational?
Rational Number Integer Whole Number Counting Number
223.1
113
5
8
0.242424...
Rational Numbers
STAAR Category 1 Grade 7 Mathematics TEKS 7.2A
TEKSING TOWARD STAAR © 2014 Page 21
NAME___________________ DATE_____________________ SCORE ___/5
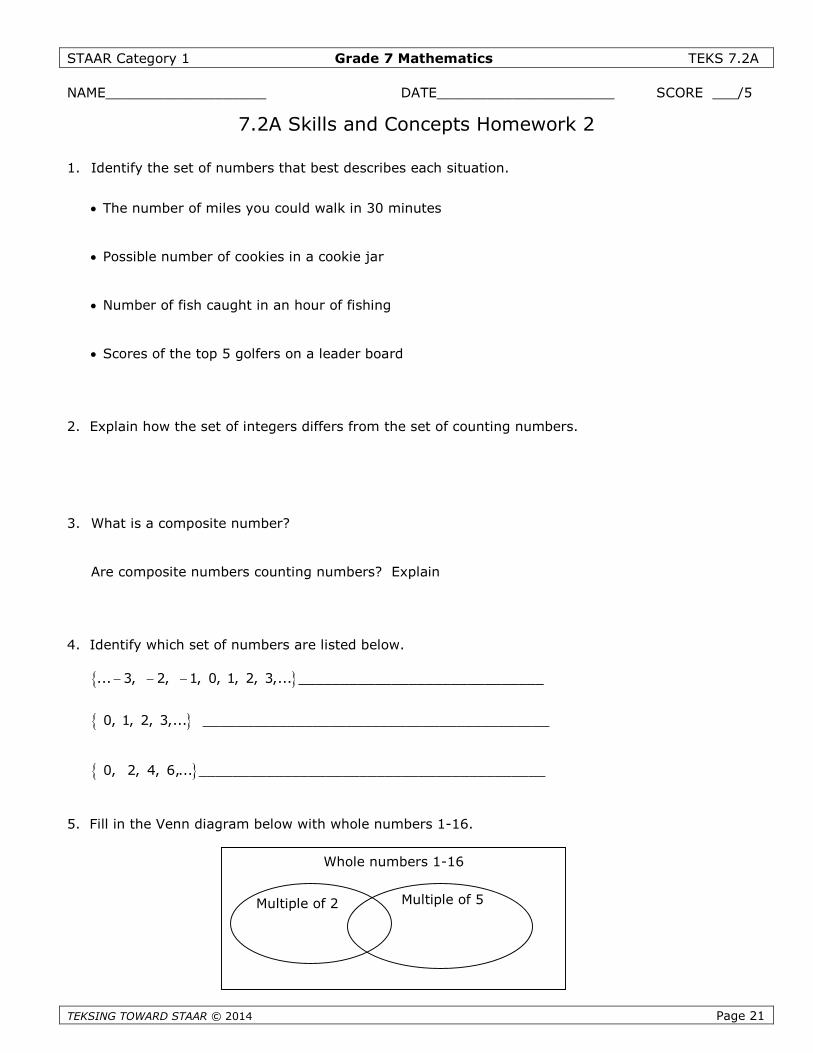
7.2A Skills and Concepts Homework 2
1. Identify the set of numbers that best describes each situation.
The number of miles you could walk in 30 minutes
Possible number of cookies in a cookie jar
Number of fish caught in an hour of fishing
Scores of the top 5 golfers on a leader board
2. Explain how the set of integers differs from the set of counting numbers.
3. What is a composite number?
Are composite numbers counting numbers? Explain
4. Identify which set of numbers are listed below.
... 3, 2, 1, 0, 1, 2, 3,... _____________________________
0, 1, 2, 3,... _________________________________________
0, 2, 4, 6,... _________________________________________
5. Fill in the Venn diagram below with whole numbers 1-16.
Whole numbers 1-16
Multiple of 2 Multiple of 5
STAAR Category 1 Grade 7 Mathematics TEKS 7.2A
TEKSING TOWARD STAAR © 2014 Page 22
NAME___________________ DATE_____________________ SCORE ___/10
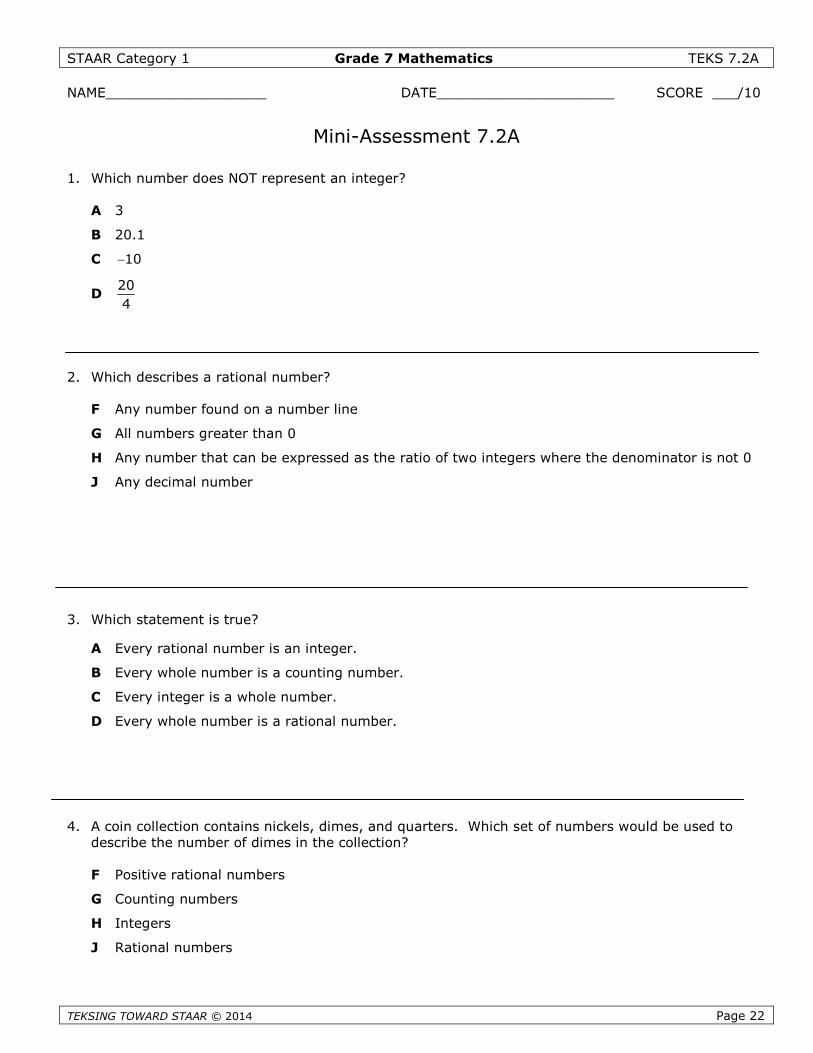
Mini-Assessment 7.2A
1. Which number does NOT represent an integer?
A 3
B 20.1
C 10
D20
4
2. Which describes a rational number?
F Any number found on a number line
G All numbers greater than 0
H Any number that can be expressed as the ratio of two integers where the denominator is not 0
J Any decimal number
3. Which statement is true?
A Every rational number is an integer.
B Every whole number is a counting number.
C Every integer is a whole number.
D Every whole number is a rational number.
4. A coin collection contains nickels, dimes, and quarters. Which set of numbers would be used todescribe the number of dimes in the collection?
F Positive rational numbers
G Counting numbers
H Integers
J Rational numbers
STAAR Category 1 Grade 7 Mathematics TEKS 7.2A
TEKSING TOWARD STAAR © 2014 Page 23
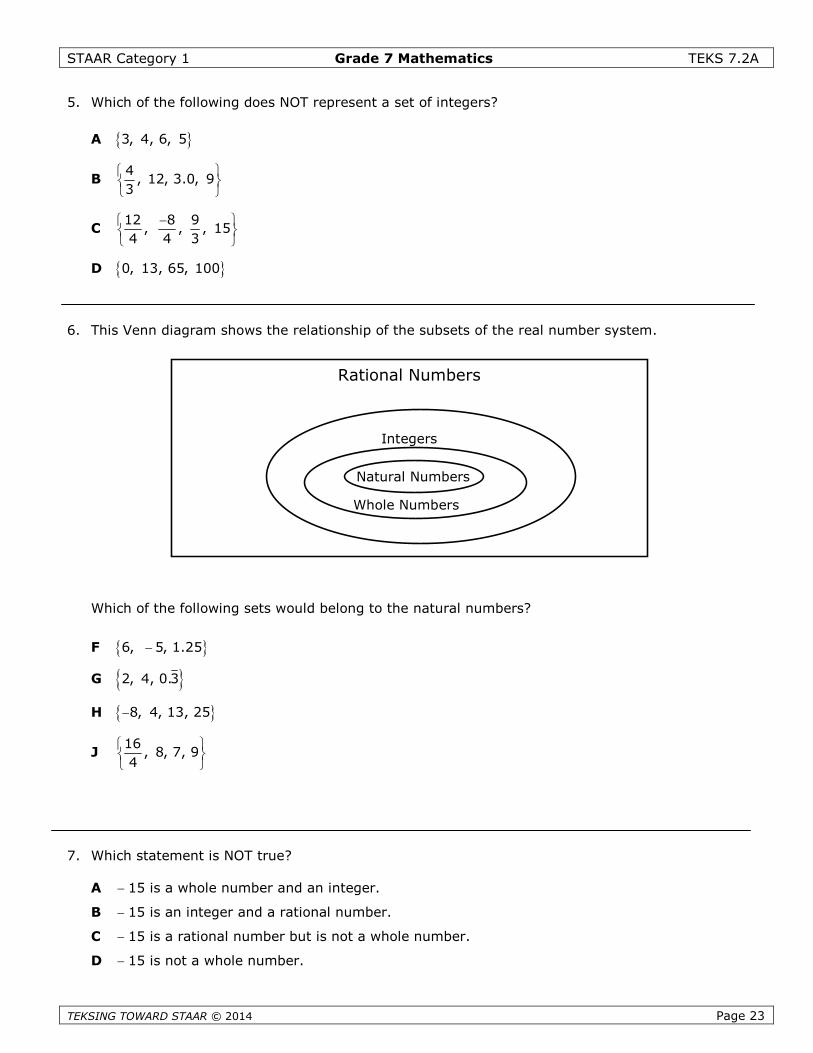
5. Which of the following does NOT represent a set of integers?
A 3, 4, 6, 5
B4
, 12, 3.0, 93
C12 8 9
, , , 154 4 3
D 0, 13, 65, 100
6. This Venn diagram shows the relationship of the subsets of the real number system.
Which of the following sets would belong to the natural numbers?
F 6, 5, 1.25
G 2, 4, 0.3
H 8, 4, 13, 25
J16
, 8, 7, 94
7. Which statement is NOT true?
A 15 is a whole number and an integer.
B 15 is an integer and a rational number.
C 15 is a rational number but is not a whole number.
D 15 is not a whole number.
Rational Numbers
Integers
Whole Numbers
Natural Numbers
STAAR Category 1 Grade 7 Mathematics TEKS 7.2A
TEKSING TOWARD STAAR © 2014 Page 24
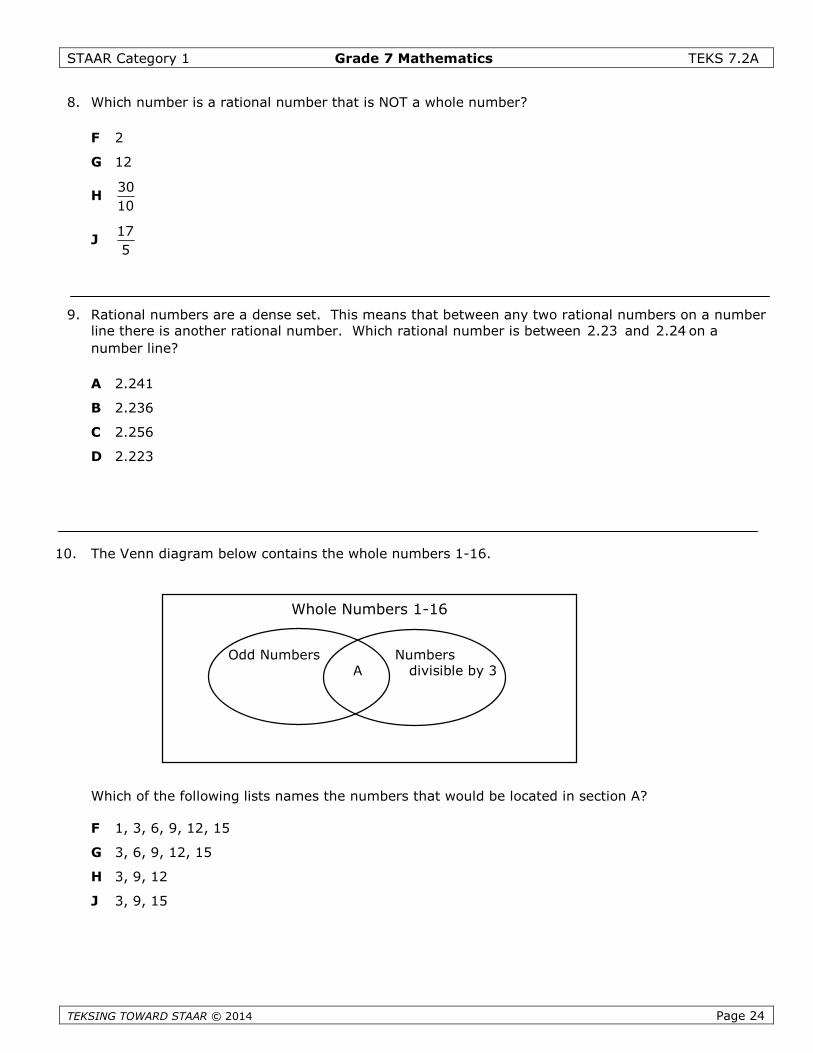
8. Which number is a rational number that is NOT a whole number?
F 2
G 12
H30
10
J17
5
9. Rational numbers are a dense set. This means that between any two rational numbers on a numberline there is another rational number. Which rational number is between 2.23 and 2.24 on a
number line?
A 2.241
B 2.236
C 2.256
D 2.223
10. The Venn diagram below contains the whole numbers 1-16.
Which of the following lists names the numbers that would be located in section A?
F 1, 3, 6, 9, 12, 15
G 3, 6, 9, 12, 15
H 3, 9, 12
J 3, 9, 15
Whole Numbers 1-16
Odd Numbers NumbersA divisible by 3
Six Weeks 1Review andAssessment
STAAR Category 1, 2, 3, 4 Grade 7 Mathematics Six Weeks 1
TEKSING TOWARD STAAR © 2014 Page 1
Six Weeks 1 Review
This review can be used in the same manner as a Student Activity from the lessons. Notes can be usedto complete the review and they can work with a partner. You can assign different portions to differentpartner pairs to be responsible for debriefing for the entire class. Students can complete any answersthey did not get before the debriefing. They just need to use a different color to record any additionalanswers.
It can be completed entirely in class, or it can be taken home to be completed and then debriefed inclass prior to the six week assessment.
STAAR Category 1, 2, 3, 4 Grade 7 Mathematics Six Weeks 1
TEKSING TOWARD STAAR © 2014 Page 2
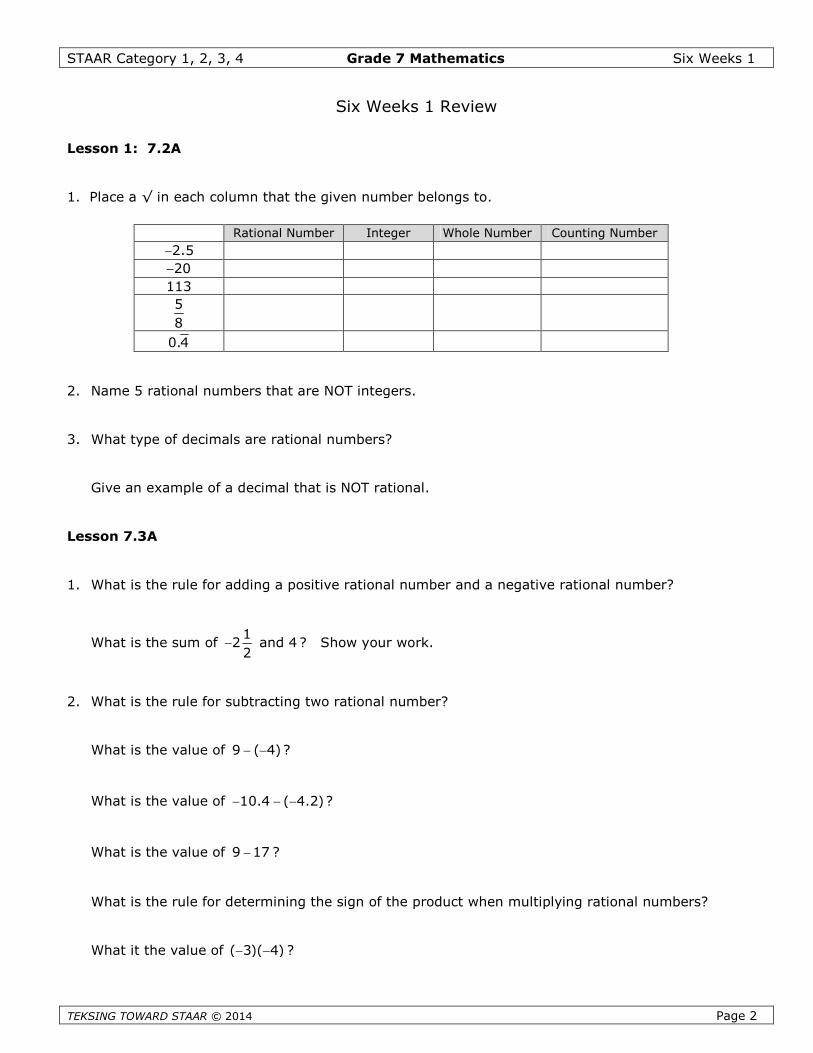
Six Weeks 1 Review
Lesson 1: 7.2A
1. Place a √ in each column that the given number belongs to.
2. Name 5 rational numbers that are NOT integers.
3. What type of decimals are rational numbers?
Give an example of a decimal that is NOT rational.
Lesson 7.3A
1. What is the rule for adding a positive rational number and a negative rational number?
What is the sum of1
2 and 42
? Show your work.
2. What is the rule for subtracting two rational number?
What is the value of 9 ( 4) ?
What is the value of 10.4 ( 4.2) ?
What is the value of 9 17 ?
What is the rule for determining the sign of the product when multiplying rational numbers?
What it the value of ( 3)( 4) ?
Rational Number Integer Whole Number Counting Number
2.5
20
113
5
8
0.4

STAAR Category 1, 2, 3, 4 Grade 7 Mathematics Six Weeks 1
TEKSING TOWARD STAAR © 2014 Page 3
What is the value of (3.5)( 8) ?
What is the rule for determining the sign of the quotient when dividing rational numbers?
What is the value of ( 300) ( 4) ?
What is the value of ( 20) (2.5) ?
What is the value of3
( 22) 24
?
Lesson 3: 7.3B
1. Dorothy wants to save $72.24 to buy her grandmother a special birthday gift. She has 12 weeks tosave the money. If she wants to save the same amount each week, how much money, in dollars andcents, does she need to save each week? Show your work.
2. Susie is finishing a research project for her history class. On Monday and Tuesday she worked for 31
2
hours each day. On Wednesday she worked for 23
5hours.
What was the total number of hours she worked on the project these 3 days? Show your work.
How many more hours did she work on the project on Tuesday than she did on Wednesday? Showyour work.
Lesson 4: 7.5A 7.5C
1. Describe the characteristics of two similar quadrilaterals.
STAAR Category 1, 2, 3, 4 Grade 7 Mathematics Six Weeks 1
TEKSING TOWARD STAAR © 2014 Page 4
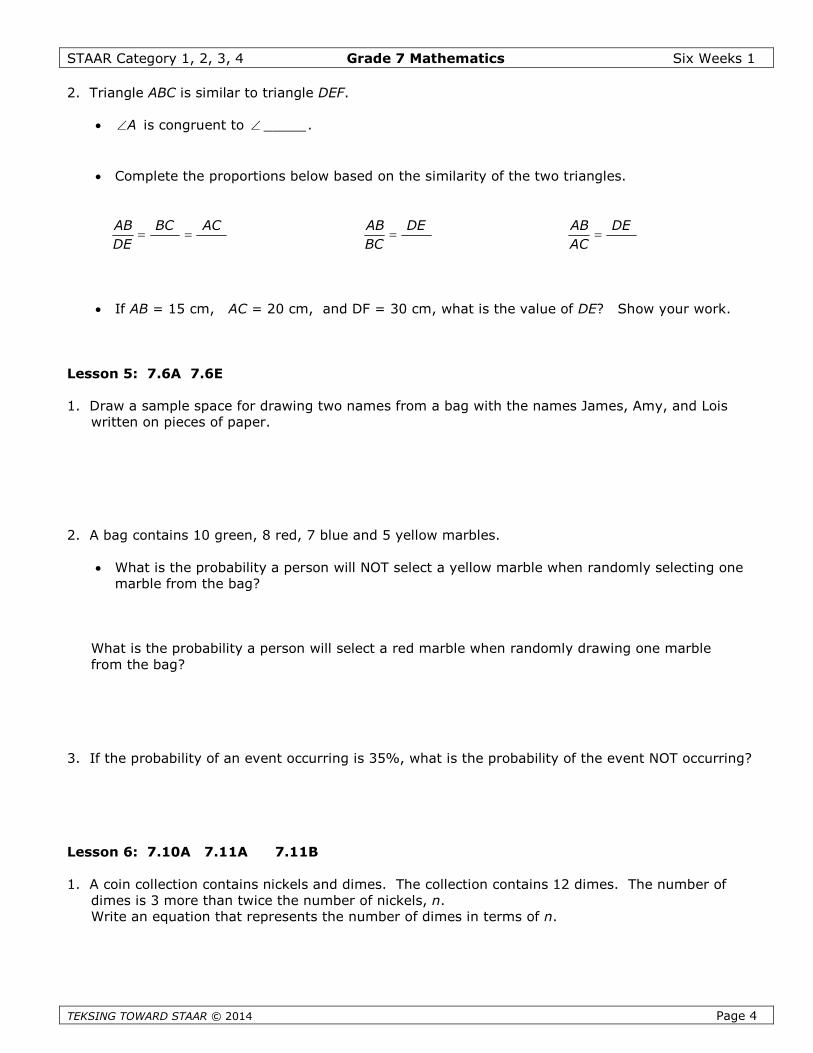
2. Triangle ABC is similar to triangle DEF.
A is congruent to _____.
Complete the proportions below based on the similarity of the two triangles.
AB BC AC
DE
AB DE
BC
AB DE
AC
If AB = 15 cm, AC = 20 cm, and DF = 30 cm, what is the value of DE? Show your work.
Lesson 5: 7.6A 7.6E
1. Draw a sample space for drawing two names from a bag with the names James, Amy, and Loiswritten on pieces of paper.
2. A bag contains 10 green, 8 red, 7 blue and 5 yellow marbles.
What is the probability a person will NOT select a yellow marble when randomly selecting onemarble from the bag?
What is the probability a person will select a red marble when randomly drawing one marblefrom the bag?
3. If the probability of an event occurring is 35%, what is the probability of the event NOT occurring?
Lesson 6: 7.10A 7.11A 7.11B
1. A coin collection contains nickels and dimes. The collection contains 12 dimes. The number ofdimes is 3 more than twice the number of nickels, n.Write an equation that represents the number of dimes in terms of n.
STAAR Category 1, 2, 3, 4 Grade 7 Mathematics Six Weeks 1
TEKSING TOWARD STAAR © 2014
2. Model the inequality: 2(x + 3) < 8
Using your model, solve the inequality.
3. Does 8 belong to the solution set of 3 5 20x ?
Does 5 satisfy the equation 4 3 17x ?
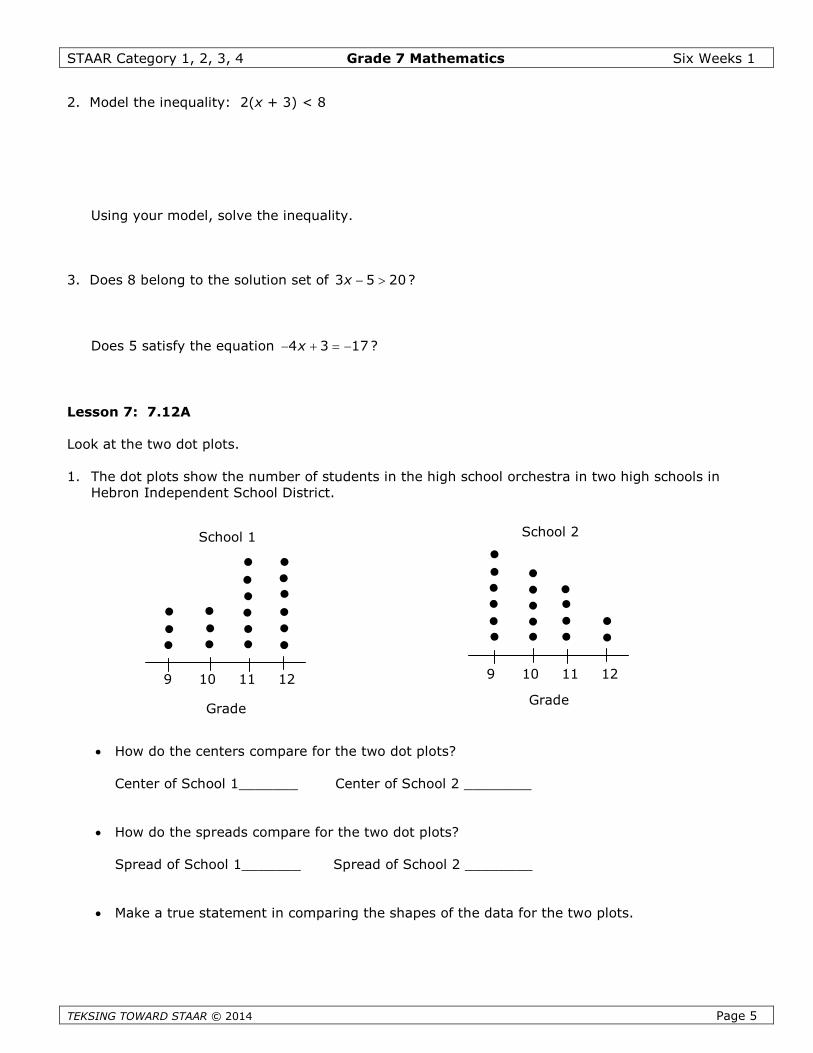
Lesson 7: 7.12A
Look at the two dot plots.
1. The dot plots show the number of students in the high school orchestra in two high schools inHebron Independent School District.
How do the centers compare for the two dot plots?
Center of School 1_______ Center of School 2 ______
How do the spreads compare for the two dot plots?
Spread of School 1_______ Spread of School 2 ______
Make a true statement in comparing the shapes of the data
9
School 1
9 10 11 12
Grade
School 2
Page 5
__
__
for the two plots.
10 11 12
Grade
STAAR Category 1, 2, 3, 4 Grade 7 Mathematics Six Weeks 1
TEKSIN
Lesson 8: 7.13A
1. What is the sales tax on an item costing $36.50 if the tax rate is 7.5%?
2. What is the total cost of an item that lists for $28 and has a tax rate of 8%?
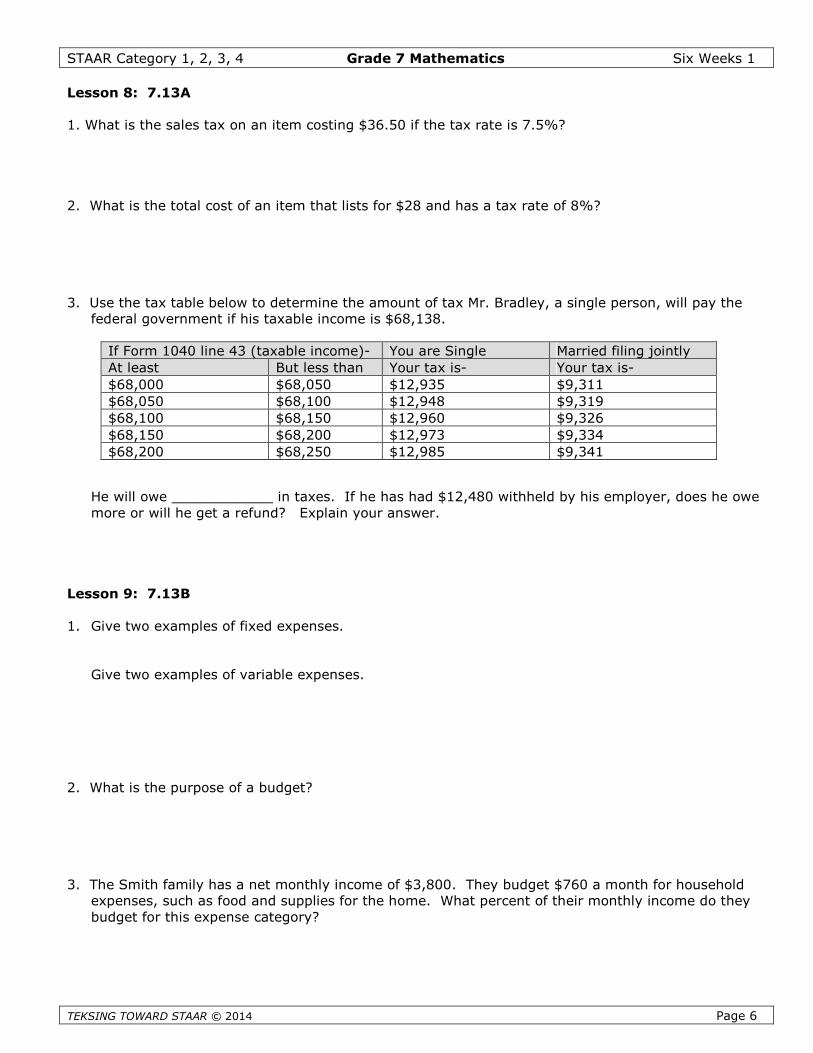
3. Use the tax table below to determine the amount of tax Mr. Bradley, a single person, will pay thefederal government if his taxable income is $68,138.
Hm
Less
1. G
G
2. W
3. Thexbu
If Form 1040 line 43 (taxable income)- You are Single Married filing jointly
At least But less than Your tax is- Your tax is-
$68,000 $68,050 $12,935 $9,311
$68,050 $68,100 $12,948 $9,319
$68,100 $68,150 $12,960 $9,326
$68,150 $68,200 $12,973 $9,334
G TOWARD STAAR © 2014 Page 6
e will owe ____________ in taxes. If he has had $12,480 withheld by his employer, does he oweore or will he get a refund? Explain your answer.
on 9: 7.13B
ive two examples of fixed expenses.
ive two examples of variable expenses.
hat is the purpose of a budget?
e Smith family has a net monthly income of $3,800. They budget $760 a month for householdpenses, such as food and supplies for the home. What percent of their monthly income do theydget for this expense category?
$68,200 $68,250 $12,985 $9,341
STAAR Category 1, 2, 3, 4 Grade 7 Mathematics Six Weeks 1
TEKSING TOWARD STAAR © 201
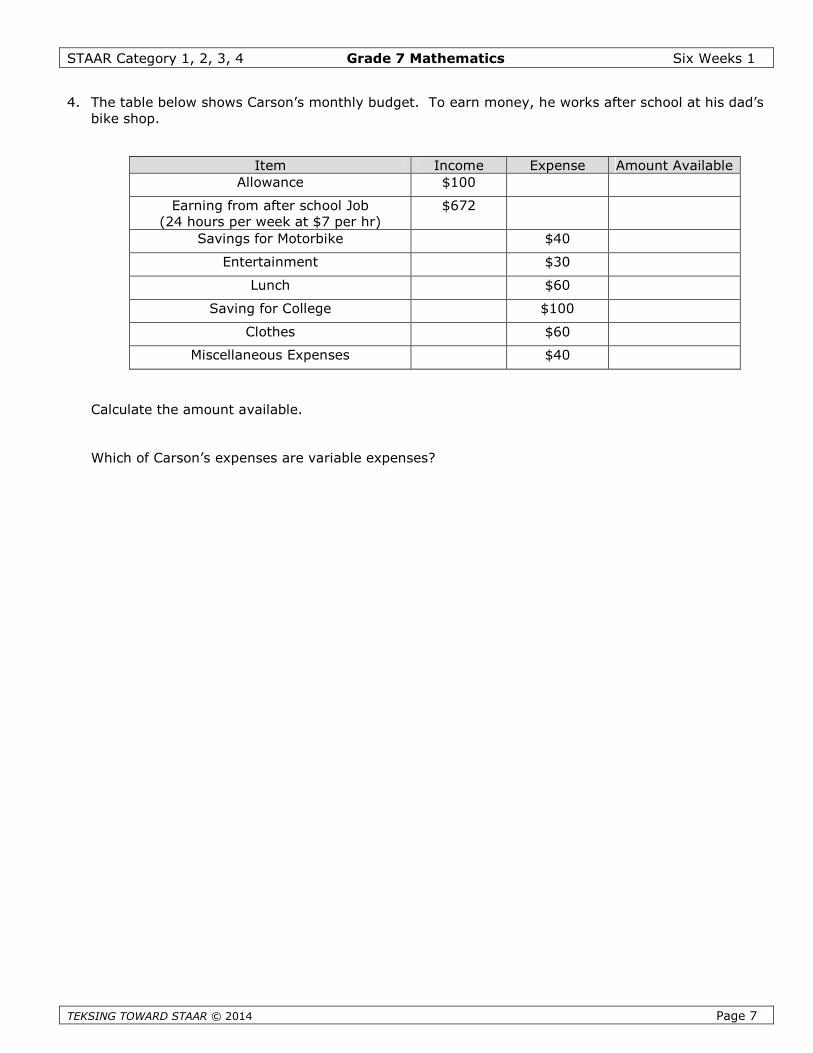
4. The table below shows Carson’s monthly budget. To earn money, he works after school at his dad’sbike shop.
Calculate the amount a
Which of Carson’s expe
A
Earning fro(24 hours pe
Savings
Ente
Savin
Miscellan
Item Income Expense Amount Available
llowance $100
m after school Jobr week at $7 per hr)
$672
for Motorbike $40
rtainment $30
Lunch $60
g for College $100
Clothes $60
4 Page 7
vailable.
nses are variable expenses?
eous Expenses $40
GRADE 7 MATHEMATICS
TEKSING TOWARD STAAR © 2014 Page 0
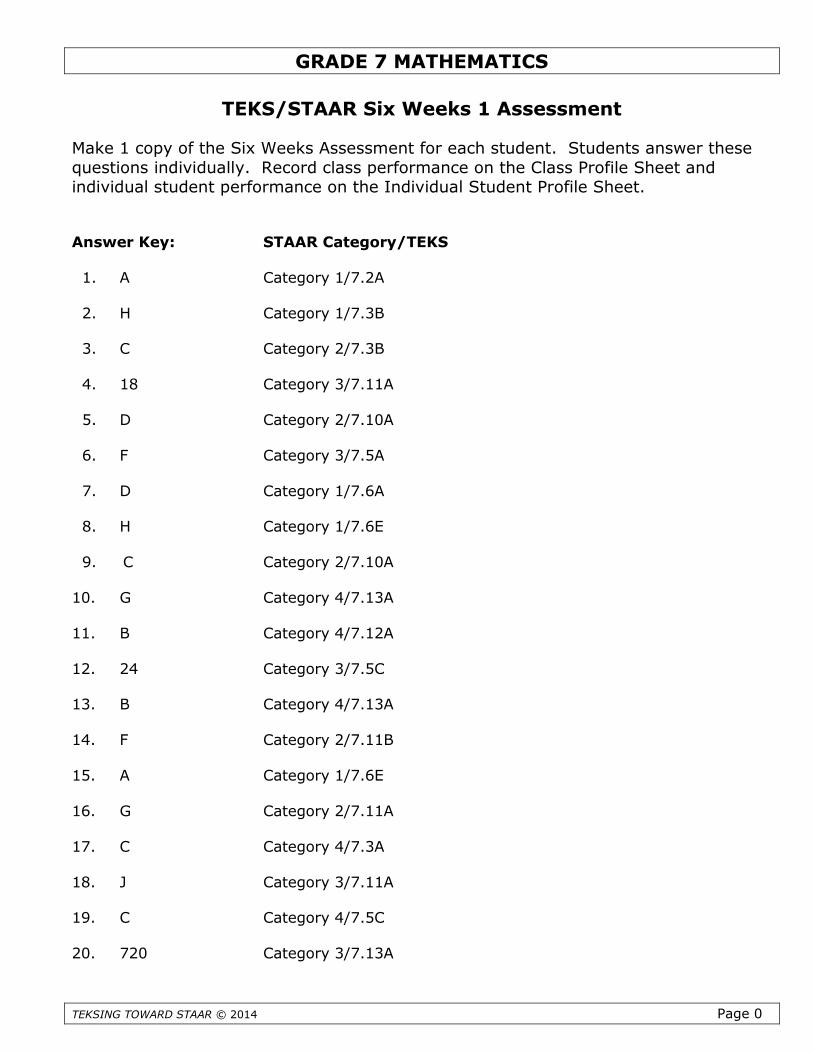
TEKS/STAAR Six Weeks 1 Assessment
Make 1 copy of the Six Weeks Assessment for each student. Students answer thesequestions individually. Record class performance on the Class Profile Sheet andindividual student performance on the Individual Student Profile Sheet.
Answer Key: STAAR Category/TEKS
1. A Category 1/7.2A
2. H Category 1/7.3B
3. C Category 2/7.3B
4. 18 Category 3/7.11A
5. D Category 2/7.10A
6. F Category 3/7.5A
7. D Category 1/7.6A
8. H Category 1/7.6E
9. C Category 2/7.10A
10. G Category 4/7.13A
11. B Category 4/7.12A
12. 24 Category 3/7.5C
13. B Category 4/7.13A
14. F Category 2/7.11B
15. A Category 1/7.6E
16. G Category 2/7.11A
17. C Category 4/7.3A
18. J Category 3/7.11A
19. C Category 4/7.5C
20. 720 Category 3/7.13A
GRADE 7 MATHEMATICS
TEKSING TOWARD STAAR © 2014 Page 1
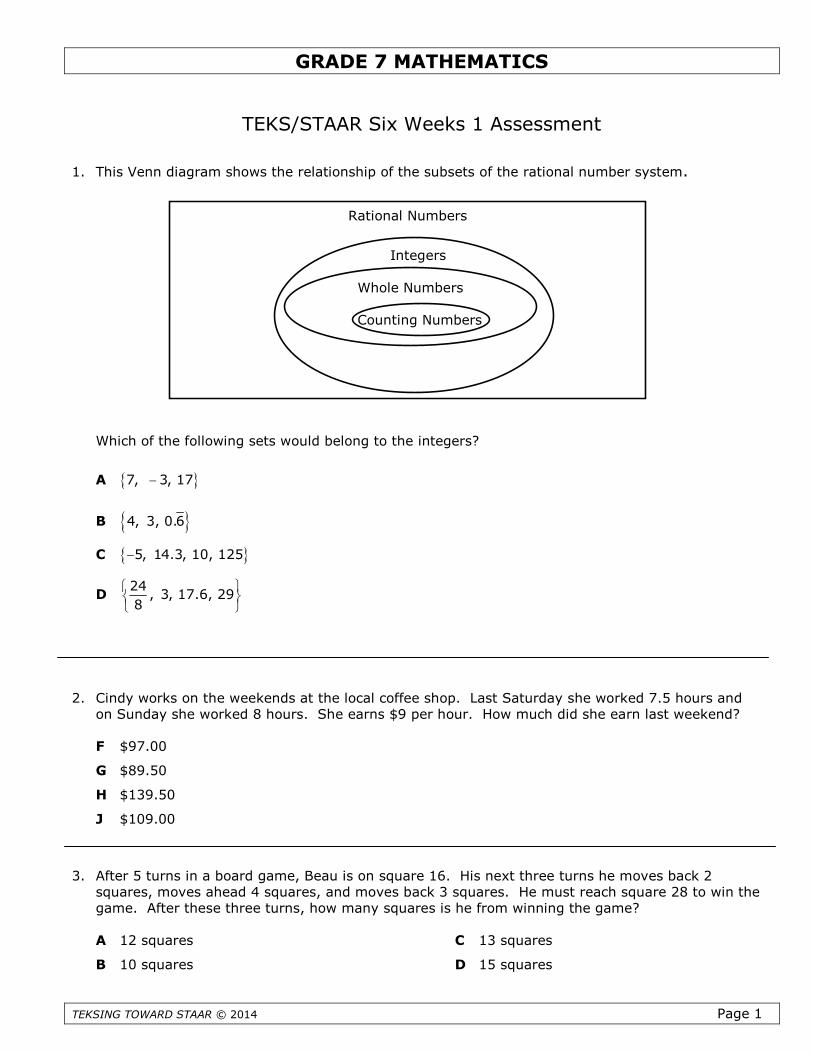
TEKS/STAAR Six Weeks 1 Assessment
1. This Venn diagram shows the relationship of the subsets of the rational number system.
Which of the following sets would belong to the integers?
A 7, 3, 17
B 4, 3, 0.6
C 5, 14.3, 10, 125
D24
, 3, 17.6, 298
2. Cindy works on the weekends at the local coffee shop. Last Saturday she worked 7.5 hours andon Sunday she worked 8 hours. She earns $9 per hour. How much did she earn last weekend?
F $97.00
G $89.50
H $139.50
J $109.00
3. After 5 turns in a board game, Beau is on square 16. His next three turns he moves back 2squares, moves ahead 4 squares, and moves back 3 squares. He must reach square 28 to win thegame. After these three turns, how many squares is he from winning the game?
A 12 squares C 13 squares
B 10 squares D 15 squares
Rational Numbers
Integers
Whole Numbers
Counting Numbers
GRADE 7 MATHEMATICS
TEKSING TOWARD STAAR © 2014 Page 2
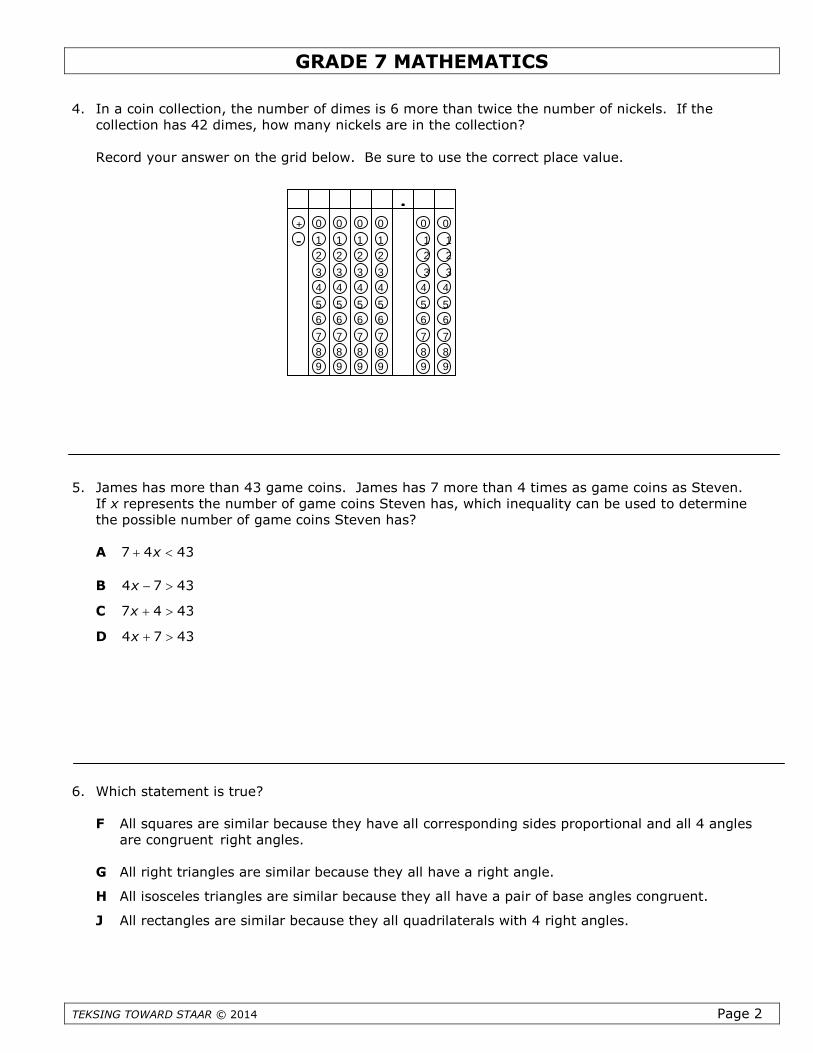
4. In a coin collection, the number of dimes is 6 more than twice the number of nickels. If thecollection has 42 dimes, how many nickels are in the collection?
Record your answer on the grid below. Be sure to use the correct place value.
5. James has more than 43 game coins. James has 7 more than 4 times as game coins as Steven.If x represents the number of game coins Steven has, which inequality can be used to determinethe possible number of game coins Steven has?
A 7 4 43x
B 4 7 43x
C 7 4 43x
D 4 7 43x
6. Which statement is true?
F All squares are similar because they have all corresponding sides proportional and all 4 anglesare congruent right angles.
G All right triangles are similar because they all have a right angle.
H All isosceles triangles are similar because they all have a pair of base angles congruent.
J All rectangles are similar because they all quadrilaterals with 4 right angles.
0 0 0 0 0 0
1 1 1 1 1 1
2 2 2 2 2 2
3 3 3 3 3 3
4 4 4 4 4 4
5 5 5 5 5 5
6 6 6 6 6 6
7 7 7 7 7 7
8 8 8 8 8 8
9 9 9 9 9 9
+
-
.
GRADE 7 MATHEMATICS
TEKSING TOWARD STAAR © 2014 Page 3
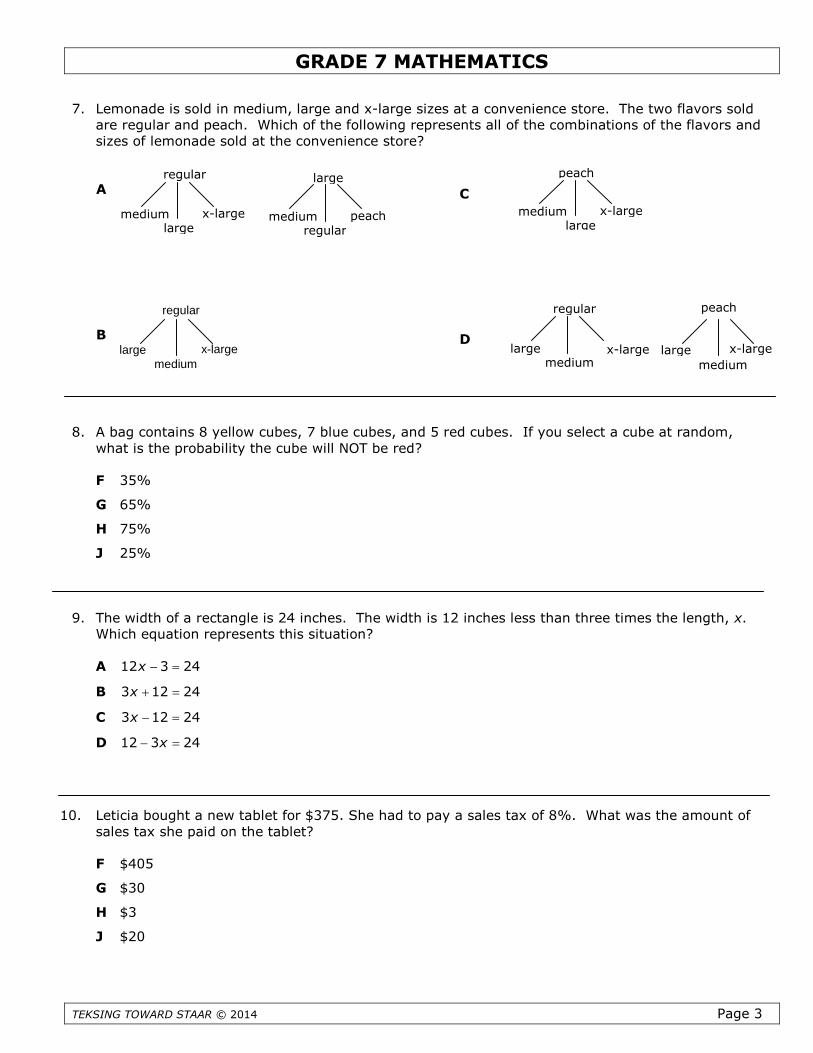
7. Lemonade is sold in medium, large and x-large sizes at a convenience store. The two flavors soldare regular and peach. Which of the following represents all of the combinations of the flavors andsizes of lemonade sold at the convenience store?
8. A bag contains 8 yellow cubes, 7 blue cubes, and 5 red cubes. If you select a cube at random,what is the probability the cube will NOT be red?
F 35%
G 65%
H 75%
J 25%
9. The width of a rectangle is 24 inches. The width is 12 inches less than three times the length, x.Which equation represents this situation?
A 12 3 24x
B 3 12 24x
C 3 12 24x
D 12 3 24x
10. Leticia bought a new tablet for $375. She had to pay a sales tax of 8%. What was the amount ofsales tax she paid on the tablet?
F $405
G $30
H $3
J $20
regular
largemedium
x-large
regular
mediumlarge
x-large
large
mediumregular
peach
A
B
regular
largemedium
x-large
peach
largemedium
x-large
peach
mediumlarge
x-large
C
D
GRADE 7 MATHEMATICS
TEKSING TOWARD STAAR © 2014 Page 4
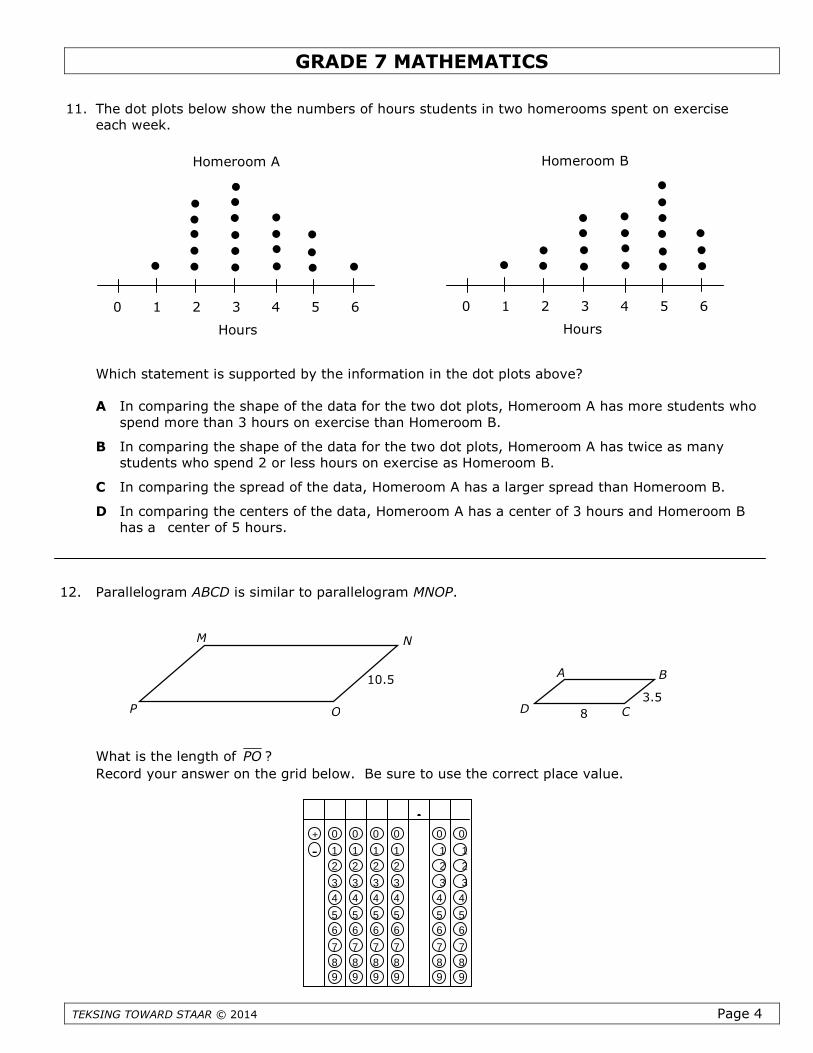
11. The dot plots below show the numbers of hours students in two homerooms spent on exerciseeach week.
Which statement is supported by the information in the dot plots above?
A In comparing the shape of the data for the two dot plots, Homeroom A has more students whospend more than 3 hours on exercise than Homeroom B.
B In comparing the shape of the data for the two dot plots, Homeroom A has twice as manystudents who spend 2 or less hours on exercise as Homeroom B.
C In comparing the spread of the data, Homeroom A has a larger spread than Homeroom B.
D In comparing the centers of the data, Homeroom A has a center of 3 hours and Homeroom Bhas a center of 5 hours.
12. Parallelogram ABCD is similar to parallelogram MNOP.
What is the length of PO ?
Record your answer on the grid below. Be sure to use the correct place value.
M N
OP
10.5A B
CD 8
3.5
Homeroom A
0 1 2 3 4 5 6
Homeroom B
0 1 2 3 4 5 6
Hours Hours
0 0 0 0 0 0
1 1 1 1 1 1
2 2 2 2 2 2
3 3 3 3 3 3
4 4 4 4 4 4
5 5 5 5 5 5
6 6 6 6 6 6
7 7 7 7 7 7
8 8 8 8 8 8
9 9 9 9 9 9
+
-
.
GRADE 7 MATHEMATICS
TEKSING TOWARD STAAR © 2014 Page 5
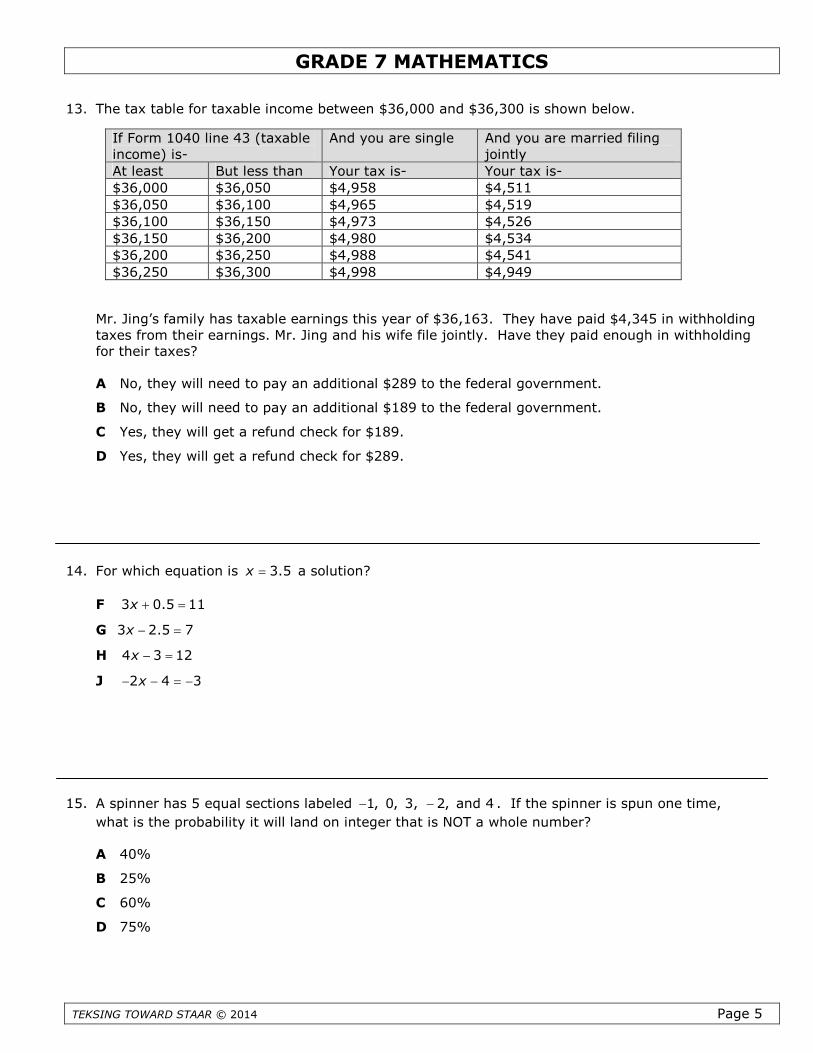
13. The tax table for taxable income between $36,000 and $36,300 is shown below.
Mr. Jing’s family has taxable earnings this year of $36,163. They have paid $4,345 in withholdingtaxes from their earnings. Mr. Jing and his wife file jointly. Have they paid enough in withholdingfor their taxes?
A No, they will need to pay an additional $289 to the federal government.
B No, they will need to pay an additional $189 to the federal government.
C Yes, they will get a refund check for $189.
D Yes, they will get a refund check for $289.
14. For which equation is 3.5x a solution?
F 3 0.5 11x
G 3 2.5 7x
H 4 3 12x
J 2 4 3x
15. A spinner has 5 equal sections labeled 1, 0, 3, 2, and 4 . If the spinner is spun one time,
what is the probability it will land on integer that is NOT a whole number?
A 40%
B 25%
C 60%
D 75%
If Form 1040 line 43 (taxableincome) is-
And you are single And you are married filingjointly
At least But less than Your tax is- Your tax is-
$36,000 $36,050 $4,958 $4,511
$36,050 $36,100 $4,965 $4,519
$36,100 $36,150 $4,973 $4,526
$36,150 $36,200 $4,980 $4,534
$36,200 $36,250 $4,988 $4,541
$36,250 $36,300 $4,998 $4,949
GRADE 7 MATHEMATICS
TEKSING TOWARD STAAR © 2014 Page 6
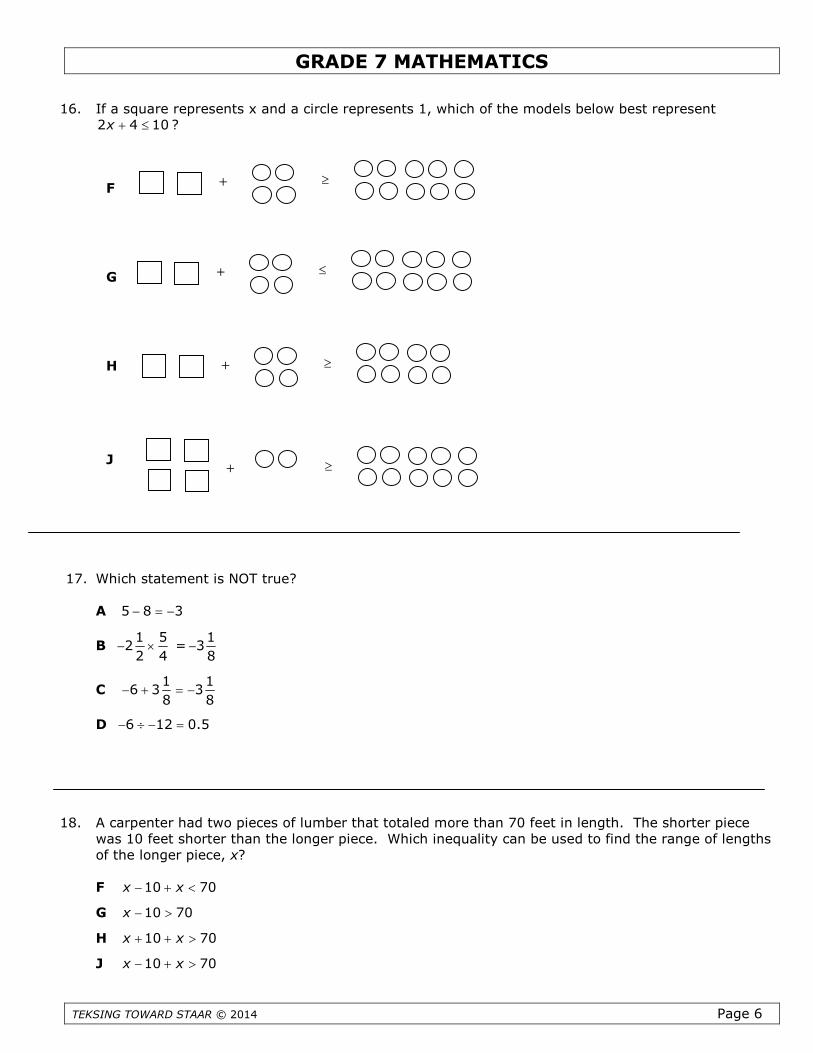
16. If a square represents x and a circle represents 1, which of the models below best represent2 4 10x ?
17. Which statement is NOT true?
A 5 8 3
B1 5
22 4
=1
38
C1 1
6 3 38 8
D 6 12 0.5
18. A carpenter had two pieces of lumber that totaled more than 70 feet in length. The shorter piecewas 10 feet shorter than the longer piece. Which inequality can be used to find the range of lengthsof the longer piece, x?
F 10 70x x
G 10 70x
H 10 70x x
J 10 70x x
+
+
+
+
+
+
+
+
F
G
H
J
GRADE 7 MATHEMATICS
TEKSING TOWARD STAAR © 2014 Page 7
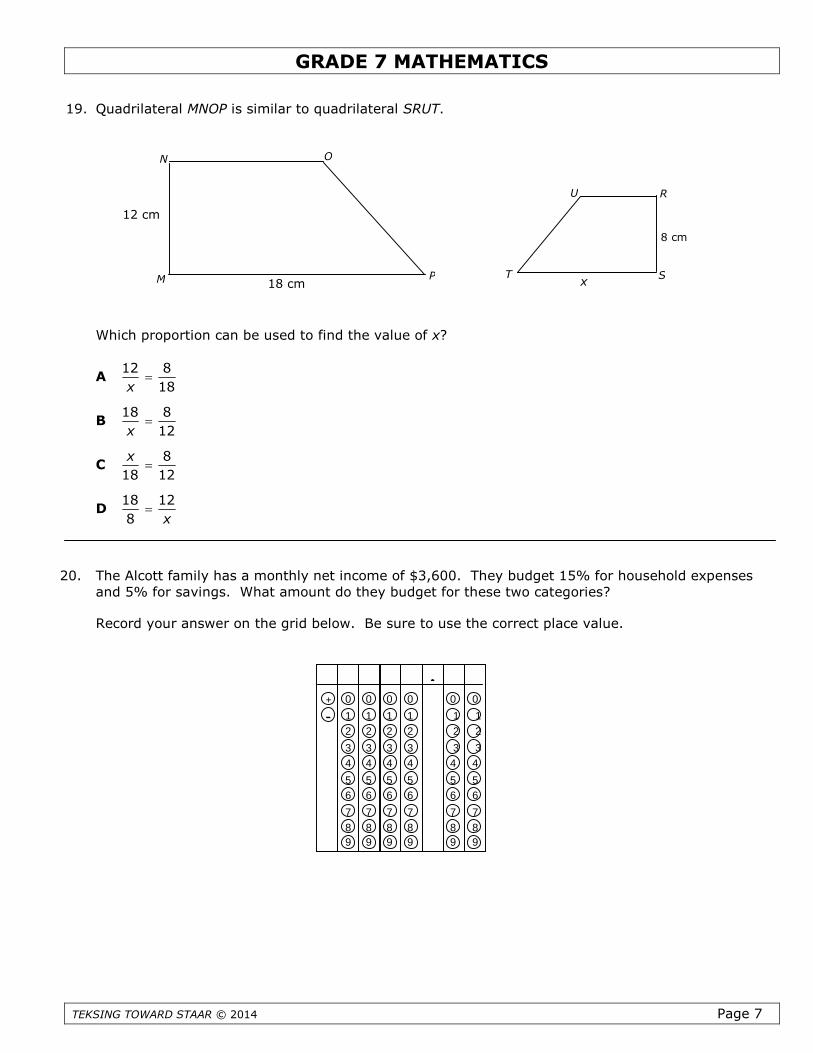
19. Quadrilateral MNOP is similar to quadrilateral SRUT.
Which proportion can be used to find the value of x?
A12 8
18x
B18 8
12x
C8
18 12
x
D18 12
8 x
20. The Alcott family has a monthly net income of $3,600. They budget 15% for household expensesand 5% for savings. What amount do they budget for these two categories?
Record your answer on the grid below. Be sure to use the correct place value.
M
N O
P18 cm
12 cm
R
ST
U
8 cm
x
0 0 0 0 0 0
1 1 1 1 1 1
2 2 2 2 2 2
3 3 3 3 3 3
4 4 4 4 4 4
5 5 5 5 5 5
6 6 6 6 6 6
7 7 7 7 7 7
8 8 8 8 8 8
9 9 9 9 9 9
+
-
.
Scope and SequenceSix Weeks 3
TEKSING TOWARD STAAR SCOPE AND SEQUENCEGrade 7 Mathematics
TEKSING TOWARD STAAR 2014 Page 1
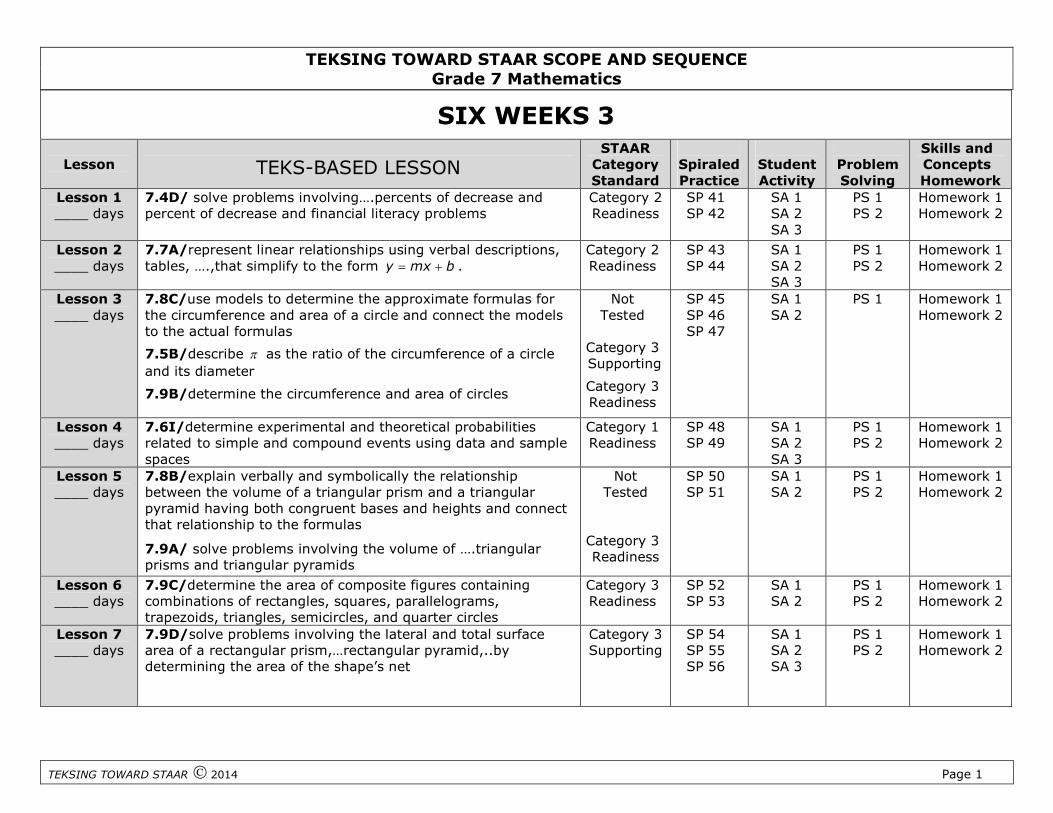
SIX WEEKS 3
Lesson TEKS-BASED LESSONSTAAR
CategoryStandard
SpiraledPractice
StudentActivity
ProblemSolving
Skills andConceptsHomework
Lesson 1____ days
7.4D/ solve problems involving….percents of decrease andpercent of decrease and financial literacy problems
Category 2Readiness
SP 41SP 42
SA 1SA 2SA 3
PS 1PS 2
Homework 1Homework 2
Lesson 2____ days
7.7A/represent linear relationships using verbal descriptions,tables, ….,that simplify to the form y mx b .
Category 2Readiness
SP 43SP 44
SA 1SA 2SA 3
PS 1PS 2
Homework 1Homework 2
Lesson 3____ days
7.8C/use models to determine the approximate formulas forthe circumference and area of a circle and connect the modelsto the actual formulas
7.5B/describe as the ratio of the circumference of a circle
and its diameter
7.9B/determine the circumference and area of circles
NotTested
Category 3Supporting
Category 3Readiness
SP 45SP 46SP 47
SA 1SA 2
PS 1 Homework 1Homework 2
Lesson 4____ days
7.6I/determine experimental and theoretical probabilitiesrelated to simple and compound events using data and samplespaces
Category 1Readiness
SP 48SP 49
SA 1SA 2SA 3
PS 1PS 2
Homework 1Homework 2
Lesson 5____ days
7.8B/explain verbally and symbolically the relationshipbetween the volume of a triangular prism and a triangularpyramid having both congruent bases and heights and connectthat relationship to the formulas
7.9A/ solve problems involving the volume of ….triangularprisms and triangular pyramids
NotTested
Category 3Readiness
SP 50SP 51
SA 1SA 2
PS 1PS 2
Homework 1Homework 2
Lesson 6____ days
7.9C/determine the area of composite figures containingcombinations of rectangles, squares, parallelograms,trapezoids, triangles, semicircles, and quarter circles
Category 3Readiness
SP 52SP 53
SA 1SA 2
PS 1PS 2
Homework 1Homework 2
Lesson 7____ days
7.9D/solve problems involving the lateral and total surfacearea of a rectangular prism,…rectangular pyramid,..bydetermining the area of the shape’s net
Category 3Supporting
SP 54SP 55SP 56
SA 1SA 2SA 3
PS 1PS 2
Homework 1Homework 2
TEKSING TOWARD STAAR SCOPE AND SEQUENCEGrade 7 Mathematics
TEKSING TOWARD STAAR 2014 Page 2
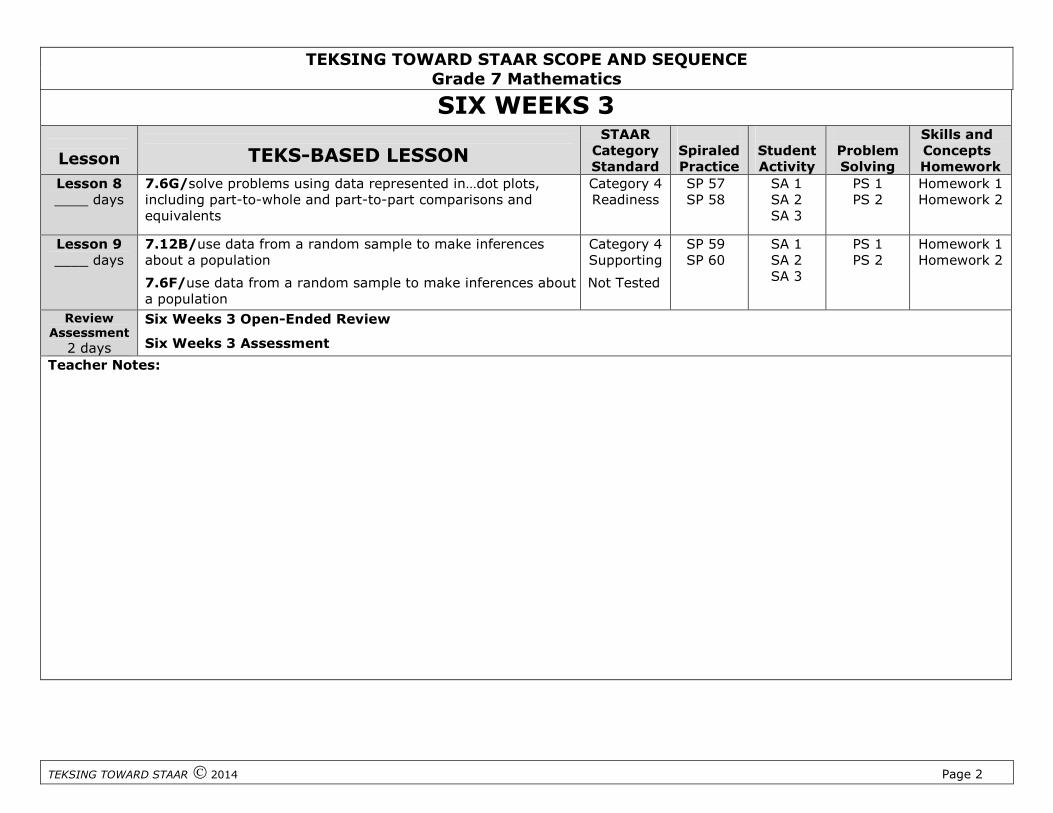
SIX WEEKS 3
Lesson TEKS-BASED LESSONSTAAR
CategoryStandard
SpiraledPractice
StudentActivity
ProblemSolving
Skills andConceptsHomework
Lesson 8____ days
7.6G/solve problems using data represented in…dot plots,including part-to-whole and part-to-part comparisons andequivalents
Category 4Readiness
SP 57SP 58
SA 1SA 2SA 3
PS 1PS 2
Homework 1Homework 2
Lesson 9____ days
7.12B/use data from a random sample to make inferencesabout a population
7.6F/use data from a random sample to make inferences abouta population
Category 4Supporting
Not Tested
SP 59SP 60
SA 1SA 2SA 3
PS 1PS 2
Homework 1Homework 2
ReviewAssessment
2 days
Six Weeks 3 Open-Ended Review
Six Weeks 3 Assessment
Teacher Notes:

Materials List

GRADE 7 MATERIALS LIST - SIX WEEKS 3
TEKSING TOWARD STAAR © 2014 Page 1
SIX WEEKS LESSON ITEM QUANTITY
3 1 Number cards (copy on cardstock, cutapart, and place in baggie)
Percent cards (copy on cardstock, cutapart, and place in baggie)
1 set per pair of students
1 set per pair of students
3 2 No materials needed
3 3 Centimeter grid paper0.5 centimeter grid paperCircle Pi circles (copy on cardstock, cutapart, and place in baggie)Circular object
Measuring tapeSafety compassCentimeter ruler
1 per pair of students1 per pair of students1 set per group of 4
students1 per group of 4 plus 3
extra1 per student1 per student1 per student
3 4 4 colored tiles using 4 colors in a bagPennyNumber cube
1 per pair of students1 per pair of students1 per pair of students
3 5 No materials needed
3 6 No materials needed
3 7 Rectangular prismMetric rulerButcher paper
1 per pair of students1 per pair of students2 sheets per pair of
students
3 8 Number cubesButcher paperColored Markers
2 per pair of students1 per pair of students2 sheets per pair of
students
3 9 No materials needed
Mini-AssessmentAnswer Key
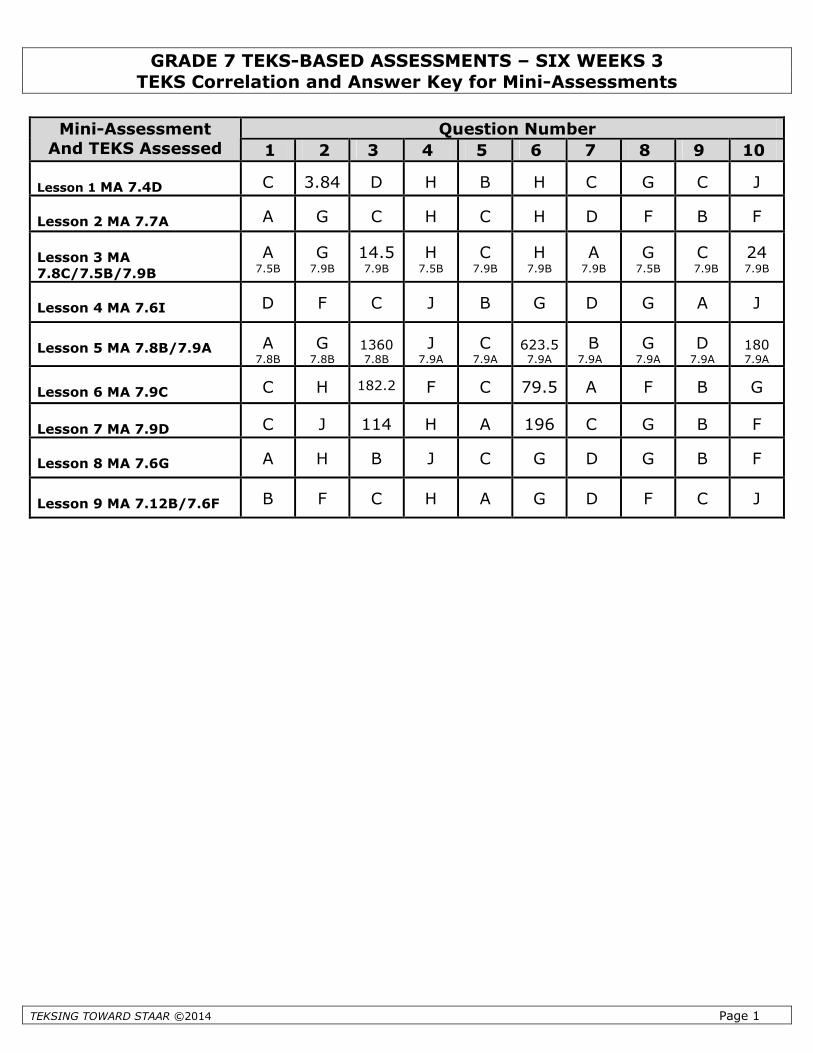
GRADE 7 TEKS-BASED ASSESSMENTS – SIX WEEKS 3TEKS Correlation and Answer Key for Mini-Assessments
TEKSING TOWARD STAAR ©2014 Page 1
Question NumberMini-AssessmentAnd TEKS Assessed 1 2 3 4 5 6 7 8 9 10
Lesson 1 MA 7.4D C 3.84 D H B H C G C J
Lesson 2 MA 7.7A A G C H C H D F B F
Lesson 3 MA7.8C/7.5B/7.9B
A7.5B
G7.9B
14.57.9B
H7.5B
C7.9B
H7.9B
A7.9B
G7.5B
C7.9B
247.9B
Lesson 4 MA 7.6I D F C J B G D G A J
Lesson 5 MA 7.8B/7.9A A7.8B
G7.8B
13607.8B
J7.9A
C7.9A
623.57.9A
B7.9A
G7.9A
D7.9A
1807.9A
Lesson 6 MA 7.9C C H 182.2 F C 79.5 A F B G
Lesson 7 MA 7.9D C J 114 H A 196 C G B F
Lesson 8 MA 7.6G A H B J C G D G B F
Lesson 9 MA 7.12B/7.6F B F C H A G D F C J
Six Weeks 3Lesson 4
Six Weeks 3Lesson 4
STAAR Category 1 Grade 7 Mathematics TEKS 7.6I
TEKSING TOWARD STAAR © 2014 Page 1
7.6I Lesson and Assessment
Lesson Focus
For TEKS 7.6I, students should be able to demonstrate an understanding of how to representprobabilities and numbers. Students apply mathematical process standards to probability andstatistics to describe or solve problems involving proportional relationships.
Students are expected to determine experimental and theoretical probabilities related tosimple and compound events using data and sample spaces.
Process Standards Incorporated Into Lesson
7.1A apply mathematics to problems arising in everyday life, society, and the workplace
7.1B Use a problem-solving model that incorporates analyzing given information,formulating a plan or strategy, determining a solution, justifying the solution, andevaluating the problem-solving process and the reasonableness of the solution
7.1D Communicate mathematical ideas, reasoning, and their implications using multiplerepresentations, including symbols, diagrams, graphs, and language as appropriate.
7.1E Create and use representations to organize, record, and communicate mathematicalideas
Materials Needed for Lesson
1. Per Student: 1 copy of all pages for student activities for this lesson, Skills and ConceptsHomework, and mini-assessment for this lesson
2. Student Activity 3: Per Pair of Students: 1 bag of 4 colored tiles using 4 colors; 1 penny; 1number cube
Math Background-Determining Experimental and Theoretical Probabilities usingData
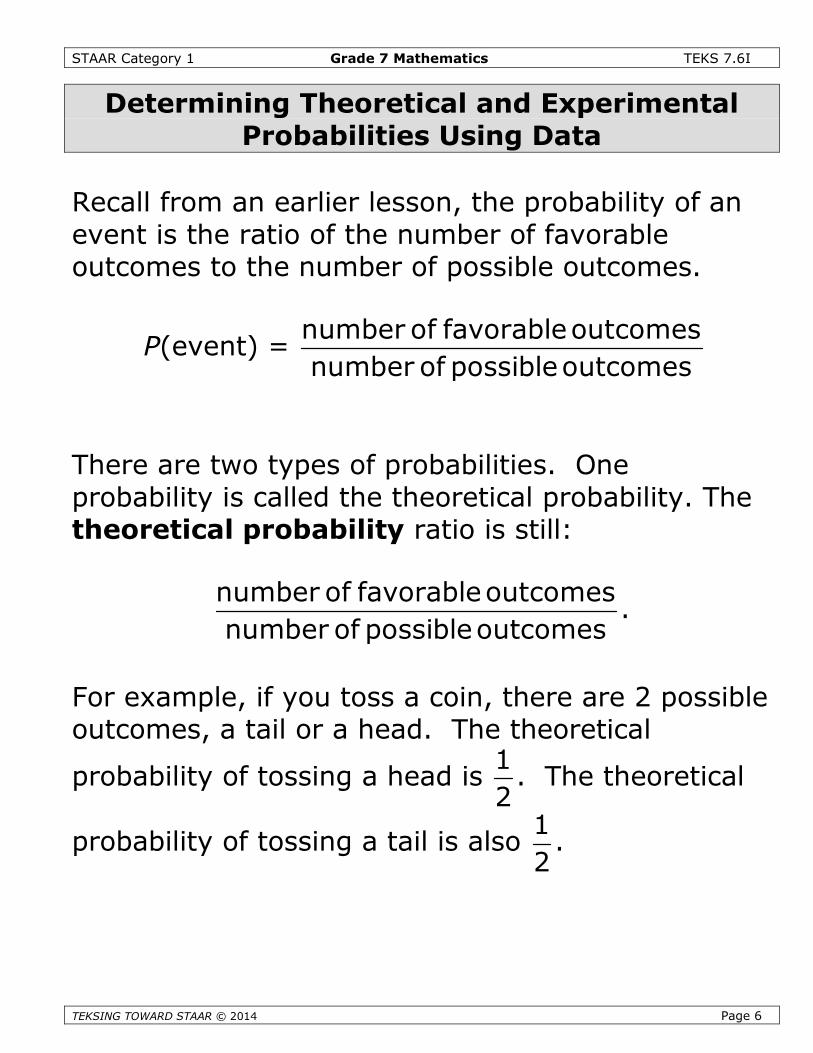
Recall from an earlier lesson, the probability of an event is the ratio of the number of favorableoutcomes to the number of possible outcomes.
P(event) =number of favorableoutcomes
number of possibleoutcomes
There are two types of probabilities. One probability is called the theoretical probability. The theoretical
probability ratio is stillnumber of favorableoutcomes
number of possibleoutcomes
. For example, if you toss a coin, there are 2
possible outcomes, a tail or a head. The theoretical probability of tossing a head is1
2. The theoretical
probability of tossing a tail is also1
2.
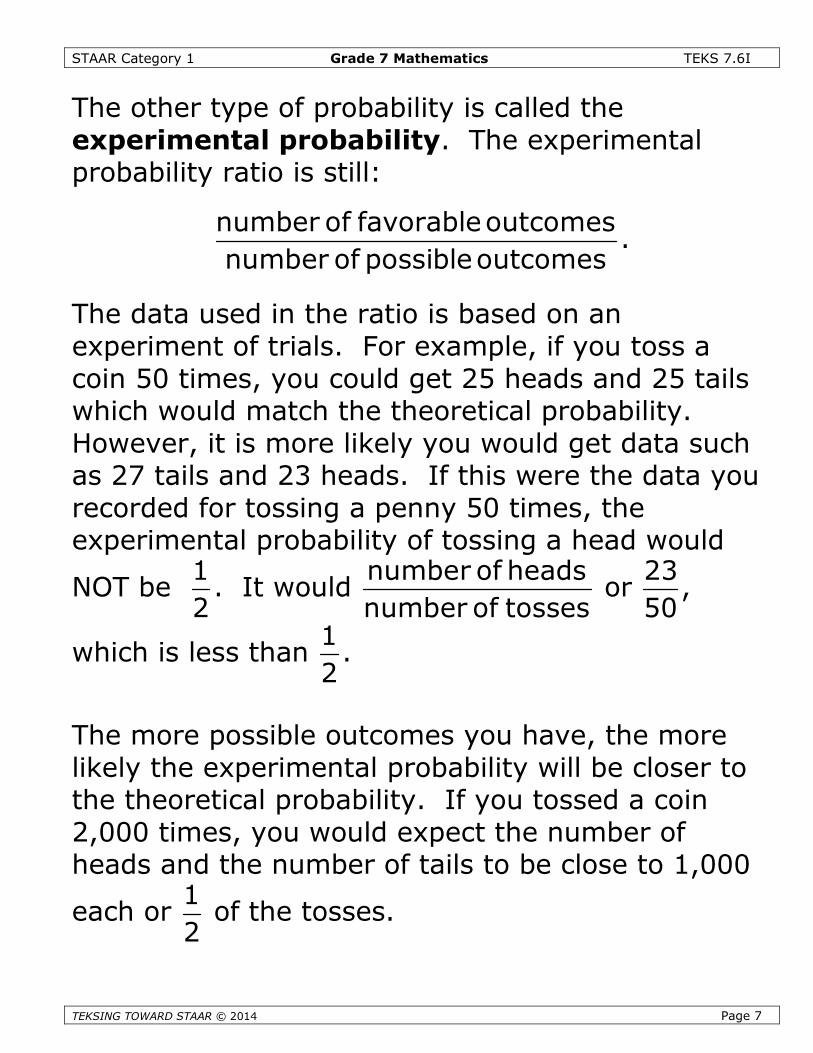
The other type of probability is called the experimental probability. The experimental probability ratio
isnumber of favorableoutcomes
number of possibleoutcomes
. The data used in the ratio is based on an experiment of trials.
STAAR Category 1 Grade 7 Mathematics TEKS 7.6I
TEKSING TOWARD STAAR ©
For example, if you toss a coin 50 times, you could get 25 heads and 25 tails which would match thetheoretical probability. However, it is more likely you would get data such as 27 tails and 23 heads. Ifthis were the data you recorded for tossing a penny 50 times, the experimental probability of tossing a
head would NOT be1
2. It would
number of heads
number of tosses
or
23
50, which is less than
1
2.
The more possible outcomes you have, the more likely the experimental probability will be closer to thetheoretical probability. If you tossed a coin 2000 times, you would expect the number of heads and the
number of tails to be close to 1000 each or1
2of the tosses.
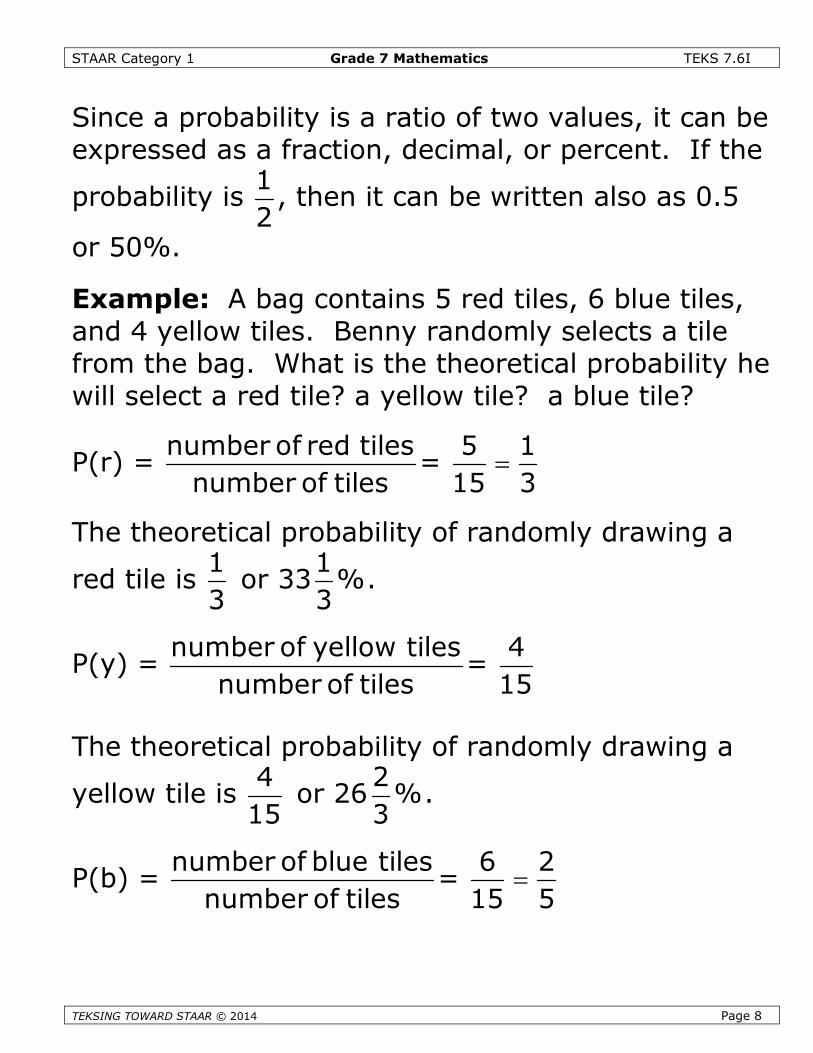
Since a probability is a ratio of two values, it can be expressed as a fraction, decimal, or percent. If the
probability is1
2, then it can be written also as 0.5 or 50%.
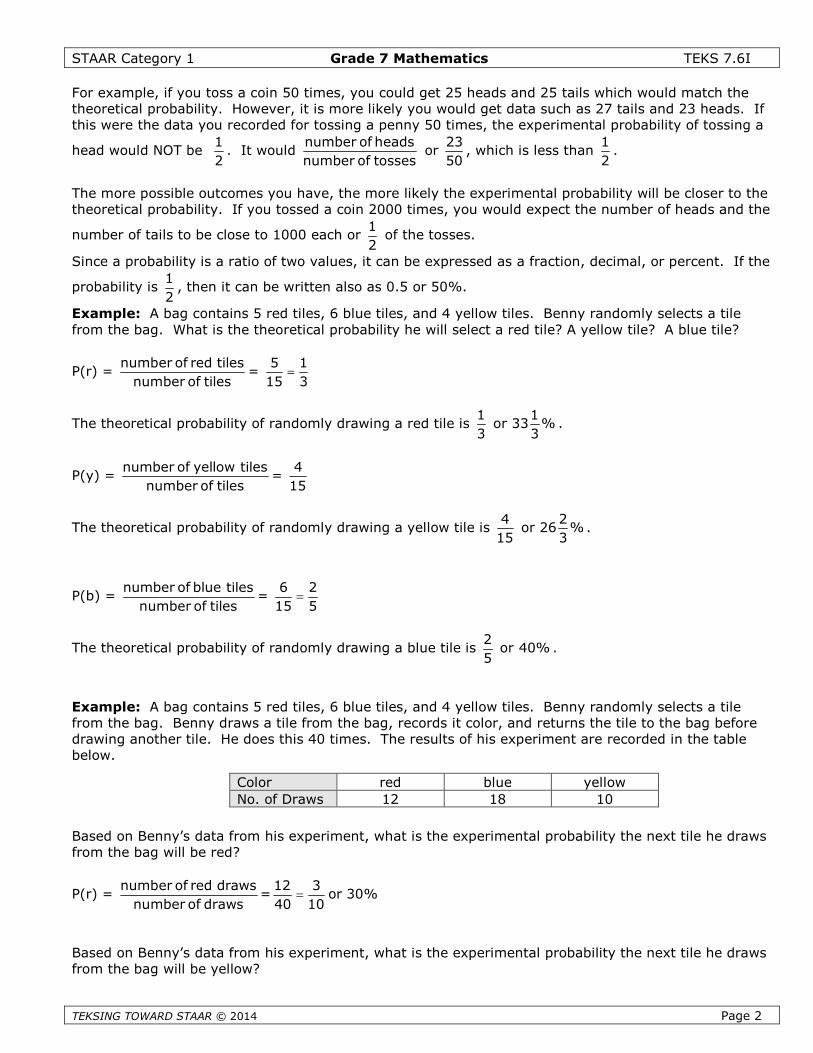
Example: A bag contains 5 red tiles, 6 blue tiles, and 4 yellow tiles. Benny randomly selects a tilefrom the bag. What is the theoretical probability he will select a red tile? A yellow tile? A blue tile?
P(r) =number of red tiles
number of tiles
=
5 1
15 3
The theoretical probability of randomly drawing a red tile is1 1
or 33 %3 3
.
P(y) =number of yellow tiles
number of tiles
=
4
15
The theoretical probability of randomly drawing a yellow tile is4 2
or 26 %15 3
.
P(b) =number of blue tiles
number of tiles
=
6 2
15 5
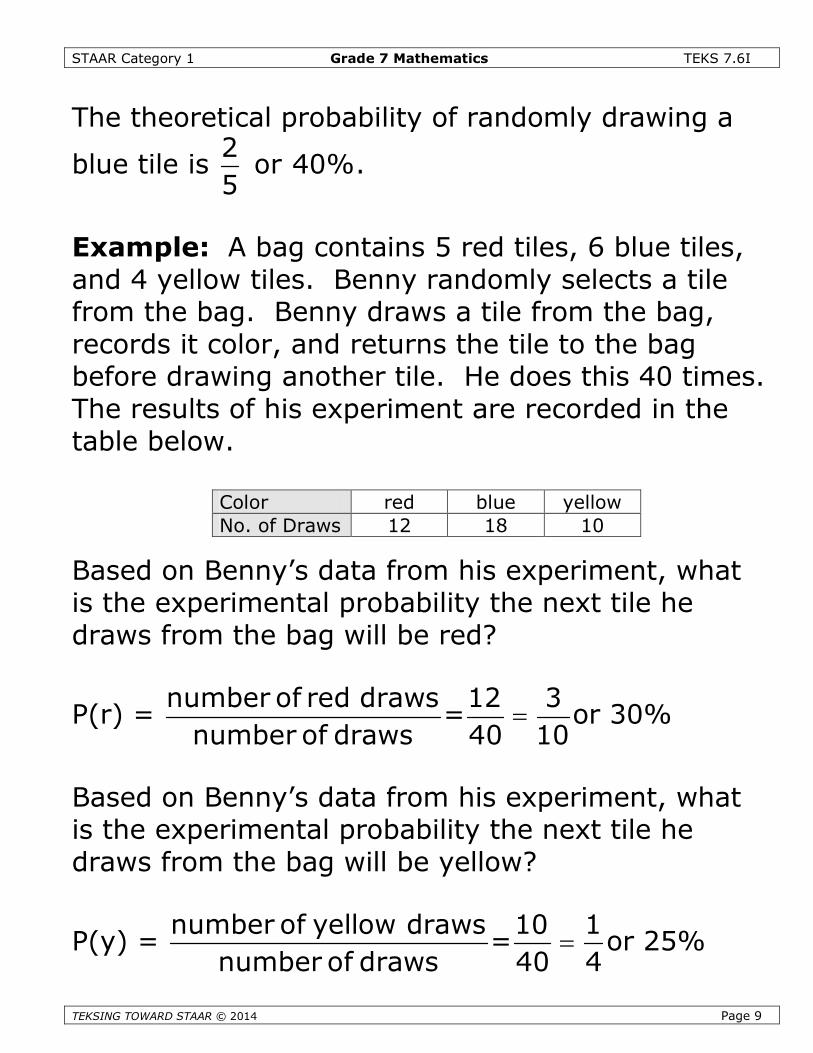
The theoretical probability of randomly drawing a blue tile is2
or 40%5
.
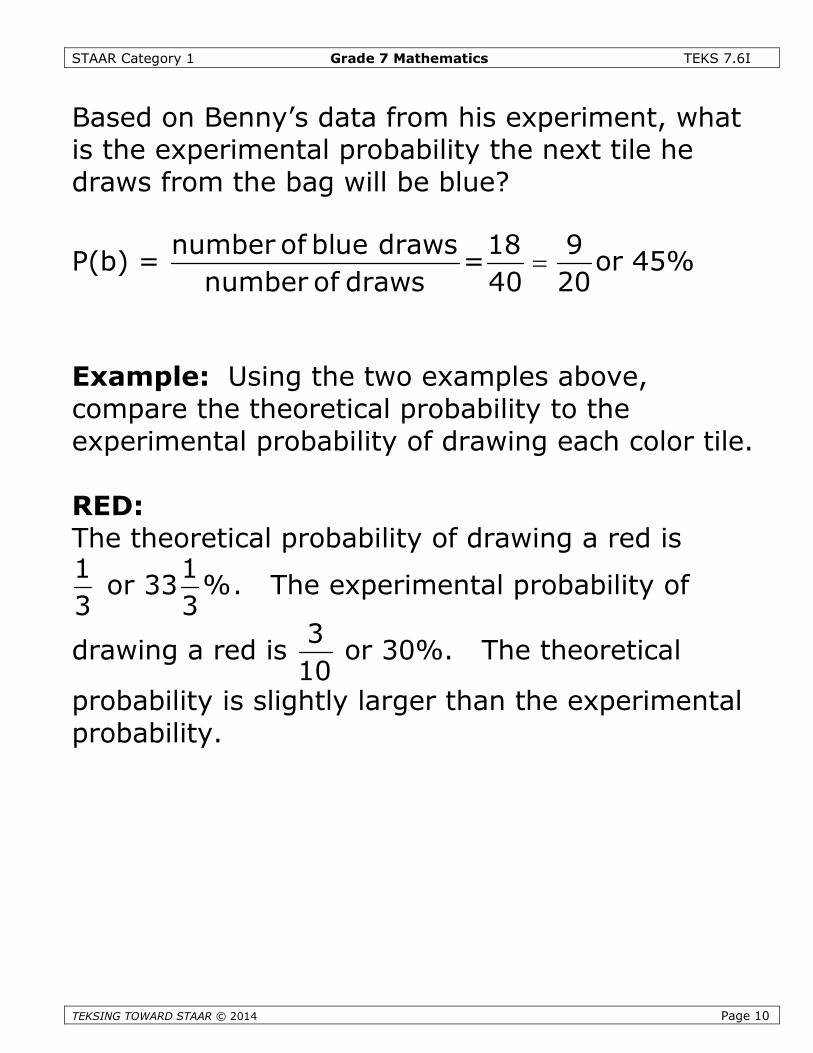
Example: A bag contains 5 red tiles, 6 blue tiles, and 4 yellow tiles. Benny randomly selects a tilefrom the bag. Benny draws a tile from the bag, records it color, and returns the tile to the bag beforedrawing another tile. He does this 40 times. The results of his experiment are recorded in the tablebelow.
Based on Benny’s datafrom the bag will be red
P(r) =number of red dr
number of draw
Based on Benny’s datafrom the bag will be yel
Color red blue yellow
2014 Page 2
from his experiment, what is the experimental probability the next tile he draws?
aws
s=
12 3
40 10 or 30%
from his experiment, what is the experimental probability the next tile he drawslow?
No. of Draws 12 18 10
STAAR Category 1 Grade 7 Mathematics TEKS 7.6I
TEKSING TOWARD STAAR © 2014 Page 3
P(y) =number of yellow draws
number of draws
=
10 1
40 4 or 25%
Based on Benny’s data from his experiment, what is the experimental probability the next tile he drawsfrom the bag will be blue?
P(b) =number of blue draws
number of draws
=
18 9
40 20 or 45%
Example: Using the two examples above, compare the theoretical probability to the experimentalprobability of drawing each color tile.
RED:
The theoretical probability of drawing a red is1 1
or 33 %3 3
. The experimental probability of drawing a
red is3
10or 30%. The theoretical probability is slightly larger than the experimental probability.
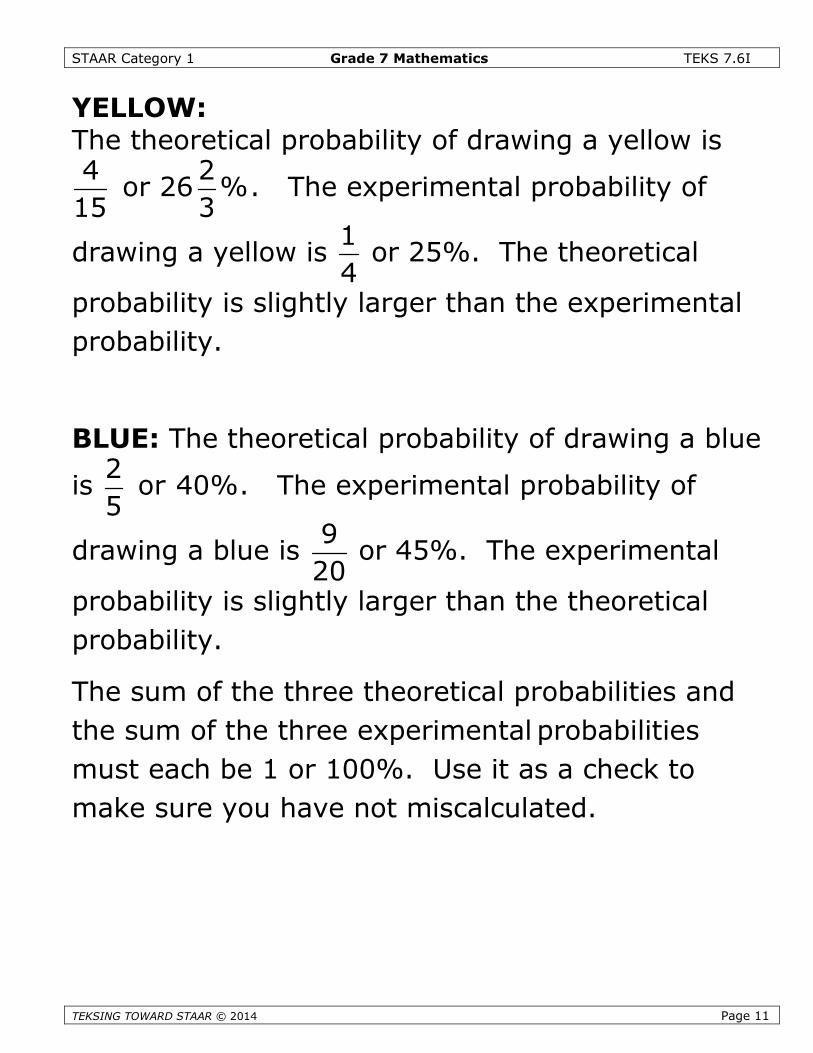
YELLOW:
The theoretical probability of drawing a yellow is4 2
or 26 %15 3
. The experimental probability of
drawing a yellow is1
4or 25%. The theoretical probability is slightly larger than the experimental
probability.
BLUE: The theoretical probability of drawing a blue is2
or 40%5
. The experimental probability of
drawing a blue is9
20or 45%. The experimental probability is slightly larger than the theoretical
probability.
The sum of the three theoretical probabilities and the sum of the three experimental probabilities musteach be 1 or 100%. Use that as a check to make sure you have not miscalculated.
Simple events are when there is one event. The event can be tossing a coin, rolling a number cube,drawing a card, spinning a spinner, etc. Compound events are when you have more than one eventoccurring. The events could be tossing a coin and spinning a spinner, tossing a coin and rolling anumber cube, drawing a card and spinning a spinner, spinning 2 different spinners, etc.
Compound events can be events that are independent events. Independent events are events that theresults of one event do NOT affect the results of the other event. An example of independent events istossing a coin and spinning a spinner. If the results of one event do affect the results of the secondevent, then they are dependent events. An example of dependent events is drawing 2 tiles from a bag,one at a time, and NOT replacing the first tile before drawing the second tile. The first draw affects thenumber of tiles in the bag for the second draw.
Where there are two independent events, the probability of certain events occurring is the product ofthe probability of each event occurring. P(A and B)= P(A) P(B)
STAAR Category 1 Grade 7 Mathematics TEKS 7.6I
TEKSING TOWARD STAAR © 2014 Page 4
When there are two dependent events, the probability of certain events occurring is the probability ofthe first event times the probability of the second event occurring given the occurrence of the firstevent. This is written P(A and B)= P(A) P(B/A)
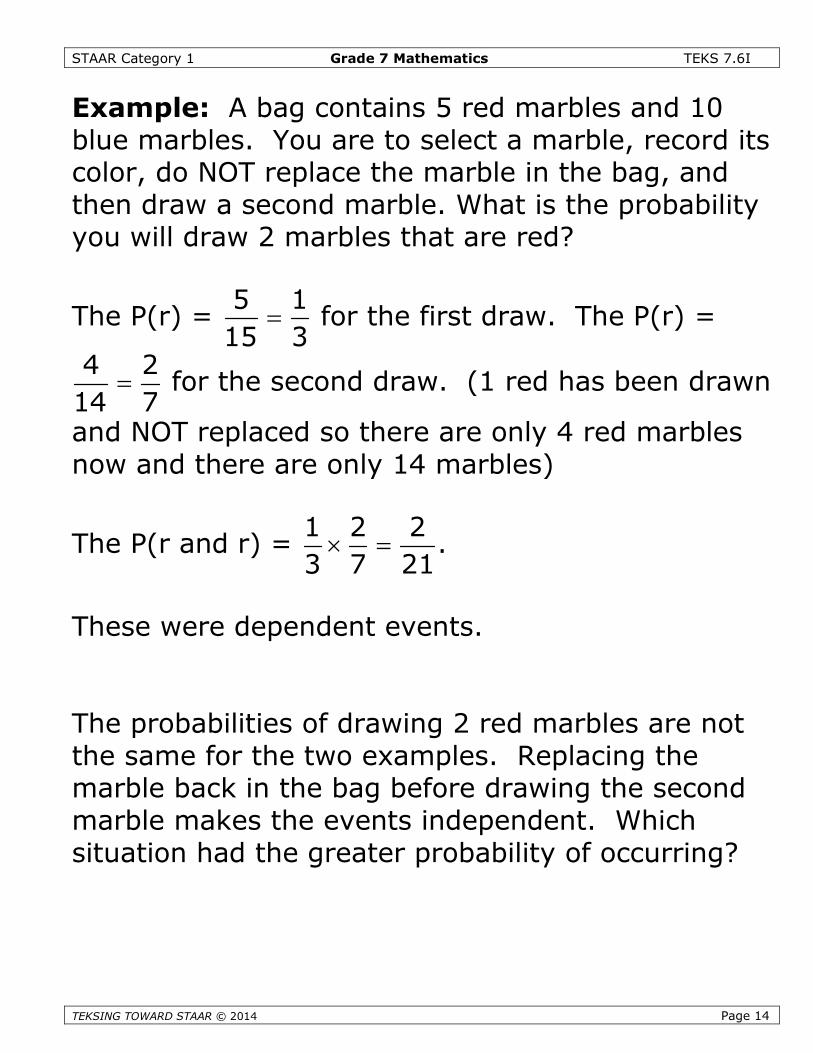
Example: A bag contains 5 red marbles and 10 blue marbles. You are to select a marble, record itscolor, replace the marble in the bag, and then draw a second marble. What is the probability you willdraw 2 marbles that are red?
The P(r) =5 1
15 3 for the first draw. The P(r) =
5 1
15 3 for the second draw.
The P(r and r) =1 1 1
3 3 9 .
These were independent events.
Example: A bag contains 5 red marbles and 10 blue marbles. You are to select a marble, record itscolor, do NOT replace the marble in the bag, and then draw a second marble. What is the probabilityyou will draw 2 marbles that are red?
The P(r) =5 1
15 3 for the first draw. The P(r) =
4 2
14 7 for the second draw. (1 red has been drawn
and NOT replaced so there are only 4 red marbles now and there are only 14 marbles)
The P(r and r) =1 2 2
3 7 21 .
These were dependent events.
The probabilities of drawing 2 red marbles are not the same for the two examples. Replacing themarble back in the bag before drawing the second marble makes the events independent. Whichsituation had the greater probability of occurring?
Determining Theoretical and Experimental Probabilities using Sample Spaces
A sample space of an event is a set of all the possible outcomes of the event. The set can be a list, atree diagram, or a table.
A sample space for tossing a coin is {heads, tails}. A sample space for rolling a 1-6 number cube isthe list: 1, 2, 3, 4, 5, and 6.
To determine the probability of an event using a sample space, use the same ratio
number of favorableoutcomes
number of possibleoutcomes
. Look at the sample space and count the number of favorable
outcomes for the numerator of the ratio. Count the total number of entries in the set for thedenominator of the ratio.
STAAR Category 1 Grade 7 Mathematics TEKS 7.6I
TEKSING TOWARD STA
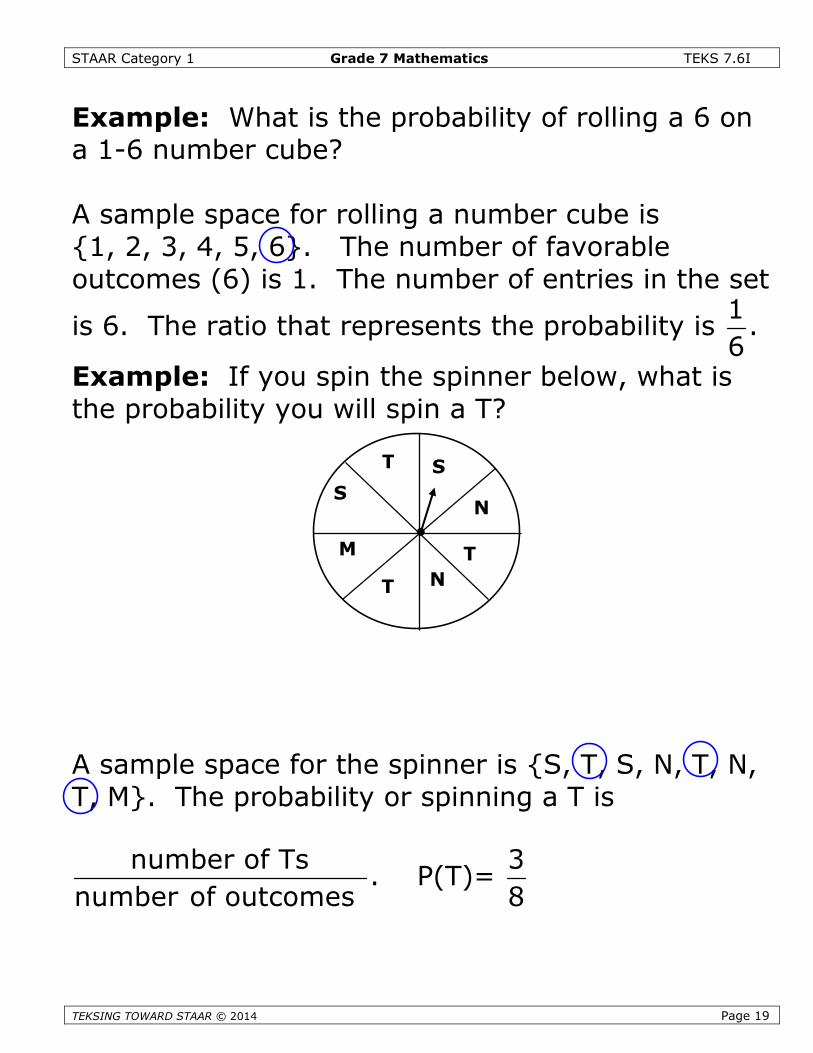
Example: What is the probability of rolling a 6 on a 1-6 number cube?
A sample space for rolling a number cube is {1, 2, 3, 4, 5, 6}. The number of favorable outcomes ( a
6) is 1. The number of entries in the set is 6. The ratio that represents the probability is1
6.
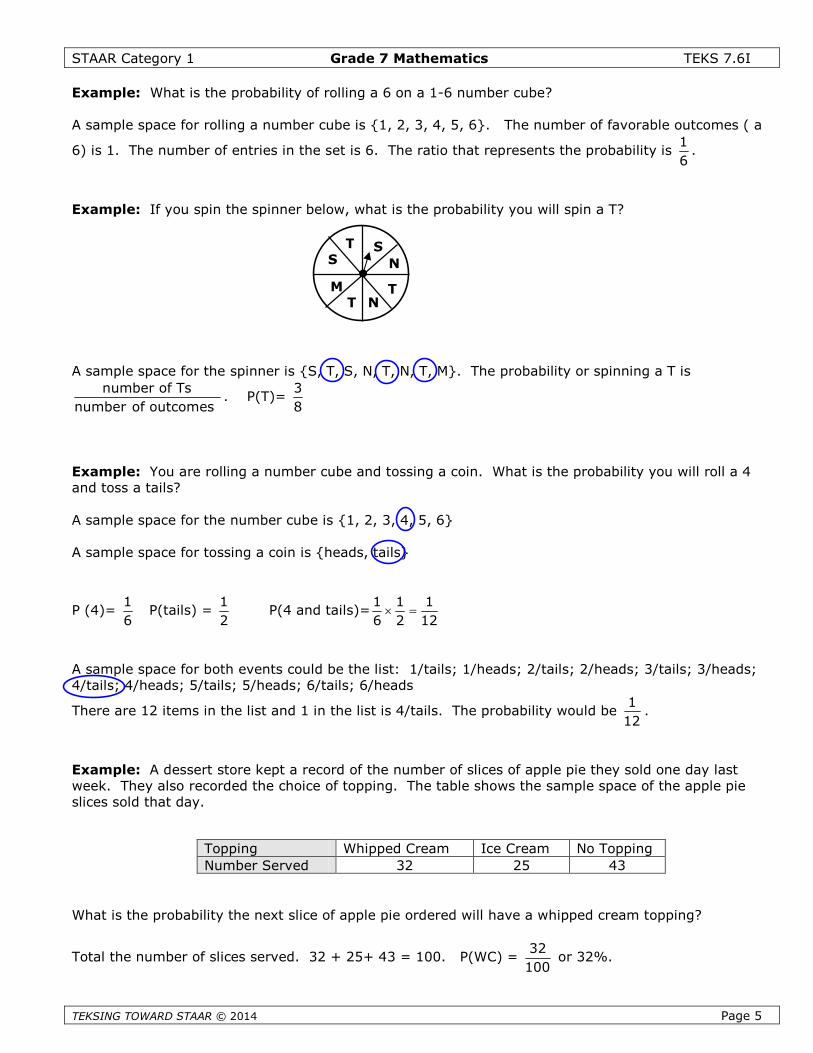
Example: If you spin the spinner below, what is the probability you will spin a T?
A sample space for the spinner is {S, T, S, N, T, N, T, M}. The probability or spinning a T is
number of Ts
number of outcomes. P(T)=
3
8
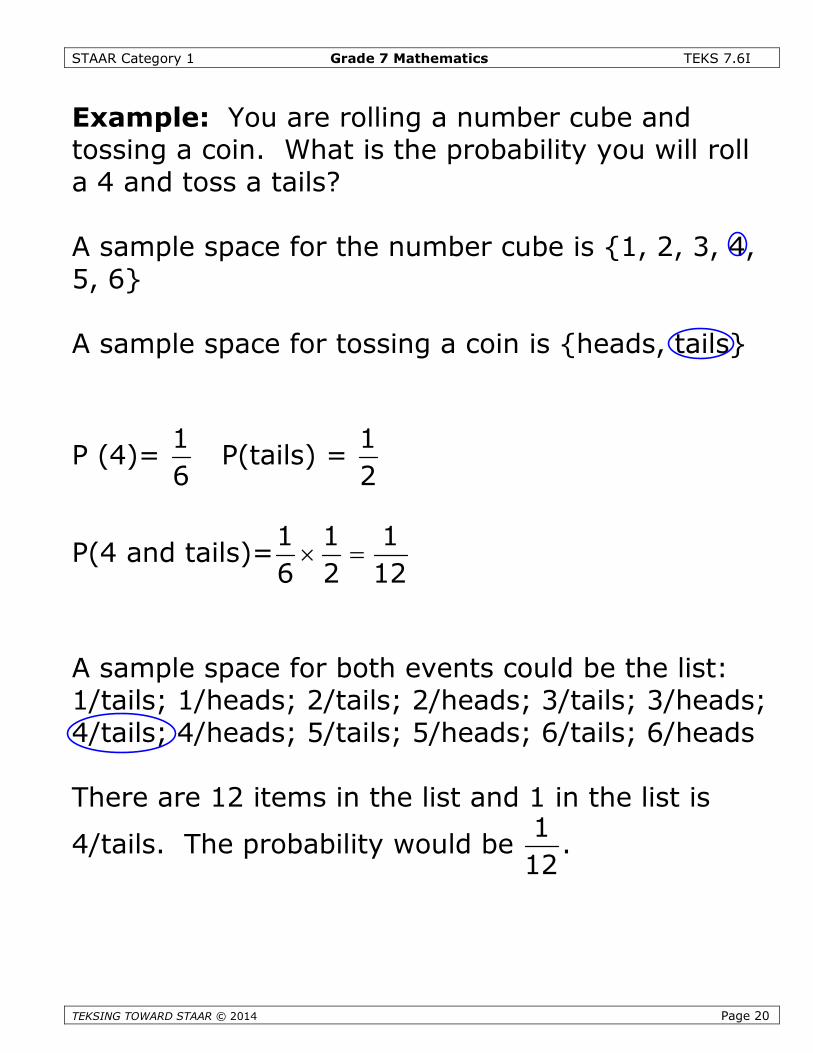
Example: You are rolling a number cube and tossing a coin. What is the probability you will roll a 4and toss a tails?
A sample space for the number cube is {1, 2, 3, 4, 5, 6}
A sample space for tossing a coin is {heads, tails}
P (4)=1
6P(tails) =
1
2P(4 and tails)=
1 1 1
6 2 12
A sample space for both events could be the list: 1/tails; 1/heads; 2/tails; 2/heads; 3/tails; 3/heads;4/tails; 4/heads; 5/tails; 5/heads; 6/tails; 6/heads
There are 12 items in the list and 1 in the list is 4/tails. The probability would be1
12.
Example: A dessert store kept a record of the number of slices of apple pie they sold one day lastweek. They also recorded the choice of topping. The table shows the sample space of the apple pieslices sold that day.
What is the probab
Total the number o
T
TT
N
M
SS
N
Topping Whipped Cream Ice Cream No Topping
AR © 2014 Page 5
ility the next slice of apple pie ordered will have a whipped cream topping?
f slices served. 32 + 25+ 43 = 100. P(WC) =32
100or 32%.
Number Served 32 25 43
STAAR Category 1 Grade 7 Mathematics TEKS 7.6I
TEKSING TOWARD STAAR © 2014 Page 6
Determining Theoretical and ExperimentalProbabilities Using Data
Recall from an earlier lesson, the probability of anevent is the ratio of the number of favorableoutcomes to the number of possible outcomes.
P(event) =number of favorableoutcomes
number of possibleoutcomes
There are two types of probabilities. Oneprobability is called the theoretical probability. Thetheoretical probability ratio is still:
number of favorableoutcomes
number of possibleoutcomes
.
For example, if you toss a coin, there are 2 possibleoutcomes, a tail or a head. The theoretical
probability of tossing a head is1
2. The theoretical
probability of tossing a tail is also1
2.
STAAR Category 1 Grade 7 Mathematics TEKS 7.6I
TEKSING TOWARD STAAR © 2014 Page 7
The other type of probability is called theexperimental probability. The experimentalprobability ratio is still:
number of favorableoutcomes
number of possibleoutcomes
.
The data used in the ratio is based on anexperiment of trials. For example, if you toss acoin 50 times, you could get 25 heads and 25 tailswhich would match the theoretical probability.However, it is more likely you would get data suchas 27 tails and 23 heads. If this were the data yourecorded for tossing a penny 50 times, theexperimental probability of tossing a head would
NOT be1
2. It would
number of heads
number of tosses
or
23
50,
which is less than1
2.
The more possible outcomes you have, the morelikely the experimental probability will be closer tothe theoretical probability. If you tossed a coin2,000 times, you would expect the number ofheads and the number of tails to be close to 1,000
each or1
2of the tosses.
STAAR Category 1 Grade 7 Mathematics TEKS 7.6I
TEKSING TOWARD STAAR © 2014 Page 8
Since a probability is a ratio of two values, it can beexpressed as a fraction, decimal, or percent. If the
probability is1
2, then it can be written also as 0.5
or 50%.
Example: A bag contains 5 red tiles, 6 blue tiles,and 4 yellow tiles. Benny randomly selects a tilefrom the bag. What is the theoretical probability hewill select a red tile? a yellow tile? a blue tile?
P(r) =number of red tiles
number of tiles
=
5 1
15 3
The theoretical probability of randomly drawing a
red tile is1 1
or 33 %3 3
.
P(y) =number of yellow tiles
number of tiles
=
4
15
The theoretical probability of randomly drawing a
yellow tile is4 2
or 26 %15 3
.
P(b) =number of blue tiles
number of tiles
=
6 2
15 5
STAAR Category 1 Grade 7 Mathematics TEKS 7.6I
TEKSING TOWARD STAAR © 2014 Page 9
The theoretical probability of randomly drawing a
blue tile is2
or 40%5
.
Example: A bag contains 5 red tiles, 6 blue tiles,and 4 yellow tiles. Benny randomly selects a tilefrom the bag. Benny draws a tile from the bag,records it color, and returns the tile to the bagbefore drawing another tile. He does this 40 times.The results of his experiment are recorded in thetable below.
Based on Benny’s data from his experiment, whatis the experimental probability the next tile hedraws from the bag will be red?
P(r) =number of red draws
number of draws
=
12 3
40 10 or 30%
Based on Benny’s data from his experiment, whatis the experimental probability the next tile hedraws from the bag will be yellow?
P(y) =number of yellow draws
number of draws
=
10 1
40 4 or 25%
Color red blue yellowNo. of Draws 12 18 10
STAAR Category 1 Grade 7 Mathematics TEKS 7.6I
TEKSING TOWARD STAAR © 2014 Page 10
Based on Benny’s data from his experiment, whatis the experimental probability the next tile hedraws from the bag will be blue?
P(b) =number of blue draws
number of draws
=
18 9
40 20 or 45%
Example: Using the two examples above,compare the theoretical probability to theexperimental probability of drawing each color tile.
RED:The theoretical probability of drawing a red is1 1
or 33 %3 3
. The experimental probability of
drawing a red is3
10or 30%. The theoretical
probability is slightly larger than the experimentalprobability.
STAAR Category 1 Grade 7 Mathematics TEKS 7.6I
TEKSING TOWARD STAAR © 2014 Page 11
YELLOW:The theoretical probability of drawing a yellow is4 2
or 26 %15 3
. The experimental probability of
drawing a yellow is1
4or 25%. The theoretical
probability is slightly larger than the experimental
probability.
BLUE: The theoretical probability of drawing a blue
is2
or 40%5
. The experimental probability of
drawing a blue is9
20or 45%. The experimental
probability is slightly larger than the theoretical
probability.
The sum of the three theoretical probabilities and
the sum of the three experimental probabilities
must each be 1 or 100%. Use it as a check to
make sure you have not miscalculated.
STAAR Category 1 Grade 7 Mathematics TEKS 7.6I
TEKSING TOWARD STAAR © 2014 Page 12
Simple events are when there is one event. Theevent can be tossing a coin, rolling a number cube,drawing a card, spinning a spinner, etc.
Compound events are when you have more thanone event occurring. The events could be tossing acoin and spinning a spinner, tossing a coin androlling a number cube, drawing a card and spinninga spinner, spinning 2 different spinners, etc.
Compound events can be events that areindependent events or dependent events.
Independent events are events that the resultsof one event do NOT affect the results of the otherevent. An example of independent events istossing a coin and spinning a spinner.
If the results of one event do affect the results ofthe second event, then they are dependentevents. An example of dependent events isdrawing 2 tiles from a bag, one at a time, and NOTreplacing the first tile before drawing the secondtile. The first draw affects the number of tiles inthe bag for the second draw.
STAAR Category 1 Grade 7 Mathematics TEKS 7.6I
TEKSING TOWARD STAAR © 2014 Page 13
Where there are two independent events, theprobability of certain events occurring is theproduct of the probability of each event occurring.P(A and B)= P(A) P(B)
When there are two dependent events, theprobability of certain events occurring is theprobability of the first event times the probability ofsecond event occurring given the occurrence of thefirst event.
This is written P(A and B)= P(A) P(B/A)
Example: A bag contains 5 red marbles and 10blue marbles. You are to select a marble, record itscolor, replace the marble in the bag, and then drawa second marble. What is the probability you willdraw 2 marbles that are red?
The P(r) =5 1
15 3 for the first draw. The P(r) =
5 1
15 3 for the second draw.
The P(r and r) =1 1 1
3 3 9 .
These were independent events.
STAAR Category 1 Grade 7 Mathematics TEKS 7.6I
TEKSING TOWARD STAAR © 2014 Page 14
Example: A bag contains 5 red marbles and 10blue marbles. You are to select a marble, record itscolor, do NOT replace the marble in the bag, andthen draw a second marble. What is the probabilityyou will draw 2 marbles that are red?
The P(r) =5 1
15 3 for the first draw. The P(r) =
4 2
14 7 for the second draw. (1 red has been drawn
and NOT replaced so there are only 4 red marblesnow and there are only 14 marbles)
The P(r and r) =1 2 2
3 7 21 .
These were dependent events.
The probabilities of drawing 2 red marbles are notthe same for the two examples. Replacing themarble back in the bag before drawing the secondmarble makes the events independent. Whichsituation had the greater probability of occurring?
STAAR Category 1 Grade 7 Mathematics TEKS 7.6I
TEKSING
Problem-Solving 1
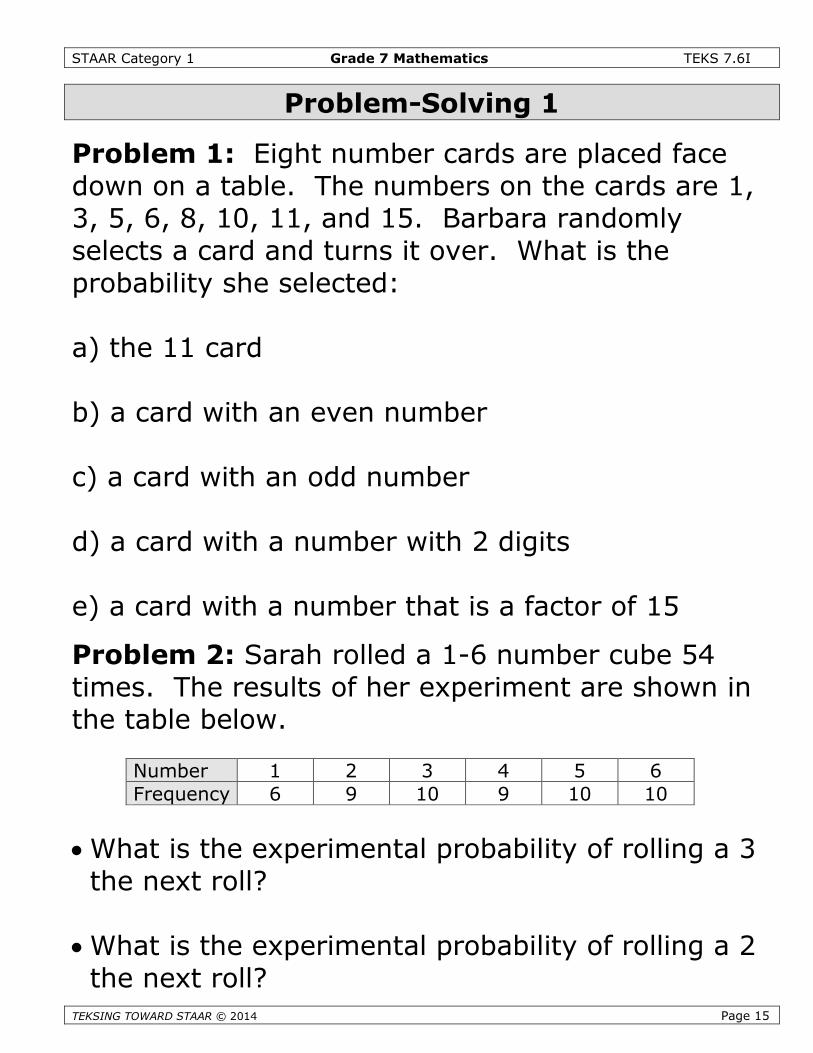
Problem 1: Eight number cards are placed facedown on a table. The numbers on the cards are 1,3, 5, 6, 8, 10, 11, and 15. Barbara randomlyselects a card and turns it over. What is theprobability she selected:
a) the 11 card
b) a card with an even number
c) a card with an odd number
d) a card with a number with 2 digits
e) a card with a number that is a factor of 15
Problem 2: Sarah rolled a 1-6 number cube 54times. The results of her experiment are shown inthe table below.
Whthe
Whthe
Number 1 2 3 4 5 6
TOWARD STAAR © 2014 Page 15
at is the experimental probability of rolling a 3next roll?
at is the experimental probability of rolling a 2next roll?
Frequency 6 9 10 9 10 10
STAAR Category 1 Grade 7 Mathematics TEKS 7.6I
TEKSING TOWARD STAAR © 2014 Page 16
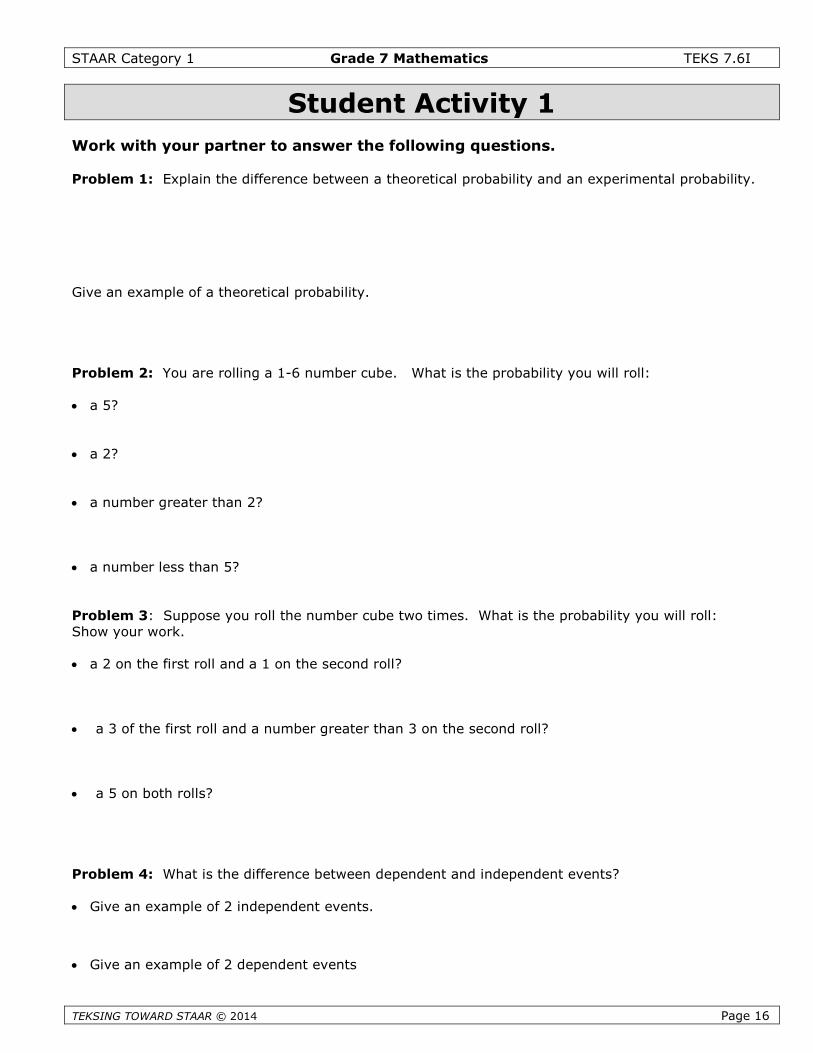
Student Activity 1
Work with your partner to answer the following questions.
Problem 1: Explain the difference between a theoretical probability and an experimental probability.
Give an example of a theoretical probability.
Problem 2: You are rolling a 1-6 number cube. What is the probability you will roll:
a 5?
a 2?
a number greater than 2?
a number less than 5?
Problem 3: Suppose you roll the number cube two times. What is the probability you will roll:Show your work.
a 2 on the first roll and a 1 on the second roll?
a 3 of the first roll and a number greater than 3 on the second roll?
a 5 on both rolls?
Problem 4: What is the difference between dependent and independent events?
Give an example of 2 independent events.
Give an example of 2 dependent events
STAAR Category 1 Grade 7 Mathematics TEKS 7.6I
TEKSING TOWARD STAAR © 2014 Page 17
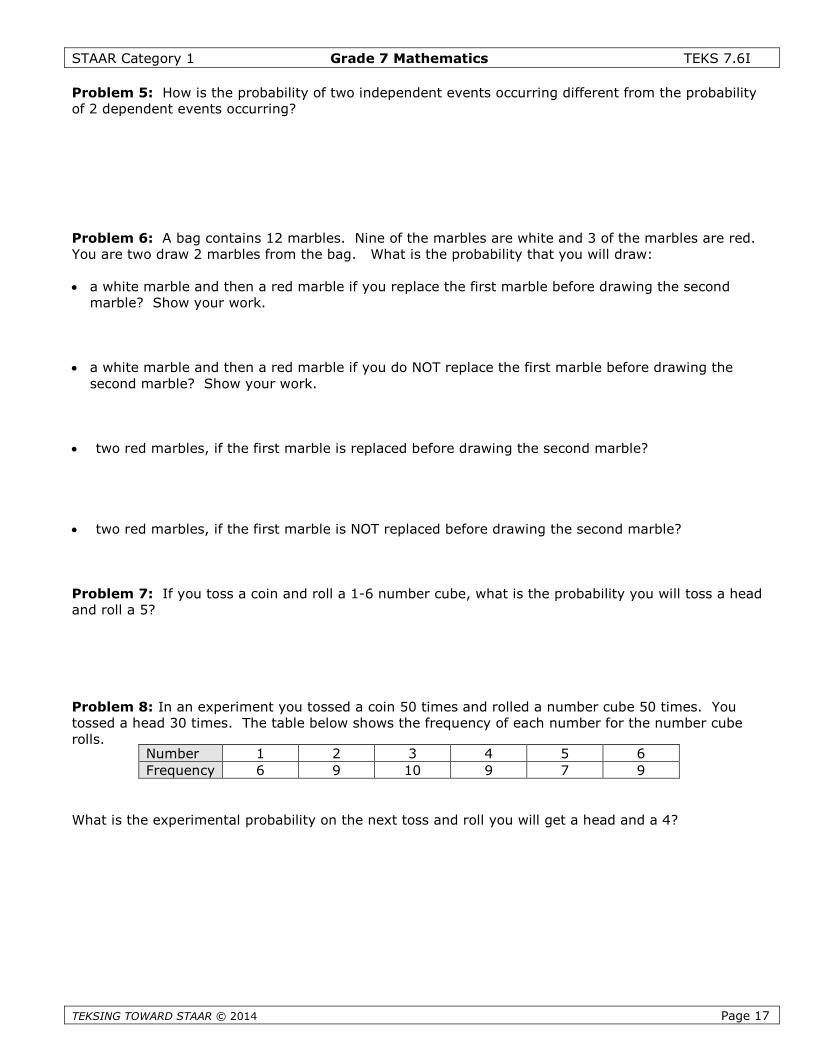
Problem 5: How is the probability of two independent events occurring different from the probabilityof 2 dependent events occurring?
Problem 6: A bag contains 12 marbles. Nine of the marbles are white and 3 of the marbles are red.You are two draw 2 marbles from the bag. What is the probability that you will draw:
a white marble and then a red marble if you replace the first marble before drawing the secondmarble? Show your work.
a white marble and then a red marble if you do NOT replace the first marble before drawing thesecond marble? Show your work.
two red marbles, if the first marble is replaced before drawing the second marble?
two red marbles, if the first marble is NOT replaced before drawing the second marble?
Problem 7: If you toss a coin and roll a 1-6 number cube, what is the probability you will toss a headand roll a 5?
Problem 8: In an experiment you tossed a coin 50 times and rolled a number cube 50 times. Youtossed a head 30 times. The table below shows the frequency of each number for the number cuberolls.
What is the experimental probability on the next toss and roll you will get a head and a 4?
Number 1 2 3 4 5 6
Frequency 6 9 10 9 7 9
STAAR Category 1 Grade 7 Mathematics TEKS 7.6I
TEKSING TOWARD STAAR © 2014 Page 18
Determining Theoretical Probability andExperimental Probability using Sample Spaces
A sample space of an event is a set of all thepossible outcomes of the event. The set can be alist, a tree diagram, or a table.
A sample space for tossing a coin is {heads, tails}.A sample space for rolling a 1-6 number cube is thelist: 1, 2, 3, 4, 5, and 6.
To determine the probability of an event using asample space, use the same ratio
number of favorableoutcomes
number of possibleoutcomes
.
Look at the sample space and count the number offavorable outcomes for the numerator of the ratio.Count the total number of entries in the set for thedenominator of the ratio.
STAAR Category 1 Grade 7 Mathematics TEKS 7.6I
TEKSING TOWARD STAAR © 2014 Page 19
Example: What is the probability of rolling a 6 ona 1-6 number cube?
A sample space for rolling a number cube is{1, 2, 3, 4, 5, 6}. The number of favorableoutcomes (6) is 1. The number of entries in the set
is 6. The ratio that represents the probability is1
6.
Example: If you spin the spinner below, what isthe probability you will spin a T?
A sample space for the spinner is {S, T, S, N, T, N,T, M}. The probability or spinning a T is
number of Ts
number of outcomes. P(T)=
3
8
T
T
T
N
M
S
S
N
STAAR Category 1 Grade 7 Mathematics TEKS 7.6I
TEKSING TOWARD STAAR © 2014 Page 20
Example: You are rolling a number cube andtossing a coin. What is the probability you will rolla 4 and toss a tails?
A sample space for the number cube is {1, 2, 3, 4,5, 6}
A sample space for tossing a coin is {heads, tails}
P (4)=1
6P(tails) =
1
2
P(4 and tails)=1 1 1
6 2 12
A sample space for both events could be the list:1/tails; 1/heads; 2/tails; 2/heads; 3/tails; 3/heads;4/tails; 4/heads; 5/tails; 5/heads; 6/tails; 6/heads
There are 12 items in the list and 1 in the list is
4/tails. The probability would be1
12.

STAAR Category 1 Grade 7 Mathematics TEKS 7.6I
TEKSING TOWARD STAAR © 2014 Page 21
Example: A dessert store kept a record of thenumber of slices of apple pie they sold one day lastweek. They also recorded the choice of topping.The table shows the sample space of the apple pieslices sold that day.
What is the probability the next slice of apple pieordered will have a whipped cream topping?
Total the number of slices served. 32 + 25+ 43 =
100. P(WC) =32
100or 32%.
Topping Whipped Cream Ice Cream No ToppingNumber Served 32 25 43

STAAR Category 1 Grade 7 Mathematics TEKS 7.6I
TEKSING TOWARD STAAR © 2014 Page 22
Problem-Solving 2
Problem 1: Give a sample space for spinning a spinner that
has 5 equal spaces numbered 1,2,3,4, and 5.
What is the probability you will spin a 3?
What is the probability you will spin an evennumber?
Problem 2: Create a sample space for spinning the spinner inProblem 1 and tossing a penny.
What is the probability you will spin a 3 and tossa head?
What is the probability you will spin a numberlarger than 2 and toss a tail?
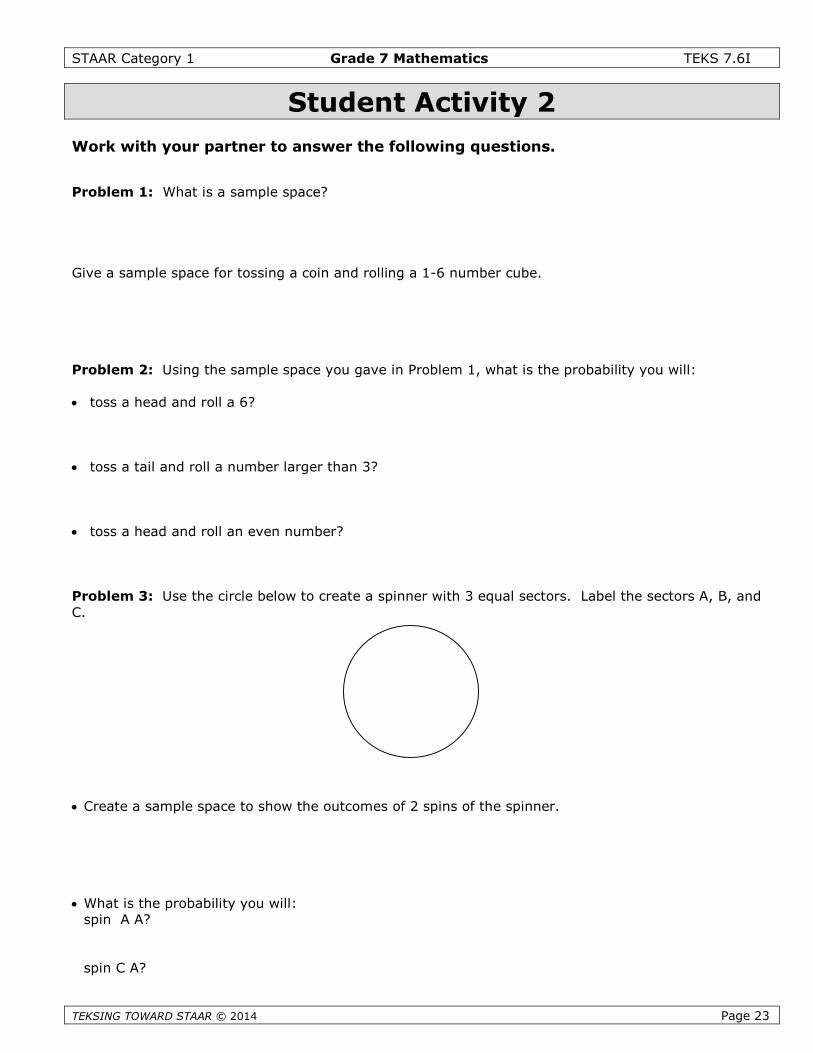
STAAR Category 1 Grade 7 Mathematics TEKS 7.6I
TEKSING TOWARD STAAR © 2014 Page 23
Student Activity 2
Work with your partner to answer the following questions.
Problem 1: What is a sample space?
Give a sample space for tossing a coin and rolling a 1-6 number cube.
Problem 2: Using the sample space you gave in Problem 1, what is the probability you will:
toss a head and roll a 6?
toss a tail and roll a number larger than 3?
toss a head and roll an even number?
Problem 3: Use the circle below to create a spinner with 3 equal sectors. Label the sectors A, B, andC.
Create a sample space to show the outcomes of 2 spins of the spinner.
What is the probability you will:spin A A?
spin C A?
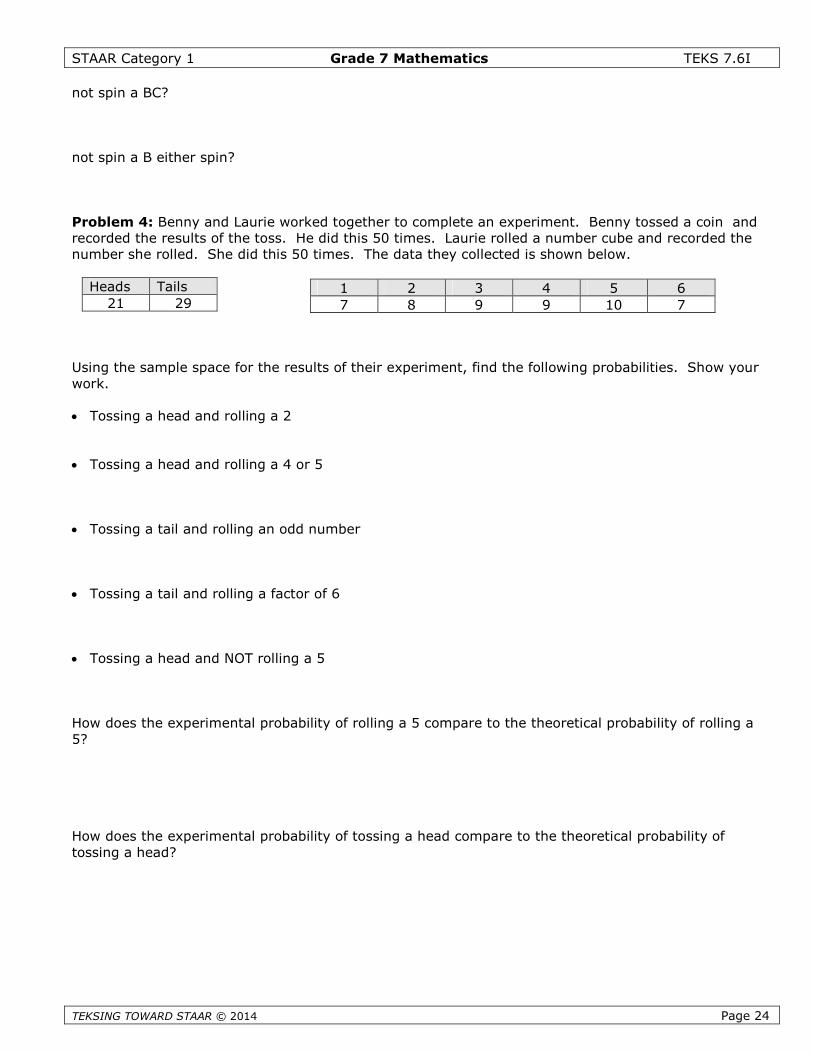
STAAR Category 1 Grade 7 Mathematics TEKS 7.6I
TE
not spin a BC?
not spin a B either spin?
Problem 4: Benny and Laurie worked together to complete an experiment. Benny tossed a coin andrecorded the results of the toss. He did this 50 times. Laurie rolled a number cube and recorded thenumber she rolled. She did this 50 times. The data they collected is shown below.
Uw
H5
Hto
Heads Tails
KSING TOWARD STAAR © 2014
sing the sample space for the resultsork.
Tossing a head and rolling a 2
Tossing a head and rolling a 4 or 5
Tossing a tail and rolling an odd num
Tossing a tail and rolling a factor of
Tossing a head and NOT rolling a 5
ow does the experimental probability?
ow does the experimental probabilityssing a head?
21 29
1 2 3 4 5 6Page 24
of their experiment, find the following probabilities. Show your
ber
6
of rolling a 5 compare to the theoretical probability of rolling a
of tossing a head compare to the theoretical probability of
7 8 9 9 10 7
STAAR Category 1 Grade 7 Mathematics TEKS 7.6I
TEKSING TOWARD STAAR © 2014 Page 25
Teacher Notes for Student Activity 3
MATERIALS: Per Pair of Students: 1 bag of 4 colored tiles using 4 colors; 1 penny; 1 number cube
PROCEDURE:
Distribute materials to pairs of students.
Students complete Student Activity 3.
Before students begin working, ask the following questions:
How can you create a frequency table for the results of an experiment?
Can you create a sample space for an event?
During Student Activity 3, roam the room and listen for the following:
Do the students understand how to make the frequency table for their event?
Do the students understand how to analyze their data and answer questions about the probabilities oftheir event?
During Student Activity 3, roam the room and look for the following:
Are students working together to answer their questions?
TAKS
Answers to these questions can be used to support decisions related to further whole classinstruction or group and individual student instruction during tutorial settings.
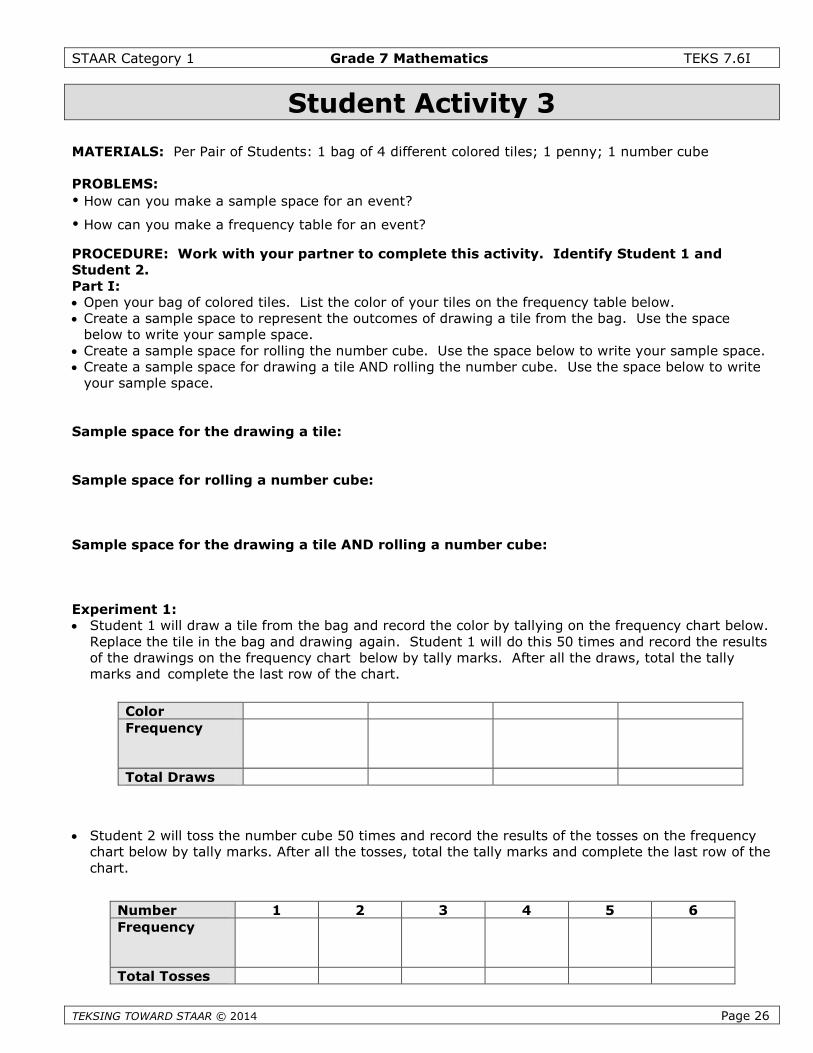
STAAR Category 1 Grade 7 Mathematics TEKS 7.6I
TEKSING TOWARD STAAR © 2014 Page 26
Student Activity 3
MATERIALS: Per Pair of Students: 1 bag of 4 different colored tiles; 1 penny; 1 number cube
PROBLEMS:
How can you make a sample space for an event?
How can you make a frequency table for an event?
PROCEDURE: Work with your partner to complete this activity. Identify Student 1 andStudent 2.Part I: Open your bag of colored tiles. List the color of your tiles on the frequency table below. Create a sample space to represent the outcomes of drawing a tile from the bag. Use the space
below to write your sample space. Create a sample space for rolling the number cube. Use the space below to write your sample space. Create a sample space for drawing a tile AND rolling the number cube. Use the space below to write
your sample space.
Sample space for the drawing a tile:
Sample space for rolling a number cube:
Sample space for the drawing a tile AND rolling a number cube:
Experiment 1: Student 1 will draw a tile from the bag and record the color by tallying on the frequency chart below.
Replace the tile in the bag and drawing again. Student 1 will do this 50 times and record the resultsof the drawings on the frequency chart below by tally marks. After all the draws, total the tallymarks and complete the last row of the chart.
Student 2 will toss the number cube 50 times and record the results of the tosses on the frequencychart below by tally marks. After all the tosses, total the tally marks and complete the last row of thechart.
Color
Frequency
Total Draws
Number 1 2 3 4 5 6
Frequency
Total Tosses
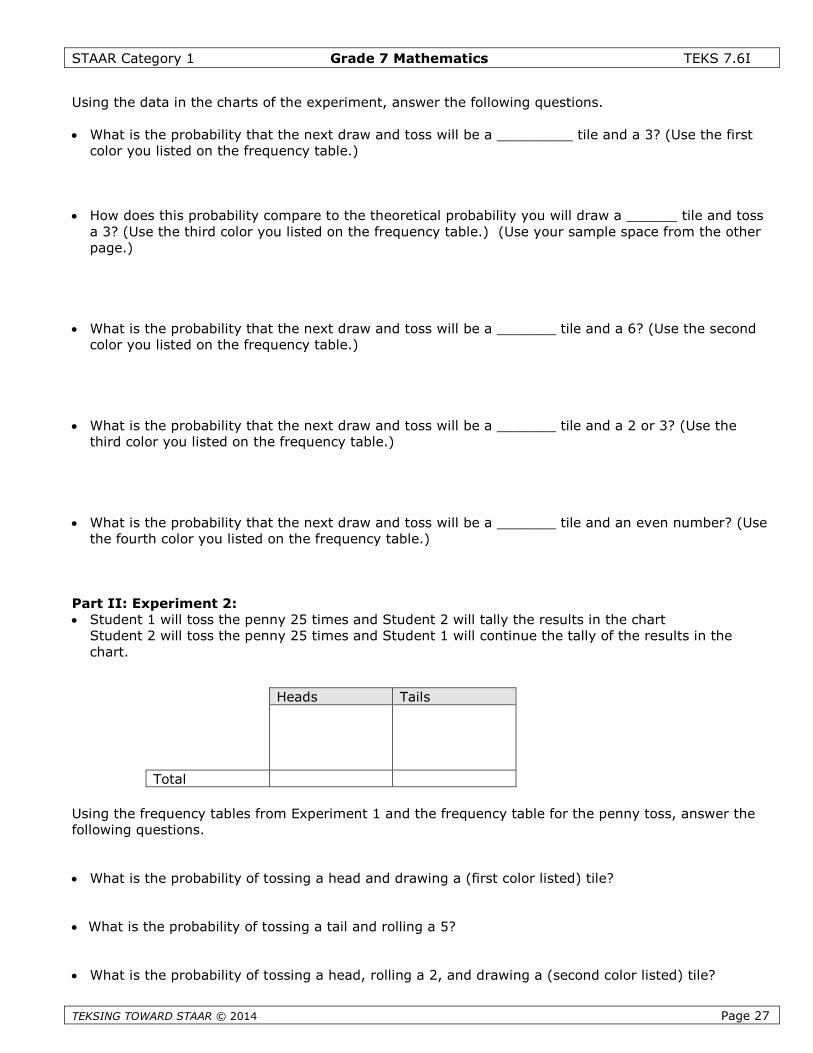
STAAR Category 1 Grade 7 Mathematics TEKS 7.6I
TEKSING TOW
Using the data in the charts of the experiment, answer the following questions.
What is the probability that the next draw and toss will be a _________ tile and a 3? (Use the firstcolor you listed on the frequency table.)
How does this probability compare to the theoretical probability you will draw a ______ tile and tossa 3? (Use the third color you listed on the frequency table.) (Use your sample space from the otherpage.)
What is the probability that the next draw and toss will be a _______ tile and a 6? (Use the secondcolor you listed on the frequency table.)
What is the probability that the next draw and toss will be a _______ tile and a 2 or 3? (Use thethird color you listed on the frequency table.)
What is the probability that the next draw and toss will be a _______ tile and an even number? (Usethe fourth color you listed on the frequency table.)
Part II: Experiment 2: Student 1 will toss the penny 25 times and Student 2 will tally the results in the chart
Student 2 will toss the penny 25 times and Student 1 will continue the tally of the results in thechart.
Using the ffollowing q
What is
What is t
What is
Heads Tails
ARD STAAR © 2014 Page 27
requency tables from Experiment 1 and the frequency table for the penny toss, answer theuestions.
the probability of tossing a head and drawing a (first color listed) tile?
he probability of tossing a tail and rolling a 5?
the probability of tossing a head, rolling a 2, and drawing a (second color listed) tile?
Total
STAAR Category 1 Grade 7 Mathematics TEKS 7.6I
TEKSING TOWARD STAAR © 2014 Page 28
When tossing the penny and rolling the cube, does one outcome of tossing the penny and rolling aparticular number appear to have a larger probability than any other similar outcome?
If so, what is the outcome?
Theoretically, should there be one outcome with a larger probability? Explain your answer.
Part III: Did you have any difficulties in answering any of the questions in this activity?_____ If so, which
questions?
Did you have any difficulties in creating the frequency tables?
How did you check your frequency table to make sure you had completed the experiment?
Create a compound event using all three frequency charts. Write the event below, and then find theprobability of the event occurring.
STAAR Category 1 Grade 7 Mathematics TEKS 7.6I
TEKSING TOWARD STAAR © 2014 Page 29
NAME___________________ DATE_____________________ SCORE ___/5
7.6I Skills and Concepts Homework 1
1. What is the ratio that represents the probability of a simple event occurring?
2. What is the probability you will:
toss a head on a coin?
roll a 4 on a 1-6 number cube?
3. What is the probability you will toss a head and roll a 4 on a 1-6 number cube?
4. What are compound events?
What are independent events of a compound event?
What are dependent events of a compound event?
Give an example of independent events and an example of dependent events.
5. How do you find the probability of independent and dependent events?
STAAR Category 1 Grade 7 Mathematics TEKS 7.6I
TEKSING TOWARD STAAR © 2014 Page 30
NAME___________________ DATE_____________________ SCORE ___/5
7.6I Skills and Concepts Homework 2
1. What is a sample space?
Give a sample space for drawing a tile from a bag that contains 1 red tile, 1 blue tile, 1 green tile,and 1 yellow tile.
2. Joanie tossed a nickel 30 times. She tallied 18 heads and 12 tails.
What is the experimental probability the next toss will be a tail?
What is the experimental probability the next toss will be a head?
What is the theoretical probability the next toss will be head?
3. Make a sample space for tossing a nickel and rolling a 1-6 number cube.
How many items are in your sample space? __________
What is the probability of tossing a head and rolling a 1?
What is the probability of tossing a tail and rolling a 3 or 5? Circle the favorable outcomes inthe sample space you created.
4. Create a spinner with 7 equal spaces labeled 0-6.
STAAR Category 1 Grade 7 Mathematics TEKS 7.6I
TEKSING TOWARD STAAR © 2014 Page 31
Create a sample space for tossing a coin and spinning the spinner.
How many elements are in your sample space? _________
How many elements in your sample space contain a 3?
How many elements in your sample space contain a head?
How many elements in your sample space contain both a head and a 3?
What is the probability you will spin a 3 and toss a head?
5. A bag contains 3 white marbles and 2 black marbles.
You draw a marble, record it color, and do NOT replace it before drawing a second marble. What isthe probability you will draw a white marble and then a black marble?
You draw a marble, record it color, and replace it before drawing a second marble. What is theprobability you will draw a white marble and then a black marble?
Which of the two situations above are dependent events?
Which of the two situations has the larger probability of occurring?
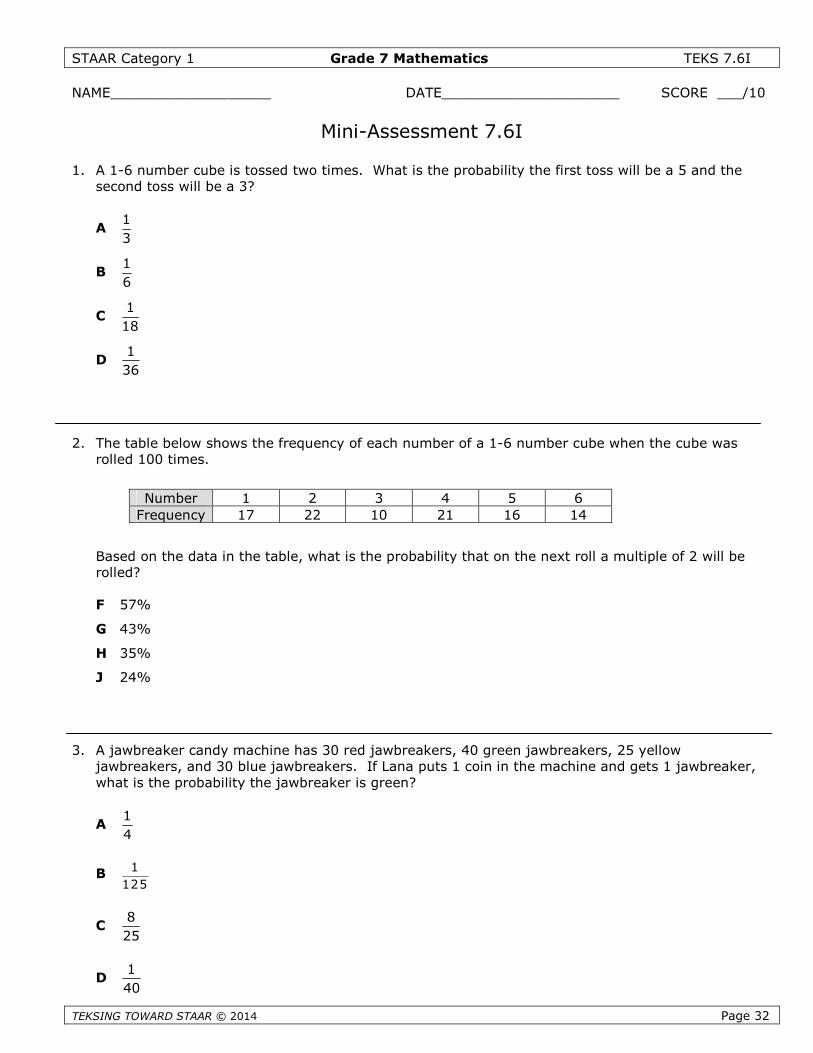
STAAR Category 1 Grade 7 Mathematics TEKS 7.6I
TEKSING TOWARD STAAR © 2014 Page 32
NAME___________________ DATE_____________________ SCORE ___/10
Mini-Assessment 7.6I
1. A 1-6 number cube is tossed two times. What is the probability the first toss will be a 5 and thesecond toss will be a 3?
A1
3
B1
6
C1
18
D1
36
2. The table below shows the frequency of each number of a 1-6 number cube when the cube wasrolled 100 times.
Based on the data in the table, what is the probability that on the next roll a multiple of 2 will berolled?
F 57%
G 43%
H 35%
J 24%
3. A jawbreaker candy machine has 30 red jawbreakers, 40 green jawbreakers, 25 yellowjawbreakers, and 30 blue jawbreakers. If Lana puts 1 coin in the machine and gets 1 jawbreaker,what is the probability the jawbreaker is green?
A1
4
B1
125
C8
25
D1
40
Number 1 2 3 4 5 6
Frequency 17 22 10 21 16 14
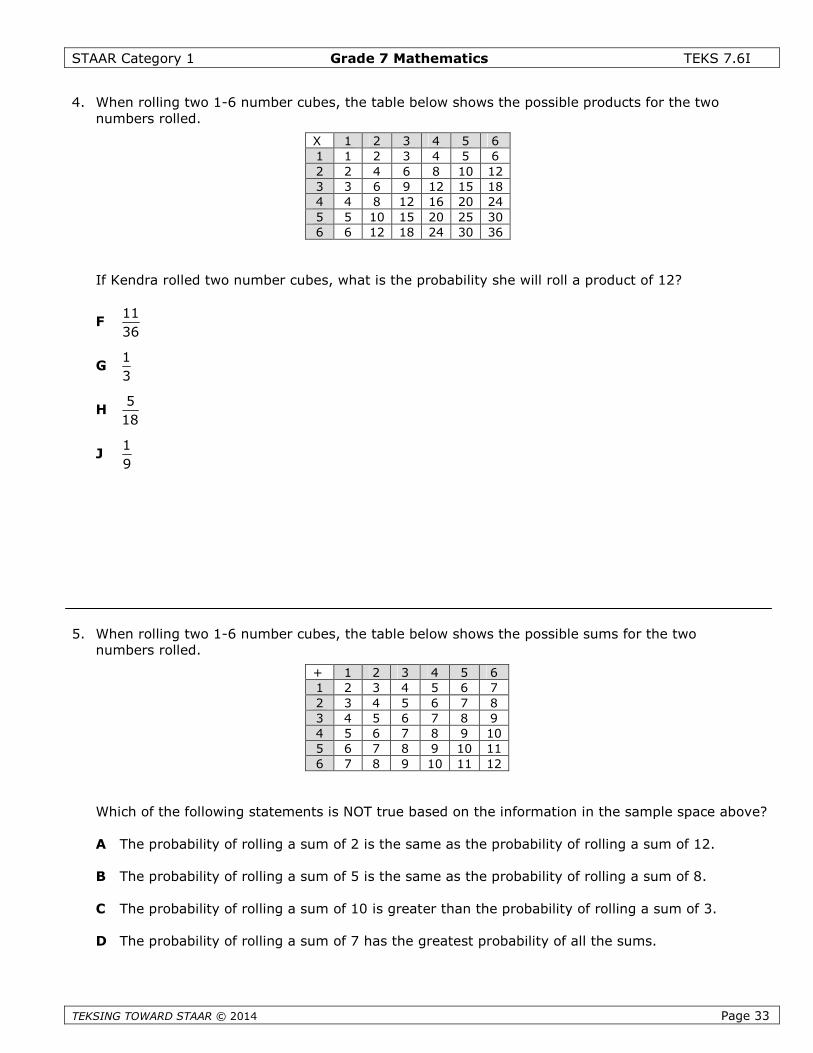
STAAR Category 1 Grade 7 Mathematics TEKS 7.6I
TEKSING TOWARD STAAR © 2014 Page 33
4. When rolling two 1-6 number cubes, the table below shows the possible products for the twonumbers rolled.
If Kendra rolled two number cubes, what is the probability she will roll a product of 12?
F11
36
G1
3
H5
18
J1
9
5. When rolling two 1-6 number cubes, the table below shows the possible sums for the twonumbers rolled.
Which of the following statements is NOT true based on the information in the sample space above?
A The probability of rolling a sum of 2 is the same as the probability of rolling a sum of 12.
B The probability of rolling a sum of 5 is the same as the probability of rolling a sum of 8.
C The probability of rolling a sum of 10 is greater than the probability of rolling a sum of 3.
D The probability of rolling a sum of 7 has the greatest probability of all the sums.
X 1 2 3 4 5 6
1 1 2 3 4 5 6
2 2 4 6 8 10 12
3 3 6 9 12 15 18
4 4 8 12 16 20 24
5 5 10 15 20 25 30
6 6 12 18 24 30 36
+ 1 2 3 4 5 6
1 2 3 4 5 6 7
2 3 4 5 6 7 8
3 4 5 6 7 8 9
4 5 6 7 8 9 10
5 6 7 8 9 10 11
6 7 8 9 10 11 12
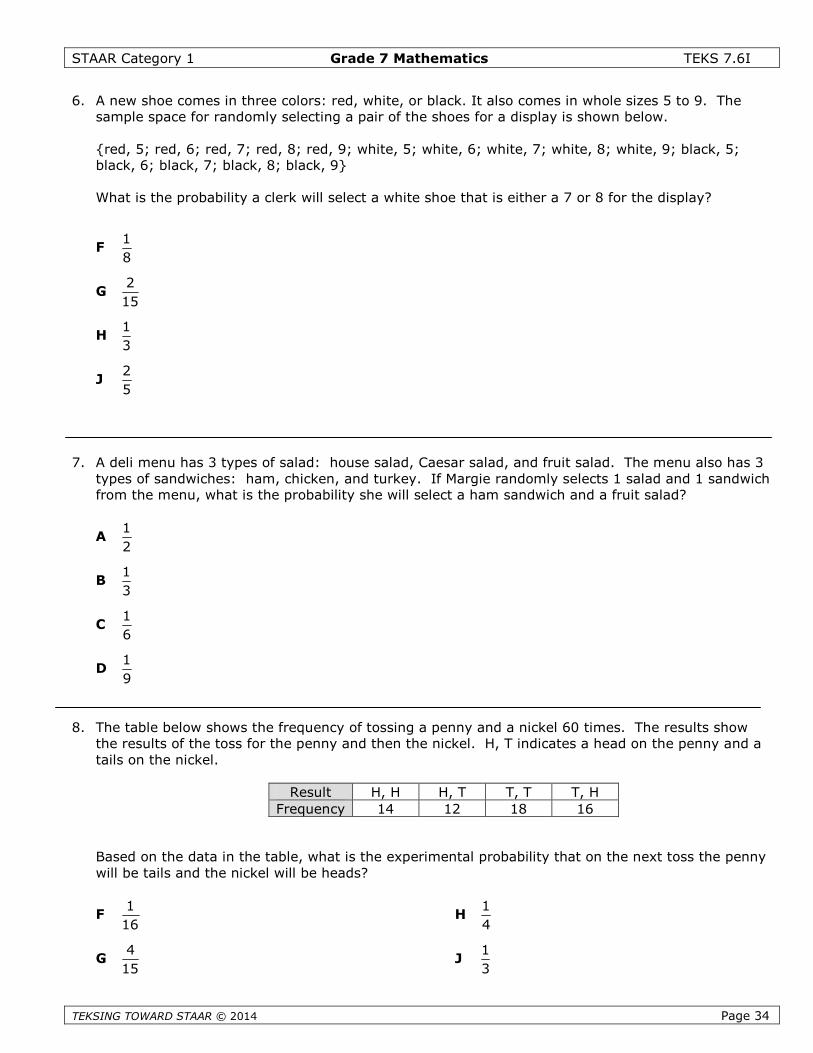
STAAR Category 1 Grade 7 Mathematics TEKS 7.6I
TEKSING TOWARD STAAR © 2014
6. A new shoe comes in three colors: red, white, or black. It also comes in whole sizes 5 to 9. Thesample space for randomly selecting a pair of the shoes for a display is shown below.
{red, 5; red, 6; red, 7; red, 8; red, 9; white, 5; white, 6; white, 7; white, 8; white, 9; black, 5;black, 6; black, 7; black, 8; black, 9}
What is the probability a clerk will select a white shoe that is either a 7 or 8 for the display?
F1
8
G2
15
H1
3
J2
5
7. A deli menu has 3 types of salad: house salad, Caesar salad, and fruit salad. The menu also has 3types of sandwiches: ham, chicken, and turkey. If Margie randomly selects 1 salad and 1 sandwichfrom the menu, what is the probability she will select a ham sandwich and a fruit salad?
A1
2
B1
3
C1
6
D1
9
8. The table below shows the frequency of tossing a penny and a nickel 60 times. The results showthe results of the toss for the penny and then the nickel. H, T indicates a head on the penny and atails on the nickel.
Based on the data in the tabwill be tails and the nickel w
F1
16
G4
15
F
Result H, H H, T T, T T, H
Page 34
le, what is the experimental probability that on the next toss the pennyill be heads?
H1
4
J1
3
requency 14 12 18 16
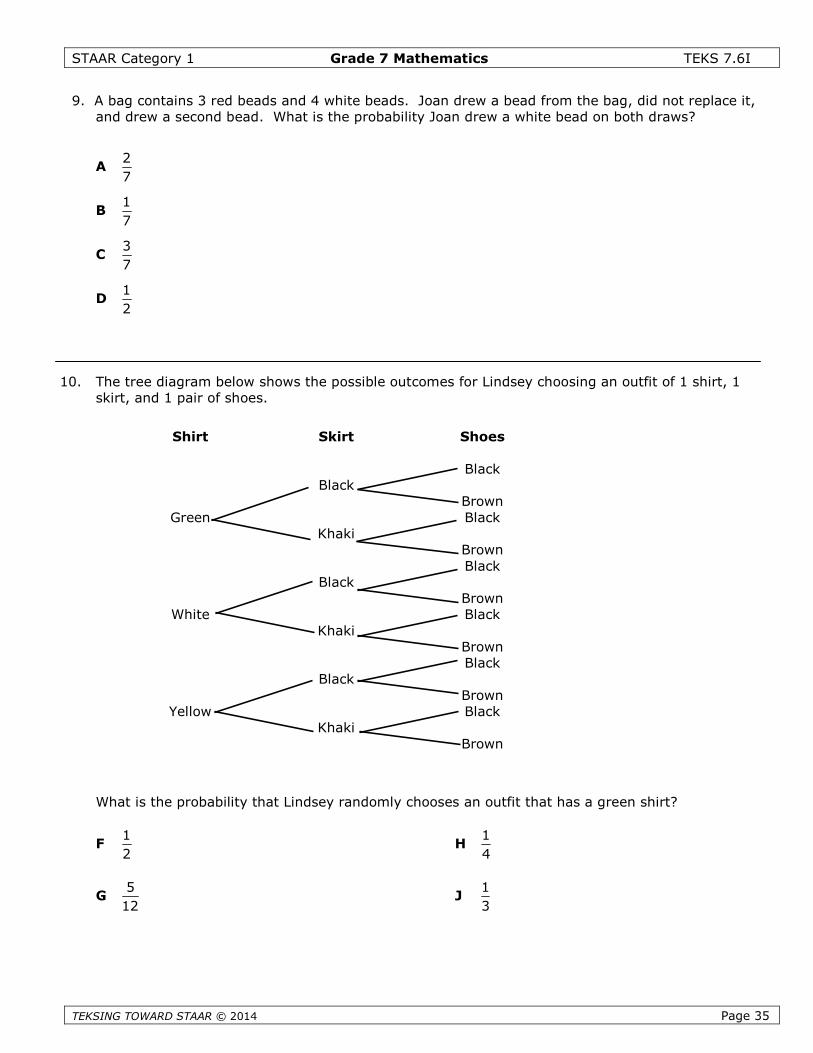
STAAR Category 1 Grade 7 Mathematics TEKS 7.6I
TEKSING TOWAR
9. A bag contains 3 red beads and 4 white beads. Joan drew a bead from the bag, did not replace it,and drew a second bead. What is the probability Joan drew a white bead on both draws?
A2
7
B1
7
C3
7
D1
2
10. The tree diagram below shows the possible outcomes for Lindsey choosing an outfit of 1 shirt, 1skirt, and 1 pair of shoes.
What is th
F1
2
G5
12
Shirt Skirt Shoes
BlackBlack
BrownGreen Black
KhakiBrownBlack
BlackBrown
White BlackKhaki
BrownBlack
BlackBrown
Yellow BlackKhaki
Brown
D STAAR © 2014 Page 35
e probability that Lindsey randomly chooses an outfit that has a green shirt?
H1
4
J1
3
Six Weeks 3Review andAssessment
STAAR Category 2, 3, 4 Grade 7 Mathematics Six Weeks 3
TEKSING TOWARD STAAR © 2014 Page 1
Six Weeks 3 Review
This review can be used in the same manner as a Student Activity from the lessons. Notes can be usedto complete the review and they can work with a partner. You can assign different portions to differentpartner pairs to be responsible for debriefing for the entire class. Students can complete any answersthey did not get before the debriefing. They just need to use a different color to record any additionalanswers.
It can be completed entirely in class, or it can be taken home to be completed and then debriefed inclass prior to the six week assessment.
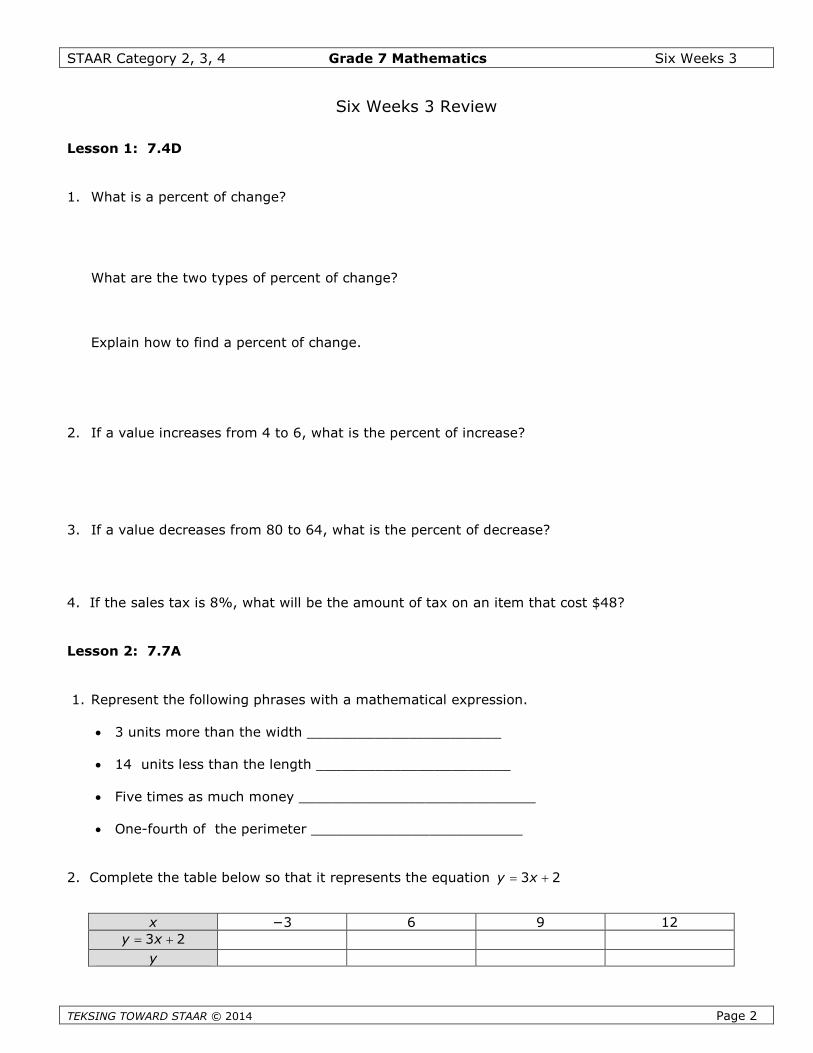
STAAR Category 2, 3, 4 Grade 7 Mathematics Six Weeks 3
TEKSING TOWARD STAAR © 2014 Page 2
Six Weeks 3 Review
Lesson 1: 7.4D
1. What is a percent of change?
What are the two types of percent of change?
Explain how to find a percent of change.
2. If a value increases from 4 to 6, what is the percent of increase?
3. If a value decreases from 80 to 64, what is the percent of decrease?
4. If the sales tax is 8%, what will be the amount of tax on an item that cost $48?
Lesson 2: 7.7A
1. Represent the following phrases with a mathematical expression.
3 units more than the width _______________________
14 units less than the length _______________________
Five times as much money ____________________________
One-fourth of the perimeter _________________________
2. Complete the table below so that it represents the equation 3 2y x
x −3 6 9 12
3 2y x
y
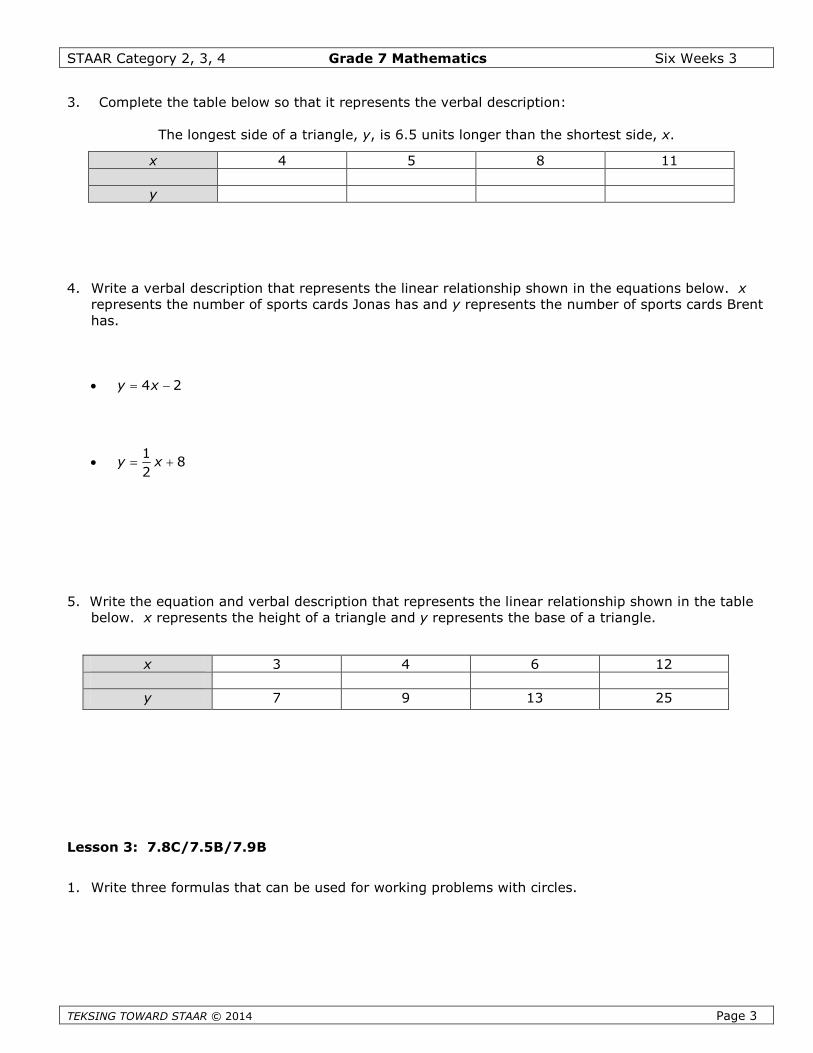
STAAR Category 2, 3, 4 Grade 7 Mathematics Six Weeks 3
TEKSING TO
3. Complete the table below so that it represents the verbal description:
The longest side of a triangle, y, is 6.5 units longer than the shortest side, x.
4. Write a verbal description that represents the linear relationship shown in the equations below. xrepresents the number of sports cards Jonas has and y represents the number of sports cards Brenthas.
4 2y x
1
82
y x
5. Write the equation and verbal description that represents the linear relationship shown in the tablebelow. x represents the height of a triangle and y represents the base of a triangle.
Lesson 3:
1. Write t
x 4 5 8 11
y
x 3 4 6 12
WARD STAAR © 2014 Page 3
7.8C/7.5B/7.9B
hree formulas that can be used for working problems with circles.
y 7 9 13 25
STAAR Category 2, 3, 4 Grade 7 Mathematics Six Weeks 3
TEKSING TOWARD STAAR © 2014 Page 4
2. Find the circumference and area of a circle with the given diameter. Find them in terms of and
approximated to the nearest hundredth if needed. Show the formula you used and the work youdid.
10 units
24 units
3. Determine what positive number was squared to give the value below.
25 is the square of ________________.
81 is the square of ________________.
16 is the square of ________________.
4. The area of a circle is 100 square inches. What is the radius of the circle?
5. What is the area of a circle whose diameter is 8 units? Give your answer in terms of and an
approximation to the nearest tenth of a square unit. Show your work.
6. is the ratio of the _____________ of a circle to the ____________ of the circle. It has a rational
approximation of _________.
Lesson 4: 7.6I
1. What is the ratio that represents the probability of a simple event occurring?
2. What is the probability you will:
toss a head on a nickel?
roll an even number on a 1-6 number cube?
STAAR Category 2, 3, 4 Grade 7 Mathematics Six Weeks 3
TEKSING TOWARD STAAR © 2014 Page 5
3. Beatrice tossed a nickel 30 times. She tallied 16 heads and 14 tails.
What is the experimental probability the next toss will be a tail?
What is the experimental probability the next toss will be a head?
What is the theoretical probability the next toss will be head?
4. Make a sample space for tossing a nickel and rolling a 1-6 number cube.
How many items are in your sample space? __________
What is the probability of tossing a head and rolling a 4?
What is the probability of tossing a tail and rolling an even number?
Are these events independent events or dependent events? ____________________ Explainyour answer.
5. A bag contains 3 white marbles and 3 black marbles.
You draw a marble, record it color, and do NOT replace it before drawing a second marble. What isthe probability you will draw a white marble and then a black marble?
You draw a marble, record it color, and replace it before drawing a second marble. What is theprobability you will draw a white marble and then a black marble?
Lesson 5: 7.8B/7.9A
1. A triangular prism and a triangular pyramid have congruent bases and heights. The volume of theprism is 183 cubic units. What is the volume of the pyramid? Show your work.
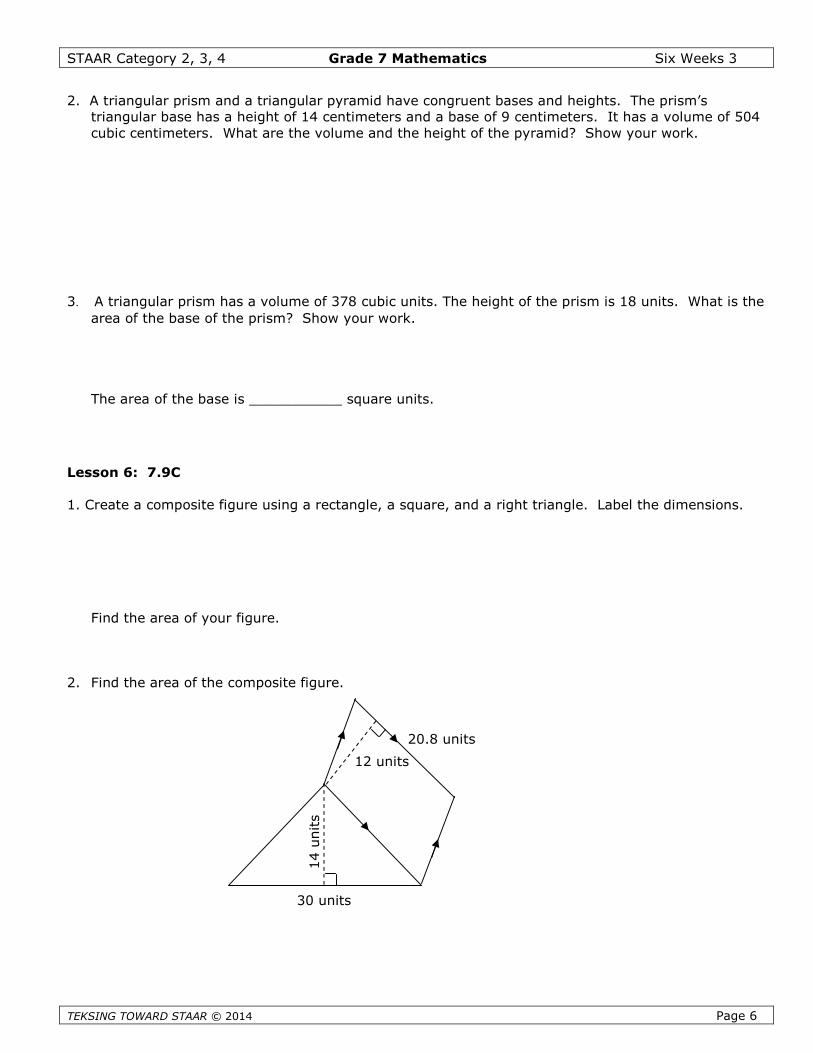
STAAR Category 2, 3, 4 Grade 7 Mathematics Six Weeks 3
TEKSING TOWARD STAAR © 2014 Page 6
2. A triangular prism and a triangular pyramid have congruent bases and heights. The prism’striangular base has a height of 14 centimeters and a base of 9 centimeters. It has a volume of 504cubic centimeters. What are the volume and the height of the pyramid? Show your work.
3. A triangular prism has a volume of 378 cubic units. The height of the prism is 18 units. What is the
area of the base of the prism? Show your work.
The area of the base is ___________ square units.
Lesson 6: 7.9C
1. Create a composite figure using a rectangle, a square, and a right triangle. Label the dimensions.
Find the area of your figure.
2. Find the area of the composite figure.
30 units
14
units
20.8 units
12 units
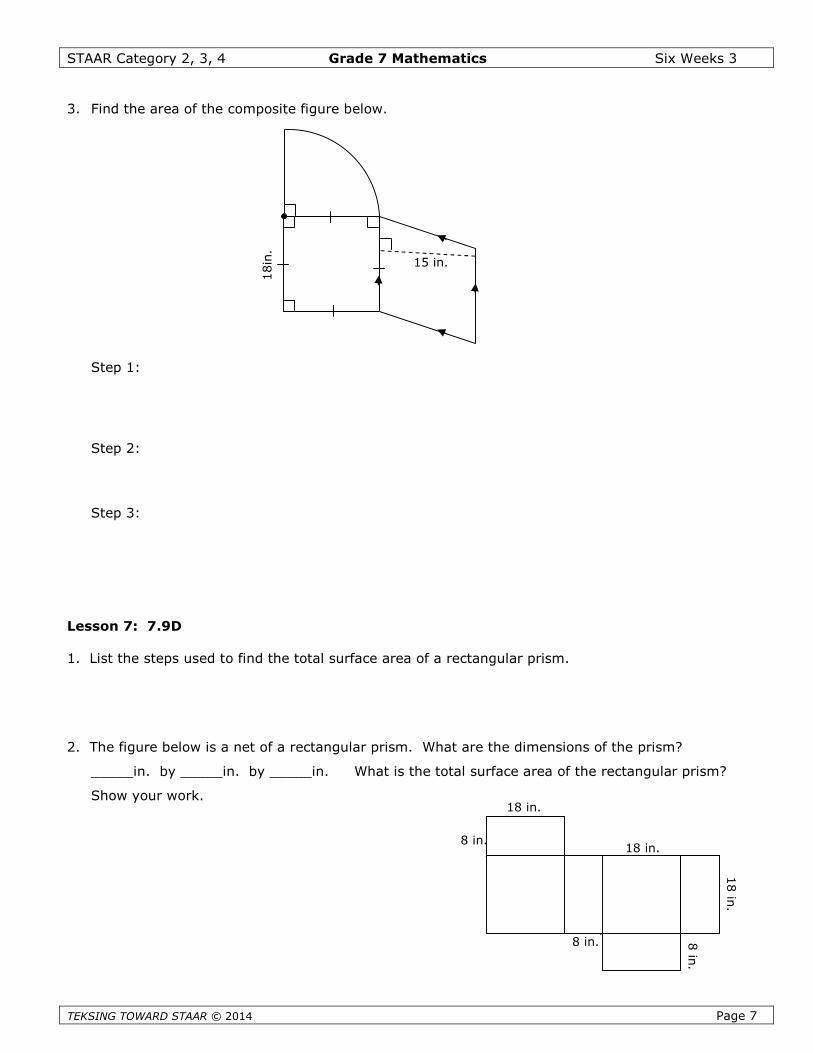
STAAR Category 2, 3, 4 Grade 7 Mathematics Six Weeks 3
TEKSING TOWARD STAAR © 2014 Page 7
3. Find the area of the composite figure below.
Step 1:
Step 2:
Step 3:
Lesson 7: 7.9D
1. List the steps used to find the total surface area of a rectangular prism.
2. The figure below is a net of a rectangular prism. What are the dimensions of the prism?
_____in. by _____in. by _____in. What is the total surface area of the rectangular prism?
Show your work.
18in
.15 in.
8 in.
18
in.
18 in.
18 in.
8 in. 8in
.
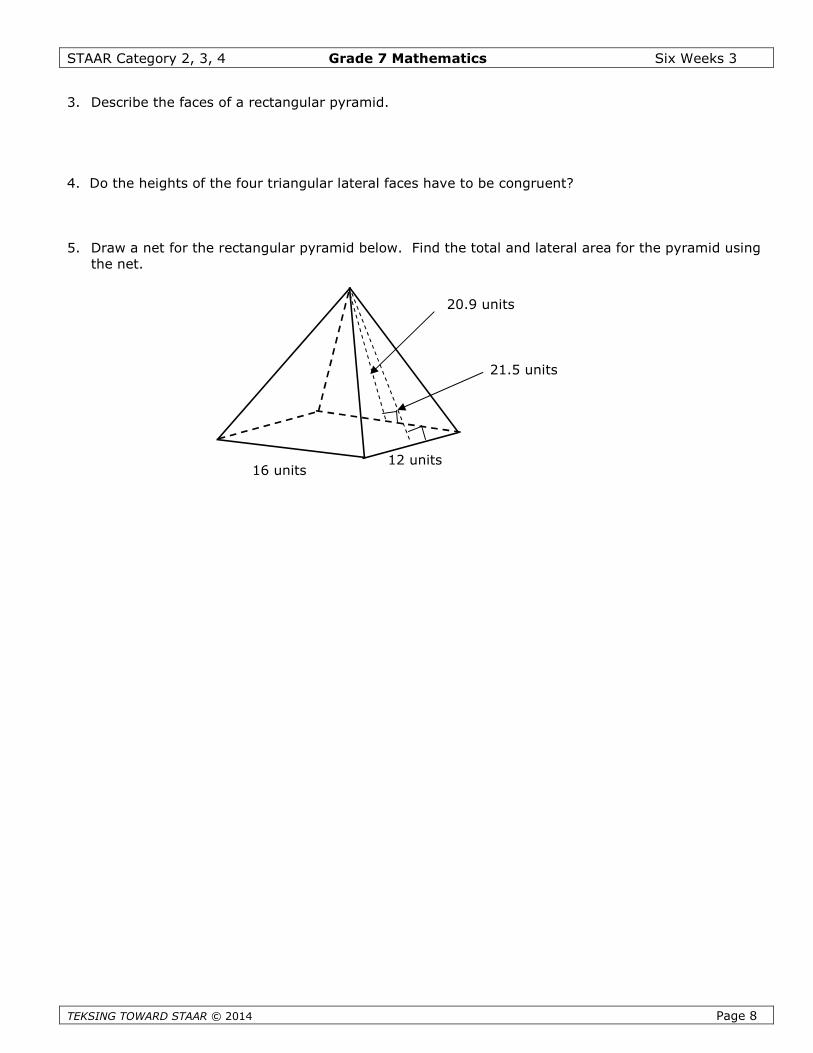
STAAR Category 2, 3, 4 Grade 7 Mathematics Six Weeks 3
TEKSING TOWARD STAAR © 2014 Page 8
3. Describe the faces of a rectangular pyramid.
4. Do the heights of the four triangular lateral faces have to be congruent?
5. Draw a net for the rectangular pyramid below. Find the total and lateral area for the pyramid usingthe net.
20.9 units
16 units12 units
21.5 units
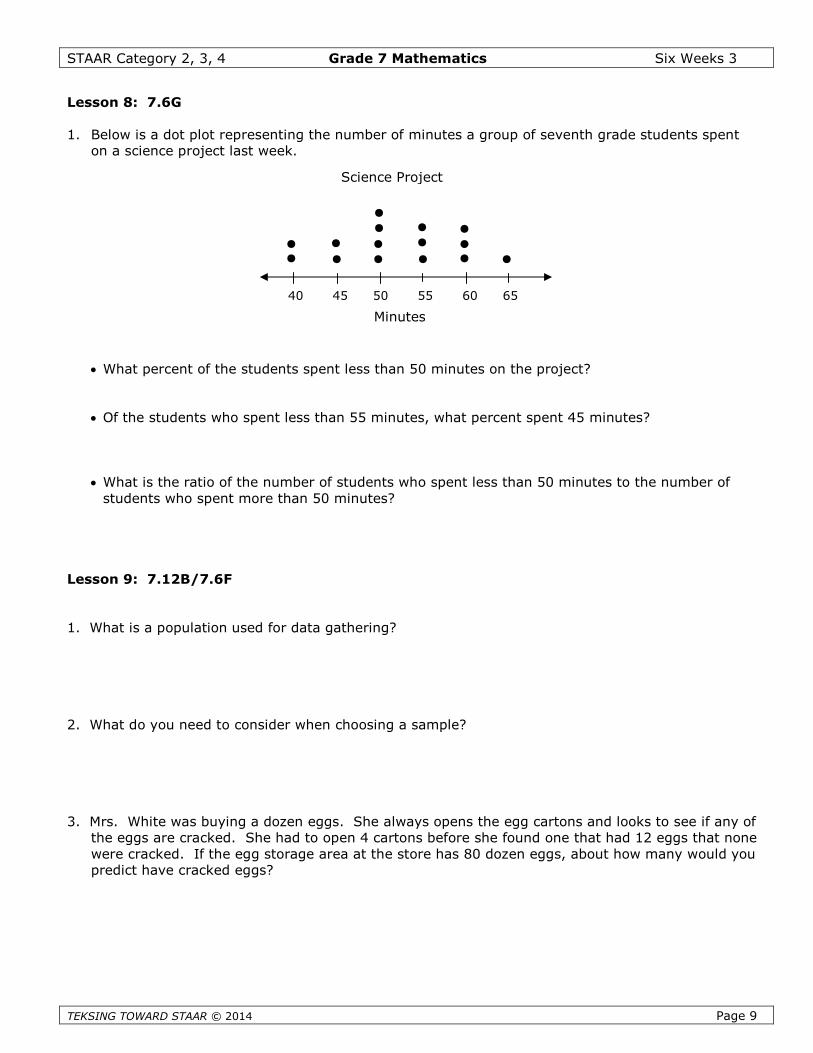
STAAR Category 2, 3, 4 Grade 7 Mathematics Six Weeks 3
TEKSING TOWARD STAAR © 2014 Page 9
Lesson 8: 7.6G
1. Below is a dot plot representing the number of minutes a group of seventh grade students spenton a science project last week.
What percent of the students spent less than 50 minutes on the project?
Of the students who spent less than 55 minutes, what percent spent 45 minutes?
What is the ratio of the number of students who spent less than 50 minutes to the number ofstudents who spent more than 50 minutes?
Lesson 9: 7.12B/7.6F
1. What is a population used for data gathering?
2. What do you need to consider when choosing a sample?
3. Mrs. White was buying a dozen eggs. She always opens the egg cartons and looks to see if any ofthe eggs are cracked. She had to open 4 cartons before she found one that had 12 eggs that nonewere cracked. If the egg storage area at the store has 80 dozen eggs, about how many would youpredict have cracked eggs?
Science Project
40 45 50 55 60 65
Minutes
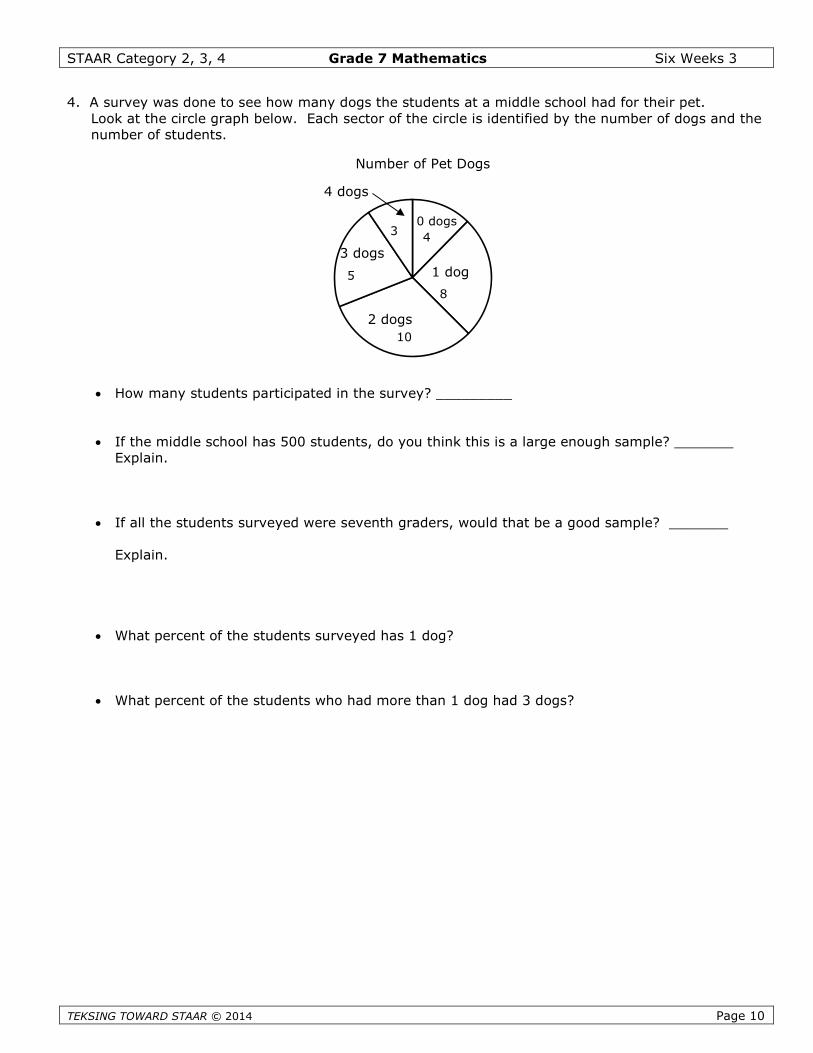
STAAR Category 2, 3, 4 Grade 7 Mathematics Six Weeks 3
TEKSING TOWARD STAAR © 2014 Page 10
4. A survey was done to see how many dogs the students at a middle school had for their pet.Look at the circle graph below. Each sector of the circle is identified by the number of dogs and thenumber of students.
How many students participated in the survey? _________
If the middle school has 500 students, do you think this is a large enough sample? _______Explain.
If all the students surveyed were seventh graders, would that be a good sample? _______
Explain.
What percent of the students surveyed has 1 dog?
What percent of the students who had more than 1 dog had 3 dogs?
Number of Pet Dogs
0 dogs
1 dog
2 dogs
3 dogs
4 dogs
8
10
5
34
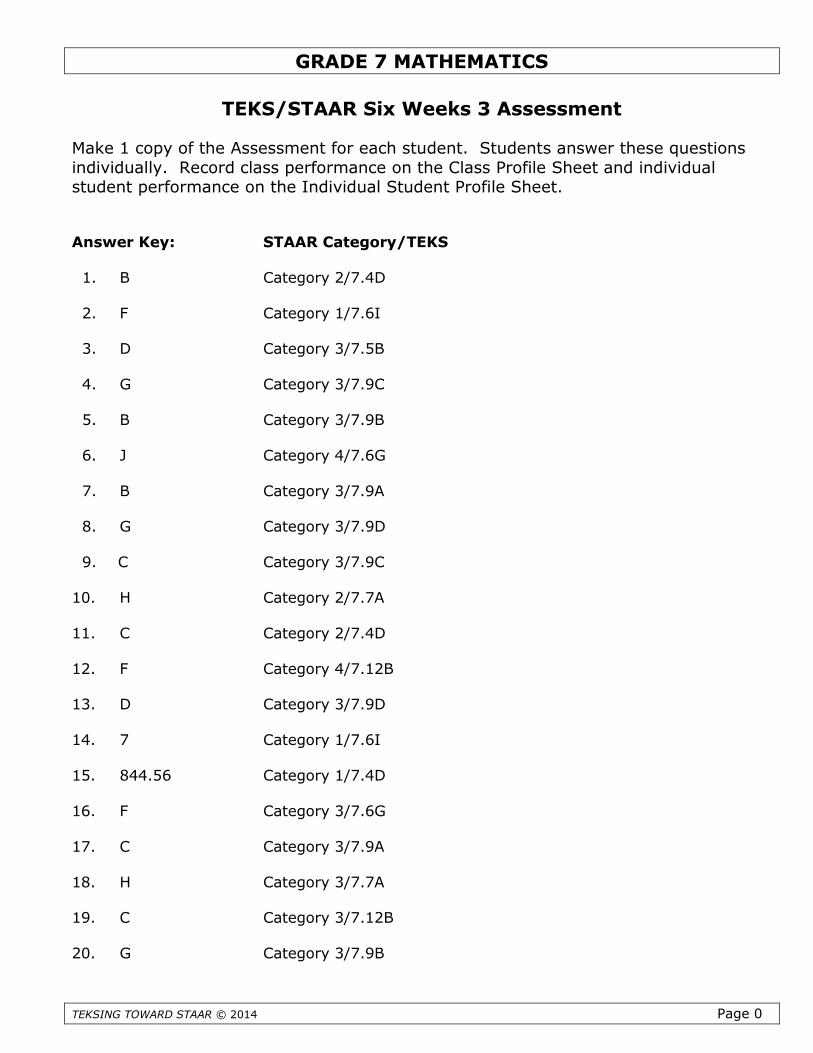
GRADE 7 MATHEMATICS
TEKSING TOWARD STAAR © 2014 Page 0
TEKS/STAAR Six Weeks 3 Assessment
Make 1 copy of the Assessment for each student. Students answer these questionsindividually. Record class performance on the Class Profile Sheet and individualstudent performance on the Individual Student Profile Sheet.
Answer Key: STAAR Category/TEKS
1. B Category 2/7.4D
2. F Category 1/7.6I
3. D Category 3/7.5B
4. G Category 3/7.9C
5. B Category 3/7.9B
6. J Category 4/7.6G
7. B Category 3/7.9A
8. G Category 3/7.9D
9. C Category 3/7.9C
10. H Category 2/7.7A
11. C Category 2/7.4D
12. F Category 4/7.12B
13. D Category 3/7.9D
14. 7 Category 1/7.6I
15. 844.56 Category 1/7.4D
16. F Category 3/7.6G
17. C Category 3/7.9A
18. H Category 3/7.7A
19. C Category 3/7.12B
20. G Category 3/7.9B
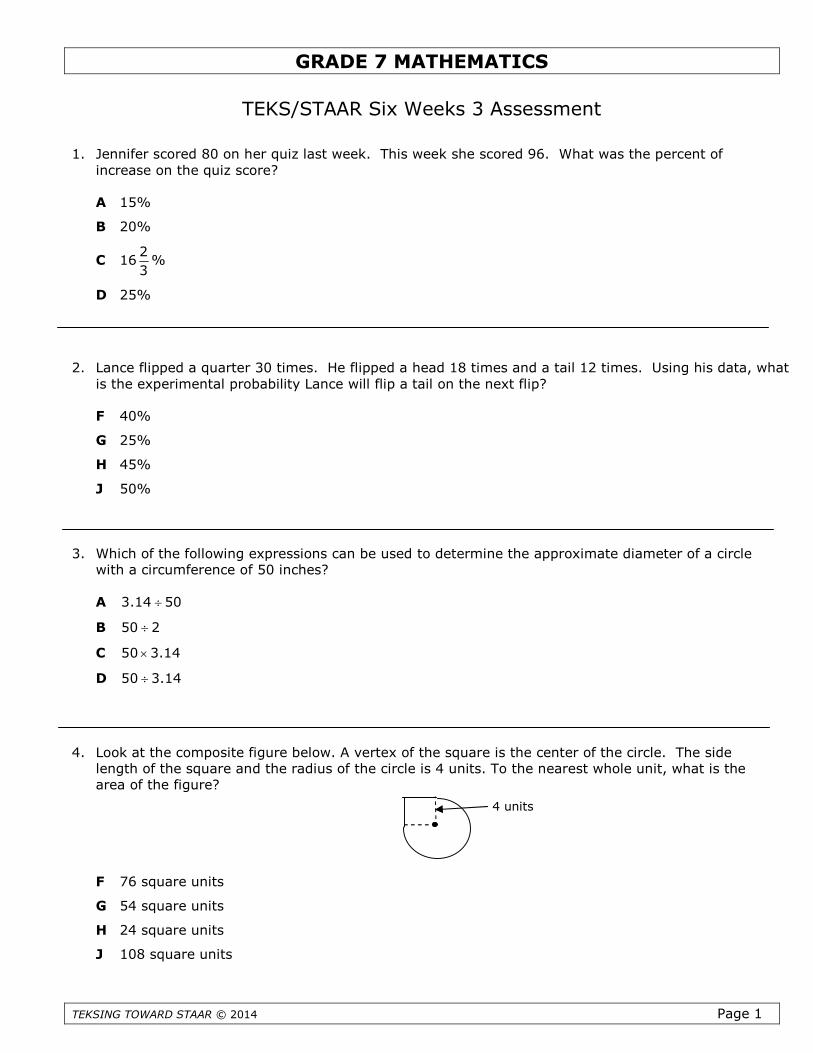
GRADE 7 MATHEMATICS
TEKSING TOWARD STAAR © 2014 Page 1
TEKS/STAAR Six Weeks 3 Assessment
1. Jennifer scored 80 on her quiz last week. This week she scored 96. What was the percent ofincrease on the quiz score?
A 15%
B 20%
C 162
3%
D 25%
2. Lance flipped a quarter 30 times. He flipped a head 18 times and a tail 12 times. Using his data, whatis the experimental probability Lance will flip a tail on the next flip?
F 40%
G 25%
H 45%
J 50%
3. Which of the following expressions can be used to determine the approximate diameter of a circlewith a circumference of 50 inches?
A 3.14 50
B 50 2
C 50 3.14
D 50 3.14
4. Look at the composite figure below. A vertex of the square is the center of the circle. The sidelength of the square and the radius of the circle is 4 units. To the nearest whole unit, what is thearea of the figure?
F 76 square units
G 54 square units
H 24 square units
J 108 square units
4 units
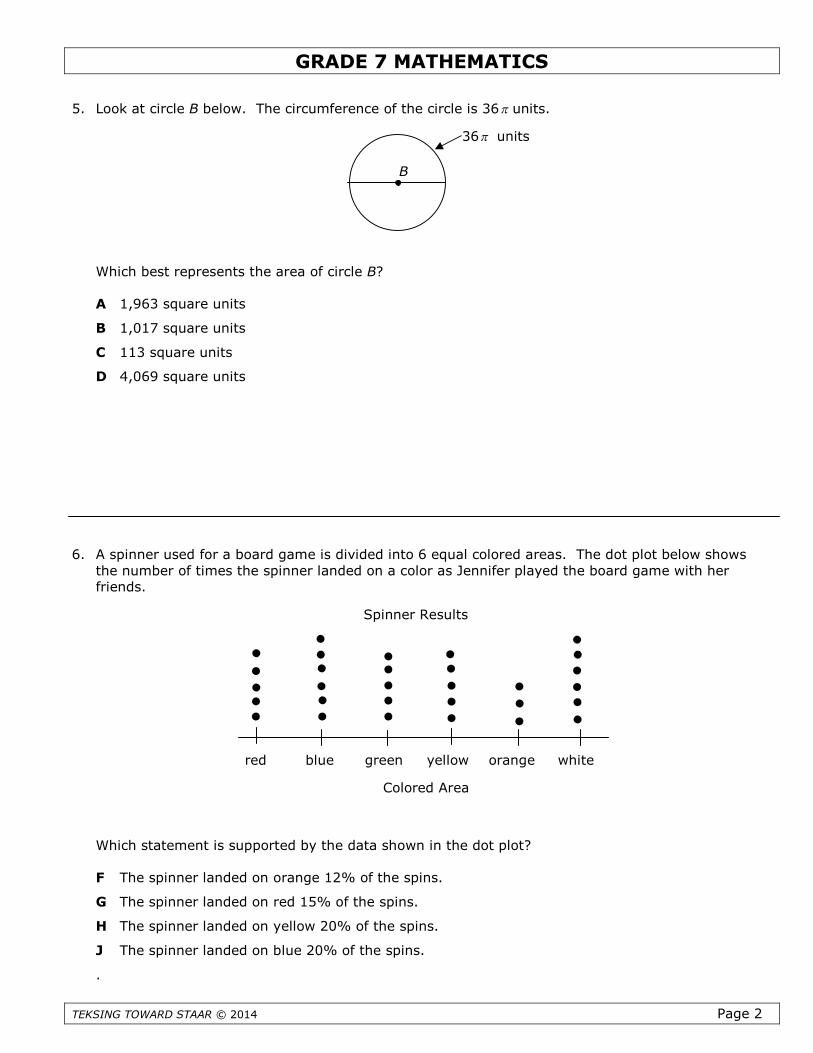
GRADE 7 MATHEMATICS
TEKSING TOWARD STAAR © 2014 Page 2
5. Look at circle B below. The circumference of the circle is 36 units.
Which best represents the area of circle B?
A 1,963 square units
B 1,017 square units
C 113 square units
D 4,069 square units
6. A spinner used for a board game is divided into 6 equal colored areas. The dot plot below showsthe number of times the spinner landed on a color as Jennifer played the board game with herfriends.
Which statement is supported by the data shown in the dot plot?
F The spinner landed on orange 12% of the spins.
G The spinner landed on red 15% of the spins.
H The spinner landed on yellow 20% of the spins.
J The spinner landed on blue 20% of the spins.
.
Spinner Results
red blue green yellow orange white
Colored Area
B
36 units
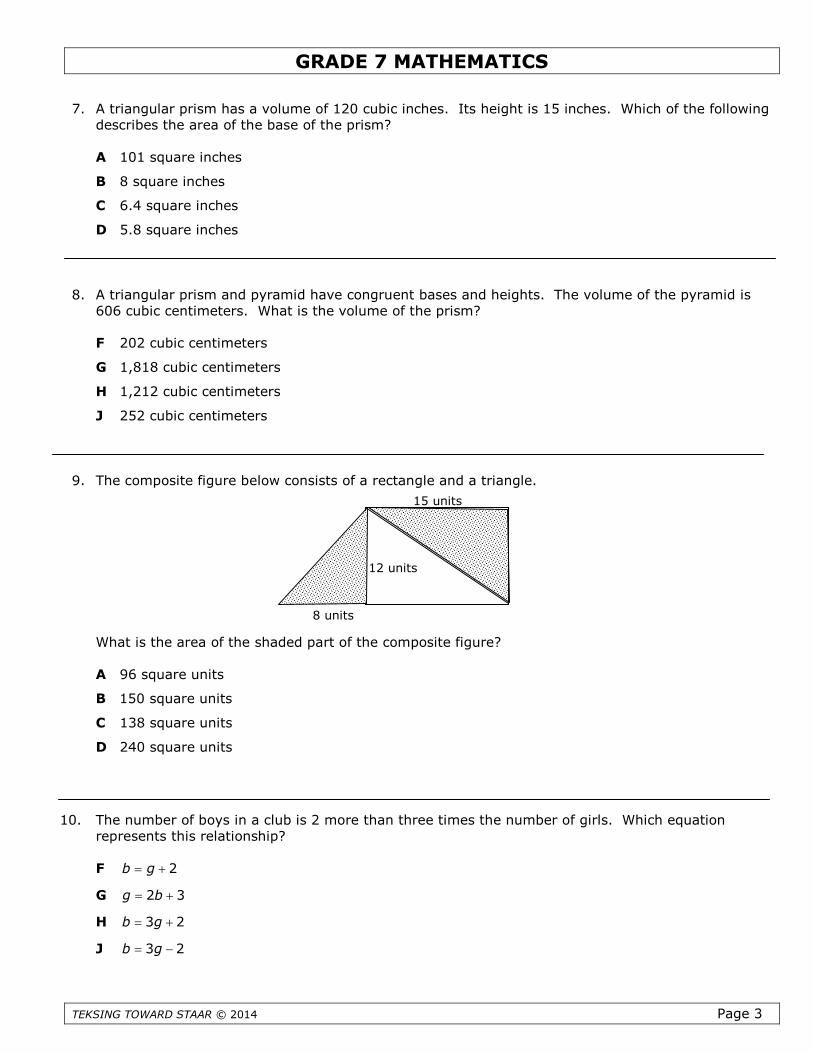
GRADE 7 MATHEMATICS
TEKSING TOWARD STAAR © 2014 Page 3
7. A triangular prism has a volume of 120 cubic inches. Its height is 15 inches. Which of the followingdescribes the area of the base of the prism?
A 101 square inches
B 8 square inches
C 6.4 square inches
D 5.8 square inches
8. A triangular prism and pyramid have congruent bases and heights. The volume of the pyramid is606 cubic centimeters. What is the volume of the prism?
F 202 cubic centimeters
G 1,818 cubic centimeters
H 1,212 cubic centimeters
J 252 cubic centimeters
9. The composite figure below consists of a rectangle and a triangle.
What is the area of the shaded part of the composite figure?
A 96 square units
B 150 square units
C 138 square units
D 240 square units
10. The number of boys in a club is 2 more than three times the number of girls. Which equationrepresents this relationship?
F 2b g
G 2 3g b
H 3 2b g
J 3 2b g
15 units
8 units
12 units
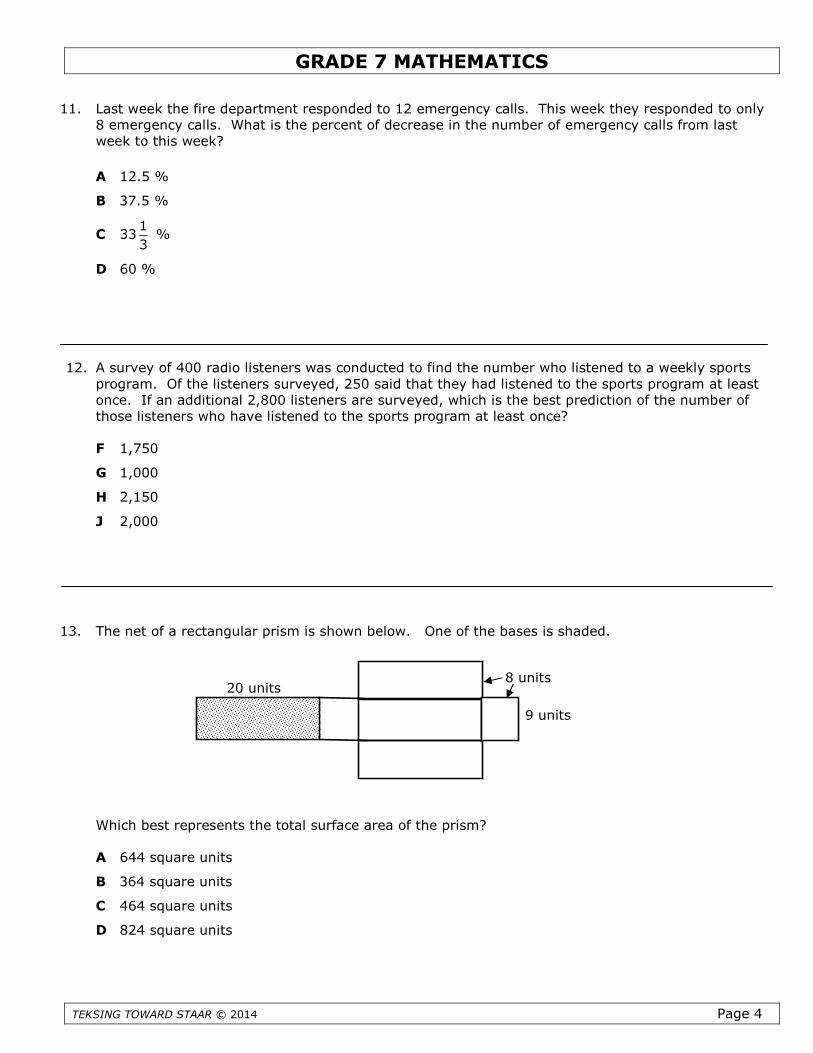
GRADE 7 MATHEMATICS
TEKSING TOWARD STAAR © 2014 Page 4
11. Last week the fire department responded to 12 emergency calls. This week they responded to only8 emergency calls. What is the percent of decrease in the number of emergency calls from lastweek to this week?
A 12.5 %
B 37.5 %
C 331
3%
D 60 %
12. A survey of 400 radio listeners was conducted to find the number who listened to a weekly sportsprogram. Of the listeners surveyed, 250 said that they had listened to the sports program at leastonce. If an additional 2,800 listeners are surveyed, which is the best prediction of the number ofthose listeners who have listened to the sports program at least once?
F 1,750
G 1,000
H 2,150
J 2,000
13. The net of a rectangular prism is shown below. One of the bases is shaded.
Which best represents the total surface area of the prism?
A 644 square units
B 364 square units
C 464 square units
D 824 square units
8 units20 units
9 units
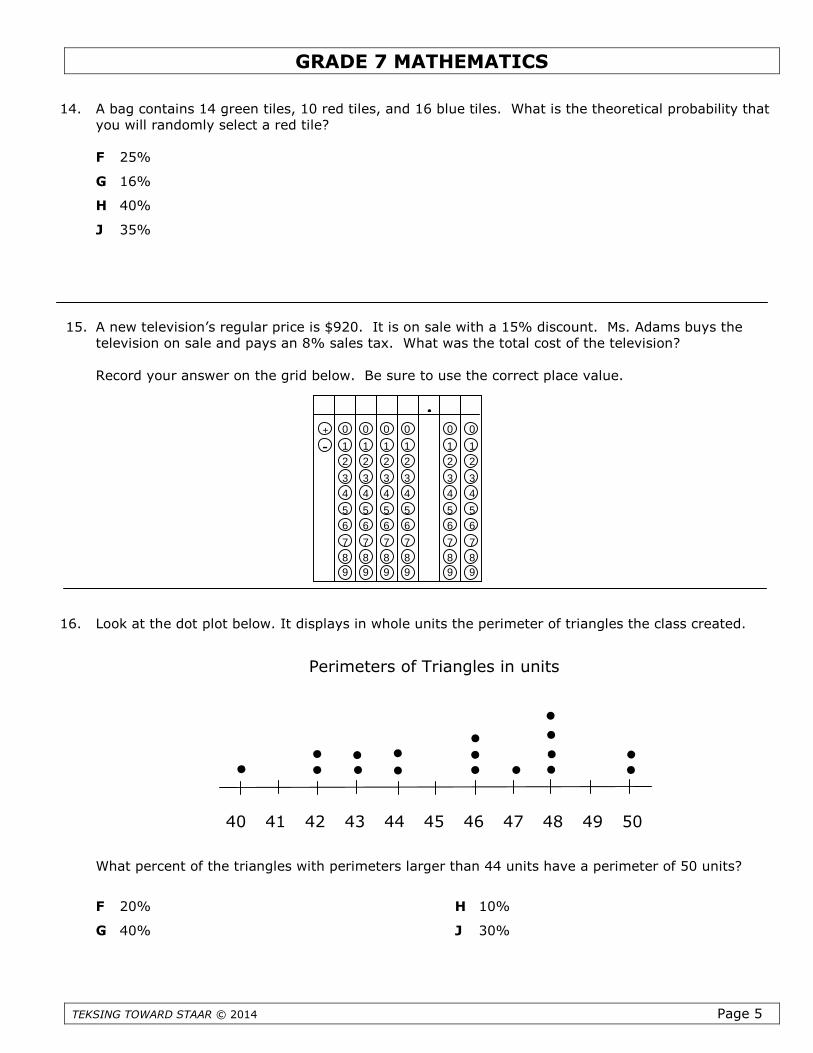
GRADE 7 MATHEMATICS
TEKSING TOWARD STAAR © 2014
14. A bag contains 14 green tiles, 10 red tiles, and 16 blue tiles. What is the theoretical probability thatyou will randomly select a red tile?
F 25%
G 16%
H 40%
J 35%
15. A new television’s regular price is $920. It is on sale with a 15% discount. Ms. Adams buys thetelevision on sale and pays an 8% sales tax. What was the total cost of the television?
Record your answer on the grid below. Be sure to use the correct place value.
16. Look at the dot plot below. It displays in whole units the perimeter of triangles the class created.
What percent of the triangles w
F 20%
G 40%
0 0 0 0 0 0
1 1 1 1 1 1
2 2 2 2 2 2
3 3 3 3 3 3
4 4 4 4 4 4
5 5 5 5 5 5
6 6 6 6 6 6
7 7 7 7 7 7
8 8 8 8 8 8
9 9 9 9 9 9
+
-
.
40 41
Perimeters of Triangles in units
Page 5
ith perimeters larger than 44 units have a perimeter of 50 units?
H 10%
J 30%
42 43 44 45 46 47 48 49 50
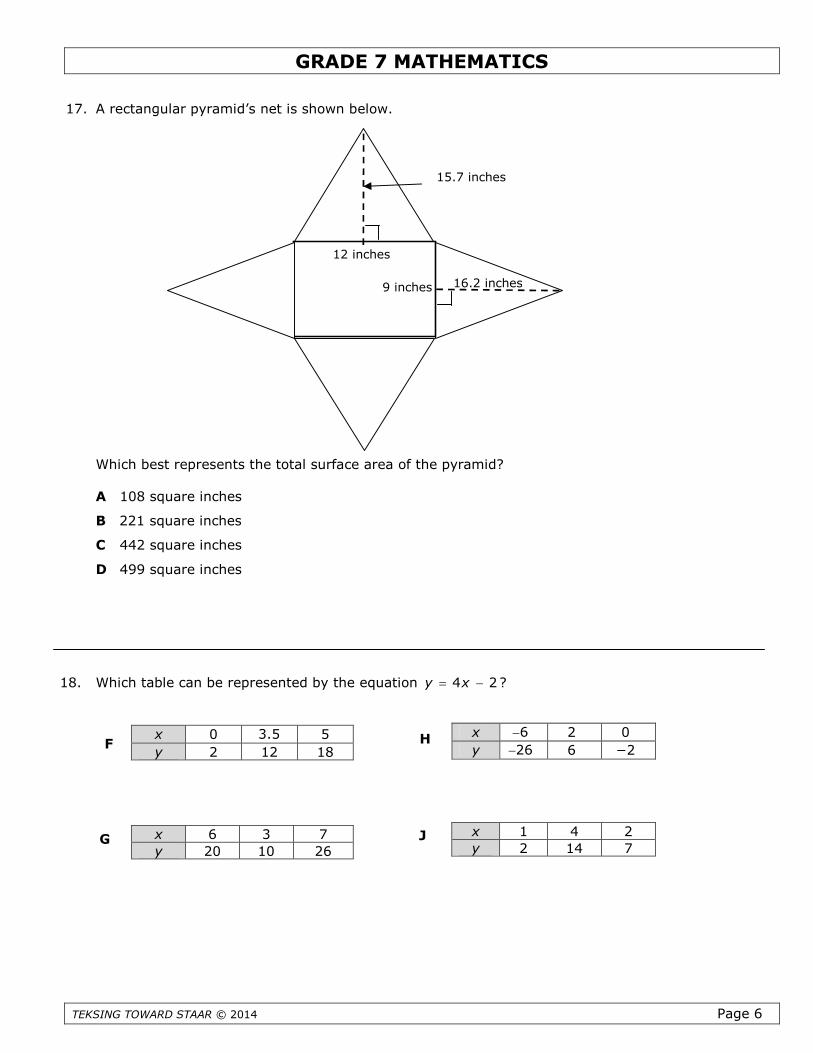
GRADE 7 MATHEMATICS
TEKSING TOWARD STAAR © 2014 Page 6
17. A rectangular pyramid’s net is shown below.
Which best represents the total surface area of the pyramid?
A 108 square inches
B 221 square inches
C 442 square inches
D 499 square inches
18. Which table can be represented by the equation 4 2y x ?
x 0 3.5 5
y 2 12 18
x 6 3 7
y 20 10 26
12 inches
15.7 inches
9 inches 16.2 inches
F
G
x 6 2 0
y 26 6 −2 H
x 1 4 2
y 2 14 7J
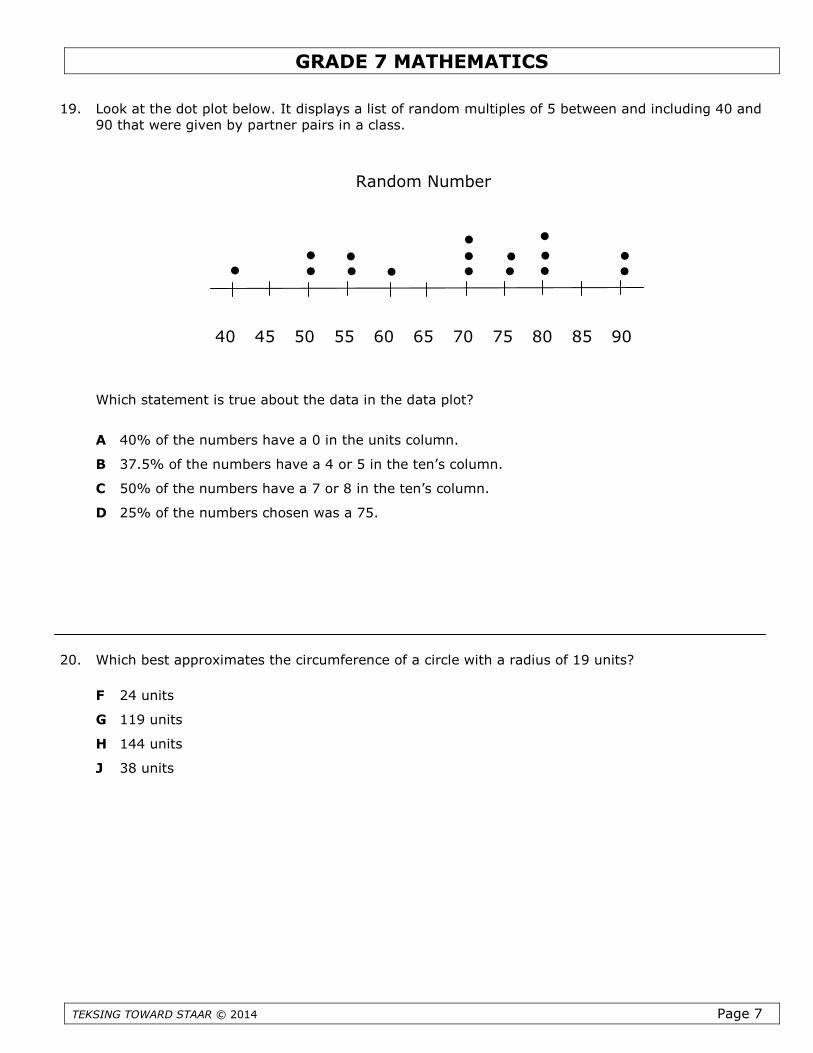
GRADE 7 MATHEMATICS
TEKSING TOWARD STAAR © 2014
19. Look at the dot plot below. It displays a list of random multiples of 5 between and including 40 and90 that were given by partner pairs in a class.
Which statement is true about the dat
A 40% of the numbers have a 0 in t
B 37.5% of the numbers have a 4 o
C 50% of the numbers have a 7 or 8
D 25% of the numbers chosen was a
20. Which best approximates the circumfe
F 24 units
G 119 units
H 144 units
J 38 units
40 45 50 55
Random Number
Page 7
a in the data plot?
he units column.
r 5 in the ten’s column.
in the ten’s column.
75.
rence of a circle with a radius of 19 units?
60 65 70 75 80 85 90