Embed Size (px)
Citation preview
© Copyright 2015, Southern California Edison All Rights Reserved
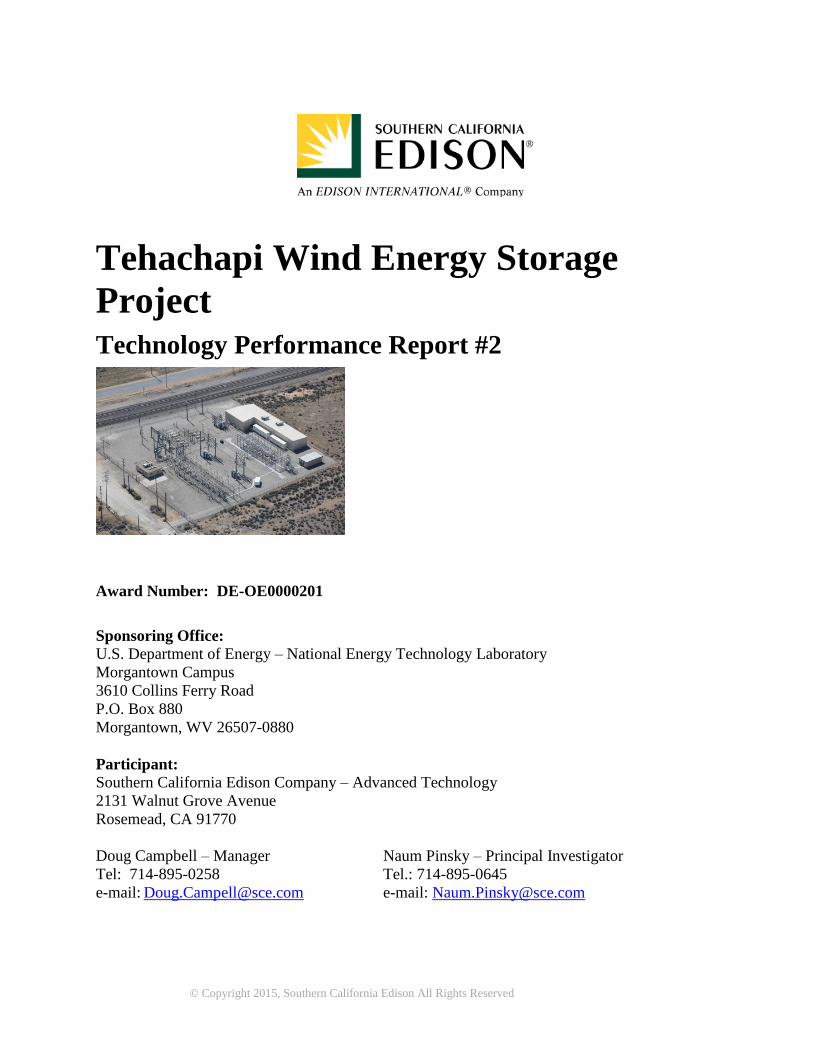
Tehachapi Wind Energy Storage
Project Technology Performance Report #2
Award Number: DE-OE0000201
Sponsoring Office:
U.S. Department of Energy – National Energy Technology Laboratory
Morgantown Campus
3610 Collins Ferry Road
P.O. Box 880
Morgantown, WV 26507-0880
Participant:
Southern California Edison Company – Advanced Technology
2131 Walnut Grove Avenue
Rosemead, CA 91770
Doug Campbell – Manager Naum Pinsky – Principal Investigator
Tel: 714-895-0258 Tel.: 714-895-0645
e-mail: [email protected] e-mail: [email protected]
Page 2 of 221
© Copyright 2015, Southern California Edison All Rights Reserved
Revision History
ID Date Summary of Changes Revised By
v1 12/31/15 Changes and additions to TPR#1 SCE
Team
v2 2/12/2016 Incorporate DOE comments SCE
Team
Acknowledgement
This material is based upon work supported by the Department of Energy (DOE) under Award
Number DE-OE0000201.
Disclaimers
This report was prepared as an account of work sponsored by an agency of the United States
Government. Neither the United States Government nor any agency thereof, nor any of their
employees, makes any warranty, express or implied, or assumes any legal liability or responsibility
for the accuracy, completeness, or usefulness of any information, apparatus, product, or process
disclosed, or represents that its use would not infringe privately owned rights. Reference herein to
any specific commercial product, process, or service by trade name, trademark, manufacturer, or
otherwise does not necessarily constitute or imply its endorsement, recommendation, or favoring
by the United States Government or any agency thereof. The views and opinions of authors
expressed herein do not necessarily state or reflect those of the United States Government or any
agency thereof.
This report was prepared by Southern California Edison Company (SCE) as an account of work
sponsored by the Department of Energy, an agency of the United States Government, under Award
Number DE-OE0000201. SCE, including any of their employees, affiliates and contractors, does
not make any warranty, express or implied, or assume any legal liability or responsibility for the
accuracy, completeness, or usefulness of any information, apparatus, product, or process disclosed,
or represents that its use would not infringe privately owned rights. Reference herein to any
specific commercial product, process, or service by trade name, trademark, manufacturer, or
otherwise does not necessarily constitute or imply its endorsement, recommendation, or favoring
by SCE. The views and opinions of authors expressed herein do not necessarily state or reflect
those of SCE.

Page 3 of 221
© Copyright 2015, Southern California Edison All Rights Reserved
TABLE OF CONTENTS
1 Executive Summary .............................................................................................................. 9
2 Scope..................................................................................................................................... 15
2.1 Abstract...................................................................................................................................... 15 2.2 Introduction to SCE ................................................................................................................... 15 2.3 Project Overview ....................................................................................................................... 16 2.4 Project Objectives ...................................................................................................................... 20 2.5 Project Benefits ......................................................................................................................... 21 2.6 Build & Impact Metrics ............................................................................................................. 23 2.7 Project Plan ................................................................................................................................ 24 2.8 Report Organization .................................................................................................................. 26
3 Technical Approach - Battery Energy Storage System ................................................... 27
3.1 Project History ........................................................................................................................... 27 3.2 Basic Facility Description ......................................................................................................... 28 3.3 Battery Design and Layout ........................................................................................................ 29 3.4 Power Conversion System Design ............................................................................................ 30 3.5 BESS Auxiliary Systems ........................................................................................................... 32
3.5.1 Auxiliary Power System ...................................................................................................................... 32 3.5.2 HVAC System ..................................................................................................................................... 32 3.5.3 Fire Suppression System ...................................................................................................................... 32
3.6 TSP Data Acquisition System ................................................................................................... 33
4 Measurement and Validation Strategy ............................................................................. 35
4.1 Methodology and Approach ...................................................................................................... 35 4.2 Operational Uses ....................................................................................................................... 37
4.2.1 Transmission Uses ............................................................................................................................... 37 4.2.1.1 Voltage Support/Grid Stabilization ............................................................................................ 37 4.2.1.2 Decreased Transmission Losses ................................................................................................. 37 4.2.1.3 Diminished Congestion .............................................................................................................. 37 4.2.1.4 Increased System Reliability by Load Shed Deferral ................................................................. 38 4.2.1.5 Deferred Transmission Investment ............................................................................................ 38 4.2.1.6 Optimized Size and Cost of Renewable Energy-Related Transmission ..................................... 38
4.2.2 System Uses ......................................................................................................................................... 38 4.2.2.1 Provide System Capacity/Resource Adequacy........................................................................... 38 4.2.2.2 Renewable Energy Integration (Smoothing) .............................................................................. 38 4.2.2.3 Wind Generation Output Shifting .............................................................................................. 38
4.2.3 CAISO Market Uses ............................................................................................................................ 39 4.2.3.1 Frequency Regulation ................................................................................................................ 39 4.2.3.2 Spin/non-Spin Replacement Reserves ........................................................................................ 39 4.2.3.3 Deliver Ramp Rate ..................................................................................................................... 39 4.2.3.4 Energy Price Arbitrage ............................................................................................................... 39
4.3 Baseline Development ............................................................................................................... 39 4.3.1 Overview ............................................................................................................................................. 39 4.3.2 The Role of a Baseline in Measurement and Validation for the TSP Performance Evaluation ........... 39 4.3.3 Requirements for a Valid Baseline ...................................................................................................... 40 4.3.4 Alternatives to Use of Historical Data as a Baseline ........................................................................... 40
4.4 Data Collection and Analysis .................................................................................................... 41 4.4.1 Steady State Data Collection ............................................................................................................... 42 4.4.2 Transient Event Data Collection .......................................................................................................... 43
Page 4 of 221
© Copyright 2015, Southern California Edison All Rights Reserved
5 Measurement and Validation Test Plan Summary.......................................................... 44
5.1 Baseline Data Analysis .............................................................................................................. 44 5.2 M&V Analysis Assumptions ..................................................................................................... 44 5.3 Mini-System .............................................................................................................................. 45 5.4 System Acceptance Test Plan .................................................................................................... 46 5.5 Characterization Test Plan ......................................................................................................... 46
5.5.1 Charge/Discharge Duration Test .......................................................................................................... 47 5.5.2 8 MW Cycle Test ................................................................................................................................. 47 5.5.3 4 MW Cycle Test ................................................................................................................................. 48 5.5.4 8 MW Cycle Test without Approximately 30 % SOC Rest ................................................................. 49
5.6 Test 1 Provide Steady State Voltage Regulation at the Local Monolith 66 kV Bus ................. 50 5.7 Test 2 Steady State Voltage Regulation under Any Mode ........................................................ 51 5.8 Test 3 Charge during Periods of high loading for the export lines And Discharge during low
Loading periods Under SCE System Operator Control .......................................................................... 53 5.9 Test 4 Charge during Off-Peak Periods & Discharge during On-Peak Periods under SCE
System Operator Control ........................................................................................................................ 55 5.10 Test 5 Charge & Discharge Seconds-To-Minutes As Needed To Firm & Shape Intermittent
Generation in Response to a Real-Time Signal ...................................................................................... 56 5.11 Test 6 Respond To CAISO Control Signals to Provide Frequency Response .......................... 58 5.12 Test 7 Respond To CAISO Market Awards to Provide Energy And Spin/ Non-Spin Reserves
59 5.13 Test 8 Follow A CAISO Market Signal for Energy Price ......................................................... 60 5.14 Detailed Test Plans .................................................................................................................... 61
6 Measurement and Validation Test Results and Conclusions .......................................... 62
6.1 Status & Timing of Tests ........................................................................................................... 62 6.2 Mini-System Test Results .......................................................................................................... 62 6.3 System Acceptance Test Results ............................................................................................... 63 6.4 Characterization Test Results .................................................................................................... 64
6.4.1 First Period Test Results – December 2014 ......................................................................................... 65 6.4.2 Second Period Test Results – April to June 2015 ................................................................................ 68
6.4.2.1 State of Charge (SOC) profile for the BESS .............................................................................. 69 6.4.2.2 2-cycle 4-MW test with ~30% SOC rest results summary ......................................................... 72 6.4.2.3 2-cycle 8-MW test with ~30% SOC rest results ......................................................................... 76 6.4.2.4 8-MW continuous cycle test with 30% SOC rest ....................................................................... 80 6.4.2.5 4-MW continuous cycle test with ~30% SOC rest ..................................................................... 84 6.4.2.6 8-MW continuous cycle test w/o rest ......................................................................................... 88
6.5 M&V Results to Date ................................................................................................................ 91 6.5.1 Market Participation ............................................................................................................................ 92 6.5.2 Operator Log and Incident Reports ...................................................................................................... 93
6.6 Lessons Learned – Design through Commissioning ................................................................. 95 6.6.1 Commercial.......................................................................................................................................... 95 6.6.2 Construction ......................................................................................................................................... 96 6.6.3 Technical ............................................................................................................................................. 98 6.6.4 Information Technology .................................................................................................................... 100 6.6.5 Preliminary Testing............................................................................................................................ 100 6.6.6 Training ............................................................................................................................................. 101
6.7 Events and Lessons Learned – Operations .............................................................................. 102 6.7.1 PCS Medium Voltage (MV) Transformer Replacement (4 December 2014 – 22 April 2015) ......... 102 6.7.2 PCS Voltage Measurement Error (16 June 2015 – 23 June 2015) ..................................................... 105 6.7.3 PCS Air Filter Replacement (20 July 2015 – 24 July 2015) .............................................................. 106 6.7.4 Data Historian Gateway Replacement (16 December 2014 – 3 December 2015) ............................. 107 6.7.5 Battery Rack Fuse Replacement (24 September 2015 – 2 November 2015) ..................................... 110
Page 5 of 221
© Copyright 2015, Southern California Edison All Rights Reserved
6.7.6 Battery Section Controller Replacement (26 October 2015 – 3 December 2015) ............................. 111 6.7.7 Additional Lessons Learned During 2015 ......................................................................................... 112 6.7.8 Hardware Replacements .................................................................................................................... 113
6.8 Conclusions ............................................................................................................................. 114
7. Storage System Performance Parameters ...................................................................... 115
8. Impact Metrics .................................................................................................................. 123
9. Appendices ......................................................................................................................... 127
9.1 Appendix A: Detailed Test Plans ............................................................................................ 127 9.1.1 Test 1 Provide Steady State Voltage Regulation At The Local Monolith 66 kV Bus ....................... 127 9.1.2 Test 2 Steady State Voltage Regulation Under Any Mode ................................................................ 131 9.1.3 Test 3 Charge During Periods Of High Line Loading And Discharge During Low Line Loading
Under SCE System Operator Control .............................................................................................................. 132 9.1.4 Test 4 Charge During Off-Peak Periods And Discharge During On-Peak Periods Under SCE System
Operator Control .............................................................................................................................................. 136 9.1.5 Test 5 Charge And Discharge Seconds-To-Minutes As Needed To Firm And Shape Intermittent
Generation In Response To A Real-Time Signal ............................................................................................. 139 9.1.6 Test 6 Respond to CAISO Control Signals to Provide Frequency Response .................................... 141 9.1.7 Test 7 Respond to CAISO market awards to provide Energy and spin/non-spin reserves ................ 142 9.1.8 Test 8 Follow A CAISO Market Signal For Energy Price ................................................................. 144
9.2 Appendix B: Analysis of Wind Generation Data .................................................................... 147 9.3 Appendix C: Tehachapi Area Load Analysis .......................................................................... 152 9.4 Appendix D: Line Loading Analysis ....................................................................................... 156 9.5 Appendix E: Schedule of TPR/Impact Metrics Reporting ...................................................... 164 9.6 Appendix F: Static and Dynamic Analysis for TSP Project Using GE-PSLF Software ......... 165 9.7 Appendix G: Analysis for TSP Project Using RTDS .............................................................. 168 9.8 Appendix H: System Acceptance Test Results ....................................................................... 171 9.9 Appendix I: CDRL 19, System Acceptance Test Plan ............................................................ 194 9.10 Appendix I: Glossary of Abbreviations ................................................................................... 220
LIST OF TABLES
TABLE 1-1 OPERATIONAL USE & TESTS ....................................................................................................................... 10 TABLE 1-2 KEY LESSONS LEARNED TO DATE .............................................................................................................. 14 TABLE 2-1 SOUTHERN CALIFORNIA EDISON COMPANY’S SERVICE TERRITORY ........................................................... 16 TABLE 2-2 RELATIONSHIP OF 13 USES TO DOE APPLICATIONS ................................................................................... 20 TABLE 2-3 SCE OPERATIONAL USES FOR THE BESS .................................................................................................. 21 TABLE 2-4 BENEFITS POTENTIALLY REALIZED BY STATIONARY ELECTRIC STORAGE DEMONSTRATIONS .................. 23 TABLE 2-5 SCE TSP MILESTONE LOG ......................................................................................................................... 25 TABLE 3-1 BESS SYSTEM CONFIGURATION & SPECIFICATION .................................................................................... 29 TABLE 4-1 SYSTEM TEST AND OPERATIONAL USE MATRIX ......................................................................................... 42 TABLE 4-2 BESS DATA COLLECTION .......................................................................................................................... 43 TABLE 5-1 SEC TEST 4 ON PEAK SCHEDULE ................................................................................................................ 48 TABLE 5-2 SEC TEST 4 OFF PEAK SCHEDULE............................................................................................................... 48 TABLE 5-3 SEC TEST 4 ON PEAK SCHEDULE ................................................................................................................ 49 TABLE 5-4 SEC TEST 4 OFF PEAK SCHEDULE............................................................................................................... 49 TABLE 5-5 TEST 1 PLAN PROCEDURE ........................................................................................................................... 51 TABLE 5-6 TEST 1 SOURCE OF TEST DATA ................................................................................................................... 51 TABLE 5-7 TEST 2 PLAN PROCEDURE ........................................................................................................................... 52 TABLE 5-8 TEST 2 SOURCE OF TEST DATA ................................................................................................................... 53 TABLE 5-9 TEST 3 PLAN PROCEDURE ........................................................................................................................... 55
Page 6 of 221
© Copyright 2015, Southern California Edison All Rights Reserved
TABLE 5-10 TEST 3 SOURCE OF TEST DATA ................................................................................................................. 55 TABLE 5-11 TEST 4 PLAN PROCEDURE AND RESULTS .................................................................................................. 56 TABLE 5-12 TEST 4 SOURCE OF TEST DATA ................................................................................................................. 56 TABLE 5-13 TEST 5 PLAN PROCEDURE AND RESULTS .................................................................................................. 57 TABLE 5-14 TEST 5 SOURCE OF TEST DATA ................................................................................................................. 57 TABLE 5-15 TEST 6 PLAN PROCEDURE AND RESULTS .................................................................................................. 58 TABLE 5-16 TEST 6 SOURCE OF TEST DATA ................................................................................................................. 59 TABLE 5-17 TEST 7 PLAN PROCEDURE AND RESULTS .................................................................................................. 60 TABLE 5-18 TEST 7 SOURCE OF TEST DATA ................................................................................................................. 60 TABLE 5-19 TEST 8 PLAN PROCEDURE AND RESULTS .................................................................................................. 61 TABLE 5-20 TEST 8 SOURCE OF TEST DATA ................................................................................................................. 61 TABLE 6-1 RESULTS FROM SYSTEM ACCEPTANCE TEST PLAN FOR BESS CAPACITY................................................... 64 TABLE 6-2. CHARACTERIZATION TEST, CHARGE/DISCHARGE DURATION TEST 8 MW CYCLE RESULTS ..................... 65 TABLE 6-3. OPTIMIZED SEC TEST 4 ON PEAK SCHEDULE FOR 8 MW CYCLE TEST ...................................................... 66 TABLE 6-4. OPTIMIZED SEC TEST 4 OFF PEAK SCHEDULE FOR 8 MW CYCLE TEST ..................................................... 66 TABLE 6-5 CHARGE/DISCHARGE ENERGY AND ROUND TRIP EFFICIENCY (NOT INCLUDING AUXILIARY LOADS).......... 68 TABLE 6-6 - BESS ROUND TRIP EFFICIENCY BASED ON LOCAL HISTORIAN DATA FOR 2-CYCLE 4-MW TEST WITH ~30%
SOC REST ............................................................................................................................................................ 72 TABLE 6-7 - BESS EFFICIENCY AT 66 KV BASED ON PQM DATA FOR 2-CYCLE 4-MW TEST WITH ~30% SOC REST .... 72 TABLE 6-8 - BESS ROUND TRIP EFFICIENCY BASED ON LOCAL HISTORIAN DATA FOR 2-CYCLE 8-MW TEST WITH ~30%
SOC REST ............................................................................................................................................................ 76 TABLE 6-9 - BESS EFFICIENCY AT 66 KV BASED ON PQM DATA FOR 2-CYCLE 8-MW TEST WITH ~30% SOC REST .... 76 TABLE 6-10 - BESS ROUND TRIP EFFICIENCY BASED ON LOCAL HISTORIAN DATA FOR 8-MW CONTINUOUS CYCLE TEST
WITH 30% SOC REST ........................................................................................................................................... 80 TABLE 6-11 - BESS EFFICIENCY AT 66 KV BASED ON PQM DATA FOR 8-MW CONTINUOUS CYCLE TEST WITH 30%
SOC REST ............................................................................................................................................................ 80 TABLE 6-12 - BESS ROUND TRIP EFFICIENCY BASED ON LOCAL HISTORIAN DATA FOR 4-MW CONTINUOUS CYCLE TEST
WITH ~30% SOC REST ......................................................................................................................................... 84 TABLE 6-13 - BESS EFFICIENCY AT 66 KV SIDE BASED ON PQM DATA FOR 4-MW CONTINUOUS CYCLE TEST WITH
~30% SOC REST .................................................................................................................................................. 84 TABLE 6-14 - BESS ROUND TRIP EFFICIENCY BASED ON LOCAL HISTORIAN DATA FOR 8-MW CONTINUOUS CYCLE TEST
W/O REST ............................................................................................................................................................. 88 TABLE 6-15 - BESS EFFICIENCY AT 66 KV BASED ON PQM DATA FOR 8-MW CONTINUOUS CYCLE TEST W/O REST .... 88 TABLE 7-1 STORAGE SYSTEM PERFORMANCE PARAMETERS ...................................................................................... 122 TABLE 8-1 IMPACT METRICS ELECTRIC TRANSMISSION SYSTEMS ............................................................................. 124 TABLE 8-2 IMPACT METRICS STORAGE SYSTEMS ...................................................................................................... 124 TABLE 8-3 IMPACT METRICS: TRANSMISSION SYSTEMS BASELINE ............................................................................ 125 TABLE 8-4 BASELINE ESTIMATES FOR IMPACT METRICS: STORAGE SYSTEMS ........................................................... 126 TABLE 9-1 VOLTAGE SET POINT SWEEPING TEST ...................................................................................................... 128 TABLE 9-2 TEST 1 STEPS - PROVIDE STEADY STATE VOLTAGE REGULATION AT LOCAL MONOLITH 66 KV BUS ......... 131 TABLE 9-3 TEST 2 STEPS – STEADY STATE VOLTAGE REGULATION UNDER ANY MODE............................................ 132 TABLE 9-4 TEST 3 STEPS - CHARGE DURING HIGH LINE LOAD/DISCHARGE DURING LOW LINE LOAD ...................... 136 TABLE 9-5 TEST 4 STEPS – CHARGE OFF-PEAK/DISCHARGE ON-PEAK ...................................................................... 139 TABLE 9-6 TEST 5 STEPS – CHARGE AND DISCHARGE SECONDS-TO-MINUTES AS NEEDED TO FIRM AND SHAPE
INTERMITTENT GENERATION IN RESPONSE TO A REAL-TIME SIGNAL .................................................................. 141 TABLE 9-7 TEST 6 STEPS – RESPOND TO CAISO CONTROL SIGNALS TO PROVIDE FREQUENCY RESPONSE .................. 142 TABLE 9-8 TEST 7 STEPS – RESPOND TO CAISO MARKET AWARDS TO PROVIDE ENERGY AND SPIN/NON-SPIN
RESERVES .......................................................................................................................................................... 144 TABLE 9-9 TEST 8 STEPS – FOLLOW A CAISO MARKET SIGNAL FOR ENERGY PRICE .................................................. 146 TABLE 9-10 WIND FARM AGGREGATE GENERATION IN GWH BY CALENDAR MONTH AND PERIOD ......................... 148 TABLE 9-11 WIND FARM CAPACITY FACTORS - 2010 ................................................................................................ 149 TABLE 9-12 WIND FARM CAPACITY FACTORS - 2011 ................................................................................................ 149 TABLE 9-13 WIND FARM CAPACITY FACTORS – 2010 AND 2011 ............................................................................... 150 TABLE 9-14 WIND FARM CAPACITY FACTOR -- MONTHLY SUMMARY STATISTICS ................................................... 151 TABLE 9-15 TOTAL 2010 GWH BY MONTH AND PERIOD ........................................................................................... 152 TABLE 9-16 TOTAL 2011 GWH BY MONTH AND PERIOD ........................................................................................... 153 TABLE 9-17 AVERAGE TEHACHAPI LOAD AS A FRACTION OF 2010-2011 PEAK ......................................................... 153
Page 7 of 221
© Copyright 2015, Southern California Edison All Rights Reserved
TABLE 9-18 INSTRUMENTS AND ACCURACIES ........................................................................................................... 177 TABLE 9-19 CUMULATIVE ACCURACY ...................................................................................................................... 177 TABLE 9-20 CDRL 19 SECTION 8, TEST PLAN FOR BESS CAPACITY ......................................................................... 181 TABLE 9-21 COMPARISON OF MANUALLY INTEGRATED AND INSTRUMENT CALCULATED ENERGY ........................... 181 TABLE 9-22, TECHNICAL & CONTRACTUAL DOCUMENT REFERENCES ................................................................. 200 TABLE 9-23, DESIGN DOCUMENT REFERENCES ...................................................................................................... 200 TABLE 9-24, REQUIRED DATA ACQUISITION & TEST EQUIPMENT ......................................................................... 201 TABLE 9-25, REQUIRED PROGRAMMING AND CONFIGURATION SOFTWARE .......................................................... 201 TABLE 9-26, REQUIRED COMPONENT SOFTWARE AND FIRMWARE ........................................................................ 202
LIST OF FIGURES
FIGURE 3-1 MONOLITH SUBSTATION AND BESS FACILITY .......................................................................................... 28 FIGURE 3-2 SYSTEM OVERVIEW ................................................................................................................................... 29 FIGURE 6-1 8 MW CYCLE TEST POWER PROFILE FROM 12/16 THROUGH 12/22 ........................................................... 67 FIGURE 6-2 - SOC PROFILE FOR THE REPORTING PERIOD .............................................................................................. 69 FIGURE 6-3- THE BESS SYSTEM, MAJOR COMPONENTS AND MEASURING POINTS (MP) ............................................... 71 FIGURE 6-4- ACTUAL POWER AT PCC (KW) AND BESS SOC (%) FOR 2-CYCLE 4-MW TEST WITH ~30% SOC REST .. 73 FIGURE 6-5- ACTUAL POWER AT PCC_CC1 FOR 2-CYCLE 4-MW TEST WITH ~30% SOC REST ................................... 73 FIGURE 6-6- ACTUAL POWER AT PCC_CC2 FOR 2-CYCLE 4-MW TEST WITH ~30% SOC REST ................................... 74 FIGURE 6-7- VOLTAGE AT PCC FOR 2-CYCLE 4-MW TEST WITH ~30% SOC REST ...................................................... 74 FIGURE 6-8- VOLTAGE AT 66 KV FOR 2-CYCLE 4-MW TEST WITH ~30% SOC REST .................................................... 75 FIGURE 6-9- ACTUAL POWER AT PCC (KW) AND BESS SOC (%) FOR 2-CYCLE 8-MW TEST WITH ~30% SOC REST .. 77 FIGURE 6-10- ACTUAL POWER AT PCC_CC1 FOR 2-CYCLE 8-MW TEST WITH ~30% SOC REST ................................. 77 FIGURE 6-11- ACTUAL POWER AT PCC_CC2 FOR 2-CYCLE 8-MW TEST WITH ~30% SOC REST ................................. 78 FIGURE 6-12- VOLTAGE AT PCC FOR 2-CYCLE 8-MW TEST WITH ~30% SOC REST .................................................... 78 FIGURE 6-13- VOLTAGE AT 66-KV FOR 2-CYCLE 8-MW TEST WITH ~30% SOC REST ................................................. 79 FIGURE 6-14- ACTUAL POWER AT PCC (KW) AND BESS SOC (%) FOR 8-MW CONTINUOUS CYCLE TEST WITH 30%
SOC REST ............................................................................................................................................................ 81 FIGURE 6-15- ACTUAL POWER AT PCC_CC1 FOR 8-MW CONTINUOUS CYCLE TEST WITH 30% SOC REST ................. 81 FIGURE 6-16- ACTUAL POWER AT PCC_CC2 FOR 8-MW CONTINUOUS CYCLE TEST WITH 30% SOC REST ................. 82 FIGURE 6-17- VOLTAGE AT PCC FOR 8-MW CONTINUOUS CYCLE TEST WITH 30% SOC REST .................................... 82 FIGURE 6-18- VOLTAGE AT 66-KV FOR 8-MW CONTINUOUS CYCLE TEST WITH 30% SOC REST ................................. 83 FIGURE 6-19- CALCULATED EFFICIENCY FOR THE SIX TEST CYCLES DURING THE 8-MW CONTINUOUS CYCLE TEST WITH
30% SOC REST .................................................................................................................................................... 83 FIGURE 6-20- ACTUAL POWER AT PCC (KW) AND BESS SOC (%) FOR 4-MW CONTINUOUS CYCLE TEST WITH ~30%
SOC REST ............................................................................................................................................................ 85 FIGURE 6-21- ACTUAL POWER AT PCC_CC1 FOR 4-MW CONTINUOUS CYCLE TEST WITH ~30% SOC REST ............... 85 FIGURE 6-22- ACTUAL POWER AT PCC_CC2 FOR 4-MW CONTINUOUS CYCLE TEST WITH ~30% SOC REST ............... 86 FIGURE 6-23- VOLTAGE AT PCC FOR 4-MW CONTINUOUS CYCLE TEST WITH ~30% SOC REST .................................. 86 FIGURE 6-24- VOLTAGE AT 66-KV FOR 4-MW CONTINUOUS CYCLE TEST WITH ~30% SOC REST ............................... 87 FIGURE 6-25- CALCULATED EFFICIENCY FOR THE EIGHT TEST CYCLES DURING THE 4-MW CONTINUOUS CYCLE TEST
WITH ~30% SOC REST ......................................................................................................................................... 87 FIGURE 6-26- ACTUAL POWER AT PCC (KW) AND BESS SOC (%) FOR 8-MW CONTINUOUS CYCLE TEST W/O REST .. 89 FIGURE 6-27- ACTUAL POWER AT PCC_CC1 FOR 8-MW CONTINUOUS CYCLE TEST W/O REST .................................... 89 FIGURE 6-28- ACTUAL POWER AT PCC_CC2 FOR 8-MW CONTINUOUS CYCLE TEST W/O REST .................................... 90 FIGURE 6-29- VOLTAGE AT PCC FOR 8-MW CONTINUOUS CYCLE TEST W/O REST ....................................................... 90 FIGURE 6-30- VOLTAGE AT 66-KV FOR 8-MW CONTINUOUS CYCLE TEST W/O REST .................................................... 91
Page 8 of 221
© Copyright 2015, Southern California Edison All Rights Reserved
FIGURE 6-31- CALCULATED EFFICIENCY FOR THE 20 TEST CYCLES DURING THE 8-MW CONTINUOUS CYCLE TEST W/O
REST .................................................................................................................................................................... 91 FIGURE 9-1 WIND FARM CAPACITY FACTORS – 2010 AND 2011 ................................................................................ 150 FIGURE 9-2 MONTHLY AVERAGE LOADS AT MONOLITH SUBSTATION ...................................................................... 154 FIGURE 9-3 MONOLITH AVERAGE LOAD BY PERIOD .................................................................................................. 154 FIGURE 9-4 DISTRIBUTION OF MONOLITH – SUB TRAN LINES BO-HA-LO-WB 2013 LOADING ................................ 156 FIGURE 9-5 DISTRIBUTION OF MONOLITH – SUB TRAN LINES BREEZE1 2013 LOADING ......................................... 157 FIGURE 9-6 DISTRIBUTION OF MONOLITH – SUB TRAN LINES BREEZE2 2013 LOADING ......................................... 157 FIGURE 9-7 DISTRIBUTION OF MONOLITH – SUB TRAN LINES CAL-GOL-WIN 2013 LOADING ................................ 158 FIGURE 9-8 DISTRIBUTION OF MONOLITH – SUB TRAN LINES CAL-ROS-WIN 2013 LOADING ................................ 158 FIGURE 9-9 DISTRIBUTION OF MONOLITH – SUB TRAN LINES CAL-WINDP 2013 LOADING .................................... 159 FIGURE 9-10 DISTRIBUTION OF MONOLITH – SUB TRAN LINES CUMMINGS 2013 LOADING ................................... 159 FIGURE 9-11 MONOLITH – SUB TRAN LINES BO-HA-LO-WB 2013 LOADING .......................................................... 160 FIGURE 9-12 MONOLITH – SUB TRAN LINES BREEZE1 2013 LOADING .................................................................... 161 FIGURE 9-13 MONOLITH – SUB TRAN LINES BREEZE2 2013 LOADING .................................................................... 161 FIGURE 9-14 MONOLITH – SUB TRAN LINES CAL-GOL-WIN 2013 LOADING .......................................................... 162 FIGURE 9-15 MONOLITH – SUB TRAN LINES CAL-ROS-WIN 2013 LOADING ........................................................... 162 FIGURE 9-16 MONOLITH – SUB TRAN LINES CAL-WINDP 2013 LOADING ............................................................... 163 FIGURE 9-17 MONOLITH – SUB TRAN LINES CUMMINGS 2013 LOADING ............................................................... 163 FIGURE 9-18 POWER OUTPUT (A) AND VOLTAGE PROFILE (B) AT DIFFERENT WIND GENERATION BUSES BEFORE AND
AFTER THE CONTINGENCY WITHOUT THE ENERGY STORAGE ( THE CONTINGENCY IS INITIATED AT 1 SEC). ........ 166 FIGURE 9-19 SYSTEM FREQUENCY WITHOUT THE ENERGY STORAGE BEFORE AND AFTER THE CONTINGENCY ............ 166 FIGURE 9-20 SYSTEM FREQUENCY WITH THE ENERGY STORAGE DURING THE CONTINGENCY .................................... 167 FIGURE 9-21 VOLTAGE PROFILE (A) AND THE WIND FARMS OUTPUT POWER (B) BEFORE AND AFTER THE .................. 167 FIGURE 9-22 ABB PSC 100 LAB CONTROLLER ......................................................................................................... 169 FIGURE 9-23 BUS VOLTAGE, POWER, AND INTERCONNECTION CURRENT AND VOLTAGE .......................................... 170 FIGURE 9-24. CDRL 19 SECTION 6, TEST PLAN FOR BESS POWER ACCURACY........................................................ 178 FIGURE 9-25. CDRL 19 SECTION 7, TEST PLAN FOR BESS REACTIVE POWER TESTS ............................................... 179 FIGURE 9-26 CDRL 19 SECTION 9, TEST PLAN FOR BESS RAMP RATE TEST ........................................................... 182 FIGURE 9-27 CDRL 19 SECTION 10, TEST PLAN FOR BALANCING FUNCTION TEST .................................................. 183 FIGURE 9-28 CDRL 19 SECTION 11.1, TEST 1, STEADY STATE VOLTAGE REGULATION ........................................... 184 FIGURE 9-29 CDRL 19 SECTION 11.2, TEST 3, CHARGE DURING HIGH LINE LOAD/DISCHARGE DURING LOW LINE
LOAD ................................................................................................................................................................. 186 FIGURE 9-30 CDRL 19 SECTION 11.3, TEST 4, CHARGE OFF-PEAK/DISCHARGE ON-PEAK ....................................... 187 FIGURE 9-31 CDRL 19 SECTION 11.4, TEST 5, CHARGE AND DISCHARGE AS NEEDED FOR GRID PURPOSES ............ 188 FIGURE 9-32 CDRL 19 SECTION 11.5, EMS–GMS TRANSITION ............................................................................... 189 FIGURE 9-33 CDRL 19 SECTION 11.6, EMS AND GMS COMMUNICATION FAULT HANDLING .................................. 190 FIGURE 9-34 CDRL 19 SECTION 12.1, MANUAL AND CAISO POWER DISPATCH...................................................... 191 FIGURE 9-35, BESS CAPACITY CHARGE AND DISCHARGE PROFILE ...................................................................... 206
Page 9 of 221
© Copyright 2015, Southern California Edison All Rights Reserved
1 Executive Summary
This is the second of three Technology Performance Reports (TPR) for the Tehachapi Wind
Energy Storage Project (TSP). The TSP is jointly funded by the Department of Energy (DOE)
(American Reinvestment and Recovery Act - ARRA) and Southern California Edison (SCE). The
TSP is a demonstration of a Battery Energy Storage System (BESS) connected directly to the SCE
sub-transmission grid. The facility is located approximately 100 miles northeast of Los Angeles,
in Tehachapi, CA at the corner of Williamson Road and East Tehachapi Boulevard.
TPR #1 (issued 12/31/2014 with subsequent iterations) was primarily concerned with the
description of events during construction, commissioning and characterization testing of the TSP
facility. This TPR #2 is concerned with the troubleshooting of various issues and the tuning of the
custom designed facility as well as initial operations yielding first instances of project test data.
TPR #3 is expected to report on the continuous operation of the facility and test data satisfying the
project scope and Metrics and Benefits Reporting Plan (MBRP).
The main objective of the TSP is to evaluate the performance of utility scale lithium ion battery
technology in improving grid performance and integrating intermittent generation, e.g., wind. The
primary object is to use electrical energy storage to manage conventional energy flows in a time
dependent function in order to address grid instability and capacity issues that result from the
interconnection of highly variable generation resources.
The TSP was developed based on engineering studies and analysis of the transmission assets in
the Tehachapi region, also referred to as the Antelope-Bailey area for transmission studies. In
general, SCE evaluated the local transmission assets by completing power flow and dynamic
stability simulation studies which looked at current conditions and contingency conditions at
selected times in the future. Specifically, the objective of the study was to quantify the grid
reliability and power quality issues and assess potential improvements on the grid at selected
interconnection locations by the deployment of energy storage devices with four-quadrant control
of real and reactive power.
The results of the studies identified scenarios that resulted in undesired effects on the Antelope-
Bailey System. These scenarios revealed voltage problems due to lack of reactive power support
and power flow capacity on two transmission lines in the region. Moreover, these scenarios led to
wind farm generation curtailments to mitigate potential transmission problems. Thus, it was the
objective of the study team to identify ways to alleviate the need to curtail wind farms in the
Tehachapi region.
The analysis team identified an 8 MW (Megawatt), 4 hours (32 MWh – Megawatt-hr) Battery
Energy Storage System (BESS) as an option to mitigate the reactive power problem and line
overloading identified in the above scenarios. The immediate benefits of the BESS are
contingency support (active and reactive power), voltage profile support, and improved fault ride-
through capability.
The DOE awarded ARRA funding in early 2010 and project work began in October of that year.
Installation and commissioning of the BESS was completed in July 2014. Initial design,
specification and procurement of the BESS were disrupted by financial issues of the original BESS
provider. Subsequently, a revised project plan was developed to select a new BESS provider and
Page 10 of 221
© Copyright 2015, Southern California Edison All Rights Reserved
continue with the project. Other than the discussion of Project History in section 3.1, this TPR
addresses the project after transition to the second BESS provider under the revised project plan
including the activities leading to the implementation of initial system testing according to the
project test plan.
The project is installed in the Monolith substation where it is connected to the 66 kV bus and will
be tested under various load and wind power generation conditions. Specifically, tests will
ascertain the capability and effectiveness of the BESS to support various grid operational uses.
The evaluation of the BESS is based on the premise that there are benefits which should accrue to
SCE and to the overall electricity delivery system based on three general categories of operational
uses: transmission, system and California Independent System Operator (CAISO) market:
Transmission uses provide a means for evaluating the ability of the BESS to resolve
capacity and stability issues on transmission systems, especially those with intermittent generation,
e.g., wind.
System uses provide for a means of meeting the system electricity needs with stored
energy.
The CAISO market uses look at the ability of the BESS to provide benefits to the grid in
ways that meet specific needs of the system operator.
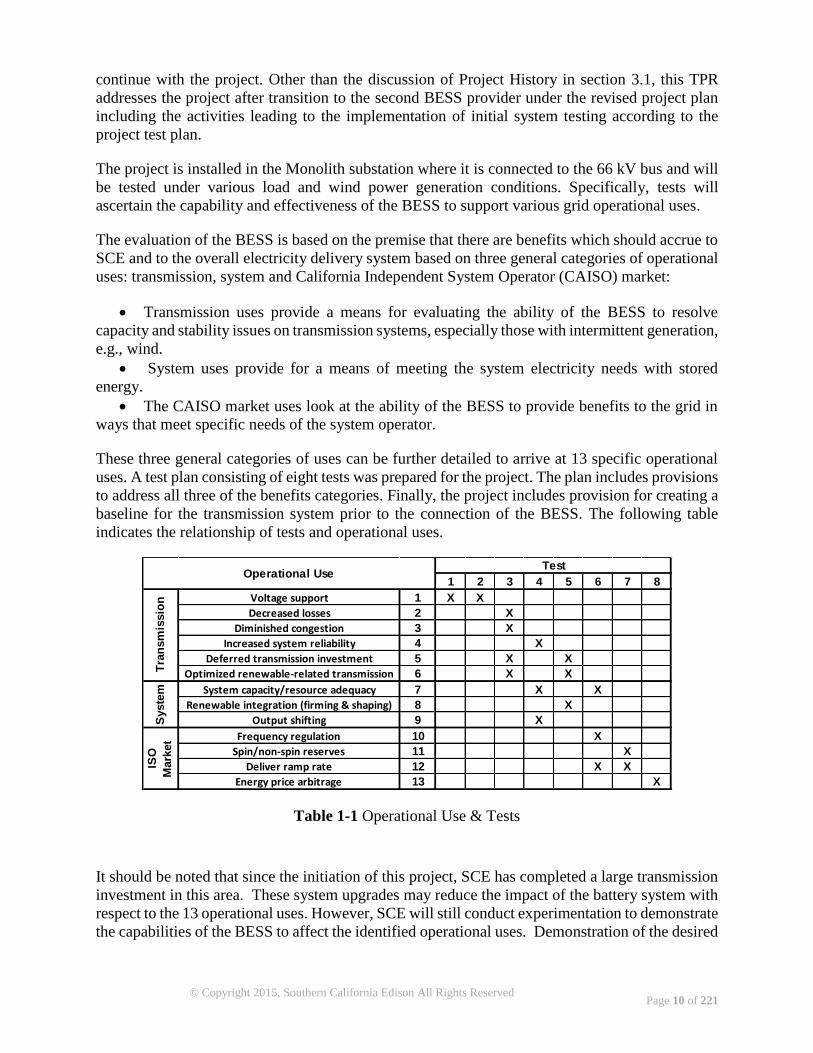
These three general categories of uses can be further detailed to arrive at 13 specific operational
uses. A test plan consisting of eight tests was prepared for the project. The plan includes provisions
to address all three of the benefits categories. Finally, the project includes provision for creating a
baseline for the transmission system prior to the connection of the BESS. The following table
indicates the relationship of tests and operational uses.
Table 1-1 Operational Use & Tests
It should be noted that since the initiation of this project, SCE has completed a large transmission
investment in this area. These system upgrades may reduce the impact of the battery system with
respect to the 13 operational uses. However, SCE will still conduct experimentation to demonstrate
the capabilities of the BESS to affect the identified operational uses. Demonstration of the desired
1 2 3 4 5 6 7 8
Voltage support 1 X X
Decreased losses 2 X
Diminished congestion 3 X
Increased system reliability 4 X
Deferred transmission investment 5 X X
Optimized renewable-related transmission 6 X X
System capacity/resource adequacy 7 X X
Renewable integration (firming & shaping) 8 X
Output shifting 9 X
Frequency regulation 10 X
Spin/non-spin reserves 11 X
Deliver ramp rate 12 X X
Energy price arbitrage 13 X
Operational UseTest
Tra
nsm
issio
nS
yste
mIS
O
Mark
et
Page 11 of 221
© Copyright 2015, Southern California Edison All Rights Reserved
response of the device to grid conditions allows us to extrapolate data, and apply lessons learned
to other scenarios where a storage device may have a more significant impact.
The transmission system baseline effort was completed during the second half of 2014. Collection
of baseline data for the project includes data from the region before and after the recent system
upgrades. Some of the “pre-upgrades” data is useful for predicting and trending area loads and
generation. For example, the timing of individual tests described later in this report is scheduled,
based in part, on seasonal variations in wind generation.
Validation of the installed BESS at the component and system level involved a multi-phase
commissioning process. A “Mini-System” was installed and tested at one of SCE’s off site
laboratories. The Mini-System consisted of all the functional components of the full system with
a scaled down set of batteries (originally 30 kW, 116 kWh; the Mini-System was expanded to 60
kW, 232 kWh in December 2015. The Mini-System allowed for operational testing of system
control schemes. A second element of commissioning involved end to end testing of the software,
communications, and data collection components of the BESS again in a lab environment. This
testing allowed SCE to verify data paths, proper communications, and ensure proper configuration
of the associated communications hardware. The third phase of commissioning tested the BESS
control strategy in a Real Time Digital Simulator (RTDS) environment. A spare BESS system
controller was hardwired into the RTDS system at yet another SCE lab. This Hardware in the
Loop (HWIL) allowed the project team to study the interaction of the control system with other
grid systems prior to actual live system operations. The fourth and final phase of commissioning
involved the component and full system testing of the complete system at the TSP facility. This
final phase of commissioning was completed in June 2014.
Full scale System Acceptance Testing (SAT) of the BESS began in July 2014 following
completion of system commissioning. The BESS was fully operational and grid connected for the
SAT, and was exercised across the full range of system operating capabilities. As a natural
progression and in order to better understand more detailed operating characteristics of the
installed system, the next phase of evaluation consists of system Characterization Testing. A more
detailed understanding of the BESS baseline performance will allow for comparison at later stages
of the M&V testing.
Preliminary Characterization Testing began at the end of 2014, further project testing continued in
January 2015. Hence, this TPR #2 reports on activities from inception of the project through
project plan testing continuing through the end of 2015. Testing of the 13 operational use cases
will be reported in this and the subsequent Final Technical Report (TPR#3).
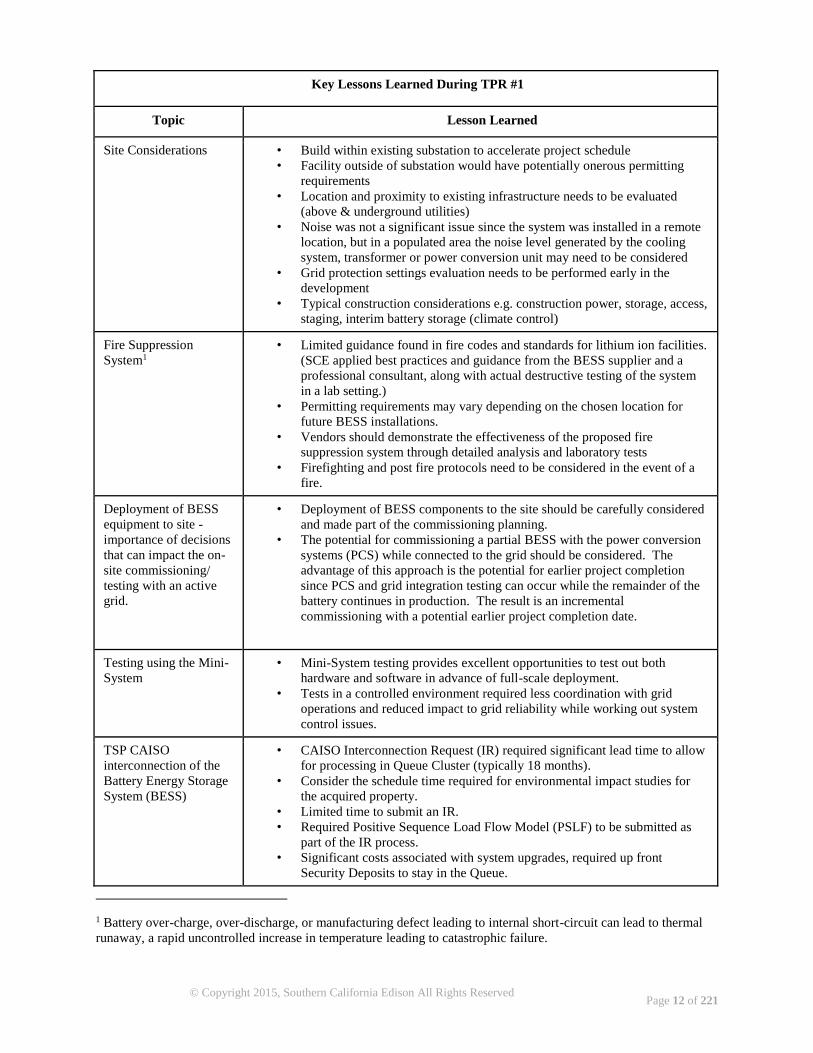
The following table identifies five of the top lessons learned to date. Additional lessons learned
are found in Section 6.
Page 12 of 221
© Copyright 2015, Southern California Edison All Rights Reserved
Key Lessons Learned During TPR #1
Topic Lesson Learned
Site Considerations • Build within existing substation to accelerate project schedule
• Facility outside of substation would have potentially onerous permitting
requirements
• Location and proximity to existing infrastructure needs to be evaluated
(above & underground utilities)
• Noise was not a significant issue since the system was installed in a remote
location, but in a populated area the noise level generated by the cooling
system, transformer or power conversion unit may need to be considered
• Grid protection settings evaluation needs to be performed early in the
development
• Typical construction considerations e.g. construction power, storage, access,
staging, interim battery storage (climate control)
Fire Suppression
System1
• Limited guidance found in fire codes and standards for lithium ion facilities.
(SCE applied best practices and guidance from the BESS supplier and a
professional consultant, along with actual destructive testing of the system
in a lab setting.)
• Permitting requirements may vary depending on the chosen location for
future BESS installations.
• Vendors should demonstrate the effectiveness of the proposed fire
suppression system through detailed analysis and laboratory tests
• Firefighting and post fire protocols need to be considered in the event of a
fire.
Deployment of BESS
equipment to site -
importance of decisions
that can impact the on-
site commissioning/
testing with an active
grid.
• Deployment of BESS components to the site should be carefully considered
and made part of the commissioning planning.
• The potential for commissioning a partial BESS with the power conversion
systems (PCS) while connected to the grid should be considered. The
advantage of this approach is the potential for earlier project completion
since PCS and grid integration testing can occur while the remainder of the
battery continues in production. The result is an incremental
commissioning with a potential earlier project completion date.
Testing using the Mini-
System
• Mini-System testing provides excellent opportunities to test out both
hardware and software in advance of full-scale deployment.
• Tests in a controlled environment required less coordination with grid
operations and reduced impact to grid reliability while working out system
control issues.
TSP CAISO
interconnection of the
Battery Energy Storage
System (BESS)
• CAISO Interconnection Request (IR) required significant lead time to allow
for processing in Queue Cluster (typically 18 months).
• Consider the schedule time required for environmental impact studies for
the acquired property.
• Limited time to submit an IR.
• Required Positive Sequence Load Flow Model (PSLF) to be submitted as
part of the IR process.
• Significant costs associated with system upgrades, required up front
Security Deposits to stay in the Queue.
1 Battery over-charge, over-discharge, or manufacturing defect leading to internal short-circuit can lead to thermal
runaway, a rapid uncontrolled increase in temperature leading to catastrophic failure.
Page 13 of 221
© Copyright 2015, Southern California Edison All Rights Reserved
• Interconnection agreement stipulated operating restrictions/limitations on
BESS due to system topology and/or reliability requirements.
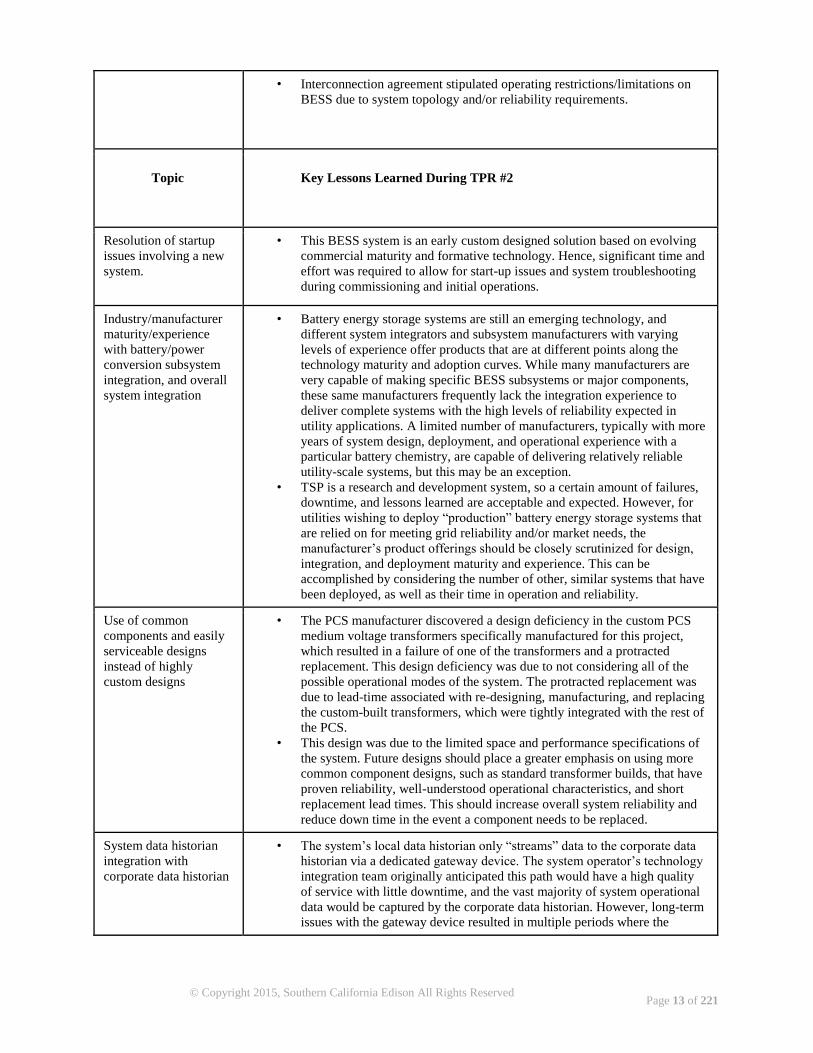
Topic
Key Lessons Learned During TPR #2
Resolution of startup
issues involving a new
system.
• This BESS system is an early custom designed solution based on evolving
commercial maturity and formative technology. Hence, significant time and
effort was required to allow for start-up issues and system troubleshooting
during commissioning and initial operations.
Industry/manufacturer
maturity/experience
with battery/power
conversion subsystem
integration, and overall
system integration
• Battery energy storage systems are still an emerging technology, and
different system integrators and subsystem manufacturers with varying
levels of experience offer products that are at different points along the
technology maturity and adoption curves. While many manufacturers are
very capable of making specific BESS subsystems or major components,
these same manufacturers frequently lack the integration experience to
deliver complete systems with the high levels of reliability expected in
utility applications. A limited number of manufacturers, typically with more
years of system design, deployment, and operational experience with a
particular battery chemistry, are capable of delivering relatively reliable
utility-scale systems, but this may be an exception.
• TSP is a research and development system, so a certain amount of failures,
downtime, and lessons learned are acceptable and expected. However, for
utilities wishing to deploy “production” battery energy storage systems that
are relied on for meeting grid reliability and/or market needs, the
manufacturer’s product offerings should be closely scrutinized for design,
integration, and deployment maturity and experience. This can be
accomplished by considering the number of other, similar systems that have
been deployed, as well as their time in operation and reliability.
Use of common
components and easily
serviceable designs
instead of highly
custom designs
• The PCS manufacturer discovered a design deficiency in the custom PCS
medium voltage transformers specifically manufactured for this project,
which resulted in a failure of one of the transformers and a protracted
replacement. This design deficiency was due to not considering all of the
possible operational modes of the system. The protracted replacement was
due to lead-time associated with re-designing, manufacturing, and replacing
the custom-built transformers, which were tightly integrated with the rest of
the PCS.
• This design was due to the limited space and performance specifications of
the system. Future designs should place a greater emphasis on using more
common component designs, such as standard transformer builds, that have
proven reliability, well-understood operational characteristics, and short
replacement lead times. This should increase overall system reliability and
reduce down time in the event a component needs to be replaced.
System data historian
integration with
corporate data historian
• The system’s local data historian only “streams” data to the corporate data
historian via a dedicated gateway device. The system operator’s technology
integration team originally anticipated this path would have a high quality
of service with little downtime, and the vast majority of system operational
data would be captured by the corporate data historian. However, long-term
issues with the gateway device resulted in multiple periods where the
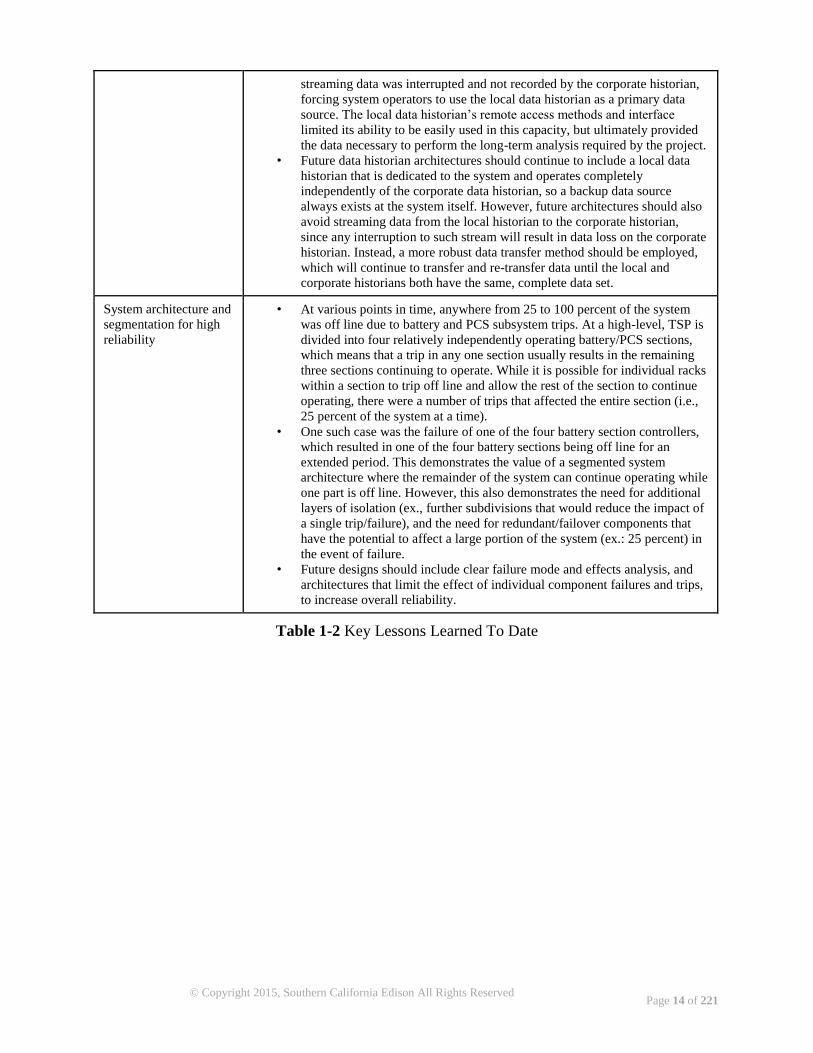
Page 14 of 221
© Copyright 2015, Southern California Edison All Rights Reserved
streaming data was interrupted and not recorded by the corporate historian,
forcing system operators to use the local data historian as a primary data
source. The local data historian’s remote access methods and interface
limited its ability to be easily used in this capacity, but ultimately provided
the data necessary to perform the long-term analysis required by the project.
• Future data historian architectures should continue to include a local data
historian that is dedicated to the system and operates completely
independently of the corporate data historian, so a backup data source
always exists at the system itself. However, future architectures should also
avoid streaming data from the local historian to the corporate historian,
since any interruption to such stream will result in data loss on the corporate
historian. Instead, a more robust data transfer method should be employed,
which will continue to transfer and re-transfer data until the local and
corporate historians both have the same, complete data set.
System architecture and
segmentation for high
reliability
• At various points in time, anywhere from 25 to 100 percent of the system
was off line due to battery and PCS subsystem trips. At a high-level, TSP is
divided into four relatively independently operating battery/PCS sections,
which means that a trip in any one section usually results in the remaining
three sections continuing to operate. While it is possible for individual racks
within a section to trip off line and allow the rest of the section to continue
operating, there were a number of trips that affected the entire section (i.e.,
25 percent of the system at a time).
• One such case was the failure of one of the four battery section controllers,
which resulted in one of the four battery sections being off line for an
extended period. This demonstrates the value of a segmented system
architecture where the remainder of the system can continue operating while
one part is off line. However, this also demonstrates the need for additional
layers of isolation (ex., further subdivisions that would reduce the impact of
a single trip/failure), and the need for redundant/failover components that
have the potential to affect a large portion of the system (ex.: 25 percent) in
the event of failure.
• Future designs should include clear failure mode and effects analysis, and
architectures that limit the effect of individual component failures and trips,
to increase overall reliability.
Table 1-2 Key Lessons Learned To Date
Page 15 of 221
© Copyright 2015, Southern California Edison All Rights Reserved
2 Scope
2.1 Abstract
The TSP is located at SCE’s Monolith Substation in Tehachapi, California. The 8 MW, 4 hours
(32 MWh) BESS is housed in a 6,300 square foot facility and 2 x 4 MW/4.5 MVA smart inverters
are on a concrete pad adjacent to the BESS facility. The project will evaluate the capabilities of
the BESS to improve grid performance and assist in the integration of large-scale intermittent
generation, e.g., wind. Project performance will be measured by 13 specific operational uses:
providing voltage support and grid stabilization, decreasing transmission losses, diminishing
congestion, increasing system reliability, deferring transmission investment, optimizing
renewable-related transmission, providing system capacity and resources adequacy, integrating
renewable energy (smoothing), shifting wind generation output, frequency regulation, spin/non-
spin replacement reserves, ramp management, and energy price arbitrage. Most of the operations
either shift other generation resources to meet peak load and other electricity system needs with
stored electricity, or resolve grid stability and capacity concerns that result from the
interconnection of intermittent generation. SCE will also demonstrate the ability of lithium ion
battery storage to provide nearly instantaneous maximum capacity for supply-side ramp rate
control to minimize the need for fossil fuel-powered back-up generation. The project began in
October, 2010 and will continue through July, 2016.
2.2 Introduction to SCE
SCE is one of the nation’s largest electric utilities, serving more than 14 million people in over
180 cities across central, coastal and southern California. SCE is based in Rosemead, California,
and has been providing electric service in this region for more than 125 years. SCE, a subsidiary
of Edison International, is an investor owned utility operating in the state of California, with a
service territory of over 50,000 square miles and delivering 12.6 billion kWh of renewable
energy.
SCE has over twenty years of experience in large-scale wind generation integration and in the
development and testing of battery technologies for grid applications. As such, SCE brings to
the project comprehensive experience in all relevant technological and operational areas.
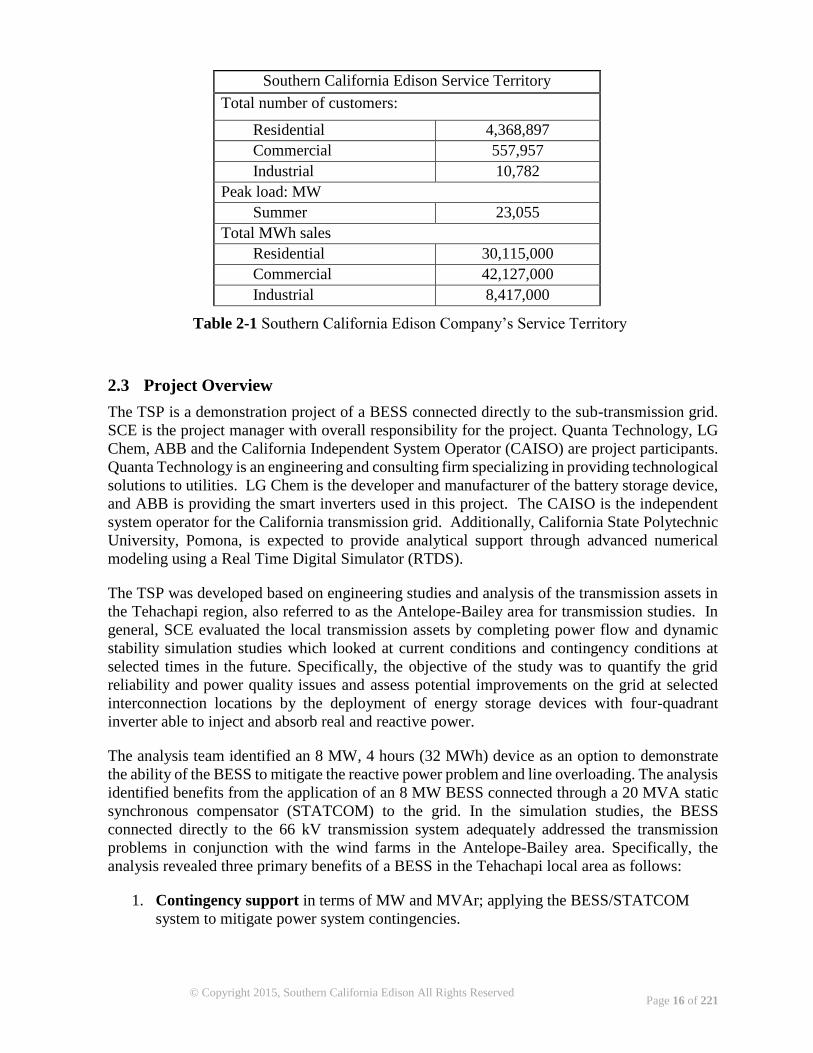
The following table, lists statistics further describing the SCE service area.
Page 16 of 221
© Copyright 2015, Southern California Edison All Rights Reserved
Southern California Edison Service Territory
Total number of customers:
Residential 4,368,897
Commercial 557,957
Industrial 10,782
Peak load: MW
Summer 23,055
Total MWh sales
Residential 30,115,000
Commercial 42,127,000
Industrial 8,417,000
Table 2-1 Southern California Edison Company’s Service Territory
2.3 Project Overview
The TSP is a demonstration project of a BESS connected directly to the sub-transmission grid.
SCE is the project manager with overall responsibility for the project. Quanta Technology, LG
Chem, ABB and the California Independent System Operator (CAISO) are project participants.
Quanta Technology is an engineering and consulting firm specializing in providing technological
solutions to utilities. LG Chem is the developer and manufacturer of the battery storage device,
and ABB is providing the smart inverters used in this project. The CAISO is the independent
system operator for the California transmission grid. Additionally, California State Polytechnic
University, Pomona, is expected to provide analytical support through advanced numerical
modeling using a Real Time Digital Simulator (RTDS).
The TSP was developed based on engineering studies and analysis of the transmission assets in
the Tehachapi region, also referred to as the Antelope-Bailey area for transmission studies. In
general, SCE evaluated the local transmission assets by completing power flow and dynamic
stability simulation studies which looked at current conditions and contingency conditions at
selected times in the future. Specifically, the objective of the study was to quantify the grid
reliability and power quality issues and assess potential improvements on the grid at selected
interconnection locations by the deployment of energy storage devices with four-quadrant
inverter able to inject and absorb real and reactive power.
The analysis team identified an 8 MW, 4 hours (32 MWh) device as an option to demonstrate
the ability of the BESS to mitigate the reactive power problem and line overloading. The analysis
identified benefits from the application of an 8 MW BESS connected through a 20 MVA static
synchronous compensator (STATCOM) to the grid. In the simulation studies, the BESS
connected directly to the 66 kV transmission system adequately addressed the transmission
problems in conjunction with the wind farms in the Antelope-Bailey area. Specifically, the
analysis revealed three primary benefits of a BESS in the Tehachapi local area as follows:
1. Contingency support in terms of MW and MVAr; applying the BESS/STATCOM
system to mitigate power system contingencies.
Page 17 of 221
© Copyright 2015, Southern California Edison All Rights Reserved
2. Voltage profile support - applying the BESS/STATCOM system results in improved
voltage recovery of about 10-15%.
3. Improved fault ride-through capability for some of the Type 1 wind turbines in close
vicinity of the proposed substation installation.
The results of possible applications of the BESS/STATCOM system between the wind farms
and congested transmission lines in the Antelope-Bailey area were studied in detail. For hourly
dispatch at one local wind farm, the battery contributes to minimizing the wind power variations
and controls wind farm power output within a preset power range. For contingency support, the
battery contributes to absorb energy (8 MW during four hours maximum) in order to avoid wind
farm curtailments during the time the contingency is in effect in the Antelope-Bailey area. At
project inception, significant curtailments were required due to transmission line congestion in
the Antelope-Bailey region. Since then, SCE has made planned improvements in the system
topology that mitigate much of the congestion in the area and alleviate much of the need for
curtailment events. Nevertheless, TSP will be operated and tested in a fashion that will
demonstrate the ability of storage to reduce congestion as originally planned.
The BESS is installed at the Monolith substation near Tehachapi, California and connected to
the 66 kV bus. Tehachapi, California is one of the premier places in California for wind
generation and one of the windiest places in the United States. SCE has entered into several
long term contracts for new wind projects in the Tehachapi-Mohave area and has committed to
investing in a significant amount of transmission infrastructure in the same area. This
demonstration project is situated at an ideal location on the California grid, where existing and
new wind projects and transmission infrastructure jointly help California meet its renewable
energy targets. This project is designed to test a BESS under various grid and power
generation conditions. Specifically, SCE anticipate evaluating the BESS capability and
effectiveness to support 13 operational uses, described by the following.
Transmission Uses
1. Voltage support/grid stabilization: Energy storage used for transmission support improves
Transmission and Distribution (T&D) system performance by compensating for electrical
anomalies and disturbances such as voltage excursions, angular stability, and frequency
stability. The result is a more stable system with improved performance (throughput).
2. Decreased transmission losses: Transmission losses are dependent on the current flow
through transmission lines. By optimizing the magnitude and power factor angle of current
flow on the transmission system under various system conditions, energy storage can reduce
losses.
3. Diminished congestion: Storage could be used to avoid congestion-related costs and
charges, especially if the charges become onerous due to significant transmission system
congestion. Storage systems traditionally have been installed at locations that are electrically
downstream from the congested portion of the transmission system. Energy would be stored
when there is no transmission congestion, and it would be discharged (during peak demand
periods) to reduce transmission capacity requirements. In the TSP, storage is installed on the
transmission system, at a location electrically upstream from the congestion. It will be charged
Page 18 of 221
© Copyright 2015, Southern California Edison All Rights Reserved
when wind generation output is high to reduce congestion, and it will be discharged when wind
generation output is lower to utilize available transmission capacity.
4. Increased system reliability by load shed deferral: In certain situations, load shedding (or
addition) is needed to mitigate under-frequency (or over-frequency) conditions. Storage could
be used to avoid load shedding by supplementing inadequate available generation and/or
transmission capacity.
5. Deferred transmission investment: Consider a T&D system whose peak electric loading
is approaching the system’s load carrying capacity (design rating). In some cases, installing a
small amount of energy storage downstream from the nearly overloaded T&D node (or
upstream as in the TSP design) will defer the need for a T&D upgrade.
6. Optimized size and cost of renewable energy-related transmission: New transmission
infrastructure built to fully integrate renewable energy into the grid must be planned and sized
for maximum output of installed renewable generation, even though that output is variable and
will usually be well below its maximum. Such sizing would lead to substantial under-
utilization of transmission capability most of the time. If battery energy storage performs as
anticipated, installing a small amount of storage upstream from new transmission infrastructure
could effectively smooth the wind output and improve the effective utilization of new
renewable energy-related transmission.
System Uses
7. Provide system capacity/resource adequacy: Depending on the circumstances in a given
electric supply system, energy storage could be used to defer and/or reduce the need to buy
new central station generation capacity and/or to “rent” capacity in the wholesale electricity
marketplace. The BESS will be evaluated for its ability to qualify for Resource Adequacy
(RA) under existing requirements. If regulatory statutes for storage are written during the
demonstration period, the BESS will be evaluated for its capabilities to meet the new
requirements.
8. Renewable energy integration (smoothing): As wind generation penetration increases, the
electricity grid effects unique to wind generation will also increase. Storage could assist with
orderly integration of wind generation (wind integration) by providing services that reduce the
variability of wind generation. Short duration applications could include: reduce output
volatility and improve power quality. Long duration applications could include: reduce output
variability, transmission congestion relief, backup for unexpected wind generation shortfall,
and reduce minimum load violations.
9. Wind generation output shifting: Many renewable generation resources produce a
significant portion of electric energy when that energy has a low financial value (e.g., at night,
on weekends, during holidays and off-peak times). Energy storage used in conjunction with
renewable energy generation could be charged using low value energy from the renewable
energy generation so that energy may be used to offset other purchases or sold when it is more
valuable.
CAISO Market Uses
Page 19 of 221
© Copyright 2015, Southern California Edison All Rights Reserved
10. Frequency regulation: Some thermal/base-load generation used for regulation service is
not especially well-suited to provide regulation, because the generation is not designed for
operation at partial load or to provide variable output. Storage may be an attractive alternative
to most generation-based load following for at least three reasons: 1) in general, storage has
superior part-load efficiency, 2) efficient storage can be used to provide up to two times its
rated capacity for regulation services, and 3) storage output can be varied rapidly (e.g., output
can change from none/full to full/none within seconds rather than minutes).
11. Spin/non-spin replacement reserves: Generation resources used as reserve capacity must
be online and operational (i.e., at part load). Unlike generation, in almost all circumstances,
storage used for reserve capacity does not discharge at all – it just has to be ready and available
to discharge if needed.
12. Deliver ramp rate: Storage is well-suited for providing load following services for
several reasons. First, most types of storage can operate at partial output levels with relatively
modest performance penalties. Second, most types of storage can respond very quickly
(compared to most types of generation) when more or less output is needed for load following.
Consider also that storage can be used effectively for both load following up (as load increases)
and for load following down (as load decreases), either by discharging or charging.
13. Energy price arbitrage: This operational use may shift wind energy output (see Use
Number 9) in response to a market signal from the CAISO.
These 13 operational uses form the basis for SCE’s evaluation of the BESS. In order to place
the TSP in the context of other ARRA funded demonstration projects it is helpful to show the
relationships between the 13 operational uses and the seventeen functions as defined by Sandia
document Energy Storage for the Electricity Grid: Benefits and Market Potential Assessment
Guide (SAND2010-0815, February 2010). The table below illustrates the relationships
between the operational uses and the Sandia applications.

Page 20 of 221
© Copyright 2015, Southern California Edison All Rights Reserved
SCE Operational
Uses
DOE Applications Comments
Voltage Support/grid
stabilization
Voltage Support
Decreased transmission losses Transmission Support Decreased Transmission Losses are
more accurately defined as storage
benefits rather than uses or
applications. “Avoided T&D Energy
Losses” is included in the DOE
Guide as an “Incidental Benefit
(#19)”. As such, applying storage for
Transmission Support has an
incidental benefit of decreasing
transmission losses.
Diminished congestion Transmission Congestion Relief
Increased system reliability by
load shed deferral
Transmission Support Under-frequency Load Shedding
Reduction (See Table 6 of DOE
Guide) This reduces the number of
mandatory load shed events to
relieve congestion or line loading,
thereby increasing the reliability of
the regional system.
Deferred transmission
investment
T&D Upgrade Deferral
Optimized size and cost of
renewable energy related
transmission
T&D Upgrade Deferral The intent is to increase the firm
capacity rating of the affected
transmission lines resulting from the
operation of the BESS. Any
incremental improvement in
transmission line firm capacity
ratings supports the deferral of
capacity upgrade.
Provide system
capacity/resource adequacy
Renewables Capacity Firming
Renewable energy integration
(smoothing)
Wind Generation Grid Integration,
Short Duration
Wind generation output shifting Wind Generation Grid Integration,
long Duration
Frequency regulation Area Regulation
Spin/non-spin replacement
reserves
Electric Supply Reserve Capacity
Deliver ramp rate Load Following
Energy price arbitrage Renewables Energy Time Shift
Table 2-2 Relationship of 13 Uses to DOE Applications
2.4 Project Objectives
The main objective of the TSP is to evaluate the capability of utility scale lithium ion battery
technology in improving grid performance and integrating intermittent generation, e.g., wind.
The primary objective is to use electrical energy storage to manage conventional energy flows
in a time dependent function in order to address grid instability and capacity issues that result
from the interconnection of highly variable wind generation resources.
The evaluation of the BESS is based on the premise that there are benefits which should accrue
to SCE and to the overall electricity delivery system based on three categories of operational
uses: transmission, system and CAISO market. These operational uses are further delineated into
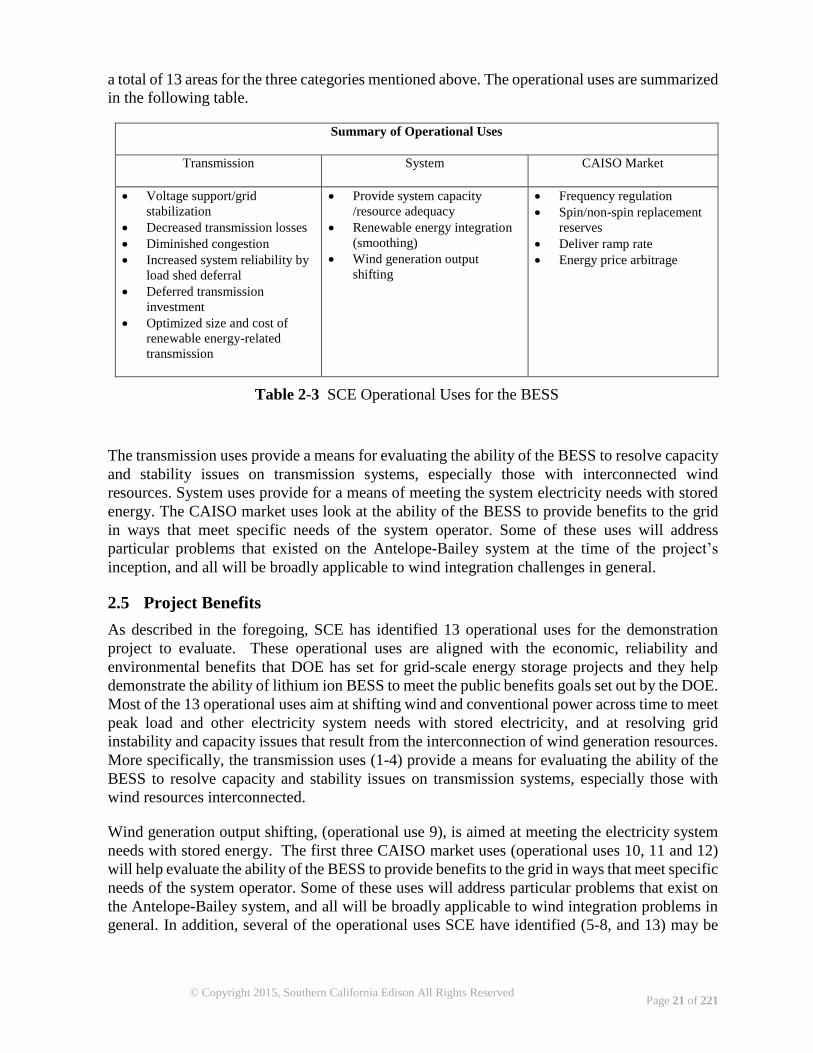
Page 21 of 221
© Copyright 2015, Southern California Edison All Rights Reserved
a total of 13 areas for the three categories mentioned above. The operational uses are summarized
in the following table.
Summary of Operational Uses
Transmission System CAISO Market
Voltage support/grid
stabilization
Decreased transmission losses
Diminished congestion
Increased system reliability by
load shed deferral
Deferred transmission
investment
Optimized size and cost of
renewable energy-related
transmission
Provide system capacity
/resource adequacy
Renewable energy integration
(smoothing)
Wind generation output
shifting
Frequency regulation
Spin/non-spin replacement
reserves
Deliver ramp rate
Energy price arbitrage
Table 2-3 SCE Operational Uses for the BESS
The transmission uses provide a means for evaluating the ability of the BESS to resolve capacity
and stability issues on transmission systems, especially those with interconnected wind
resources. System uses provide for a means of meeting the system electricity needs with stored
energy. The CAISO market uses look at the ability of the BESS to provide benefits to the grid
in ways that meet specific needs of the system operator. Some of these uses will address
particular problems that existed on the Antelope-Bailey system at the time of the project’s
inception, and all will be broadly applicable to wind integration challenges in general.
2.5 Project Benefits
As described in the foregoing, SCE has identified 13 operational uses for the demonstration
project to evaluate. These operational uses are aligned with the economic, reliability and
environmental benefits that DOE has set for grid-scale energy storage projects and they help
demonstrate the ability of lithium ion BESS to meet the public benefits goals set out by the DOE.
Most of the 13 operational uses aim at shifting wind and conventional power across time to meet
peak load and other electricity system needs with stored electricity, and at resolving grid
instability and capacity issues that result from the interconnection of wind generation resources.
More specifically, the transmission uses (1-4) provide a means for evaluating the ability of the
BESS to resolve capacity and stability issues on transmission systems, especially those with
wind resources interconnected.
Wind generation output shifting, (operational use 9), is aimed at meeting the electricity system
needs with stored energy. The first three CAISO market uses (operational uses 10, 11 and 12)
will help evaluate the ability of the BESS to provide benefits to the grid in ways that meet specific
needs of the system operator. Some of these uses will address particular problems that exist on
the Antelope-Bailey system, and all will be broadly applicable to wind integration problems in
general. In addition, several of the operational uses SCE have identified (5-8, and 13) may be
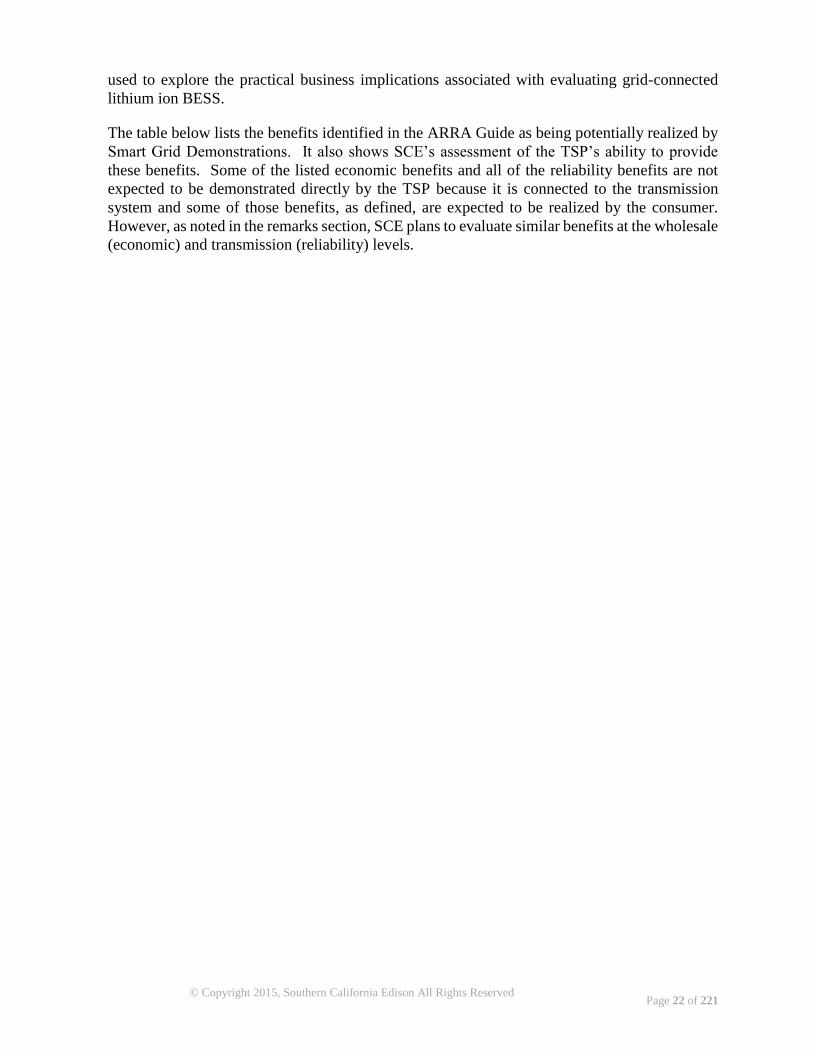
Page 22 of 221
© Copyright 2015, Southern California Edison All Rights Reserved
used to explore the practical business implications associated with evaluating grid-connected
lithium ion BESS.
The table below lists the benefits identified in the ARRA Guide as being potentially realized by
Smart Grid Demonstrations. It also shows SCE’s assessment of the TSP’s ability to provide
these benefits. Some of the listed economic benefits and all of the reliability benefits are not
expected to be demonstrated directly by the TSP because it is connected to the transmission
system and some of those benefits, as defined, are expected to be realized by the consumer.
However, as noted in the remarks section, SCE plans to evaluate similar benefits at the wholesale
(economic) and transmission (reliability) levels.
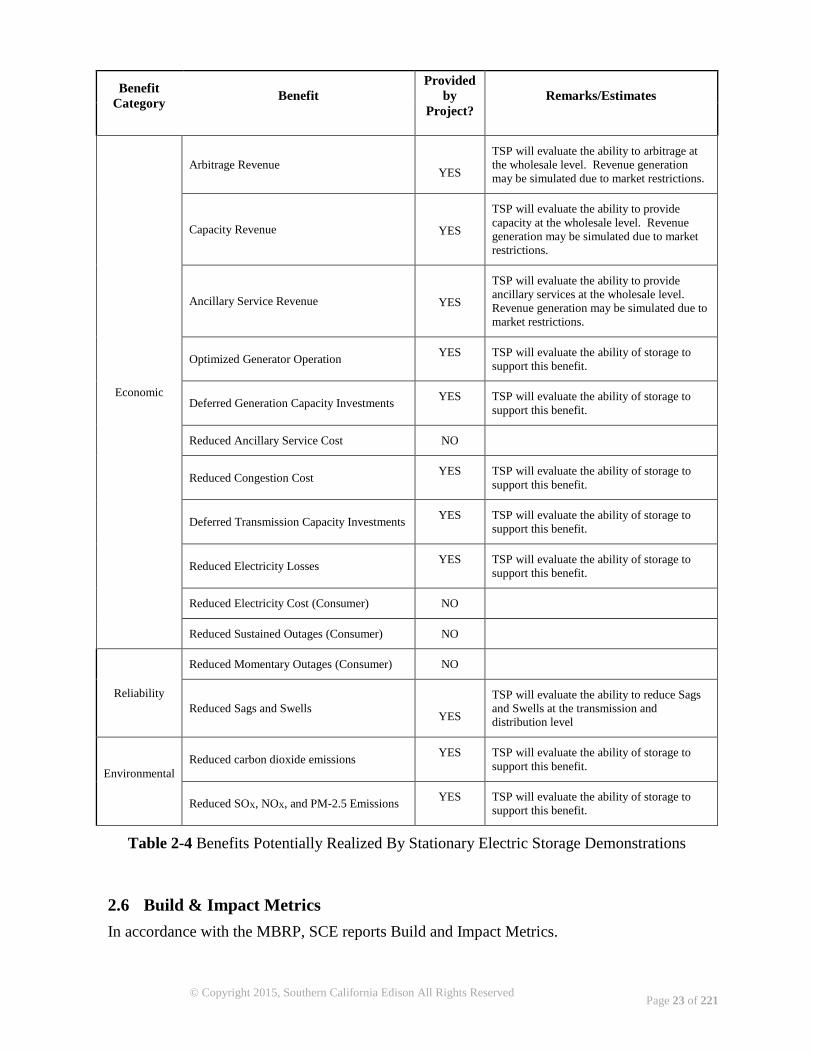
Page 23 of 221
© Copyright 2015, Southern California Edison All Rights Reserved
Benefit
Category Benefit
Provided
by
Project?
Remarks/Estimates
Economic
Arbitrage Revenue
YES
TSP will evaluate the ability to arbitrage at
the wholesale level. Revenue generation
may be simulated due to market restrictions.
Capacity Revenue
YES
TSP will evaluate the ability to provide
capacity at the wholesale level. Revenue
generation may be simulated due to market
restrictions.
Ancillary Service Revenue
YES
TSP will evaluate the ability to provide
ancillary services at the wholesale level.
Revenue generation may be simulated due to
market restrictions.
Optimized Generator Operation YES TSP will evaluate the ability of storage to
support this benefit.
Deferred Generation Capacity Investments YES TSP will evaluate the ability of storage to
support this benefit.
Reduced Ancillary Service Cost NO
Reduced Congestion Cost YES TSP will evaluate the ability of storage to
support this benefit.
Deferred Transmission Capacity Investments YES TSP will evaluate the ability of storage to
support this benefit.
Reduced Electricity Losses YES TSP will evaluate the ability of storage to
support this benefit.
Reduced Electricity Cost (Consumer) NO
Reduced Sustained Outages (Consumer) NO
Reliability
Reduced Momentary Outages (Consumer) NO
Reduced Sags and Swells
YES
TSP will evaluate the ability to reduce Sags
and Swells at the transmission and
distribution level
Environmental
Reduced carbon dioxide emissions YES TSP will evaluate the ability of storage to
support this benefit.
Reduced SOX, NOX, and PM-2.5 Emissions YES TSP will evaluate the ability of storage to
support this benefit.
Table 2-4 Benefits Potentially Realized By Stationary Electric Storage Demonstrations
2.6 Build & Impact Metrics
In accordance with the MBRP, SCE reports Build and Impact Metrics.
Page 24 of 221
© Copyright 2015, Southern California Edison All Rights Reserved
Build Metrics track how the project money is spent, including spending on hardware
and software, and associated programs. These reports are issued separately every 3
months.
Impact metrics measure how, and to what extent, the storage system affects grid
operations and performance.
This TPR is written specifically to address Impact Metrics. The TPR addresses how the BESS
affects the transmission system performance and how well the storage system itself performs
under each of the operational uses discussed previously.
In addition to Build and Impact Metrics, key BESS performance parameters are addressed as
part of the TSP system evaluation. These include system availability, maintenance procedures
and costs; energy charged and discharged, capacity degradation over time, and ramp rate
capabilities. During the period of this TPR #2, metrics assessment was continued although
compromised by typical non-recurring issues relating to design and operations of a new
system.
2.7 Project Plan
The DOE awarded ARRA funding in early 2010 and project work began in October of that year.
Initial design, specification and procurement of the BESS were disrupted by financial issues of
the original BESS provider. Subsequently, a revised project plan was developed to select a new
BESS provider and continue with the project. This and the subsequent TPR#3 will address the
project after transition to the revised project plan.
Key asset deployment milestones, as identified in SCE’s Project Management Plan, are
included in the table below. Baseline data was gathered and analyzed prior to asset
deployment, and post-deployment data is gathered and analyzed in accordance with the
project’s Metrics and Benefits Reporting Plan (MBRP) and DOE reporting frequencies (i.e.
Build Metrics reported quarterly and Impact Metrics reported with each TPR). Please refer to
Section 5 of this report for more information regarding Baseline Data, including proposed
timelines, data sources, and analysis methods.
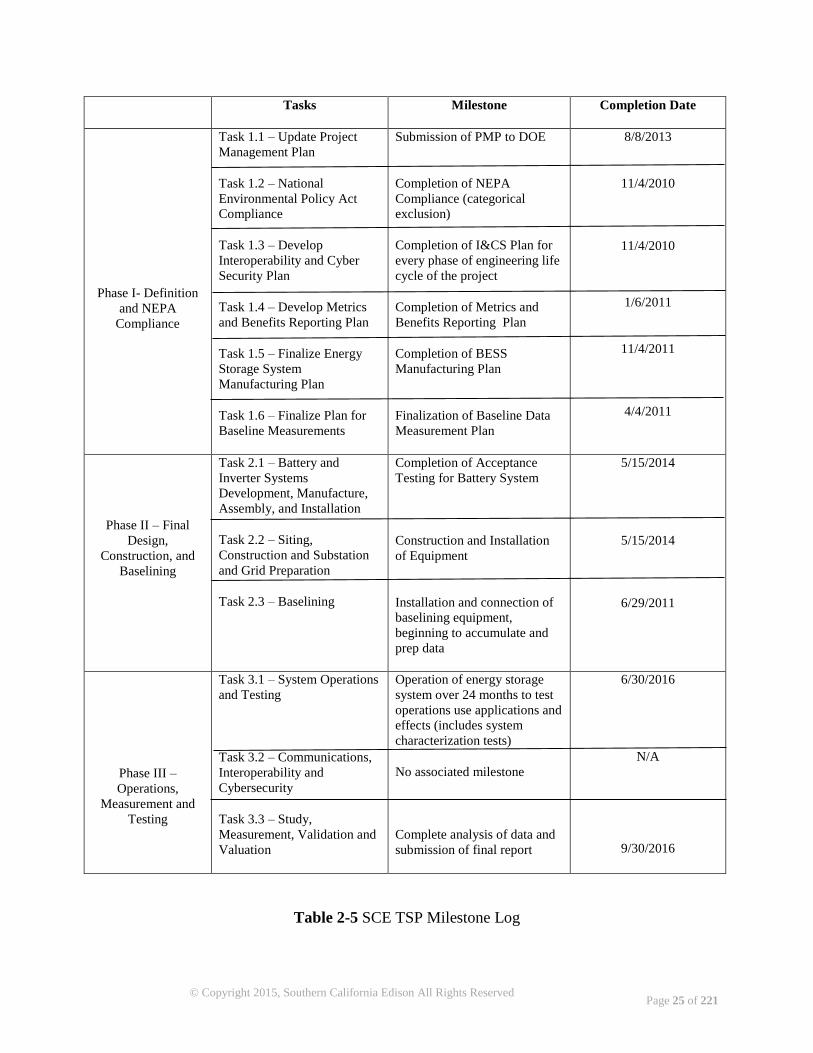
Page 25 of 221
© Copyright 2015, Southern California Edison All Rights Reserved
Tasks Milestone Completion Date
Phase I- Definition
and NEPA
Compliance
Task 1.1 – Update Project
Management Plan
Task 1.2 – National
Environmental Policy Act
Compliance
Task 1.3 – Develop
Interoperability and Cyber
Security Plan
Task 1.4 – Develop Metrics
and Benefits Reporting Plan
Task 1.5 – Finalize Energy
Storage System
Manufacturing Plan
Task 1.6 – Finalize Plan for
Baseline Measurements
Submission of PMP to DOE
Completion of NEPA
Compliance (categorical
exclusion)
Completion of I&CS Plan for
every phase of engineering life
cycle of the project
Completion of Metrics and
Benefits Reporting Plan
Completion of BESS
Manufacturing Plan
Finalization of Baseline Data
Measurement Plan
8/8/2013
11/4/2010
11/4/2010
1/6/2011
11/4/2011
4/4/2011
Phase II – Final
Design,
Construction, and
Baselining
Task 2.1 – Battery and
Inverter Systems
Development, Manufacture,
Assembly, and Installation
Task 2.2 – Siting,
Construction and Substation
and Grid Preparation
Task 2.3 – Baselining
Completion of Acceptance
Testing for Battery System
Construction and Installation
of Equipment
Installation and connection of
baselining equipment,
beginning to accumulate and
prep data
5/15/2014
5/15/2014
6/29/2011
Phase III –
Operations,
Measurement and
Testing
Task 3.1 – System Operations
and Testing
Task 3.2 – Communications,
Interoperability and
Cybersecurity
Task 3.3 – Study,
Measurement, Validation and
Valuation
Operation of energy storage
system over 24 months to test
operations use applications and
effects (includes system
characterization tests)
No associated milestone
Complete analysis of data and
submission of final report
6/30/2016
N/A
9/30/2016
Table 2-5 SCE TSP Milestone Log

Page 26 of 221
© Copyright 2015, Southern California Edison All Rights Reserved
2.8 Report Organization
This report presents the results of project work performed by the TSP project team from inception
of the project through continuation of project plan testing in December, 2015. This report is the
second of three TPRs. In the aggregate, the TPRs will report test results and operational
experience with the TSP over the entire project period expected to continue through June 2016.
Section 4 presents the methodology and approach used by the project to assess and evaluate
performance of the BESS as part of the Measurement and Validation (M&V) preparation phase.
Section 5 presents the summary of the Measurement and Validation Test Plan and Baseline
development. Section 6 identifies the M&V tests conducted, and the results observed. Section 7
presents the BESS performance parameters to be examined. In Section 8, the table of Impact
Metrics is presented and other pertinent data. In Section 9, the Appendices contain test data forms
and miscellaneous information associated with supporting the test results.
Page 27 of 221
© Copyright 2015, Southern California Edison All Rights Reserved
3 Technical Approach - Battery Energy Storage System
3.1 Project History
Project definition for TSP was completed in October 2010, preliminary design work was initiated
in December, and the DOE authorized SCE to start work on all tasks in January 2011. The I&CS
Plan and the MBRP were submitted and approval for the documents occurred in November,
2010 and May 2011 respectively. In parallel, SCE initiated an Interconnection Request with the
CAISO in May, 2011 making allowances for market participation during the M&V period.
The site selected for the BESS was within the perimeter of an existing sub-transmission
substation. The location was chosen based on an earlier study which examined suitable locations
for installation of grid scale energy storage. The Antelope Bailey system was determined to be
a viable candidate based on grid conditions at that time, and the likelihood that a storage device
of the size under consideration could have a measureable impact on grid performance. Monolith
substation was chosen as the BESS site because it was within the Antelope Bailey system, there
was sufficient space to build a facility, and SCE owned the property which allowed for an
immediate start to facility construction.
SCE partnered with A123 at project inception and contracts were issued between A123 and SCE
in February, 2011. A123 chose DynaPower as the supplier for the PCS. Design work continued
through 2011, and a critical design review with A123 was conducted in January, 2012. Contracts
for civil/structural and electrical construction along with a release for procurement of
construction materials were issued in January. Due to concerns with A123 performance
following Q1 financial results disclosure, SCE began a risk evaluation/mitigation process. In
October, 2012 A123 filed for Chapter 11 protection, and the company was later acquired through
auction in January of 2013. In March of 2013, SCE entered into a new contract with LG Chem
Ltd replacing A123 as the battery manufacturer and prime contractor for TSP. An element of
the selection process stipulated that the capability for conducting testing as outlined in the MBRP
would be a requirement. As such, no substantive modifications to the MBRP were required due
to the replacement of BESS vendor.
Based on original plans, the BESS facility (structure and interconnection infrastructure) was
substantially complete at the time of the change to LG Chem. As a result, LG Chem designed
their system to fit within the existing physical confines of the BESS facility. A design review
with LG Chem. occurred in June, 2013, and battery deliveries began in late July. The LG Chem
system matched original design requirements of an 8 MW, 32 MWh lithium ion battery system
utilizing a bi-directional four quadrant smart inverter. The batteries and controls systems fit
within the existing facility, and interconnection facilities including switchgear, step up
transformer, and communications/controls hardware from the previous design were
accommodated by the LG Chem system design. Installation and commissioning of the BESS
was completed in July 2014. Characterization Testing began in 2014 and completed in early
2015. Individual project tests in accordance with the MBRP began in June 2015, following
characterization testing, and continue through December 2015.
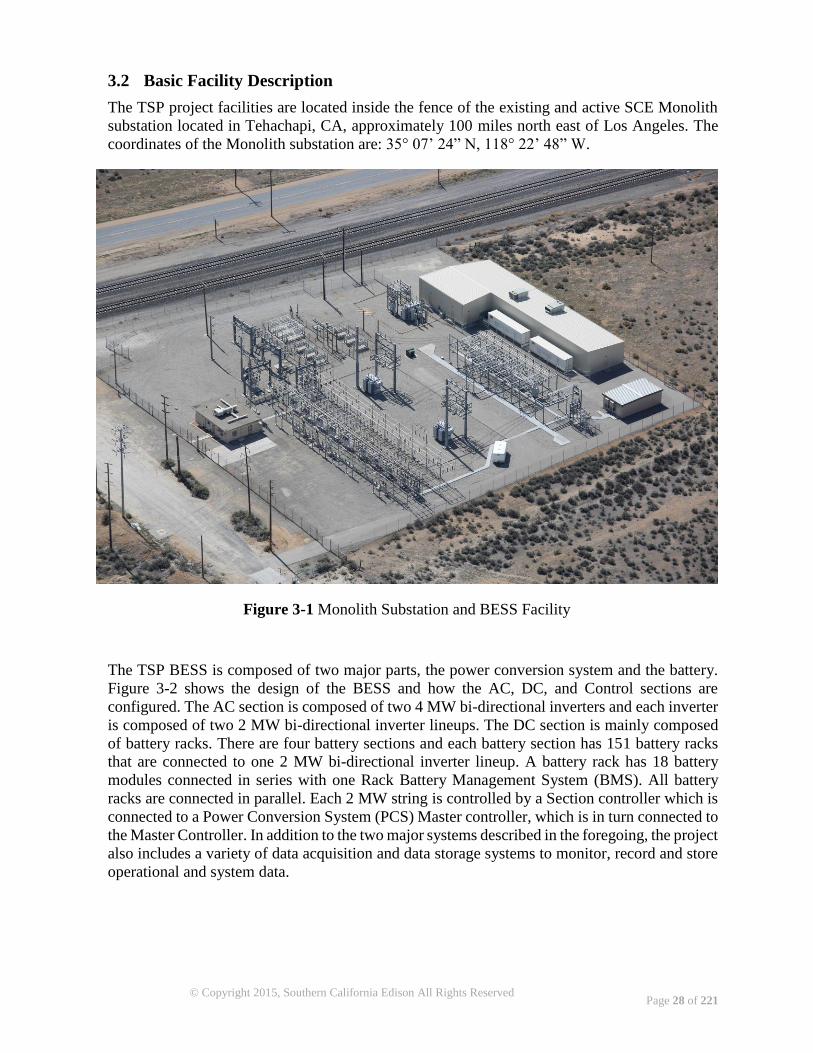
Page 28 of 221
© Copyright 2015, Southern California Edison All Rights Reserved
3.2 Basic Facility Description
The TSP project facilities are located inside the fence of the existing and active SCE Monolith
substation located in Tehachapi, CA, approximately 100 miles north east of Los Angeles. The
coordinates of the Monolith substation are: 35° 07’ 24” N, 118° 22’ 48” W.
Figure 3-1 Monolith Substation and BESS Facility
The TSP BESS is composed of two major parts, the power conversion system and the battery.
Figure 3-2 shows the design of the BESS and how the AC, DC, and Control sections are
configured. The AC section is composed of two 4 MW bi-directional inverters and each inverter
is composed of two 2 MW bi-directional inverter lineups. The DC section is mainly composed
of battery racks. There are four battery sections and each battery section has 151 battery racks
that are connected to one 2 MW bi-directional inverter lineup. A battery rack has 18 battery
modules connected in series with one Rack Battery Management System (BMS). All battery
racks are connected in parallel. Each 2 MW string is controlled by a Section controller which is
connected to a Power Conversion System (PCS) Master controller, which is in turn connected to
the Master Controller. In addition to the two major systems described in the foregoing, the project
also includes a variety of data acquisition and data storage systems to monitor, record and store
operational and system data.
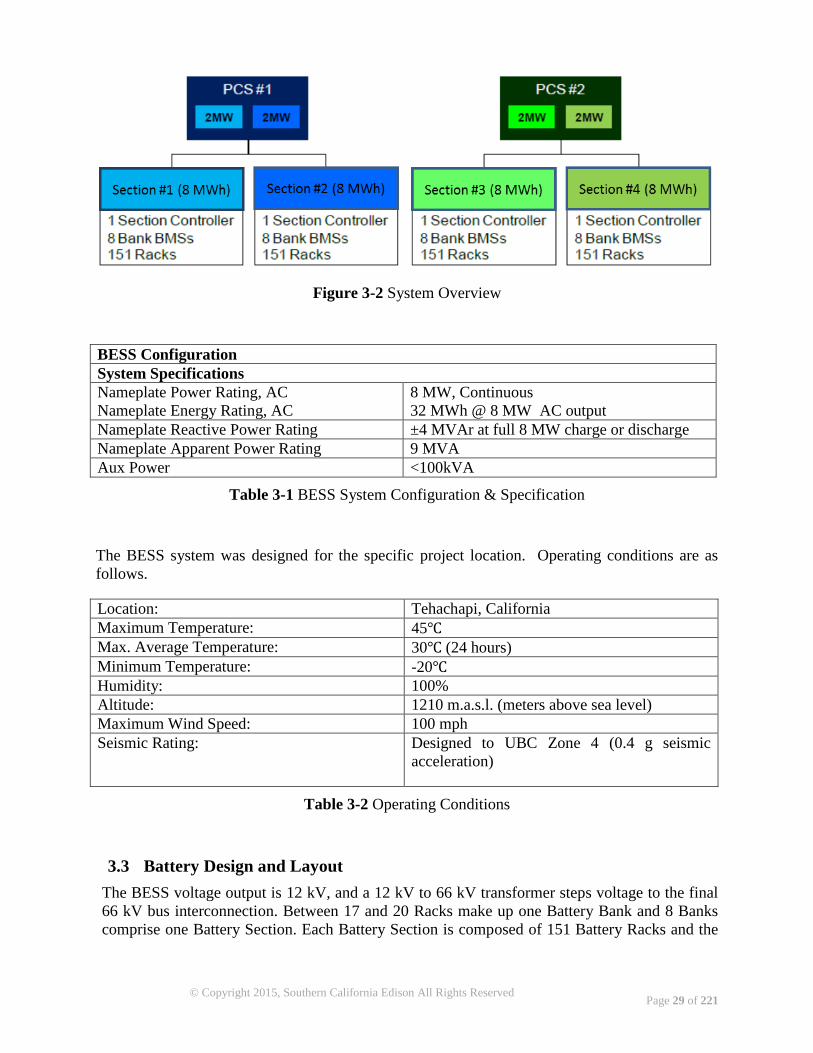
Page 29 of 221
© Copyright 2015, Southern California Edison All Rights Reserved
Figure 3-2 System Overview
BESS Configuration
System Specifications
Nameplate Power Rating, AC
Nameplate Energy Rating, AC
8 MW, Continuous
32 MWh @ 8 MW AC output
Nameplate Reactive Power Rating ±4 MVAr at full 8 MW charge or discharge
Nameplate Apparent Power Rating 9 MVA
Aux Power <100kVA
Table 3-1 BESS System Configuration & Specification
The BESS system was designed for the specific project location. Operating conditions are as
follows.
Location: Tehachapi, California
Maximum Temperature: 45℃
Max. Average Temperature: 30℃ (24 hours)
Minimum Temperature: -20℃
Humidity: 100%
Altitude: 1210 m.a.s.l. (meters above sea level)
Maximum Wind Speed: 100 mph
Seismic Rating: Designed to UBC Zone 4 (0.4 g seismic
acceleration)
Table 3-2 Operating Conditions
3.3 Battery Design and Layout
The BESS voltage output is 12 kV, and a 12 kV to 66 kV transformer steps voltage to the final
66 kV bus interconnection. Between 17 and 20 Racks make up one Battery Bank and 8 Banks
comprise one Battery Section. Each Battery Section is composed of 151 Battery Racks and the
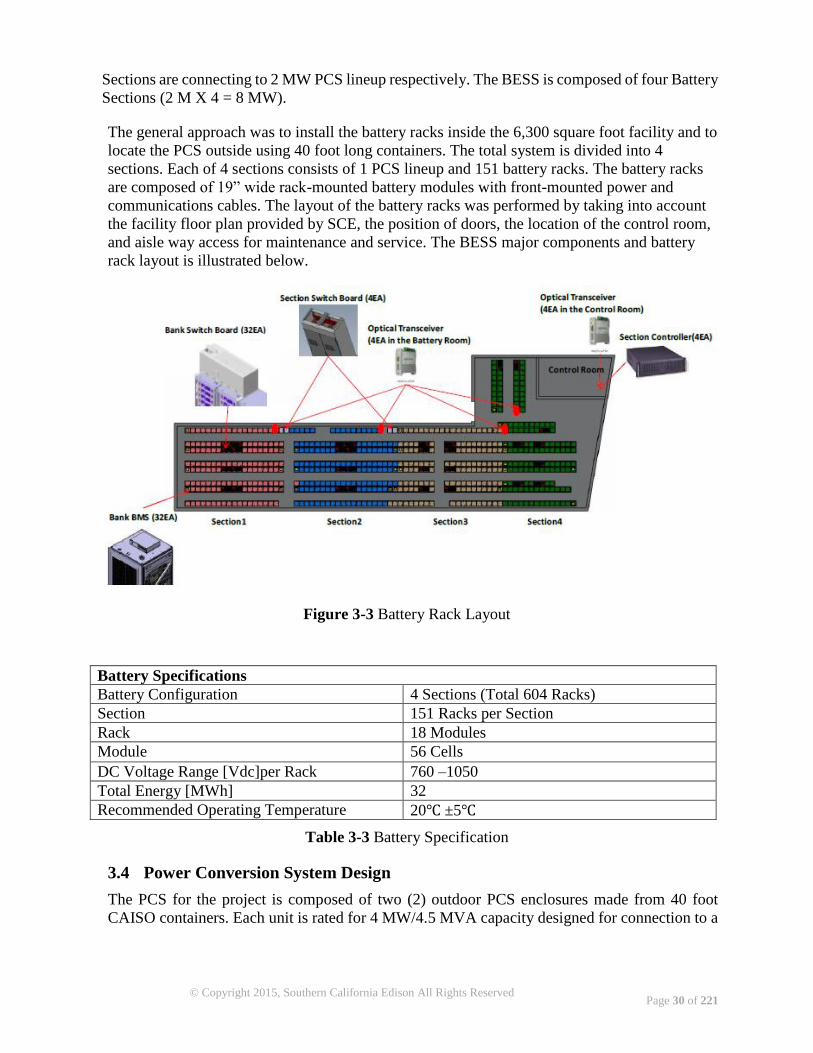
Page 30 of 221
© Copyright 2015, Southern California Edison All Rights Reserved
Sections are connecting to 2 MW PCS lineup respectively. The BESS is composed of four Battery
Sections (2 M X 4 = 8 MW).
The general approach was to install the battery racks inside the 6,300 square foot facility and to
locate the PCS outside using 40 foot long containers. The total system is divided into 4
sections. Each of 4 sections consists of 1 PCS lineup and 151 battery racks. The battery racks
are composed of 19” wide rack-mounted battery modules with front-mounted power and
communications cables. The layout of the battery racks was performed by taking into account
the facility floor plan provided by SCE, the position of doors, the location of the control room,
and aisle way access for maintenance and service. The BESS major components and battery
rack layout is illustrated below.
Figure 3-3 Battery Rack Layout
Battery Specifications
Battery Configuration 4 Sections (Total 604 Racks)
Section 151 Racks per Section
Rack 18 Modules
Module 56 Cells
DC Voltage Range [Vdc]per Rack 760 –1050
Total Energy [MWh] 32
Recommended Operating Temperature 20℃ ±5℃
Table 3-3 Battery Specification
3.4 Power Conversion System Design
The PCS for the project is composed of two (2) outdoor PCS enclosures made from 40 foot
CAISO containers. Each unit is rated for 4 MW/4.5 MVA capacity designed for connection to a
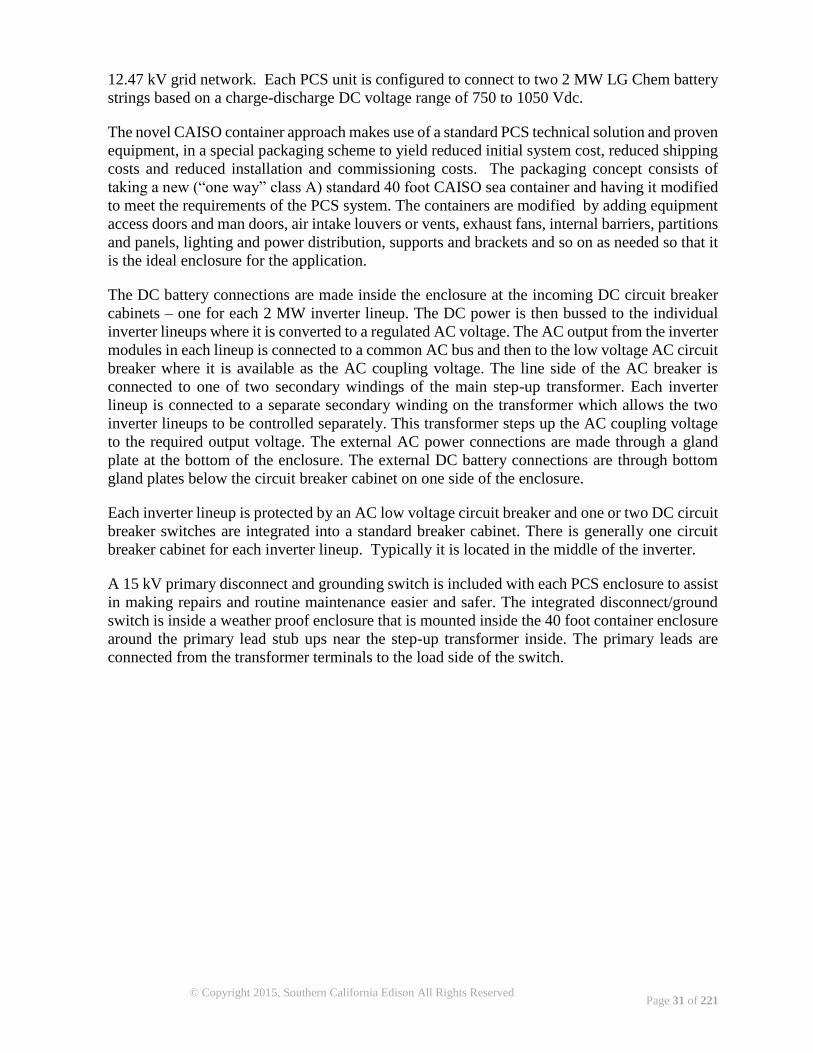
Page 31 of 221
© Copyright 2015, Southern California Edison All Rights Reserved
12.47 kV grid network. Each PCS unit is configured to connect to two 2 MW LG Chem battery
strings based on a charge-discharge DC voltage range of 750 to 1050 Vdc.
The novel CAISO container approach makes use of a standard PCS technical solution and proven
equipment, in a special packaging scheme to yield reduced initial system cost, reduced shipping
costs and reduced installation and commissioning costs. The packaging concept consists of
taking a new (“one way” class A) standard 40 foot CAISO sea container and having it modified
to meet the requirements of the PCS system. The containers are modified by adding equipment
access doors and man doors, air intake louvers or vents, exhaust fans, internal barriers, partitions
and panels, lighting and power distribution, supports and brackets and so on as needed so that it
is the ideal enclosure for the application.
The DC battery connections are made inside the enclosure at the incoming DC circuit breaker
cabinets – one for each 2 MW inverter lineup. The DC power is then bussed to the individual
inverter lineups where it is converted to a regulated AC voltage. The AC output from the inverter
modules in each lineup is connected to a common AC bus and then to the low voltage AC circuit
breaker where it is available as the AC coupling voltage. The line side of the AC breaker is
connected to one of two secondary windings of the main step-up transformer. Each inverter
lineup is connected to a separate secondary winding on the transformer which allows the two
inverter lineups to be controlled separately. This transformer steps up the AC coupling voltage
to the required output voltage. The external AC power connections are made through a gland
plate at the bottom of the enclosure. The external DC battery connections are through bottom
gland plates below the circuit breaker cabinet on one side of the enclosure.
Each inverter lineup is protected by an AC low voltage circuit breaker and one or two DC circuit
breaker switches are integrated into a standard breaker cabinet. There is generally one circuit
breaker cabinet for each inverter lineup. Typically it is located in the middle of the inverter.
A 15 kV primary disconnect and grounding switch is included with each PCS enclosure to assist
in making repairs and routine maintenance easier and safer. The integrated disconnect/ground
switch is inside a weather proof enclosure that is mounted inside the 40 foot container enclosure
around the primary lead stub ups near the step-up transformer inside. The primary leads are
connected from the transformer terminals to the load side of the switch.
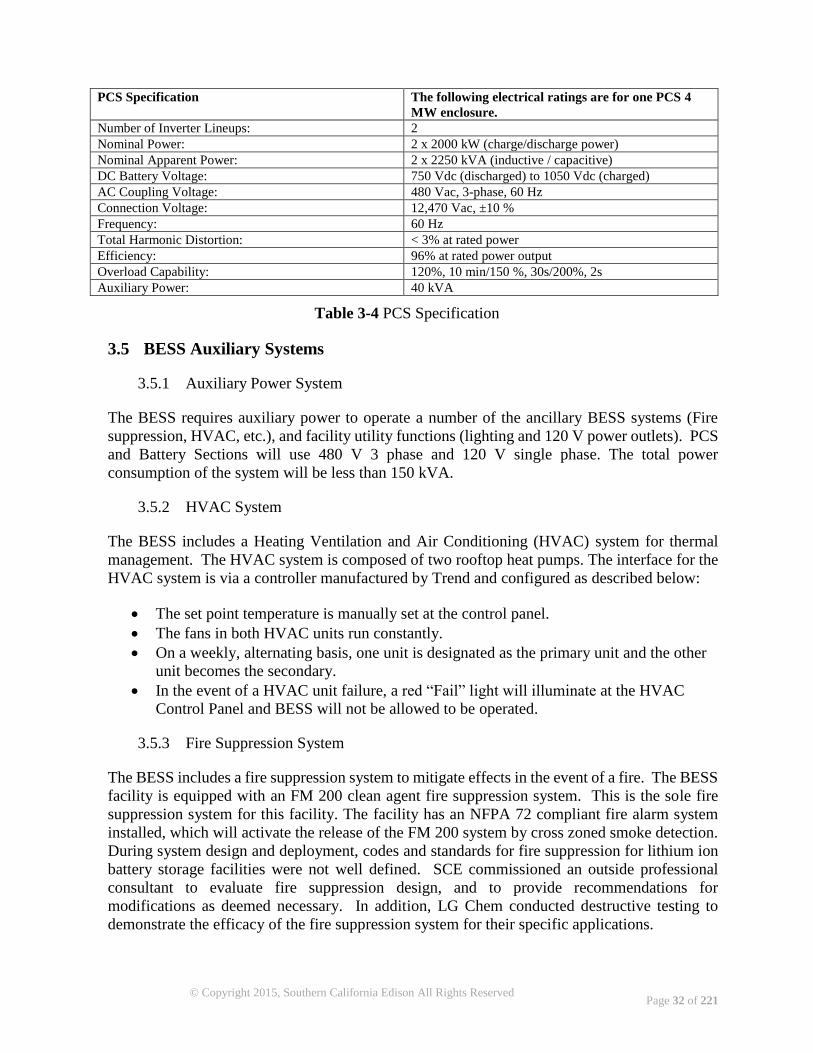
Page 32 of 221
© Copyright 2015, Southern California Edison All Rights Reserved
PCS Specification The following electrical ratings are for one PCS 4
MW enclosure.
Number of Inverter Lineups: 2
Nominal Power: 2 x 2000 kW (charge/discharge power)
Nominal Apparent Power: 2 x 2250 kVA (inductive / capacitive)
DC Battery Voltage: 750 Vdc (discharged) to 1050 Vdc (charged)
AC Coupling Voltage: 480 Vac, 3-phase, 60 Hz
Connection Voltage: 12,470 Vac, ±10 %
Frequency: 60 Hz
Total Harmonic Distortion: < 3% at rated power
Efficiency: 96% at rated power output
Overload Capability: 120%, 10 min/150 %, 30s/200%, 2s
Auxiliary Power: 40 kVA
Table 3-4 PCS Specification
3.5 BESS Auxiliary Systems
3.5.1 Auxiliary Power System
The BESS requires auxiliary power to operate a number of the ancillary BESS systems (Fire
suppression, HVAC, etc.), and facility utility functions (lighting and 120 V power outlets). PCS
and Battery Sections will use 480 V 3 phase and 120 V single phase. The total power
consumption of the system will be less than 150 kVA.
3.5.2 HVAC System
The BESS includes a Heating Ventilation and Air Conditioning (HVAC) system for thermal
management. The HVAC system is composed of two rooftop heat pumps. The interface for the
HVAC system is via a controller manufactured by Trend and configured as described below:
The set point temperature is manually set at the control panel.
The fans in both HVAC units run constantly.
On a weekly, alternating basis, one unit is designated as the primary unit and the other
unit becomes the secondary.
In the event of a HVAC unit failure, a red “Fail” light will illuminate at the HVAC
Control Panel and BESS will not be allowed to be operated.
3.5.3 Fire Suppression System
The BESS includes a fire suppression system to mitigate effects in the event of a fire. The BESS
facility is equipped with an FM 200 clean agent fire suppression system. This is the sole fire
suppression system for this facility. The facility has an NFPA 72 compliant fire alarm system
installed, which will activate the release of the FM 200 system by cross zoned smoke detection.
During system design and deployment, codes and standards for fire suppression for lithium ion
battery storage facilities were not well defined. SCE commissioned an outside professional
consultant to evaluate fire suppression design, and to provide recommendations for
modifications as deemed necessary. In addition, LG Chem conducted destructive testing to
demonstrate the efficacy of the fire suppression system for their specific applications.
Page 33 of 221
© Copyright 2015, Southern California Edison All Rights Reserved
The system is a pressurized gas system delivered via overhead piping and ceiling mounted open
discharge nozzles, designed for total flooding of the fire area with a pre-established concentration
by volume of the extinguishing media. This is a commonly available clean agent system which
suppresses fires by a combination of chemical and physical mechanisms that still maintains
breathable oxygen levels. The system is to be released by cross zoned smoke detection devices
as part of the facility’s fire alarm system.
3.6 TSP Data Acquisition System
A one-line schematic of the Data Acquisition System (DAS) is provided in the Figure 3-4 below.
Energy Management System (EMS) SCADA historical data is available for the transmission
system and for the wind farms. The EMS SCADA data will be used in conjuction with data
collected during the year prior to BESS operation to establish baseline information. Power
Quality Meters (PQM) data will also be available locally at the BESS, and at remote adjacent
substations (Cal-Cement, and Goldtown). In addition, a Phasor Measurement Unit (PMU) with
digital fault recorder data will be available at Monolith. These PMU/PQMs and the EMS
SCADA system will capture the transmission system data needed to demonstrate the ability of
the BESS to perform the 13 operational uses and to assess the value of the BESS’s benefit.
The project has defined eight tests that will be conducted during the demonstration period. Data
obtained from these eight tests will be used in different combinations to demonstrate the BESS’s
ability to perform the 13 operational use cases. Transmission data to be captured during these
tests includes:
66 kV substation bus voltage
Transmission line load profiles and transmission losses
Wind generation profiles
Wind curtailment events
CAISO congestion – magnitudes and costs
CAISO frequency response requirements and the response provided by the BESS over
time
CAISO spin/non-spin reserve requirements and the response provided by the BESS over
time
CAISO generation reserve requirements and the response provided by the BESS over
time
CAISO energy price signals and the charge and discharge patterns of the BESS
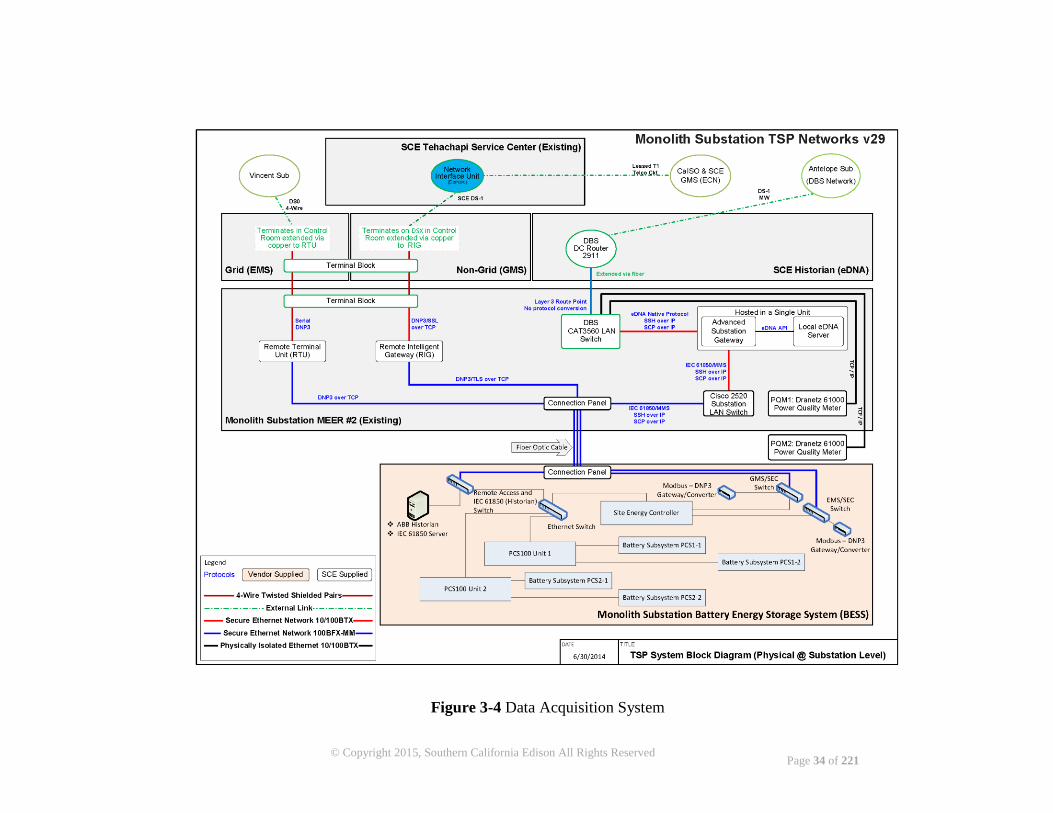
Page 34 of 221
© Copyright 2015, Southern California Edison All Rights Reserved
Figure 3-4 Data Acquisition System
Page 35 of 221
© Copyright 2015, Southern California Edison All Rights Reserved
4 Measurement and Validation Strategy
4.1 Methodology and Approach
The TSP BESS is installed on the sub-transmission system at the Monolith substation 66 kV bus.
The BESS system data collected will be used to help SCE quantify the TSP’s potential effects
on transmission capacity and load requirements and thereby allow SCE to evaluate the ability of
the BESS to reduce congestion and improve the integration of wind generation into the grid. The
project team will analyze the data that is archived continuously from the Supervisory Control
and Data Acquisition (SCADA) historian database as its primary source, while using data
sources from event-driven substation recording devices to supplement the analysis. Formal
testing will begin in January 2015 and will continue through June 2016.
An M&V Test Plan was developed to evaluate the effectiveness of the BESS in the Monolith
substation in accordance with the MBRP. The testing protocol of eight (8) tests was developed
to align with the operational use cases. The test plan specifies the data to be collected, how
frequently, and what observations are critical for the analysis. The test plan and operational uses
will be discussed in subsequent sections of this report.
The overall approach to M&V is to evaluate the instantaneous and steady-state or trending
measurement data over a specified time period set aside for specific system tests. Using post-
processing, the data will be analyzed by system engineers to verify the system response as
expected or observed from the simulations. It is expected that this approach will produce “big
data” that will be subject to data mining techniques.
Data mining techniques will be used to manage the big data to identify specific conditions that
support the operational uses discussed as part of the research objectives. Since the wind
generation is basically unchanged and local customer loads are relatively the same, these
conditions are more than likely to occur again. Data mining techniques looks at the statistical
probability of historic wind generation patterns and “predicts” when, how often and where the
project team should analyze the test year data. Those prescribed periods are then identified and
the BESS response is observed. The project team then determines, based on the data and
observations, that the BESS response is appropriate, and whether or not it can scale up to a larger
system. This approach relies on engineering experience and judgment to prove or disprove the
hypothesis that a larger BESS, if in a specific location, can provide significant and measureable
benefits to the surrounding system.
SCE captures data from its SCADA historian database (eDNA) which records 4-second
instantaneous measurements; and a Phasor Measurement Unit (PMU) in the Monolith substation
captures event data at a rate of 30 samples per second. In addition the PMU at Monolith
Substation is a Digital Fault Recorder (DFR)/PMU device able not only to record RMS voltages
and currents but also sinusoidal waveforms able to capture high frequency transient data.
All of the above sources provide physical data inputs to the engineering analysis which becomes
the basis for the impact metrics. The project team will have at its disposal a RTDS (a parallel
processor computer used to simulate the power system in real time) to simulate system
Page 36 of 221
© Copyright 2015, Southern California Edison All Rights Reserved
performance in cases where it is physically impractical to conduct field tests in an operational
substation. Additionally, when an expected event doesn’t occur under normal operating
conditions (such as a fault, line trip, or contingency) this “test condition” can be simulated and
analyzed on the RTDS. More information on the use of RTDS is found in the appendices.
During 2015, the Cal State Polytechnic University Pomona team focused on Modeling &
Performance studies, Data Reduction & Analysis, and discussed some R & D Projects with faculty
and students. The Pomona team subsequently designed, developed and tested some different
examples of the system. The team reviewed test results and built a small prototype system which was
documented as a comprehensive tutorial that would be beneficial for anyone that is either new to the
RTDS or for use as a refresher course.
In addition to the RTDS, SCE utilized General Electric Positive Sequence Load Flow (PSLF)
steady-state and dynamic modeling to observe system conditions in a simulation environment
for the same reasons the RTDS was used. PSLF is a standard tool utilized by operation engineers
and transmission planners on which system performance is evaluated under various
contingencies. It was early PSLF studies which identified the current location of the BESS for
its potential benefits to the adjacent wind farms due to transmission contingencies. More
information on the use of PSLF is found in the appendices.
Some system conditions are expected under normal operating conditions such as high wind
generation and a low local load which produce a large amount of export energy from the region.
Based on past experience, these periods are predictable and are anticipated. Although these
conditions historically have produced stress on the system, it does not demonstrate the type of
stress caused by a system event such as a fault or by wind gusts causing unusually high wind
ramp rates. Therefore, the approach is to capture data for both types of scenarios. SCADA data
is the primary source for steady-state or trend data, while the PMU and DFR will be the primary
source for transient type event.
Project TPRs will also provide information about wind generation availability, variability, and
capacity. Working with the CAISO, SCE will evaluate the ability of the BESS smart inverter to
follow operator and market signals to provide ancillary services and arbitrage market prices. To
that end, some non-EMS data will be observed and analyzed for its relation to BESS
performance.
The ability of the BESS to respond to CAISO market signals or its ability to follow a prescribed
schedule as a result of being awarded for an acceptable bid into the market will be examined.
The intent of the first year of operation is to let the SCE Energy Operations Group simulate
market awards and dispatches to the BESS control system. The Energy Operations Group will
observe the operation of the BESS to respond to CAISO signals via the RIG and make an
assessment whether the BESS would pass CAISO requirements as a market resource. The plan
is to set up prescribed charge/discharge schedules in year 1 that would test the capability of the
BESS to follow regimented patterns. Concurrently, the project team will collect data and note
system conditions and opportunities via data mining to further support one or more of the 13
operational uses.
Page 37 of 221
© Copyright 2015, Southern California Edison All Rights Reserved
During year 2 of the BESS field test, the SCE Energy Procurement & Management Group are
taking the lessons learned from initial operations and actually bid the BESS into the CAISO
market with real financial implications and exposure. This activity will be conducted under the
close scrutiny of the project team while monitoring the BESS performance and benefits under
real market conditions. Since issue of TPR #1, the project team has split the market testing into
two parts. Part 1 is a simulation of market dispatch signals and AGC signals that represent flat
schedules and varied AGC signals. Part 2 is an actual market based demonstration that will have
Bids, Awards, and Dispatches from the ISO systems as if it was a wholesale market resource.
This includes all the groups in SCE’s Energy Procurement Management (EPM) from market
planning to settlements.
Additionally, key performance factors for BESS applications such as energy capacity
degradation, round trip efficiency, and thermal performance will be reported.
4.2 Operational Uses
As referenced previously, SCE has identified operational uses to be evaluated as part of the TSP.
Each of the 13 use cases and the associated evaluation methodology are summarized below.
Modeling and/or simulation may be used in some instances to scale results to better understand
potential and other impacts of the BESS.
4.2.1 Transmission Uses
4.2.1.1 Voltage Support/Grid Stabilization
Steady state and dynamic voltage regulation testing will be conducted locally (Monolith 66
kV bus voltage profile). This will provide data for real and reactive power (power factor),
and storage system dispatch metrics. Existing EMS SCADA data collection systems, along
with PMU/Digital Fault Recorder (DFR)/Power Quality Monitor (PQM) devices will be
used to collect and archive event data. PSLF and the RTDS will be used for simulation and
validation.
4.2.1.2 Decreased Transmission Losses
Transmission losses for the affected system under study will be evaluated by monitoring
real-time transmission line loading. Existing EMS SCADA data collection systems, along
with PMU/DFR/PQM devices will be used to collect and archive field data. The RTDS will
be used for simulation and validation.
4.2.1.3 Diminished Congestion
Effectiveness of the BESS to diminish congestion will be measured by the reduction of
transmission line loading wind generation curtailment and/or the frequency of wind
curtailment events. This will be provided through system operator control of on-peak
charging and off-peak discharging of the BESS. Existing EMS SCADA data collection
systems along with PMU/DFR/PQM devices will be used to collect and archive data. The
RTDS will be used for simulation and validation.
Page 38 of 221
© Copyright 2015, Southern California Edison All Rights Reserved
4.2.1.4 Increased System Reliability by Load Shed Deferral
Effectiveness of the BESS to increase system reliability through load shed deferral will be
measured by the reduction of load shedding events and increased power flow into the area.
This will be provided through system operator control of the storage system; charging
during high wind and discharging during low wind. Existing EMS SCADA data collection
systems along with PMU/DFR/PQM devices will be used to collect and archive data. The
RTDS will be used for simulation and validation.
4.2.1.5 Deferred Transmission Investment
The suitability of the BESS to allow for deferred transmission investment will be evaluated
as part of the TSP. Transmission load profile and storage system dispatch data will be
collected to determine transmission line loading, transmission losses, congestion, and
congestion costs. Comparison of this data against current transmission plans will provide
a means to support deferral of transmission investment. Existing EMS SCADA data
collection systems along with PMU/DFR/PQM devices will be used to collect and archive
data. The RTDS will be used for simulation and validation. It should be noted that since
the initiation of this project, SCE has completed a large transmission investment in this area,
which may reduce the ability to evaluate this usage.
4.2.1.6 Optimized Size and Cost of Renewable Energy-Related Transmission
The ability to reduce cost and optimize size of renewable energy related transmission will
be measured by comparing the projected differences in the required transmission line
capacity. Wind generation profiles and storage dispatch data will be used to draw these
comparisons.
4.2.2 System Uses
4.2.2.1 Provide System Capacity/Resource Adequacy
System capacity and resource adequacy will be evaluated based on the required generation
reserves relative to total wind generation injecting power into the Monolith substation. Pre
and post installation values will be compared to determine the effect of the BESS.
4.2.2.2 Renewable Energy Integration (Smoothing)
Power output and voltage fluctuations before and after BESS installation will be compared
to determine the effect of the BESS. Existing EMS SCADA data collection systems along
with PMU/DFR/PQM devices will be used to collect and archive data. The RTDS will be
used for simulation and validation.
4.2.2.3 Wind Generation Output Shifting
Our objective is to determine the BESS’s ability to shift wind generation output from lower
cost off-peak times to higher cost, on-peak times. The battery will be charged at night and
discharged during the day. The cost difference between energy during discharge and charge
cycles will be evaluated to determine the benefits.
Page 39 of 221
© Copyright 2015, Southern California Edison All Rights Reserved
4.2.3 CAISO Market Uses
4.2.3.1 Frequency Regulation
Our objective is to determine if the BESS can provide frequency regulation as directed by
CAISO Automated Generation Control (AGC) signal. The results will demonstrate the
system’s ability to follow schedule.
4.2.3.2 Spin/non-Spin Replacement Reserves
The objective is to determine if the BESS can supply power in non-spinning and spinning
situations as directed by the CAISO automated dispatch system (ADS) signal. The
evaluation will determine the quantity and financial value of displaced operating reserves.
4.2.3.3 Deliver Ramp Rate
The output from the BESS controller will be monitored to verify the ability to follow CAISO
signals. The accuracy will be expressed in terms of the percentage deviation from schedule.
4.2.3.4 Energy Price Arbitrage
The cost difference between energy during discharge and charge cycles at both peak and
off-peak hours will be evaluated. The output from the BESS controller will be monitored
to verify the ability to follow CAISO market signals.
4.3 Baseline Development
4.3.1 Overview
Baseline development was completed during the second half of 2014. Collection of baseline
data for the project includes data from the region before and after the recent system
upgrades. Establishing a baseline set of conditions of the system prior to BESS connection,
and providing monthly status updates and periodic update reports as to trends and findings,
are important aspects of the original plan for this project. Baseline report data and
information will be used in Technical Performance, Impact Metrics, and Final Reports
defined by the MBRP. The Baseline Data Analysis & pre-M&V modeling is specifically
tailored to support the requirements of the TSP Test Plan. For reasons set forth below, the
approach for developing and using a baseline was revised, due to changes in the
transmission system in the Tehachapi area.
4.3.2 The Role of a Baseline in Measurement and Validation for the TSP Performance
Evaluation
A baseline is a set of measured values before a test is conducted, against which comparable
values collected during the test are to be compared to verify that changes in system response
to the test can be validly attributed to the TSP and not to changes in other conditions.
Therefore, the purpose of a baseline is to set a standard of system response to events if the
TSP were not in service. Such events are of four types:
Page 40 of 221
© Copyright 2015, Southern California Edison All Rights Reserved
1. Spontaneous events. Examples include faults, unintended line trips, load changes, and
excursions in wind speed affecting generation.
2. Operational actions. These are intentional changes affecting other system elements
for reasons unrelated to the operation or testing of the TSP. Examples include changed
generation dispatch, voltage targets, line or capacitor status, transformer taps.
3. System response tests. These involve intentional changes to other system elements to
which the TSP is to respond which will be followed by a reversal to bring the system
back to its prior condition. The actions performed are similar to type 2 above but the
intent is to test the TSP.
4. Local tests. These involve intentional changes in the set points or dispatch of the TSP
itself, to be followed by a reversal to bring the system and the TSP back to their prior
condition.
Events of the first and second types occur routinely during the operation of a power system.
The intentional changes in the third type of event can be applied during either baseline or
test conditions. Events of the fourth type are not meaningful unless the TSP is in service.
4.3.3 Requirements for a Valid Baseline
A baseline is valid if and only if system conditions have not been changed in a way that will
affect the values recorded. The data collected in years 2010-2011 for the Tehachapi area
includes some variables, such as local load and wind generation, which are expected to
follow similar patterns in the future, because the installed equipment and the climactic
conditions are not known to have experienced material change. However the installation of
new 230/66 kV transformers at Windhub, the separation of the Antelope – Bailey area into
two parts, and the reconfiguration of the 66 kV lines in the Tehachapi area to radially feed
into Windhub (together referred to as the Eastern Kern Wind Resource Area - EKWRA
Project) mean that the data collected is not a valid baseline for such quantities as congestion
and voltage.
4.3.4 Alternatives to Use of Historical Data as a Baseline
Not all of the tests to be performed would depend on a baseline even if one were available.
Several tests to demonstrate the response of the system to a signal from the CAISO to the
TSP cannot be compared to a baseline, as if there were no TSP there would be nothing to
send the signal to.
One type of baseline which can be applied is to utilize the TSP for only a portion of a test
and compare responses during the two periods. Some tests are designed to be conducted
during special conditions such as a certain combination of wind generation and load, it is
beneficial to compare the system response with and without TSP for a portion of the test
since it can fully utilizing the limited occurrence of the required condition.
Due to the EKWRA project strength the system in the area, it is possible that the impact of
BESS is not as significant as in the initial engineering studies and analysis of the
transmission assets in the Tehachapi region. As needed, it is beneficial to form the baseline
Page 41 of 221
© Copyright 2015, Southern California Edison All Rights Reserved
by simulating the effect of a test using PSLF and to compare the simulated response to that
observed in the field.
4.4 Data Collection and Analysis
Energy Management System (EMS) SCADA historical data is available to the project for the
transmission system and for the wind farms. EMS SCADA data in conjuction with data collected
during the year prior to BESS operation, was used to establish baseline information. This
baseline data was also used to determine optimum periods for specific tests. The EMS SCADA
will capture transmission system data needed to demonstrate the ability of the BESS to perform
the 13 operational uses and to assess the value of the BESS’s benefit. SCE has defined eight
tests that will be conducted during the demonstration period. Data obtained from these eight
tests will be used in different combinations to demonstrate the BESS’s ability to perform against
the 13 operational use cases.
Briefly, the eight tests will be designed to measure the BESS’s ability to respond to the following
system needs or signals:
1) Provide steady state voltage regulation at the local Monolith 66 kV bus
2) Provide steady state voltage regulation at the local Monolith 66 kV bus while performing
any other tests
3) Charge during periods of high wind and discharge during low wind under SCE system
operator control
4) Charge during off-peak periods and discharge during on-peak periods under SCE system
operator control
5) Charge and discharge seconds-to-minutes as needed to smooth intermittent generation in
response to a real-time signal
6) Respond to CAISO control signals to provide frequency response
7) Respond to CAISO control signals to provide spin/non-spin reserves
8) Follow a CAISO market signal for energy price
SCE expects that each of the above tests will be conducted independently. In addition, some of
the tests will also be conducted concurrently in various combinations (stacking) to develop an
understanding of an operator’s ability to deploy the BESS for multiple operational uses
simultaneously. The ability to respond to multiple uses will be an important factor in
determining the cost effecetivness of the battery system. The table below shows which tests are
expected to provide data for each of the operational uses.

Page 42 of 221
© Copyright 2015, Southern California Edison All Rights Reserved
Table 4-1 System Test and Operational Use Matrix
4.4.1 Steady State Data Collection
The principal source for system steady state data is the EMS SCADA data historian which
records 4 second instantaneous values continuously. This data, which is time stamped, is
archived for the duration of the project in a separate server for this data called eDNA. eDNA is
the corporate depository of practically all electrical measurements providing ample data to
support analyses of the battery system’s effect on the grid system as a whole.
Transmission data to be captured during these tests includes:
Wind generation
66 kV substation bus voltages at Monolith and Windhub
Loading on the following transmission lines
o Monolith – Breeze 66 kV line 1 and 2
o Monolith – Cummings 66 kV line
o Monolith – Loraine 66 kV line
o Monolith – Cal Cement 66 kV line
o Monolith – MidWind 66 kV line
o Monolith – ArbWind 66 kV line
In addition to the physical data, non-EMS data such as information provided by CAISO were
captured during these tests include:
Frequency response requirements and the response provided by the BESS over time
Spin/non-spin reserve requirements and the response provided by the BESS over time
Generation reserve requirements and the response provided by the BESS over time
1 2 3 4 5 6 7 8
1 X X
2 X
3 X
4 X
5 X X
6 X X
7 X
8 X
9 X
10 X
11 X
12 X X
13 X
Operational UseTest
Tra
nsm
issio
nS
yste
mC
AIS
O
Ma
rke
t
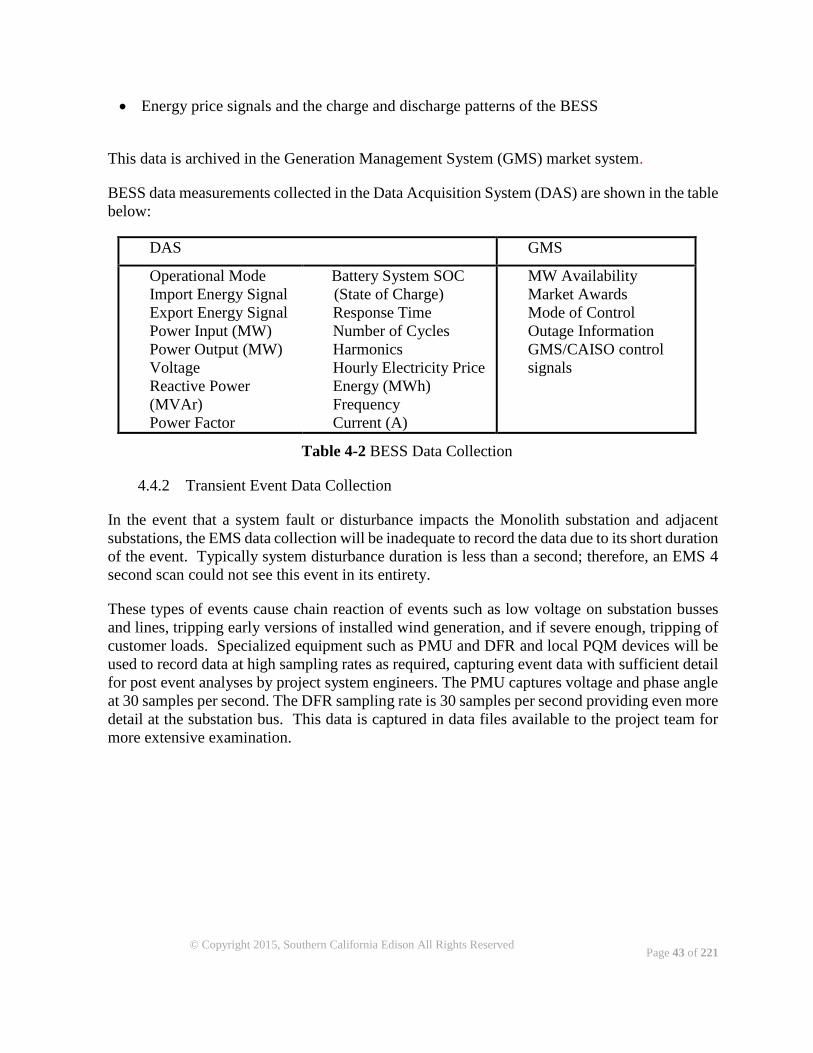
Page 43 of 221
© Copyright 2015, Southern California Edison All Rights Reserved
Energy price signals and the charge and discharge patterns of the BESS
This data is archived in the Generation Management System (GMS) market system.
BESS data measurements collected in the Data Acquisition System (DAS) are shown in the table
below:
DAS GMS
Operational Mode
Import Energy Signal
Export Energy Signal
Power Input (MW)
Power Output (MW)
Voltage
Reactive Power
(MVAr)
Power Factor
Battery System SOC
(State of Charge)
Response Time
Number of Cycles
Harmonics
Hourly Electricity Price
Energy (MWh)
Frequency
Current (A)
MW Availability
Market Awards
Mode of Control
Outage Information
GMS/CAISO control
signals
Table 4-2 BESS Data Collection
4.4.2 Transient Event Data Collection
In the event that a system fault or disturbance impacts the Monolith substation and adjacent
substations, the EMS data collection will be inadequate to record the data due to its short duration
of the event. Typically system disturbance duration is less than a second; therefore, an EMS 4
second scan could not see this event in its entirety.
These types of events cause chain reaction of events such as low voltage on substation busses
and lines, tripping early versions of installed wind generation, and if severe enough, tripping of
customer loads. Specialized equipment such as PMU and DFR and local PQM devices will be
used to record data at high sampling rates as required, capturing event data with sufficient detail
for post event analyses by project system engineers. The PMU captures voltage and phase angle
at 30 samples per second. The DFR sampling rate is 30 samples per second providing even more
detail at the substation bus. This data is captured in data files available to the project team for
more extensive examination.
Page 44 of 221
© Copyright 2015, Southern California Edison All Rights Reserved
5 Measurement and Validation Test Plan Summary
5.1 Baseline Data Analysis
Two years (2010 through 2011) of data was collected and analyzed to guide the project team
for the optimum times to implement specific tests. For example, system engineers recalled that
problems in the system exacerbated during times of high wind generation and low local load.
The baseline data provided insight as described below on the seasonality and time of day
sensitivity for the voltage tests. This data included:
EMS Data:
i. Monolith Substation 66 kV bus voltage
ii. Monolith Capacitor Bank Status
iii. Monolith substation real power profiles
iv. Line load profiles on seven 66 kV transmission lines of interest :
Monolith – Sub Tran Lines BO-HA-LO-WB (Monolith – Loraine line)
Monolith – Sub Tran Lines BREEZE1
Monolith – Sub Tran Lines BREEZE2
Monolith – Sub Tran Lines CAL-GOL-WIN (Monolith – MidWind line)
Monolith – Sub Tran Lines CAL-ROS-WIN (Monolith – ArbWind line)
Monolith – Sub Tran Lines CAL-WINDP (Monolith – Cal Cement line)
Monolith – Sub Tran Lines CUMMINGS
v. Area wind farm generation profiles.
Non EMS Data:
vi. Area wind farm curtailments requiring compensation
vii. System disturbance
viii. CAISO locational marginal pricing
Statistical methodologies were used to analyze two-year’s data. The collected load data was
normalized to the peak value observed, termed a “load factor”. The normalized data was
summarized for time periods distinguished by:
• Calendar month
• Period within the day: six four hour periods, period 1 beginning at midnight and ending at
4:00 AM, period 2 beginning at 4:00 AM and ending at 8:00 AM, etc.
Wind generation data was normalized and summarized for the same periods. The resulting
metric is referred to as a capacity factor. Detailed analyses are presented in the Appendices.
5.2 M&V Analysis Assumptions
The Test Plan assumes the BESS will always be operated within the specifications given by the
manufacturer, and with safety constraints determined by SCE. The BESS will be taken off-line
in any circumstance that places additional stress on the system, or when it may interfere with

Page 45 of 221
© Copyright 2015, Southern California Edison All Rights Reserved
system operations or grid reliability. When bidding into the CAISO market, the BESS will be
operated and scheduled in accordance with established procedures like any other CAISO
resource. It is expected that lessons learned in early testing will inform future tests, particularly
as they relate to market participation. As such, financial constraints and expectations during year
1 of operation will be appropriately measured.
When applicable the project will run numerical model simulations of the each test. System
variables (voltages, currents, power flows) predicted by simulation models will be made
available to grid operations.
5.3 Mini-System
Contractual requirements for substantial acceptance included manufacturer delivery of a Mini-
System for testing, evaluation, and acceptance by SCE. The Mini-System replicated all major
hardware, software, and firmware components present in the full system, including the batteries,
BMS, PCS modules, PCS controls, Site Energy Controller (SEC) controls, and communication
paths within and between these components. This enabled SCE to test the overall design, quality,
safety, and reliability of the system’s final integration prior to commissioning or energizing the
full system. This approach had the advantage of avoiding significant limitations to performing
the same tests on the full system, including the difficulty in working out software/firmware bugs
with the manufacturer outside of a controlled laboratory environment, the need to exchange
significant power and energy at will, the remote location of the site, the availability of laboratory
facilities, equipment, and personnel, and the ability to perform tests that would be hazardous or
potentially detrimental to the full system.
The original Mini-System was delivered and installed at the SCE Pomona facility in October
2013 as a 30 kW, 116 kWh system comprised of two racks, one bank, and one battery section.
This original build was extremely useful in supporting full system startup and commissioning,
but only had one battery section and one PCS inverter lineup. This limited the ability of engineers
to test the multi-inverter lineup/battery section operation of the system in the laboratory, such as
inter-section balancing controls, multi-PCS operation, and symmetrical/unsymmetrical
operation of the inverter lineups. Therefore, the Mini-System was expanded in December 2015
to include twice the number of each component, resulting in a system with two PCS controllers,
inverter lineups, and battery sections, as shown below. This expansion even more closely
resembled the full system, and will allow engineers to study the long-term effects of operating
multiple, independent battery sections in parallel.
Mini-System characteristics include the following:
Original Build (October 2013) Expansion (December 2015)
77 sq. ft. footprint
30 kW
116 kWh
1 mini Power Conversion System cabinet
1 Section
1 Bank
154 sq. ft. footprint
60 kW
232 kWh
2 mini Power Conversion System cabinets
2 Sections
2 Banks

Page 46 of 221
© Copyright 2015, Southern California Edison All Rights Reserved
2 Racks
36 Modules
2,016 Cells
4 racks
72 modules
4,032 Cells
A Mini-System test plan was developed by SCE energy storage engineers, and was divided into
two phases. The first phase focused on the safety and expected behavior of the batteries and
BMS during interruptions to various communication paths during system startup and operation.
The first phase also consisted of intentionally changing the BMS’s warning and fault thresholds
to confirm the system was capable of recognizing operation outside of these limits, and its ability
to take appropriate action to reach a stable, safe condition without manual intervention. SCE
required successful completion of the first phase before allowing the manufacturer to finish
commissioning or energize the full system. The second phase of testing consisted of performing
system acceptance tests on the Mini-System to confirm overall correct operation of the SEC
control algorithms, test modes, and system response prior to performing the same tests on the
full system. This had the added advantage of being able to refine and make improvements to the
system acceptance test plan itself prior to final, official performance on the full system.
5.4 System Acceptance Test Plan
Similar to the Mini-System, contractual requirements for substantial acceptance called for the
full system to pass a series of system acceptance tests as defined in the System Acceptance Test
Plan jointly developed by SCE, the manufacturer, and the PCS/SEC/controls subcontractor. The
test plan included five tests to verify compliance with the contractually specified performance
parameters, as well as seven tests to confirm the proper operation of the SEC control algorithms
that would be used throughout the M&V period. The individual system acceptance tests were:
Performance and Capabilities
1. Real/reactive power dispatch accuracy
2. Sustained full real/reactive power dispatch capability
3. Real power discharge capacity and duration
4. Real/reactive power ramp rate
5. Automatic battery section balancing
SEC Control Algorithms
1. Test 1: Steady State Voltage Regulation
2. Test 3: Charge During High Line Load/Discharge During Low Line Load
3. Test 4: Charge Off-peak/Discharge On-peak
4. Test 5: Charge and Discharge as Needed for Grid Purposes
5. EMS–GMS Transition
6. EMS and GMS Communication Fault Handling
7. Manual and CAISO Power Dispatch
5.5 Characterization Test Plan
The System Acceptance Tests performed in July 2014 (see Section 6) included a capacity test
that measured the dischargeable energy of the system. However, this test did not measure round
Page 47 of 221
© Copyright 2015, Southern California Edison All Rights Reserved
trip efficiency, nor did it operate the system under realistic, frequent cycling profiles. The
purpose of the system Characterization Test Plan is to characterize the behavior and performance
of the system during frequent full charge/discharge cycles at 8 and 4 MW. Power, energy,
efficiency, and temperature data from the battery system, PCS, and PCC will be analyzed.
5.5.1 Charge/Discharge Duration Test
During the System Acceptance Tests, the system took four hours (+/- one minute) to discharge
from 98% SOC to 2.5% SOC (the full operating range) at 8 MW (see Section 6 and Appendix
I). From this, the TSP team concluded that the system will take no more than eight hours to
discharge over the same range at 4 MW. However, the System Acceptance Tests did not
demonstrate the amount of time the system takes to charge from 2.5% SOC to 98% SOC, at
either 8 or 4 MW. The purpose of the Charge/Discharge Duration Test is to determine the current
charge and discharge durations of the system at 8 and 4 MW, in order to optimize the SEC Test
42 On/Off Peak schedules for the Cycle Tests below.
1. Using Fully Discharge BESS, the system will discharge at 8 MW to a full
discharge.
2. After a minimal rest period (less than 15 minutes) with Fully Discharge BESS still
on, using Fully Charge BESS, the system will charge at 8 MW to a full charge.
3. After a minimal rest period (less than 15 minutes) with Fully Charge BESS still on,
using Fully Discharge BESS, the system will discharge at 8 MW to a full
discharge.
4. After an optional rest period, using SOC Control, the system will charge to
approximately 30 % SOC.
5. Steps 1 through 4 will be repeated at least once, and no more than once per day.
6. Steps 1 through 5 will be repeated at 4 MW.
5.5.2 8 MW Cycle Test
The purpose of the 8 MW Cycle Test is to characterize the behavior and performance of the
system during frequent full charge/discharge cycles at 8 MW, with a daily rest at 30 % SOC.
Prior to starting the test, the SEC Test 4 On/Off Peak schedules should be optimized using the
results of the Charge/Discharge Duration Test. The schedules include two continuous
charge/discharge cycles over the entire SOC operating range (2.5–98 % SOC), as well as a rest
period at 30 % SOC. This rest period fills the gap between the end of a day’s two full-range
charge/discharge cycles and the start of the next day’s cycles. This gap is not long enough to
include a third complete cycle, and the SEC Test 4 scheduler is not capable of creating a rolling
schedule that spans multiple days.
1. Using SCE Test 4 and the On/Off Peak schedules below, the system will
charge/discharge at 8 MW for at least one week.
2 SEC Test 4 refers to a specific BESS operating mode that includes a schedule function.
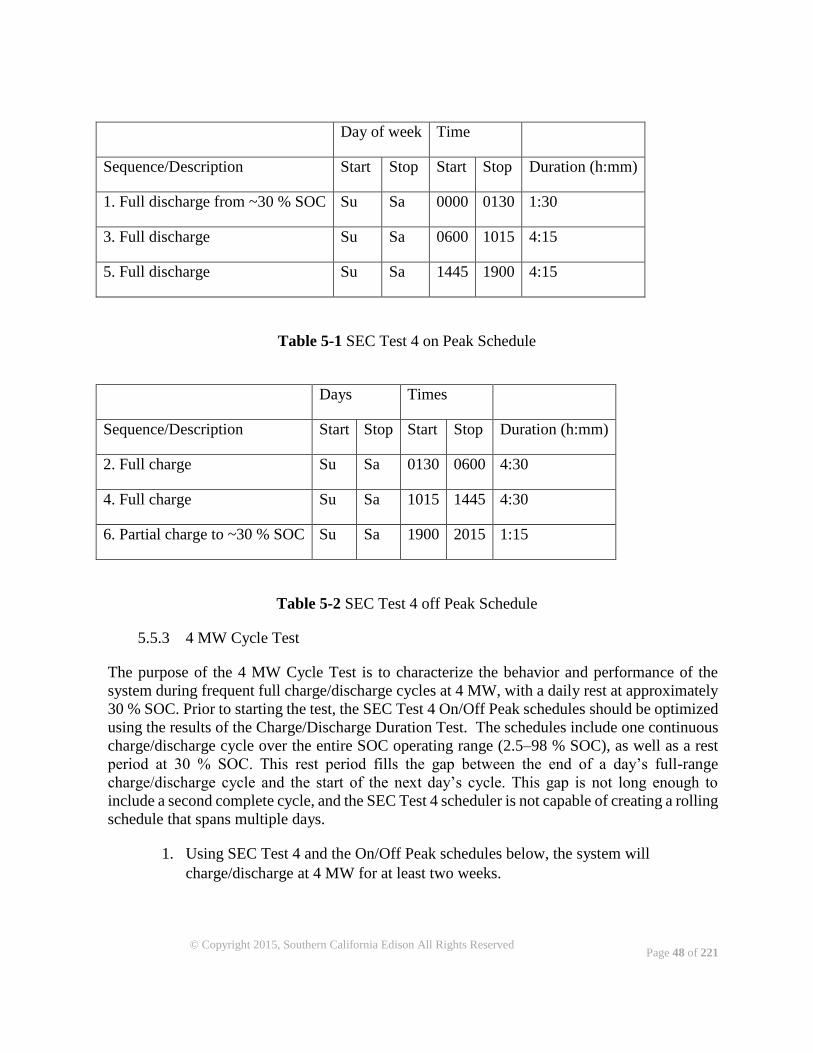
Page 48 of 221
© Copyright 2015, Southern California Edison All Rights Reserved
Day of week Time
Sequence/Description Start Stop Start Stop Duration (h:mm)
1. Full discharge from ~30 % SOC Su Sa 0000 0130 1:30
3. Full discharge Su Sa 0600 1015 4:15
5. Full discharge Su Sa 1445 1900 4:15
Table 5-1 SEC Test 4 on Peak Schedule
Days Times
Sequence/Description Start Stop Start Stop Duration (h:mm)
2. Full charge Su Sa 0130 0600 4:30
4. Full charge Su Sa 1015 1445 4:30
6. Partial charge to ~30 % SOC Su Sa 1900 2015 1:15
Table 5-2 SEC Test 4 off Peak Schedule
5.5.3 4 MW Cycle Test
The purpose of the 4 MW Cycle Test is to characterize the behavior and performance of the
system during frequent full charge/discharge cycles at 4 MW, with a daily rest at approximately
30 % SOC. Prior to starting the test, the SEC Test 4 On/Off Peak schedules should be optimized
using the results of the Charge/Discharge Duration Test. The schedules include one continuous
charge/discharge cycle over the entire SOC operating range (2.5–98 % SOC), as well as a rest
period at 30 % SOC. This rest period fills the gap between the end of a day’s full-range
charge/discharge cycle and the start of the next day’s cycle. This gap is not long enough to
include a second complete cycle, and the SEC Test 4 scheduler is not capable of creating a rolling
schedule that spans multiple days.
1. Using SEC Test 4 and the On/Off Peak schedules below, the system will
charge/discharge at 4 MW for at least two weeks.
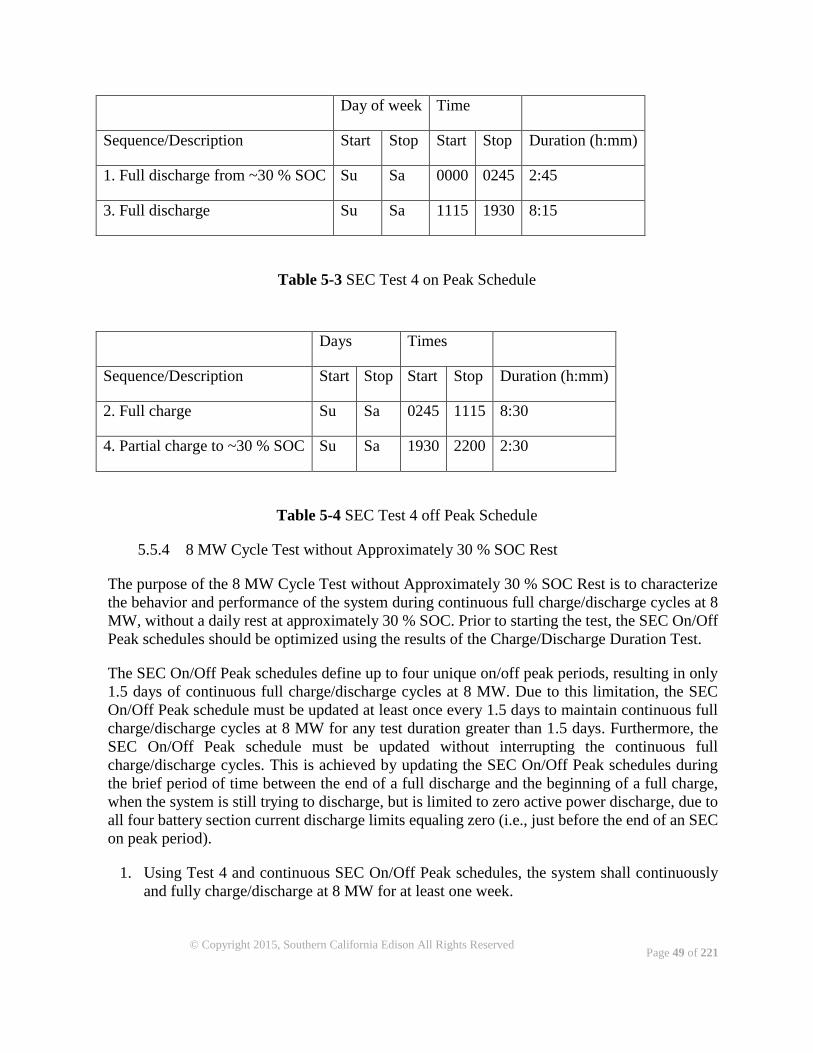
Page 49 of 221
© Copyright 2015, Southern California Edison All Rights Reserved
Day of week Time
Sequence/Description Start Stop Start Stop Duration (h:mm)
1. Full discharge from ~30 % SOC Su Sa 0000 0245 2:45
3. Full discharge Su Sa 1115 1930 8:15
Table 5-3 SEC Test 4 on Peak Schedule
Days Times
Sequence/Description Start Stop Start Stop Duration (h:mm)
2. Full charge Su Sa 0245 1115 8:30
4. Partial charge to ~30 % SOC Su Sa 1930 2200 2:30
Table 5-4 SEC Test 4 off Peak Schedule
5.5.4 8 MW Cycle Test without Approximately 30 % SOC Rest
The purpose of the 8 MW Cycle Test without Approximately 30 % SOC Rest is to characterize
the behavior and performance of the system during continuous full charge/discharge cycles at 8
MW, without a daily rest at approximately 30 % SOC. Prior to starting the test, the SEC On/Off
Peak schedules should be optimized using the results of the Charge/Discharge Duration Test.
The SEC On/Off Peak schedules define up to four unique on/off peak periods, resulting in only
1.5 days of continuous full charge/discharge cycles at 8 MW. Due to this limitation, the SEC
On/Off Peak schedule must be updated at least once every 1.5 days to maintain continuous full
charge/discharge cycles at 8 MW for any test duration greater than 1.5 days. Furthermore, the
SEC On/Off Peak schedule must be updated without interrupting the continuous full
charge/discharge cycles. This is achieved by updating the SEC On/Off Peak schedules during
the brief period of time between the end of a full discharge and the beginning of a full charge,
when the system is still trying to discharge, but is limited to zero active power discharge, due to
all four battery section current discharge limits equaling zero (i.e., just before the end of an SEC
on peak period).
1. Using Test 4 and continuous SEC On/Off Peak schedules, the system shall continuously
and fully charge/discharge at 8 MW for at least one week.

Page 50 of 221
© Copyright 2015, Southern California Edison All Rights Reserved
5.6 Test 1 Provide Steady State Voltage Regulation at the Local Monolith 66 kV
Bus
Overview: This test will examine the BESS’ ability, in a reactive power control mode, to respond
with ±4 MVAr of nominal capability to maintain AC voltage on the 66 kV Monolith substation
bus within steady-state (± 5%) range.
Primary Method of Performing Test Operate passively in background, absorbing
or supplying reactive power as required to
hold voltage set-point
Expectations for this test not expected for
all tests
Correlate reactive power output with voltage
response at 66 kV bus
Preconditions for this test not required for
all tests
Coordinate schedule with operational
sequence for capacitor banks
Simulation Real Time Digital Simulation with Hardware
in the Loop (RTDS)
1. Representing voltage, generation and load
values before test.
2. With BESS at changed voltage setpoint.
3. With capacitor switched off, BESS off
4. With capacitor off, BESS at maximum
MVAr injection.
Timing of test High and low expected wind generation
o High wind months are May and June.
o Low wind months are from
September through February
o March, April, September and October
vary from year to year.
High and low expected local load
Duration of test At a minimum, until bus voltage has
stabilized at the command value. A minimum
of one hour is suggested to demonstrate the
ability to sustain the scheduled MVAr flow
Data to be collected 66 kV Monolith bus voltage profile
Storage dispatch (BESS reactive power
output)
Relevant DOE Metrics Reactive power at BESS 66 kV
connection
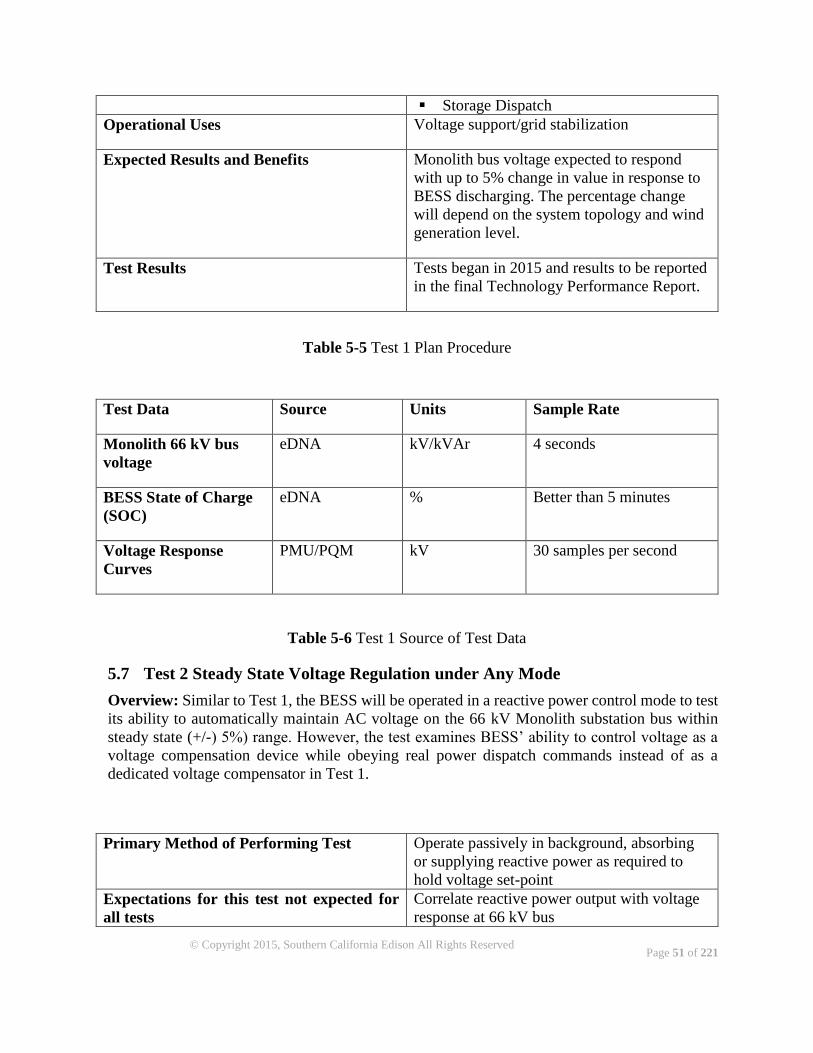
Page 51 of 221
© Copyright 2015, Southern California Edison All Rights Reserved
Storage Dispatch
Operational Uses Voltage support/grid stabilization
Expected Results and Benefits Monolith bus voltage expected to respond
with up to 5% change in value in response to
BESS discharging. The percentage change
will depend on the system topology and wind
generation level.
Test Results Tests began in 2015 and results to be reported
in the final Technology Performance Report.
Table 5-5 Test 1 Plan Procedure
Test Data Source Units Sample Rate
Monolith 66 kV bus
voltage
eDNA kV/kVAr 4 seconds
BESS State of Charge
(SOC)
eDNA % Better than 5 minutes
Voltage Response
Curves
PMU/PQM kV 30 samples per second
Table 5-6 Test 1 Source of Test Data
5.7 Test 2 Steady State Voltage Regulation under Any Mode
Overview: Similar to Test 1, the BESS will be operated in a reactive power control mode to test
its ability to automatically maintain AC voltage on the 66 kV Monolith substation bus within
steady state (+/-) 5%) range. However, the test examines BESS’ ability to control voltage as a
voltage compensation device while obeying real power dispatch commands instead of as a
dedicated voltage compensator in Test 1.
Primary Method of Performing Test Operate passively in background, absorbing
or supplying reactive power as required to
hold voltage set-point
Expectations for this test not expected for
all tests
Correlate reactive power output with voltage
response at 66 kV bus
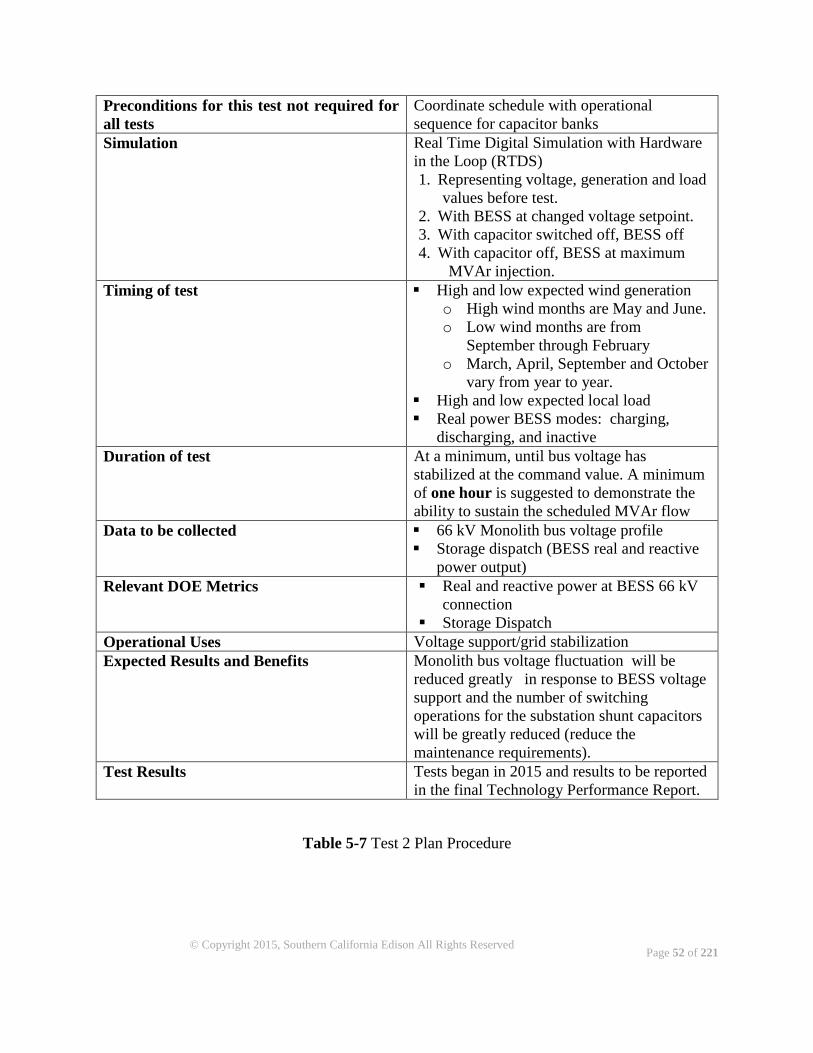
Page 52 of 221
© Copyright 2015, Southern California Edison All Rights Reserved
Preconditions for this test not required for
all tests
Coordinate schedule with operational
sequence for capacitor banks
Simulation Real Time Digital Simulation with Hardware
in the Loop (RTDS)
1. Representing voltage, generation and load
values before test.
2. With BESS at changed voltage setpoint.
3. With capacitor switched off, BESS off
4. With capacitor off, BESS at maximum
MVAr injection.
Timing of test High and low expected wind generation
o High wind months are May and June.
o Low wind months are from
September through February
o March, April, September and October
vary from year to year.
High and low expected local load
Real power BESS modes: charging,
discharging, and inactive
Duration of test At a minimum, until bus voltage has
stabilized at the command value. A minimum
of one hour is suggested to demonstrate the
ability to sustain the scheduled MVAr flow
Data to be collected 66 kV Monolith bus voltage profile
Storage dispatch (BESS real and reactive
power output)
Relevant DOE Metrics Real and reactive power at BESS 66 kV
connection
Storage Dispatch
Operational Uses Voltage support/grid stabilization
Expected Results and Benefits Monolith bus voltage fluctuation will be
reduced greatly in response to BESS voltage
support and the number of switching
operations for the substation shunt capacitors
will be greatly reduced (reduce the
maintenance requirements).
Test Results Tests began in 2015 and results to be reported
in the final Technology Performance Report.
Table 5-7 Test 2 Plan Procedure
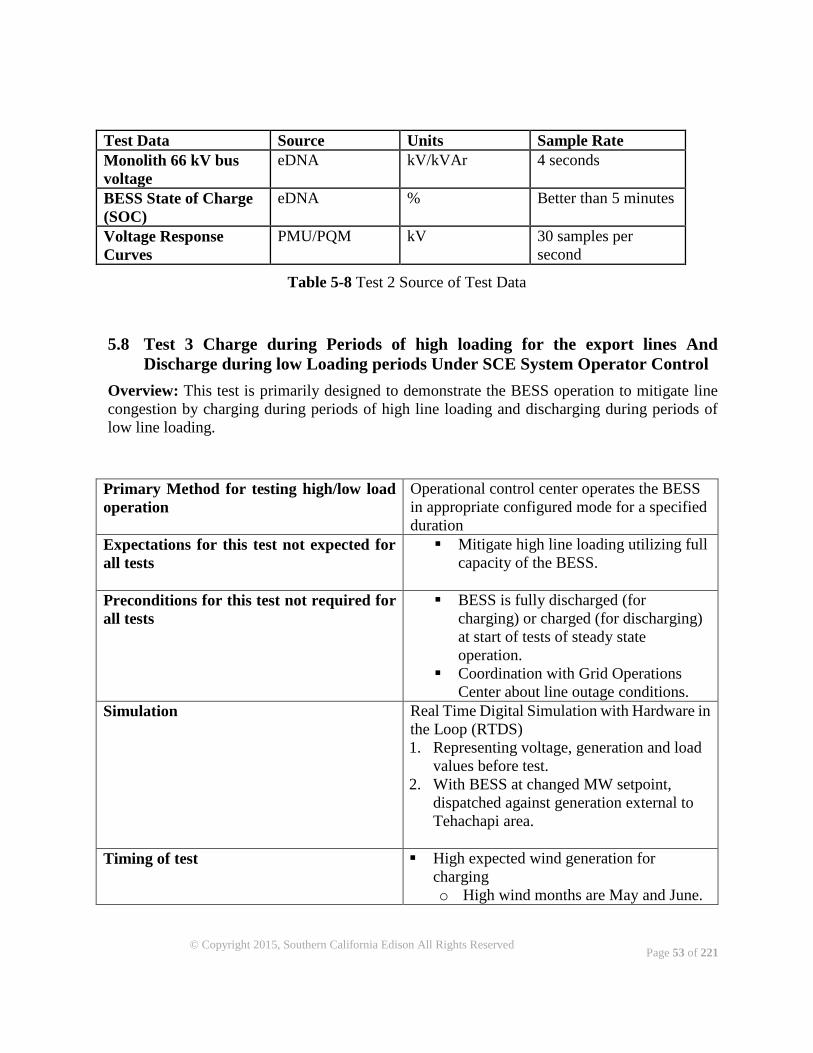
Page 53 of 221
© Copyright 2015, Southern California Edison All Rights Reserved
Test Data Source Units Sample Rate
Monolith 66 kV bus
voltage
eDNA kV/kVAr 4 seconds
BESS State of Charge
(SOC)
eDNA % Better than 5 minutes
Voltage Response
Curves
PMU/PQM kV 30 samples per
second
Table 5-8 Test 2 Source of Test Data
5.8 Test 3 Charge during Periods of high loading for the export lines And
Discharge during low Loading periods Under SCE System Operator Control
Overview: This test is primarily designed to demonstrate the BESS operation to mitigate line
congestion by charging during periods of high line loading and discharging during periods of
low line loading.
Primary Method for testing high/low load
operation
Operational control center operates the BESS
in appropriate configured mode for a specified
duration
Expectations for this test not expected for
all tests
Mitigate high line loading utilizing full
capacity of the BESS.
Preconditions for this test not required for
all tests
BESS is fully discharged (for
charging) or charged (for discharging)
at start of tests of steady state
operation.
Coordination with Grid Operations
Center about line outage conditions.
Simulation Real Time Digital Simulation with Hardware in
the Loop (RTDS)
1. Representing voltage, generation and load
values before test.
2. With BESS at changed MW setpoint,
dispatched against generation external to
Tehachapi area.
Timing of test High expected wind generation for
charging
o High wind months are May and June.
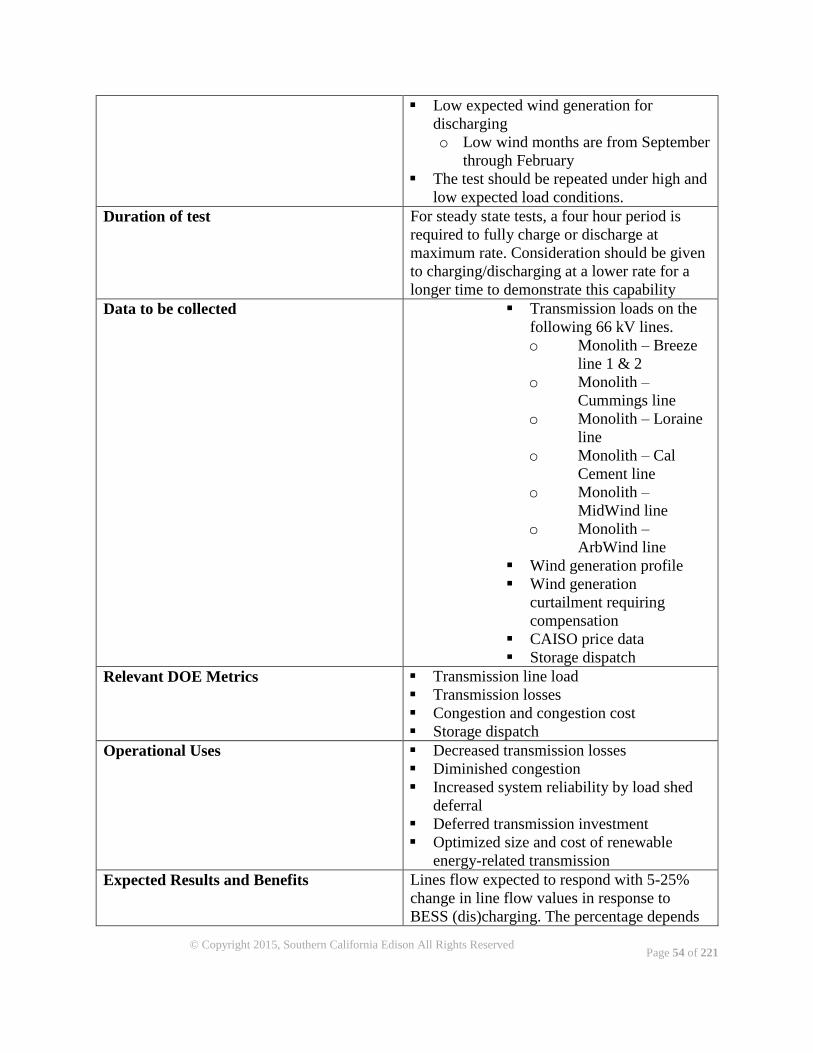
Page 54 of 221
© Copyright 2015, Southern California Edison All Rights Reserved
Low expected wind generation for
discharging
o Low wind months are from September
through February
The test should be repeated under high and
low expected load conditions.
Duration of test For steady state tests, a four hour period is
required to fully charge or discharge at
maximum rate. Consideration should be given
to charging/discharging at a lower rate for a
longer time to demonstrate this capability
Data to be collected Transmission loads on the
following 66 kV lines.
o Monolith – Breeze
line 1 & 2
o Monolith –
Cummings line
o Monolith – Loraine
line
o Monolith – Cal
Cement line
o Monolith –
MidWind line
o Monolith –
ArbWind line
Wind generation profile
Wind generation
curtailment requiring
compensation
CAISO price data
Storage dispatch
Relevant DOE Metrics Transmission line load
Transmission losses
Congestion and congestion cost
Storage dispatch
Operational Uses Decreased transmission losses
Diminished congestion
Increased system reliability by load shed
deferral
Deferred transmission investment
Optimized size and cost of renewable
energy-related transmission
Expected Results and Benefits Lines flow expected to respond with 5-25%
change in line flow values in response to
BESS (dis)charging. The percentage depends
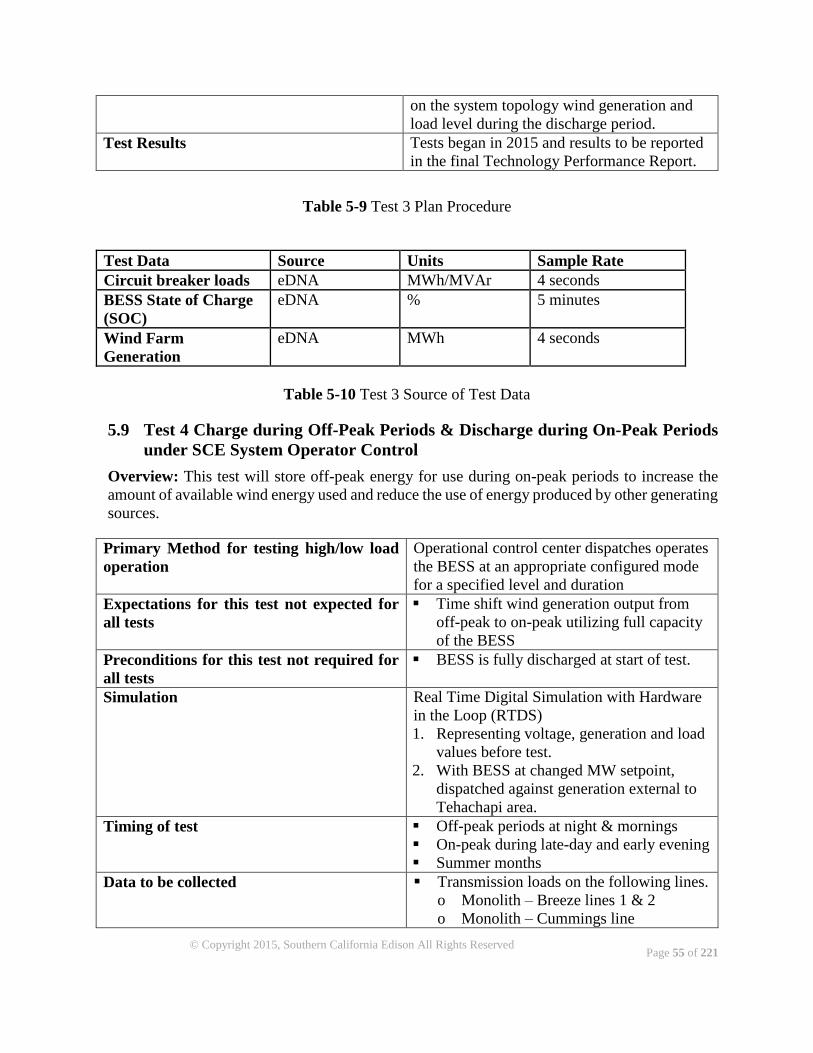
Page 55 of 221
© Copyright 2015, Southern California Edison All Rights Reserved
on the system topology wind generation and
load level during the discharge period.
Test Results Tests began in 2015 and results to be reported
in the final Technology Performance Report.
Table 5-9 Test 3 Plan Procedure
Test Data Source Units Sample Rate
Circuit breaker loads eDNA MWh/MVAr 4 seconds
BESS State of Charge
(SOC)
eDNA % 5 minutes
Wind Farm
Generation
eDNA MWh 4 seconds
Table 5-10 Test 3 Source of Test Data
5.9 Test 4 Charge during Off-Peak Periods & Discharge during On-Peak Periods
under SCE System Operator Control
Overview: This test will store off-peak energy for use during on-peak periods to increase the
amount of available wind energy used and reduce the use of energy produced by other generating
sources.
Primary Method for testing high/low load
operation
Operational control center dispatches operates
the BESS at an appropriate configured mode
for a specified level and duration
Expectations for this test not expected for
all tests
Time shift wind generation output from
off-peak to on-peak utilizing full capacity
of the BESS
Preconditions for this test not required for
all tests
BESS is fully discharged at start of test.
Simulation Real Time Digital Simulation with Hardware
in the Loop (RTDS)
1. Representing voltage, generation and load
values before test.
2. With BESS at changed MW setpoint,
dispatched against generation external to
Tehachapi area.
Timing of test Off-peak periods at night & mornings
On-peak during late-day and early evening
Summer months
Data to be collected Transmission loads on the following lines.
o Monolith – Breeze lines 1 & 2
o Monolith – Cummings line
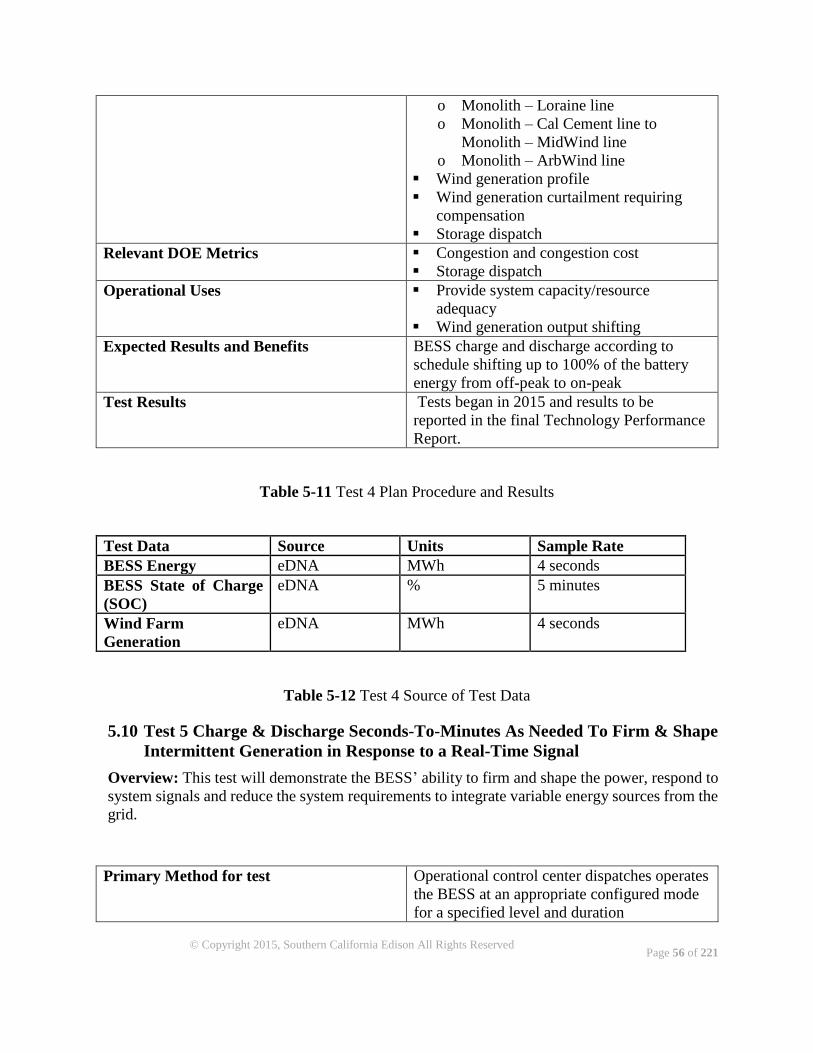
Page 56 of 221
© Copyright 2015, Southern California Edison All Rights Reserved
o Monolith – Loraine line
o Monolith – Cal Cement line to
Monolith – MidWind line
o Monolith – ArbWind line
Wind generation profile
Wind generation curtailment requiring
compensation
Storage dispatch
Relevant DOE Metrics Congestion and congestion cost
Storage dispatch
Operational Uses Provide system capacity/resource
adequacy
Wind generation output shifting
Expected Results and Benefits BESS charge and discharge according to
schedule shifting up to 100% of the battery
energy from off-peak to on-peak
Test Results Tests began in 2015 and results to be
reported in the final Technology Performance
Report.
Table 5-11 Test 4 Plan Procedure and Results
Test Data Source Units Sample Rate
BESS Energy eDNA MWh 4 seconds
BESS State of Charge
(SOC)
eDNA % 5 minutes
Wind Farm
Generation
eDNA MWh 4 seconds
Table 5-12 Test 4 Source of Test Data
5.10 Test 5 Charge & Discharge Seconds-To-Minutes As Needed To Firm & Shape
Intermittent Generation in Response to a Real-Time Signal
Overview: This test will demonstrate the BESS’ ability to firm and shape the power, respond to
system signals and reduce the system requirements to integrate variable energy sources from the
grid.
Primary Method for test Operational control center dispatches operates
the BESS at an appropriate configured mode
for a specified level and duration
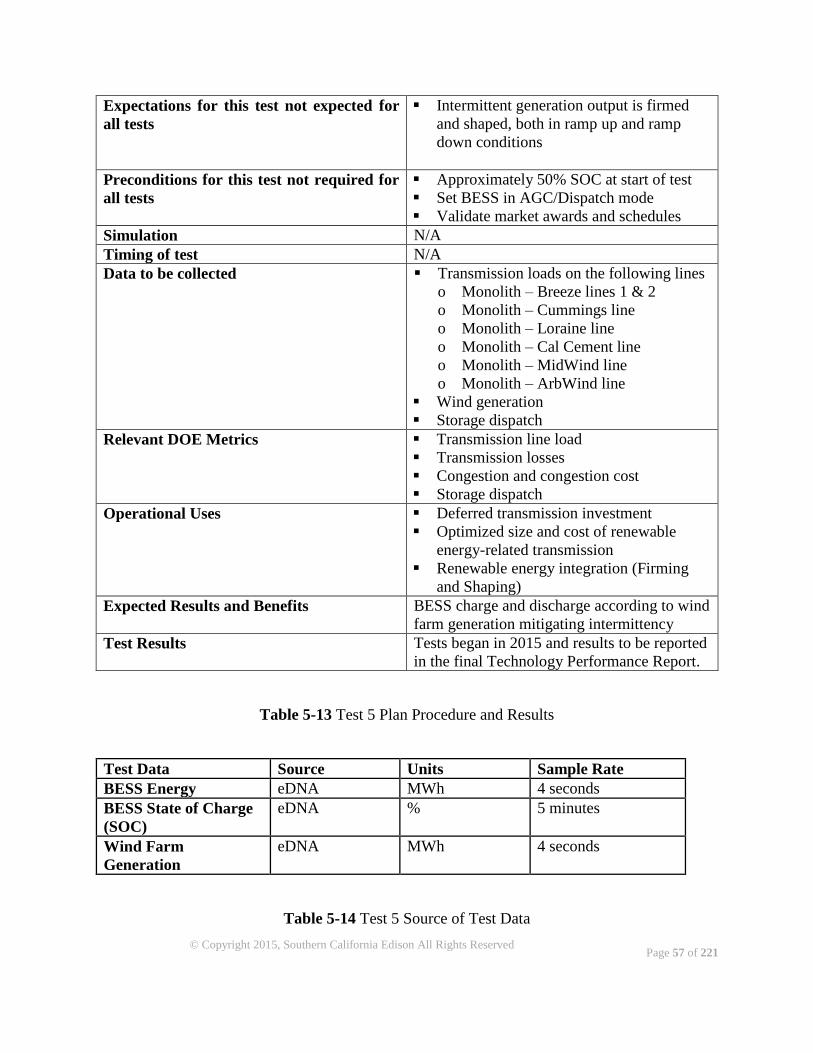
Page 57 of 221
© Copyright 2015, Southern California Edison All Rights Reserved
Expectations for this test not expected for
all tests
Intermittent generation output is firmed
and shaped, both in ramp up and ramp
down conditions
Preconditions for this test not required for
all tests
Approximately 50% SOC at start of test
Set BESS in AGC/Dispatch mode
Validate market awards and schedules
Simulation N/A
Timing of test N/A
Data to be collected Transmission loads on the following lines
o Monolith – Breeze lines 1 & 2
o Monolith – Cummings line
o Monolith – Loraine line
o Monolith – Cal Cement line
o Monolith – MidWind line
o Monolith – ArbWind line
Wind generation
Storage dispatch
Relevant DOE Metrics Transmission line load
Transmission losses
Congestion and congestion cost
Storage dispatch
Operational Uses Deferred transmission investment
Optimized size and cost of renewable
energy-related transmission
Renewable energy integration (Firming
and Shaping)
Expected Results and Benefits BESS charge and discharge according to wind
farm generation mitigating intermittency
Test Results Tests began in 2015 and results to be reported
in the final Technology Performance Report.
Table 5-13 Test 5 Plan Procedure and Results
Test Data Source Units Sample Rate
BESS Energy eDNA MWh 4 seconds
BESS State of Charge
(SOC)
eDNA % 5 minutes
Wind Farm
Generation
eDNA MWh 4 seconds
Table 5-14 Test 5 Source of Test Data

Page 58 of 221
© Copyright 2015, Southern California Edison All Rights Reserved
5.11 Test 6 Respond To CAISO Control Signals to Provide Frequency Response
Overview: This test will demonstrate the BESS’ ability to follow CAISO’s control signal for
Area Control Error (ACE) via the RIG (Remote Intelligent Gateway).
Primary Method for test The Generation Management System (GMS)
schedules a predetermined schedule for BESS
to follow CAISO market signal via the RIG
Expectations for this test not expected for
all tests
BESS awarded market AGC for testing
hours
BESS follows CAISO AGC signals in real
time
Preconditions for this test not required for
all tests
Connection to CAISO via RIG module
BESS has been certified to provide
Ancillary Services – regulation and/or
spinning reserve – to CAISO
BESS has been Bid and Awarded
regulation
BESS is capable of receiving a MW
dispatch notification – for dispatch signal
case
Approximately 50% State of Charge at
start of test
Simulation N/A
Timing of test Based on market award
Data to be collected CAISO operations signal for system
frequency response (set point)
Frequency response requirement
Storage dispatch
Control Mode
Control Permissive
High and Low range regulation values
Energy schedule
Relevant DOE Metrics System Frequency
Storage dispatch
Operational Uses Frequency regulation
Deliver ramp rate
Expected Results and Benefits BESS charge and discharge according to
market signals within acceptable CAISO
performance guidelines
Test Results Tests began in 2015 and results to be reported
in the final Technology Performance Report.
Table 5-15 Test 6 Plan Procedure and Results
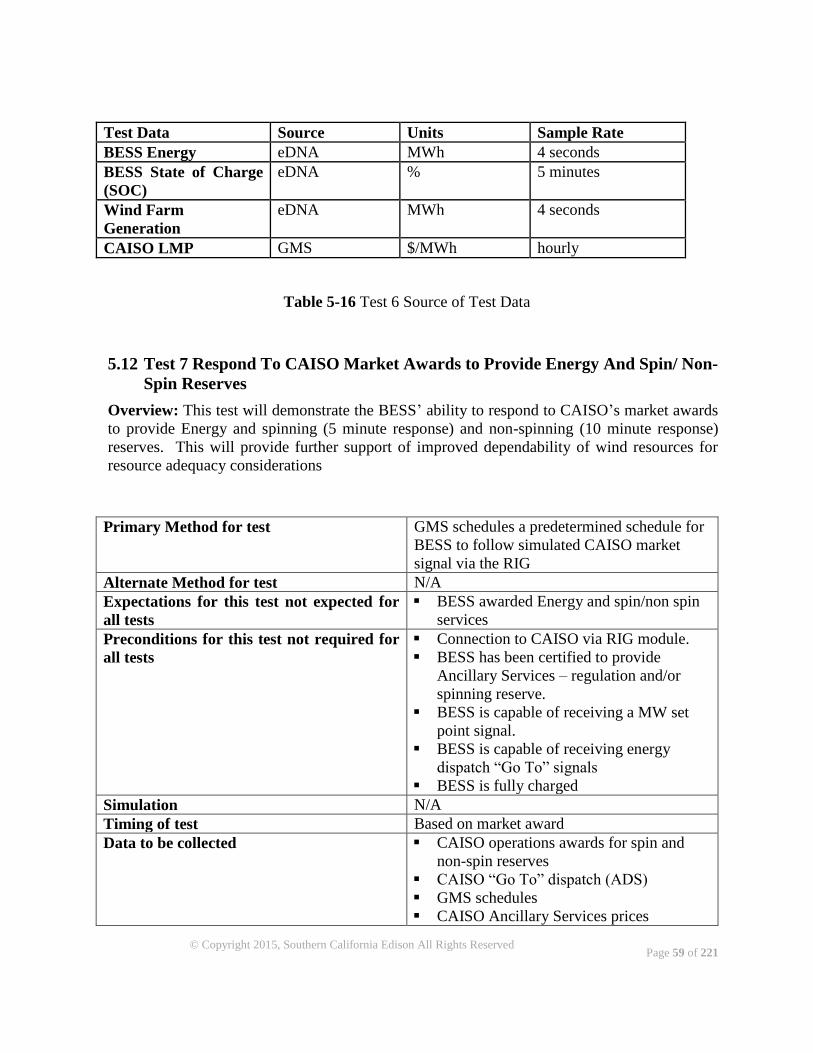
Page 59 of 221
© Copyright 2015, Southern California Edison All Rights Reserved
Test Data Source Units Sample Rate
BESS Energy eDNA MWh 4 seconds
BESS State of Charge
(SOC)
eDNA % 5 minutes
Wind Farm
Generation
eDNA MWh 4 seconds
CAISO LMP GMS $/MWh hourly
Table 5-16 Test 6 Source of Test Data
5.12 Test 7 Respond To CAISO Market Awards to Provide Energy And Spin/ Non-
Spin Reserves
Overview: This test will demonstrate the BESS’ ability to respond to CAISO’s market awards
to provide Energy and spinning (5 minute response) and non-spinning (10 minute response)
reserves. This will provide further support of improved dependability of wind resources for
resource adequacy considerations
Primary Method for test GMS schedules a predetermined schedule for
BESS to follow simulated CAISO market
signal via the RIG
Alternate Method for test N/A
Expectations for this test not expected for
all tests
BESS awarded Energy and spin/non spin
services
Preconditions for this test not required for
all tests
Connection to CAISO via RIG module.
BESS has been certified to provide
Ancillary Services – regulation and/or
spinning reserve.
BESS is capable of receiving a MW set
point signal.
BESS is capable of receiving energy
dispatch “Go To” signals
BESS is fully charged
Simulation N/A
Timing of test Based on market award
Data to be collected CAISO operations awards for spin and
non-spin reserves
CAISO “Go To” dispatch (ADS)
GMS schedules
CAISO Ancillary Services prices
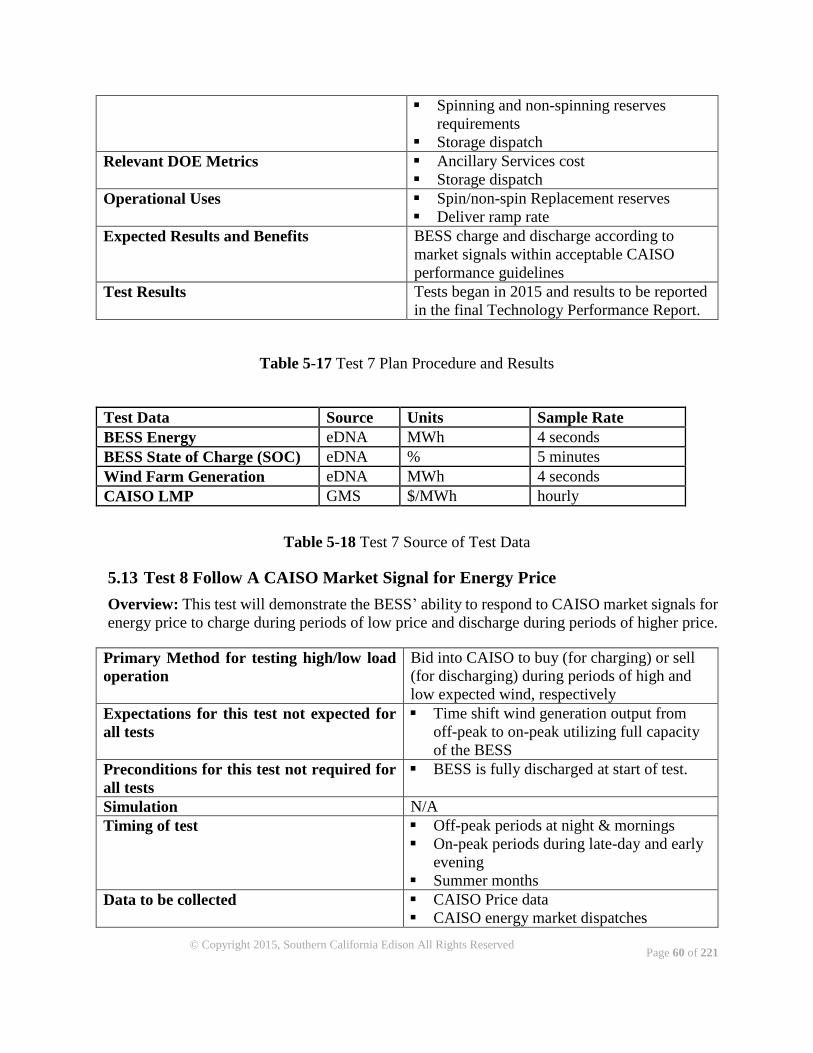
Page 60 of 221
© Copyright 2015, Southern California Edison All Rights Reserved
Spinning and non-spinning reserves
requirements
Storage dispatch
Relevant DOE Metrics Ancillary Services cost
Storage dispatch
Operational Uses Spin/non-spin Replacement reserves
Deliver ramp rate
Expected Results and Benefits BESS charge and discharge according to
market signals within acceptable CAISO
performance guidelines
Test Results Tests began in 2015 and results to be reported
in the final Technology Performance Report.
Table 5-17 Test 7 Plan Procedure and Results
Test Data Source Units Sample Rate
BESS Energy eDNA MWh 4 seconds
BESS State of Charge (SOC) eDNA % 5 minutes
Wind Farm Generation eDNA MWh 4 seconds
CAISO LMP GMS $/MWh hourly
Table 5-18 Test 7 Source of Test Data
5.13 Test 8 Follow A CAISO Market Signal for Energy Price
Overview: This test will demonstrate the BESS’ ability to respond to CAISO market signals for
energy price to charge during periods of low price and discharge during periods of higher price.
Primary Method for testing high/low load
operation
Bid into CAISO to buy (for charging) or sell
(for discharging) during periods of high and
low expected wind, respectively
Expectations for this test not expected for
all tests
Time shift wind generation output from
off-peak to on-peak utilizing full capacity
of the BESS
Preconditions for this test not required for
all tests
BESS is fully discharged at start of test.
Simulation N/A
Timing of test Off-peak periods at night & mornings
On-peak periods during late-day and early
evening
Summer months
Data to be collected CAISO Price data
CAISO energy market dispatches
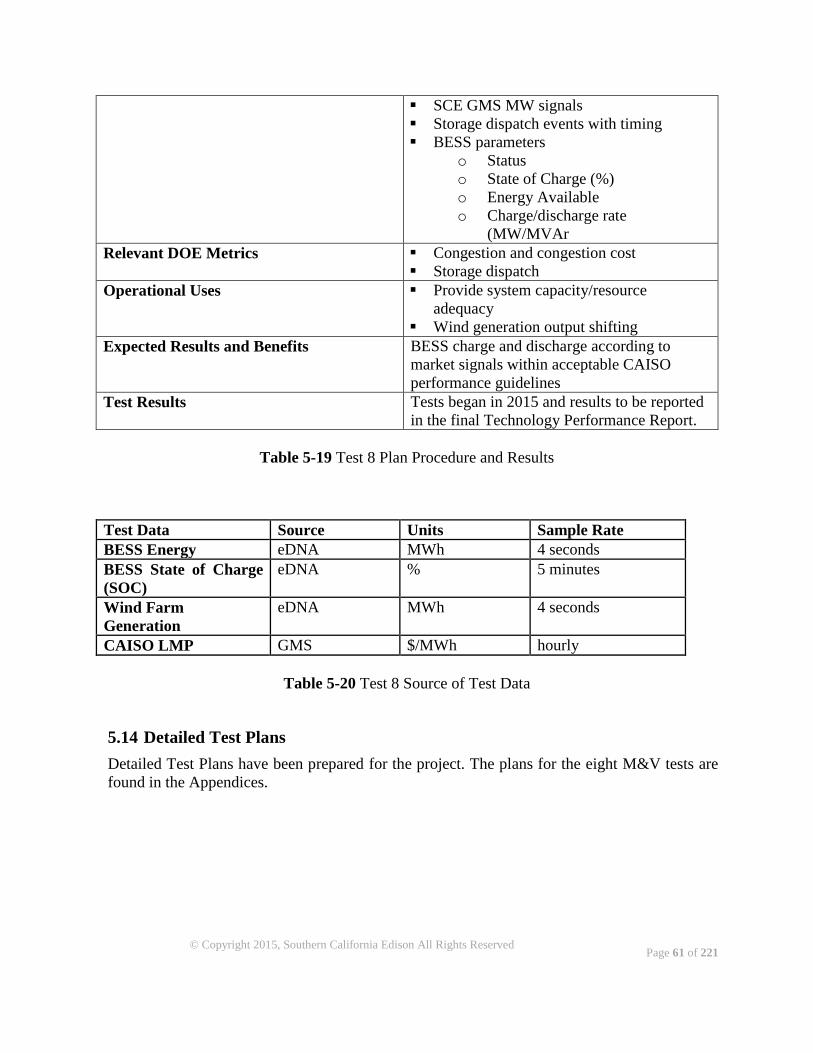
Page 61 of 221
© Copyright 2015, Southern California Edison All Rights Reserved
SCE GMS MW signals
Storage dispatch events with timing
BESS parameters
o Status
o State of Charge (%)
o Energy Available
o Charge/discharge rate
(MW/MVAr
Relevant DOE Metrics Congestion and congestion cost
Storage dispatch
Operational Uses Provide system capacity/resource
adequacy
Wind generation output shifting
Expected Results and Benefits BESS charge and discharge according to
market signals within acceptable CAISO
performance guidelines
Test Results Tests began in 2015 and results to be reported
in the final Technology Performance Report.
Table 5-19 Test 8 Plan Procedure and Results
Test Data Source Units Sample Rate
BESS Energy eDNA MWh 4 seconds
BESS State of Charge
(SOC)
eDNA % 5 minutes
Wind Farm
Generation
eDNA MWh 4 seconds
CAISO LMP GMS $/MWh hourly
Table 5-20 Test 8 Source of Test Data
5.14 Detailed Test Plans
Detailed Test Plans have been prepared for the project. The plans for the eight M&V tests are
found in the Appendices.
Page 62 of 221
© Copyright 2015, Southern California Edison All Rights Reserved
6 Measurement and Validation Test Results and Conclusions
6.1 Status & Timing of Tests
Prior to onsite project commissioning activities, Mini-System testing was performed at SCE lab
facilities. In parallel, Hardware-In-The-Loop RTDS Testing using an actual PCS controller was
conducted. SCE engineers reached a level of confidence in the system through RTDS and Mini-
System Testing and onsite commissioning activities were initiated to verify function and
integration of system components. Subsequent to project commissioning and trial demonstration
use of the BESS, System Acceptance Testing was performed in July 2014 to demonstrate that
the system met all design specification and criteria. Finally, a Characterization Test Period was
initiated in December 2014 to determine key characteristics of the total system. Characterization
testing concluded in early 2015. Preliminary results of this characterization testing were reported
in the initial TPR #1. The TSP project began initial operations and resolved various startup
issues. Although, multiple operating issues took some time to resolve, the project subsequently
began operations of tests 1 through 8 and was able to obtain limited test results as in this TPR
#2.
6.2 Mini-System Test Results
The Mini-System was delivered and installed at SCE’s energy storage laboratories in October
2013. Engineers then operated the system to gain familiarity and experience with the actual
hardware, software, and firmware build, especially the integration of the various subsystem
components. This experience was then used to develop the Mini-System test plan described in
Section 5. Finally, the Mini-System test plan was used to start methodical Mini-System testing
in November 2013.
Originally, SCE anticipated performing two or three rounds of Mini-System phase 1 testing: one
to discover any software/firmware bugs, safety concerns, or suboptimal behavior, and another
round or two to verify the issues were corrected by the manufacturer. However, actual phase 1
testing consisted of a total of 11 initial rounds over nine months in support of full system startup
and commissioning, from November 2013 through August 2014. Each round of testing,
excluding the final round, generated a BMS, PCS, and/or SEC software/firmware update to
correct any issues that had been identified. Each round also consisted of a complete repeat of all
Phase 1 test components, since the software/firmware updates frequently resulted in new issues
or other discoveries, such as areas for improving system behavior and stability. Phase 2 testing
occurred concurrently with Phase 1 in mid-2014, took approximately one month, and also
included updates to the SEC firmware to refine system control logic. Furthermore, phase 2
testing allowed all parties to refine the system acceptance test plan prior to performance on the
full system.
Issues identified included:
Potential overcharging and over-discharging the battery due to incorrect BMS safety limits
Page 63 of 221
© Copyright 2015, Southern California Edison All Rights Reserved
Incorrect aggregation/summarization of battery data based on the actual number of battery
racks online, resulting in incorrect real-time capability/capacity limits being provided to
the PCS
Inability to recognize or take appropriate action for certain battery warnings or faults
Failure to perform an automatic maintenance charge at low SOC, allowing the battery to
self-discharge below the operating range of the PCS and requiring manual, external
charging of the batteries in order to restore the system to operation (this particular situation
would have been extremely problematic for the full system, since there is no way to
manually, externally charge all 604 racks)
Incorrect redundant communication paths being used for inter-component communication
Lack of recognition or appropriate response when certain communication paths were
interrupted
While Mini-System testing took longer than originally anticipated, it did not significantly delay
the completion of full system commissioning, since some final construction activities were still
taking place at the site. Furthermore, the Mini-System testing proved invaluable to SCE, the
manufacturer, and the PCS/SEC/controls subcontractor in identifying and correcting a number
of issues prior to completing commissioning, energizing, or trying to perform system acceptance
tests on the full system. All parties agreed that the Mini-System testing substantially reduced the
number of issues that would have otherwise surfaced on the full system and caused significant
delays and larger-scale problems.
Once the Mini-System passed all critical phase 1 and 2 tests, SCE allowed the manufacturer to
energize the full system and exchange power to complete commissioning in early July 2014.
During this time, SCE engineers continued the final rounds of Mini-System testing in preparation
for system acceptance testing.
Since August 2014, SCE engineers and the manufacturer identified additional software bugs and
operational issues through the operation of the full system. These prompted the development of
software updates and three additional rounds of phase 1 Mini-System testing, which were
completed between June and December 2015. Similar to the initial 11 rounds of phase 1 testing,
these software updates were tested on the Mini-System prior to being installed on the full system.
6.3 System Acceptance Test Results
Full system acceptance testing (SAT) was performed in mid-July 2014 per the system acceptance
test plan jointly developed by SCE, the manufacturer, and the PCS/control subcontractor. SAT
was successfully completed on-schedule over the course of 10 workdays, due in no small part to
the extensive Mini-System testing. The full system passed all SAT tests, even though a few
issues surfaced, including a rack BMS hardware failure, two PCS transformer cooling fan
failures, and a PCS trip due to a false positive smoke detector signal.
Originally, there were concerns with the system not being able to meet the contractually
required energy discharge capacity of 32 MWh at 12 kV AC. This concern was developed
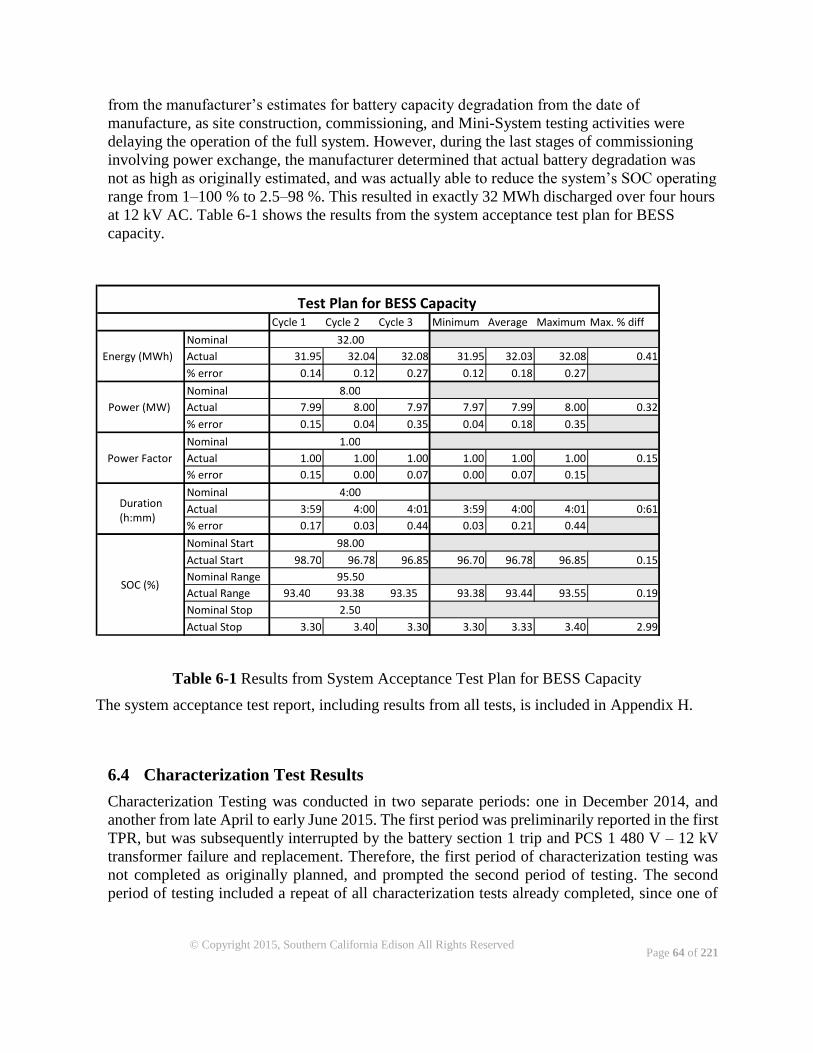
Page 64 of 221
© Copyright 2015, Southern California Edison All Rights Reserved
from the manufacturer’s estimates for battery capacity degradation from the date of
manufacture, as site construction, commissioning, and Mini-System testing activities were
delaying the operation of the full system. However, during the last stages of commissioning
involving power exchange, the manufacturer determined that actual battery degradation was
not as high as originally estimated, and was actually able to reduce the system’s SOC operating
range from 1–100 % to 2.5–98 %. This resulted in exactly 32 MWh discharged over four hours
at 12 kV AC. Table 6-1 shows the results from the system acceptance test plan for BESS
capacity.
Table 6-1 Results from System Acceptance Test Plan for BESS Capacity
The system acceptance test report, including results from all tests, is included in Appendix H.
6.4 Characterization Test Results
Characterization Testing was conducted in two separate periods: one in December 2014, and
another from late April to early June 2015. The first period was preliminarily reported in the first
TPR, but was subsequently interrupted by the battery section 1 trip and PCS 1 480 V – 12 kV
transformer failure and replacement. Therefore, the first period of characterization testing was
not completed as originally planned, and prompted the second period of testing. The second
period of testing included a repeat of all characterization tests already completed, since one of
Cycle 1 Cycle 2 Cycle 3 Minimum Average Maximum Max. % diff Nominal Actual 31.95 32.04 32.08 31.95 32.03 32.08 0.41 % error 0.14 0.12 0.27 0.12 0.18 0.27 Nominal Actual 7.99 8.00 7.97 7.97 7.99 8.00 0.32 % error 0.15 0.04 0.35 0.04 0.18 0.35 Nominal Actual 1.00 1.00 1.00 1.00 1.00 1.00 0.15 % error 0.15 0.00 0.07 0.00 0.07 0.15 Nominal Actual 3:59 4:00 4:01 3:59 4:00 4:01 0:61 % error 0.17 0.03 0.44 0.03 0.21 0.44 Nominal Start Actual Start 98.70 96.78 96.85 96.70 96.78 96.85 0.15 Nominal Range Actual Range 93.40 93.38 93.35 93.38 93.44 93.55 0.19 Nominal Stop Actual Stop 3.30 3.40 3.30 3.30 3.33 3.40 2.99
SOC (%)
Test Plan for BESS Capacity
8.00
1.00
4:00 Duration (h:mm)
Power Factor
Power (MW)
Energy (MWh) 32.00
98.00
95.50
2.50
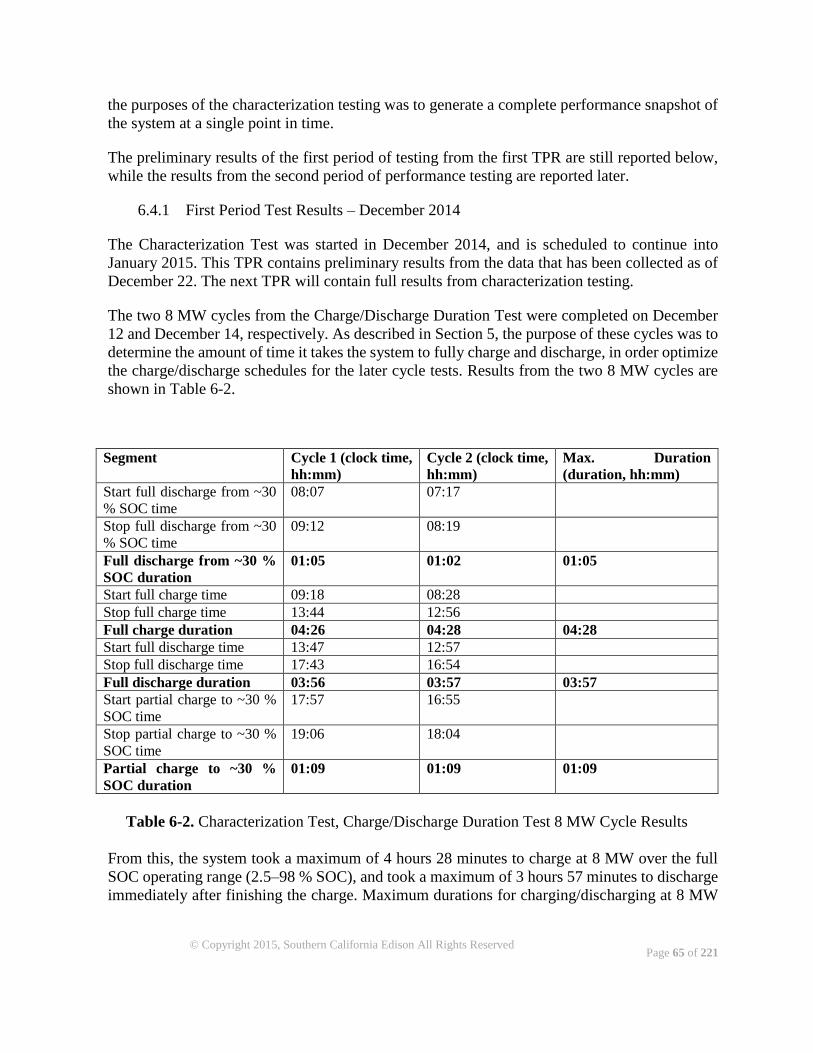
Page 65 of 221
© Copyright 2015, Southern California Edison All Rights Reserved
the purposes of the characterization testing was to generate a complete performance snapshot of
the system at a single point in time.
The preliminary results of the first period of testing from the first TPR are still reported below,
while the results from the second period of performance testing are reported later.
6.4.1 First Period Test Results – December 2014
The Characterization Test was started in December 2014, and is scheduled to continue into
January 2015. This TPR contains preliminary results from the data that has been collected as of
December 22. The next TPR will contain full results from characterization testing.
The two 8 MW cycles from the Charge/Discharge Duration Test were completed on December
12 and December 14, respectively. As described in Section 5, the purpose of these cycles was to
determine the amount of time it takes the system to fully charge and discharge, in order optimize
the charge/discharge schedules for the later cycle tests. Results from the two 8 MW cycles are
shown in Table 6-2.
Segment Cycle 1 (clock time,
hh:mm)
Cycle 2 (clock time,
hh:mm)
Max. Duration
(duration, hh:mm)
Start full discharge from ~30
% SOC time
08:07 07:17
Stop full discharge from ~30
% SOC time
09:12 08:19
Full discharge from ~30 %
SOC duration
01:05 01:02 01:05
Start full charge time 09:18 08:28
Stop full charge time 13:44 12:56
Full charge duration 04:26 04:28 04:28
Start full discharge time 13:47 12:57
Stop full discharge time 17:43 16:54
Full discharge duration 03:56 03:57 03:57
Start partial charge to ~30 %
SOC time
17:57 16:55
Stop partial charge to ~30 %
SOC time
19:06 18:04
Partial charge to ~30 %
SOC duration
01:09 01:09 01:09
Table 6-2. Characterization Test, Charge/Discharge Duration Test 8 MW Cycle Results
From this, the system took a maximum of 4 hours 28 minutes to charge at 8 MW over the full
SOC operating range (2.5–98 % SOC), and took a maximum of 3 hours 57 minutes to discharge
immediately after finishing the charge. Maximum durations for charging/discharging at 8 MW
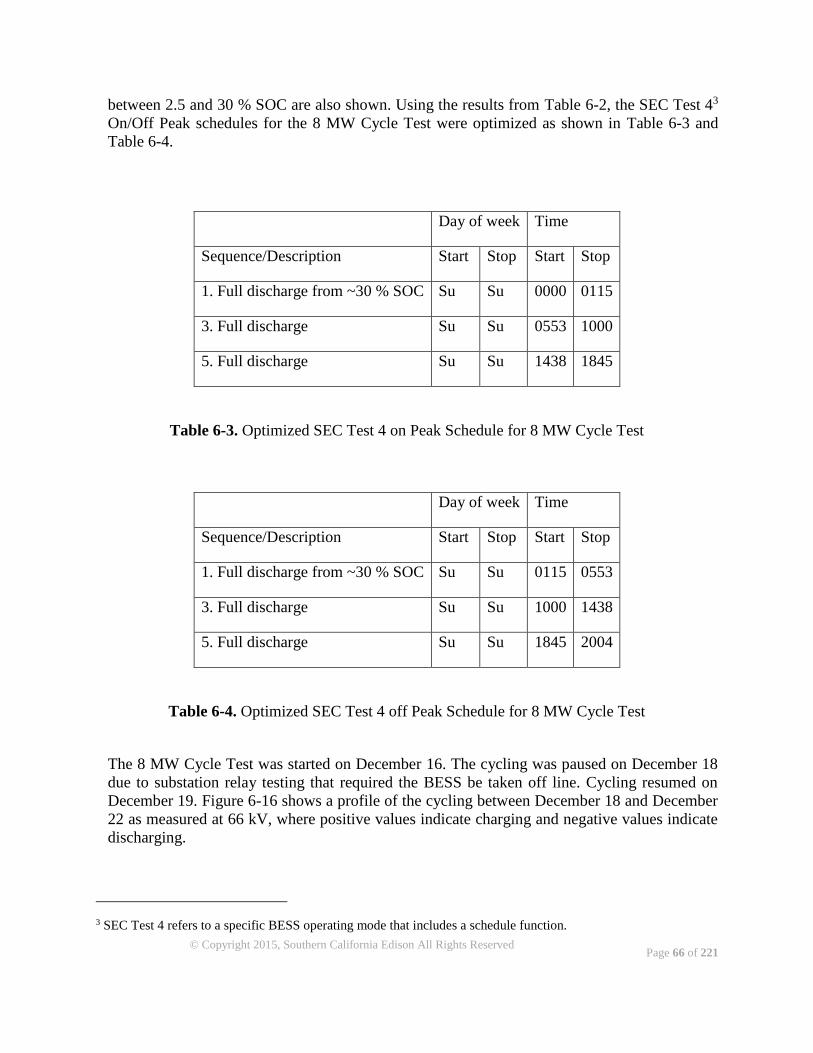
Page 66 of 221
© Copyright 2015, Southern California Edison All Rights Reserved
between 2.5 and 30 % SOC are also shown. Using the results from Table 6-2, the SEC Test 43
On/Off Peak schedules for the 8 MW Cycle Test were optimized as shown in Table 6-3 and
Table 6-4.
Day of week Time
Sequence/Description Start Stop Start Stop
1. Full discharge from ~30 % SOC Su Su 0000 0115
3. Full discharge Su Su 0553 1000
5. Full discharge Su Su 1438 1845
Table 6-3. Optimized SEC Test 4 on Peak Schedule for 8 MW Cycle Test
Day of week Time
Sequence/Description Start Stop Start Stop
1. Full discharge from ~30 % SOC Su Su 0115 0553
3. Full discharge Su Su 1000 1438
5. Full discharge Su Su 1845 2004
Table 6-4. Optimized SEC Test 4 off Peak Schedule for 8 MW Cycle Test
The 8 MW Cycle Test was started on December 16. The cycling was paused on December 18
due to substation relay testing that required the BESS be taken off line. Cycling resumed on
December 19. Figure 6-16 shows a profile of the cycling between December 18 and December
22 as measured at 66 kV, where positive values indicate charging and negative values indicate
discharging.
3 SEC Test 4 refers to a specific BESS operating mode that includes a schedule function.
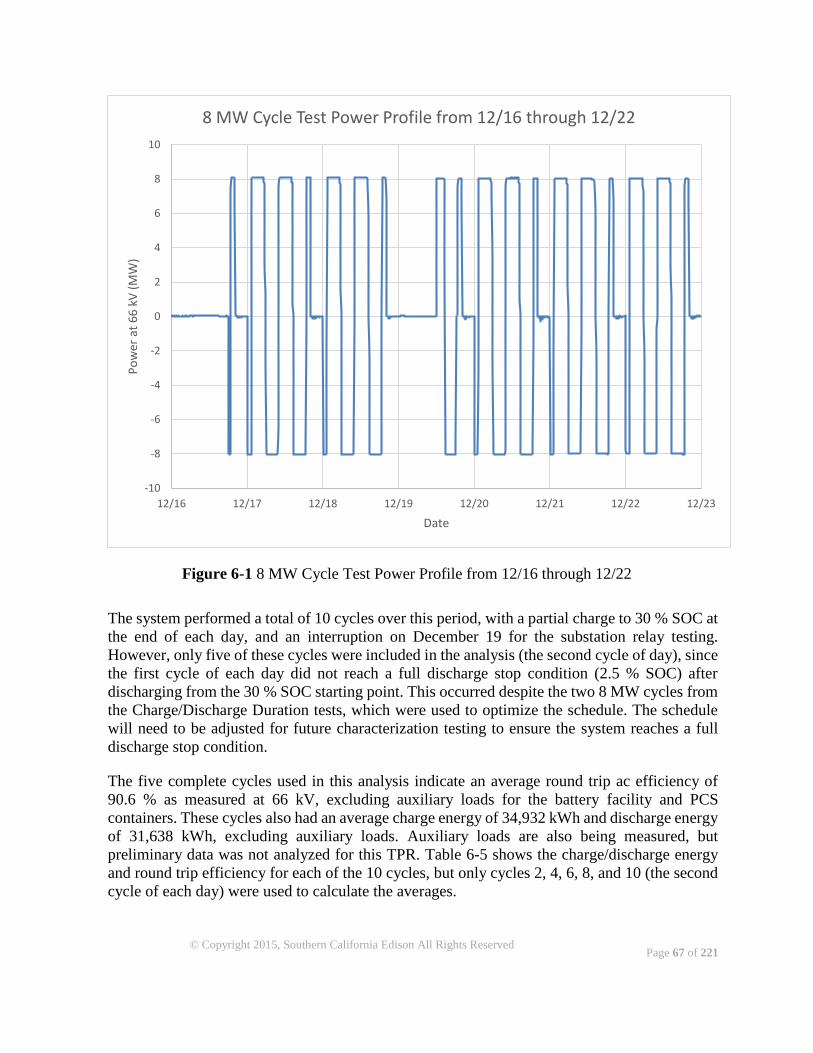
Page 67 of 221
© Copyright 2015, Southern California Edison All Rights Reserved
Figure 6-1 8 MW Cycle Test Power Profile from 12/16 through 12/22
The system performed a total of 10 cycles over this period, with a partial charge to 30 % SOC at
the end of each day, and an interruption on December 19 for the substation relay testing.
However, only five of these cycles were included in the analysis (the second cycle of day), since
the first cycle of each day did not reach a full discharge stop condition (2.5 % SOC) after
discharging from the 30 % SOC starting point. This occurred despite the two 8 MW cycles from
the Charge/Discharge Duration tests, which were used to optimize the schedule. The schedule
will need to be adjusted for future characterization testing to ensure the system reaches a full
discharge stop condition.
The five complete cycles used in this analysis indicate an average round trip ac efficiency of
90.6 % as measured at 66 kV, excluding auxiliary loads for the battery facility and PCS
containers. These cycles also had an average charge energy of 34,932 kWh and discharge energy
of 31,638 kWh, excluding auxiliary loads. Auxiliary loads are also being measured, but
preliminary data was not analyzed for this TPR. Table 6-5 shows the charge/discharge energy
and round trip efficiency for each of the 10 cycles, but only cycles 2, 4, 6, 8, and 10 (the second
cycle of each day) were used to calculate the averages.
-10
-8
-6
-4
-2
0
2
4
6
8
10
12/16 12/17 12/18 12/19 12/20 12/21 12/22 12/23
Po
wer
at
66
kV
(M
W)
Date
8 MW Cycle Test Power Profile from 12/16 through 12/22
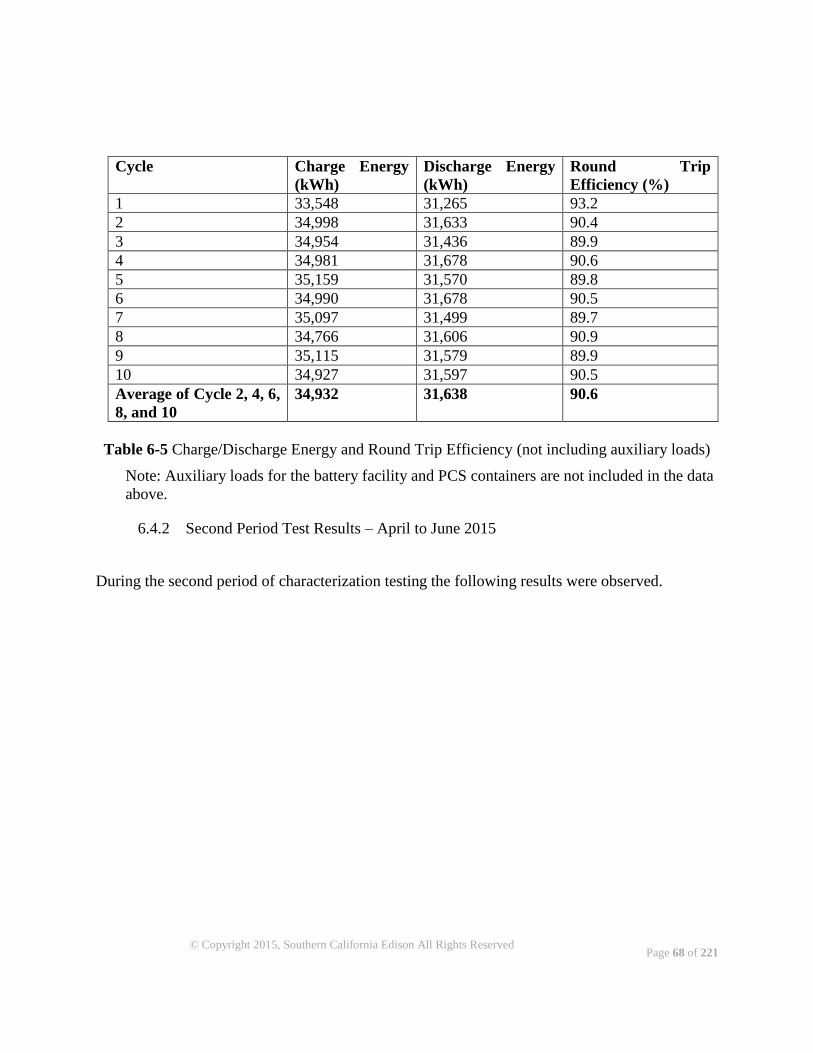
Page 68 of 221
© Copyright 2015, Southern California Edison All Rights Reserved
Cycle Charge Energy
(kWh)
Discharge Energy
(kWh)
Round Trip
Efficiency (%)
1 33,548 31,265 93.2
2 34,998 31,633 90.4
3 34,954 31,436 89.9
4 34,981 31,678 90.6
5 35,159 31,570 89.8
6 34,990 31,678 90.5
7 35,097 31,499 89.7
8 34,766 31,606 90.9
9 35,115 31,579 89.9
10 34,927 31,597 90.5
Average of Cycle 2, 4, 6,
8, and 10
34,932 31,638 90.6
Table 6-5 Charge/Discharge Energy and Round Trip Efficiency (not including auxiliary loads)
Note: Auxiliary loads for the battery facility and PCS containers are not included in the data
above.
6.4.2 Second Period Test Results – April to June 2015
During the second period of characterization testing the following results were observed.
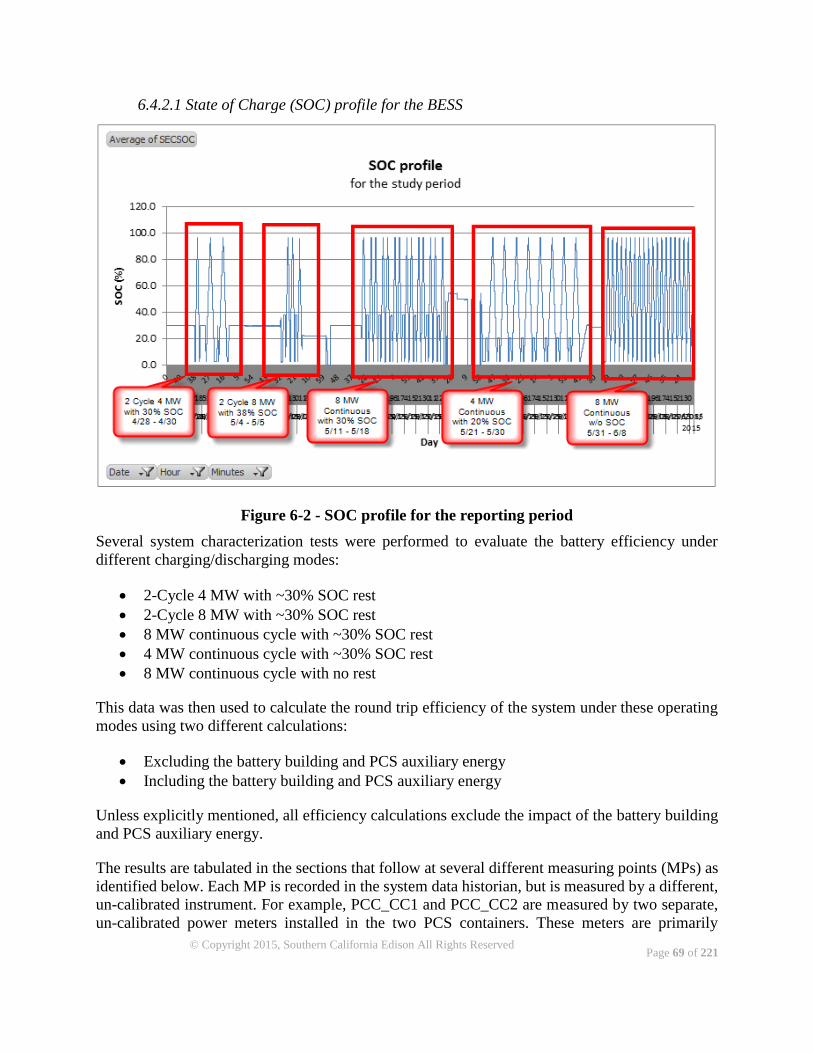
Page 69 of 221
© Copyright 2015, Southern California Edison All Rights Reserved
6.4.2.1 State of Charge (SOC) profile for the BESS
Figure 6-2 - SOC profile for the reporting period
Several system characterization tests were performed to evaluate the battery efficiency under
different charging/discharging modes:
2-Cycle 4 MW with ~30% SOC rest
2-Cycle 8 MW with ~30% SOC rest
8 MW continuous cycle with ~30% SOC rest
4 MW continuous cycle with ~30% SOC rest
8 MW continuous cycle with no rest
This data was then used to calculate the round trip efficiency of the system under these operating
modes using two different calculations:
Excluding the battery building and PCS auxiliary energy
Including the battery building and PCS auxiliary energy
Unless explicitly mentioned, all efficiency calculations exclude the impact of the battery building
and PCS auxiliary energy.
The results are tabulated in the sections that follow at several different measuring points (MPs) as
identified below. Each MP is recorded in the system data historian, but is measured by a different,
un-calibrated instrument. For example, PCC_CC1 and PCC_CC2 are measured by two separate,
un-calibrated power meters installed in the two PCS containers. These meters are primarily
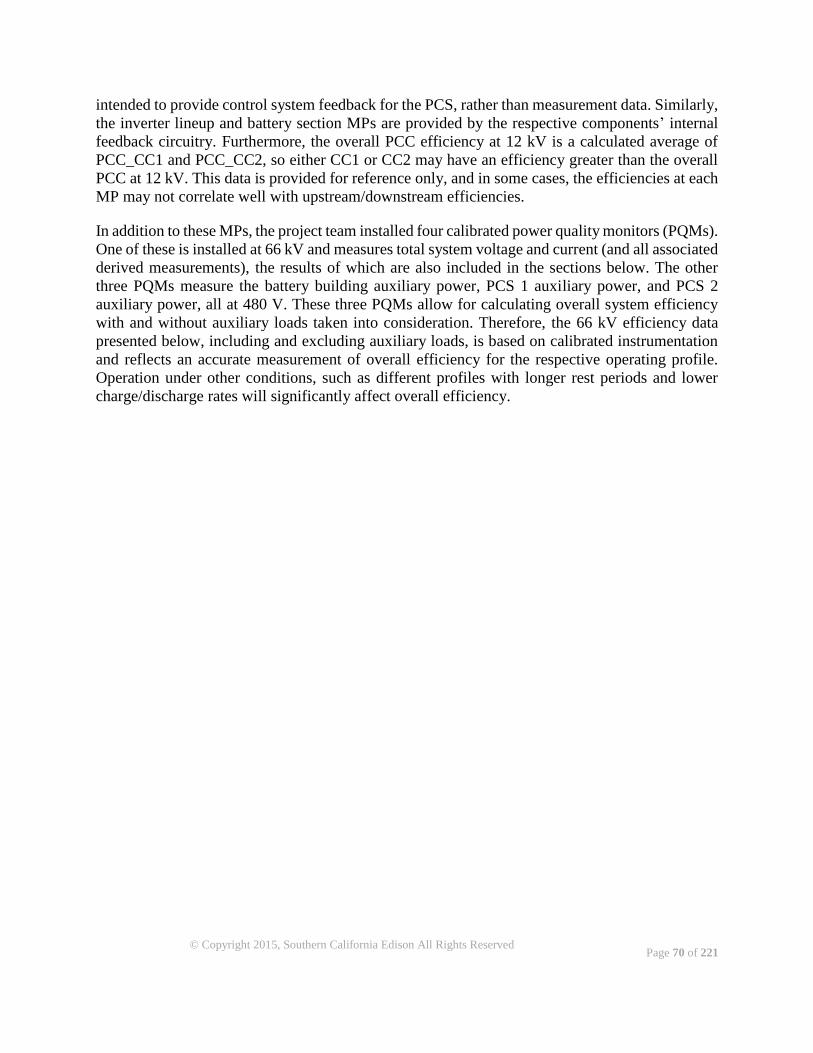
Page 70 of 221
© Copyright 2015, Southern California Edison All Rights Reserved
intended to provide control system feedback for the PCS, rather than measurement data. Similarly,
the inverter lineup and battery section MPs are provided by the respective components’ internal
feedback circuitry. Furthermore, the overall PCC efficiency at 12 kV is a calculated average of
PCC_CC1 and PCC_CC2, so either CC1 or CC2 may have an efficiency greater than the overall
PCC at 12 kV. This data is provided for reference only, and in some cases, the efficiencies at each
MP may not correlate well with upstream/downstream efficiencies.
In addition to these MPs, the project team installed four calibrated power quality monitors (PQMs).
One of these is installed at 66 kV and measures total system voltage and current (and all associated
derived measurements), the results of which are also included in the sections below. The other
three PQMs measure the battery building auxiliary power, PCS 1 auxiliary power, and PCS 2
auxiliary power, all at 480 V. These three PQMs allow for calculating overall system efficiency
with and without auxiliary loads taken into consideration. Therefore, the 66 kV efficiency data
presented below, including and excluding auxiliary loads, is based on calibrated instrumentation
and reflects an accurate measurement of overall efficiency for the respective operating profile.
Operation under other conditions, such as different profiles with longer rest periods and lower
charge/discharge rates will significantly affect overall efficiency.
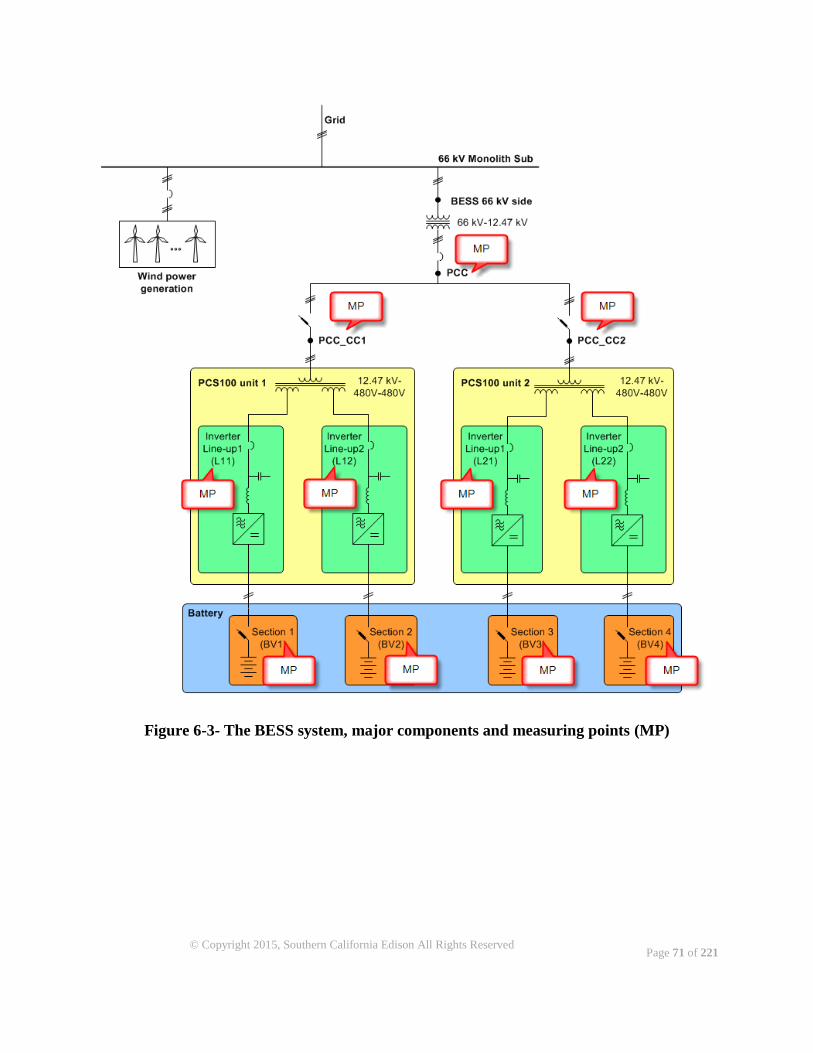
Page 71 of 221
© Copyright 2015, Southern California Edison All Rights Reserved
Figure 6-3- The BESS system, major components and measuring points (MP)
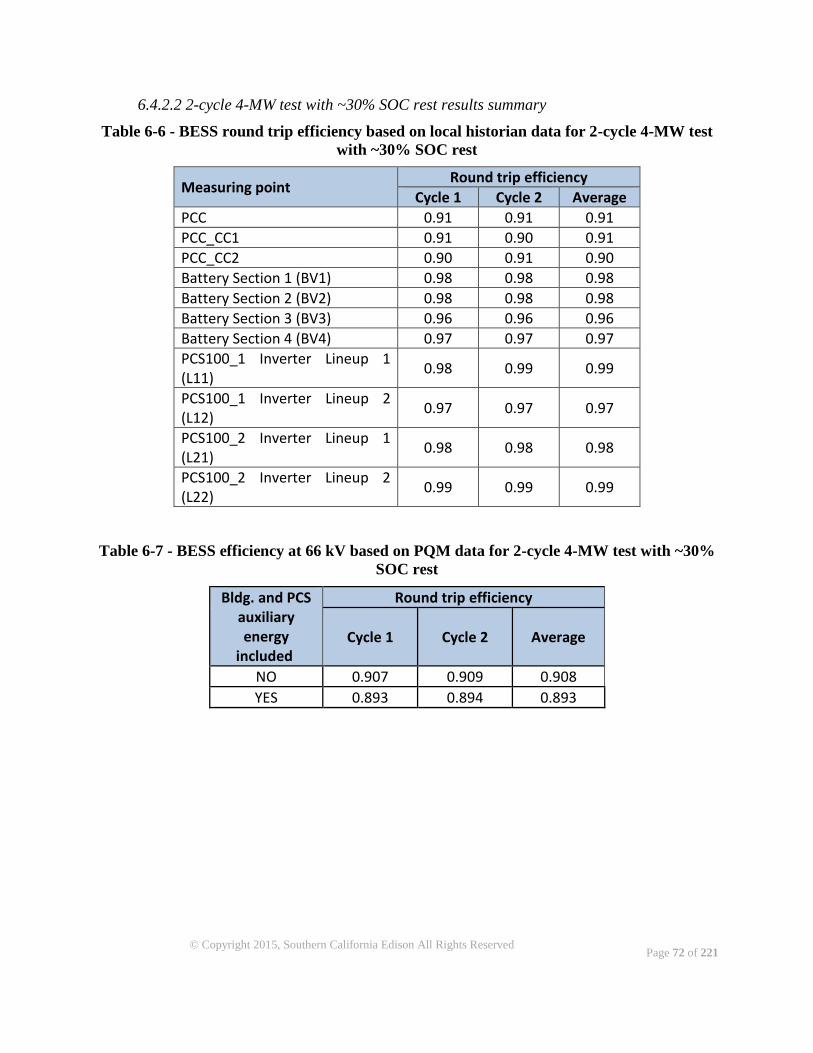
Page 72 of 221
© Copyright 2015, Southern California Edison All Rights Reserved
6.4.2.2 2-cycle 4-MW test with ~30% SOC rest results summary
Table 6-6 - BESS round trip efficiency based on local historian data for 2-cycle 4-MW test
with ~30% SOC rest
Measuring point Round trip efficiency
Cycle 1 Cycle 2 Average
PCC 0.91 0.91 0.91
PCC_CC1 0.91 0.90 0.91
PCC_CC2 0.90 0.91 0.90
Battery Section 1 (BV1) 0.98 0.98 0.98
Battery Section 2 (BV2) 0.98 0.98 0.98
Battery Section 3 (BV3) 0.96 0.96 0.96
Battery Section 4 (BV4) 0.97 0.97 0.97
PCS100_1 Inverter Lineup 1 (L11)
0.98 0.99 0.99
PCS100_1 Inverter Lineup 2 (L12)
0.97 0.97 0.97
PCS100_2 Inverter Lineup 1 (L21)
0.98 0.98 0.98
PCS100_2 Inverter Lineup 2 (L22)
0.99 0.99 0.99
Table 6-7 - BESS efficiency at 66 kV based on PQM data for 2-cycle 4-MW test with ~30%
SOC rest
Bldg. and PCS auxiliary energy
included
Round trip efficiency
Cycle 1 Cycle 2 Average
NO 0.907 0.909 0.908
YES 0.893 0.894 0.893
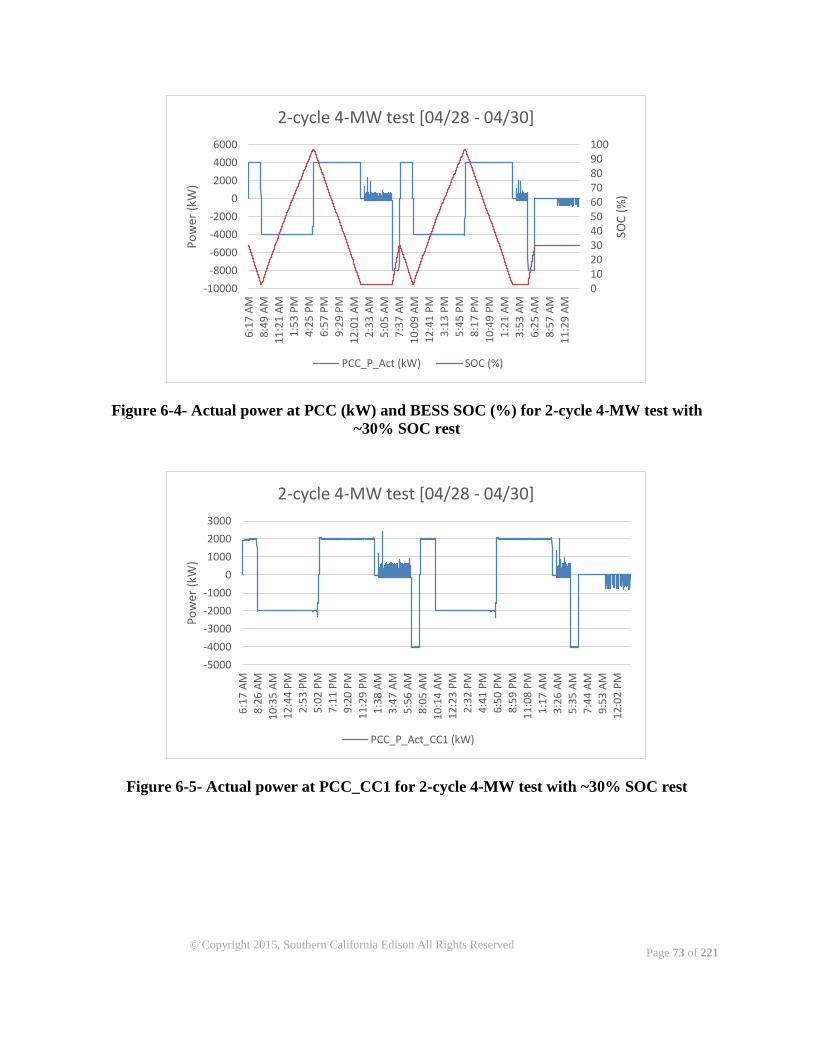
Page 73 of 221
© Copyright 2015, Southern California Edison All Rights Reserved
Figure 6-4- Actual power at PCC (kW) and BESS SOC (%) for 2-cycle 4-MW test with
~30% SOC rest
Figure 6-5- Actual power at PCC_CC1 for 2-cycle 4-MW test with ~30% SOC rest
0102030405060708090100
-10000
-8000
-6000
-4000
-2000
0
2000
4000
6000
6:1
7 A
M
8:4
9 A
M
11
:21
AM
1:5
3 P
M
4:2
5 P
M
6:5
7 P
M
9:2
9 P
M
12
:01
AM
2:3
3 A
M
5:0
5 A
M
7:3
7 A
M
10
:09
AM
12
:41
PM
3:1
3 P
M
5:4
5 P
M
8:1
7 P
M
10
:49
PM
1:2
1 A
M
3:5
3 A
M
6:2
5 A
M
8:5
7 A
M
11
:29
AM
SOC
(%
)
Po
wer
(kW
)
2-cycle 4-MW test [04/28 - 04/30]
PCC_P_Act (kW) SOC (%)
-5000
-4000
-3000
-2000
-1000
0
1000
2000
3000
6:1
7 A
M
8:2
6 A
M1
0:3
5 A
M
12
:44
PM
2:5
3 P
M
5:0
2 P
M7
:11
PM
9:2
0 P
M
11
:29
PM
1:3
8 A
M
3:4
7 A
M
5:5
6 A
M8
:05
AM
10
:14
AM
12
:23
PM
2:3
2 P
M4
:41
PM
6:5
0 P
M
8:5
9 P
M
11
:08
PM
1:1
7 A
M
3:2
6 A
M5
:35
AM
7:4
4 A
M
9:5
3 A
M
12
:02
PM
Po
wer
(kW
)
2-cycle 4-MW test [04/28 - 04/30]
PCC_P_Act_CC1 (kW)
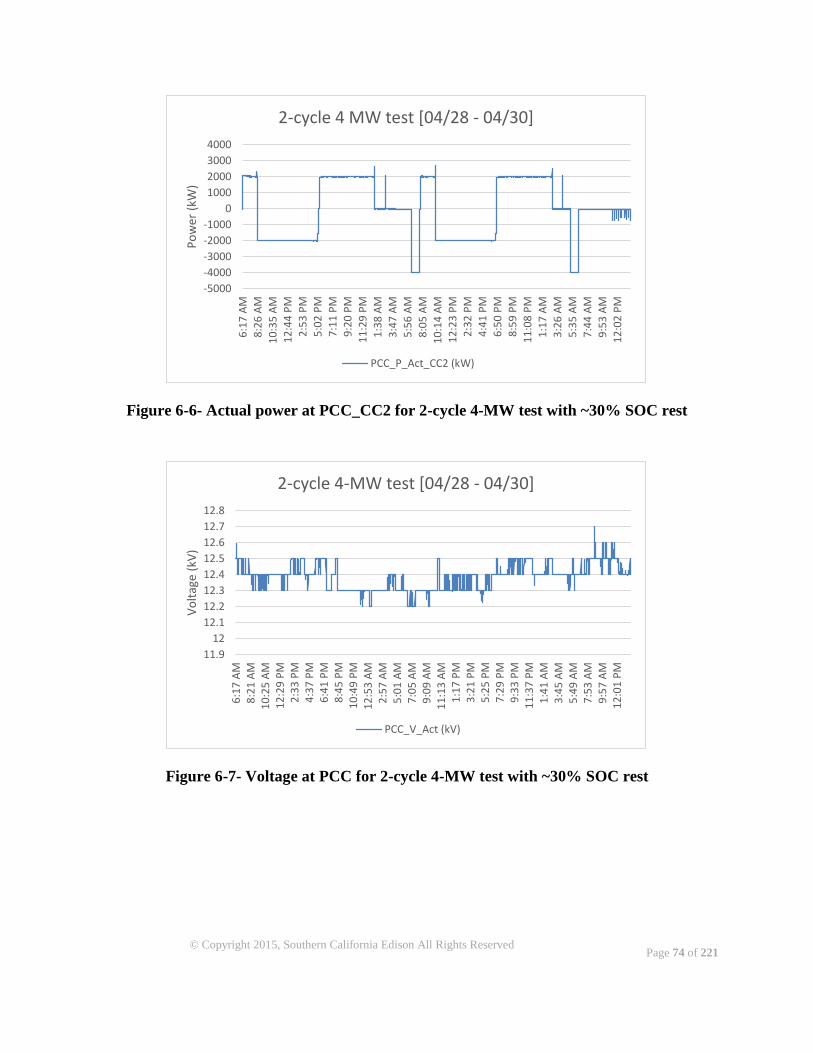
Page 74 of 221
© Copyright 2015, Southern California Edison All Rights Reserved
Figure 6-6- Actual power at PCC_CC2 for 2-cycle 4-MW test with ~30% SOC rest
Figure 6-7- Voltage at PCC for 2-cycle 4-MW test with ~30% SOC rest
-5000
-4000
-3000
-2000
-1000
0
1000
2000
3000
4000
6:1
7 A
M
8:2
6 A
M1
0:3
5 A
M
12
:44
PM
2:5
3 P
M
5:0
2 P
M7
:11
PM
9:2
0 P
M
11
:29
PM
1:3
8 A
M
3:4
7 A
M
5:5
6 A
M8
:05
AM
10
:14
AM
12
:23
PM
2:3
2 P
M4
:41
PM
6:5
0 P
M
8:5
9 P
M
11
:08
PM
1:1
7 A
M
3:2
6 A
M5
:35
AM
7:4
4 A
M
9:5
3 A
M
12
:02
PM
Po
wer
(kW
)
2-cycle 4 MW test [04/28 - 04/30]
PCC_P_Act_CC2 (kW)
11.9
12
12.1
12.2
12.3
12.4
12.5
12.6
12.7
12.8
6:1
7 A
M8
:21
AM
10
:25
AM
12
:29
PM
2:3
3 P
M4
:37
PM
6:4
1 P
M8
:45
PM
10
:49
PM
12
:53
AM
2:5
7 A
M5
:01
AM
7:0
5 A
M9
:09
AM
11
:13
AM
1:1
7 P
M3
:21
PM
5:2
5 P
M7
:29
PM
9:3
3 P
M1
1:3
7 P
M1
:41
AM
3:4
5 A
M5
:49
AM
7:5
3 A
M9
:57
AM
12
:01
PM
Vo
ltag
e (k
V)
2-cycle 4-MW test [04/28 - 04/30]
PCC_V_Act (kV)
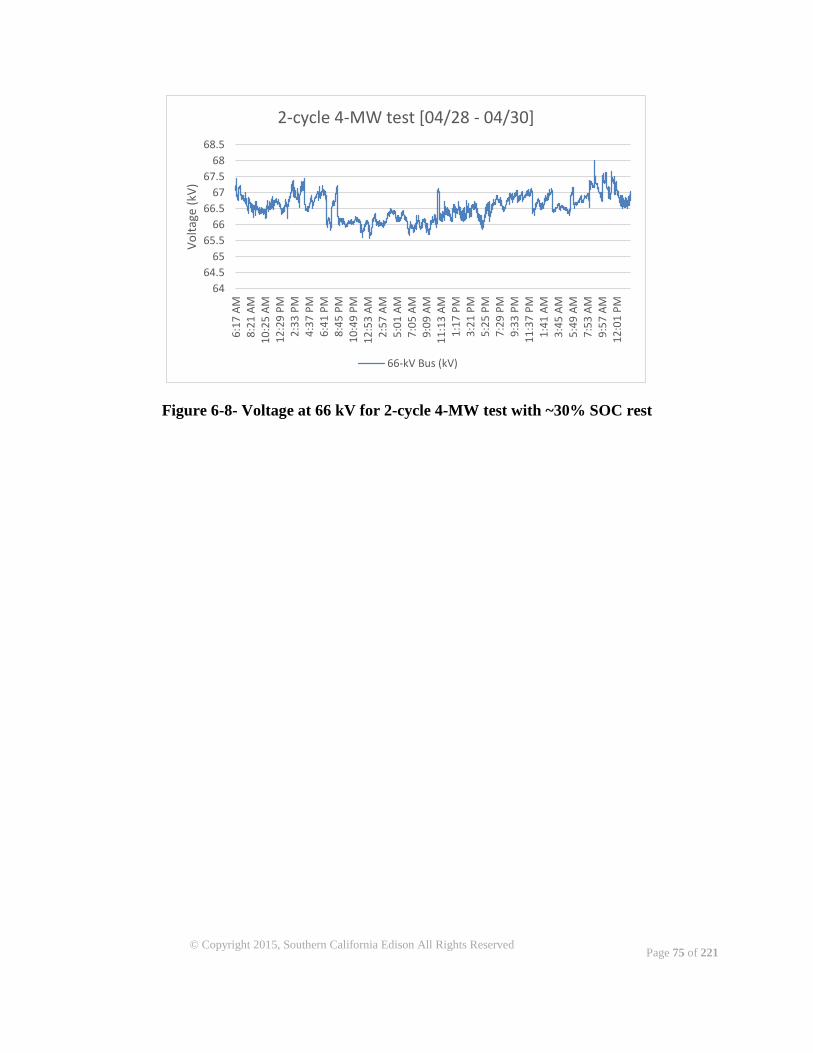
Page 75 of 221
© Copyright 2015, Southern California Edison All Rights Reserved
Figure 6-8- Voltage at 66 kV for 2-cycle 4-MW test with ~30% SOC rest
64
64.5
65
65.5
66
66.5
67
67.5
68
68.5
6:1
7 A
M8
:21
AM
10
:25
AM
12
:29
PM
2:3
3 P
M4
:37
PM
6:4
1 P
M8
:45
PM
10
:49
PM
12
:53
AM
2:5
7 A
M5
:01
AM
7:0
5 A
M9
:09
AM
11
:13
AM
1:1
7 P
M3
:21
PM
5:2
5 P
M7
:29
PM
9:3
3 P
M1
1:3
7 P
M1
:41
AM
3:4
5 A
M5
:49
AM
7:5
3 A
M9
:57
AM
12
:01
PM
Vo
ltag
e (k
V)
2-cycle 4-MW test [04/28 - 04/30]
66-kV Bus (kV)
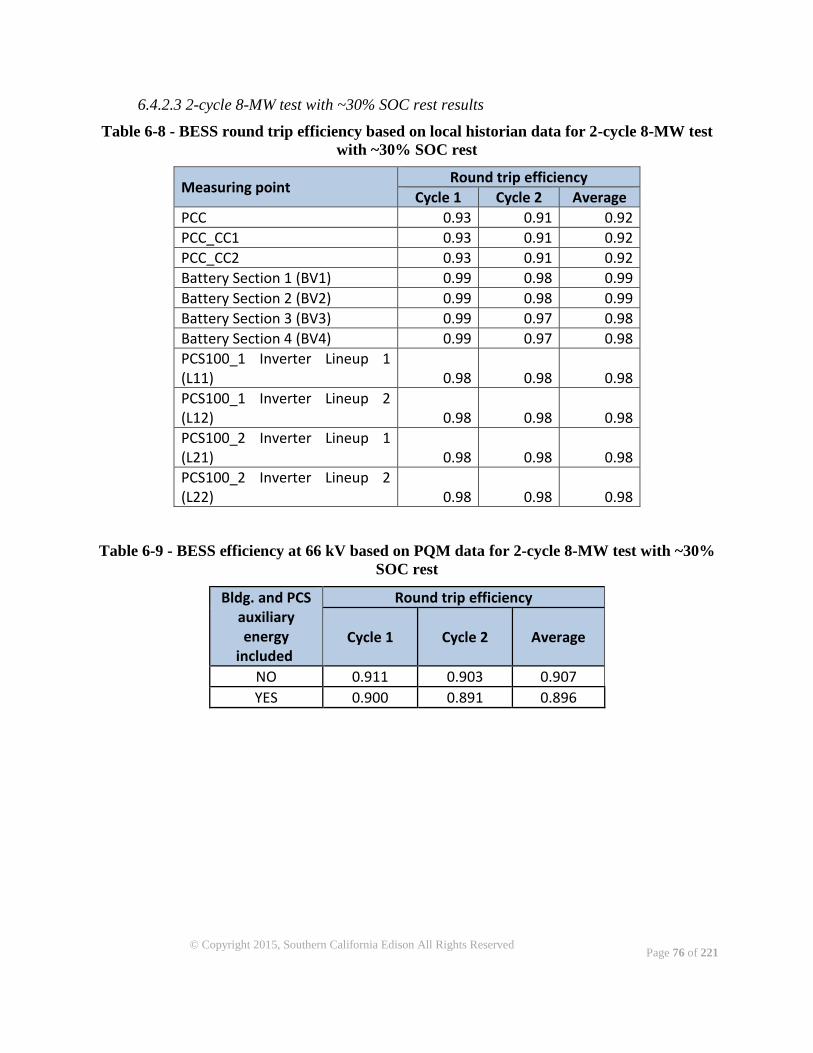
Page 76 of 221
© Copyright 2015, Southern California Edison All Rights Reserved
6.4.2.3 2-cycle 8-MW test with ~30% SOC rest results
Table 6-8 - BESS round trip efficiency based on local historian data for 2-cycle 8-MW test
with ~30% SOC rest
Measuring point Round trip efficiency
Cycle 1 Cycle 2 Average
PCC 0.93 0.91 0.92
PCC_CC1 0.93 0.91 0.92
PCC_CC2 0.93 0.91 0.92
Battery Section 1 (BV1) 0.99 0.98 0.99
Battery Section 2 (BV2) 0.99 0.98 0.99
Battery Section 3 (BV3) 0.99 0.97 0.98
Battery Section 4 (BV4) 0.99 0.97 0.98
PCS100_1 Inverter Lineup 1 (L11) 0.98 0.98 0.98
PCS100_1 Inverter Lineup 2 (L12) 0.98 0.98 0.98
PCS100_2 Inverter Lineup 1 (L21) 0.98 0.98 0.98
PCS100_2 Inverter Lineup 2 (L22) 0.98 0.98 0.98
Table 6-9 - BESS efficiency at 66 kV based on PQM data for 2-cycle 8-MW test with ~30%
SOC rest
Bldg. and PCS auxiliary energy
included
Round trip efficiency
Cycle 1 Cycle 2 Average
NO 0.911 0.903 0.907
YES 0.900 0.891 0.896
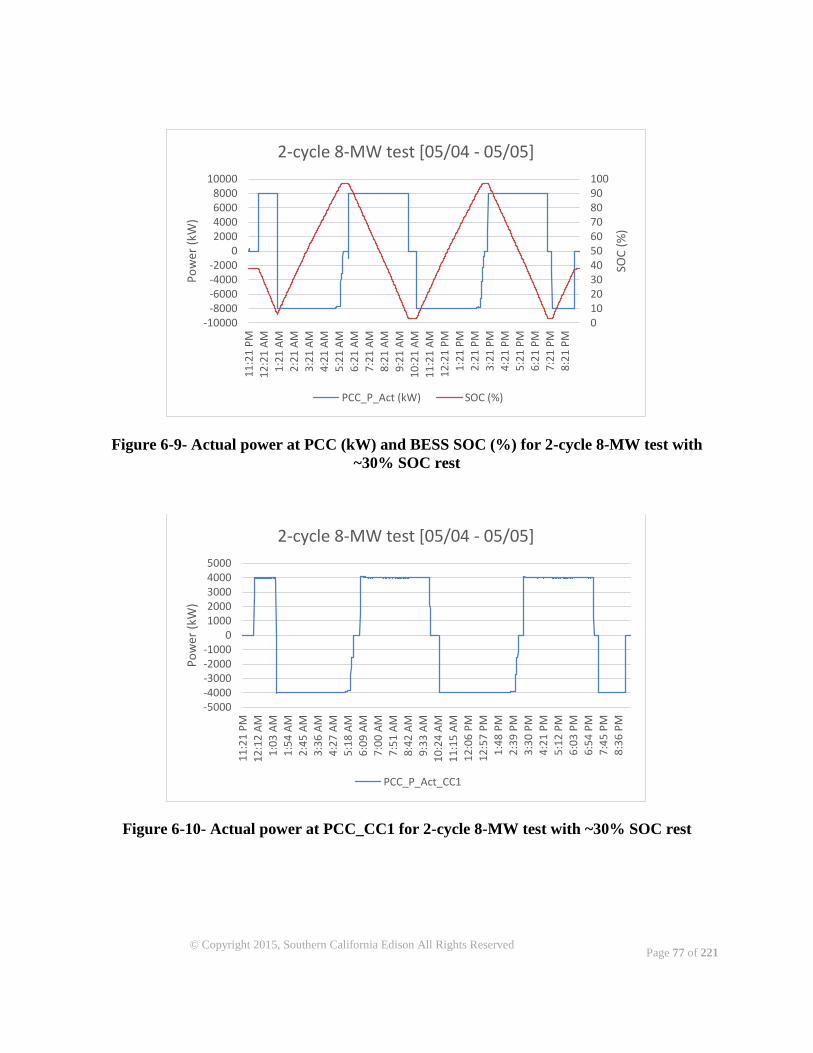
Page 77 of 221
© Copyright 2015, Southern California Edison All Rights Reserved
Figure 6-9- Actual power at PCC (kW) and BESS SOC (%) for 2-cycle 8-MW test with
~30% SOC rest
Figure 6-10- Actual power at PCC_CC1 for 2-cycle 8-MW test with ~30% SOC rest
0102030405060708090100
-10000-8000-6000-4000-2000
02000400060008000
10000
11
:21
PM
12
:21
AM
1:2
1 A
M
2:2
1 A
M
3:2
1 A
M
4:2
1 A
M
5:2
1 A
M
6:2
1 A
M
7:2
1 A
M
8:2
1 A
M
9:2
1 A
M
10
:21
AM
11
:21
AM
12
:21
PM
1:2
1 P
M
2:2
1 P
M
3:2
1 P
M
4:2
1 P
M
5:2
1 P
M
6:2
1 P
M
7:2
1 P
M
8:2
1 P
M
SOC
(%
)
Po
wer
(kW
)
2-cycle 8-MW test [05/04 - 05/05]
PCC_P_Act (kW) SOC (%)
-5000-4000-3000-2000-1000
010002000300040005000
11
:21
PM
12
:12
AM
1:0
3 A
M
1:5
4 A
M
2:4
5 A
M
3:3
6 A
M
4:2
7 A
M
5:1
8 A
M
6:0
9 A
M
7:0
0 A
M
7:5
1 A
M
8:4
2 A
M
9:3
3 A
M
10
:24
AM
11
:15
AM
12
:06
PM
12
:57
PM
1:4
8 P
M
2:3
9 P
M
3:3
0 P
M
4:2
1 P
M
5:1
2 P
M
6:0
3 P
M
6:5
4 P
M
7:4
5 P
M
8:3
6 P
M
Po
wer
(kW
)
2-cycle 8-MW test [05/04 - 05/05]
PCC_P_Act_CC1
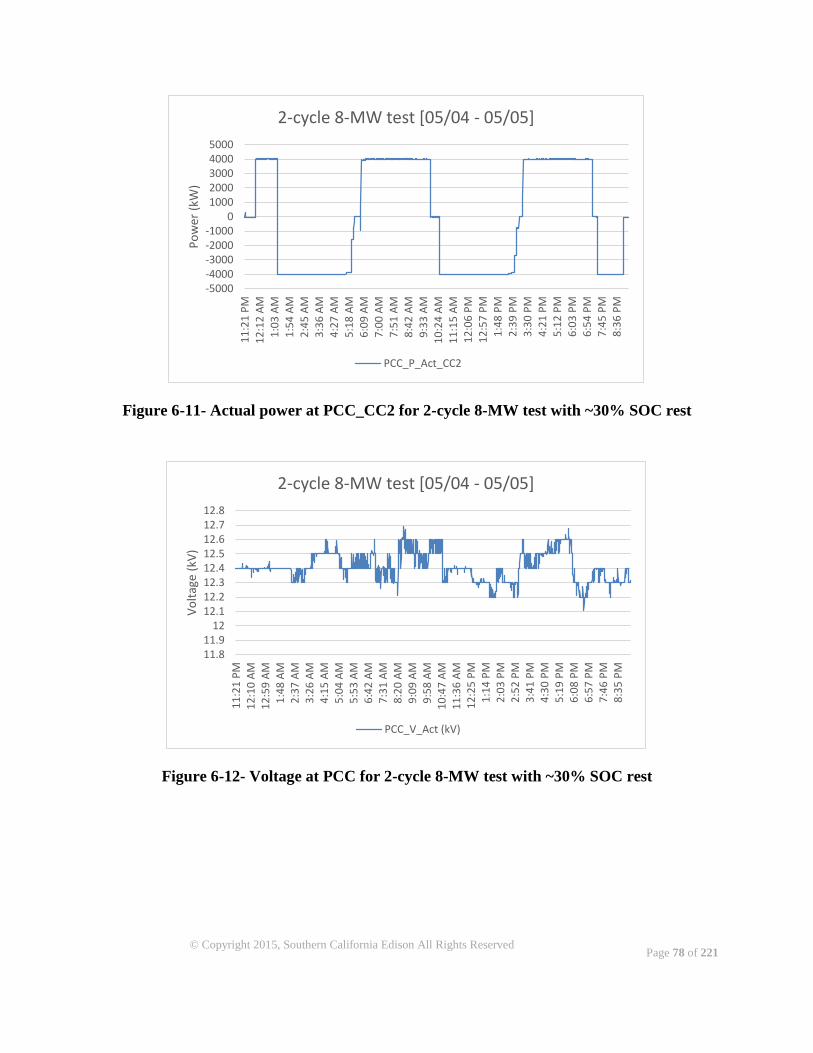
Page 78 of 221
© Copyright 2015, Southern California Edison All Rights Reserved
Figure 6-11- Actual power at PCC_CC2 for 2-cycle 8-MW test with ~30% SOC rest
Figure 6-12- Voltage at PCC for 2-cycle 8-MW test with ~30% SOC rest
-5000-4000-3000-2000-1000
010002000300040005000
11
:21
PM
12
:12
AM
1:0
3 A
M1
:54
AM
2:4
5 A
M3
:36
AM
4:2
7 A
M5
:18
AM
6:0
9 A
M7
:00
AM
7:5
1 A
M8
:42
AM
9:3
3 A
M1
0:2
4 A
M1
1:1
5 A
M1
2:0
6 P
M1
2:5
7 P
M1
:48
PM
2:3
9 P
M3
:30
PM
4:2
1 P
M5
:12
PM
6:0
3 P
M6
:54
PM
7:4
5 P
M8
:36
PM
Po
wer
(kW
)
2-cycle 8-MW test [05/04 - 05/05]
PCC_P_Act_CC2
11.811.9
1212.112.212.312.412.512.612.712.8
11
:21
PM
12
:10
AM
12
:59
AM
1:4
8 A
M2
:37
AM
3:2
6 A
M4
:15
AM
5:0
4 A
M5
:53
AM
6:4
2 A
M7
:31
AM
8:2
0 A
M9
:09
AM
9:5
8 A
M1
0:4
7 A
M1
1:3
6 A
M1
2:2
5 P
M1
:14
PM
2:0
3 P
M2
:52
PM
3:4
1 P
M4
:30
PM
5:1
9 P
M6
:08
PM
6:5
7 P
M7
:46
PM
8:3
5 P
M
Vo
ltag
e (k
V)
2-cycle 8-MW test [05/04 - 05/05]
PCC_V_Act (kV)

Page 79 of 221
© Copyright 2015, Southern California Edison All Rights Reserved
Figure 6-13- Voltage at 66-kV for 2-cycle 8-MW test with ~30% SOC rest
63.564
64.565
65.566
66.567
67.568
68.5
11
:21
PM
12
:10
AM
12
:59
AM
1:4
8 A
M2
:37
AM
3:2
6 A
M4
:15
AM
5:0
4 A
M5
:53
AM
6:4
2 A
M7
:31
AM
8:2
0 A
M9
:09
AM
9:5
8 A
M1
0:4
7 A
M1
1:3
6 A
M1
2:2
5 P
M1
:14
PM
2:0
3 P
M2
:52
PM
3:4
1 P
M4
:30
PM
5:1
9 P
M6
:08
PM
6:5
7 P
M7
:46
PM
8:3
5 P
M
Vo
ltag
e (k
V)
2-cycle 8-MW test [05/04 - 05/05]
66-kV bus (kV)
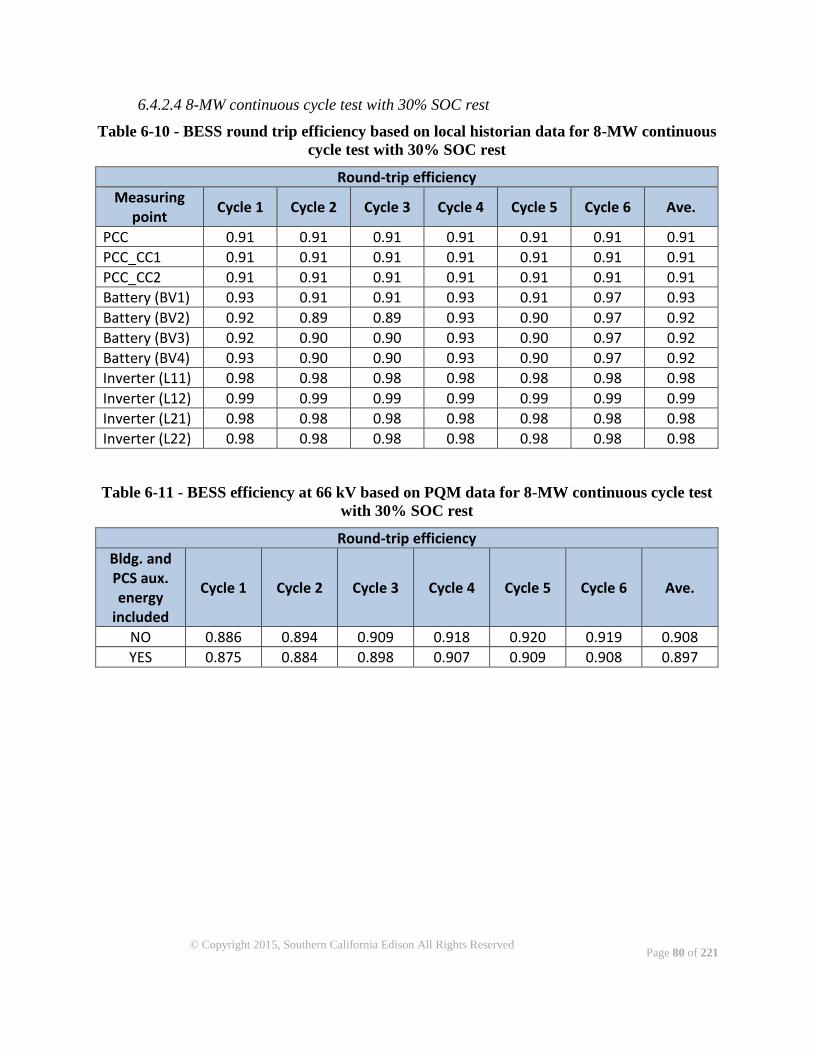
Page 80 of 221
© Copyright 2015, Southern California Edison All Rights Reserved
6.4.2.4 8-MW continuous cycle test with 30% SOC rest
Table 6-10 - BESS round trip efficiency based on local historian data for 8-MW continuous
cycle test with 30% SOC rest
Round-trip efficiency
Measuring point
Cycle 1 Cycle 2 Cycle 3 Cycle 4 Cycle 5 Cycle 6 Ave.
PCC 0.91 0.91 0.91 0.91 0.91 0.91 0.91
PCC_CC1 0.91 0.91 0.91 0.91 0.91 0.91 0.91
PCC_CC2 0.91 0.91 0.91 0.91 0.91 0.91 0.91
Battery (BV1) 0.93 0.91 0.91 0.93 0.91 0.97 0.93
Battery (BV2) 0.92 0.89 0.89 0.93 0.90 0.97 0.92
Battery (BV3) 0.92 0.90 0.90 0.93 0.90 0.97 0.92
Battery (BV4) 0.93 0.90 0.90 0.93 0.90 0.97 0.92
Inverter (L11) 0.98 0.98 0.98 0.98 0.98 0.98 0.98
Inverter (L12) 0.99 0.99 0.99 0.99 0.99 0.99 0.99
Inverter (L21) 0.98 0.98 0.98 0.98 0.98 0.98 0.98
Inverter (L22) 0.98 0.98 0.98 0.98 0.98 0.98 0.98
Table 6-11 - BESS efficiency at 66 kV based on PQM data for 8-MW continuous cycle test
with 30% SOC rest
Round-trip efficiency
Bldg. and PCS aux. energy
included
Cycle 1 Cycle 2 Cycle 3 Cycle 4 Cycle 5 Cycle 6 Ave.
NO 0.886 0.894 0.909 0.918 0.920 0.919 0.908
YES 0.875 0.884 0.898 0.907 0.909 0.908 0.897
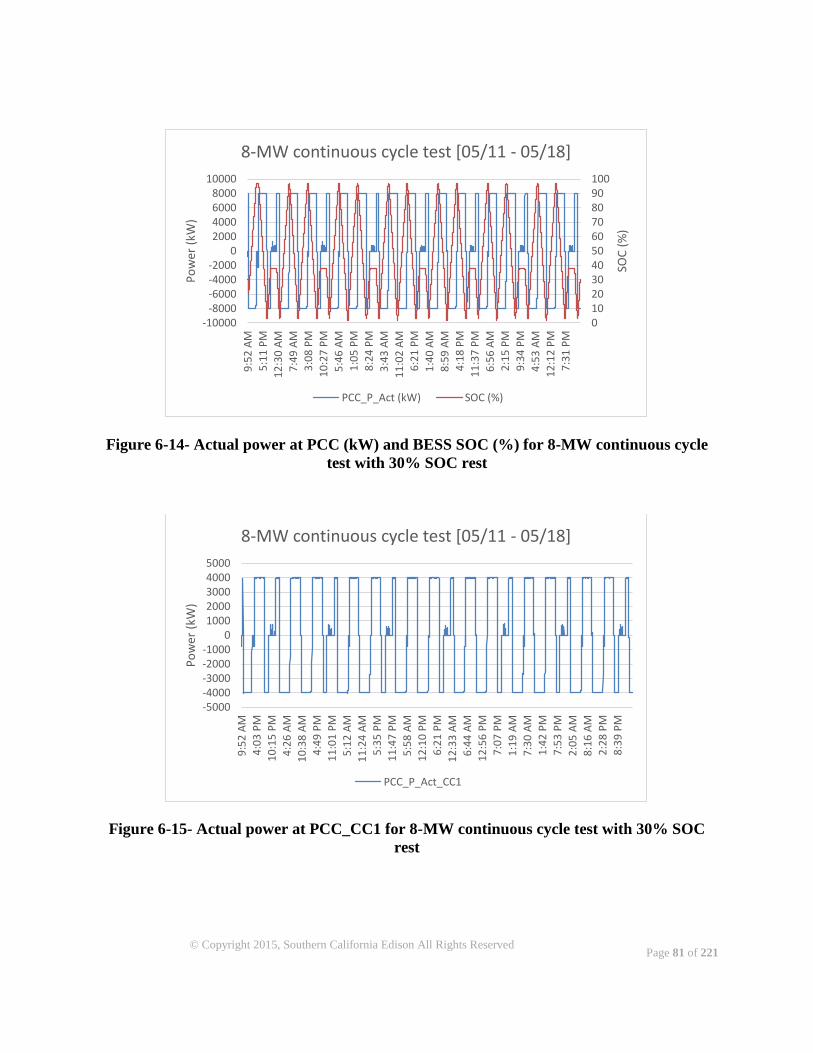
Page 81 of 221
© Copyright 2015, Southern California Edison All Rights Reserved
Figure 6-14- Actual power at PCC (kW) and BESS SOC (%) for 8-MW continuous cycle
test with 30% SOC rest
Figure 6-15- Actual power at PCC_CC1 for 8-MW continuous cycle test with 30% SOC
rest
0102030405060708090100
-10000-8000-6000-4000-2000
02000400060008000
10000
9:5
2 A
M
5:1
1 P
M
12
:30
AM
7:4
9 A
M
3:0
8 P
M
10
:27
PM
5:4
6 A
M
1:0
5 P
M
8:2
4 P
M
3:4
3 A
M
11
:02
AM
6:2
1 P
M
1:4
0 A
M
8:5
9 A
M
4:1
8 P
M
11
:37
PM
6:5
6 A
M
2:1
5 P
M
9:3
4 P
M
4:5
3 A
M
12
:12
PM
7:3
1 P
M
SOC
(%
)
Po
wer
(kW
)
8-MW continuous cycle test [05/11 - 05/18]
PCC_P_Act (kW) SOC (%)
-5000-4000-3000-2000-1000
010002000300040005000
9:5
2 A
M
4:0
3 P
M
10
:15
PM
4:2
6 A
M
10
:38
AM
4:4
9 P
M
11
:01
PM
5:1
2 A
M
11
:24
AM
5:3
5 P
M
11
:47
PM
5:5
8 A
M
12
:10
PM
6:2
1 P
M
12
:33
AM
6:4
4 A
M
12
:56
PM
7:0
7 P
M
1:1
9 A
M
7:3
0 A
M
1:4
2 P
M
7:5
3 P
M
2:0
5 A
M
8:1
6 A
M
2:2
8 P
M
8:3
9 P
M
Po
wer
(kW
)
8-MW continuous cycle test [05/11 - 05/18]
PCC_P_Act_CC1
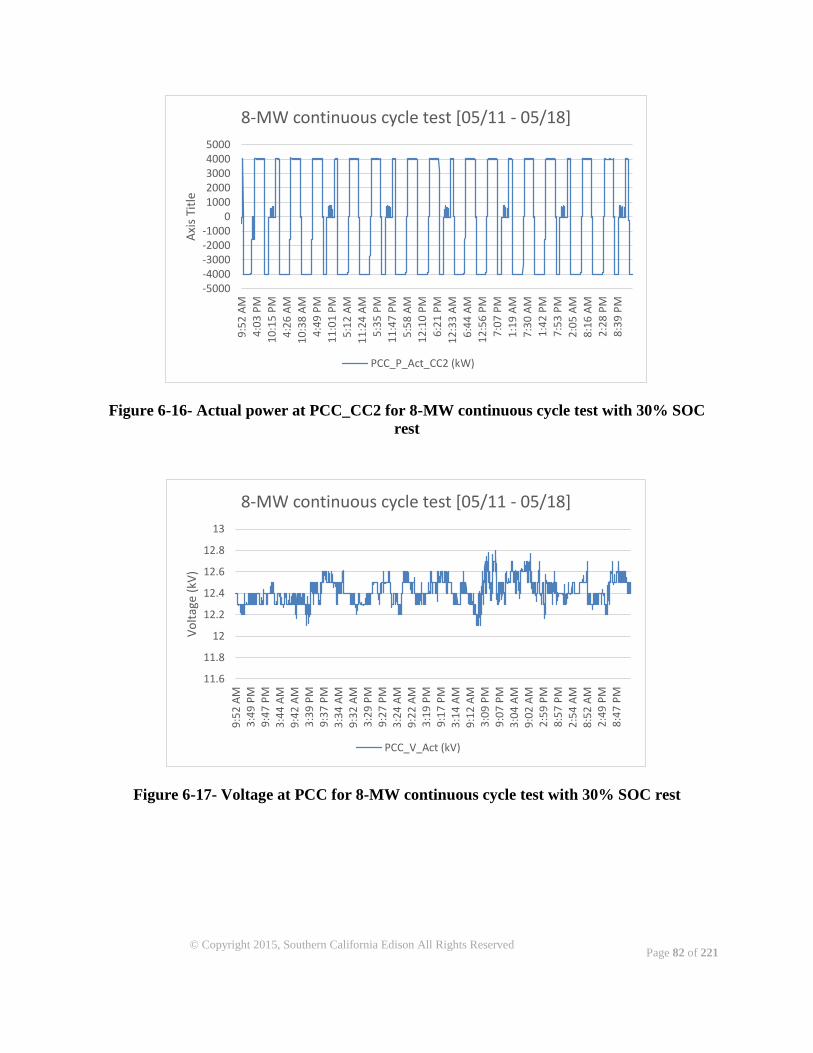
Page 82 of 221
© Copyright 2015, Southern California Edison All Rights Reserved
Figure 6-16- Actual power at PCC_CC2 for 8-MW continuous cycle test with 30% SOC
rest
Figure 6-17- Voltage at PCC for 8-MW continuous cycle test with 30% SOC rest
-5000-4000-3000-2000-1000
010002000300040005000
9:5
2 A
M
4:0
3 P
M
10
:15
PM
4:2
6 A
M
10
:38
AM
4:4
9 P
M
11
:01
PM
5:1
2 A
M
11
:24
AM
5:3
5 P
M
11
:47
PM
5:5
8 A
M
12
:10
PM
6:2
1 P
M
12
:33
AM
6:4
4 A
M
12
:56
PM
7:0
7 P
M
1:1
9 A
M
7:3
0 A
M
1:4
2 P
M
7:5
3 P
M
2:0
5 A
M
8:1
6 A
M
2:2
8 P
M
8:3
9 P
M
Axi
s Ti
tle
8-MW continuous cycle test [05/11 - 05/18]
PCC_P_Act_CC2 (kW)
11.6
11.8
12
12.2
12.4
12.6
12.8
13
9:5
2 A
M3
:49
PM
9:4
7 P
M3
:44
AM
9:4
2 A
M3
:39
PM
9:3
7 P
M3
:34
AM
9:3
2 A
M3
:29
PM
9:2
7 P
M3
:24
AM
9:2
2 A
M3
:19
PM
9:1
7 P
M3
:14
AM
9:1
2 A
M3
:09
PM
9:0
7 P
M3
:04
AM
9:0
2 A
M2
:59
PM
8:5
7 P
M2
:54
AM
8:5
2 A
M2
:49
PM
8:4
7 P
M
Vo
ltag
e (k
V)
8-MW continuous cycle test [05/11 - 05/18]
PCC_V_Act (kV)
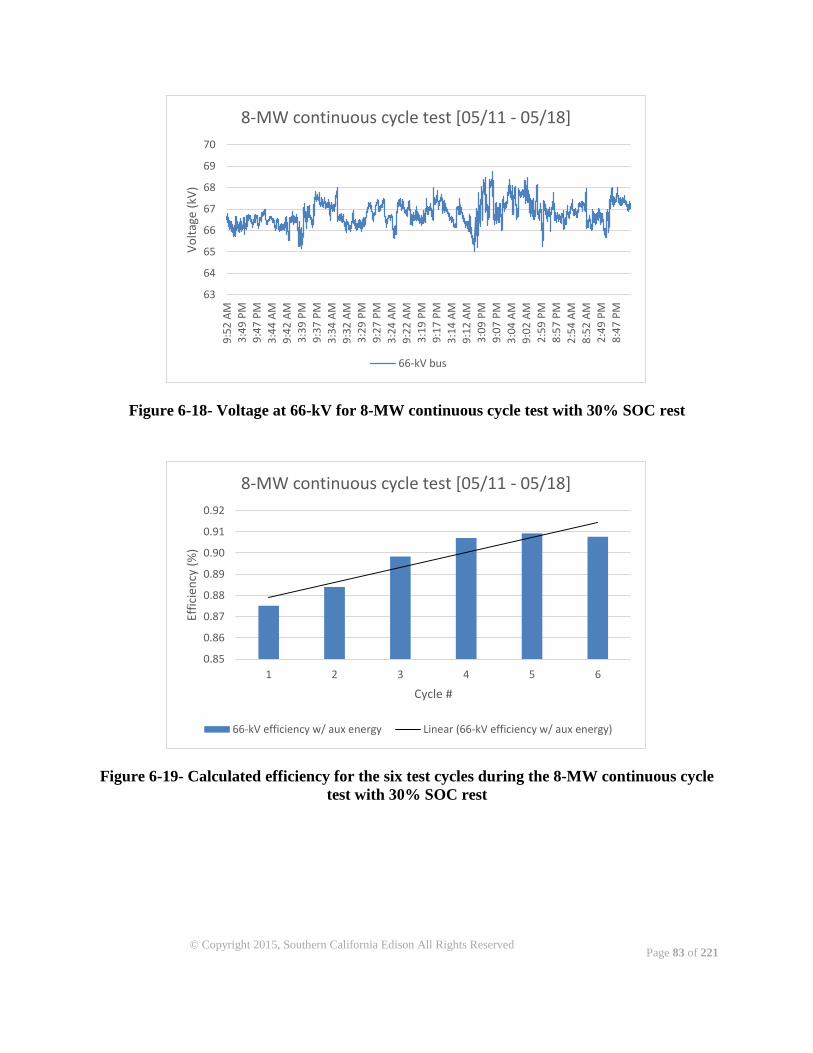
Page 83 of 221
© Copyright 2015, Southern California Edison All Rights Reserved
Figure 6-18- Voltage at 66-kV for 8-MW continuous cycle test with 30% SOC rest
Figure 6-19- Calculated efficiency for the six test cycles during the 8-MW continuous cycle
test with 30% SOC rest
63
64
65
66
67
68
69
70
9:5
2 A
M3
:49
PM
9:4
7 P
M3
:44
AM
9:4
2 A
M
3:3
9 P
M9
:37
PM
3:3
4 A
M
9:3
2 A
M
3:2
9 P
M
9:2
7 P
M3
:24
AM
9:2
2 A
M3
:19
PM
9:1
7 P
M
3:1
4 A
M
9:1
2 A
M3
:09
PM
9:0
7 P
M3
:04
AM
9:0
2 A
M
2:5
9 P
M8
:57
PM
2:5
4 A
M8
:52
AM
2:4
9 P
M
8:4
7 P
M
Vo
ltag
e (k
V)
8-MW continuous cycle test [05/11 - 05/18]
66-kV bus
0.85
0.86
0.87
0.88
0.89
0.90
0.91
0.92
1 2 3 4 5 6
Effi
cien
cy (
%)
Cycle #
8-MW continuous cycle test [05/11 - 05/18]
66-kV efficiency w/ aux energy Linear (66-kV efficiency w/ aux energy)
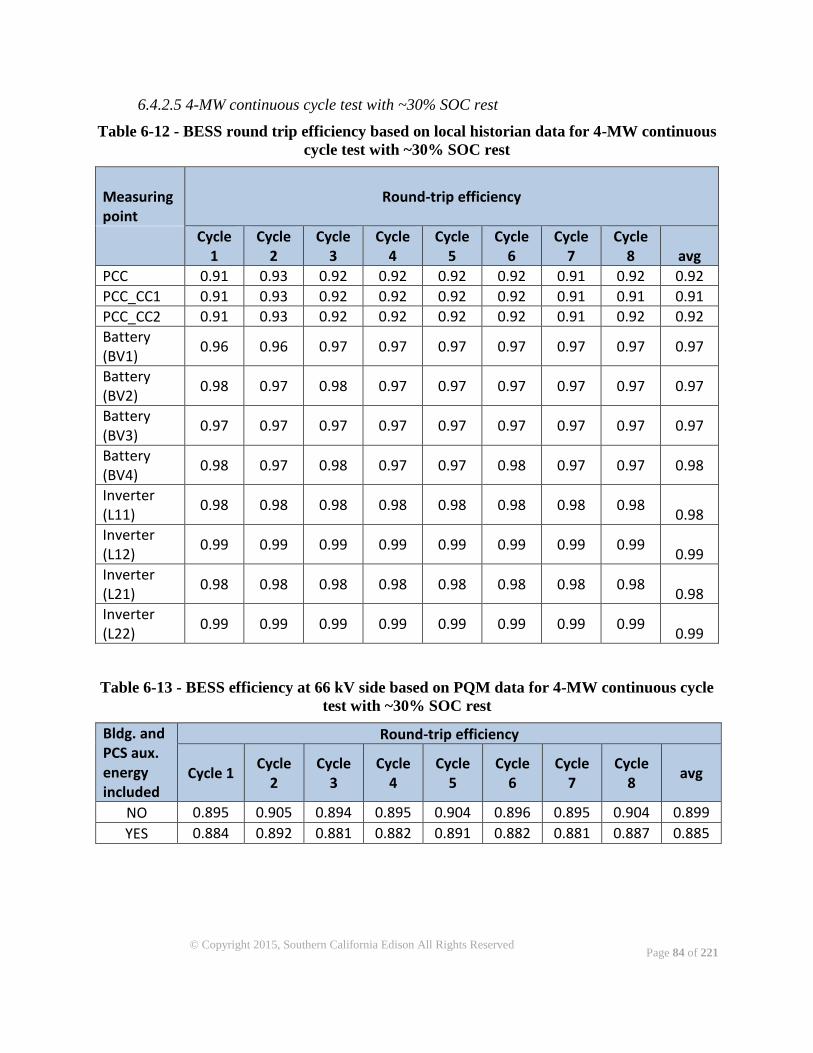
Page 84 of 221
© Copyright 2015, Southern California Edison All Rights Reserved
6.4.2.5 4-MW continuous cycle test with ~30% SOC rest
Table 6-12 - BESS round trip efficiency based on local historian data for 4-MW continuous
cycle test with ~30% SOC rest
Measuring point
Round-trip efficiency
Cycle
1 Cycle
2 Cycle
3 Cycle
4 Cycle
5 Cycle
6 Cycle
7 Cycle
8 avg
PCC 0.91 0.93 0.92 0.92 0.92 0.92 0.91 0.92 0.92
PCC_CC1 0.91 0.93 0.92 0.92 0.92 0.92 0.91 0.91 0.91
PCC_CC2 0.91 0.93 0.92 0.92 0.92 0.92 0.91 0.92 0.92
Battery (BV1)
0.96 0.96 0.97 0.97 0.97 0.97 0.97 0.97 0.97
Battery (BV2)
0.98 0.97 0.98 0.97 0.97 0.97 0.97 0.97 0.97
Battery (BV3)
0.97 0.97 0.97 0.97 0.97 0.97 0.97 0.97 0.97
Battery (BV4)
0.98 0.97 0.98 0.97 0.97 0.98 0.97 0.97 0.98
Inverter (L11)
0.98 0.98 0.98 0.98 0.98 0.98 0.98 0.98 0.98
Inverter (L12)
0.99 0.99 0.99 0.99 0.99 0.99 0.99 0.99 0.99
Inverter (L21)
0.98 0.98 0.98 0.98 0.98 0.98 0.98 0.98 0.98
Inverter (L22)
0.99 0.99 0.99 0.99 0.99 0.99 0.99 0.99 0.99
Table 6-13 - BESS efficiency at 66 kV side based on PQM data for 4-MW continuous cycle
test with ~30% SOC rest
Bldg. and PCS aux. energy included
Round-trip efficiency
Cycle 1 Cycle
2 Cycle
3 Cycle
4 Cycle
5 Cycle
6 Cycle
7 Cycle
8 avg
NO 0.895 0.905 0.894 0.895 0.904 0.896 0.895 0.904 0.899
YES 0.884 0.892 0.881 0.882 0.891 0.882 0.881 0.887 0.885
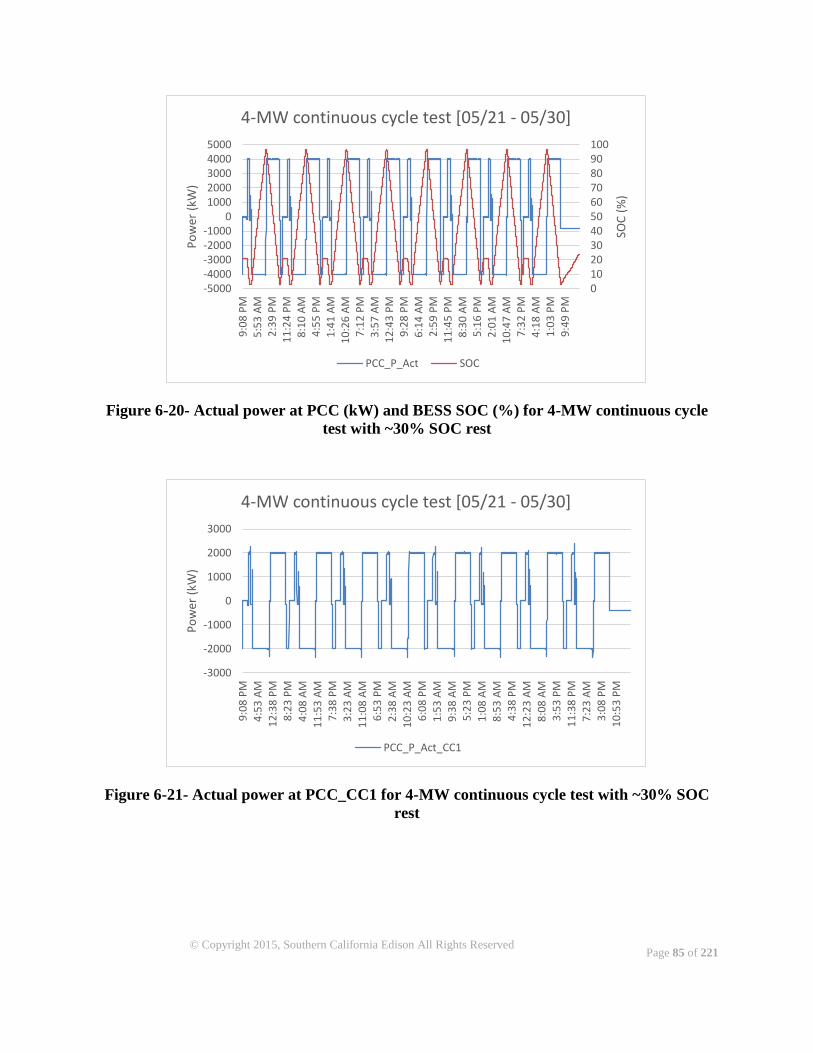
Page 85 of 221
© Copyright 2015, Southern California Edison All Rights Reserved
Figure 6-20- Actual power at PCC (kW) and BESS SOC (%) for 4-MW continuous cycle
test with ~30% SOC rest
Figure 6-21- Actual power at PCC_CC1 for 4-MW continuous cycle test with ~30% SOC
rest
0102030405060708090100
-5000-4000-3000-2000-1000
010002000300040005000
9:0
8 P
M5
:53
AM
2:3
9 P
M1
1:2
4 P
M8
:10
AM
4:5
5 P
M1
:41
AM
10
:26
AM
7:1
2 P
M3
:57
AM
12
:43
PM
9:2
8 P
M6
:14
AM
2:5
9 P
M1
1:4
5 P
M8
:30
AM
5:1
6 P
M2
:01
AM
10
:47
AM
7:3
2 P
M4
:18
AM
1:0
3 P
M9
:49
PM
SOC
(%
)
Po
wer
(kW
)
4-MW continuous cycle test [05/21 - 05/30]
PCC_P_Act SOC
-3000
-2000
-1000
0
1000
2000
3000
9:0
8 P
M4
:53
AM
12
:38
PM
8:2
3 P
M4
:08
AM
11
:53
AM
7:3
8 P
M3
:23
AM
11
:08
AM
6:5
3 P
M2
:38
AM
10
:23
AM
6:0
8 P
M1
:53
AM
9:3
8 A
M5
:23
PM
1:0
8 A
M8
:53
AM
4:3
8 P
M1
2:2
3 A
M8
:08
AM
3:5
3 P
M1
1:3
8 P
M7
:23
AM
3:0
8 P
M1
0:5
3 P
M
Po
wer
(kW
)
4-MW continuous cycle test [05/21 - 05/30]
PCC_P_Act_CC1
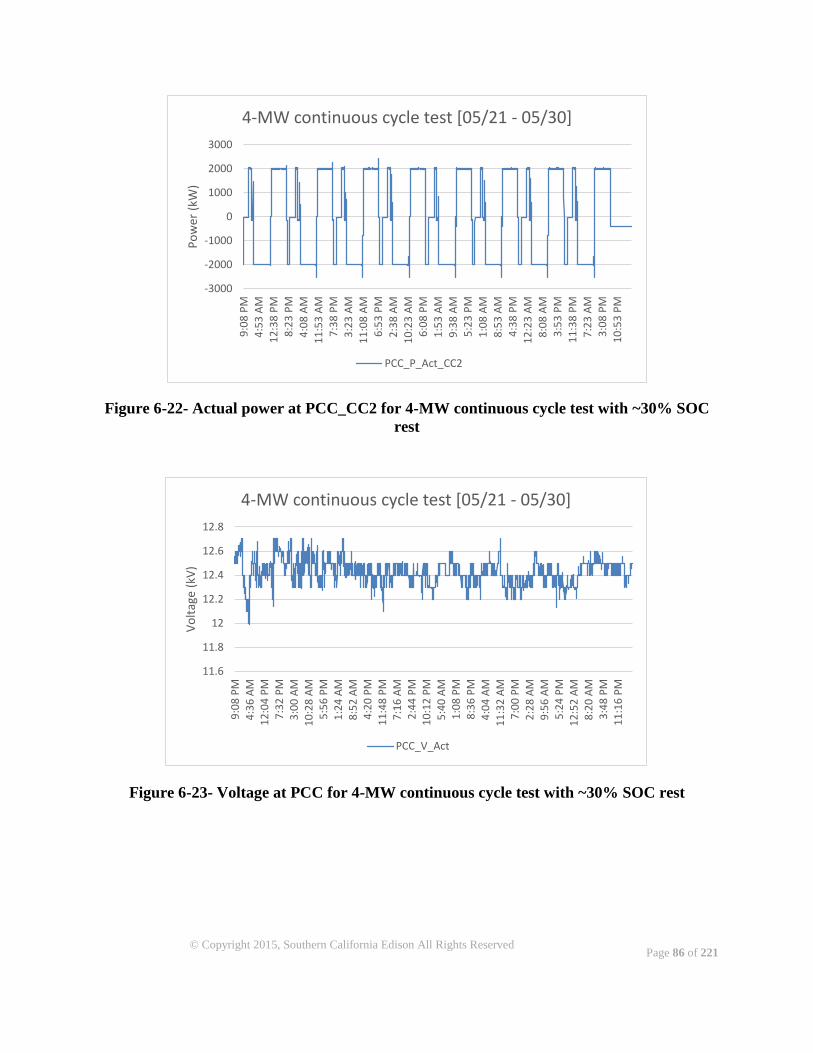
Page 86 of 221
© Copyright 2015, Southern California Edison All Rights Reserved
Figure 6-22- Actual power at PCC_CC2 for 4-MW continuous cycle test with ~30% SOC
rest
Figure 6-23- Voltage at PCC for 4-MW continuous cycle test with ~30% SOC rest
-3000
-2000
-1000
0
1000
2000
3000
9:0
8 P
M4
:53
AM
12
:38
PM
8:2
3 P
M4
:08
AM
11
:53
AM
7:3
8 P
M3
:23
AM
11
:08
AM
6:5
3 P
M2
:38
AM
10
:23
AM
6:0
8 P
M1
:53
AM
9:3
8 A
M5
:23
PM
1:0
8 A
M8
:53
AM
4:3
8 P
M1
2:2
3 A
M8
:08
AM
3:5
3 P
M1
1:3
8 P
M7
:23
AM
3:0
8 P
M1
0:5
3 P
M
Po
wer
(kW
)
4-MW continuous cycle test [05/21 - 05/30]
PCC_P_Act_CC2
11.6
11.8
12
12.2
12.4
12.6
12.8
9:0
8 P
M4
:36
AM
12
:04
PM
7:3
2 P
M3
:00
AM
10
:28
AM
5:5
6 P
M1
:24
AM
8:5
2 A
M4
:20
PM
11
:48
PM
7:1
6 A
M2
:44
PM
10
:12
PM
5:4
0 A
M1
:08
PM
8:3
6 P
M4
:04
AM
11
:32
AM
7:0
0 P
M2
:28
AM
9:5
6 A
M5
:24
PM
12
:52
AM
8:2
0 A
M3
:48
PM
11
:16
PM
Vo
ltag
e (k
V)
4-MW continuous cycle test [05/21 - 05/30]
PCC_V_Act
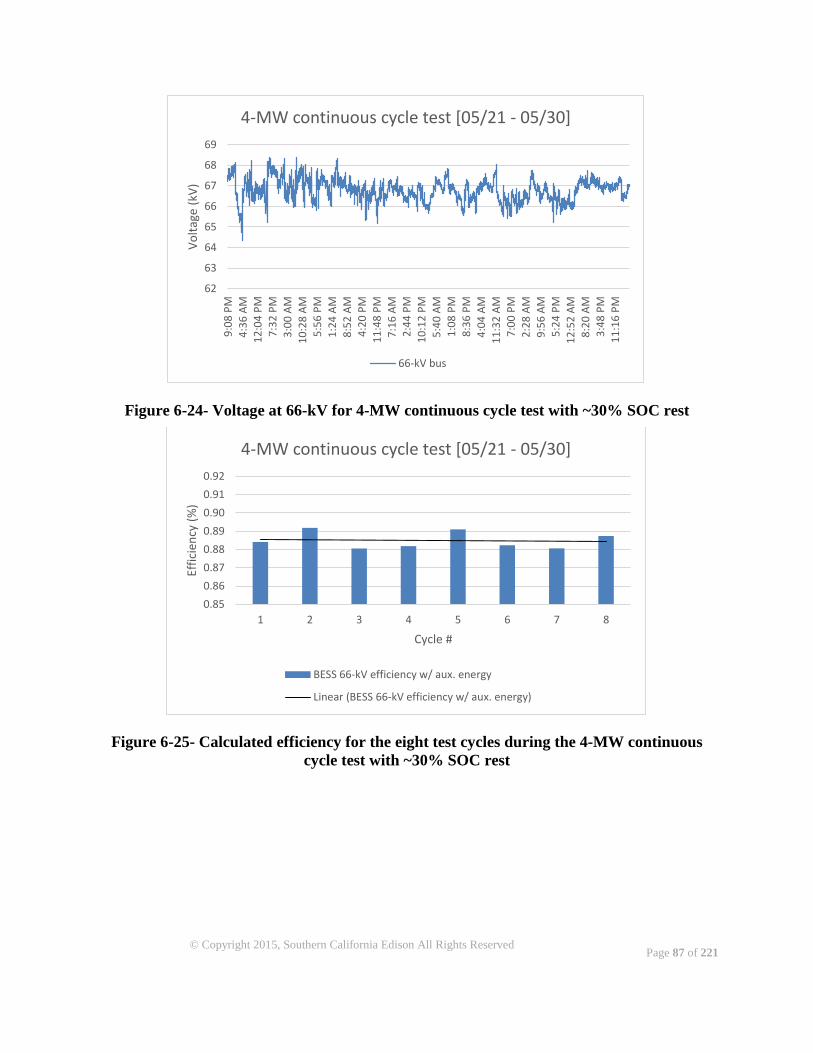
Page 87 of 221
© Copyright 2015, Southern California Edison All Rights Reserved
Figure 6-24- Voltage at 66-kV for 4-MW continuous cycle test with ~30% SOC rest
Figure 6-25- Calculated efficiency for the eight test cycles during the 4-MW continuous
cycle test with ~30% SOC rest
62
63
64
65
66
67
68
69
9:0
8 P
M4
:36
AM
12
:04
PM
7:3
2 P
M3
:00
AM
10
:28
AM
5:5
6 P
M1
:24
AM
8:5
2 A
M4
:20
PM
11
:48
PM
7:1
6 A
M2
:44
PM
10
:12
PM
5:4
0 A
M1
:08
PM
8:3
6 P
M4
:04
AM
11
:32
AM
7:0
0 P
M2
:28
AM
9:5
6 A
M5
:24
PM
12
:52
AM
8:2
0 A
M3
:48
PM
11
:16
PM
Vo
ltag
e (k
V)
4-MW continuous cycle test [05/21 - 05/30]
66-kV bus
0.85
0.86
0.87
0.88
0.89
0.90
0.91
0.92
1 2 3 4 5 6 7 8
Effi
cien
cy (
%)
Cycle #
4-MW continuous cycle test [05/21 - 05/30]
BESS 66-kV efficiency w/ aux. energy
Linear (BESS 66-kV efficiency w/ aux. energy)
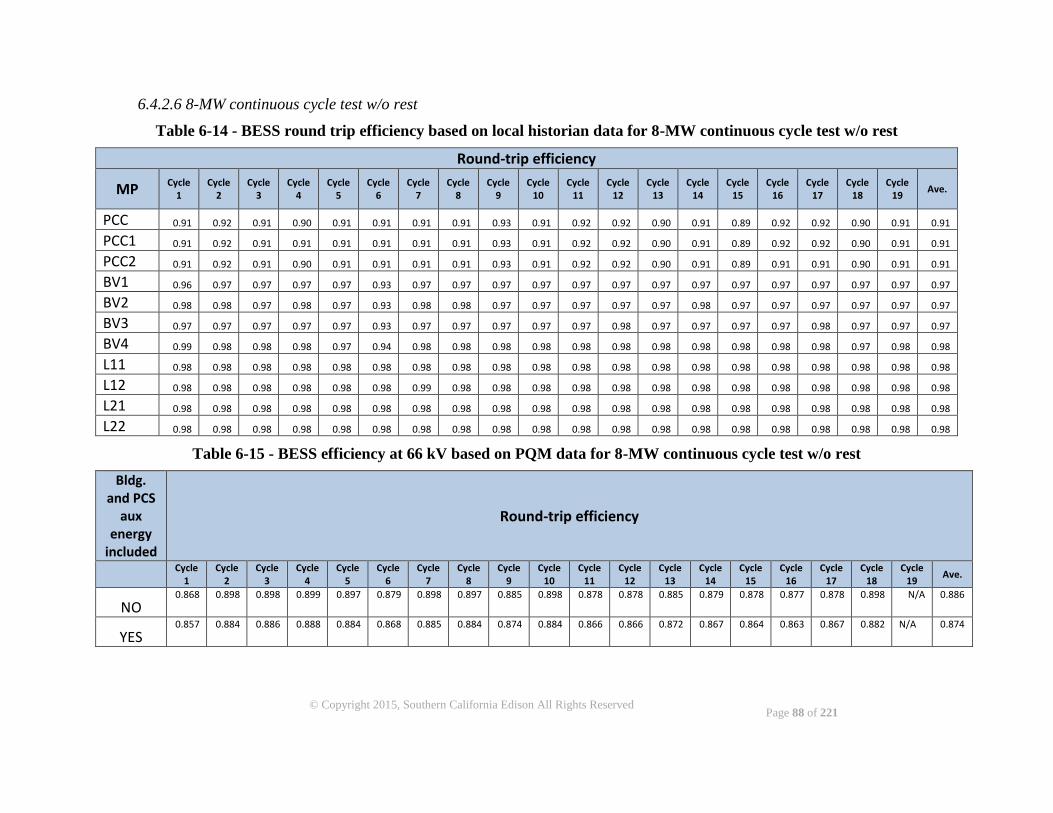
Page 88 of 221
© Copyright 2015, Southern California Edison All Rights Reserved
6.4.2.6 8-MW continuous cycle test w/o rest
Table 6-14 - BESS round trip efficiency based on local historian data for 8-MW continuous cycle test w/o rest
Round-trip efficiency
MP Cycle
1 Cycle
2 Cycle
3 Cycle
4 Cycle
5 Cycle
6 Cycle
7 Cycle
8 Cycle
9 Cycle
10 Cycle
11 Cycle
12 Cycle
13 Cycle
14 Cycle
15 Cycle
16 Cycle
17 Cycle
18 Cycle
19 Ave.
PCC 0.91 0.92 0.91 0.90 0.91 0.91 0.91 0.91 0.93 0.91 0.92 0.92 0.90 0.91 0.89 0.92 0.92 0.90 0.91 0.91
PCC1 0.91 0.92 0.91 0.91 0.91 0.91 0.91 0.91 0.93 0.91 0.92 0.92 0.90 0.91 0.89 0.92 0.92 0.90 0.91 0.91
PCC2 0.91 0.92 0.91 0.90 0.91 0.91 0.91 0.91 0.93 0.91 0.92 0.92 0.90 0.91 0.89 0.91 0.91 0.90 0.91 0.91
BV1 0.96 0.97 0.97 0.97 0.97 0.93 0.97 0.97 0.97 0.97 0.97 0.97 0.97 0.97 0.97 0.97 0.97 0.97 0.97 0.97
BV2 0.98 0.98 0.97 0.98 0.97 0.93 0.98 0.98 0.97 0.97 0.97 0.97 0.97 0.98 0.97 0.97 0.97 0.97 0.97 0.97
BV3 0.97 0.97 0.97 0.97 0.97 0.93 0.97 0.97 0.97 0.97 0.97 0.98 0.97 0.97 0.97 0.97 0.98 0.97 0.97 0.97
BV4 0.99 0.98 0.98 0.98 0.97 0.94 0.98 0.98 0.98 0.98 0.98 0.98 0.98 0.98 0.98 0.98 0.98 0.97 0.98 0.98
L11 0.98 0.98 0.98 0.98 0.98 0.98 0.98 0.98 0.98 0.98 0.98 0.98 0.98 0.98 0.98 0.98 0.98 0.98 0.98 0.98
L12 0.98 0.98 0.98 0.98 0.98 0.98 0.99 0.98 0.98 0.98 0.98 0.98 0.98 0.98 0.98 0.98 0.98 0.98 0.98 0.98
L21 0.98 0.98 0.98 0.98 0.98 0.98 0.98 0.98 0.98 0.98 0.98 0.98 0.98 0.98 0.98 0.98 0.98 0.98 0.98 0.98
L22 0.98 0.98 0.98 0.98 0.98 0.98 0.98 0.98 0.98 0.98 0.98 0.98 0.98 0.98 0.98 0.98 0.98 0.98 0.98 0.98
Table 6-15 - BESS efficiency at 66 kV based on PQM data for 8-MW continuous cycle test w/o rest
Bldg. and PCS
aux energy
included
Round-trip efficiency
Cycle
1 Cycle
2 Cycle
3 Cycle
4 Cycle
5 Cycle
6 Cycle
7 Cycle
8 Cycle
9 Cycle
10 Cycle
11 Cycle
12 Cycle
13 Cycle
14 Cycle
15 Cycle
16 Cycle
17 Cycle
18 Cycle
19 Ave.
NO 0.868 0.898 0.898 0.899 0.897 0.879 0.898 0.897 0.885 0.898 0.878 0.878 0.885 0.879 0.878 0.877 0.878 0.898 N/A 0.886
YES 0.857 0.884 0.886 0.888 0.884 0.868 0.885 0.884 0.874 0.884 0.866 0.866 0.872 0.867 0.864 0.863 0.867 0.882 N/A 0.874
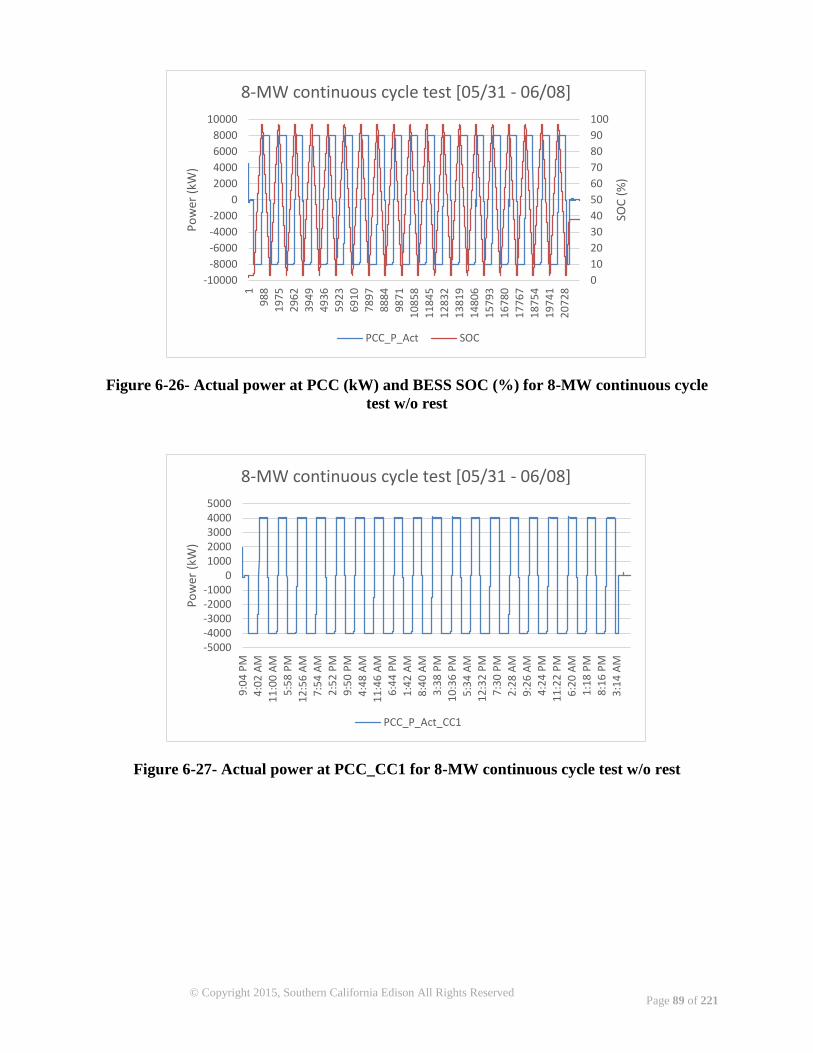
Page 89 of 221
© Copyright 2015, Southern California Edison All Rights Reserved
Figure 6-26- Actual power at PCC (kW) and BESS SOC (%) for 8-MW continuous cycle
test w/o rest
Figure 6-27- Actual power at PCC_CC1 for 8-MW continuous cycle test w/o rest
0
10
20
30
40
50
60
70
80
90
100
-10000
-8000
-6000
-4000
-2000
0
2000
4000
6000
8000
10000
1
98
8
19
75
29
62
39
49
49
36
59
23
69
10
78
97
88
84
98
71
10
85
8
11
84
5
12
83
2
13
81
9
14
80
6
15
79
3
16
78
0
17
76
7
18
75
4
19
74
1
20
72
8
SOC
(%
)
Po
wer
(kW
)
8-MW continuous cycle test [05/31 - 06/08]
PCC_P_Act SOC
-5000-4000-3000-2000-1000
010002000300040005000
9:0
4 P
M4
:02
AM
11
:00
AM
5:5
8 P
M1
2:5
6 A
M7
:54
AM
2:5
2 P
M9
:50
PM
4:4
8 A
M1
1:4
6 A
M6
:44
PM
1:4
2 A
M8
:40
AM
3:3
8 P
M1
0:3
6 P
M5
:34
AM
12
:32
PM
7:3
0 P
M2
:28
AM
9:2
6 A
M4
:24
PM
11
:22
PM
6:2
0 A
M
1:1
8 P
M8
:16
PM
3:1
4 A
M
Po
wer
(kW
)
8-MW continuous cycle test [05/31 - 06/08]
PCC_P_Act_CC1
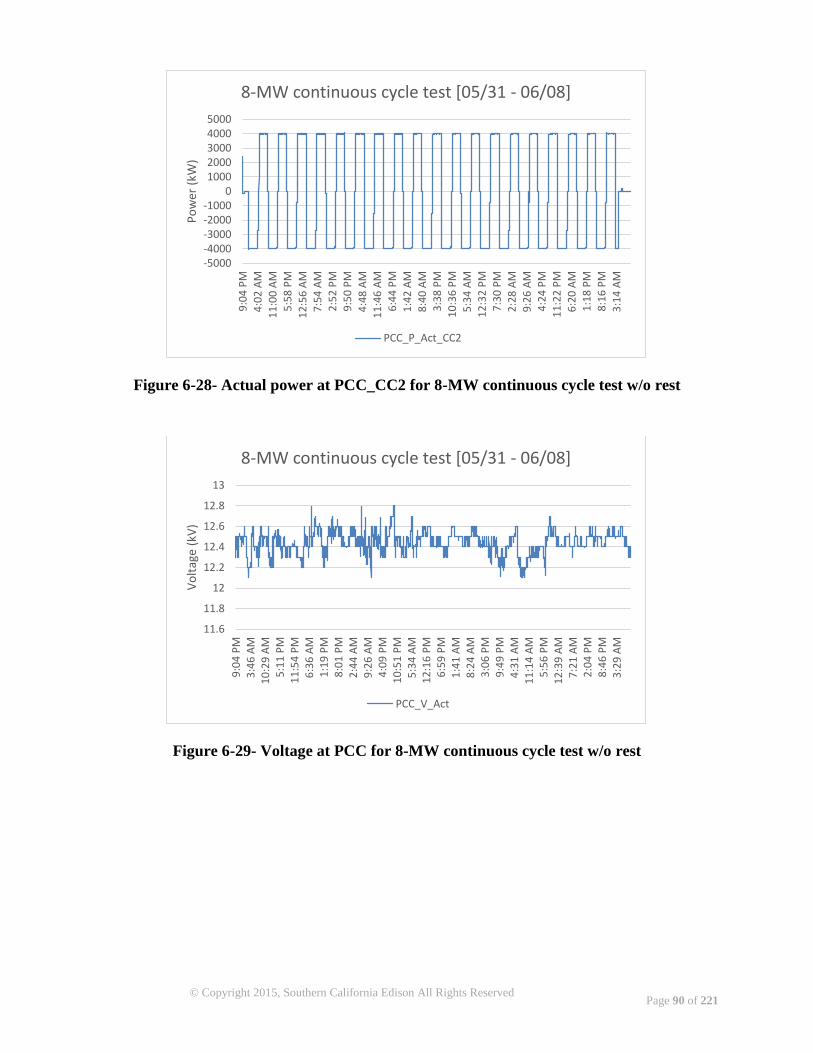
Page 90 of 221
© Copyright 2015, Southern California Edison All Rights Reserved
Figure 6-28- Actual power at PCC_CC2 for 8-MW continuous cycle test w/o rest
Figure 6-29- Voltage at PCC for 8-MW continuous cycle test w/o rest
-5000-4000-3000-2000-1000
010002000300040005000
9:0
4 P
M4
:02
AM
11
:00
AM
5:5
8 P
M1
2:5
6 A
M7
:54
AM
2:5
2 P
M9
:50
PM
4:4
8 A
M1
1:4
6 A
M6
:44
PM
1:4
2 A
M8
:40
AM
3:3
8 P
M1
0:3
6 P
M5
:34
AM
12
:32
PM
7:3
0 P
M2
:28
AM
9:2
6 A
M4
:24
PM
11
:22
PM
6:2
0 A
M
1:1
8 P
M8
:16
PM
3:1
4 A
M
Po
wer
(kW
)
8-MW continuous cycle test [05/31 - 06/08]
PCC_P_Act_CC2
11.6
11.8
12
12.2
12.4
12.6
12.8
13
9:0
4 P
M3
:46
AM
10
:29
AM
5:1
1 P
M1
1:5
4 P
M6
:36
AM
1:1
9 P
M8
:01
PM
2:4
4 A
M9
:26
AM
4:0
9 P
M1
0:5
1 P
M5
:34
AM
12
:16
PM
6:5
9 P
M1
:41
AM
8:2
4 A
M3
:06
PM
9:4
9 P
M4
:31
AM
11
:14
AM
5:5
6 P
M1
2:3
9 A
M7
:21
AM
2:0
4 P
M8
:46
PM
3:2
9 A
M
Vo
ltag
e (k
V)
8-MW continuous cycle test [05/31 - 06/08]
PCC_V_Act
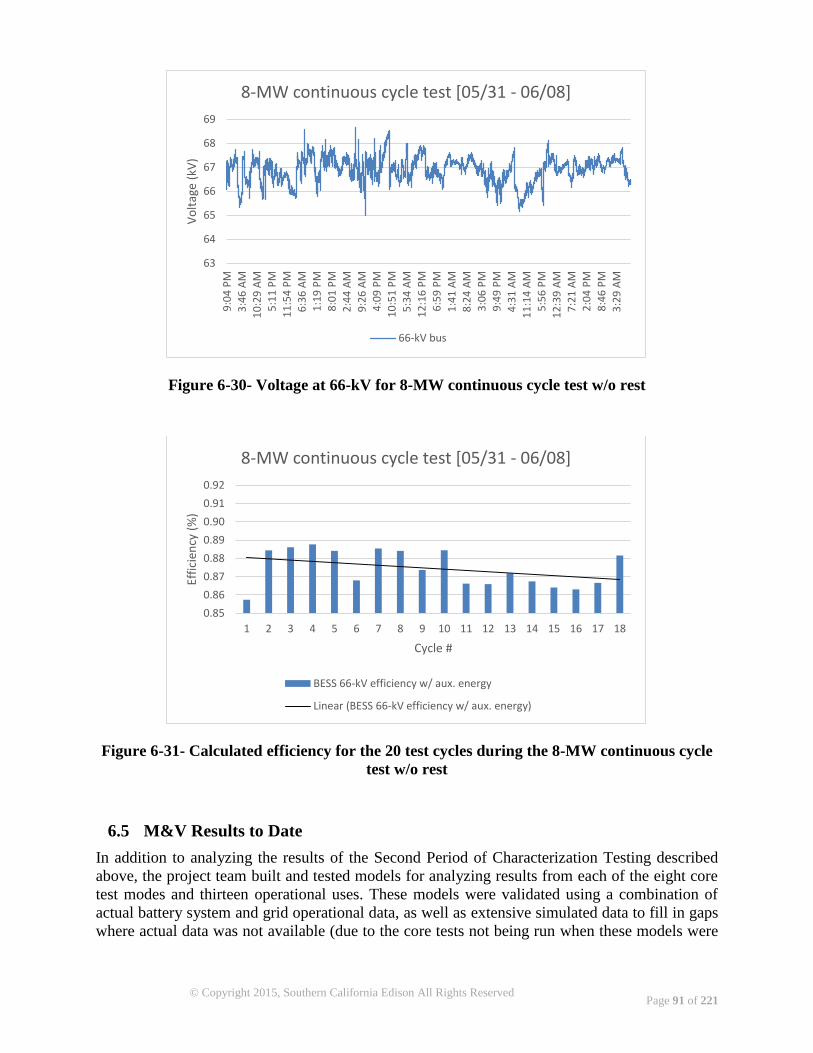
Page 91 of 221
© Copyright 2015, Southern California Edison All Rights Reserved
Figure 6-30- Voltage at 66-kV for 8-MW continuous cycle test w/o rest
Figure 6-31- Calculated efficiency for the 20 test cycles during the 8-MW continuous cycle
test w/o rest
6.5 M&V Results to Date
In addition to analyzing the results of the Second Period of Characterization Testing described
above, the project team built and tested models for analyzing results from each of the eight core
test modes and thirteen operational uses. These models were validated using a combination of
actual battery system and grid operational data, as well as extensive simulated data to fill in gaps
where actual data was not available (due to the core tests not being run when these models were
63
64
65
66
67
68
69
9:0
4 P
M3
:46
AM
10
:29
AM
5:1
1 P
M
11
:54
PM
6:3
6 A
M
1:1
9 P
M
8:0
1 P
M
2:4
4 A
M9
:26
AM
4:0
9 P
M
10
:51
PM
5:3
4 A
M
12
:16
PM
6:5
9 P
M
1:4
1 A
M
8:2
4 A
M
3:0
6 P
M
9:4
9 P
M4
:31
AM
11
:14
AM
5:5
6 P
M
12
:39
AM
7:2
1 A
M
2:0
4 P
M
8:4
6 P
M
3:2
9 A
M
Vo
ltag
e (k
V)
8-MW continuous cycle test [05/31 - 06/08]
66-kV bus
0.85
0.86
0.87
0.88
0.89
0.90
0.91
0.92
1 2 3 4 5 6 7 8 9 10 11 12 13 14 15 16 17 18
Effi
cien
cy (
%)
Cycle #
8-MW continuous cycle test [05/31 - 06/08]
BESS 66-kV efficiency w/ aux. energy
Linear (BESS 66-kV efficiency w/ aux. energy)
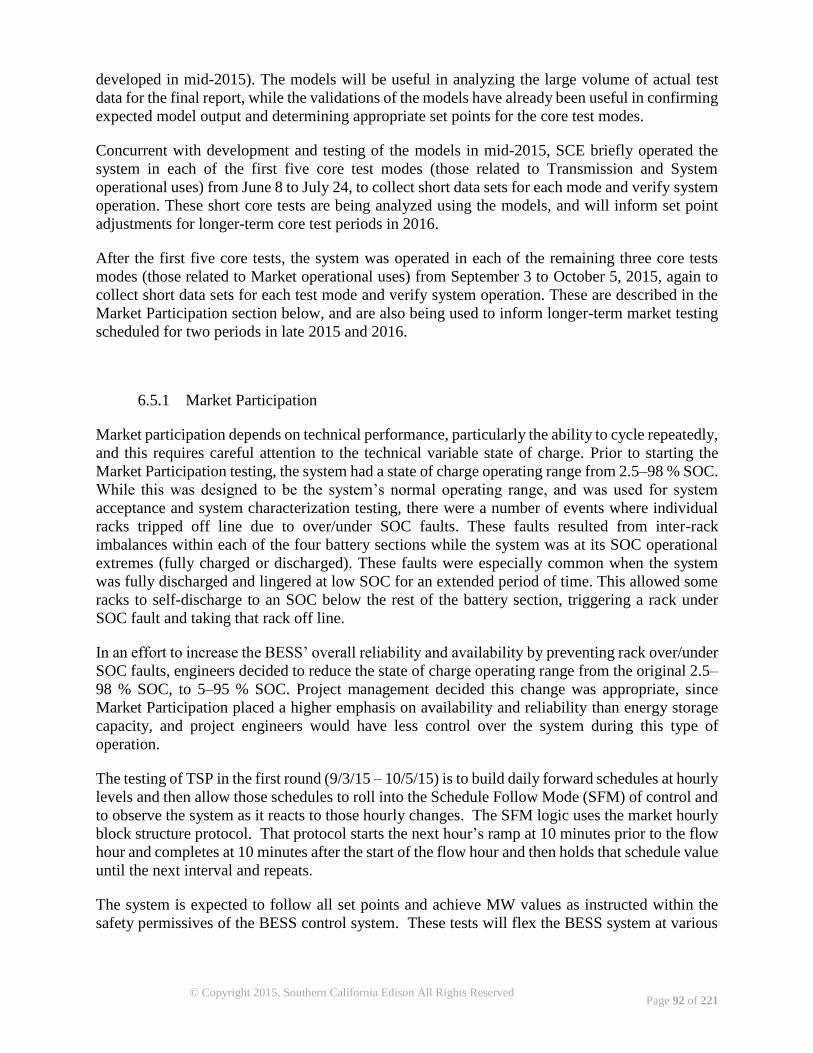
Page 92 of 221
© Copyright 2015, Southern California Edison All Rights Reserved
developed in mid-2015). The models will be useful in analyzing the large volume of actual test
data for the final report, while the validations of the models have already been useful in confirming
expected model output and determining appropriate set points for the core test modes.
Concurrent with development and testing of the models in mid-2015, SCE briefly operated the
system in each of the first five core test modes (those related to Transmission and System
operational uses) from June 8 to July 24, to collect short data sets for each mode and verify system
operation. These short core tests are being analyzed using the models, and will inform set point
adjustments for longer-term core test periods in 2016.
After the first five core tests, the system was operated in each of the remaining three core tests
modes (those related to Market operational uses) from September 3 to October 5, 2015, again to
collect short data sets for each test mode and verify system operation. These are described in the
Market Participation section below, and are also being used to inform longer-term market testing
scheduled for two periods in late 2015 and 2016.
6.5.1 Market Participation
Market participation depends on technical performance, particularly the ability to cycle repeatedly,
and this requires careful attention to the technical variable state of charge. Prior to starting the
Market Participation testing, the system had a state of charge operating range from 2.5–98 % SOC.
While this was designed to be the system’s normal operating range, and was used for system
acceptance and system characterization testing, there were a number of events where individual
racks tripped off line due to over/under SOC faults. These faults resulted from inter-rack
imbalances within each of the four battery sections while the system was at its SOC operational
extremes (fully charged or discharged). These faults were especially common when the system
was fully discharged and lingered at low SOC for an extended period of time. This allowed some
racks to self-discharge to an SOC below the rest of the battery section, triggering a rack under
SOC fault and taking that rack off line.
In an effort to increase the BESS’ overall reliability and availability by preventing rack over/under
SOC faults, engineers decided to reduce the state of charge operating range from the original 2.5–
98 % SOC, to 5–95 % SOC. Project management decided this change was appropriate, since
Market Participation placed a higher emphasis on availability and reliability than energy storage
capacity, and project engineers would have less control over the system during this type of
operation.
The testing of TSP in the first round (9/3/15 – 10/5/15) is to build daily forward schedules at hourly
levels and then allow those schedules to roll into the Schedule Follow Mode (SFM) of control and
to observe the system as it reacts to those hourly changes. The SFM logic uses the market hourly
block structure protocol. That protocol starts the next hour’s ramp at 10 minutes prior to the flow
hour and completes at 10 minutes after the start of the flow hour and then holds that schedule value
until the next interval and repeats.
The system is expected to follow all set points and achieve MW values as instructed within the
safety permissives of the BESS control system. These tests will flex the BESS system at various
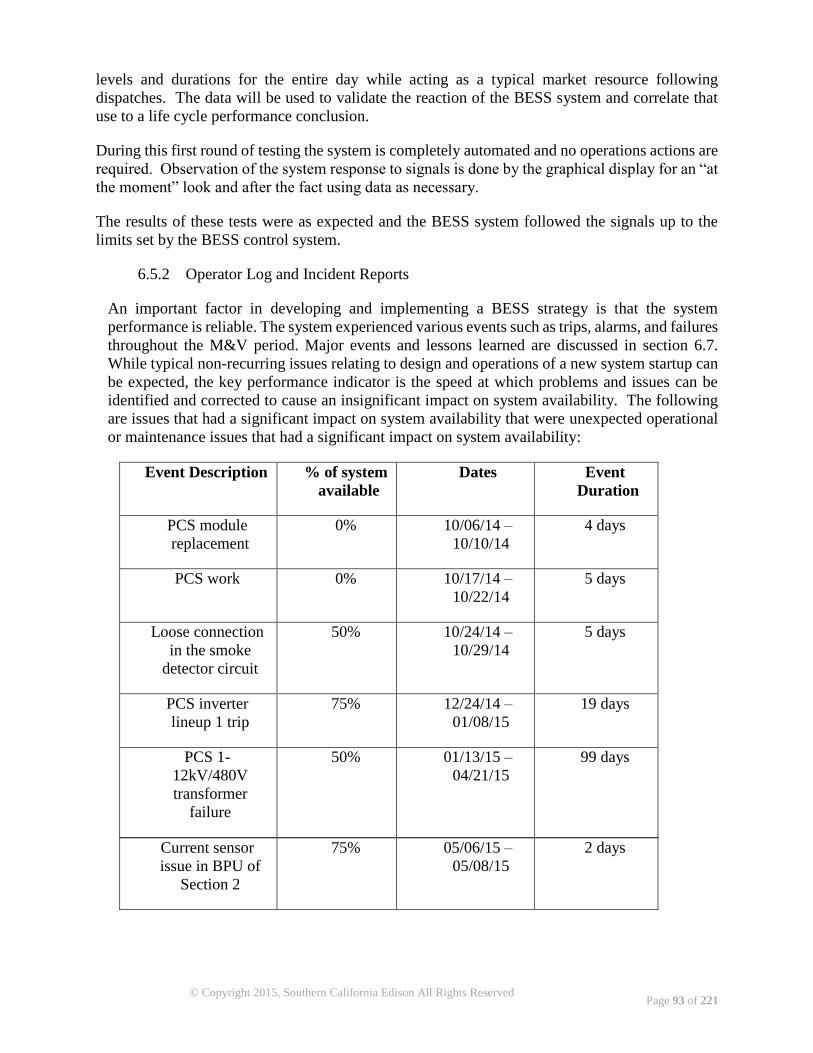
Page 93 of 221
© Copyright 2015, Southern California Edison All Rights Reserved
levels and durations for the entire day while acting as a typical market resource following
dispatches. The data will be used to validate the reaction of the BESS system and correlate that
use to a life cycle performance conclusion.
During this first round of testing the system is completely automated and no operations actions are
required. Observation of the system response to signals is done by the graphical display for an “at
the moment” look and after the fact using data as necessary.
The results of these tests were as expected and the BESS system followed the signals up to the
limits set by the BESS control system.
6.5.2 Operator Log and Incident Reports
An important factor in developing and implementing a BESS strategy is that the system
performance is reliable. The system experienced various events such as trips, alarms, and failures
throughout the M&V period. Major events and lessons learned are discussed in section 6.7.
While typical non-recurring issues relating to design and operations of a new system startup can
be expected, the key performance indicator is the speed at which problems and issues can be
identified and corrected to cause an insignificant impact on system availability. The following
are issues that had a significant impact on system availability that were unexpected operational
or maintenance issues that had a significant impact on system availability:
Event Description % of system
available
Dates Event
Duration
PCS module
replacement
0% 10/06/14 –
10/10/14
4 days
PCS work 0% 10/17/14 –
10/22/14
5 days
Loose connection
in the smoke
detector circuit
50% 10/24/14 –
10/29/14
5 days
PCS inverter
lineup 1 trip
75% 12/24/14 –
01/08/15
19 days
PCS 1-
12kV/480V
transformer
failure
50% 01/13/15 –
04/21/15
99 days
Current sensor
issue in BPU of
Section 2
75% 05/06/15 –
05/08/15
2 days
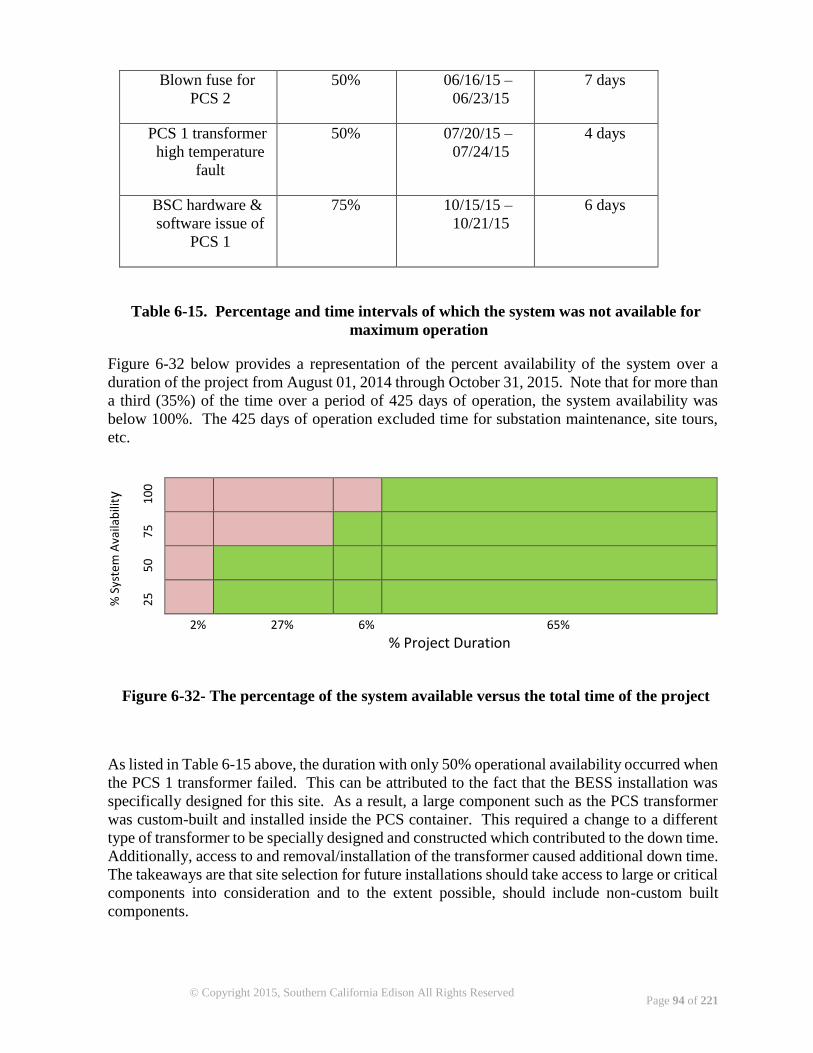
Page 94 of 221
© Copyright 2015, Southern California Edison All Rights Reserved
Blown fuse for
PCS 2
50% 06/16/15 –
06/23/15
7 days
PCS 1 transformer
high temperature
fault
50% 07/20/15 –
07/24/15
4 days
BSC hardware &
software issue of
PCS 1
75% 10/15/15 –
10/21/15
6 days
Table 6-15. Percentage and time intervals of which the system was not available for
maximum operation
Figure 6-32 below provides a representation of the percent availability of the system over a
duration of the project from August 01, 2014 through October 31, 2015. Note that for more than
a third (35%) of the time over a period of 425 days of operation, the system availability was
below 100%. The 425 days of operation excluded time for substation maintenance, site tours,
etc.
% S
yste
m A
vaila
bili
ty
10
0
75
50
25
2% 27% 6% 65%
% Project Duration
Figure 6-32- The percentage of the system available versus the total time of the project
As listed in Table 6-15 above, the duration with only 50% operational availability occurred when
the PCS 1 transformer failed. This can be attributed to the fact that the BESS installation was
specifically designed for this site. As a result, a large component such as the PCS transformer
was custom-built and installed inside the PCS container. This required a change to a different
type of transformer to be specially designed and constructed which contributed to the down time.
Additionally, access to and removal/installation of the transformer caused additional down time.
The takeaways are that site selection for future installations should take access to large or critical
components into consideration and to the extent possible, should include non-custom built
components.
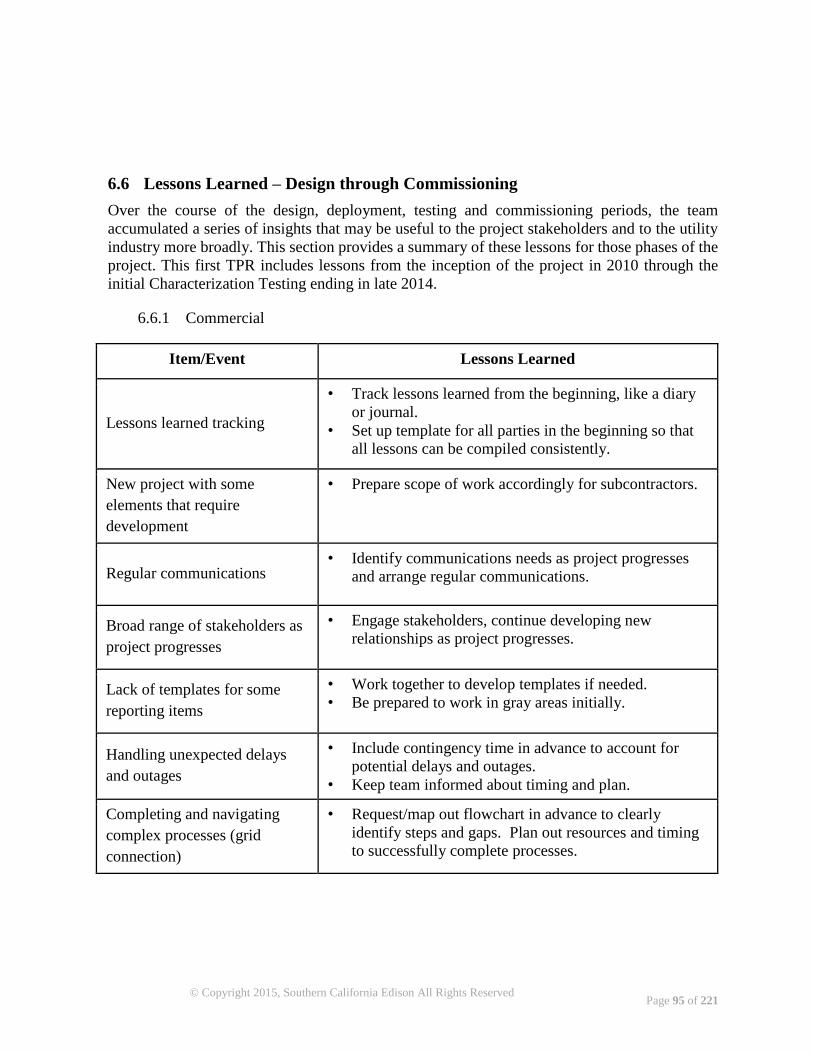
Page 95 of 221
© Copyright 2015, Southern California Edison All Rights Reserved
6.6 Lessons Learned – Design through Commissioning
Over the course of the design, deployment, testing and commissioning periods, the team
accumulated a series of insights that may be useful to the project stakeholders and to the utility
industry more broadly. This section provides a summary of these lessons for those phases of the
project. This first TPR includes lessons from the inception of the project in 2010 through the
initial Characterization Testing ending in late 2014.
6.6.1 Commercial
Item/Event Lessons Learned
Lessons learned tracking
• Track lessons learned from the beginning, like a diary
or journal.
• Set up template for all parties in the beginning so that
all lessons can be compiled consistently.
New project with some
elements that require
development
• Prepare scope of work accordingly for subcontractors.
Regular communications • Identify communications needs as project progresses
and arrange regular communications.
Broad range of stakeholders as
project progresses
• Engage stakeholders, continue developing new
relationships as project progresses.
Lack of templates for some
reporting items
• Work together to develop templates if needed.
• Be prepared to work in gray areas initially.
Handling unexpected delays
and outages
• Include contingency time in advance to account for
potential delays and outages.
• Keep team informed about timing and plan.
Completing and navigating
complex processes (grid
connection)
• Request/map out flowchart in advance to clearly
identify steps and gaps. Plan out resources and timing
to successfully complete processes.
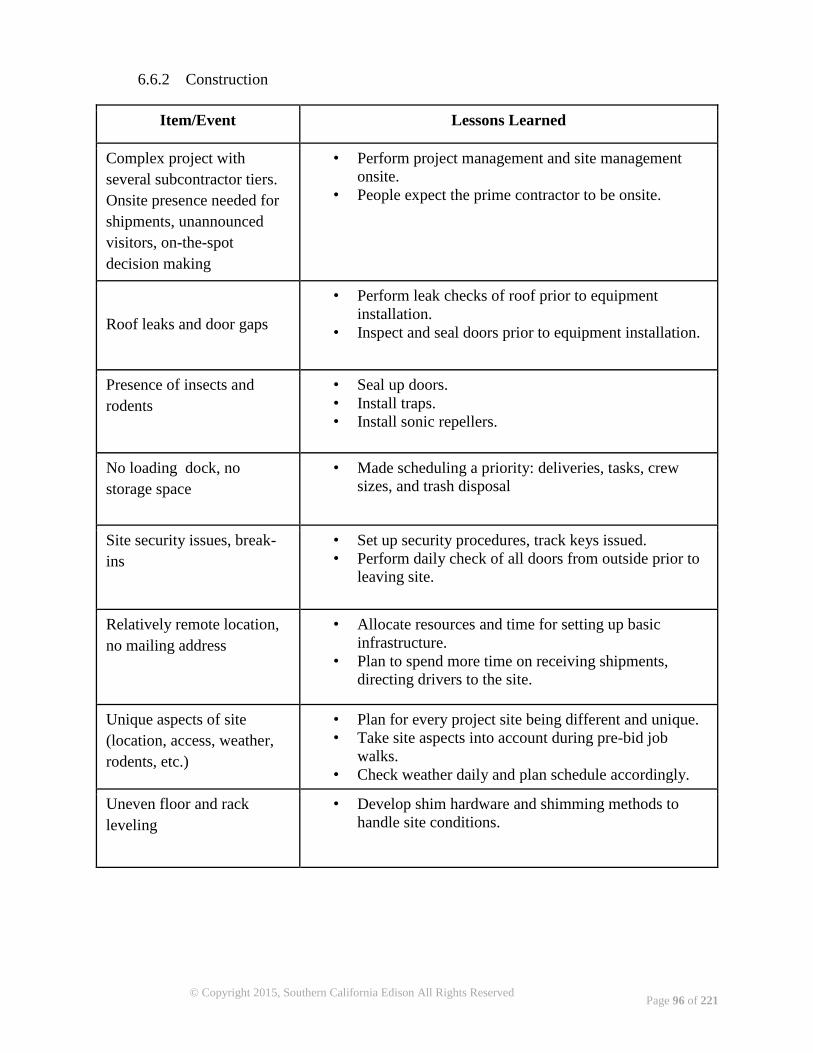
Page 96 of 221
© Copyright 2015, Southern California Edison All Rights Reserved
6.6.2 Construction
Item/Event Lessons Learned
Complex project with
several subcontractor tiers.
Onsite presence needed for
shipments, unannounced
visitors, on-the-spot
decision making
• Perform project management and site management
onsite.
• People expect the prime contractor to be onsite.
Roof leaks and door gaps
• Perform leak checks of roof prior to equipment
installation.
• Inspect and seal doors prior to equipment installation.
Presence of insects and
rodents
• Seal up doors.
• Install traps.
• Install sonic repellers.
No loading dock, no
storage space
• Made scheduling a priority: deliveries, tasks, crew
sizes, and trash disposal
Site security issues, break-
ins
• Set up security procedures, track keys issued.
• Perform daily check of all doors from outside prior to
leaving site.
Relatively remote location,
no mailing address
• Allocate resources and time for setting up basic
infrastructure.
• Plan to spend more time on receiving shipments,
directing drivers to the site.
Unique aspects of site
(location, access, weather,
rodents, etc.)
• Plan for every project site being different and unique.
• Take site aspects into account during pre-bid job
walks.
• Check weather daily and plan schedule accordingly.
Uneven floor and rack
leveling
• Develop shim hardware and shimming methods to
handle site conditions.
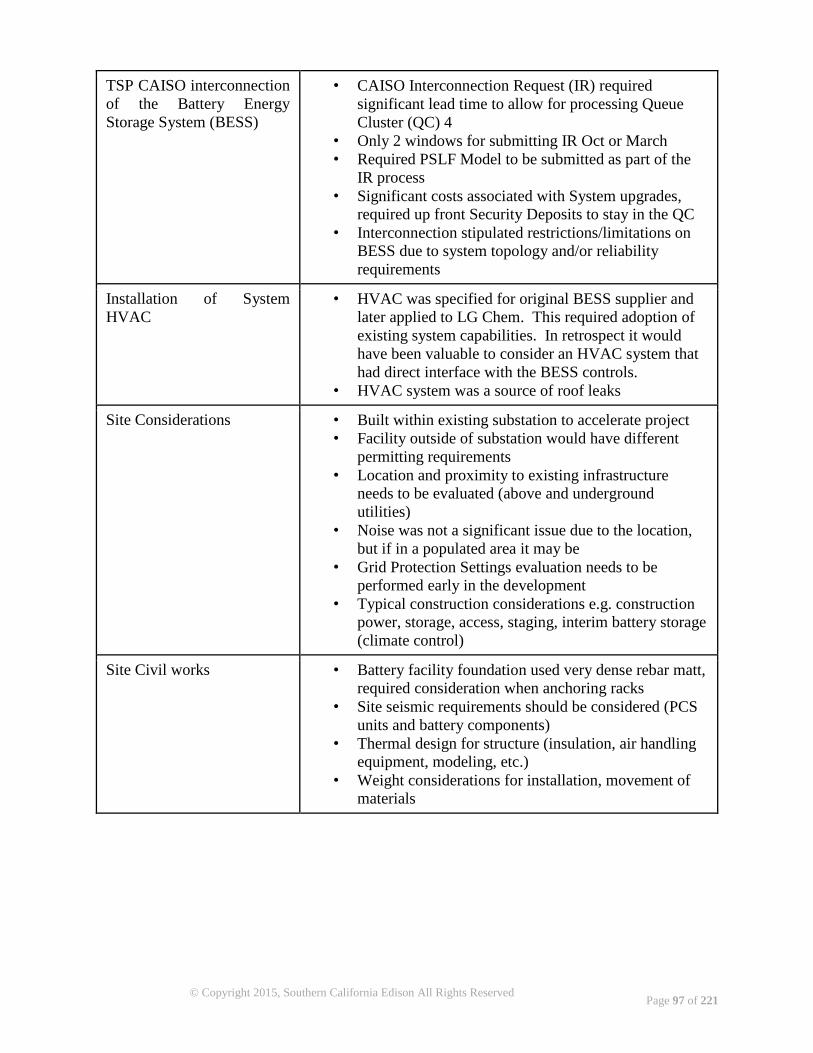
Page 97 of 221
© Copyright 2015, Southern California Edison All Rights Reserved
TSP CAISO interconnection
of the Battery Energy
Storage System (BESS)
• CAISO Interconnection Request (IR) required
significant lead time to allow for processing Queue
Cluster (QC) 4
• Only 2 windows for submitting IR Oct or March
• Required PSLF Model to be submitted as part of the
IR process
• Significant costs associated with System upgrades,
required up front Security Deposits to stay in the QC
• Interconnection stipulated restrictions/limitations on
BESS due to system topology and/or reliability
requirements
Installation of System
HVAC
• HVAC was specified for original BESS supplier and
later applied to LG Chem. This required adoption of
existing system capabilities. In retrospect it would
have been valuable to consider an HVAC system that
had direct interface with the BESS controls.
• HVAC system was a source of roof leaks
Site Considerations • Built within existing substation to accelerate project
• Facility outside of substation would have different
permitting requirements
• Location and proximity to existing infrastructure
needs to be evaluated (above and underground
utilities)
• Noise was not a significant issue due to the location,
but if in a populated area it may be
• Grid Protection Settings evaluation needs to be
performed early in the development
• Typical construction considerations e.g. construction
power, storage, access, staging, interim battery storage
(climate control)
Site Civil works • Battery facility foundation used very dense rebar matt,
required consideration when anchoring racks
• Site seismic requirements should be considered (PCS
units and battery components)
• Thermal design for structure (insulation, air handling
equipment, modeling, etc.)
• Weight considerations for installation, movement of
materials

Page 98 of 221
© Copyright 2015, Southern California Edison All Rights Reserved
66 kV to 12 kV Transformer
Connection
• Point of demarcation needs to be clearly identified
• Inter-company Clearance Procedure Requirements
• Roles & Responsibilities for “Customer” and
Transmission/Distribution System Owner
• Lock out tag out procedure
• Auxiliary power provided from a separate bus for
TSP.
Fire Suppression System • Limited guidance from fire codes and standards for
lithium ion facilities.
• Fire marshal reviews could be an issue for other
locations
• Vendors should demonstrate the effectiveness of the
proposed fire suppression system through detailed
analysis and laboratory tests
• In the event of a fire, firefighting and post fire
protocols need to be considered
Deployment of BESS
equipment to site -
importance of decisions that
can impact the on-site
commissioning and
integration testing with an
active grid.
• Deployment of BESS components to the site should
be carefully considered and made part of the
commissioning planning.
• The potential for commissioning a partial ESS with
the power conversion systems (PCS) while connected
to the grid should be considered. The advantage of
this approach is the potential earlier project
completion since PCS and grid integration testing can
occur while the remainder of the battery continues in
production. The result is an incremental
commissioning with a potential earlier project
completion date.
6.6.3 Technical
Item/Event Lessons Learned
Equipment installation and assembly
challenges
• Provide more extensive training in
advance.
• Include more photos in manuals, have
demos, have post-training tests.
• Develop products with ease of installation
in mind.
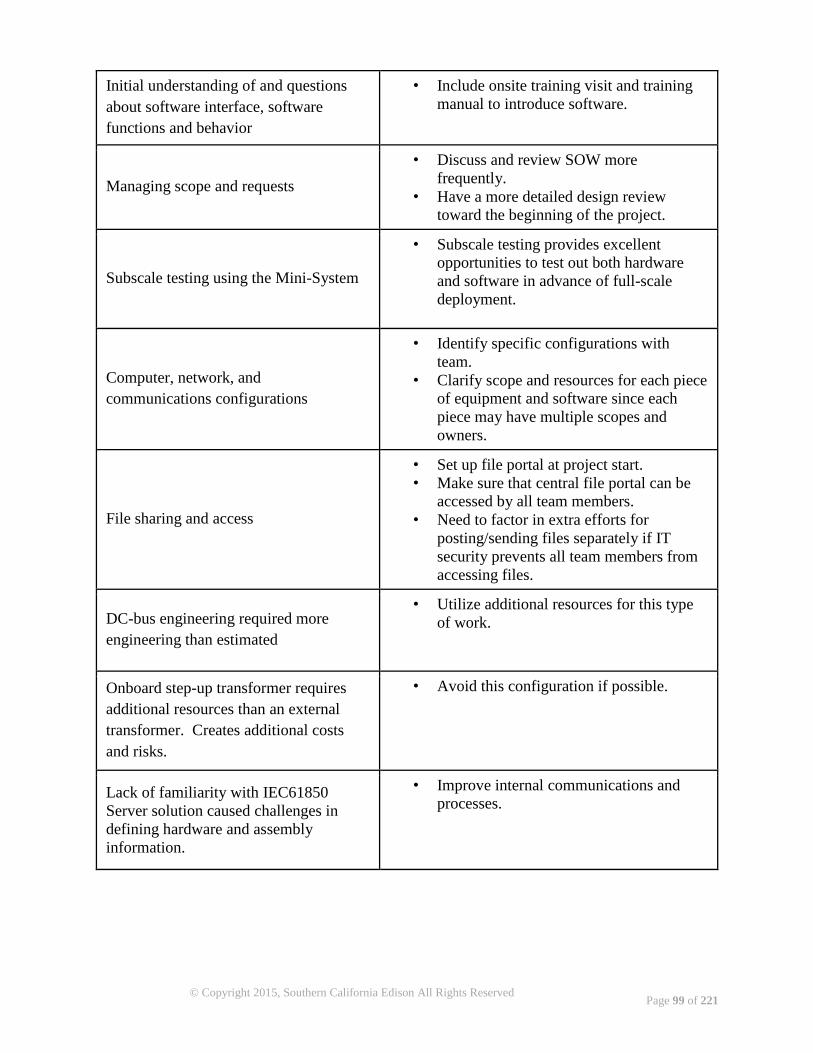
Page 99 of 221
© Copyright 2015, Southern California Edison All Rights Reserved
Initial understanding of and questions
about software interface, software
functions and behavior
• Include onsite training visit and training
manual to introduce software.
Managing scope and requests
• Discuss and review SOW more
frequently.
• Have a more detailed design review
toward the beginning of the project.
Subscale testing using the Mini-System
• Subscale testing provides excellent
opportunities to test out both hardware
and software in advance of full-scale
deployment.
Computer, network, and
communications configurations
• Identify specific configurations with
team.
• Clarify scope and resources for each piece
of equipment and software since each
piece may have multiple scopes and
owners.
File sharing and access
• Set up file portal at project start.
• Make sure that central file portal can be
accessed by all team members.
• Need to factor in extra efforts for
posting/sending files separately if IT
security prevents all team members from
accessing files.
DC-bus engineering required more
engineering than estimated
• Utilize additional resources for this type
of work.
Onboard step-up transformer requires
additional resources than an external
transformer. Creates additional costs
and risks.
• Avoid this configuration if possible.
Lack of familiarity with IEC61850
Server solution caused challenges in
defining hardware and assembly
information.
• Improve internal communications and
processes.
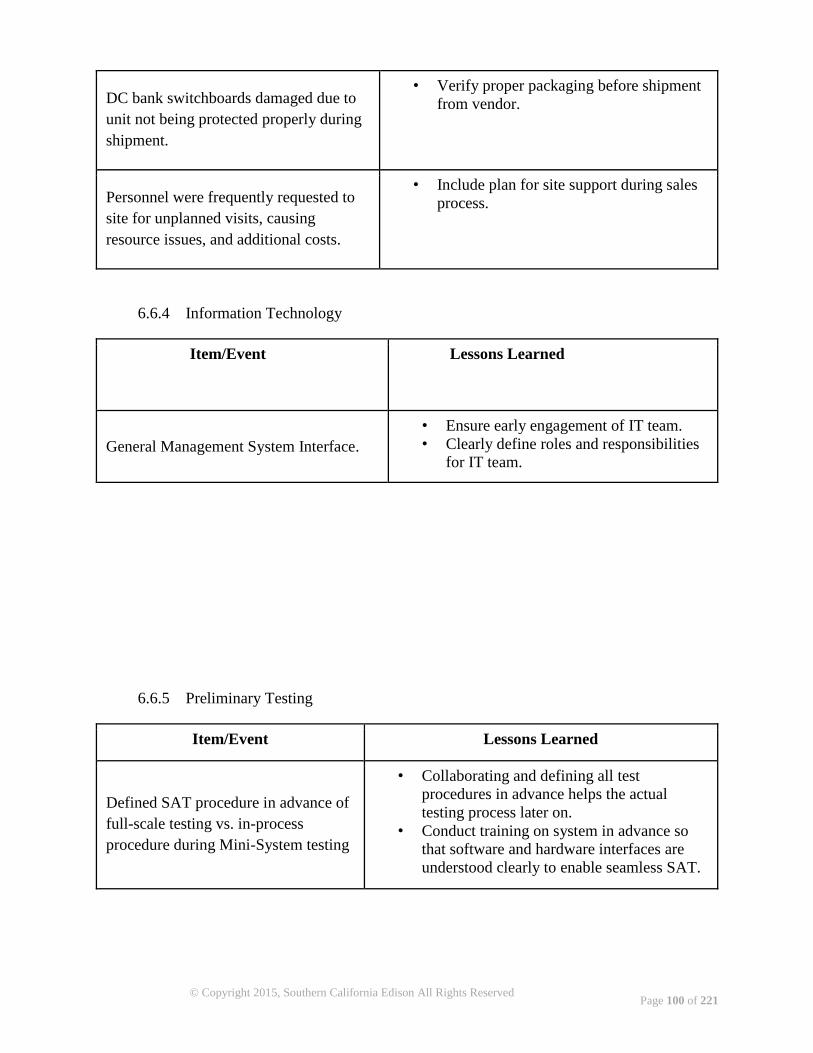
Page 100 of 221
© Copyright 2015, Southern California Edison All Rights Reserved
DC bank switchboards damaged due to
unit not being protected properly during
shipment.
• Verify proper packaging before shipment
from vendor.
Personnel were frequently requested to
site for unplanned visits, causing
resource issues, and additional costs.
• Include plan for site support during sales
process.
6.6.4 Information Technology
Item/Event Lessons Learned
General Management System Interface.
• Ensure early engagement of IT team.
• Clearly define roles and responsibilities
for IT team.
6.6.5 Preliminary Testing
Item/Event Lessons Learned
Defined SAT procedure in advance of
full-scale testing vs. in-process
procedure during Mini-System testing
• Collaborating and defining all test
procedures in advance helps the actual
testing process later on.
• Conduct training on system in advance so
that software and hardware interfaces are
understood clearly to enable seamless SAT.

Page 101 of 221
© Copyright 2015, Southern California Edison All Rights Reserved
SAT – Testing time and schedule
• Allow sufficient time not only to perform
the test, but also for changeover, setup,
shutdown, data collection, and data analysis.
SAT – Onsite support is beneficial for
answering questions, collaborating
real-time, and performing repairs
• Provide onsite support for customer during
SAT.
• Include onsite support on several fronts,
including technical, electrician, and
laborers.
Unexpected additional tasks, outages,
and changes to test sequences
• Make plan flexible and not completely
serial.
• Be flexible and adjust as needed.
Lengthy approval and confirmation
processes
• Communicate expected process and timing
in advance, identify if there are scheduling
and resource limitations.
6.6.6 Training
Item/Event Lessons Learned
Page turn meetings with training team • Collaborating and reviewing materials
page-by-page is very beneficial and
productive.
Training logistics/meeting location
• Prepare for multiple training sessions at
different locations due to different
audiences.
• Allow sufficient time for travel, security
clearances, etc.
Role of training in processes (grid
connection, operations)
• Engage all stakeholders in advance to
determine when training is needed and
which processes are affected.
Targeted training is needed for
software operation, maintenance,
safety, site details, etc.
• Expect that turnkey provider will need to
provide training to different audiences.
Training material development and
customization
• Expect materials development and
customization due to range of audiences
involved.
• Do not assume that completely standard
materials can be used.
Page 102 of 221
© Copyright 2015, Southern California Edison All Rights Reserved
6.7 Events and Lessons Learned – Operations
Over the course of the formal testing period (scheduled from January 2015 through June 2016)
the team will accumulate a number of insights. This TPR #2 and the Final Technical Report will
report lessons learned and derived from the implementation and operation of the Test Plan. The
following describes the categories and timing of significant events.
Categories
PCS (entire or partial) trip offs such as the transformer event, dirty filters, temp overloads,
etc.
Section trip offs
Sub elements trip offs such as banks, racks, etc.
Data Historian Gateway
Reporting Aspects
Description of the events is focused on the following three aspects:
Is it a unique incident i.e. one time only? What is the likelihood of reoccurrence either on
the same unit or another similar unit or systemic? This is assuming there are no external
drivers such as an extreme ambient temp change or animal impacts, etc.
Did the fix involve a design change or modification to the system or part(s)?
What lessons learned can SCE derive from the incidents that speak to system reliability,
operation and maintenance, etc.
6.7.1 PCS Medium Voltage (MV) Transformer Replacement (4 December 2014 – 22
April 2015)
While running EMS Test 4 on December 24, 2014, PCS inverter lineup 1 tripped unexpectedly.
At the time of the trip, battery section 1 was at approximately four percent SOC, near the 2.5
percent minimum SOC for normal operation. All battery section 1 racks remained on line, as
designed for this type of trip. The other three PCS inverter lineups and battery sections also
remained on line. Upon discovering the trip, SCE attempted to remotely reset and restart inverter
lineup 1, but was unable to bring the lineup back on line due to an “unexpected status” fault code
from one of the dc circuit breakers. SCE was able to charge the other three battery sections to
approximately 30 percent SOC and left them on line.
Recognizing battery section 1 was at a low SOC, and that the module battery management
systems (MBMSs) built into each battery module had the potential to continue discharging the
battery through standby losses, SCE disconnected the high-level battery section controller (BSC)
from the bank battery management systems (BBMSs) in an attempt to shut down the MBMSs
and preserve battery SOC. SCE was concerned that if battery SOC decreased to a low enough
level, the battery bus voltage would be too low to operate the PCS inverter lineup and recharge
Page 103 of 221
© Copyright 2015, Southern California Edison All Rights Reserved
the battery section. This scenario had the potential of requiring each battery module in each rack
to be manually recharged in order to bring the voltage high enough to operate the PCS, which
would be an extremely laborious and lengthy task given there are 151 racks and 2,718 battery
modules in section 1.
However, the BBMS/MBMS software was not designed to turn off the MBMSs when the
BBMSs were disconnected from the BSC, even if the corresponding racks were off line (all racks
automatically go off line when the BSC is disconnected from the BBMS). The only way to turn
off the MBMSs was to manually open the bank/rack auxiliary power circuit breakers, which
could only be accomplished on-site. As a result, the MBMSs continued to consume energy from
the batteries and lower the SOC. On January 2, 2015, per recommendation from LG Chem, SCE
traveled to the site and manually opened the battery section 1 bank/rack auxiliary power circuit
breakers to turn off the MBMSs and stop the further degradation in SOC.
On January 6, 2015, LG Chem traveled to the site to investigate the trip with remote support
from ABB. LG Chem found one of the two dc circuit breakers in PCS inverter lineup 1 tripped,
requiring a manual reset. As designed, this tripped circuit breaker was preventing the inverter
lineup from being remotely reset or restarted (and was causing the aforementioned circuit
breaker “unexpected status” fault code). On January 7, LG Chem used a circuit breaker checker
tool from ABB in an effort to determine the cause of the trip, but the tool did not provide any
useful information. Also during the visit, LG Chem noted the voltage of battery section 1 had
dropped below the default minimum for the PCS to operate.
After some additional analysis, ABB identified a plan to charge the batteries by resetting the dc
circuit breaker, changing the 12 kV–480 V medium voltage (MV) transformer tap, and
modifying the PCS software to temporarily allow the PCS to run at a lower voltage. On January
13, 2015, LG Chem and ABB changed the transformer tap and PCS software, and successfully
charged battery section 1 to approximately 16 percent SOC. During this time, all other inverter
lineups and battery sections were off line.
While continuing to charge battery section 1, fuses blew on two of the three phases in the fused
disconnect switches on the substation 12 kV rack, between the PCS MV transformer for inverter
lineups 1 and 2, and the 12 kV circuit breaker in the substation. Upon inspecting the PCS, ABB
found the MV transformer for inverter lineups 1 and 2 had failed. The transformer showed signs
of localized heating and arcing around the secondary coils.
Through further investigation, ABB determined the MV transformers in both PCS containers
(one transformer for inverter lineups 1 and 2, and another transformer for inverter lineups 3 and
4) had a design deficiency that did not allow the transformers to operate with a large load on one
inverter lineup and little to no load on the other inverter lineup. The transformers consisted of
one primary coil and two secondary coils, where the secondary coils had axially stacked
windings. Each of the two secondary coils was connected to one of the two inverter lineups.
When both inverter lineups were operating with similar load, the transformer was “balanced”
and operated normally. However, in the case of the failure, inverter lineup 1 was operated to
charge the battery section, while inverter lineup 2 was off line. This created a large load on one
of the secondary coils, with no load on the other secondary coil. In turn, this created a high flux
area and localized overheating at the corner of the secondary winding, which eventually melted
the insulation, shorted the coil, and caused the failure.
Page 104 of 221
© Copyright 2015, Southern California Edison All Rights Reserved
This series of events led to further investigations and the following actions:
Inverter lineup dc circuit breaker: The dc circuit breaker was replaced. The original
circuit breaker was returned to ABB Italy for analysis, but there were no conclusive
findings as to why it tripped.
BMS software: LG Chem developed a Protective Power Saving (PPS) mode for the rack
battery management system (RBMS) software to automatically turn off the MBMSs
when the rack voltage is low and the rack main contactor is open. This will prevent the
MBMSs from further discharging the battery in a similar situation in the future.
Remote e-stop: The system had an existing on-site e-stop circuit designed to quickly and
safely stop the system in the event of a major failure or emergency. Upon activation, this
circuit was designed to send a signal to trip the PCS containers, and to open the master
bank/rack auxiliary power circuit breaker after a three second delay, thereby shutting
down the BBMSs, RBMSs, and MBMSs, and opening the rack main contactors for all
four battery sections. However, this circuit could only be activated via a physical
pushbutton in the control room. Had this circuit been controllable remotely, SCE could
have used it to remove power from the BMS (albeit for all four battery sections), which
would have immediately preserved the SOC without traveling to the site. At SCE’s
request, LG Chem and ABB added a second e-stop button outside the battery building,
and added a remotely controllable software e-stop button to the SEC interface. This
software button triggers the same circuit as the physical buttons, and can be used to
remotely trip the system in the event of an emergency or similar situation in the future.
MV transformer: ABB inspected the failed transformer, prepared a new design that
allowed each inverter lineup to operate independently, manufactured two new
transformers, and replaced the existing transformers on site. The new design featured
secondary coils that were interleaved rather than axially stacked. The complete
replacement project was a major undertaking, since the original and replacement
transformers were a custom design that required noticeable lead time for materials,
manufacturing, and transportation to the battery system. Furthermore, the transformers
were located inside the PCS containers, between the inverter lineups and the 12 kV
disconnect switch/control system bulkhead. Replacing the transformer in each PCS
required first removing the 12 kV disconnect switch and all control system components,
followed by the bulkhead, and finally the transformer. On top of this, the PCS containers
were arranged end-to-end and in close proximity to the battery building and substation 12
kV rack, which meant that working clearances were very limited. Rather than lift the
entire PCS containers to another location to replace the transformers, ABB and the
riggers elected to build platforms to slide the original transformers out of the end of the
PCS containers, lower them to the ground, and then use wood ramps to roll them to a
location where they could be loaded on a truck. The process was reversed to install the
new transformers. Once the transformers were replaced, each PCS container underwent
recommissioning and testing with the rest of the system.
The lessons learned from this series of events include:
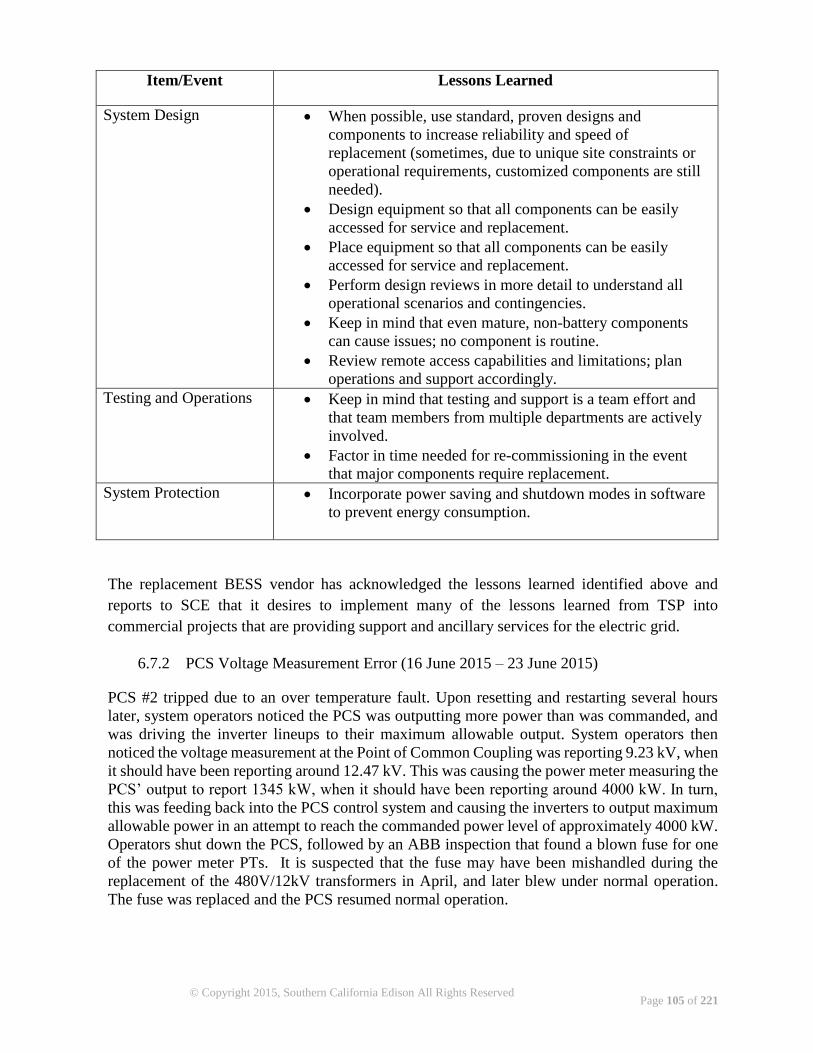
Page 105 of 221
© Copyright 2015, Southern California Edison All Rights Reserved
Item/Event Lessons Learned
System Design When possible, use standard, proven designs and
components to increase reliability and speed of
replacement (sometimes, due to unique site constraints or
operational requirements, customized components are still
needed).
Design equipment so that all components can be easily
accessed for service and replacement.
Place equipment so that all components can be easily
accessed for service and replacement.
Perform design reviews in more detail to understand all
operational scenarios and contingencies.
Keep in mind that even mature, non-battery components
can cause issues; no component is routine.
Review remote access capabilities and limitations; plan
operations and support accordingly.
Testing and Operations Keep in mind that testing and support is a team effort and
that team members from multiple departments are actively
involved.
Factor in time needed for re-commissioning in the event
that major components require replacement.
System Protection Incorporate power saving and shutdown modes in software
to prevent energy consumption.
The replacement BESS vendor has acknowledged the lessons learned identified above and
reports to SCE that it desires to implement many of the lessons learned from TSP into
commercial projects that are providing support and ancillary services for the electric grid.
6.7.2 PCS Voltage Measurement Error (16 June 2015 – 23 June 2015)
PCS #2 tripped due to an over temperature fault. Upon resetting and restarting several hours
later, system operators noticed the PCS was outputting more power than was commanded, and
was driving the inverter lineups to their maximum allowable output. System operators then
noticed the voltage measurement at the Point of Common Coupling was reporting 9.23 kV, when
it should have been reporting around 12.47 kV. This was causing the power meter measuring the
PCS’ output to report 1345 kW, when it should have been reporting around 4000 kW. In turn,
this was feeding back into the PCS control system and causing the inverters to output maximum
allowable power in an attempt to reach the commanded power level of approximately 4000 kW.
Operators shut down the PCS, followed by an ABB inspection that found a blown fuse for one
of the power meter PTs. It is suspected that the fuse may have been mishandled during the
replacement of the 480V/12kV transformers in April, and later blew under normal operation.
The fuse was replaced and the PCS resumed normal operation.
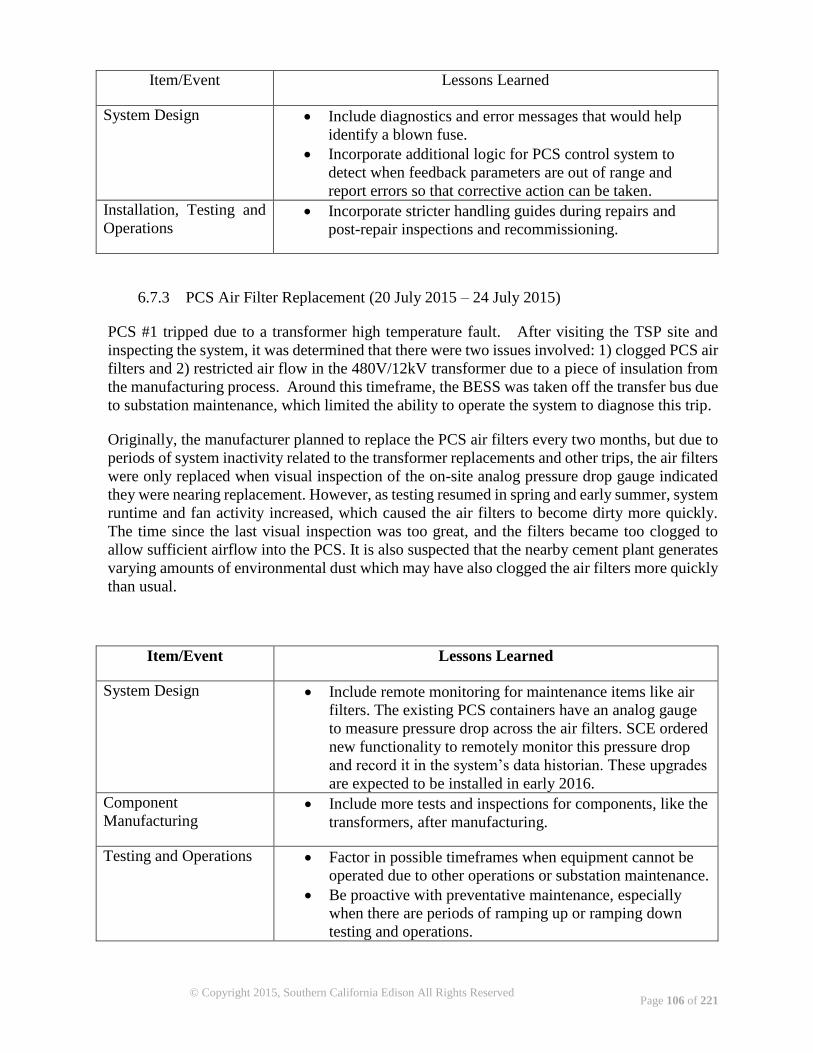
Page 106 of 221
© Copyright 2015, Southern California Edison All Rights Reserved
Item/Event Lessons Learned
System Design Include diagnostics and error messages that would help
identify a blown fuse.
Incorporate additional logic for PCS control system to
detect when feedback parameters are out of range and
report errors so that corrective action can be taken.
Installation, Testing and
Operations Incorporate stricter handling guides during repairs and
post-repair inspections and recommissioning.
6.7.3 PCS Air Filter Replacement (20 July 2015 – 24 July 2015)
PCS #1 tripped due to a transformer high temperature fault. After visiting the TSP site and
inspecting the system, it was determined that there were two issues involved: 1) clogged PCS air
filters and 2) restricted air flow in the 480V/12kV transformer due to a piece of insulation from
the manufacturing process. Around this timeframe, the BESS was taken off the transfer bus due
to substation maintenance, which limited the ability to operate the system to diagnose this trip.
Originally, the manufacturer planned to replace the PCS air filters every two months, but due to
periods of system inactivity related to the transformer replacements and other trips, the air filters
were only replaced when visual inspection of the on-site analog pressure drop gauge indicated
they were nearing replacement. However, as testing resumed in spring and early summer, system
runtime and fan activity increased, which caused the air filters to become dirty more quickly.
The time since the last visual inspection was too great, and the filters became too clogged to
allow sufficient airflow into the PCS. It is also suspected that the nearby cement plant generates
varying amounts of environmental dust which may have also clogged the air filters more quickly
than usual.
Item/Event Lessons Learned
System Design Include remote monitoring for maintenance items like air
filters. The existing PCS containers have an analog gauge
to measure pressure drop across the air filters. SCE ordered
new functionality to remotely monitor this pressure drop
and record it in the system’s data historian. These upgrades
are expected to be installed in early 2016.
Component
Manufacturing Include more tests and inspections for components, like the
transformers, after manufacturing.
Testing and Operations Factor in possible timeframes when equipment cannot be
operated due to other operations or substation maintenance.
Be proactive with preventative maintenance, especially
when there are periods of ramping up or ramping down
testing and operations.
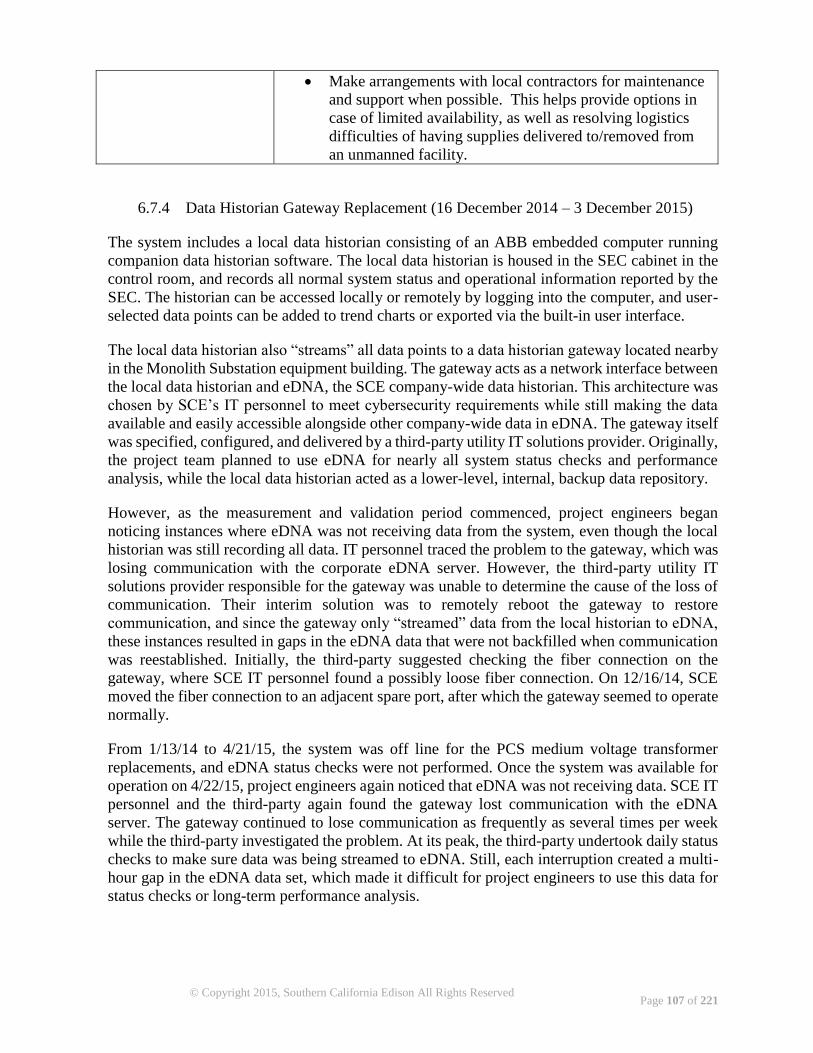
Page 107 of 221
© Copyright 2015, Southern California Edison All Rights Reserved
Make arrangements with local contractors for maintenance
and support when possible. This helps provide options in
case of limited availability, as well as resolving logistics
difficulties of having supplies delivered to/removed from
an unmanned facility.
6.7.4 Data Historian Gateway Replacement (16 December 2014 – 3 December 2015)
The system includes a local data historian consisting of an ABB embedded computer running
companion data historian software. The local data historian is housed in the SEC cabinet in the
control room, and records all normal system status and operational information reported by the
SEC. The historian can be accessed locally or remotely by logging into the computer, and user-
selected data points can be added to trend charts or exported via the built-in user interface.
The local data historian also “streams” all data points to a data historian gateway located nearby
in the Monolith Substation equipment building. The gateway acts as a network interface between
the local data historian and eDNA, the SCE company-wide data historian. This architecture was
chosen by SCE’s IT personnel to meet cybersecurity requirements while still making the data
available and easily accessible alongside other company-wide data in eDNA. The gateway itself
was specified, configured, and delivered by a third-party utility IT solutions provider. Originally,
the project team planned to use eDNA for nearly all system status checks and performance
analysis, while the local data historian acted as a lower-level, internal, backup data repository.
However, as the measurement and validation period commenced, project engineers began
noticing instances where eDNA was not receiving data from the system, even though the local
historian was still recording all data. IT personnel traced the problem to the gateway, which was
losing communication with the corporate eDNA server. However, the third-party utility IT
solutions provider responsible for the gateway was unable to determine the cause of the loss of
communication. Their interim solution was to remotely reboot the gateway to restore
communication, and since the gateway only “streamed” data from the local historian to eDNA,
these instances resulted in gaps in the eDNA data that were not backfilled when communication
was reestablished. Initially, the third-party suggested checking the fiber connection on the
gateway, where SCE IT personnel found a possibly loose fiber connection. On 12/16/14, SCE
moved the fiber connection to an adjacent spare port, after which the gateway seemed to operate
normally.
From 1/13/14 to 4/21/15, the system was off line for the PCS medium voltage transformer
replacements, and eDNA status checks were not performed. Once the system was available for
operation on 4/22/15, project engineers again noticed that eDNA was not receiving data. SCE IT
personnel and the third-party again found the gateway lost communication with the eDNA
server. The gateway continued to lose communication as frequently as several times per week
while the third-party investigated the problem. At its peak, the third-party undertook daily status
checks to make sure data was being streamed to eDNA. Still, each interruption created a multi-
hour gap in the eDNA data set, which made it difficult for project engineers to use this data for
status checks or long-term performance analysis.
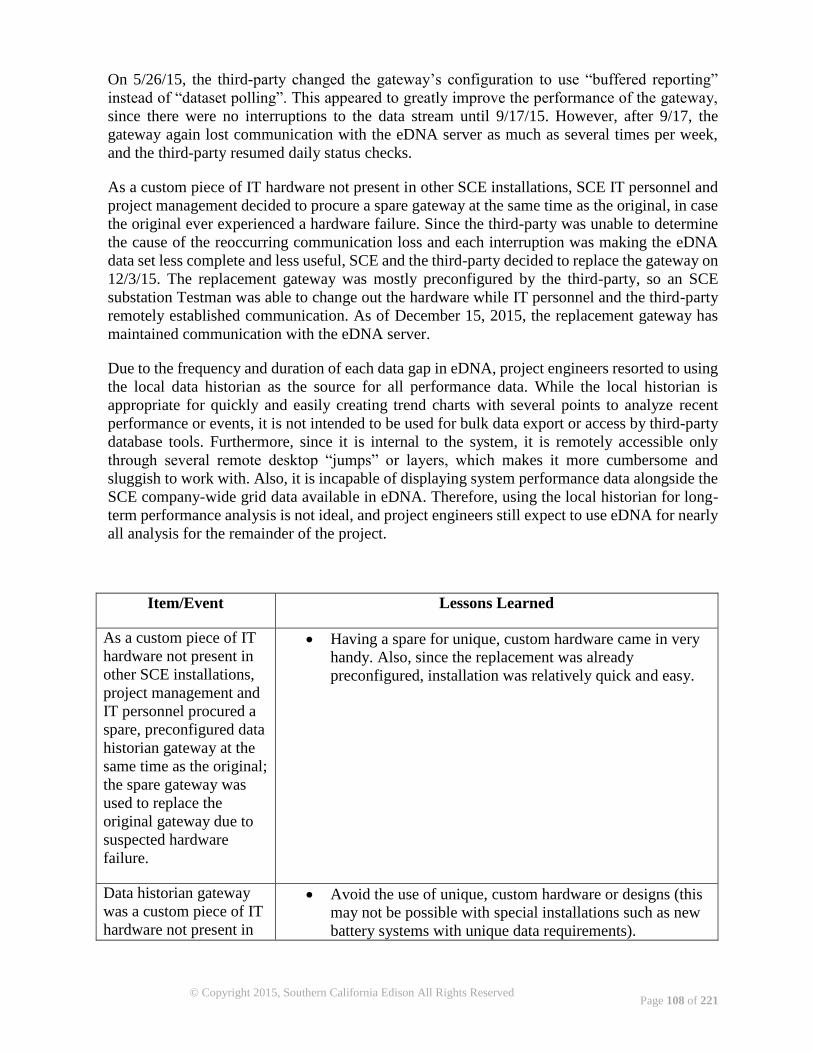
Page 108 of 221
© Copyright 2015, Southern California Edison All Rights Reserved
On 5/26/15, the third-party changed the gateway’s configuration to use “buffered reporting”
instead of “dataset polling”. This appeared to greatly improve the performance of the gateway,
since there were no interruptions to the data stream until 9/17/15. However, after 9/17, the
gateway again lost communication with the eDNA server as much as several times per week,
and the third-party resumed daily status checks.
As a custom piece of IT hardware not present in other SCE installations, SCE IT personnel and
project management decided to procure a spare gateway at the same time as the original, in case
the original ever experienced a hardware failure. Since the third-party was unable to determine
the cause of the reoccurring communication loss and each interruption was making the eDNA
data set less complete and less useful, SCE and the third-party decided to replace the gateway on
12/3/15. The replacement gateway was mostly preconfigured by the third-party, so an SCE
substation Testman was able to change out the hardware while IT personnel and the third-party
remotely established communication. As of December 15, 2015, the replacement gateway has
maintained communication with the eDNA server.
Due to the frequency and duration of each data gap in eDNA, project engineers resorted to using
the local data historian as the source for all performance data. While the local historian is
appropriate for quickly and easily creating trend charts with several points to analyze recent
performance or events, it is not intended to be used for bulk data export or access by third-party
database tools. Furthermore, since it is internal to the system, it is remotely accessible only
through several remote desktop “jumps” or layers, which makes it more cumbersome and
sluggish to work with. Also, it is incapable of displaying system performance data alongside the
SCE company-wide grid data available in eDNA. Therefore, using the local historian for long-
term performance analysis is not ideal, and project engineers still expect to use eDNA for nearly
all analysis for the remainder of the project.
Item/Event Lessons Learned
As a custom piece of IT
hardware not present in
other SCE installations,
project management and
IT personnel procured a
spare, preconfigured data
historian gateway at the
same time as the original;
the spare gateway was
used to replace the
original gateway due to
suspected hardware
failure.
Having a spare for unique, custom hardware came in very
handy. Also, since the replacement was already
preconfigured, installation was relatively quick and easy.
Data historian gateway
was a custom piece of IT
hardware not present in
Avoid the use of unique, custom hardware or designs (this
may not be possible with special installations such as new
battery systems with unique data requirements).
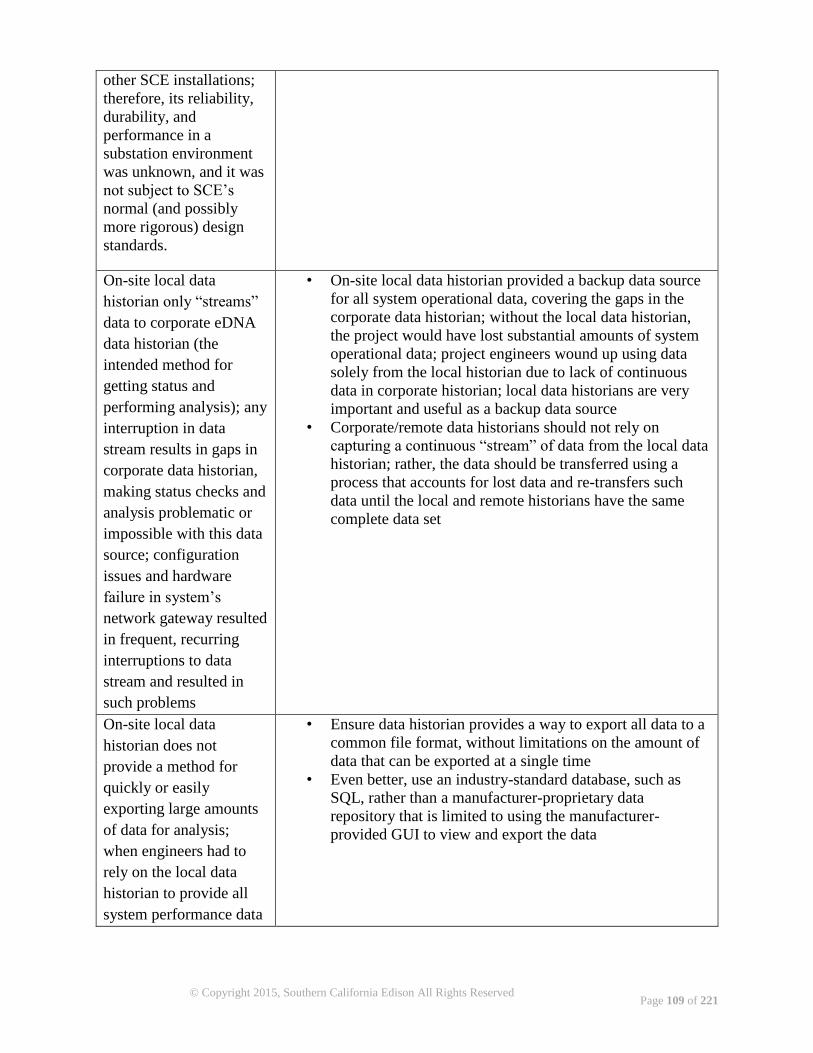
Page 109 of 221
© Copyright 2015, Southern California Edison All Rights Reserved
other SCE installations;
therefore, its reliability,
durability, and
performance in a
substation environment
was unknown, and it was
not subject to SCE’s
normal (and possibly
more rigorous) design
standards.
On-site local data
historian only “streams”
data to corporate eDNA
data historian (the
intended method for
getting status and
performing analysis); any
interruption in data
stream results in gaps in
corporate data historian,
making status checks and
analysis problematic or
impossible with this data
source; configuration
issues and hardware
failure in system’s
network gateway resulted
in frequent, recurring
interruptions to data
stream and resulted in
such problems
• On-site local data historian provided a backup data source
for all system operational data, covering the gaps in the
corporate data historian; without the local data historian,
the project would have lost substantial amounts of system
operational data; project engineers wound up using data
solely from the local historian due to lack of continuous
data in corporate historian; local data historians are very
important and useful as a backup data source
• Corporate/remote data historians should not rely on
capturing a continuous “stream” of data from the local data
historian; rather, the data should be transferred using a
process that accounts for lost data and re-transfers such
data until the local and remote historians have the same
complete data set
On-site local data
historian does not
provide a method for
quickly or easily
exporting large amounts
of data for analysis;
when engineers had to
rely on the local data
historian to provide all
system performance data
• Ensure data historian provides a way to export all data to a
common file format, without limitations on the amount of
data that can be exported at a single time
• Even better, use an industry-standard database, such as
SQL, rather than a manufacturer-proprietary data
repository that is limited to using the manufacturer-
provided GUI to view and export the data
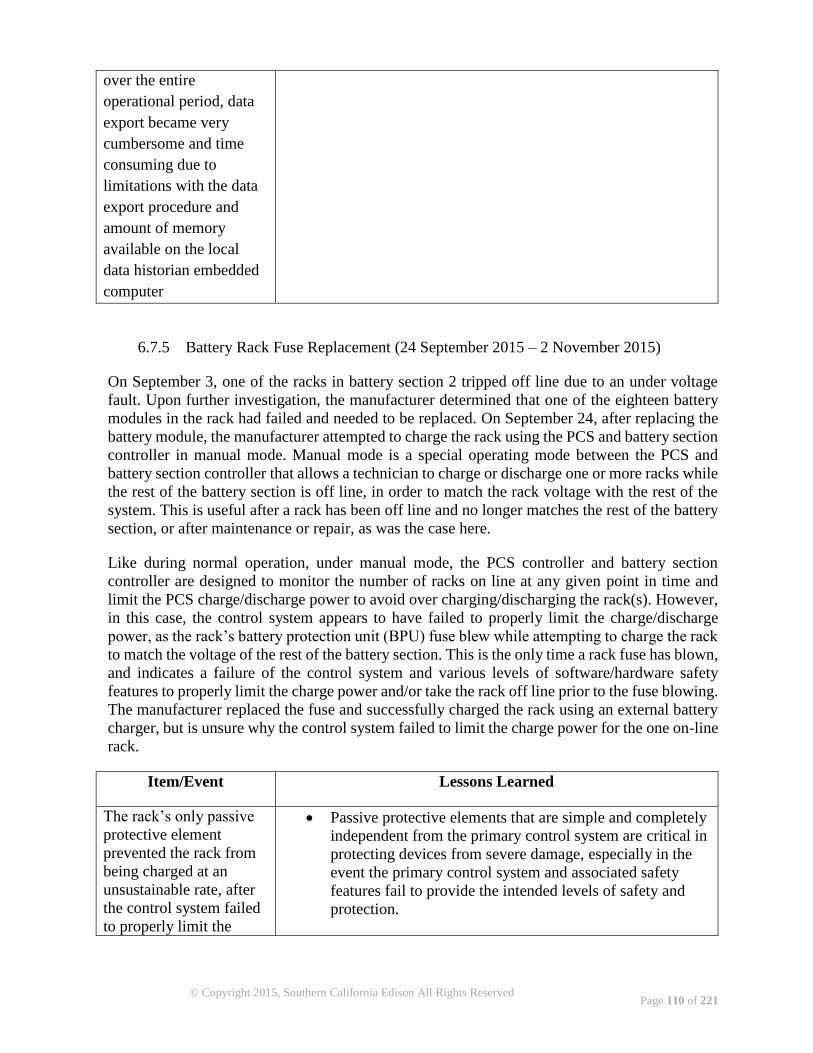
Page 110 of 221
© Copyright 2015, Southern California Edison All Rights Reserved
over the entire
operational period, data
export became very
cumbersome and time
consuming due to
limitations with the data
export procedure and
amount of memory
available on the local
data historian embedded
computer
6.7.5 Battery Rack Fuse Replacement (24 September 2015 – 2 November 2015)
On September 3, one of the racks in battery section 2 tripped off line due to an under voltage
fault. Upon further investigation, the manufacturer determined that one of the eighteen battery
modules in the rack had failed and needed to be replaced. On September 24, after replacing the
battery module, the manufacturer attempted to charge the rack using the PCS and battery section
controller in manual mode. Manual mode is a special operating mode between the PCS and
battery section controller that allows a technician to charge or discharge one or more racks while
the rest of the battery section is off line, in order to match the rack voltage with the rest of the
system. This is useful after a rack has been off line and no longer matches the rest of the battery
section, or after maintenance or repair, as was the case here.
Like during normal operation, under manual mode, the PCS controller and battery section
controller are designed to monitor the number of racks on line at any given point in time and
limit the PCS charge/discharge power to avoid over charging/discharging the rack(s). However,
in this case, the control system appears to have failed to properly limit the charge/discharge
power, as the rack’s battery protection unit (BPU) fuse blew while attempting to charge the rack
to match the voltage of the rest of the battery section. This is the only time a rack fuse has blown,
and indicates a failure of the control system and various levels of software/hardware safety
features to properly limit the charge power and/or take the rack off line prior to the fuse blowing.
The manufacturer replaced the fuse and successfully charged the rack using an external battery
charger, but is unsure why the control system failed to limit the charge power for the one on-line
rack.
Item/Event Lessons Learned
The rack’s only passive
protective element
prevented the rack from
being charged at an
unsustainable rate, after
the control system failed
to properly limit the
Passive protective elements that are simple and completely
independent from the primary control system are critical in
protecting devices from severe damage, especially in the
event the primary control system and associated safety
features fail to provide the intended levels of safety and
protection.
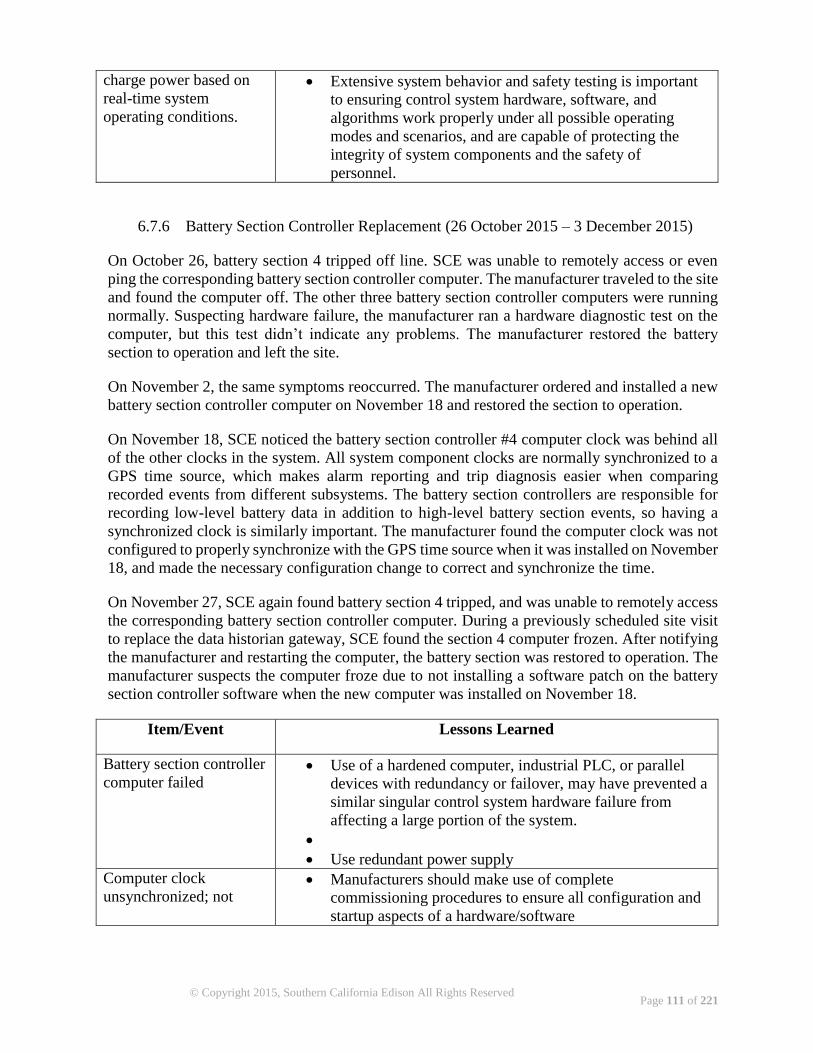
Page 111 of 221
© Copyright 2015, Southern California Edison All Rights Reserved
charge power based on
real-time system
operating conditions.
Extensive system behavior and safety testing is important
to ensuring control system hardware, software, and
algorithms work properly under all possible operating
modes and scenarios, and are capable of protecting the
integrity of system components and the safety of
personnel.
6.7.6 Battery Section Controller Replacement (26 October 2015 – 3 December 2015)
On October 26, battery section 4 tripped off line. SCE was unable to remotely access or even
ping the corresponding battery section controller computer. The manufacturer traveled to the site
and found the computer off. The other three battery section controller computers were running
normally. Suspecting hardware failure, the manufacturer ran a hardware diagnostic test on the
computer, but this test didn’t indicate any problems. The manufacturer restored the battery
section to operation and left the site.
On November 2, the same symptoms reoccurred. The manufacturer ordered and installed a new
battery section controller computer on November 18 and restored the section to operation.
On November 18, SCE noticed the battery section controller #4 computer clock was behind all
of the other clocks in the system. All system component clocks are normally synchronized to a
GPS time source, which makes alarm reporting and trip diagnosis easier when comparing
recorded events from different subsystems. The battery section controllers are responsible for
recording low-level battery data in addition to high-level battery section events, so having a
synchronized clock is similarly important. The manufacturer found the computer clock was not
configured to properly synchronize with the GPS time source when it was installed on November
18, and made the necessary configuration change to correct and synchronize the time.
On November 27, SCE again found battery section 4 tripped, and was unable to remotely access
the corresponding battery section controller computer. During a previously scheduled site visit
to replace the data historian gateway, SCE found the section 4 computer frozen. After notifying
the manufacturer and restarting the computer, the battery section was restored to operation. The
manufacturer suspects the computer froze due to not installing a software patch on the battery
section controller software when the new computer was installed on November 18.
Item/Event Lessons Learned
Battery section controller
computer failed Use of a hardened computer, industrial PLC, or parallel
devices with redundancy or failover, may have prevented a
similar singular control system hardware failure from
affecting a large portion of the system.
Use redundant power supply
Computer clock
unsynchronized; not Manufacturers should make use of complete
commissioning procedures to ensure all configuration and
startup aspects of a hardware/software
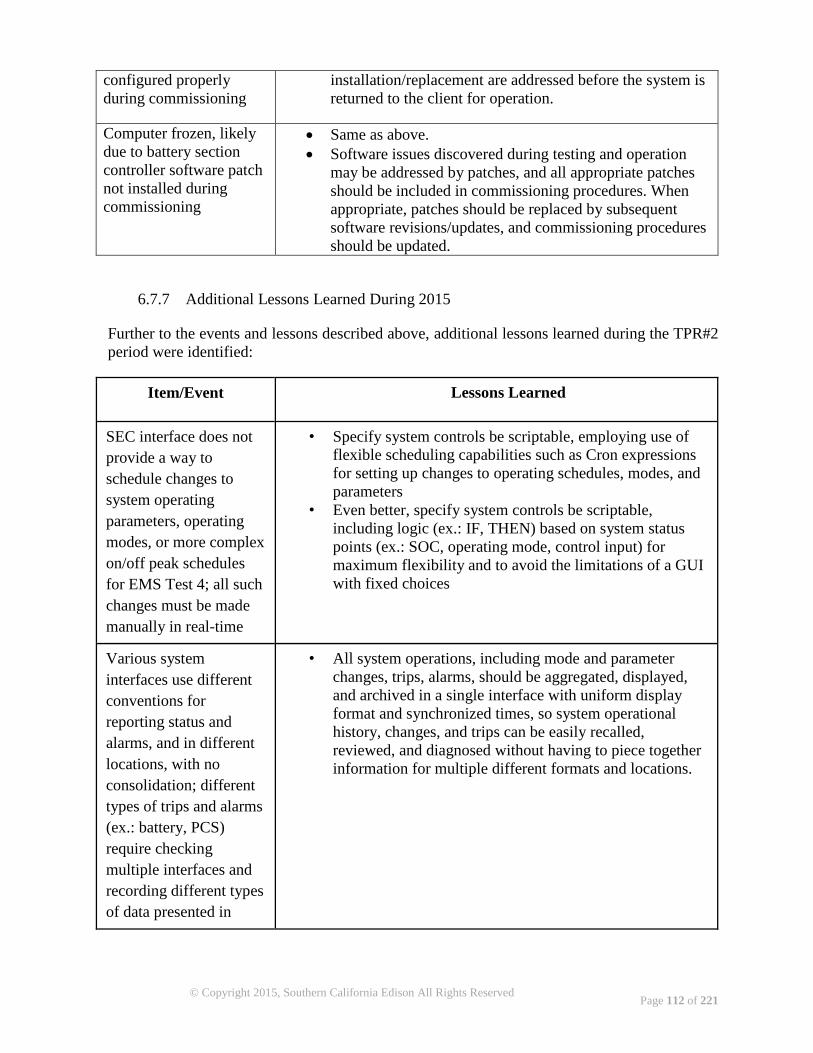
Page 112 of 221
© Copyright 2015, Southern California Edison All Rights Reserved
configured properly
during commissioning
installation/replacement are addressed before the system is
returned to the client for operation.
Computer frozen, likely
due to battery section
controller software patch
not installed during
commissioning
Same as above.
Software issues discovered during testing and operation
may be addressed by patches, and all appropriate patches
should be included in commissioning procedures. When
appropriate, patches should be replaced by subsequent
software revisions/updates, and commissioning procedures
should be updated.
6.7.7 Additional Lessons Learned During 2015
Further to the events and lessons described above, additional lessons learned during the TPR#2
period were identified:
Item/Event Lessons Learned
SEC interface does not
provide a way to
schedule changes to
system operating
parameters, operating
modes, or more complex
on/off peak schedules
for EMS Test 4; all such
changes must be made
manually in real-time
• Specify system controls be scriptable, employing use of
flexible scheduling capabilities such as Cron expressions
for setting up changes to operating schedules, modes, and
parameters
• Even better, specify system controls be scriptable,
including logic (ex.: IF, THEN) based on system status
points (ex.: SOC, operating mode, control input) for
maximum flexibility and to avoid the limitations of a GUI
with fixed choices
Various system
interfaces use different
conventions for
reporting status and
alarms, and in different
locations, with no
consolidation; different
types of trips and alarms
(ex.: battery, PCS)
require checking
multiple interfaces and
recording different types
of data presented in
• All system operations, including mode and parameter
changes, trips, alarms, should be aggregated, displayed,
and archived in a single interface with uniform display
format and synchronized times, so system operational
history, changes, and trips can be easily recalled,
reviewed, and diagnosed without having to piece together
information for multiple different formats and locations.
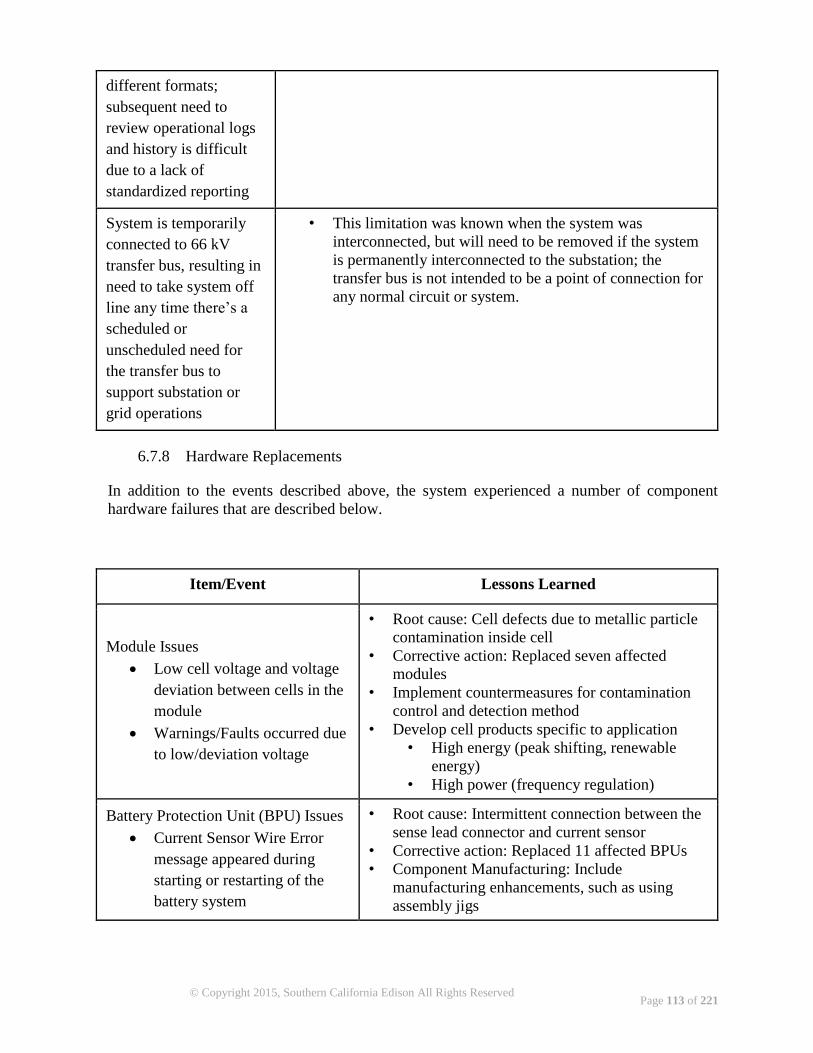
Page 113 of 221
© Copyright 2015, Southern California Edison All Rights Reserved
different formats;
subsequent need to
review operational logs
and history is difficult
due to a lack of
standardized reporting
System is temporarily
connected to 66 kV
transfer bus, resulting in
need to take system off
line any time there’s a
scheduled or
unscheduled need for
the transfer bus to
support substation or
grid operations
• This limitation was known when the system was
interconnected, but will need to be removed if the system
is permanently interconnected to the substation; the
transfer bus is not intended to be a point of connection for
any normal circuit or system.
6.7.8 Hardware Replacements
In addition to the events described above, the system experienced a number of component
hardware failures that are described below.
Item/Event Lessons Learned
Module Issues
Low cell voltage and voltage
deviation between cells in the
module
Warnings/Faults occurred due
to low/deviation voltage
• Root cause: Cell defects due to metallic particle
contamination inside cell
• Corrective action: Replaced seven affected
modules
• Implement countermeasures for contamination
control and detection method
• Develop cell products specific to application
• High energy (peak shifting, renewable
energy)
• High power (frequency regulation)
Battery Protection Unit (BPU) Issues
Current Sensor Wire Error
message appeared during
starting or restarting of the
battery system
• Root cause: Intermittent connection between the
sense lead connector and current sensor
• Corrective action: Replaced 11 affected BPUs
• Component Manufacturing: Include
manufacturing enhancements, such as using
assembly jigs
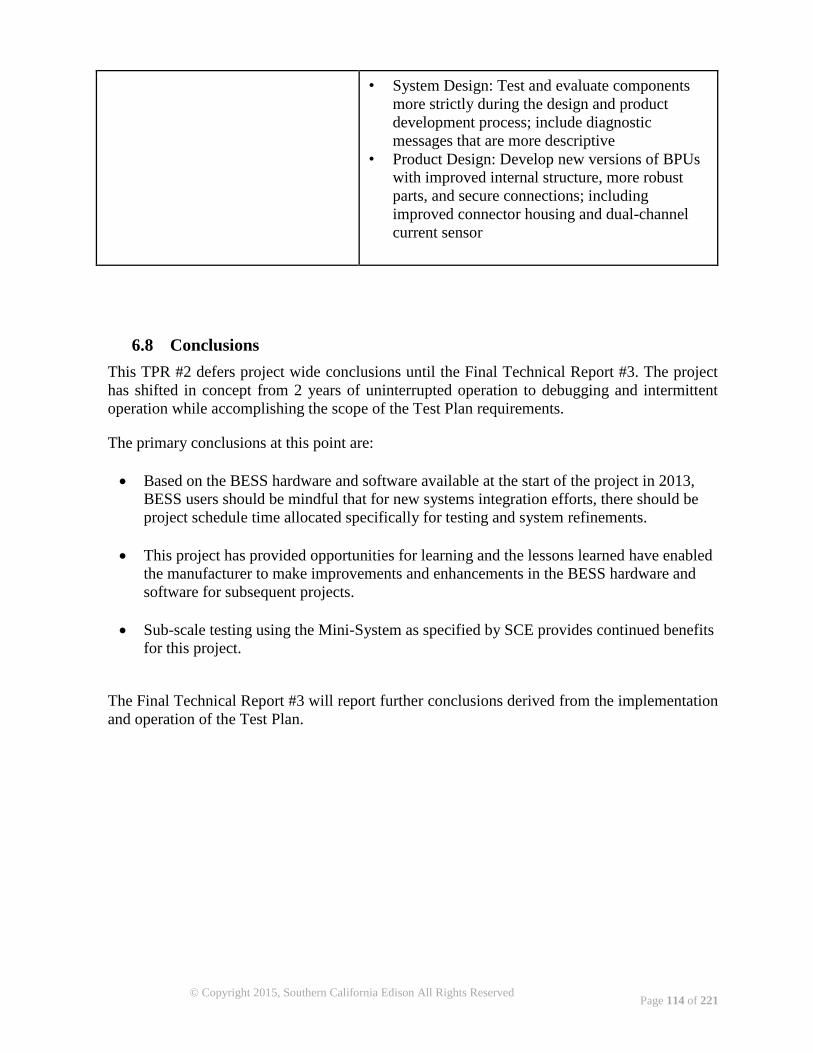
Page 114 of 221
© Copyright 2015, Southern California Edison All Rights Reserved
• System Design: Test and evaluate components
more strictly during the design and product
development process; include diagnostic
messages that are more descriptive
• Product Design: Develop new versions of BPUs
with improved internal structure, more robust
parts, and secure connections; including
improved connector housing and dual-channel
current sensor
6.8 Conclusions
This TPR #2 defers project wide conclusions until the Final Technical Report #3. The project
has shifted in concept from 2 years of uninterrupted operation to debugging and intermittent
operation while accomplishing the scope of the Test Plan requirements.
The primary conclusions at this point are:
Based on the BESS hardware and software available at the start of the project in 2013,
BESS users should be mindful that for new systems integration efforts, there should be
project schedule time allocated specifically for testing and system refinements.
This project has provided opportunities for learning and the lessons learned have enabled
the manufacturer to make improvements and enhancements in the BESS hardware and
software for subsequent projects.
Sub-scale testing using the Mini-System as specified by SCE provides continued benefits
for this project.
The Final Technical Report #3 will report further conclusions derived from the implementation
and operation of the Test Plan.
Page 115 of 221
© Copyright 2015, Southern California Edison All Rights Reserved
7. Storage System Performance Parameters
The BESS performance parameters are specific to the energy storage systems itself. This means
that in addition to measuring the impact of the BESS, SCE will report how well the BESS
operates under various conditions regardless of the impact it might have on the system or market.
Specific performance parameters are described in the following tabulated summary. The table
will be populated as data becomes available during M&V testing leading up to issue of the Final
Technical Report #3.
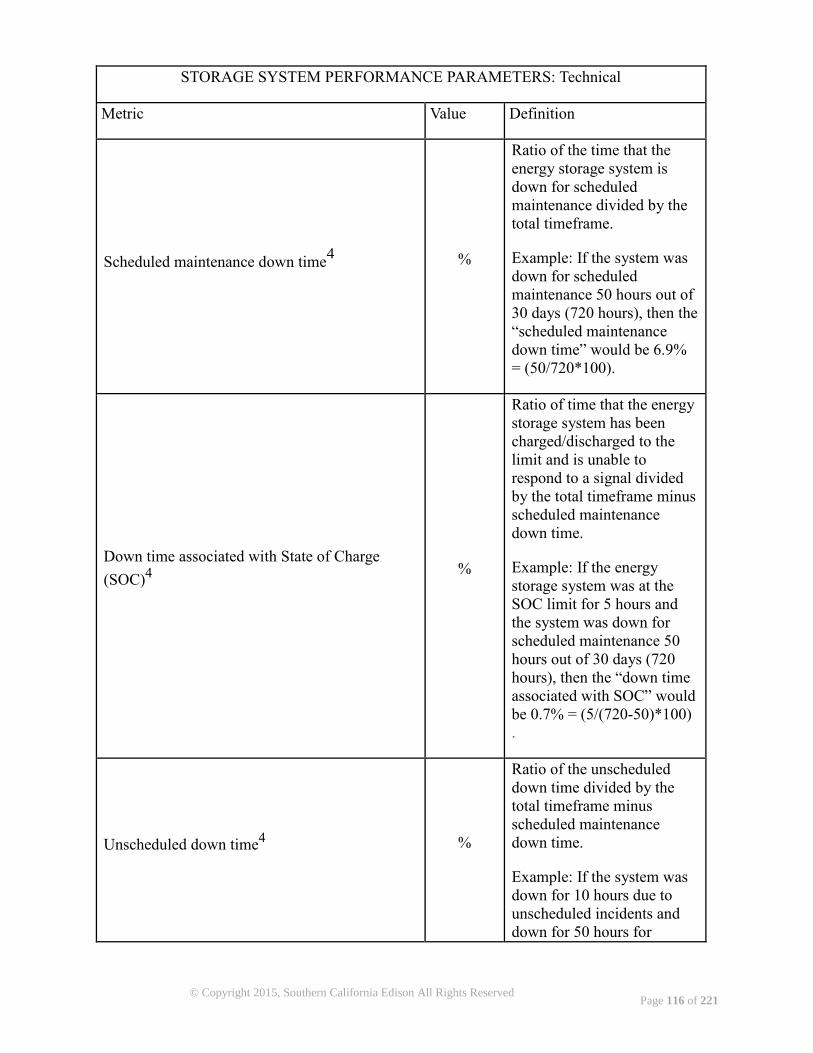
Page 116 of 221
© Copyright 2015, Southern California Edison All Rights Reserved
STORAGE SYSTEM PERFORMANCE PARAMETERS: Technical
Metric Value Definition
Scheduled maintenance down time4 %
Ratio of the time that the
energy storage system is
down for scheduled
maintenance divided by the
total timeframe.
Example: If the system was
down for scheduled
maintenance 50 hours out of
30 days (720 hours), then the
“scheduled maintenance
down time” would be 6.9%
= (50/720*100).
Down time associated with State of Charge
(SOC)4
%
Ratio of time that the energy
storage system has been
charged/discharged to the
limit and is unable to
respond to a signal divided
by the total timeframe minus
scheduled maintenance
down time.
Example: If the energy
storage system was at the
SOC limit for 5 hours and
the system was down for
scheduled maintenance 50
hours out of 30 days (720
hours), then the “down time
associated with SOC” would
be 0.7% = (5/(720-50)*100)
.
Unscheduled down time4 %
Ratio of the unscheduled
down time divided by the
total timeframe minus
scheduled maintenance
down time.
Example: If the system was
down for 10 hours due to
unscheduled incidents and
down for 50 hours for
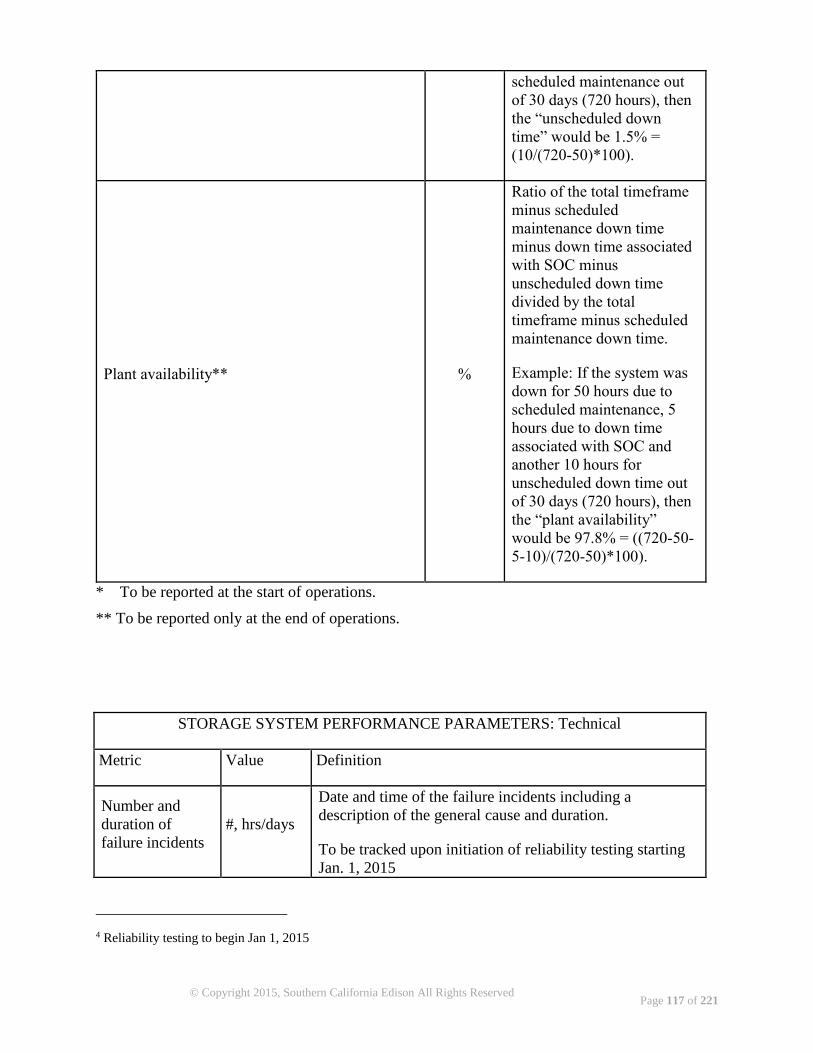
Page 117 of 221
© Copyright 2015, Southern California Edison All Rights Reserved
* To be reported at the start of operations.
** To be reported only at the end of operations.
STORAGE SYSTEM PERFORMANCE PARAMETERS: Technical
Metric Value Definition
Number and
duration of
failure incidents
#, hrs/days
Date and time of the failure incidents including a
description of the general cause and duration.
To be tracked upon initiation of reliability testing starting
Jan. 1, 2015
4 Reliability testing to begin Jan 1, 2015
scheduled maintenance out
of 30 days (720 hours), then
the “unscheduled down
time” would be 1.5% =
(10/(720-50)*100).
Plant availability** %
Ratio of the total timeframe
minus scheduled
maintenance down time
minus down time associated
with SOC minus
unscheduled down time
divided by the total
timeframe minus scheduled
maintenance down time.
Example: If the system was
down for 50 hours due to
scheduled maintenance, 5
hours due to down time
associated with SOC and
another 10 hours for
unscheduled down time out
of 30 days (720 hours), then
the “plant availability”
would be 97.8% = ((720-50-
5-10)/(720-50)*100).
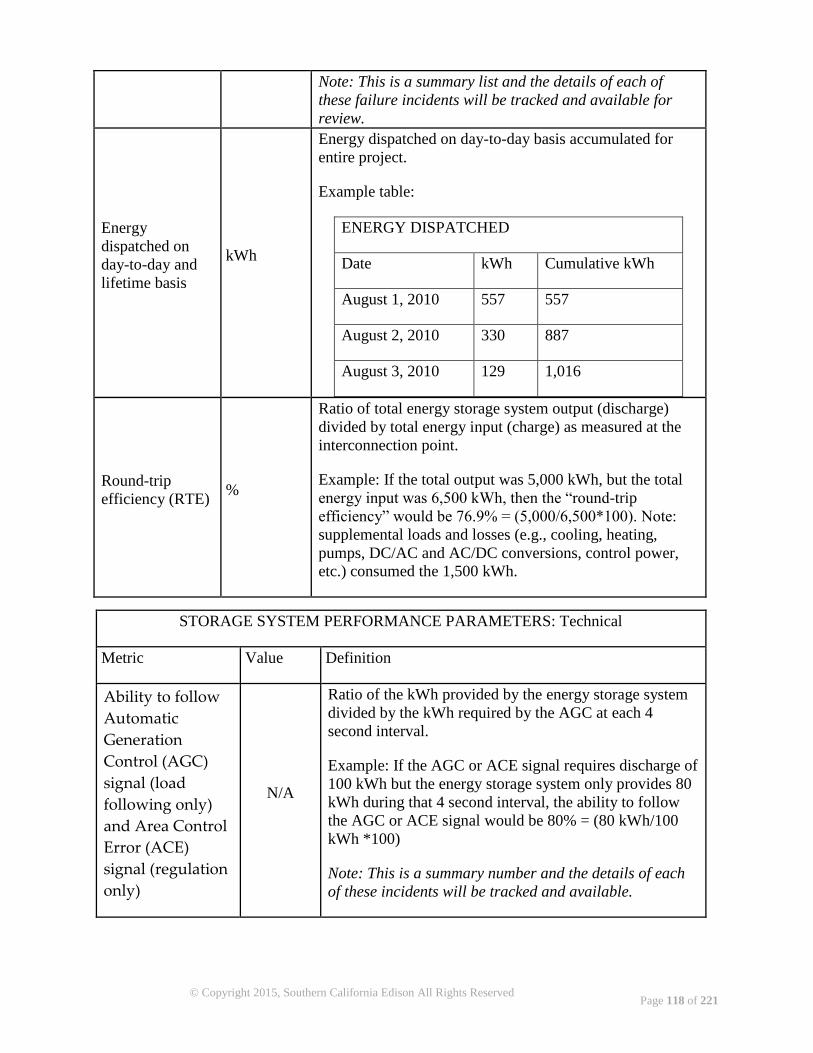
Page 118 of 221
© Copyright 2015, Southern California Edison All Rights Reserved
Note: This is a summary list and the details of each of
these failure incidents will be tracked and available for
review.
Energy
dispatched on
day-to-day and
lifetime basis
kWh
Energy dispatched on day-to-day basis accumulated for
entire project.
Example table:
ENERGY DISPATCHED
Date kWh Cumulative kWh
August 1, 2010 557 557
August 2, 2010 330 887
August 3, 2010 129 1,016
Round-trip
efficiency (RTE) %
Ratio of total energy storage system output (discharge)
divided by total energy input (charge) as measured at the
interconnection point.
Example: If the total output was 5,000 kWh, but the total
energy input was 6,500 kWh, then the “round-trip
efficiency” would be 76.9% = (5,000/6,500*100). Note:
supplemental loads and losses (e.g., cooling, heating,
pumps, DC/AC and AC/DC conversions, control power,
etc.) consumed the 1,500 kWh.
STORAGE SYSTEM PERFORMANCE PARAMETERS: Technical
Metric Value Definition
Ability to follow
Automatic
Generation
Control (AGC)
signal (load
following only)
and Area Control
Error (ACE)
signal (regulation
only)
N/A
Ratio of the kWh provided by the energy storage system
divided by the kWh required by the AGC at each 4
second interval.
Example: If the AGC or ACE signal requires discharge of
100 kWh but the energy storage system only provides 80
kWh during that 4 second interval, the ability to follow
the AGC or ACE signal would be 80% = (80 kWh/100
kWh *100)
Note: This is a summary number and the details of each
of these incidents will be tracked and available.
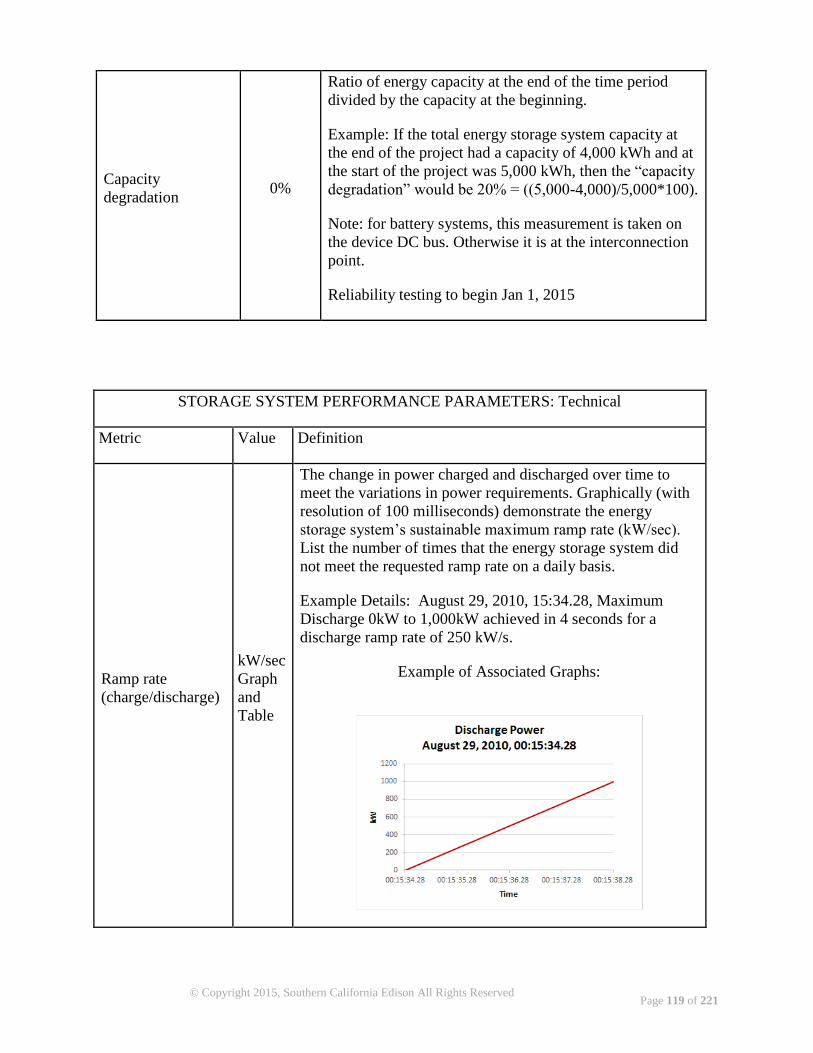
Page 119 of 221
© Copyright 2015, Southern California Edison All Rights Reserved
STORAGE SYSTEM PERFORMANCE PARAMETERS: Technical
Metric Value Definition
Ramp rate
(charge/discharge)
kW/sec
Graph
and
Table
The change in power charged and discharged over time to
meet the variations in power requirements. Graphically (with
resolution of 100 milliseconds) demonstrate the energy
storage system’s sustainable maximum ramp rate (kW/sec).
List the number of times that the energy storage system did
not meet the requested ramp rate on a daily basis.
Example Details: August 29, 2010, 15:34.28, Maximum
Discharge 0kW to 1,000kW achieved in 4 seconds for a
discharge ramp rate of 250 kW/s.
Example of Associated Graphs:
Capacity
degradation 0%
Ratio of energy capacity at the end of the time period
divided by the capacity at the beginning.
Example: If the total energy storage system capacity at
the end of the project had a capacity of 4,000 kWh and at
the start of the project was 5,000 kWh, then the “capacity
degradation” would be 20% = ((5,000-4,000)/5,000*100).
Note: for battery systems, this measurement is taken on
the device DC bus. Otherwise it is at the interconnection
point.
Reliability testing to begin Jan 1, 2015
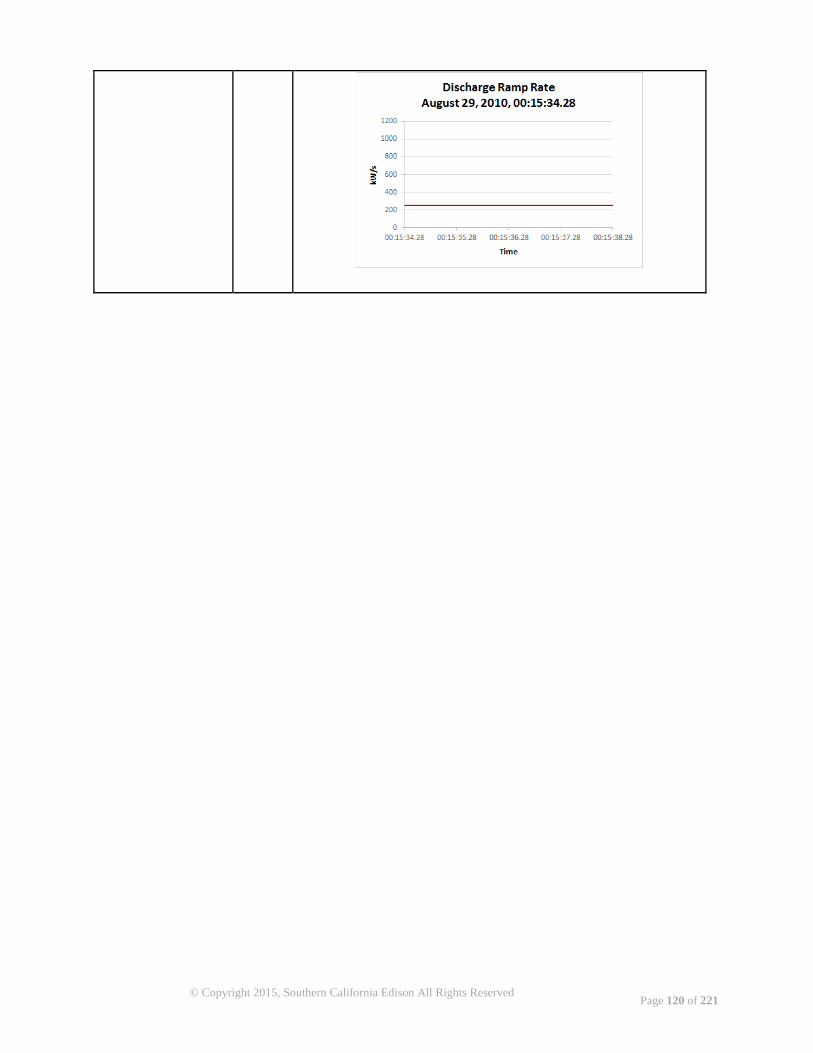
Page 120 of 221
© Copyright 2015, Southern California Edison All Rights Reserved

Page 121 of 221
© Copyright 2015, Southern California Edison All Rights Reserved
* To be reported at the start of operations.
** To be reported only at the end of operations.
STORAGE SYSTEM PERFORMANCE PARAMETERS: Economic
Metric Value Definition
Engineering and design costs $
The cost associated with engineering and
design for the demonstration project
implementation.
Capital cost (i.e., equipment
capital and installation)* $
Total installed first cost of fielded system,
breaking out major categories including
equipment (i.e., major equipment components,
related support equipment, and initial spare
parts) and costs associated with shipping, site
preparations, installation, and commissioning.
Capital cost* $/kWh &
$/kW
Total installed first cost of fielded system,
normalized by energy storage capacity and
peak power output.
End of life disposal cost** $
Total cost of dismantling and removing the
fielded system, including (if applicable)
decontamination long-term waste storage,
environmental restoration and related costs.
End of life value of plant and
equipment** $
Resale or salvage value of plant and all
associated equipment.
Operating cost (activity
based, non-fuel, by
application plus monitoring)
$/kW-
month
Activity based, average monthly total of all
direct and indirect costs incurred in using the
system, excluding the cost of purchased
electricity and including third-party monitoring
if applicable.
Maintenance cost (by cost
category)
$/kW-
month
Activity based, average monthly cost of
maintaining the fielded system.
STORAGE SYSTEM PERFORMANCE PARAMETERS: Environmental Health & Safety
Metric Value Definition
Operating temperature 20°C Degrees Fahrenheit at which the energy system
normally operates.
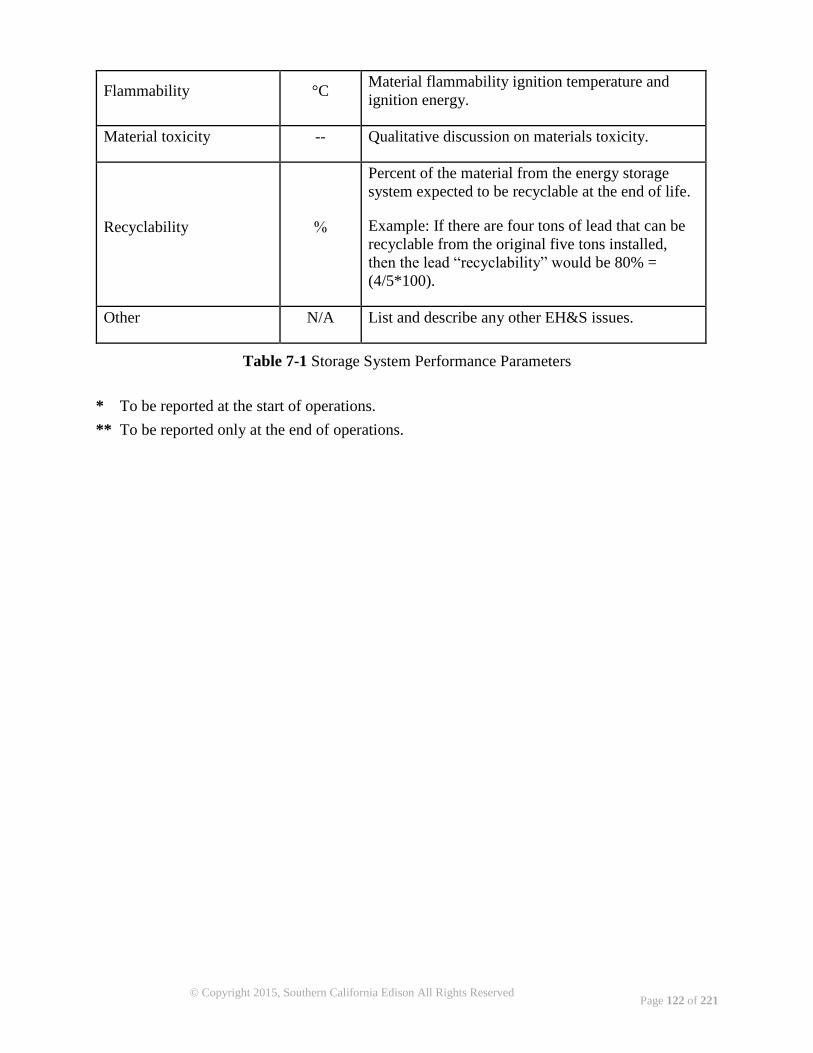
Page 122 of 221
© Copyright 2015, Southern California Edison All Rights Reserved
Table 7-1 Storage System Performance Parameters
* To be reported at the start of operations.
** To be reported only at the end of operations.
Flammability °C Material flammability ignition temperature and
ignition energy.
Material toxicity -- Qualitative discussion on materials toxicity.
Recyclability %
Percent of the material from the energy storage
system expected to be recyclable at the end of life.
Example: If there are four tons of lead that can be
recyclable from the original five tons installed,
then the lead “recyclability” would be 80% =
(4/5*100).
Other N/A List and describe any other EH&S issues.
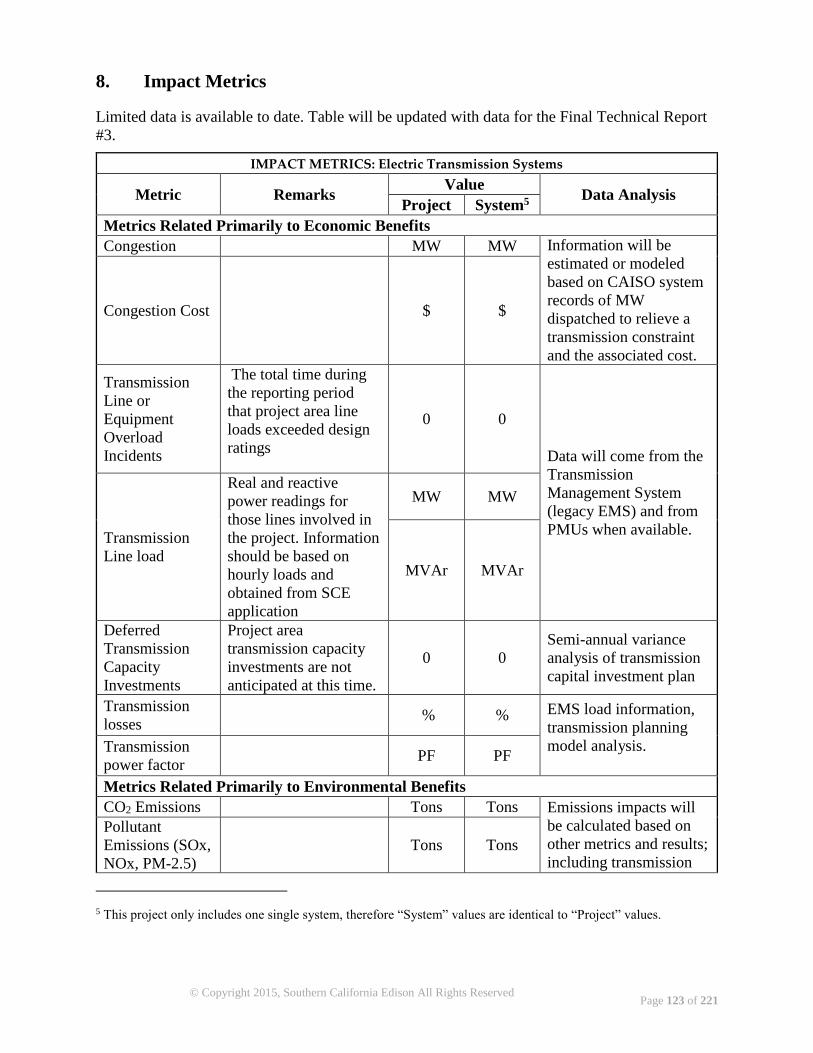
Page 123 of 221
© Copyright 2015, Southern California Edison All Rights Reserved
8. Impact Metrics
Limited data is available to date. Table will be updated with data for the Final Technical Report
#3.
IMPACT METRICS: Electric Transmission Systems
Metric Remarks Value
Data Analysis Project System5
Metrics Related Primarily to Economic Benefits
Congestion MW MW Information will be
estimated or modeled
based on CAISO system
records of MW
dispatched to relieve a
transmission constraint
and the associated cost.
Congestion Cost $ $
Transmission
Line or
Equipment
Overload
Incidents
The total time during
the reporting period
that project area line
loads exceeded design
ratings
0 0
Data will come from the
Transmission
Management System
(legacy EMS) and from
PMUs when available. Transmission
Line load
Real and reactive
power readings for
those lines involved in
the project. Information
should be based on
hourly loads and
obtained from SCE
application
MW MW
MVAr MVAr
Deferred
Transmission
Capacity
Investments
Project area
transmission capacity
investments are not
anticipated at this time.
0 0
Semi-annual variance
analysis of transmission
capital investment plan
Transmission
losses % % EMS load information,
transmission planning
model analysis. Transmission
power factor PF PF
Metrics Related Primarily to Environmental Benefits
CO2 Emissions Tons Tons Emissions impacts will
be calculated based on
other metrics and results;
including transmission
Pollutant
Emissions (SOx,
NOx, PM-2.5)
Tons Tons
5 This project only includes one single system, therefore “System” values are identical to “Project” values.
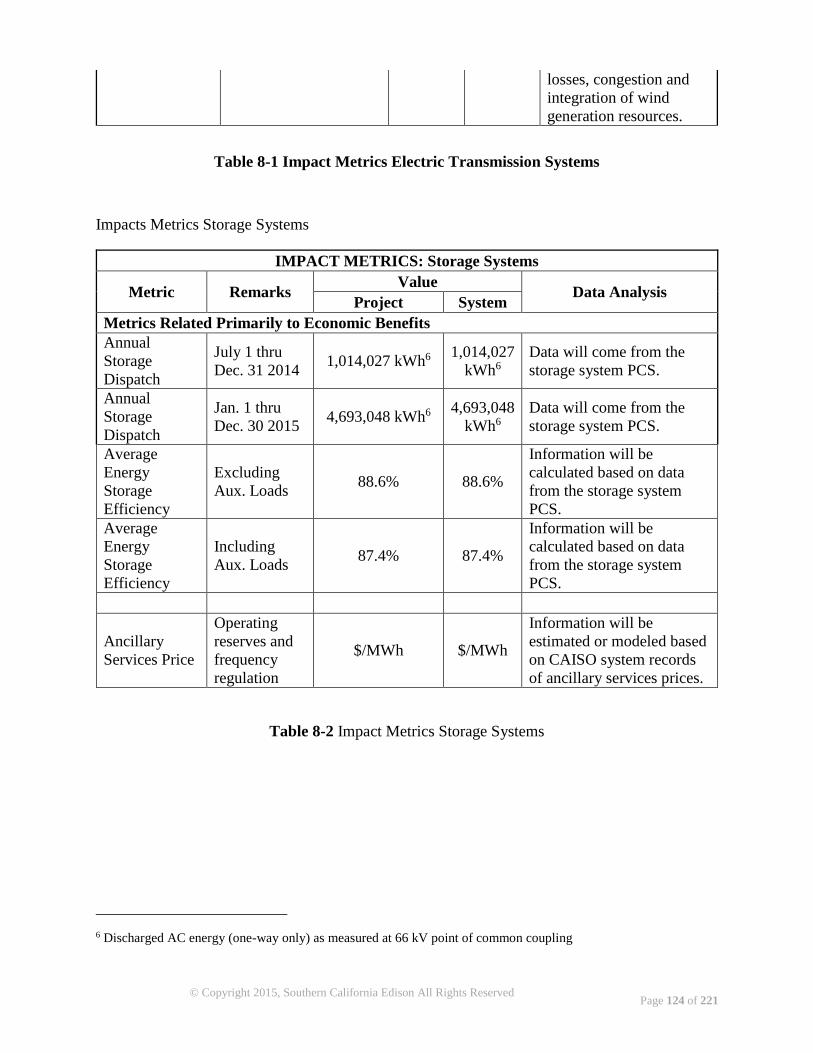
Page 124 of 221
© Copyright 2015, Southern California Edison All Rights Reserved
losses, congestion and
integration of wind
generation resources.
Table 8-1 Impact Metrics Electric Transmission Systems
Impacts Metrics Storage Systems
IMPACT METRICS: Storage Systems
Metric Remarks Value
Data Analysis Project System
Metrics Related Primarily to Economic Benefits
Annual
Storage
Dispatch
July 1 thru
Dec. 31 2014 1,014,027 kWh6
1,014,027
kWh6
Data will come from the
storage system PCS.
Annual
Storage
Dispatch
Jan. 1 thru
Dec. 30 2015 4,693,048 kWh6
4,693,048
kWh6
Data will come from the
storage system PCS.
Average
Energy
Storage
Efficiency
Excluding
Aux. Loads 88.6% 88.6%
Information will be
calculated based on data
from the storage system
PCS.
Average
Energy
Storage
Efficiency
Including
Aux. Loads 87.4% 87.4%
Information will be
calculated based on data
from the storage system
PCS.
Ancillary
Services Price
Operating
reserves and
frequency
regulation
$/MWh $/MWh
Information will be
estimated or modeled based
on CAISO system records
of ancillary services prices.
Table 8-2 Impact Metrics Storage Systems
6 Discharged AC energy (one-way only) as measured at 66 kV point of common coupling
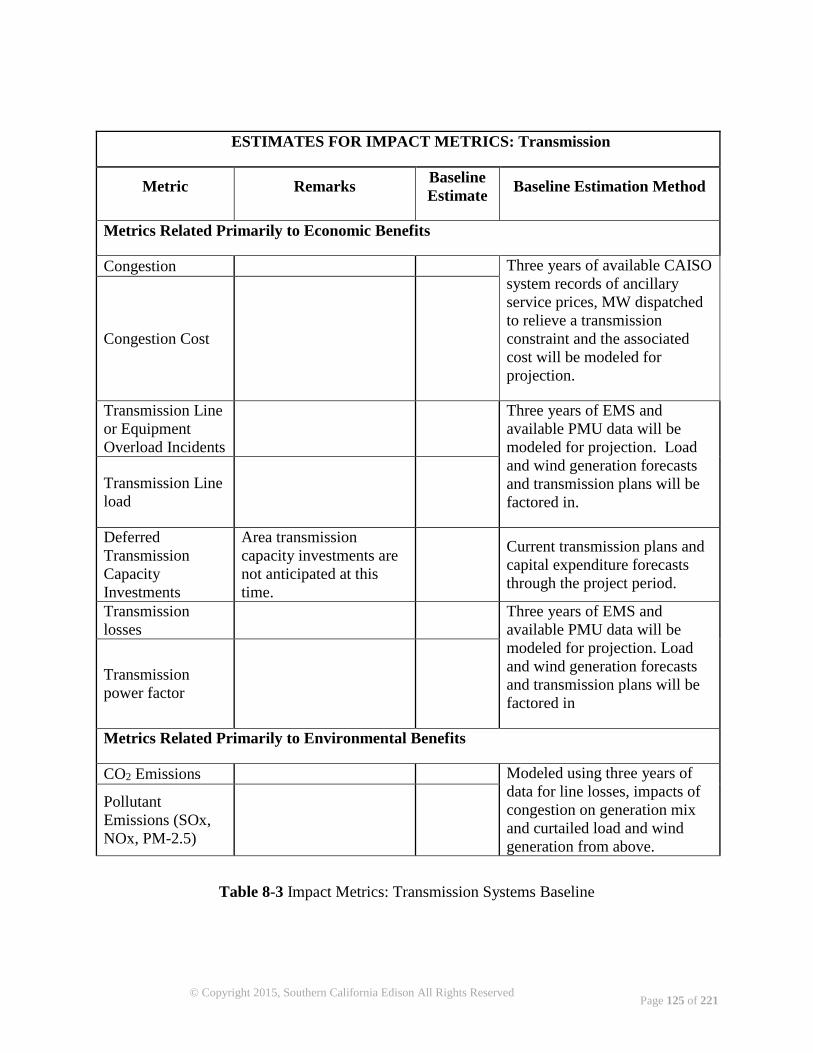
Page 125 of 221
© Copyright 2015, Southern California Edison All Rights Reserved
BASELINE ESTIMATES FOR IMPACT METRICS: Transmission Systems
Metric Remarks Baseline
Estimate Baseline Estimation Method
Metrics Related Primarily to Economic Benefits
Congestion Three years of available CAISO
system records of ancillary
service prices, MW dispatched
to relieve a transmission
constraint and the associated
cost will be modeled for
projection.
Congestion Cost
Transmission Line
or Equipment
Overload Incidents
Three years of EMS and
available PMU data will be
modeled for projection. Load
and wind generation forecasts
and transmission plans will be
factored in.
Transmission Line
load
Deferred
Transmission
Capacity
Investments
Area transmission
capacity investments are
not anticipated at this
time.
Current transmission plans and
capital expenditure forecasts
through the project period.
Transmission
losses
Three years of EMS and
available PMU data will be
modeled for projection. Load
and wind generation forecasts
and transmission plans will be
factored in
Transmission
power factor
Metrics Related Primarily to Environmental Benefits
CO2 Emissions Modeled using three years of
data for line losses, impacts of
congestion on generation mix
and curtailed load and wind
generation from above.
Pollutant
Emissions (SOx,
NOx, PM-2.5)
Table 8-3 Impact Metrics: Transmission Systems Baseline
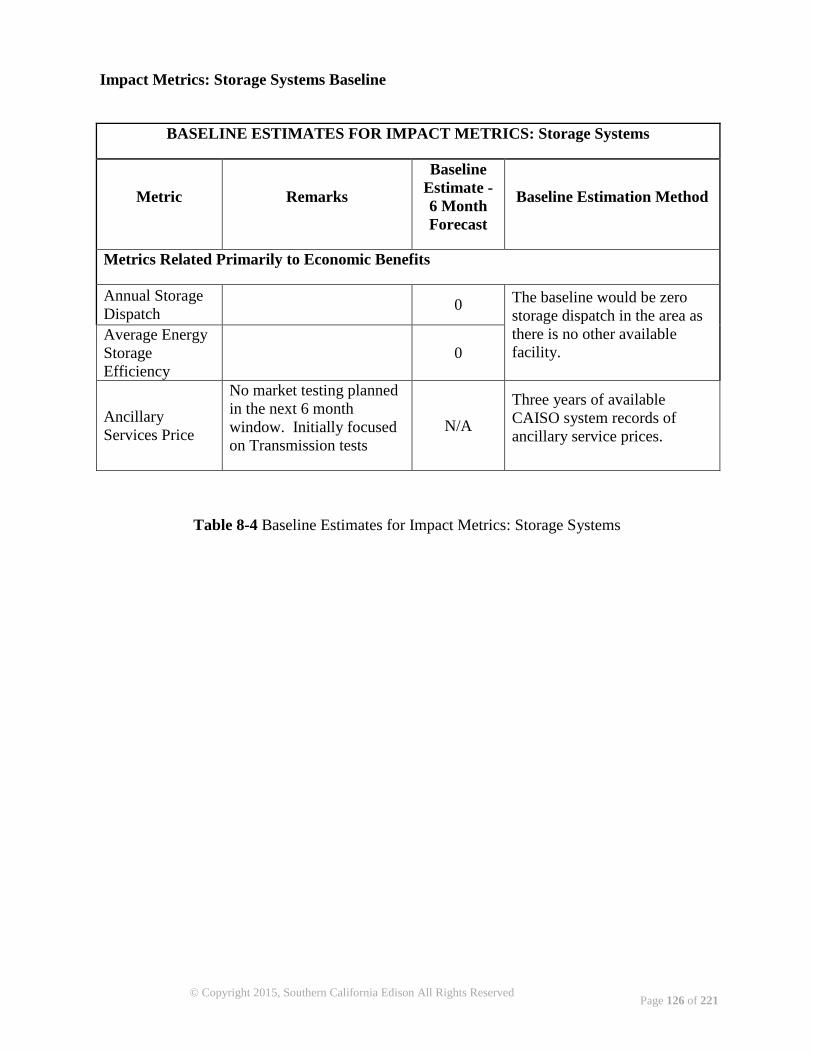
Page 126 of 221
© Copyright 2015, Southern California Edison All Rights Reserved
Impact Metrics: Storage Systems Baseline
BASELINE ESTIMATES FOR IMPACT METRICS: Storage Systems
Metric Remarks
Baseline
Estimate -
6 Month
Forecast
Baseline Estimation Method
Metrics Related Primarily to Economic Benefits
Annual Storage
Dispatch
0 The baseline would be zero
storage dispatch in the area as
there is no other available
facility. Average Energy
Storage
Efficiency
0
Ancillary
Services Price
No market testing planned
in the next 6 month
window. Initially focused
on Transmission tests
N/A
Three years of available
CAISO system records of
ancillary service prices.
Table 8-4 Baseline Estimates for Impact Metrics: Storage Systems

Page 127 of 221
© Copyright 2015, Southern California Edison All Rights Reserved
9. Appendices
9.1 Appendix A: Detailed Test Plans
9.1.1 Test 1 Provide Steady State Voltage Regulation At The Local Monolith 66 kV Bus
Overview:
This test will examine the BESS’ ability, in a reactive power control mode, to respond with ±4
MVAr of nominal capability to maintain AC voltage on the 66 kV Monolith substation bus within
steady-state (± 5%) range. This test aims to demonstrate the BESS’ ability to control voltage as a
dedicated voltage compensator.
Primary Method of Performing Tests:
According to the previously conducted PSS/E simulations, the system in the Tehachapi area
already has good voltage support. In order to demonstrate the capability of BESS providing voltage
regulation support, the BESS’ voltage set point will be carefully selected so that voltage regulation
activities, either reactive power injection or absorption, will more likely be triggered. With a proper
voltage set point, this test can be applied at any time.
The BESS Site Energy Controller (SEC) regulates voltage to within +/-5%7 of the set point. The
+/- 5% dead-band will be adjustable in an upcoming software revision. If the voltage set point is
66 kV, then BESS voltage support capability will be in effect only when the Monolith bus voltage
falls outside of 66 kV ±5% (i.e., [62.7 kV, 69.3 kV]), which may be a less likely event in the
current system. However, if the voltage set point is 62.86 kV, then BESS voltage support capability
will be in effect when the Monolith bus voltage is higher than 66 kV (set point voltage +5%),
which is more likely to happen. In the first phase of the test, a sweeping test is proposed to evaluate
BESS’ voltage sensitivity in current system and to identify the best selection for voltage set point.
The series of voltage set points to be tested are shown in Table 9-1.
Voltage Set Point - 5% Voltage Set Point Voltage Set Point + 5%
59.72 kV 62.86 kV 66.00 kV
60.29 kV 63.46 kV 66.63 kV
60.88 kV 64.08 kV 67.28 kV
61.47 kV 64.71 kV 67.95 kV
62.08 kV 65.35 kV 68.62 kV
7 ABB, “Tehachapi Wind Energy Storage Project Control and Interface Concept”
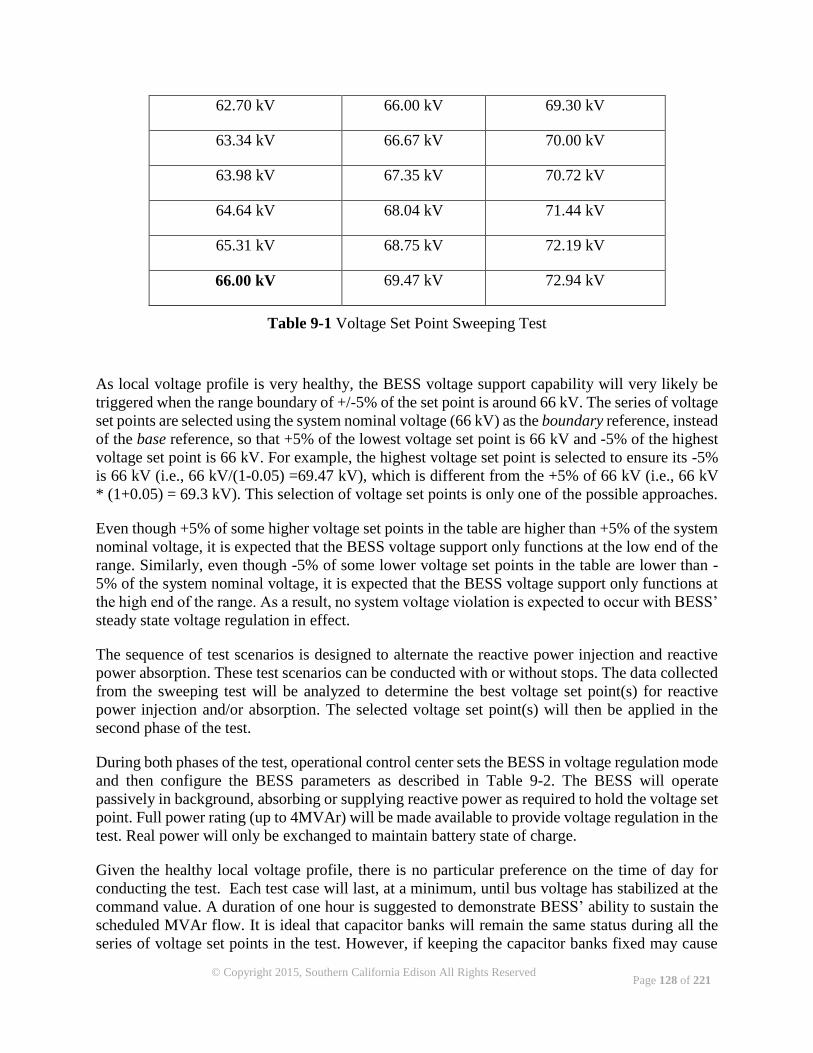
Page 128 of 221
© Copyright 2015, Southern California Edison All Rights Reserved
62.70 kV 66.00 kV 69.30 kV
63.34 kV 66.67 kV 70.00 kV
63.98 kV 67.35 kV 70.72 kV
64.64 kV 68.04 kV 71.44 kV
65.31 kV 68.75 kV 72.19 kV
66.00 kV 69.47 kV 72.94 kV
Table 9-1 Voltage Set Point Sweeping Test
As local voltage profile is very healthy, the BESS voltage support capability will very likely be
triggered when the range boundary of +/-5% of the set point is around 66 kV. The series of voltage
set points are selected using the system nominal voltage (66 kV) as the boundary reference, instead
of the base reference, so that +5% of the lowest voltage set point is 66 kV and -5% of the highest
voltage set point is 66 kV. For example, the highest voltage set point is selected to ensure its -5%
is 66 kV (i.e., 66 kV/(1-0.05) =69.47 kV), which is different from the +5% of 66 kV (i.e., 66 kV
* (1+0.05) = 69.3 kV). This selection of voltage set points is only one of the possible approaches.
Even though +5% of some higher voltage set points in the table are higher than +5% of the system
nominal voltage, it is expected that the BESS voltage support only functions at the low end of the
range. Similarly, even though -5% of some lower voltage set points in the table are lower than -
5% of the system nominal voltage, it is expected that the BESS voltage support only functions at
the high end of the range. As a result, no system voltage violation is expected to occur with BESS’
steady state voltage regulation in effect.
The sequence of test scenarios is designed to alternate the reactive power injection and reactive
power absorption. These test scenarios can be conducted with or without stops. The data collected
from the sweeping test will be analyzed to determine the best voltage set point(s) for reactive
power injection and/or absorption. The selected voltage set point(s) will then be applied in the
second phase of the test.
During both phases of the test, operational control center sets the BESS in voltage regulation mode
and then configure the BESS parameters as described in Table 9-2. The BESS will operate
passively in background, absorbing or supplying reactive power as required to hold the voltage set
point. Full power rating (up to 4MVAr) will be made available to provide voltage regulation in the
test. Real power will only be exchanged to maintain battery state of charge.
Given the healthy local voltage profile, there is no particular preference on the time of day for
conducting the test. Each test case will last, at a minimum, until bus voltage has stabilized at the
command value. A duration of one hour is suggested to demonstrate BESS’ ability to sustain the
scheduled MVAr flow. It is ideal that capacitor banks will remain the same status during all the
series of voltage set points in the test. However, if keeping the capacitor banks fixed may cause

Page 129 of 221
© Copyright 2015, Southern California Edison All Rights Reserved
potential adverse impact to the system, the status of capacitor banks will remain the same during
the test for the same voltage set point.
Data to be collected:
Voltage profile at 66 kV Monolith substation bus
Monolith substation capacitor bank status
BESS parameters
o Status
o Voltage Set Point
o State of Charge (%)8
o Charge/Discharge rate (MW/MVAr)
Step
#
Who Does It? Action Additional Notes
Which
participant,
either primary
or secondary is
responsible for
the activity in
this step?
Describe the actions that take place
in this step in active, present tense.
Additional description of
statement about the step to
help support description.
Comments about data
collection requirements,
special equipment features,
unusual challenges, etc.
1 SCE EMS Place BESS in Voltage Regulation
mode (Test 1).
2 Advanced
Energy Storage
In BESS Human Machine Interface
(HMI):
Set the “Maintain SOC
Allowed for T1&T4” as
ON.
The BESS will begin the test at
approximately 50% SOC.
Currently, the system dead-
band for V Control is fixed at
+/- 2.5% of the set-point; and
the ramp rate is 100 kVAr/s.
Both settings will be variable
in the future (e.g., 0.5-5% for
dead-band, 4–4000 kVAr/s for
ramp rate).
3 Advanced
Energy Storage
Set the “V Control Set Point” at 66
kV in BESS HMI
4 Grid Operations Operate BESS in the configured
mode for an hour
8 State of Charge (SOC) information is mainly for the reference during data analysis. For example, if the collected
test data shows the BESS charge/discharge rate change at certain time, this SOC information can help capture if the
change is because the BESS is close to be fully charged/discharged or due to other reasons. This information can
further help determine necessary data exclusion for analysis.

Page 130 of 221
© Copyright 2015, Southern California Edison All Rights Reserved
5 Advanced
Energy Storage
Set the “V Control Set Point” at
65.35 kV in BESS HMI
65.35 kV + 1% ≈ 66 kV
65.35 kV ±5% ≈ [62.08
kV,68.62 kV]
6 Grid
Operations
Operate BESS in the configured
mode for an hour
7 Advanced
Energy Storage
Set the “V Control Set Point” at
66.67 kV in BESS HMI
66.67 kV - 1% ≈ 66 kV
66.67 kV ±5% ≈ [63.34
kV,70.00 kV]
8 Grid
Operations
Operate BESS in the configured
mode for an hour
9 Advanced
Energy Storage
Set the “V Control Set Point” at
64.71 kV in BESS HMI
64.71 kV + 2% ≈ 66 kV
64.71 kV ±5% ≈ [61.47
kV,67.95 kV]
10 Grid
Operations
Operate BESS in the configured
mode for an hour
11 Advanced
Energy Storage
Set the “V Control Set Point” at
67.35 kV in BESS HMI
67.35 kV - 2% ≈ 66 kV
67.35 kV ±5% ≈ [63.98
kV,70.72 kV]
12 Grid
Operations
Operate BESS in the configured
mode for an hour
13 Advanced
Energy Storage
Set the “V Control Set Point” at
64.08 kV in BESS HMI
64.08 kV + 3% ≈ 66 kV
64.08 kV ±5% ≈ [60.88
kV,67.28 kV]
14 Grid
Operations
Operate BESS in the configured
mode for an hour
15 Advanced
Energy Storage
Set the “V Control Set Point” at
68.04 kV in BESS HMI
68.04 kV - 3% ≈ 66 kV
68.04 kV ±5% ≈ [64.64
kV,71.44 kV]
16 Grid
Operations
Operate BESS in the configured
mode for an hour
17 Advanced
Energy Storage
Set the “V Control Set Point” at
63.46 kV in BESS HMI
63.46 kV + 4% ≈ 66 kV
63.46 kV ±5% ≈ [60.29
kV,66.63 kV]
18 Grid
Operations
Operate BESS in the configured
mode for an hour
19 Advanced
Energy Storage
Set the “V Control Set Point” at
68.75 kV in BESS HMI
68.75 kV - 4% ≈ 66 kV
68.75 kV ±5% ≈ [65.31
kV,72.19 kV]
20 Grid
Operations
Operate BESS in the configured
mode for an hour
21 Advanced
Energy Storage
Set the “V Control Set Point” at
62.86 kV in BESS HMI
62.86 kV + 5% ≈ 66 kV
62.86 kV ±5% ≈ [59.72
kV,66.00 kV]
22 Grid
Operations
Operate BESS in the configured
mode for an hour
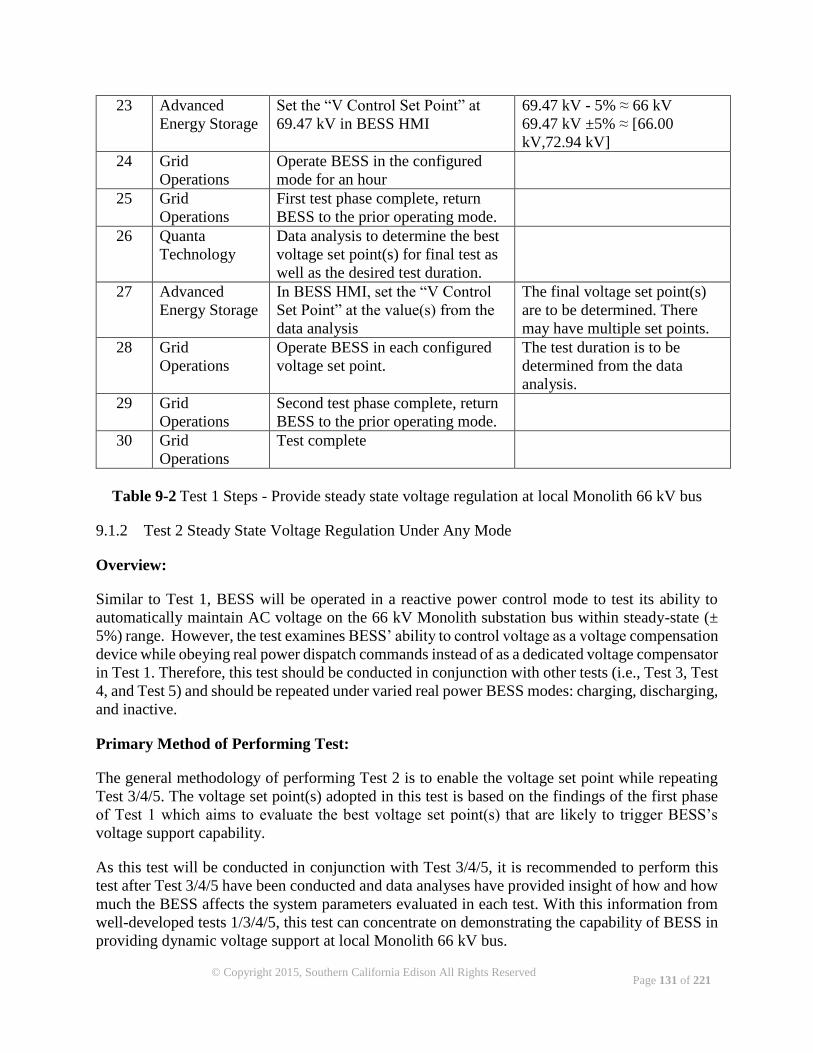
Page 131 of 221
© Copyright 2015, Southern California Edison All Rights Reserved
23 Advanced
Energy Storage
Set the “V Control Set Point” at
69.47 kV in BESS HMI
69.47 kV - 5% ≈ 66 kV
69.47 kV ±5% ≈ [66.00
kV,72.94 kV]
24 Grid
Operations
Operate BESS in the configured
mode for an hour
25 Grid
Operations
First test phase complete, return
BESS to the prior operating mode.
26 Quanta
Technology
Data analysis to determine the best
voltage set point(s) for final test as
well as the desired test duration.
27 Advanced
Energy Storage
In BESS HMI, set the “V Control
Set Point” at the value(s) from the
data analysis
The final voltage set point(s)
are to be determined. There
may have multiple set points.
28 Grid
Operations
Operate BESS in each configured
voltage set point.
The test duration is to be
determined from the data
analysis.
29 Grid
Operations
Second test phase complete, return
BESS to the prior operating mode.
30 Grid
Operations
Test complete
Table 9-2 Test 1 Steps - Provide steady state voltage regulation at local Monolith 66 kV bus
9.1.2 Test 2 Steady State Voltage Regulation Under Any Mode
Overview:
Similar to Test 1, BESS will be operated in a reactive power control mode to test its ability to
automatically maintain AC voltage on the 66 kV Monolith substation bus within steady-state (±
5%) range. However, the test examines BESS’ ability to control voltage as a voltage compensation
device while obeying real power dispatch commands instead of as a dedicated voltage compensator
in Test 1. Therefore, this test should be conducted in conjunction with other tests (i.e., Test 3, Test
4, and Test 5) and should be repeated under varied real power BESS modes: charging, discharging,
and inactive.
Primary Method of Performing Test:
The general methodology of performing Test 2 is to enable the voltage set point while repeating
Test 3/4/5. The voltage set point(s) adopted in this test is based on the findings of the first phase
of Test 1 which aims to evaluate the best voltage set point(s) that are likely to trigger BESS’s
voltage support capability.
As this test will be conducted in conjunction with Test 3/4/5, it is recommended to perform this
test after Test 3/4/5 have been conducted and data analyses have provided insight of how and how
much the BESS affects the system parameters evaluated in each test. With this information from
well-developed tests 1/3/4/5, this test can concentrate on demonstrating the capability of BESS in
providing dynamic voltage support at local Monolith 66 kV bus.
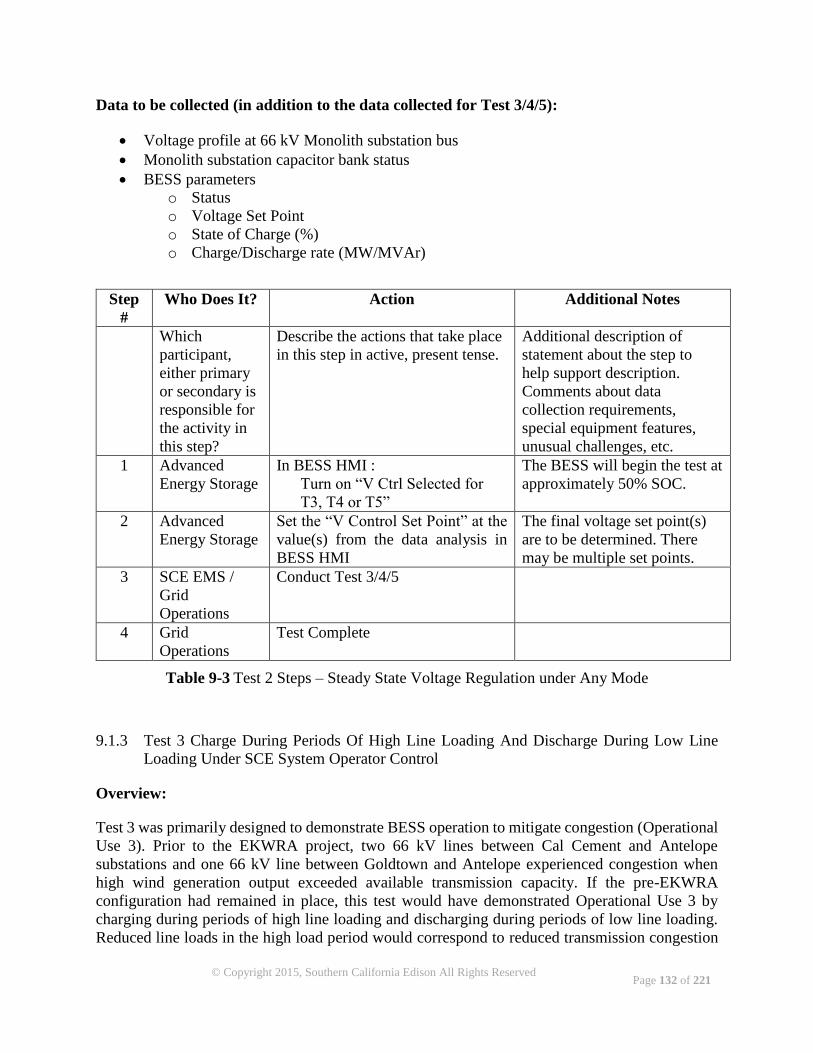
Page 132 of 221
© Copyright 2015, Southern California Edison All Rights Reserved
Data to be collected (in addition to the data collected for Test 3/4/5):
Voltage profile at 66 kV Monolith substation bus
Monolith substation capacitor bank status
BESS parameters
o Status
o Voltage Set Point
o State of Charge (%)
o Charge/Discharge rate (MW/MVAr)
Step
#
Who Does It? Action Additional Notes
Which
participant,
either primary
or secondary is
responsible for
the activity in
this step?
Describe the actions that take place
in this step in active, present tense.
Additional description of
statement about the step to
help support description.
Comments about data
collection requirements,
special equipment features,
unusual challenges, etc.
1 Advanced
Energy Storage
In BESS HMI :
Turn on “V Ctrl Selected for
T3, T4 or T5”
The BESS will begin the test at
approximately 50% SOC.
2 Advanced
Energy Storage
Set the “V Control Set Point” at the
value(s) from the data analysis in
BESS HMI
The final voltage set point(s)
are to be determined. There
may be multiple set points.
3 SCE EMS /
Grid
Operations
Conduct Test 3/4/5
4 Grid
Operations
Test Complete
Table 9-3 Test 2 Steps – Steady State Voltage Regulation under Any Mode
9.1.3 Test 3 Charge During Periods Of High Line Loading And Discharge During Low Line
Loading Under SCE System Operator Control
Overview:
Test 3 was primarily designed to demonstrate BESS operation to mitigate congestion (Operational
Use 3). Prior to the EKWRA project, two 66 kV lines between Cal Cement and Antelope
substations and one 66 kV line between Goldtown and Antelope experienced congestion when
high wind generation output exceeded available transmission capacity. If the pre-EKWRA
configuration had remained in place, this test would have demonstrated Operational Use 3 by
charging during periods of high line loading and discharging during periods of low line loading.
Reduced line loads in the high load period would correspond to reduced transmission congestion
Page 133 of 221
© Copyright 2015, Southern California Edison All Rights Reserved
while also reducing curtailment of wind generation requiring compensation. Reduction in line
loading will also reduce transmission losses (Operational Use 2).
The economic benefit would be determined by estimating the value of wind generation that did
not have to be curtailed. Over time, wind generation curtailments would justify investment in
additional transmission facilities (Operational Use 5). BESS can be operated to delay delivery of
peaks of renewable output, holding delivery to a level which requires a smaller transmission
investment (Operational Use 6). In addition to monetary savings, emissions will be reduced by the
amount of extra wind generation output made available for use and by the reduction of out-of-
merit generation required for congestion relief.
The EKWRA reconfiguration has essentially eliminated congestion in the Tehachapi area, so
BESS can be operated to demonstrate that it can reduce line flows between Monolith and major
load centers and/or wind generations. The reduction in line flows can be used to estimate reduction
in line losses.
In some instances it may be possible to operate BESS in such a way as to avoid or reduce automatic
load shedding during extreme contingencies (Operational Use 4). Automatic load shedding occurs
when an isolated portion of an interconnected system, typically by multiple transmission outages,
has an excess of load over generation, which causes kinetic energy to be pulled out of the rotating
electrical machines, slowing their speed of rotation and causing frequency to decline. Discharging
BESS can reduce the amount of energy withdrawn from the rotating machines, slow the rate of
frequency decline and hopefully, allow frequency to stabilize at a higher level, with less dropping
of load. Demonstrating the rapid ramping capabilities of BESS will verify the feasibility of it being
used to avoid load shedding or generator tripping when system disturbances perturb frequency
from the nominal 60 Hz level. However, the Tehachapi area has an excess of installed generation
over load, so very few credible contingencies will result in an “island” with an excess of load over
generation and cause under-frequency load shedding.
Primary Method of Performing Test:
This test can be applied at any line loading level. To be beneficial, the wind generation upstream
of Monolith will be sufficiently above the 8 MW capability of the BESS so the resulting load is
still positive, otherwise the BESS charging rate will be reduced from its maximum rate. SCE
anticipates that at low loading levels it will achieve no more reduction in line flows, and possibly
less if the flow actually reverses during the charging cycle.
The BESS SEC utilizes an algorithm9 to compare the line loading of two selected transmission
lines with the pre-defined range and then dispatch BESS to inject or absorb real power accordingly.
The two selected transmission lines that carry the wind power to Windhub through Monolith
substation are
Monolith –TAP88-Windhub 66 kV line
Monolith –TAP78- TAP79-Windhub 66 kV line
9 ABB, “Tehachapi Wind Energy Storage Project Control and Interface Concept”
Page 134 of 221
© Copyright 2015, Southern California Edison All Rights Reserved
Given the system configuration change due to EKWRA project, it is recommended to conduct an
initial test and examine the collected data for parameter tuning. During the initial test, the BESS
is set in Test 3 mode and then Advanced Energy Storage personnel configure the BESS parameters
as described in Table 9-4. The parameter configuration is designed to enable the BESS dispatch
(both charge and discharge) occur frequently during the initial test phase. Even though the selected
lines have limited seasonal variations in loading, the best month for conducting the initial test is
October when the line loading fluctuation is good for triggering BESS dispatch.
The initial test with BESS dispatched in its maximum rate will last a week. Another week of
monitoring without the BESS in place is required to collect baseline measurement. The purpose of
conducting tests on alternative weeks is to maximize the possibility of pairing similar scenarios
with or without BESS in service.
Data analyses will be conducted to evaluate the necessity to change the lines to be monitored or to
lower the BESS charge/discharge rate given the combination of the cycle of load condition, the
variation of wind generation during the test period.
One aspect of the test is to demonstrate BESS’ rapid ramping capabilities to avoid load shedding
or generator tripping when system disturbances perturb frequency from the nominal 60 Hz level.
Given the excess of installed generation over load in the Tehachapi area, the under-frequency load
shedding event is unlikely to occur. As an alternative, the test will monitor the frequency variation
to assess the potential of BESS to avoid load shedding when in an excess of load over generation
scenario.
During the test, the maximum BESS ramping rate is configured. During the data analysis, various
BESS scenarios that are similar to being dispatched to arrest frequency decline and prevent load
shedding will be examined: from neutral to maximum discharge and from charge to maximum
discharge.
Data to be collected:
Transmission loads on the following 66 kV lines.
o Monolith – Breeze lines 1 & 2
o Monolith – Cummings line
o Monolith – Loraine line
o Monolith – Cal Cement line
o Monolith – MidWind line
o Monolith – ArbWind line
Frequency at Monolith substation (PMU data)
Monolith transformer 1 and 2 load
Tehachapi wind generation profile for each wind plant (MW/MVAr)
Storage dispatch event with its timing
BESS parameters
o Status
o State of Charge (%)
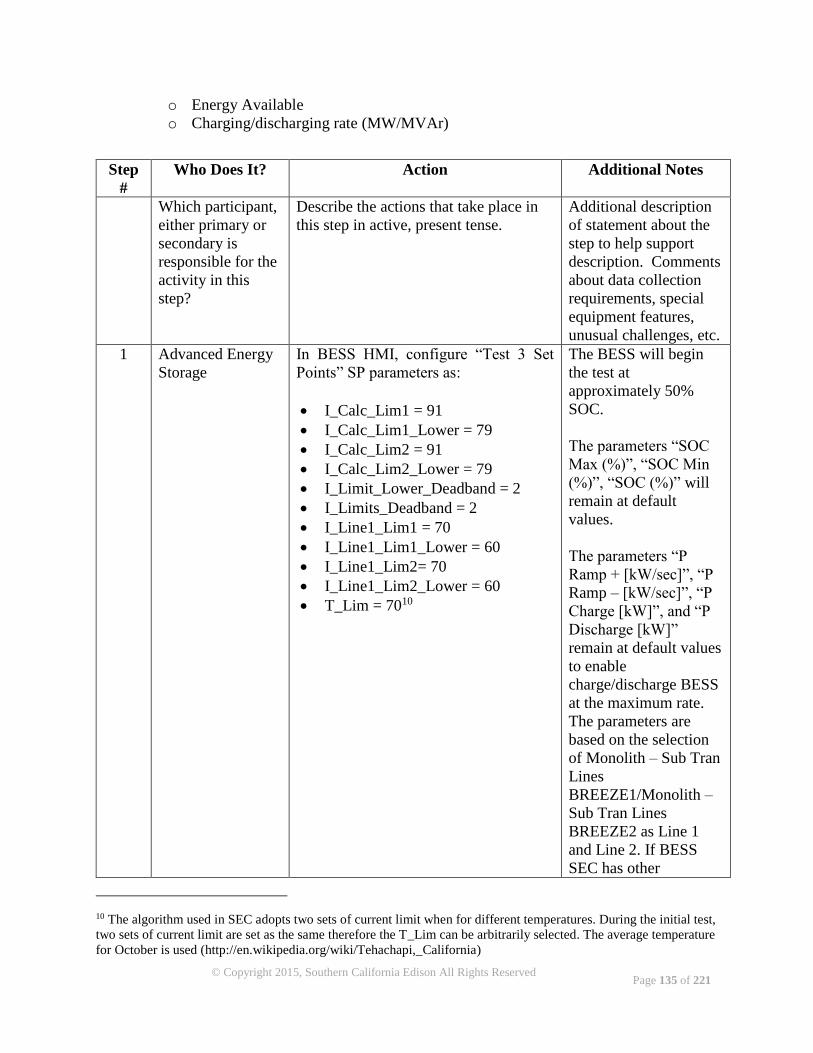
Page 135 of 221
© Copyright 2015, Southern California Edison All Rights Reserved
o Energy Available
o Charging/discharging rate (MW/MVAr)
Step
#
Who Does It? Action Additional Notes
Which participant,
either primary or
secondary is
responsible for the
activity in this
step?
Describe the actions that take place in
this step in active, present tense.
Additional description
of statement about the
step to help support
description. Comments
about data collection
requirements, special
equipment features,
unusual challenges, etc.
1 Advanced Energy
Storage
In BESS HMI, configure “Test 3 Set
Points” SP parameters as:
I_Calc_Lim1 = 91
I_Calc_Lim1_Lower = 79
I_Calc_Lim2 = 91
I_Calc_Lim2_Lower = 79
I_Limit_Lower_Deadband = 2
I_Limits_Deadband = 2
I_Line1_Lim1 = 70
I_Line1_Lim1_Lower = 60
I_Line1_Lim2= 70
I_Line1_Lim2_Lower = 60
T_Lim = 7010
The BESS will begin
the test at
approximately 50%
SOC.
The parameters “SOC
Max (%)”, “SOC Min
(%)”, “SOC (%)” will
remain at default
values.
The parameters “P
Ramp + [kW/sec]”, “P
Ramp – [kW/sec]”, “P
Charge [kW]”, and “P
Discharge [kW]”
remain at default values
to enable
charge/discharge BESS
at the maximum rate.
The parameters are
based on the selection
of Monolith – Sub Tran
Lines
BREEZE1/Monolith –
Sub Tran Lines
BREEZE2 as Line 1
and Line 2. If BESS
SEC has other
10 The algorithm used in SEC adopts two sets of current limit when for different temperatures. During the initial test,
two sets of current limit are set as the same therefore the T_Lim can be arbitrarily selected. The average temperature
for October is used (http://en.wikipedia.org/wiki/Tehachapi,_California)
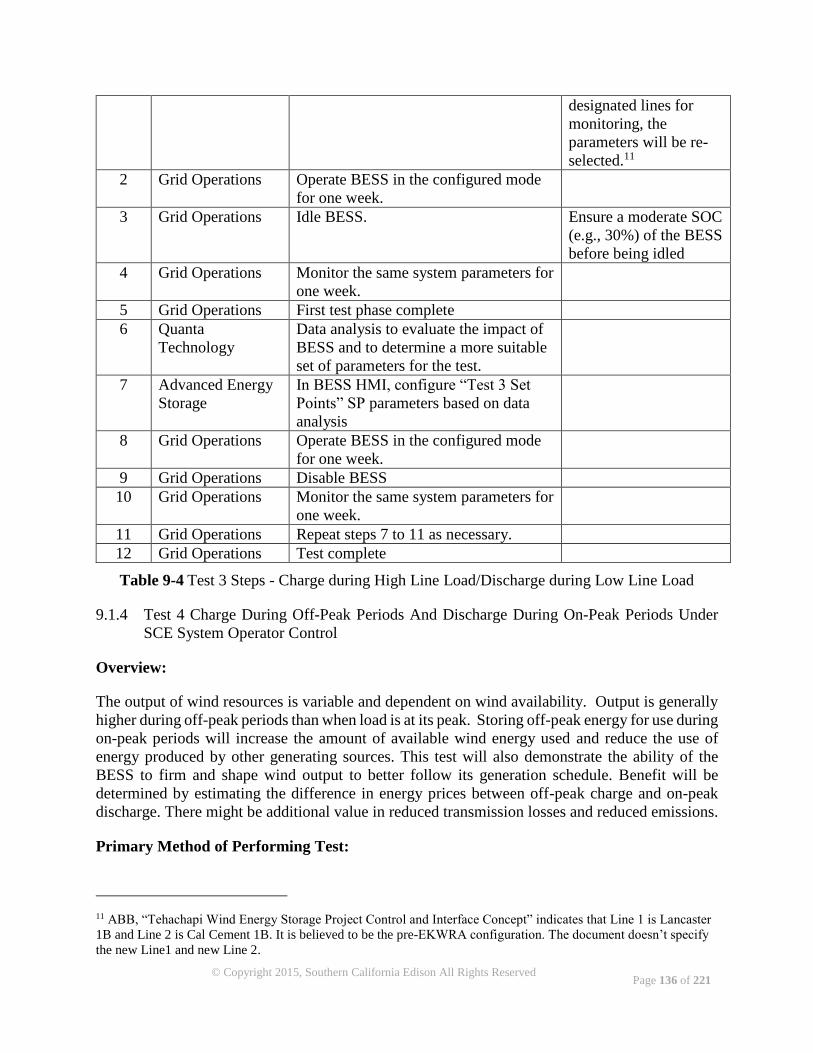
Page 136 of 221
© Copyright 2015, Southern California Edison All Rights Reserved
designated lines for
monitoring, the
parameters will be re-
selected.11
2 Grid Operations Operate BESS in the configured mode
for one week.
3 Grid Operations Idle BESS. Ensure a moderate SOC
(e.g., 30%) of the BESS
before being idled
4 Grid Operations Monitor the same system parameters for
one week.
5 Grid Operations First test phase complete
6 Quanta
Technology
Data analysis to evaluate the impact of
BESS and to determine a more suitable
set of parameters for the test.
7 Advanced Energy
Storage
In BESS HMI, configure “Test 3 Set
Points” SP parameters based on data
analysis
8 Grid Operations Operate BESS in the configured mode
for one week.
9 Grid Operations Disable BESS
10 Grid Operations Monitor the same system parameters for
one week.
11 Grid Operations Repeat steps 7 to 11 as necessary.
12 Grid Operations Test complete
Table 9-4 Test 3 Steps - Charge during High Line Load/Discharge during Low Line Load
9.1.4 Test 4 Charge During Off-Peak Periods And Discharge During On-Peak Periods Under
SCE System Operator Control
Overview:
The output of wind resources is variable and dependent on wind availability. Output is generally
higher during off-peak periods than when load is at its peak. Storing off-peak energy for use during
on-peak periods will increase the amount of available wind energy used and reduce the use of
energy produced by other generating sources. This test will also demonstrate the ability of the
BESS to firm and shape wind output to better follow its generation schedule. Benefit will be
determined by estimating the difference in energy prices between off-peak charge and on-peak
discharge. There might be additional value in reduced transmission losses and reduced emissions.
Primary Method of Performing Test:
11 ABB, “Tehachapi Wind Energy Storage Project Control and Interface Concept” indicates that Line 1 is Lancaster
1B and Line 2 is Cal Cement 1B. It is believed to be the pre-EKWRA configuration. The document doesn’t specify
the new Line1 and new Line 2.
Page 137 of 221
© Copyright 2015, Southern California Edison All Rights Reserved
The historical load data analysis, as presented in Appendix B, shows that the average load at
Monolith is typically within the 8 MW capability of the BESS. A larger load difference between
on-peak period and off-peak load can fully utilize the BESS and potentially show more of its
impact. The average load is the highest from July to September and the load difference between
on-peak period and off-peak period is the largest in July and August. In addition, the average wind
generation, as presented in Appendix A, peaks in May and June while April, July and August have
relatively large wind generation. The best time to conduct this test is from July to August when
the load variation between on-peak and off-peak periods are the largest while the wind generation
is also relatively large. September is also a good time since the load variation is relatively large.
Even though the typical average wind generation in September can be significantly smaller than
July and August, the wind output is still sufficient to supply the battery charging need during the
off-peak period.
The BESS is set Test 4 mode and then Advanced Energy Storage personnel configures the BESS
parameters and dispatch schedule as described in Table 9-5 on alternative days. The purpose of
conducting tests on alternative days is to maximize the possibility of pairing similar scenarios with
or without BESS in service, given that EKWRA project changes system configuration and
historically collected data are of limited usage for the M&V purpose. The test will last a few weeks
to ensure a sufficient amount of data to be collected for both weekdays and weekends.
As shown in the four-hour segment based load data analysis (Appendix B), the off-peak period is
between 0:00 and 4:00, while the load between 4:00 and 8:00 is also light; the on-peak period is
between 12:00 and 16:00, while the load between 16:00 and 20:00 is also heavy. On the scheduled
days when the BESS is dispatched, the BESS is charged at its maximum rate starting from 0:00
until fully charged (a six-hour period is designated as off-peak period in the test to allow for certain
variation in charging) and is discharged at its maximum rate from 12:00 until fully discharged (a
six-hour period is designated as on-peak period in the test to allow for certain variation in
discharging).
Data to be collected:
Transmission loads on the following lines.
o Monolith – Breeze lines 1 & 2
o Monolith – Cummings line
o Monolith – Loraine line
o Monolith – Cal Cement line
o Monolith – MidWind line
o Monolith – ArbWind line
Monolith transformer 1 and 2 load
Tehachapi wind generation profile for each wind plant (MW/MVAr)
Storage dispatch event with its timing
BESS parameters
o Status
o State of Charge (%)
o Energy Available
o Charge/discharge rate (MW/MVAr)
CAISO price data
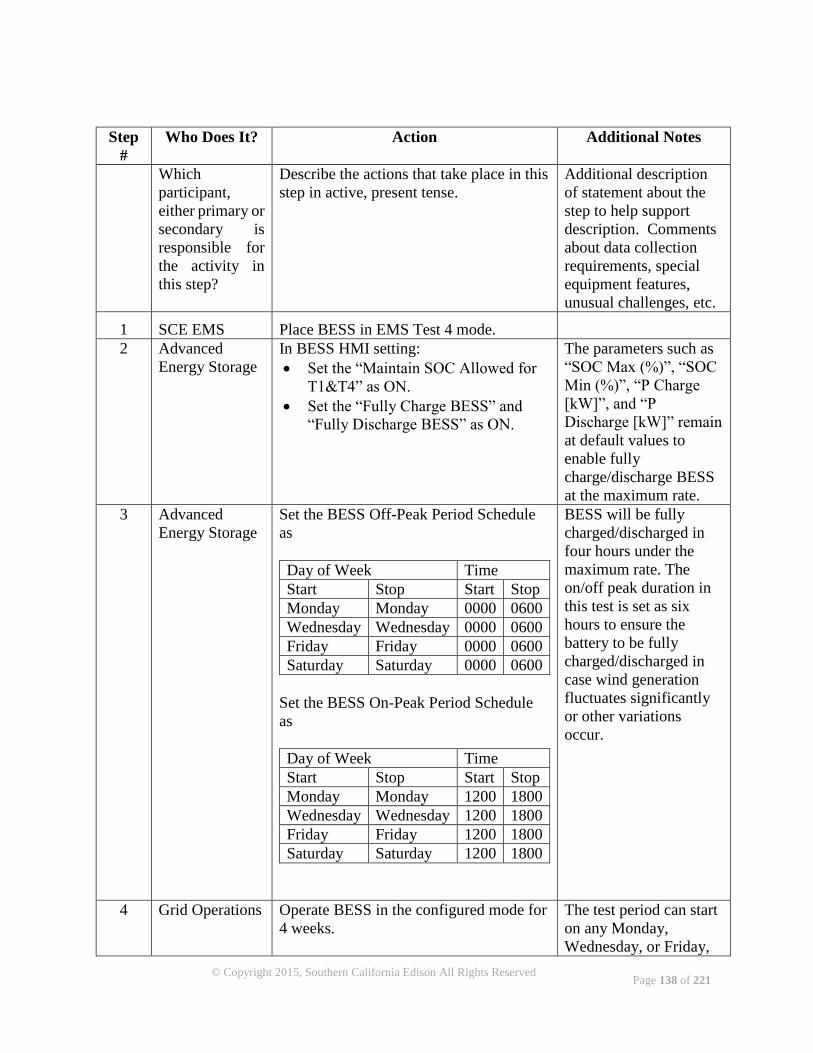
Page 138 of 221
© Copyright 2015, Southern California Edison All Rights Reserved
Step
#
Who Does It? Action Additional Notes
Which
participant,
either primary or
secondary is
responsible for
the activity in
this step?
Describe the actions that take place in this
step in active, present tense.
Additional description
of statement about the
step to help support
description. Comments
about data collection
requirements, special
equipment features,
unusual challenges, etc.
1 SCE EMS Place BESS in EMS Test 4 mode.
2 Advanced
Energy Storage
In BESS HMI setting:
Set the “Maintain SOC Allowed for
T1&T4” as ON.
Set the “Fully Charge BESS” and
“Fully Discharge BESS” as ON.
The parameters such as
“SOC Max (%)”, “SOC
Min (%)”, “P Charge
[kW]”, and “P
Discharge [kW]” remain
at default values to
enable fully
charge/discharge BESS
at the maximum rate.
3 Advanced
Energy Storage
Set the BESS Off-Peak Period Schedule
as
Day of Week Time
Start Stop Start Stop
Monday Monday 0000 0600
Wednesday Wednesday 0000 0600
Friday Friday 0000 0600
Saturday Saturday 0000 0600
Set the BESS On-Peak Period Schedule
as
Day of Week Time
Start Stop Start Stop
Monday Monday 1200 1800
Wednesday Wednesday 1200 1800
Friday Friday 1200 1800
Saturday Saturday 1200 1800
.
BESS will be fully
charged/discharged in
four hours under the
maximum rate. The
on/off peak duration in
this test is set as six
hours to ensure the
battery to be fully
charged/discharged in
case wind generation
fluctuates significantly
or other variations
occur.
4 Grid Operations Operate BESS in the configured mode for
4 weeks.
The test period can start
on any Monday,
Wednesday, or Friday,
Page 139 of 221
© Copyright 2015, Southern California Edison All Rights Reserved
but will last for a period
that contains at least 4
weekends (both
Saturday and Sunday).
5 Grid Operations Test complete
Table 9-5 Test 4 Steps – Charge Off-Peak/Discharge On-Peak
9.1.5 Test 5 Charge And Discharge Seconds-To-Minutes As Needed To Firm And Shape
Intermittent Generation In Response To A Real-Time Signal
Overview:
Intermittent resources are by their nature variable, and with their substantial growth, managing the
fluctuation will become more costly to the system. The test will demonstrate the BESS’ ability to
firm and shape the power output, respond to system signals and reduce the system requirements to
integrate variable energy resources into the grid. This can reduce required reserves and may reduce
the GHG footprint to serve load. This will also improve the utilization of available and planned
transmission and may support the deferral of transmission investment. Benefit will be determined
as the reduction in required reserves, reduction in output fluctuation, improved transmission
utilization, reduced transmission losses and possibly reduced transmission congestion.
Primary Method of Performing Test:
EMS monitors aggregated output of wind farms and compares to a pre-set target, then dispatches
BESS (charge/discharge) proportionate real power ramps in the opposite direction of wind power
change to minimize the difference and to smooth the wind generators’ output.
The wind-park generation information is captured in SCADA and mapped back as an input to the
SEC. As this test can be applied at any season, it is recommended to use the average wind speed
during previous days as the parameter P_WT_Act_Coef12 for the test periods. Depending on the
test period, this value may vary.
Once the scaling factor is determined, the BESS is set in Test 5 mode and then Advanced Energy
Storage personnel configures the BESS parameters as described in Table 9-6. The test with BESS
enabled/disabled will be conducted on alternative weeks to increase the possibility of pairing
similar scenarios with or without BESS in service.
Data to be collected for all tests:
Total wind generation profile in Tehachapi (MW/MVAr)
o P_WT_Act
Storage dispatch event with its timing
12 ABB, “Tehachapi Wind Energy Storage Project Control and Interface Concept” indicates that P_WT_Act_Coef is
one set point for test.
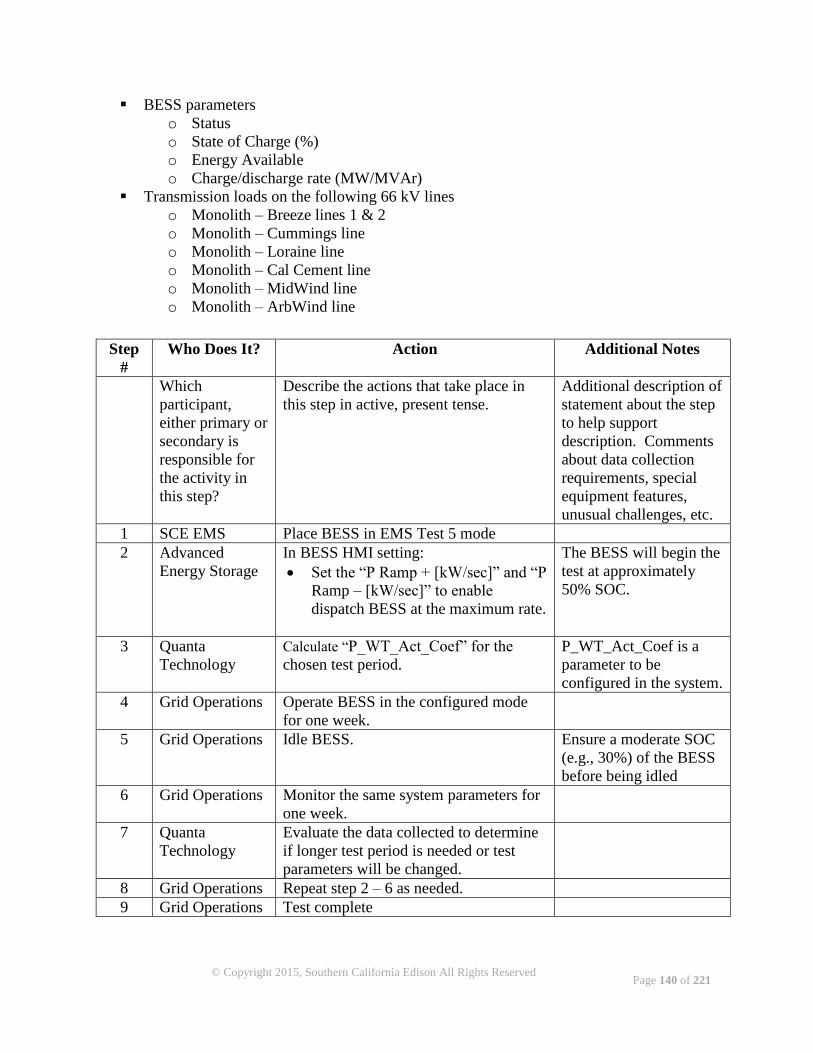
Page 140 of 221
© Copyright 2015, Southern California Edison All Rights Reserved
BESS parameters
o Status
o State of Charge (%)
o Energy Available
o Charge/discharge rate (MW/MVAr)
Transmission loads on the following 66 kV lines
o Monolith – Breeze lines 1 & 2
o Monolith – Cummings line
o Monolith – Loraine line
o Monolith – Cal Cement line
o Monolith – MidWind line
o Monolith – ArbWind line
Step
#
Who Does It? Action Additional Notes
Which
participant,
either primary or
secondary is
responsible for
the activity in
this step?
Describe the actions that take place in
this step in active, present tense.
Additional description of
statement about the step
to help support
description. Comments
about data collection
requirements, special
equipment features,
unusual challenges, etc.
1 SCE EMS Place BESS in EMS Test 5 mode
2 Advanced
Energy Storage
In BESS HMI setting:
Set the “P Ramp + [kW/sec]” and “P
Ramp – [kW/sec]” to enable
dispatch BESS at the maximum rate.
The BESS will begin the
test at approximately
50% SOC.
3 Quanta
Technology
Calculate “P_WT_Act_Coef” for the
chosen test period.
P_WT_Act_Coef is a
parameter to be
configured in the system.
4 Grid Operations Operate BESS in the configured mode
for one week.
5 Grid Operations Idle BESS. Ensure a moderate SOC
(e.g., 30%) of the BESS
before being idled
6 Grid Operations Monitor the same system parameters for
one week.
7 Quanta
Technology
Evaluate the data collected to determine
if longer test period is needed or test
parameters will be changed.
8 Grid Operations Repeat step 2 – 6 as needed.
9 Grid Operations Test complete
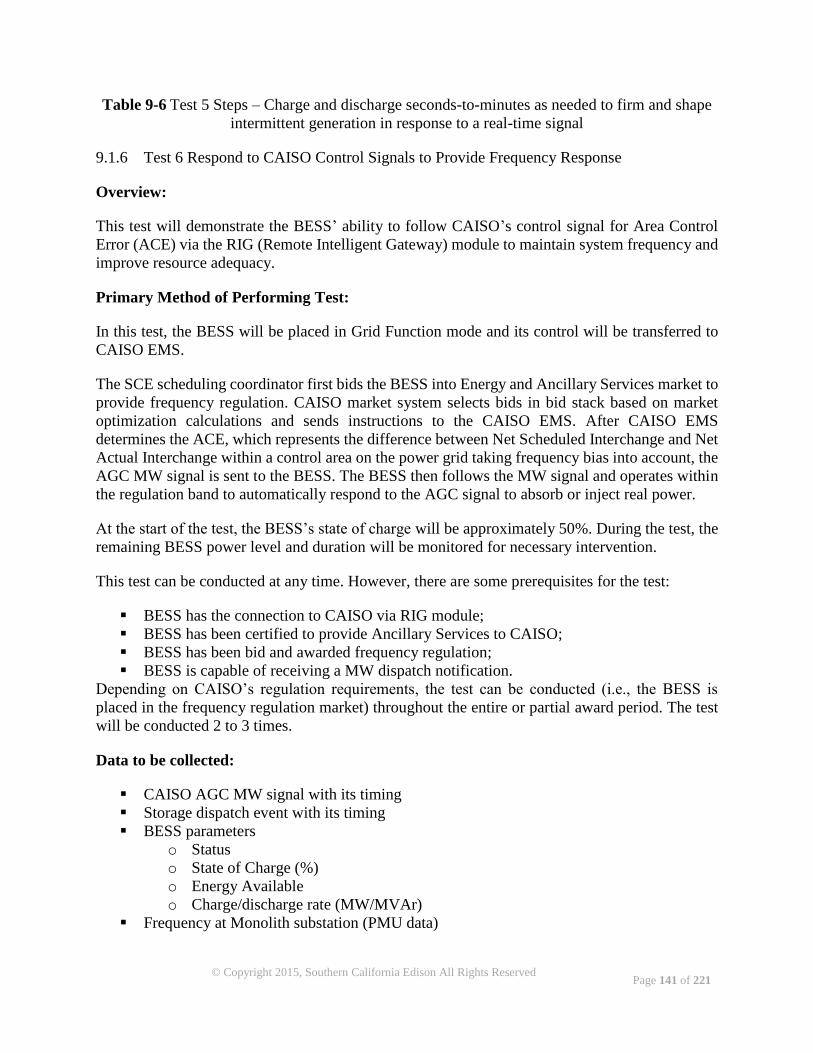
Page 141 of 221
© Copyright 2015, Southern California Edison All Rights Reserved
Table 9-6 Test 5 Steps – Charge and discharge seconds-to-minutes as needed to firm and shape
intermittent generation in response to a real-time signal
9.1.6 Test 6 Respond to CAISO Control Signals to Provide Frequency Response
Overview:
This test will demonstrate the BESS’ ability to follow CAISO’s control signal for Area Control
Error (ACE) via the RIG (Remote Intelligent Gateway) module to maintain system frequency and
improve resource adequacy.
Primary Method of Performing Test:
In this test, the BESS will be placed in Grid Function mode and its control will be transferred to
CAISO EMS.
The SCE scheduling coordinator first bids the BESS into Energy and Ancillary Services market to
provide frequency regulation. CAISO market system selects bids in bid stack based on market
optimization calculations and sends instructions to the CAISO EMS. After CAISO EMS
determines the ACE, which represents the difference between Net Scheduled Interchange and Net
Actual Interchange within a control area on the power grid taking frequency bias into account, the
AGC MW signal is sent to the BESS. The BESS then follows the MW signal and operates within
the regulation band to automatically respond to the AGC signal to absorb or inject real power.
At the start of the test, the BESS’s state of charge will be approximately 50%. During the test, the
remaining BESS power level and duration will be monitored for necessary intervention.
This test can be conducted at any time. However, there are some prerequisites for the test:
BESS has the connection to CAISO via RIG module;
BESS has been certified to provide Ancillary Services to CAISO;
BESS has been bid and awarded frequency regulation;
BESS is capable of receiving a MW dispatch notification.
Depending on CAISO’s regulation requirements, the test can be conducted (i.e., the BESS is
placed in the frequency regulation market) throughout the entire or partial award period. The test
will be conducted 2 to 3 times.
Data to be collected:
CAISO AGC MW signal with its timing
Storage dispatch event with its timing
BESS parameters
o Status
o State of Charge (%)
o Energy Available
o Charge/discharge rate (MW/MVAr)
Frequency at Monolith substation (PMU data)
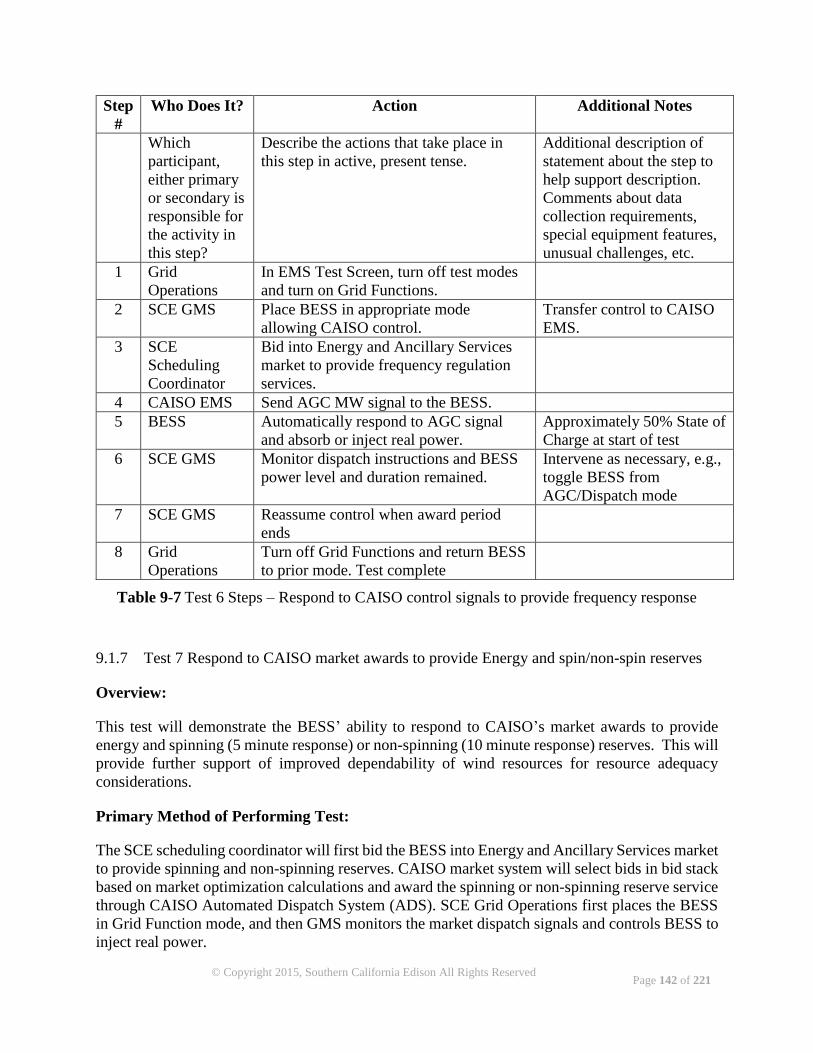
Page 142 of 221
© Copyright 2015, Southern California Edison All Rights Reserved
Step
#
Who Does It? Action Additional Notes
Which
participant,
either primary
or secondary is
responsible for
the activity in
this step?
Describe the actions that take place in
this step in active, present tense.
Additional description of
statement about the step to
help support description.
Comments about data
collection requirements,
special equipment features,
unusual challenges, etc.
1 Grid
Operations
In EMS Test Screen, turn off test modes
and turn on Grid Functions.
2 SCE GMS Place BESS in appropriate mode
allowing CAISO control.
Transfer control to CAISO
EMS.
3 SCE
Scheduling
Coordinator
Bid into Energy and Ancillary Services
market to provide frequency regulation
services.
4 CAISO EMS Send AGC MW signal to the BESS.
5 BESS Automatically respond to AGC signal
and absorb or inject real power.
Approximately 50% State of
Charge at start of test
6 SCE GMS Monitor dispatch instructions and BESS
power level and duration remained.
Intervene as necessary, e.g.,
toggle BESS from
AGC/Dispatch mode
7 SCE GMS Reassume control when award period
ends
8 Grid
Operations
Turn off Grid Functions and return BESS
to prior mode. Test complete
Table 9-7 Test 6 Steps – Respond to CAISO control signals to provide frequency response
9.1.7 Test 7 Respond to CAISO market awards to provide Energy and spin/non-spin reserves
Overview:
This test will demonstrate the BESS’ ability to respond to CAISO’s market awards to provide
energy and spinning (5 minute response) or non-spinning (10 minute response) reserves. This will
provide further support of improved dependability of wind resources for resource adequacy
considerations.
Primary Method of Performing Test:
The SCE scheduling coordinator will first bid the BESS into Energy and Ancillary Services market
to provide spinning and non-spinning reserves. CAISO market system will select bids in bid stack
based on market optimization calculations and award the spinning or non-spinning reserve service
through CAISO Automated Dispatch System (ADS). SCE Grid Operations first places the BESS
in Grid Function mode, and then GMS monitors the market dispatch signals and controls BESS to
inject real power.
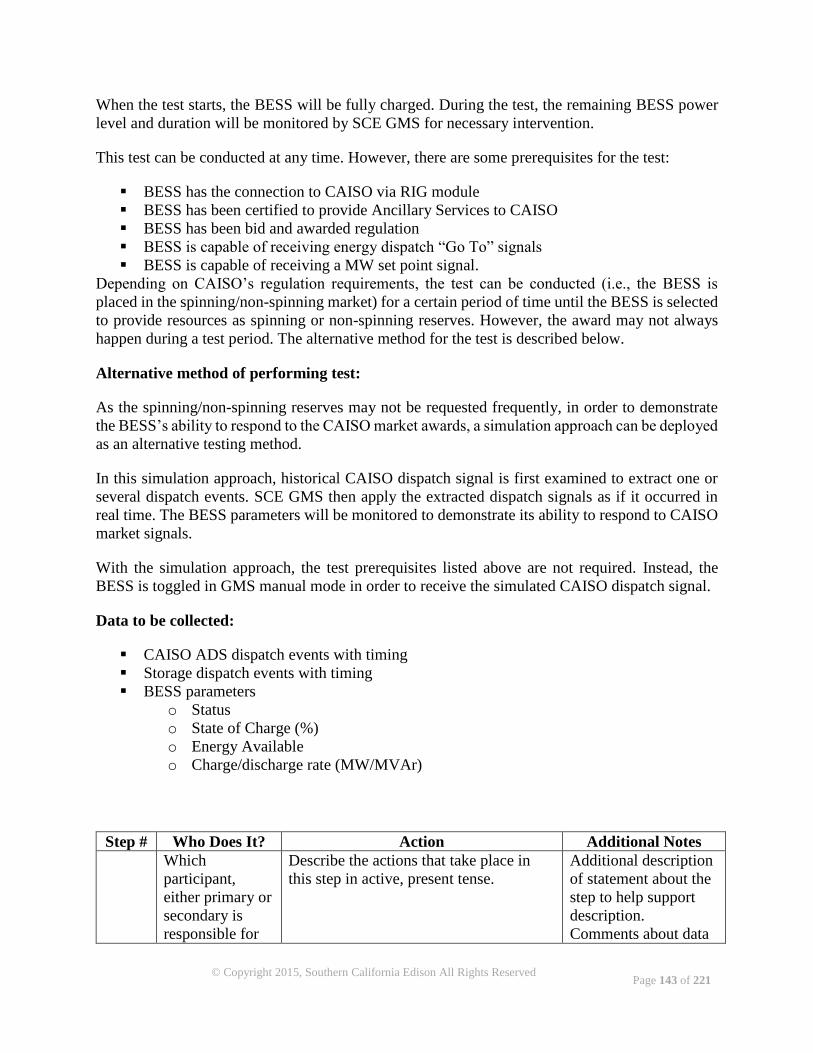
Page 143 of 221
© Copyright 2015, Southern California Edison All Rights Reserved
When the test starts, the BESS will be fully charged. During the test, the remaining BESS power
level and duration will be monitored by SCE GMS for necessary intervention.
This test can be conducted at any time. However, there are some prerequisites for the test:
BESS has the connection to CAISO via RIG module
BESS has been certified to provide Ancillary Services to CAISO
BESS has been bid and awarded regulation
BESS is capable of receiving energy dispatch “Go To” signals
BESS is capable of receiving a MW set point signal.
Depending on CAISO’s regulation requirements, the test can be conducted (i.e., the BESS is
placed in the spinning/non-spinning market) for a certain period of time until the BESS is selected
to provide resources as spinning or non-spinning reserves. However, the award may not always
happen during a test period. The alternative method for the test is described below.
Alternative method of performing test:
As the spinning/non-spinning reserves may not be requested frequently, in order to demonstrate
the BESS’s ability to respond to the CAISO market awards, a simulation approach can be deployed
as an alternative testing method.
In this simulation approach, historical CAISO dispatch signal is first examined to extract one or
several dispatch events. SCE GMS then apply the extracted dispatch signals as if it occurred in
real time. The BESS parameters will be monitored to demonstrate its ability to respond to CAISO
market signals.
With the simulation approach, the test prerequisites listed above are not required. Instead, the
BESS is toggled in GMS manual mode in order to receive the simulated CAISO dispatch signal.
Data to be collected:
CAISO ADS dispatch events with timing
Storage dispatch events with timing
BESS parameters
o Status
o State of Charge (%)
o Energy Available
o Charge/discharge rate (MW/MVAr)
Step # Who Does It? Action Additional Notes
Which
participant,
either primary or
secondary is
responsible for
Describe the actions that take place in
this step in active, present tense.
Additional description
of statement about the
step to help support
description.
Comments about data
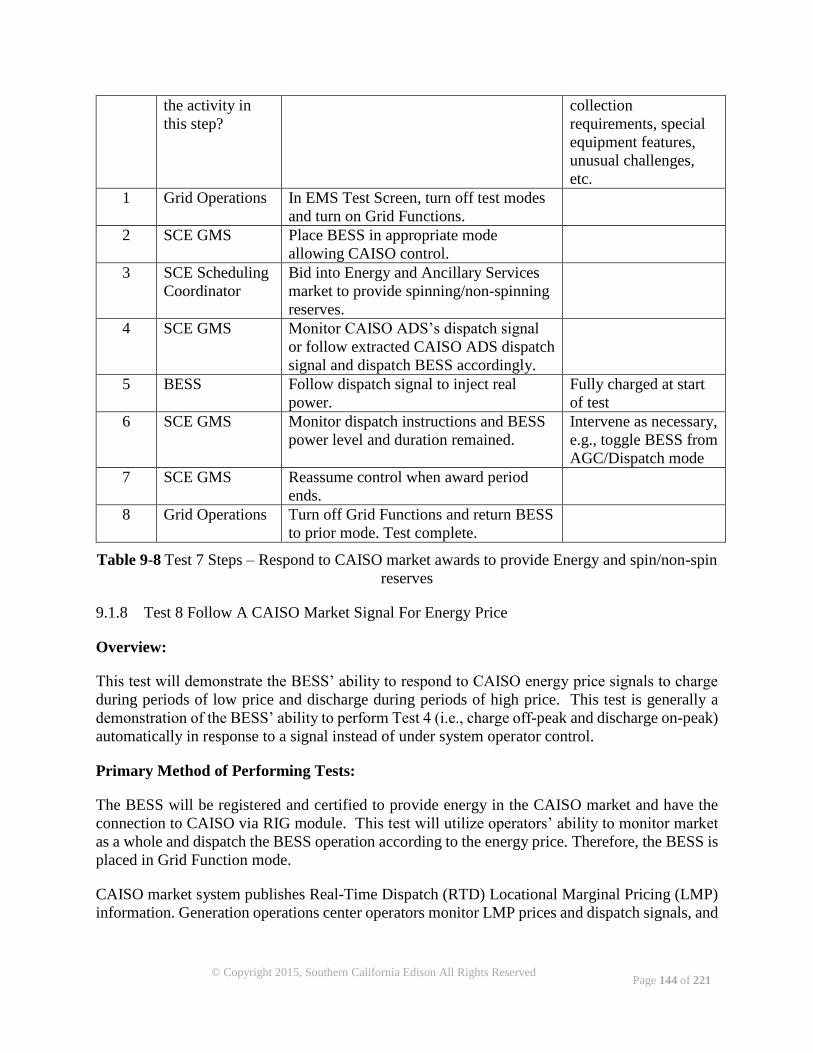
Page 144 of 221
© Copyright 2015, Southern California Edison All Rights Reserved
the activity in
this step?
collection
requirements, special
equipment features,
unusual challenges,
etc.
1 Grid Operations In EMS Test Screen, turn off test modes
and turn on Grid Functions.
2 SCE GMS Place BESS in appropriate mode
allowing CAISO control.
3 SCE Scheduling
Coordinator
Bid into Energy and Ancillary Services
market to provide spinning/non-spinning
reserves.
4 SCE GMS Monitor CAISO ADS’s dispatch signal
or follow extracted CAISO ADS dispatch
signal and dispatch BESS accordingly.
5 BESS Follow dispatch signal to inject real
power.
Fully charged at start
of test
6 SCE GMS Monitor dispatch instructions and BESS
power level and duration remained.
Intervene as necessary,
e.g., toggle BESS from
AGC/Dispatch mode
7 SCE GMS Reassume control when award period
ends.
8 Grid Operations Turn off Grid Functions and return BESS
to prior mode. Test complete.
Table 9-8 Test 7 Steps – Respond to CAISO market awards to provide Energy and spin/non-spin
reserves
9.1.8 Test 8 Follow A CAISO Market Signal For Energy Price
Overview:
This test will demonstrate the BESS’ ability to respond to CAISO energy price signals to charge
during periods of low price and discharge during periods of high price. This test is generally a
demonstration of the BESS’ ability to perform Test 4 (i.e., charge off-peak and discharge on-peak)
automatically in response to a signal instead of under system operator control.
Primary Method of Performing Tests:
The BESS will be registered and certified to provide energy in the CAISO market and have the
connection to CAISO via RIG module. This test will utilize operators’ ability to monitor market
as a whole and dispatch the BESS operation according to the energy price. Therefore, the BESS is
placed in Grid Function mode.
CAISO market system publishes Real-Time Dispatch (RTD) Locational Marginal Pricing (LMP)
information. Generation operations center operators monitor LMP prices and dispatch signals, and
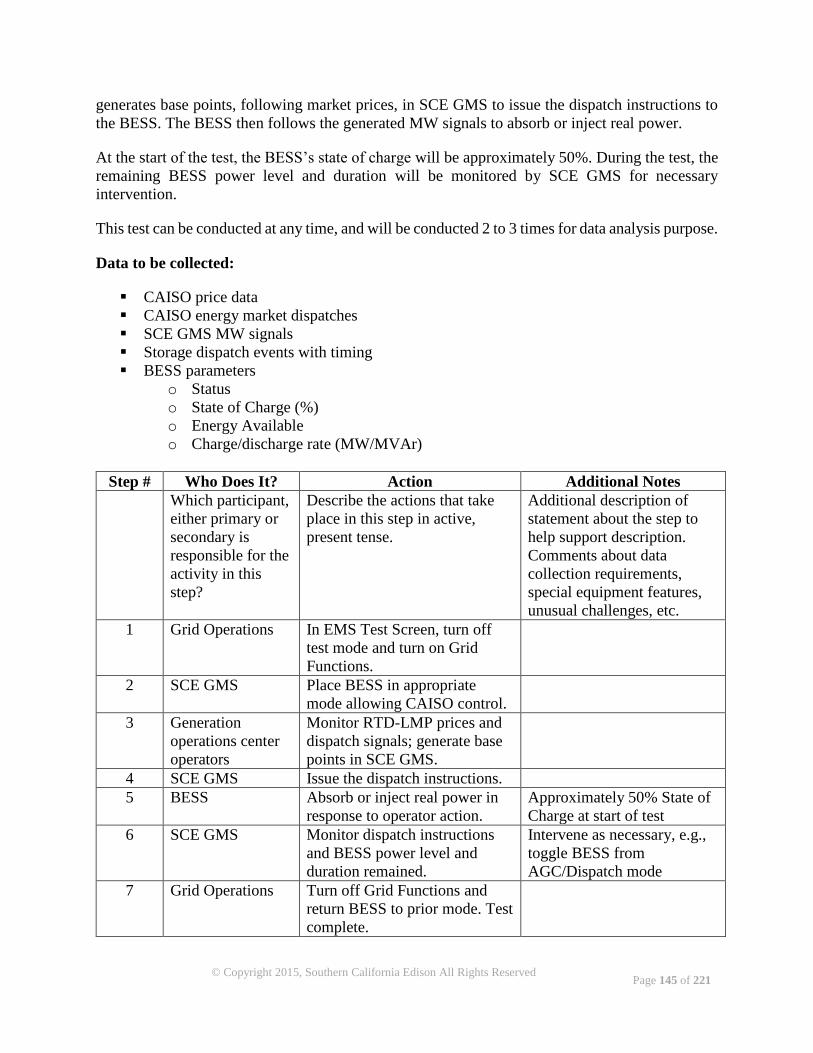
Page 145 of 221
© Copyright 2015, Southern California Edison All Rights Reserved
generates base points, following market prices, in SCE GMS to issue the dispatch instructions to
the BESS. The BESS then follows the generated MW signals to absorb or inject real power.
At the start of the test, the BESS’s state of charge will be approximately 50%. During the test, the
remaining BESS power level and duration will be monitored by SCE GMS for necessary
intervention.
This test can be conducted at any time, and will be conducted 2 to 3 times for data analysis purpose.
Data to be collected:
CAISO price data
CAISO energy market dispatches
SCE GMS MW signals
Storage dispatch events with timing
BESS parameters
o Status
o State of Charge (%)
o Energy Available
o Charge/discharge rate (MW/MVAr)
Step # Who Does It? Action Additional Notes
Which participant,
either primary or
secondary is
responsible for the
activity in this
step?
Describe the actions that take
place in this step in active,
present tense.
Additional description of
statement about the step to
help support description.
Comments about data
collection requirements,
special equipment features,
unusual challenges, etc.
1 Grid Operations In EMS Test Screen, turn off
test mode and turn on Grid
Functions.
2 SCE GMS Place BESS in appropriate
mode allowing CAISO control.
3 Generation
operations center
operators
Monitor RTD-LMP prices and
dispatch signals; generate base
points in SCE GMS.
4 SCE GMS Issue the dispatch instructions.
5 BESS Absorb or inject real power in
response to operator action.
Approximately 50% State of
Charge at start of test
6 SCE GMS Monitor dispatch instructions
and BESS power level and
duration remained.
Intervene as necessary, e.g.,
toggle BESS from
AGC/Dispatch mode
7 Grid Operations Turn off Grid Functions and
return BESS to prior mode. Test
complete.
Page 146 of 221
© Copyright 2015, Southern California Edison All Rights Reserved
Table 9-9 Test 8 Steps – Follow a CAISO market signal for energy price
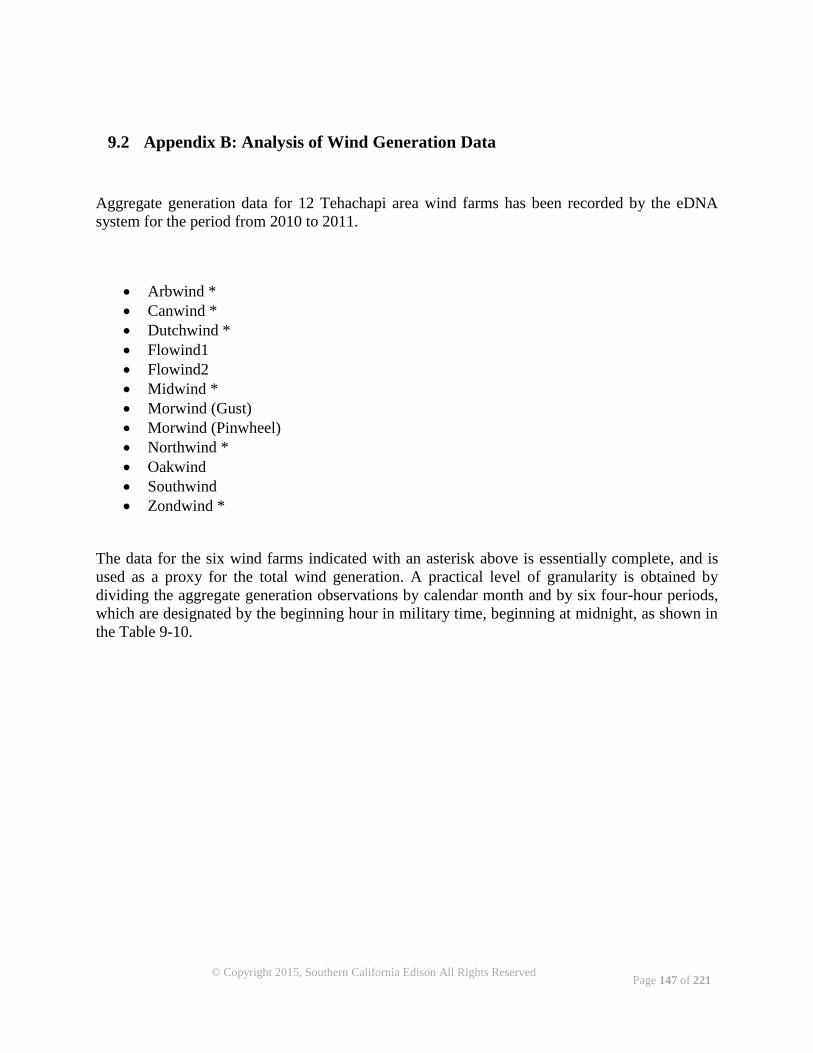
Page 147 of 221
© Copyright 2015, Southern California Edison All Rights Reserved
9.2 Appendix B: Analysis of Wind Generation Data
Aggregate generation data for 12 Tehachapi area wind farms has been recorded by the eDNA
system for the period from 2010 to 2011.
Arbwind *
Canwind *
Dutchwind *
Flowind1
Flowind2
Midwind *
Morwind (Gust)
Morwind (Pinwheel)
Northwind *
Oakwind
Southwind
Zondwind *
The data for the six wind farms indicated with an asterisk above is essentially complete, and is
used as a proxy for the total wind generation. A practical level of granularity is obtained by
dividing the aggregate generation observations by calendar month and by six four-hour periods,
which are designated by the beginning hour in military time, beginning at midnight, as shown in
the Table 9-10.
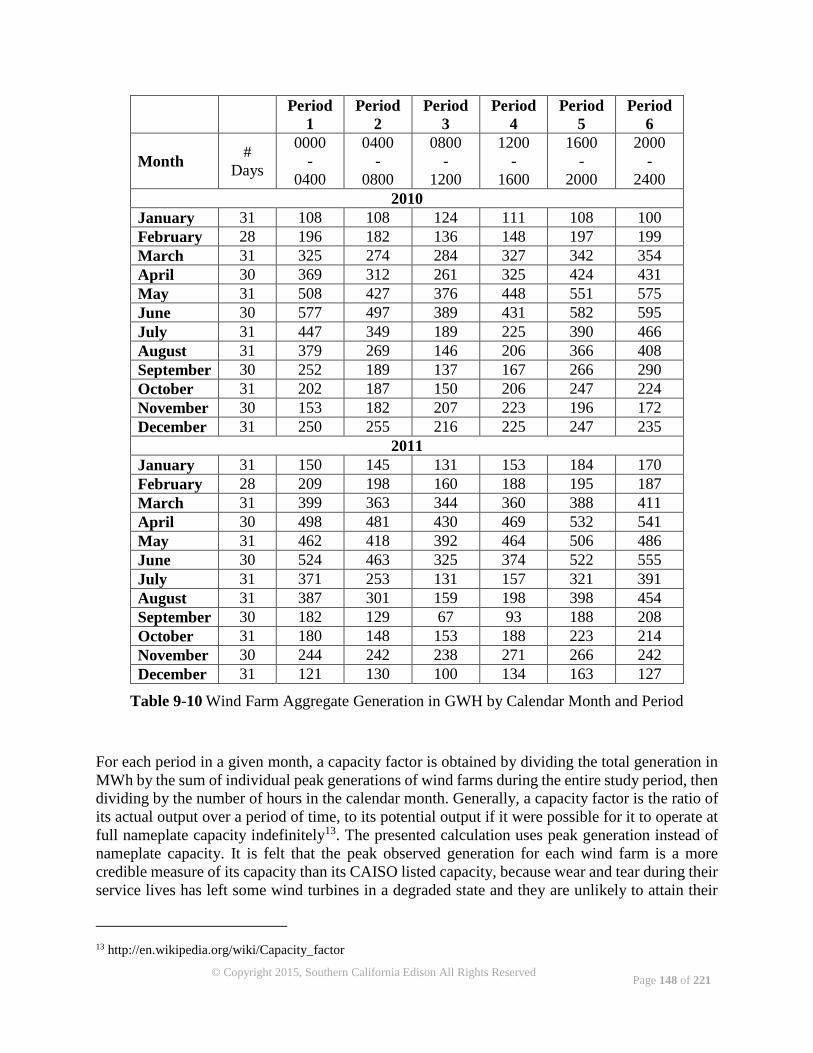
Page 148 of 221
© Copyright 2015, Southern California Edison All Rights Reserved
Period
1
Period
2
Period
3
Period
4
Period
5
Period
6
Month #
Days
0000
-
0400
0400
-
0800
0800
-
1200
1200
-
1600
1600
-
2000
2000
-
2400
2010
January 31 108 108 124 111 108 100
February 28 196 182 136 148 197 199
March 31 325 274 284 327 342 354
April 30 369 312 261 325 424 431
May 31 508 427 376 448 551 575
June 30 577 497 389 431 582 595
July 31 447 349 189 225 390 466
August 31 379 269 146 206 366 408
September 30 252 189 137 167 266 290
October 31 202 187 150 206 247 224
November 30 153 182 207 223 196 172
December 31 250 255 216 225 247 235
2011
January 31 150 145 131 153 184 170
February 28 209 198 160 188 195 187
March 31 399 363 344 360 388 411
April 30 498 481 430 469 532 541
May 31 462 418 392 464 506 486
June 30 524 463 325 374 522 555
July 31 371 253 131 157 321 391
August 31 387 301 159 198 398 454
September 30 182 129 67 93 188 208
October 31 180 148 153 188 223 214
November 30 244 242 238 271 266 242
December 31 121 130 100 134 163 127
Table 9-10 Wind Farm Aggregate Generation in GWH by Calendar Month and Period
For each period in a given month, a capacity factor is obtained by dividing the total generation in
MWh by the sum of individual peak generations of wind farms during the entire study period, then
dividing by the number of hours in the calendar month. Generally, a capacity factor is the ratio of
its actual output over a period of time, to its potential output if it were possible for it to operate at
full nameplate capacity indefinitely13. The presented calculation uses peak generation instead of
nameplate capacity. It is felt that the peak observed generation for each wind farm is a more
credible measure of its capacity than its CAISO listed capacity, because wear and tear during their
service lives has left some wind turbines in a degraded state and they are unlikely to attain their
13 http://en.wikipedia.org/wiki/Capacity_factor
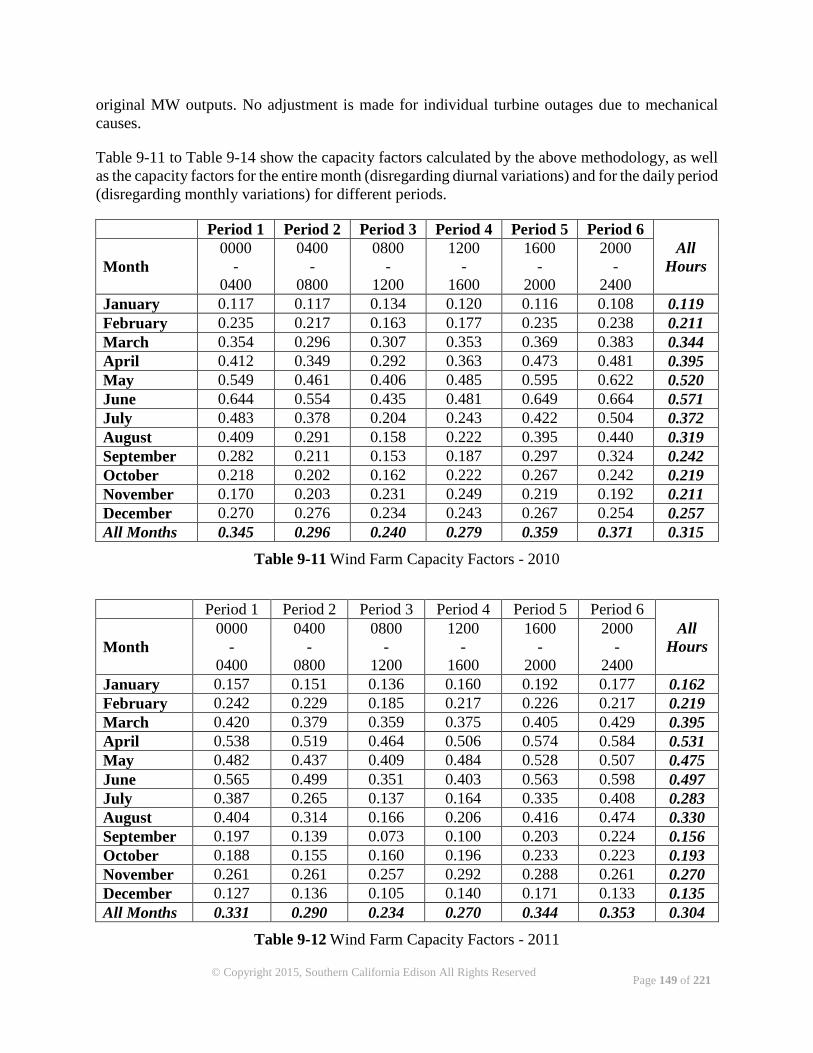
Page 149 of 221
© Copyright 2015, Southern California Edison All Rights Reserved
original MW outputs. No adjustment is made for individual turbine outages due to mechanical
causes.
Table 9-11 to Table 9-14 show the capacity factors calculated by the above methodology, as well
as the capacity factors for the entire month (disregarding diurnal variations) and for the daily period
(disregarding monthly variations) for different periods.
Period 1 Period 2 Period 3 Period 4 Period 5 Period 6
All
Hours Month
0000
-
0400
0400
-
0800
0800
-
1200
1200
-
1600
1600
-
2000
2000
-
2400
January 0.117 0.117 0.134 0.120 0.116 0.108 0.119
February 0.235 0.217 0.163 0.177 0.235 0.238 0.211
March 0.354 0.296 0.307 0.353 0.369 0.383 0.344
April 0.412 0.349 0.292 0.363 0.473 0.481 0.395
May 0.549 0.461 0.406 0.485 0.595 0.622 0.520
June 0.644 0.554 0.435 0.481 0.649 0.664 0.571
July 0.483 0.378 0.204 0.243 0.422 0.504 0.372
August 0.409 0.291 0.158 0.222 0.395 0.440 0.319
September 0.282 0.211 0.153 0.187 0.297 0.324 0.242
October 0.218 0.202 0.162 0.222 0.267 0.242 0.219
November 0.170 0.203 0.231 0.249 0.219 0.192 0.211
December 0.270 0.276 0.234 0.243 0.267 0.254 0.257
All Months 0.345 0.296 0.240 0.279 0.359 0.371 0.315
Table 9-11 Wind Farm Capacity Factors - 2010
Period 1 Period 2 Period 3 Period 4 Period 5 Period 6
All
Hours Month
0000
-
0400
0400
-
0800
0800
-
1200
1200
-
1600
1600
-
2000
2000
-
2400
January 0.157 0.151 0.136 0.160 0.192 0.177 0.162
February 0.242 0.229 0.185 0.217 0.226 0.217 0.219
March 0.420 0.379 0.359 0.375 0.405 0.429 0.395
April 0.538 0.519 0.464 0.506 0.574 0.584 0.531
May 0.482 0.437 0.409 0.484 0.528 0.507 0.475
June 0.565 0.499 0.351 0.403 0.563 0.598 0.497
July 0.387 0.265 0.137 0.164 0.335 0.408 0.283
August 0.404 0.314 0.166 0.206 0.416 0.474 0.330
September 0.197 0.139 0.073 0.100 0.203 0.224 0.156
October 0.188 0.155 0.160 0.196 0.233 0.223 0.193
November 0.261 0.261 0.257 0.292 0.288 0.261 0.270
December 0.127 0.136 0.105 0.140 0.171 0.133 0.135
All Months 0.331 0.290 0.234 0.270 0.344 0.353 0.304
Table 9-12 Wind Farm Capacity Factors - 2011
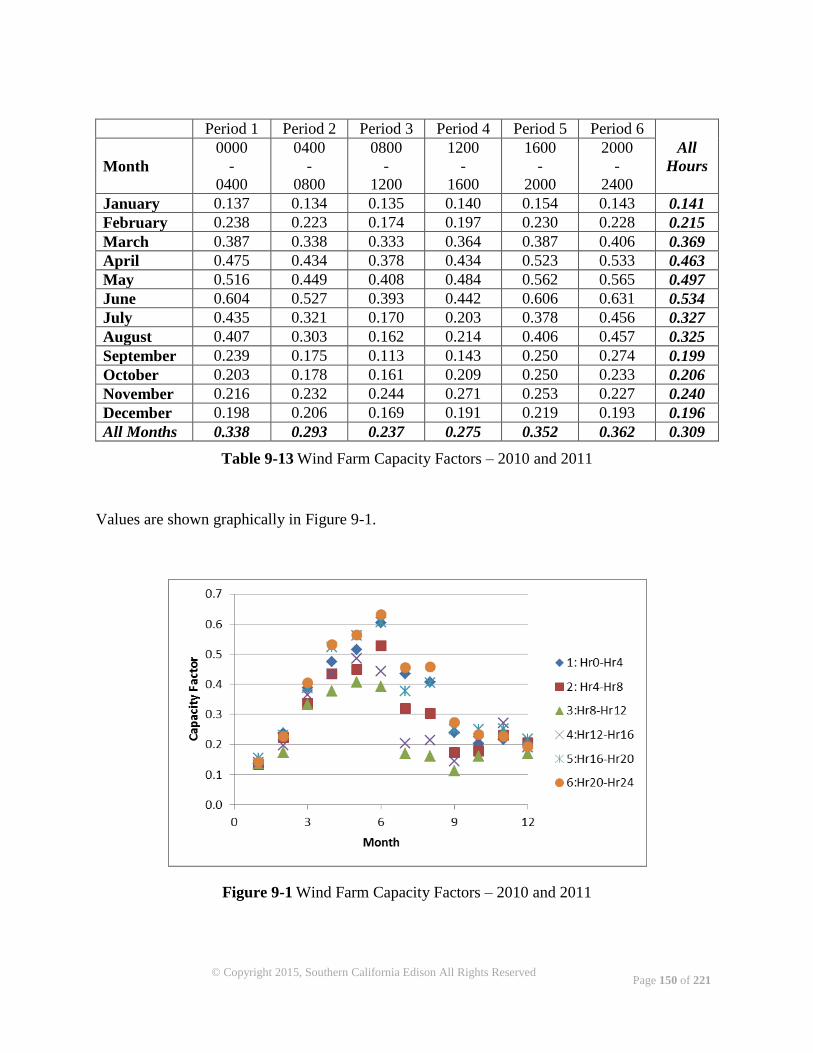
Page 150 of 221
© Copyright 2015, Southern California Edison All Rights Reserved
Period 1 Period 2 Period 3 Period 4 Period 5 Period 6
All
Hours Month
0000
-
0400
0400
-
0800
0800
-
1200
1200
-
1600
1600
-
2000
2000
-
2400
January 0.137 0.134 0.135 0.140 0.154 0.143 0.141
February 0.238 0.223 0.174 0.197 0.230 0.228 0.215
March 0.387 0.338 0.333 0.364 0.387 0.406 0.369
April 0.475 0.434 0.378 0.434 0.523 0.533 0.463
May 0.516 0.449 0.408 0.484 0.562 0.565 0.497
June 0.604 0.527 0.393 0.442 0.606 0.631 0.534
July 0.435 0.321 0.170 0.203 0.378 0.456 0.327
August 0.407 0.303 0.162 0.214 0.406 0.457 0.325
September 0.239 0.175 0.113 0.143 0.250 0.274 0.199
October 0.203 0.178 0.161 0.209 0.250 0.233 0.206
November 0.216 0.232 0.244 0.271 0.253 0.227 0.240
December 0.198 0.206 0.169 0.191 0.219 0.193 0.196
All Months 0.338 0.293 0.237 0.275 0.352 0.362 0.309
Table 9-13 Wind Farm Capacity Factors – 2010 and 2011
Values are shown graphically in Figure 9-1.
Figure 9-1 Wind Farm Capacity Factors – 2010 and 2011
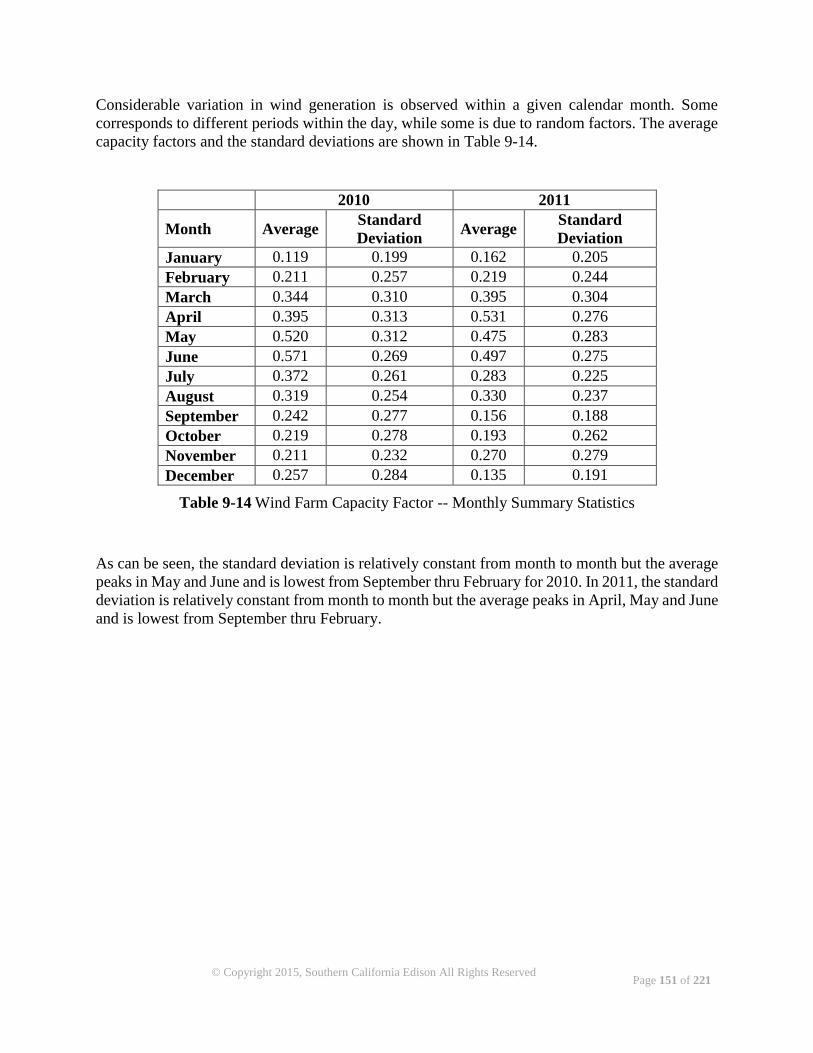
Page 151 of 221
© Copyright 2015, Southern California Edison All Rights Reserved
Considerable variation in wind generation is observed within a given calendar month. Some
corresponds to different periods within the day, while some is due to random factors. The average
capacity factors and the standard deviations are shown in Table 9-14.
2010 2011
Month Average Standard
Deviation Average
Standard
Deviation
January 0.119 0.199 0.162 0.205
February 0.211 0.257 0.219 0.244
March 0.344 0.310 0.395 0.304
April 0.395 0.313 0.531 0.276
May 0.520 0.312 0.475 0.283
June 0.571 0.269 0.497 0.275
July 0.372 0.261 0.283 0.225
August 0.319 0.254 0.330 0.237
September 0.242 0.277 0.156 0.188
October 0.219 0.278 0.193 0.262
November 0.211 0.232 0.270 0.279
December 0.257 0.284 0.135 0.191
Table 9-14 Wind Farm Capacity Factor -- Monthly Summary Statistics
As can be seen, the standard deviation is relatively constant from month to month but the average
peaks in May and June and is lowest from September thru February for 2010. In 2011, the standard
deviation is relatively constant from month to month but the average peaks in April, May and June
and is lowest from September thru February.
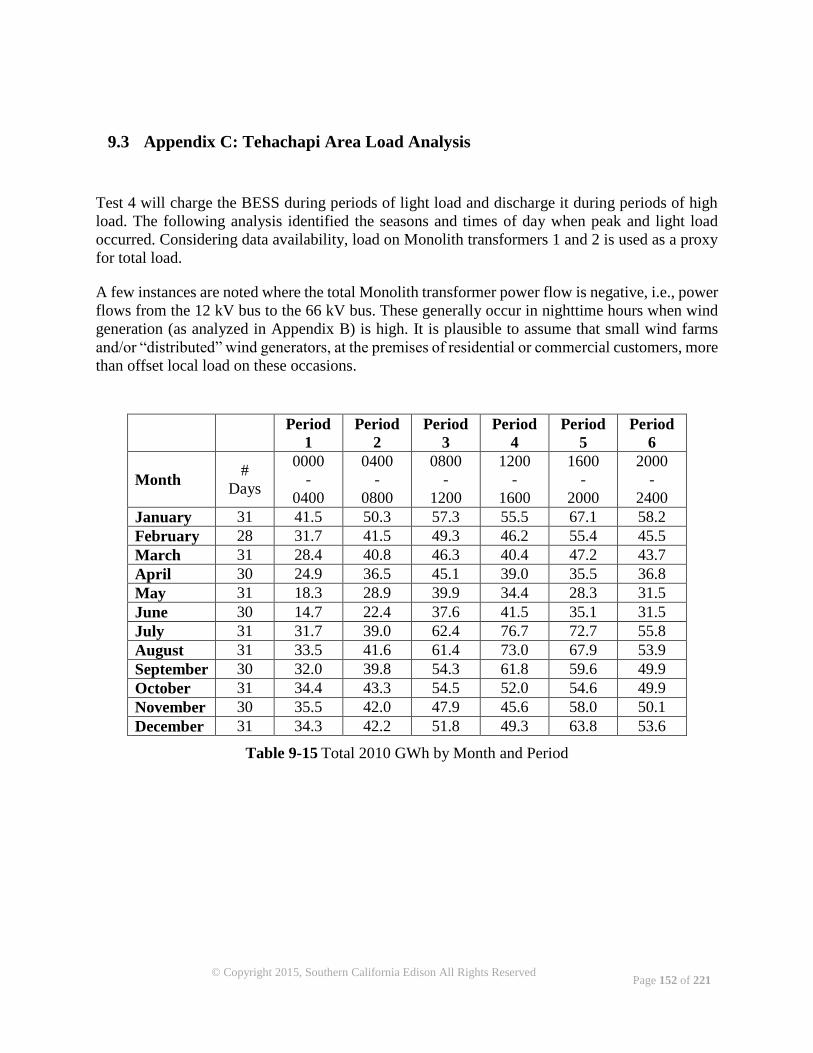
Page 152 of 221
© Copyright 2015, Southern California Edison All Rights Reserved
9.3 Appendix C: Tehachapi Area Load Analysis
Test 4 will charge the BESS during periods of light load and discharge it during periods of high
load. The following analysis identified the seasons and times of day when peak and light load
occurred. Considering data availability, load on Monolith transformers 1 and 2 is used as a proxy
for total load.
A few instances are noted where the total Monolith transformer power flow is negative, i.e., power
flows from the 12 kV bus to the 66 kV bus. These generally occur in nighttime hours when wind
generation (as analyzed in Appendix B) is high. It is plausible to assume that small wind farms
and/or “distributed” wind generators, at the premises of residential or commercial customers, more
than offset local load on these occasions.
Period
1
Period
2
Period
3
Period
4
Period
5
Period
6
Month #
Days
0000
-
0400
0400
-
0800
0800
-
1200
1200
-
1600
1600
-
2000
2000
-
2400
January 31 41.5 50.3 57.3 55.5 67.1 58.2
February 28 31.7 41.5 49.3 46.2 55.4 45.5
March 31 28.4 40.8 46.3 40.4 47.2 43.7
April 30 24.9 36.5 45.1 39.0 35.5 36.8
May 31 18.3 28.9 39.9 34.4 28.3 31.5
June 30 14.7 22.4 37.6 41.5 35.1 31.5
July 31 31.7 39.0 62.4 76.7 72.7 55.8
August 31 33.5 41.6 61.4 73.0 67.9 53.9
September 30 32.0 39.8 54.3 61.8 59.6 49.9
October 31 34.4 43.3 54.5 52.0 54.6 49.9
November 30 35.5 42.0 47.9 45.6 58.0 50.1
December 31 34.3 42.2 51.8 49.3 63.8 53.6
Table 9-15 Total 2010 GWh by Month and Period
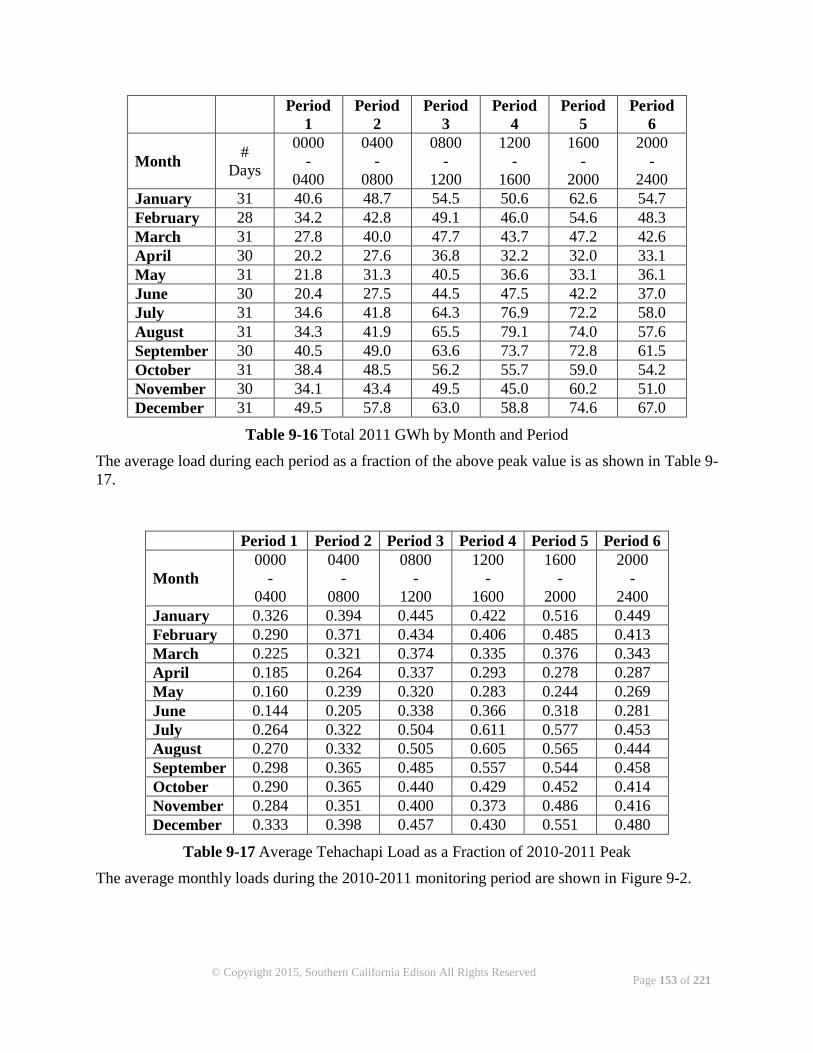
Page 153 of 221
© Copyright 2015, Southern California Edison All Rights Reserved
Period
1
Period
2
Period
3
Period
4
Period
5
Period
6
Month #
Days
0000
-
0400
0400
-
0800
0800
-
1200
1200
-
1600
1600
-
2000
2000
-
2400
January 31 40.6 48.7 54.5 50.6 62.6 54.7
February 28 34.2 42.8 49.1 46.0 54.6 48.3
March 31 27.8 40.0 47.7 43.7 47.2 42.6
April 30 20.2 27.6 36.8 32.2 32.0 33.1
May 31 21.8 31.3 40.5 36.6 33.1 36.1
June 30 20.4 27.5 44.5 47.5 42.2 37.0
July 31 34.6 41.8 64.3 76.9 72.2 58.0
August 31 34.3 41.9 65.5 79.1 74.0 57.6
September 30 40.5 49.0 63.6 73.7 72.8 61.5
October 31 38.4 48.5 56.2 55.7 59.0 54.2
November 30 34.1 43.4 49.5 45.0 60.2 51.0
December 31 49.5 57.8 63.0 58.8 74.6 67.0
Table 9-16 Total 2011 GWh by Month and Period
The average load during each period as a fraction of the above peak value is as shown in Table 9-
17.
Period 1 Period 2 Period 3 Period 4 Period 5 Period 6
Month
0000
-
0400
0400
-
0800
0800
-
1200
1200
-
1600
1600
-
2000
2000
-
2400
January 0.326 0.394 0.445 0.422 0.516 0.449
February 0.290 0.371 0.434 0.406 0.485 0.413
March 0.225 0.321 0.374 0.335 0.376 0.343
April 0.185 0.264 0.337 0.293 0.278 0.287
May 0.160 0.239 0.320 0.283 0.244 0.269
June 0.144 0.205 0.338 0.366 0.318 0.281
July 0.264 0.322 0.504 0.611 0.577 0.453
August 0.270 0.332 0.505 0.605 0.565 0.444
September 0.298 0.365 0.485 0.557 0.544 0.458
October 0.290 0.365 0.440 0.429 0.452 0.414
November 0.284 0.351 0.400 0.373 0.486 0.416
December 0.333 0.398 0.457 0.430 0.551 0.480
Table 9-17 Average Tehachapi Load as a Fraction of 2010-2011 Peak
The average monthly loads during the 2010-2011 monitoring period are shown in Figure 9-2.
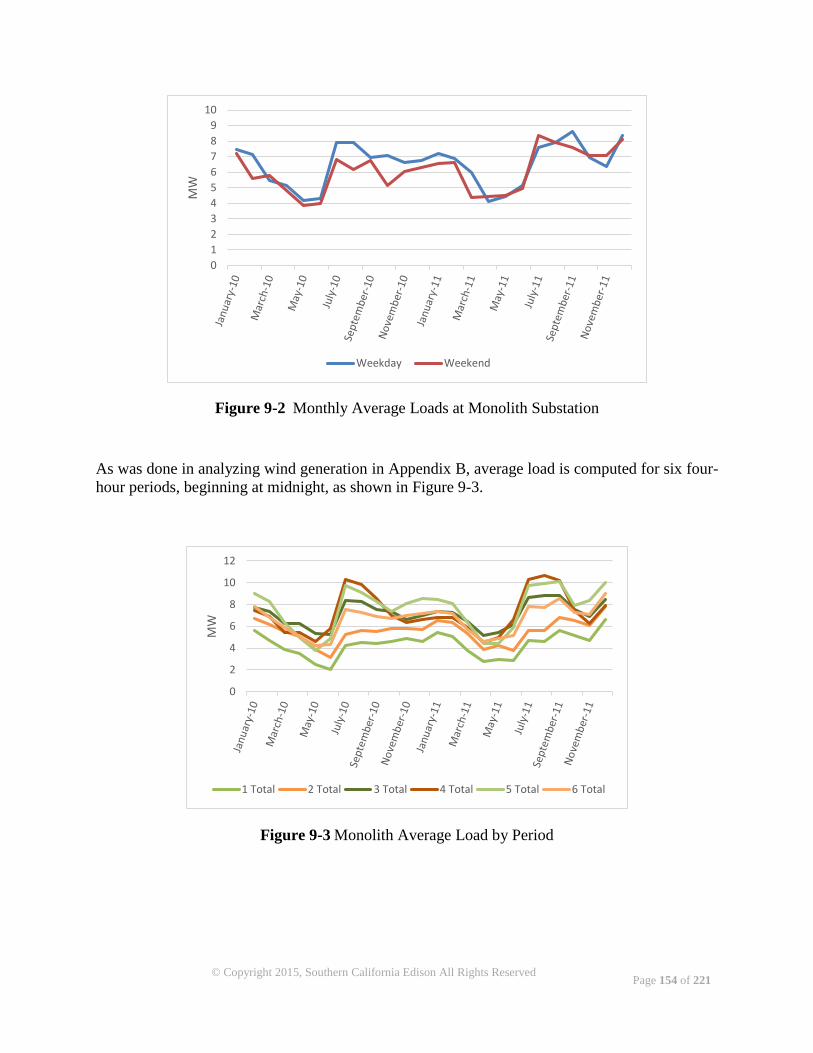
Page 154 of 221
© Copyright 2015, Southern California Edison All Rights Reserved
Figure 9-2 Monthly Average Loads at Monolith Substation
As was done in analyzing wind generation in Appendix B, average load is computed for six four-
hour periods, beginning at midnight, as shown in Figure 9-3.
Figure 9-3 Monolith Average Load by Period
0
1
2
3
4
5
6
7
8
9
10
MW
Weekday Weekend
0
2
4
6
8
10
12
MW
1 Total 2 Total 3 Total 4 Total 5 Total 6 Total

Page 155 of 221
© Copyright 2015, Southern California Edison All Rights Reserved
The principal observations about load variation are as follows:
Load is the highest from July to September, with a secondary peak in December and
January, and lower from February to June.
Period 1 loads are the lowest, periods 4 and 5 loads are the highest.
The load difference between peak period and light period is the largest for July and
August and the lowest in March and April.
The high load periods show more seasonal variation than do the low load periods.
There is a variation of 3 ½ to 4 MW between the highest and lowest periods at any season
of the year.
Most of the year, the average load at Monolith is within the 8 MW capability of the
BESS.
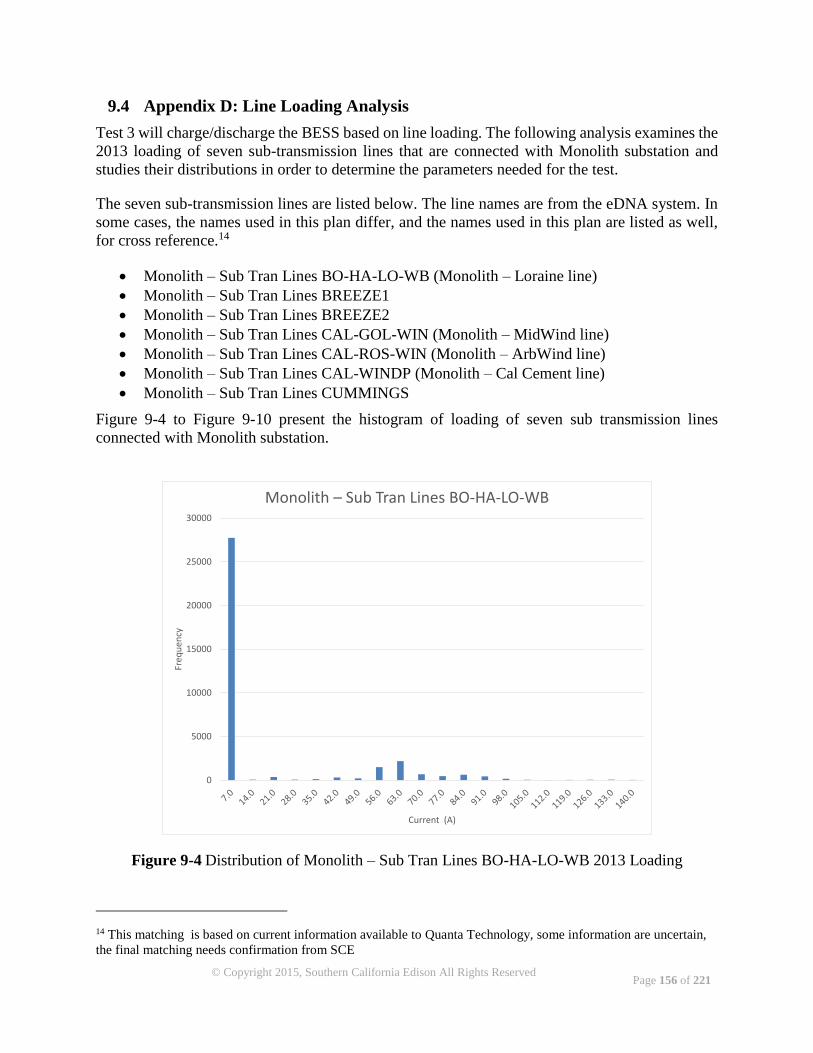
Page 156 of 221
© Copyright 2015, Southern California Edison All Rights Reserved
9.4 Appendix D: Line Loading Analysis
Test 3 will charge/discharge the BESS based on line loading. The following analysis examines the
2013 loading of seven sub-transmission lines that are connected with Monolith substation and
studies their distributions in order to determine the parameters needed for the test.
The seven sub-transmission lines are listed below. The line names are from the eDNA system. In
some cases, the names used in this plan differ, and the names used in this plan are listed as well,
for cross reference.14
Monolith – Sub Tran Lines BO-HA-LO-WB (Monolith – Loraine line)
Monolith – Sub Tran Lines BREEZE1
Monolith – Sub Tran Lines BREEZE2
Monolith – Sub Tran Lines CAL-GOL-WIN (Monolith – MidWind line)
Monolith – Sub Tran Lines CAL-ROS-WIN (Monolith – ArbWind line)
Monolith – Sub Tran Lines CAL-WINDP (Monolith – Cal Cement line)
Monolith – Sub Tran Lines CUMMINGS
Figure 9-4 to Figure 9-10 present the histogram of loading of seven sub transmission lines
connected with Monolith substation.
Figure 9-4 Distribution of Monolith – Sub Tran Lines BO-HA-LO-WB 2013 Loading
14 This matching is based on current information available to Quanta Technology, some information are uncertain,
the final matching needs confirmation from SCE
0
5000
10000
15000
20000
25000
30000
Freq
uen
cy
Current (A)
Monolith – Sub Tran Lines BO-HA-LO-WB
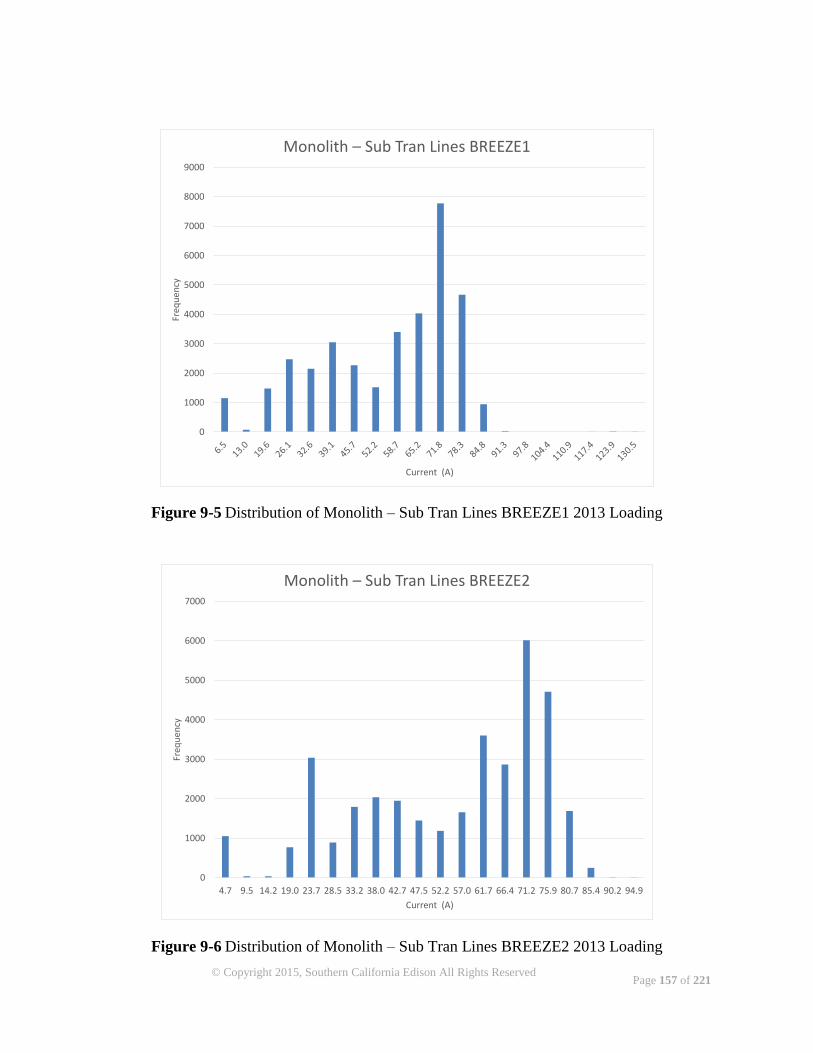
Page 157 of 221
© Copyright 2015, Southern California Edison All Rights Reserved
Figure 9-5 Distribution of Monolith – Sub Tran Lines BREEZE1 2013 Loading
Figure 9-6 Distribution of Monolith – Sub Tran Lines BREEZE2 2013 Loading
0
1000
2000
3000
4000
5000
6000
7000
8000
9000Fr
equ
ency
Current (A)
Monolith – Sub Tran Lines BREEZE1
0
1000
2000
3000
4000
5000
6000
7000
4.7 9.5 14.2 19.0 23.7 28.5 33.2 38.0 42.7 47.5 52.2 57.0 61.7 66.4 71.2 75.9 80.7 85.4 90.2 94.9
Freq
uen
cy
Current (A)
Monolith – Sub Tran Lines BREEZE2
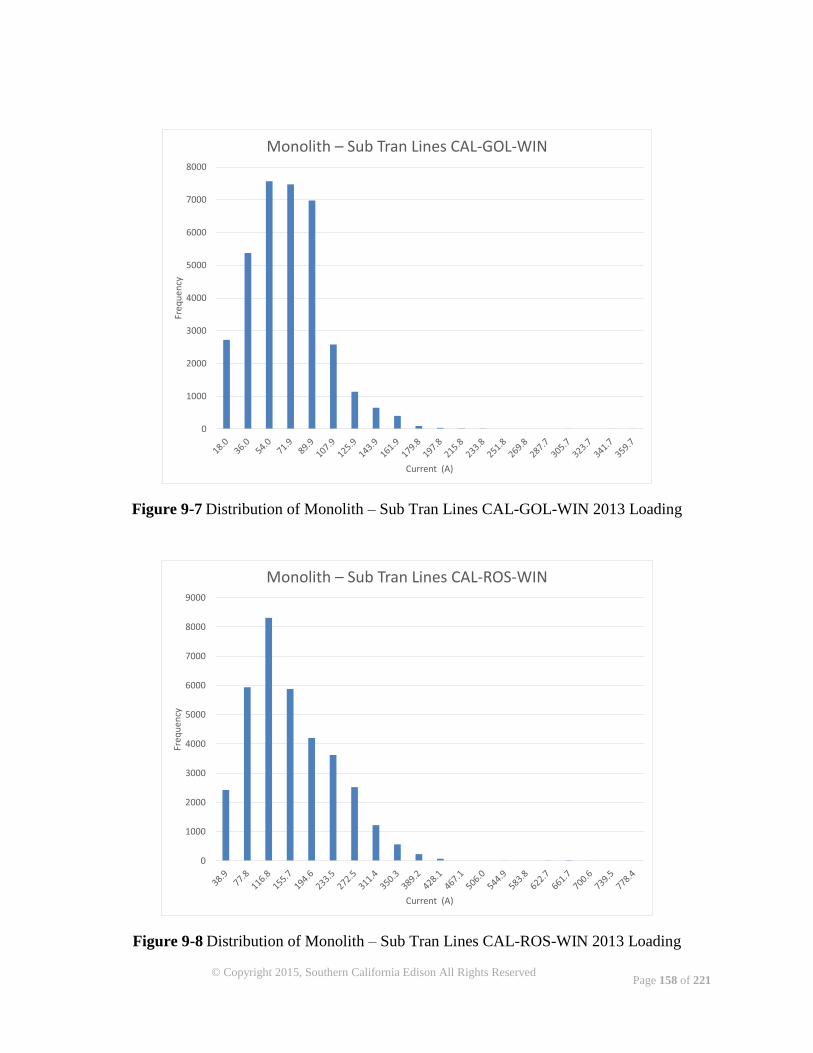
Page 158 of 221
© Copyright 2015, Southern California Edison All Rights Reserved
Figure 9-7 Distribution of Monolith – Sub Tran Lines CAL-GOL-WIN 2013 Loading
Figure 9-8 Distribution of Monolith – Sub Tran Lines CAL-ROS-WIN 2013 Loading
0
1000
2000
3000
4000
5000
6000
7000
8000Fr
equ
ency
Current (A)
Monolith – Sub Tran Lines CAL-GOL-WIN
0
1000
2000
3000
4000
5000
6000
7000
8000
9000
Freq
uen
cy
Current (A)
Monolith – Sub Tran Lines CAL-ROS-WIN
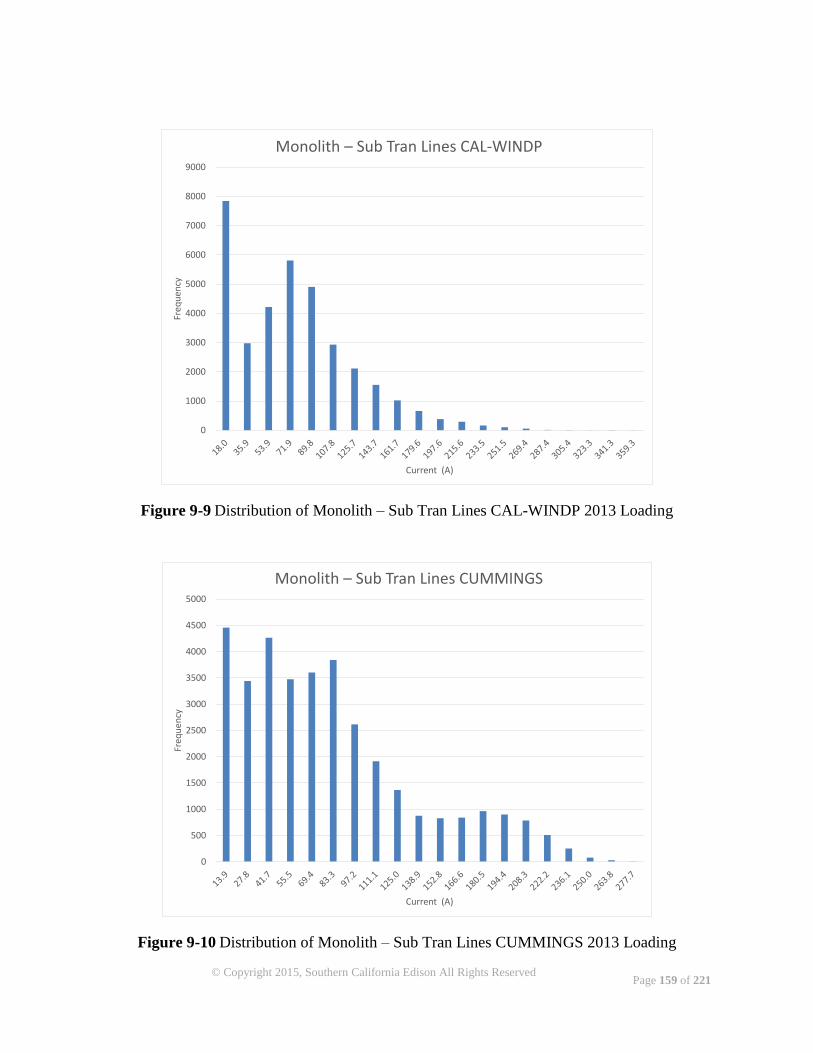
Page 159 of 221
© Copyright 2015, Southern California Edison All Rights Reserved
Figure 9-9 Distribution of Monolith – Sub Tran Lines CAL-WINDP 2013 Loading
Figure 9-10 Distribution of Monolith – Sub Tran Lines CUMMINGS 2013 Loading
0
1000
2000
3000
4000
5000
6000
7000
8000
9000Fr
equ
ency
Current (A)
Monolith – Sub Tran Lines CAL-WINDP
0
500
1000
1500
2000
2500
3000
3500
4000
4500
5000
Freq
uen
cy
Current (A)
Monolith – Sub Tran Lines CUMMINGS
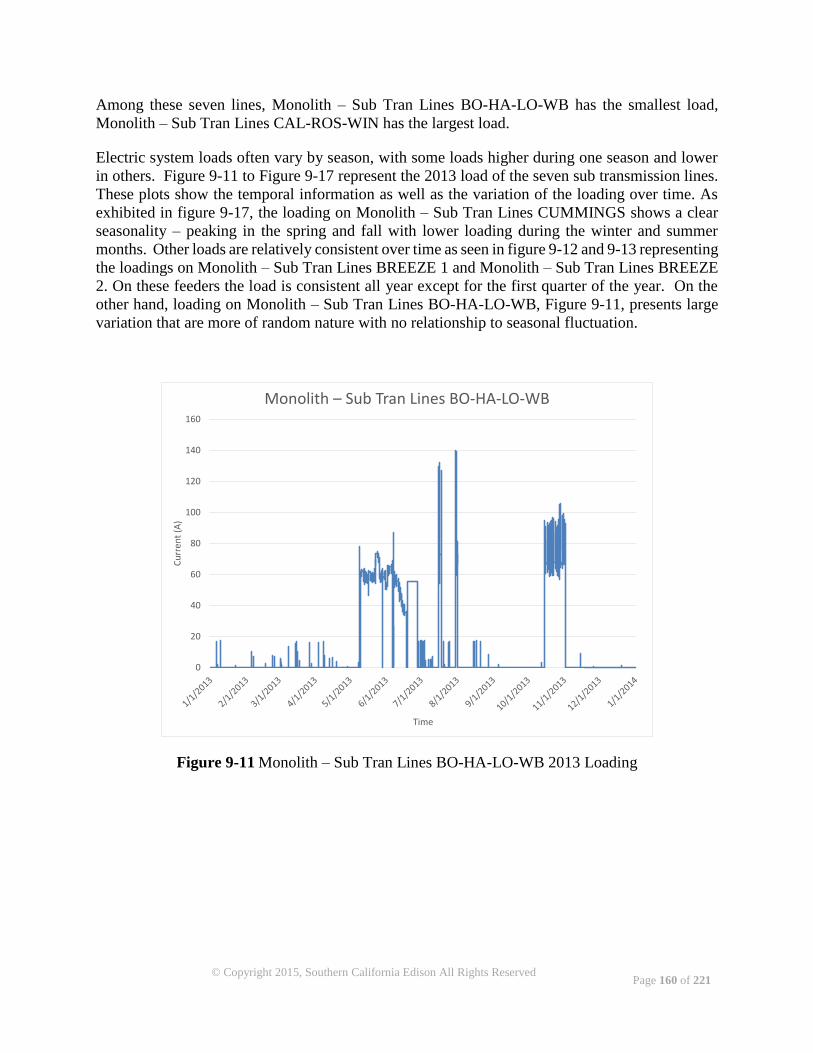
Page 160 of 221
© Copyright 2015, Southern California Edison All Rights Reserved
Among these seven lines, Monolith – Sub Tran Lines BO-HA-LO-WB has the smallest load,
Monolith – Sub Tran Lines CAL-ROS-WIN has the largest load.
Electric system loads often vary by season, with some loads higher during one season and lower
in others. Figure 9-11 to Figure 9-17 represent the 2013 load of the seven sub transmission lines.
These plots show the temporal information as well as the variation of the loading over time. As
exhibited in figure 9-17, the loading on Monolith – Sub Tran Lines CUMMINGS shows a clear
seasonality – peaking in the spring and fall with lower loading during the winter and summer
months. Other loads are relatively consistent over time as seen in figure 9-12 and 9-13 representing
the loadings on Monolith – Sub Tran Lines BREEZE 1 and Monolith – Sub Tran Lines BREEZE
2. On these feeders the load is consistent all year except for the first quarter of the year. On the
other hand, loading on Monolith – Sub Tran Lines BO-HA-LO-WB, Figure 9-11, presents large
variation that are more of random nature with no relationship to seasonal fluctuation.
Figure 9-11 Monolith – Sub Tran Lines BO-HA-LO-WB 2013 Loading
0
20
40
60
80
100
120
140
160
Cu
rren
t (A
)
Time
Monolith – Sub Tran Lines BO-HA-LO-WB
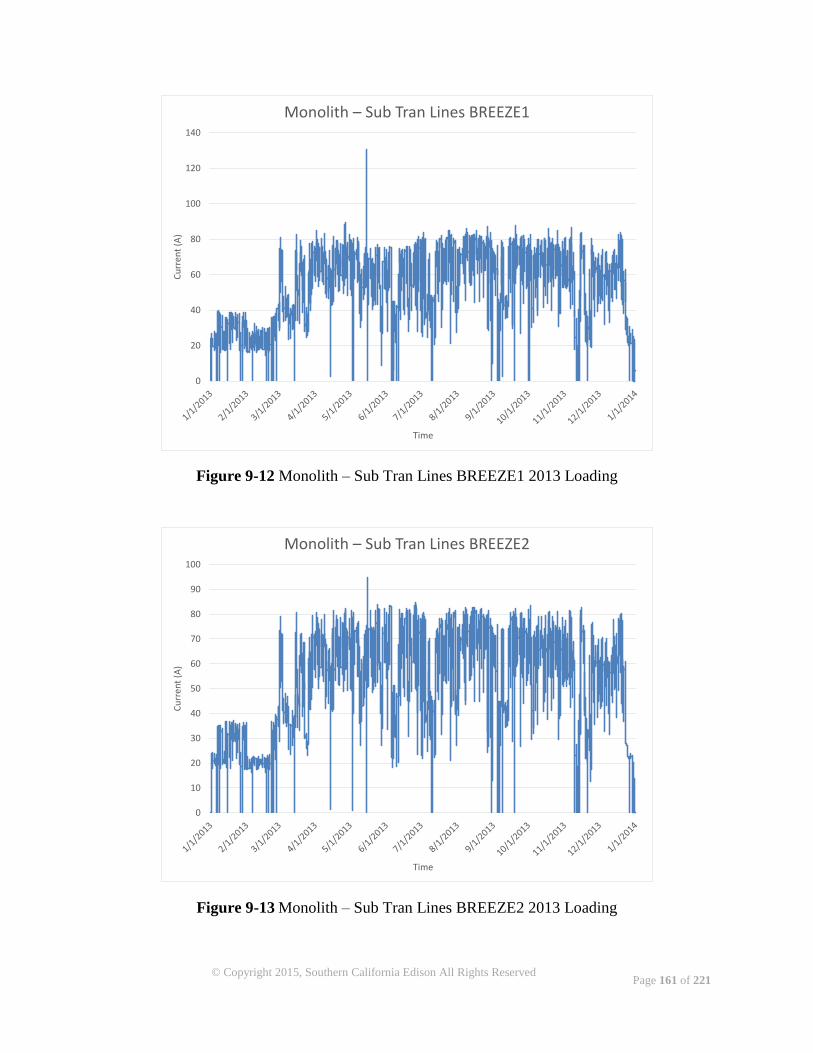
Page 161 of 221
© Copyright 2015, Southern California Edison All Rights Reserved
Figure 9-12 Monolith – Sub Tran Lines BREEZE1 2013 Loading
Figure 9-13 Monolith – Sub Tran Lines BREEZE2 2013 Loading
0
20
40
60
80
100
120
140
Cu
rren
t (A
)
Time
Monolith – Sub Tran Lines BREEZE1
0
10
20
30
40
50
60
70
80
90
100
Cu
rren
t (A
)
Time
Monolith – Sub Tran Lines BREEZE2
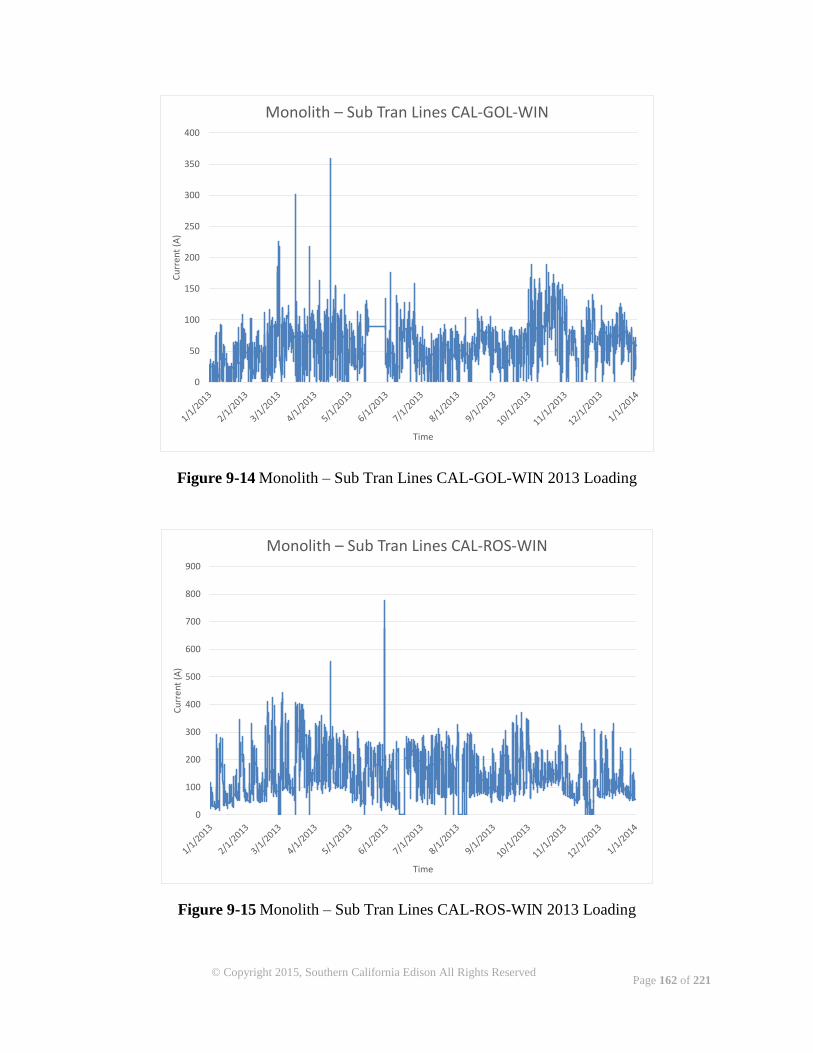
Page 162 of 221
© Copyright 2015, Southern California Edison All Rights Reserved
Figure 9-14 Monolith – Sub Tran Lines CAL-GOL-WIN 2013 Loading
Figure 9-15 Monolith – Sub Tran Lines CAL-ROS-WIN 2013 Loading
0
50
100
150
200
250
300
350
400
Cu
rren
t (A
)
Time
Monolith – Sub Tran Lines CAL-GOL-WIN
0
100
200
300
400
500
600
700
800
900
Cu
rren
t (A
)
Time
Monolith – Sub Tran Lines CAL-ROS-WIN
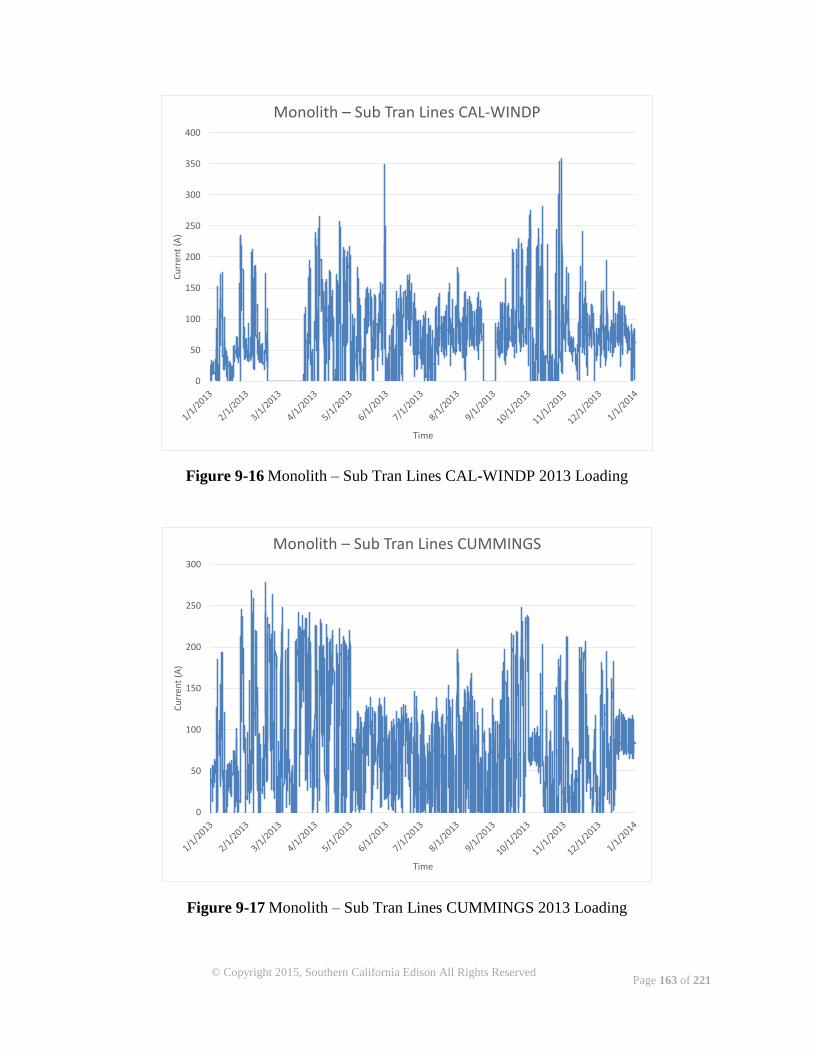
Page 163 of 221
© Copyright 2015, Southern California Edison All Rights Reserved
Figure 9-16 Monolith – Sub Tran Lines CAL-WINDP 2013 Loading
Figure 9-17 Monolith – Sub Tran Lines CUMMINGS 2013 Loading
0
50
100
150
200
250
300
350
400
Cu
rren
t (A
)
Time
Monolith – Sub Tran Lines CAL-WINDP
0
50
100
150
200
250
300
Cu
rren
t (A
)
Time
Monolith – Sub Tran Lines CUMMINGS
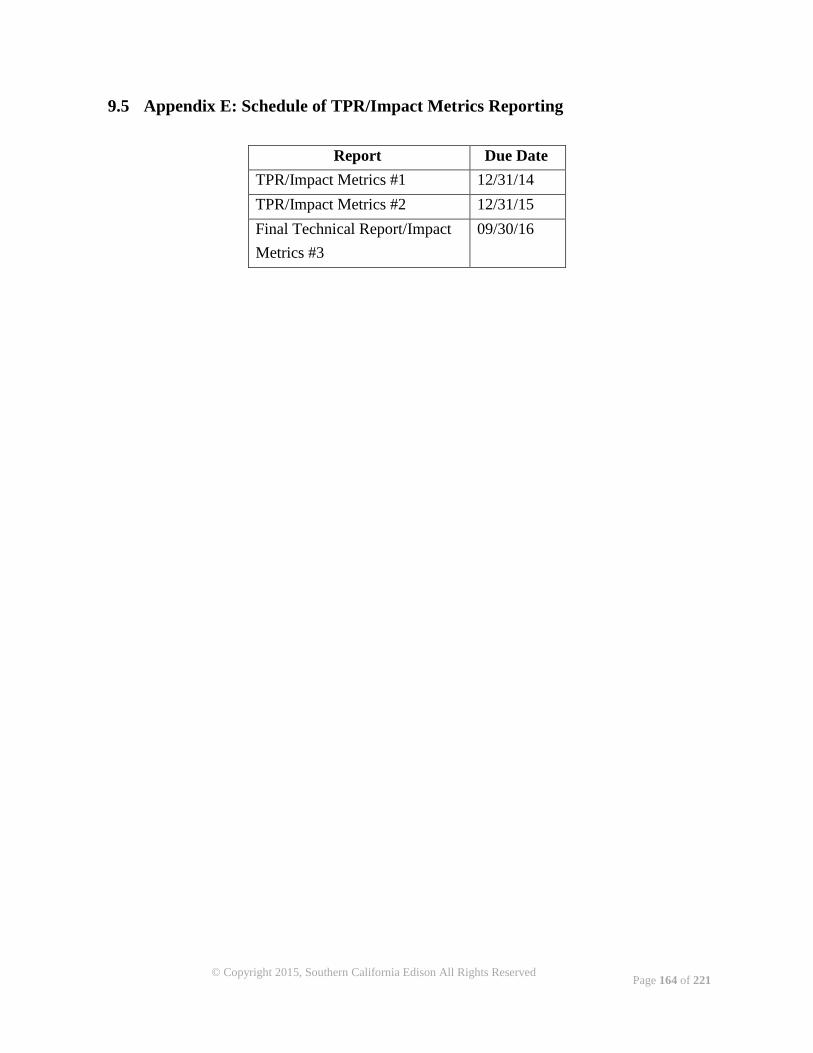
Page 164 of 221
© Copyright 2015, Southern California Edison All Rights Reserved
9.5 Appendix E: Schedule of TPR/Impact Metrics Reporting
Report Due Date
TPR/Impact Metrics #1 12/31/14
TPR/Impact Metrics #2 12/31/15
Final Technical Report/Impact
Metrics #3
09/30/16
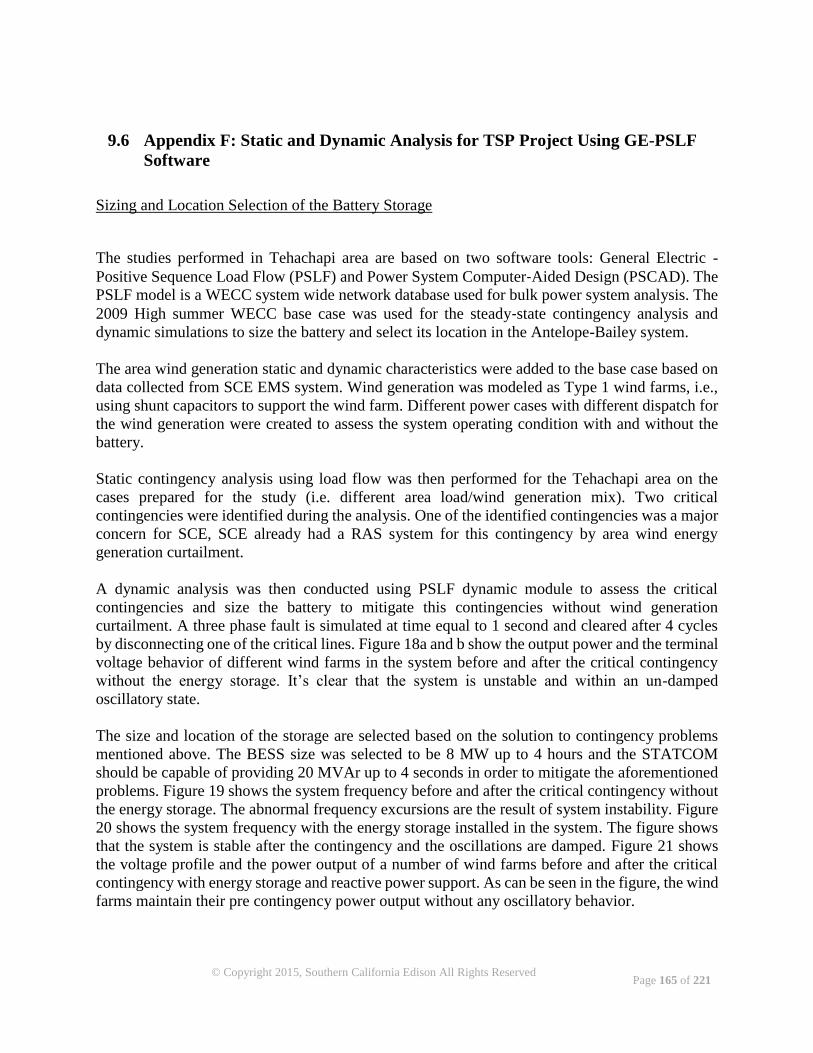
Page 165 of 221
© Copyright 2015, Southern California Edison All Rights Reserved
9.6 Appendix F: Static and Dynamic Analysis for TSP Project Using GE-PSLF
Software
Sizing and Location Selection of the Battery Storage
The studies performed in Tehachapi area are based on two software tools: General Electric -
Positive Sequence Load Flow (PSLF) and Power System Computer‐Aided Design (PSCAD). The
PSLF model is a WECC system wide network database used for bulk power system analysis. The
2009 High summer WECC base case was used for the steady‐state contingency analysis and
dynamic simulations to size the battery and select its location in the Antelope-Bailey system.
The area wind generation static and dynamic characteristics were added to the base case based on
data collected from SCE EMS system. Wind generation was modeled as Type 1 wind farms, i.e.,
using shunt capacitors to support the wind farm. Different power cases with different dispatch for
the wind generation were created to assess the system operating condition with and without the
battery.
Static contingency analysis using load flow was then performed for the Tehachapi area on the
cases prepared for the study (i.e. different area load/wind generation mix). Two critical
contingencies were identified during the analysis. One of the identified contingencies was a major
concern for SCE, SCE already had a RAS system for this contingency by area wind energy
generation curtailment.
A dynamic analysis was then conducted using PSLF dynamic module to assess the critical
contingencies and size the battery to mitigate this contingencies without wind generation
curtailment. A three phase fault is simulated at time equal to 1 second and cleared after 4 cycles
by disconnecting one of the critical lines. Figure 18a and b show the output power and the terminal
voltage behavior of different wind farms in the system before and after the critical contingency
without the energy storage. It’s clear that the system is unstable and within an un-damped
oscillatory state.
The size and location of the storage are selected based on the solution to contingency problems
mentioned above. The BESS size was selected to be 8 MW up to 4 hours and the STATCOM
should be capable of providing 20 MVAr up to 4 seconds in order to mitigate the aforementioned
problems. Figure 19 shows the system frequency before and after the critical contingency without
the energy storage. The abnormal frequency excursions are the result of system instability. Figure
20 shows the system frequency with the energy storage installed in the system. The figure shows
that the system is stable after the contingency and the oscillations are damped. Figure 21 shows
the voltage profile and the power output of a number of wind farms before and after the critical
contingency with energy storage and reactive power support. As can be seen in the figure, the wind
farms maintain their pre contingency power output without any oscillatory behavior.
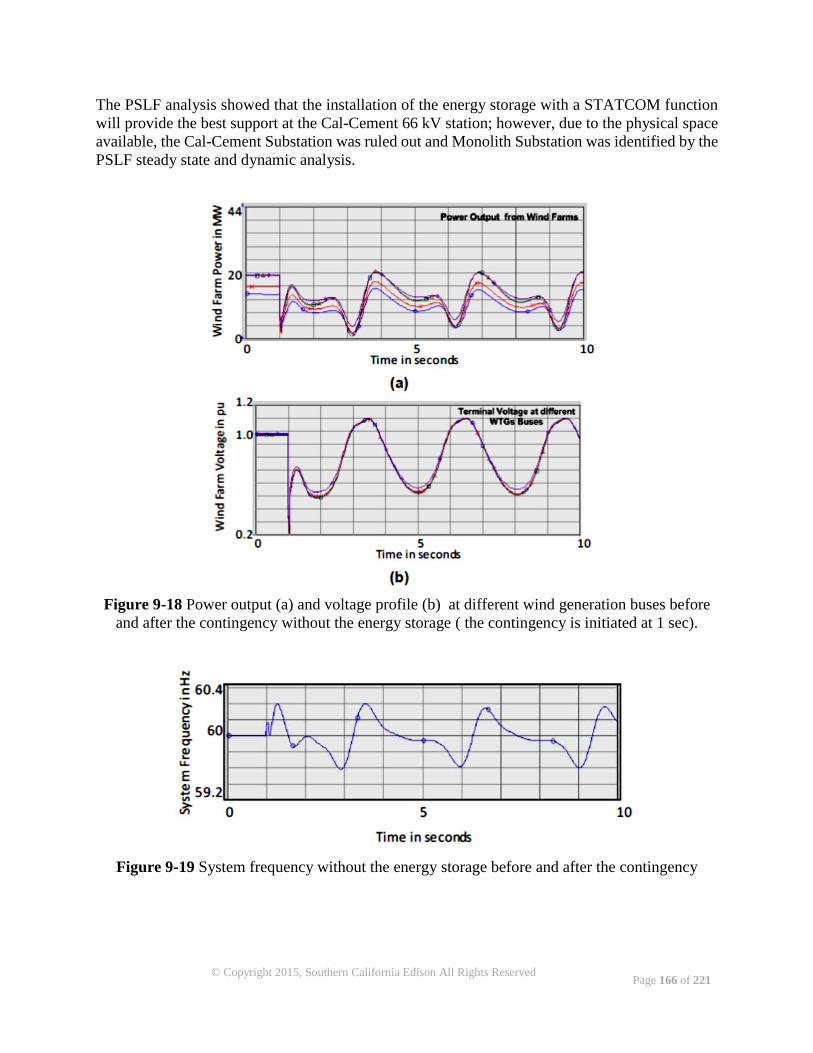
Page 166 of 221
© Copyright 2015, Southern California Edison All Rights Reserved
The PSLF analysis showed that the installation of the energy storage with a STATCOM function
will provide the best support at the Cal-Cement 66 kV station; however, due to the physical space
available, the Cal-Cement Substation was ruled out and Monolith Substation was identified by the
PSLF steady state and dynamic analysis.
Figure 9-18 Power output (a) and voltage profile (b) at different wind generation buses before
and after the contingency without the energy storage ( the contingency is initiated at 1 sec).
Figure 9-19 System frequency without the energy storage before and after the contingency
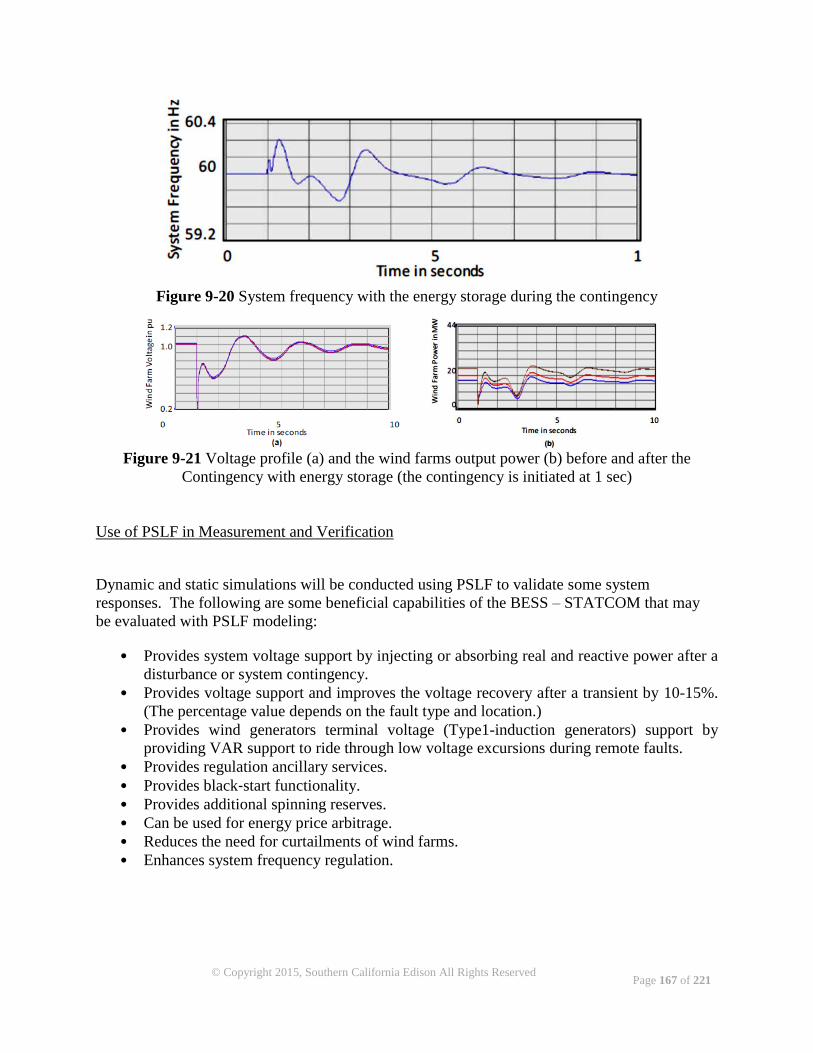
Page 167 of 221
© Copyright 2015, Southern California Edison All Rights Reserved
Figure 9-20 System frequency with the energy storage during the contingency
Figure 9-21 Voltage profile (a) and the wind farms output power (b) before and after the
Contingency with energy storage (the contingency is initiated at 1 sec)
Use of PSLF in Measurement and Verification
Dynamic and static simulations will be conducted using PSLF to validate some system
responses. The following are some beneficial capabilities of the BESS – STATCOM that may
be evaluated with PSLF modeling:
• Provides system voltage support by injecting or absorbing real and reactive power after a
disturbance or system contingency.
• Provides voltage support and improves the voltage recovery after a transient by 10-15%.
(The percentage value depends on the fault type and location.)
• Provides wind generators terminal voltage (Type1-induction generators) support by
providing VAR support to ride through low voltage excursions during remote faults.
• Provides regulation ancillary services.
• Provides black‐start functionality.
• Provides additional spinning reserves.
• Can be used for energy price arbitrage.
• Reduces the need for curtailments of wind farms.
• Enhances system frequency regulation.
Page 168 of 221
© Copyright 2015, Southern California Edison All Rights Reserved
9.7 Appendix G: Analysis for TSP Project Using RTDS
Dynamic Voltage Support Testing
A real time digital simulator (RTDS) was used to test the dynamic voltage support function (also
described as ‘voltage clamp’ in ABB nomenclature) of the PCS. The voltage support function was
requested to test the ability of the TSP system to autonomously stop following a P & Q setpoint,
and begin injecting reactive power to boost system voltage when the 66 kV bus voltage at Monolith
Substation drops below a defined setpoint. When the voltage recovers, the PCS curtails the reactive
power and resumes following the P and Q setpoint.
What is RTDS and how is it being used to test dynamic voltage support
A RTDS system is a hardware platform for running an electro-magnetic transients program
(EMTP) in real time. One of the differences between EMTP and other power system simulation
tools, is that EMTP calculates the instantaneous voltages at all of the nodes (or busses) and the
currents between all of the nodes (or busses) at every simulation time step. Typical real time EMTP
simulations build the waveform by calculating all of the instantaneous voltage and currents every
50 microseconds, which is about one degree on a single 60 hertz cycle.
In order to test external equipment, the RTDS has several different types of input/output cards that
can be used to bring signals into or send out of the EMTP simulation. In this application, the
simulated voltage and currents in the PCS and at Monolith substation are scaled down to a low
voltage (+/-10V) analog signal and connected directly to the PCS 100’s analog to digital converter
via several D-subminiature connections in the front of the device. Similarly, the firing pulses that
the PCS would send to the insulated-gate bipolar transistors (IGBT) are sampled by the RTDS via
a low voltage digital input card.
For many applications, such as testing microprocessor based protective relays, a time step of 50
microseconds is sufficient, however converter systems such as the PCS 100 send out firing pulses
that are only a few microseconds in duration. Additionally, converter controller systems typically
have very fast control loops that may become unstable if the delay between time steps is too long.
To solve this problem, the RTDS has the capability to run part of a model with a much smaller
time step (about 2.5 microseconds) and interface the small time step model with the large time step
model. The interface between the small and large time step models is done with a special interface
transformer model that decouples the two solutions. The decoupling does introduce some error
(added series inductance and shunt reactance) but still captures overall system behavior. However,
the interface transformer has a feature to scale up the output of a single PSC 100 unit to represent
the power injected by both PCS container units (8 MVA).
Test Setup
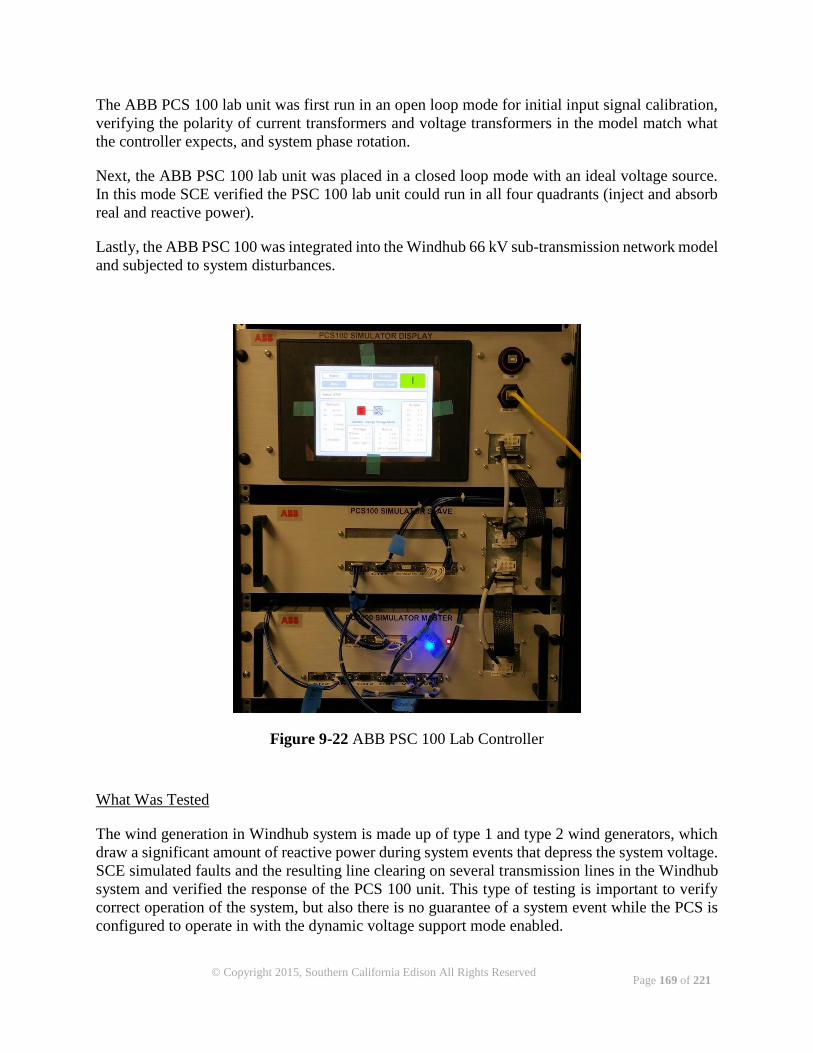
Page 169 of 221
© Copyright 2015, Southern California Edison All Rights Reserved
The ABB PCS 100 lab unit was first run in an open loop mode for initial input signal calibration,
verifying the polarity of current transformers and voltage transformers in the model match what
the controller expects, and system phase rotation.
Next, the ABB PSC 100 lab unit was placed in a closed loop mode with an ideal voltage source.
In this mode SCE verified the PSC 100 lab unit could run in all four quadrants (inject and absorb
real and reactive power).
Lastly, the ABB PSC 100 was integrated into the Windhub 66 kV sub-transmission network model
and subjected to system disturbances.
Figure 9-22 ABB PSC 100 Lab Controller
What Was Tested
The wind generation in Windhub system is made up of type 1 and type 2 wind generators, which
draw a significant amount of reactive power during system events that depress the system voltage.
SCE simulated faults and the resulting line clearing on several transmission lines in the Windhub
system and verified the response of the PCS 100 unit. This type of testing is important to verify
correct operation of the system, but also there is no guarantee of a system event while the PCS is
configured to operate in with the dynamic voltage support mode enabled.
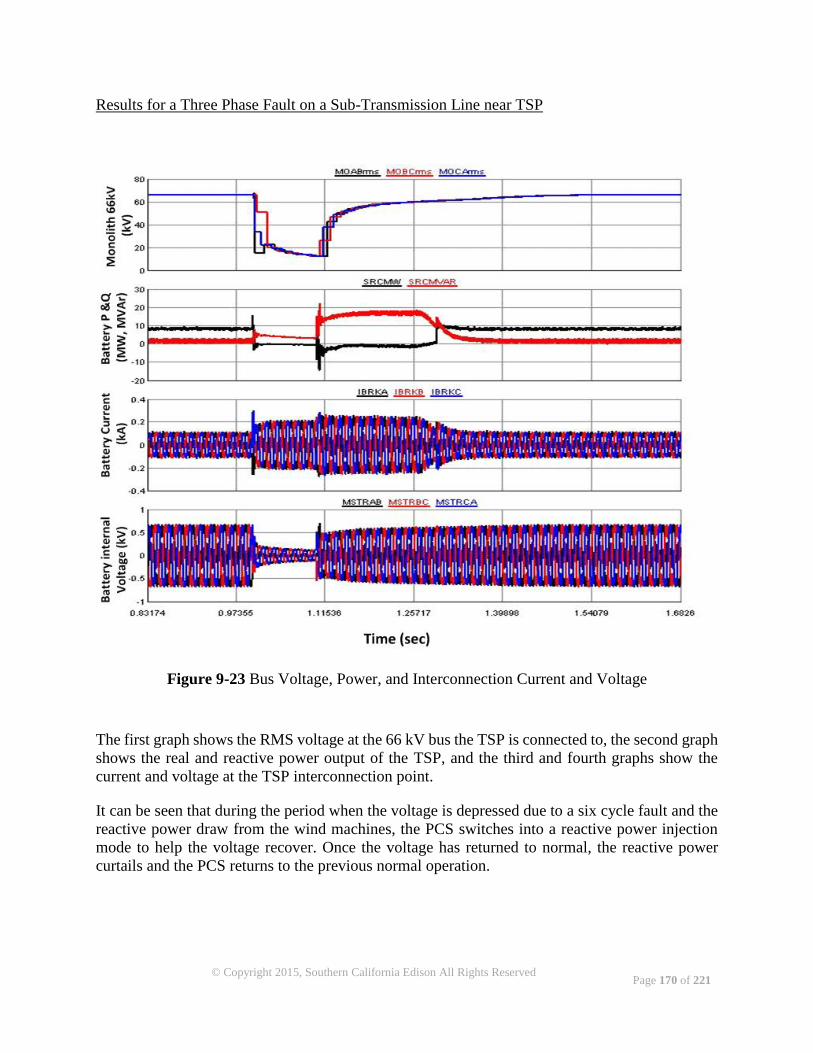
Page 170 of 221
© Copyright 2015, Southern California Edison All Rights Reserved
Results for a Three Phase Fault on a Sub-Transmission Line near TSP
Figure 9-23 Bus Voltage, Power, and Interconnection Current and Voltage
The first graph shows the RMS voltage at the 66 kV bus the TSP is connected to, the second graph
shows the real and reactive power output of the TSP, and the third and fourth graphs show the
current and voltage at the TSP interconnection point.
It can be seen that during the period when the voltage is depressed due to a six cycle fault and the
reactive power draw from the wind machines, the PCS switches into a reactive power injection
mode to help the voltage recover. Once the voltage has returned to normal, the reactive power
curtails and the PCS returns to the previous normal operation.

Page 171 of 221
© Copyright 2015, Southern California Edison All Rights Reserved
9.8 Appendix H: System Acceptance Test Results
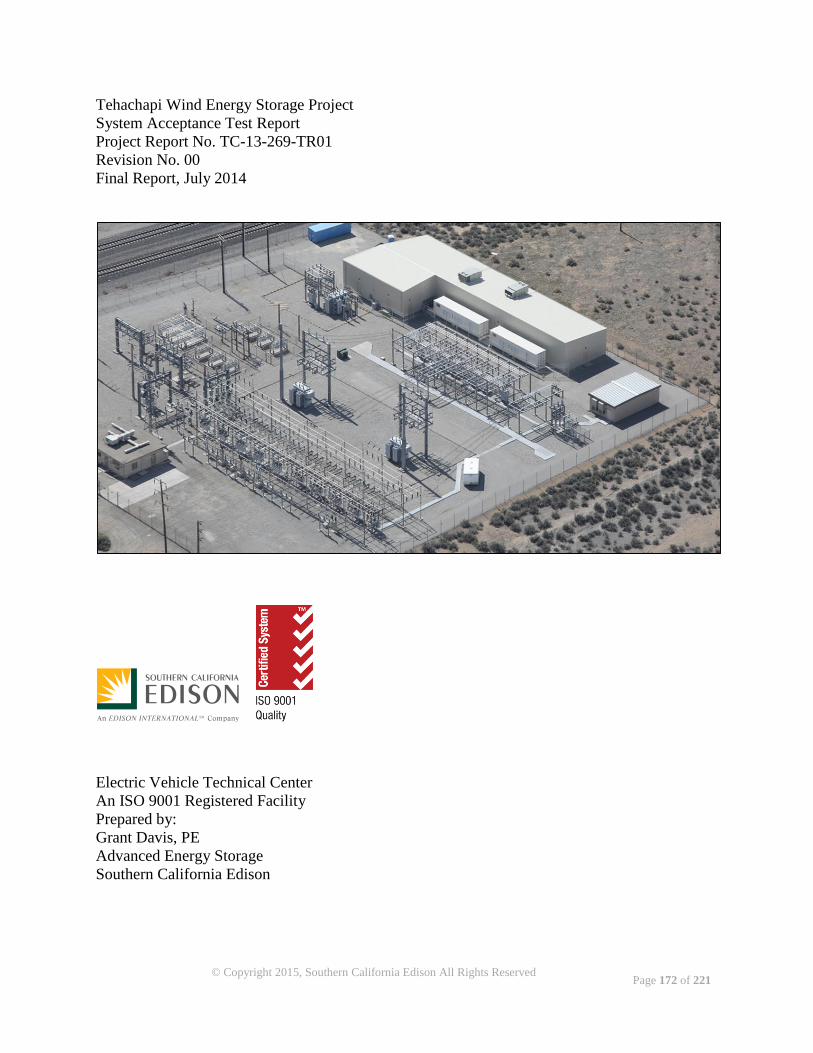
Page 172 of 221
© Copyright 2015, Southern California Edison All Rights Reserved
Tehachapi Wind Energy Storage Project
System Acceptance Test Report
Project Report No. TC-13-269-TR01
Revision No. 00
Final Report, July 2014
Electric Vehicle Technical Center
An ISO 9001 Registered Facility
Prepared by:
Grant Davis, PE
Advanced Energy Storage
Southern California Edison
Page 173 of 221
© Copyright 2015, Southern California Edison All Rights Reserved
DISCLAIMER OF WARRANTIES AND LIMITATION OF LIABILITIES
This report was prepared by the Advanced Technology Department of Southern California Edison
(SCE).
Neither SCE, nor any of its affiliates, makes any warranty, express or implied, or assumes any
legal liability or responsibility for the accuracy, completeness, or usefulness, of any information,
apparatus, or product or process disclosed herein or represents that its use will not infringe any
rights. Reference herein to any specific product, process, or service by trademark, name, and
manufacturer or otherwise does not constitute or imply endorsement, recommendation, or favoring
opinion of same by SCE or any of its affiliates. The views and opinions of the authors expressed
herein do not necessarily state or reflect those of SCE or any of its affiliates. Any
recommendations, opinions or findings stated in this report are based on circumstances and facts
upon which this report is based as they existed at the time SCE performed the evaluation. Any
changes in such circumstances and facts upon which this report is based may adversely affect any
recommendations, opinions or findings contained in this report.
Page 174 of 221
© Copyright 2015, Southern California Edison All Rights Reserved
TABLE OF CONTENTS
1.0 Introduction ......................................................................................................................... 175
2.0 Procedure and Instrumentation ........................................................................................... 175
3.0 Results and analysis ............................................................................................................ 176
3.1 CDRL 19 Section 6, Test Plan for BESS Power Accuracy ................................................ 176
3.2 CDRL 19 Section 7, Test Plan for BESS Reactive Power Tests ........................................ 178
3.3 CDRL 19 Section 8, Test Plan for BESS Capacity ............................................................ 179
3.4 CDRL 19 Section 9, Test Plan for BESS Ramp Rate Test ................................................. 181
3.5 CDRL 19 Section 10, Test Plan for Balancing Function Test ............................................ 182
3.6 CDRL 19 Section 11.1, Test 1, Steady State Voltage Regulation ...................................... 183
3.7 CDRL 19 Section 11.2, Test 3, Charge During High Line Load/Discharge During Low Line
Load ............................................................................................................................................ 184
3.8 CDRL 19 Section 11.3, Test 4, Charge Off-peak/Discharge On-peak ............................... 185
3.9 CDRL 19 Section 11.4, Test 5, Charge and Discharge as Needed for Grid Purposes ....... 187
3.10 CDRL 19 Section 11.5, EMS–GMS Transition.................................................................. 188
3.11 CDRL 19 Section 11.6, EMS and GMS Communication Fault Handling ......................... 189
3.12 CDRL 19 Section 12.1, Manual and ISO Power Dispatch ................................................. 190
4.0 Conclusion .......................................................................................................................... 191
4.1 Notable Items Related to Behaviors and Issues Observed During SAT ............................. 191
Appendix A. Report Approvals and Revisions ........................................................................... 192
LIST OF FIGURES
Figure 9-24. CDRL 19 Section 6, Test Plan for BESS Power Accuracy ................................... 177
Figure 9-25. CDRL 19 Section 7, Test Plan for BESS Reactive Power Tests ........................... 178
Figure 9-26. CDRL 19 Section 9, Test Plan for BESS Ramp Rate Test .................................... 181
Figure 9-27. CDRL 19 Section 10, Test Plan for Balancing Function Test ............................... 182
Figure 9-28. CDRL 19 Section 11.1, Test 1, Steady State Voltage Regulation ......................... 183
Figure 9-29. CDRL 19 Section 11.2, Test 3, Charge During High Line Load/Discharge During
Low Line Load ............................................................................................................................ 185
Figure 9-30. CDRL 19 Section 11.3, Test 4, Charge Off-peak/Discharge On-peak .................. 186
Figure 9-31. CDRL 19 Section 11.4, Test 5, Charge and Discharge as Needed for Grid Purposes
187
Figure 9-32. CDRL 19 Section 11.5, EMS–GMS Transition ..................................................... 188
Page 175 of 221
© Copyright 2015, Southern California Edison All Rights Reserved
Figure 9-33. CDRL 19 Section 11.6, EMS and GMS Communication Fault Handling ............ 189
Figure 9-34. CDRL 19 Section 12.1, Manual and ISO Power Dispatch .................................... 190
LIST OF TABLES
Table 9-18. Instruments and Accuracies ..................................................................................... 176
Table 9-19. Cumulative Accuracy .............................................................................................. 176
Table 9-20. CDRL 19 Section 8, Test Plan for BESS Capacity ................................................. 180
Table 9-21. Comparison of Manually Integrated and Instrument Calculated Energy ................ 180
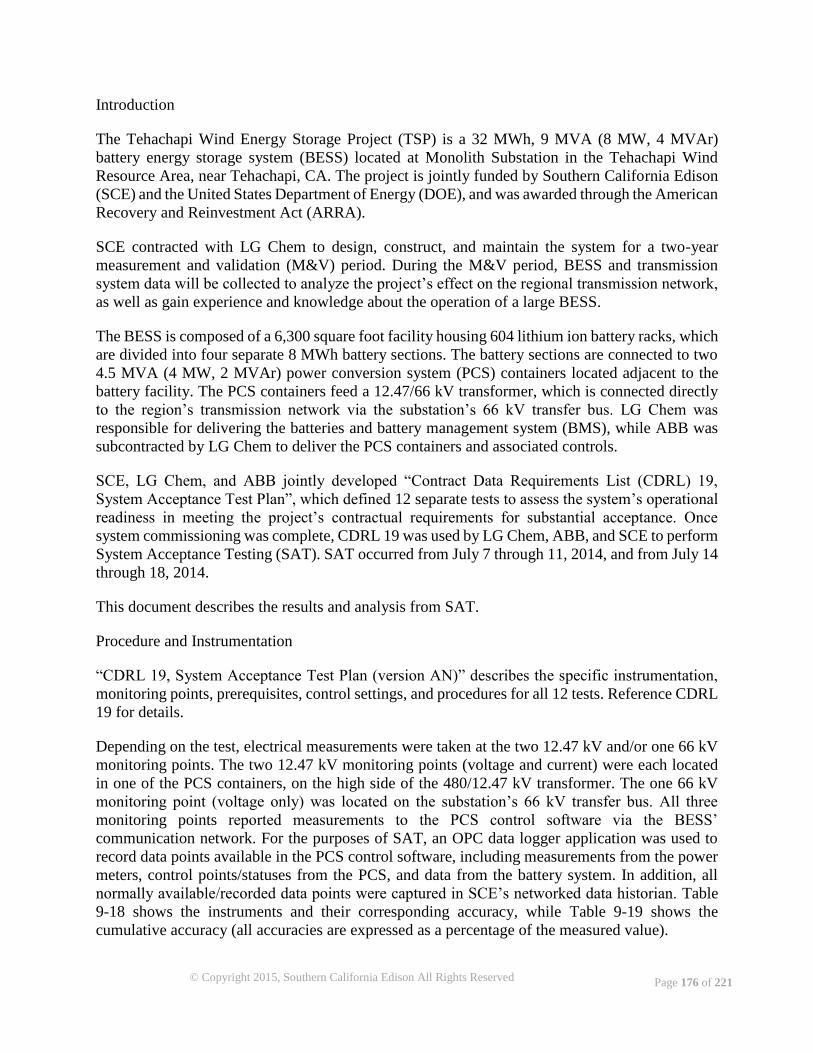
© Copyright 2015, Southern California Edison All Rights Reserved Page 176 of 221
Introduction
The Tehachapi Wind Energy Storage Project (TSP) is a 32 MWh, 9 MVA (8 MW, 4 MVAr)
battery energy storage system (BESS) located at Monolith Substation in the Tehachapi Wind
Resource Area, near Tehachapi, CA. The project is jointly funded by Southern California Edison
(SCE) and the United States Department of Energy (DOE), and was awarded through the American
Recovery and Reinvestment Act (ARRA).
SCE contracted with LG Chem to design, construct, and maintain the system for a two-year
measurement and validation (M&V) period. During the M&V period, BESS and transmission
system data will be collected to analyze the project’s effect on the regional transmission network,
as well as gain experience and knowledge about the operation of a large BESS.
The BESS is composed of a 6,300 square foot facility housing 604 lithium ion battery racks, which
are divided into four separate 8 MWh battery sections. The battery sections are connected to two
4.5 MVA (4 MW, 2 MVAr) power conversion system (PCS) containers located adjacent to the
battery facility. The PCS containers feed a 12.47/66 kV transformer, which is connected directly
to the region’s transmission network via the substation’s 66 kV transfer bus. LG Chem was
responsible for delivering the batteries and battery management system (BMS), while ABB was
subcontracted by LG Chem to deliver the PCS containers and associated controls.
SCE, LG Chem, and ABB jointly developed “Contract Data Requirements List (CDRL) 19,
System Acceptance Test Plan”, which defined 12 separate tests to assess the system’s operational
readiness in meeting the project’s contractual requirements for substantial acceptance. Once
system commissioning was complete, CDRL 19 was used by LG Chem, ABB, and SCE to perform
System Acceptance Testing (SAT). SAT occurred from July 7 through 11, 2014, and from July 14
through 18, 2014.
This document describes the results and analysis from SAT.
Procedure and Instrumentation
“CDRL 19, System Acceptance Test Plan (version AN)” describes the specific instrumentation,
monitoring points, prerequisites, control settings, and procedures for all 12 tests. Reference CDRL
19 for details.
Depending on the test, electrical measurements were taken at the two 12.47 kV and/or one 66 kV
monitoring points. The two 12.47 kV monitoring points (voltage and current) were each located
in one of the PCS containers, on the high side of the 480/12.47 kV transformer. The one 66 kV
monitoring point (voltage only) was located on the substation’s 66 kV transfer bus. All three
monitoring points reported measurements to the PCS control software via the BESS’
communication network. For the purposes of SAT, an OPC data logger application was used to
record data points available in the PCS control software, including measurements from the power
meters, control points/statuses from the PCS, and data from the battery system. In addition, all
normally available/recorded data points were captured in SCE’s networked data historian. Table
9-18 shows the instruments and their corresponding accuracy, while Table 9-19 shows the
cumulative accuracy (all accuracies are expressed as a percentage of the measured value).
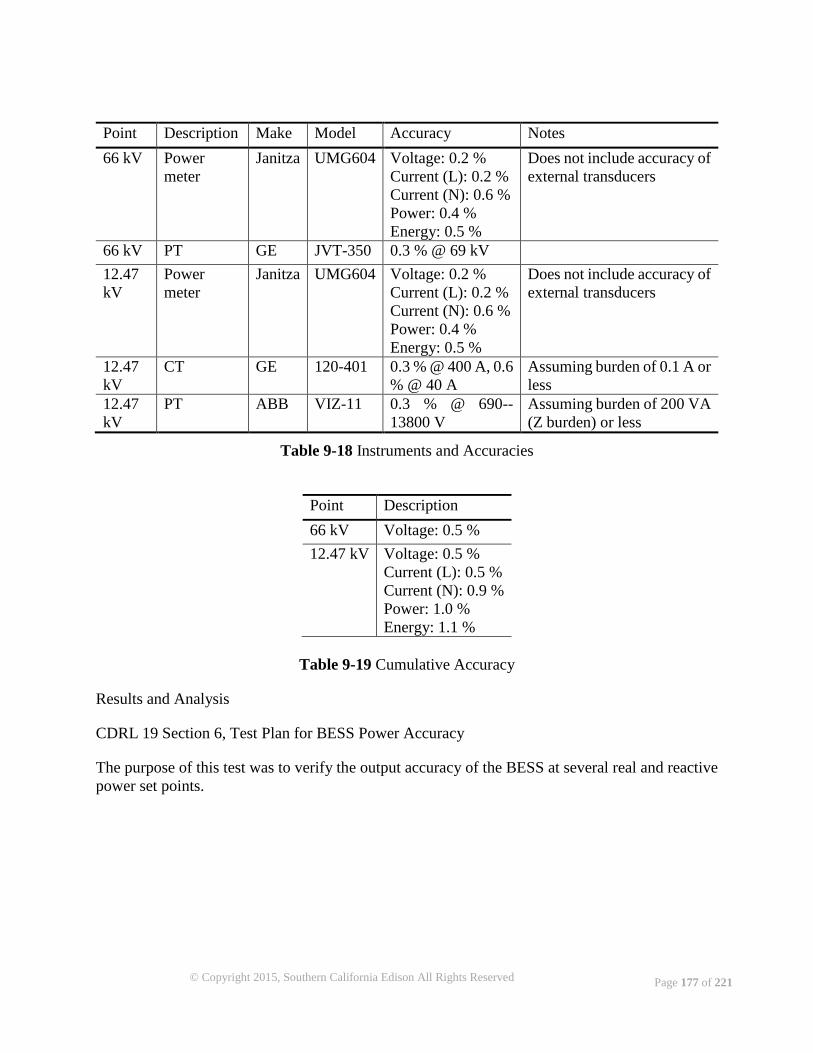
© Copyright 2015, Southern California Edison All Rights Reserved Page 177 of 221
Point Description Make Model Accuracy Notes
66 kV Power
meter
Janitza UMG604 Voltage: 0.2 %
Current (L): 0.2 %
Current (N): 0.6 %
Power: 0.4 %
Energy: 0.5 %
Does not include accuracy of
external transducers
66 kV PT GE JVT-350 0.3 % @ 69 kV
12.47
kV
Power
meter
Janitza UMG604 Voltage: 0.2 %
Current (L): 0.2 %
Current (N): 0.6 %
Power: 0.4 %
Energy: 0.5 %
Does not include accuracy of
external transducers
12.47
kV
CT GE 120-401 0.3 % @ 400 A, 0.6
% @ 40 A
Assuming burden of 0.1 A or
less
12.47
kV
PT ABB VIZ-11 0.3 % @ 690--
13800 V
Assuming burden of 200 VA
(Z burden) or less
Table 9-18 Instruments and Accuracies
Point Description
66 kV Voltage: 0.5 %
12.47 kV Voltage: 0.5 %
Current (L): 0.5 %
Current (N): 0.9 %
Power: 1.0 %
Energy: 1.1 %
Table 9-19 Cumulative Accuracy
Results and Analysis
CDRL 19 Section 6, Test Plan for BESS Power Accuracy
The purpose of this test was to verify the output accuracy of the BESS at several real and reactive
power set points.
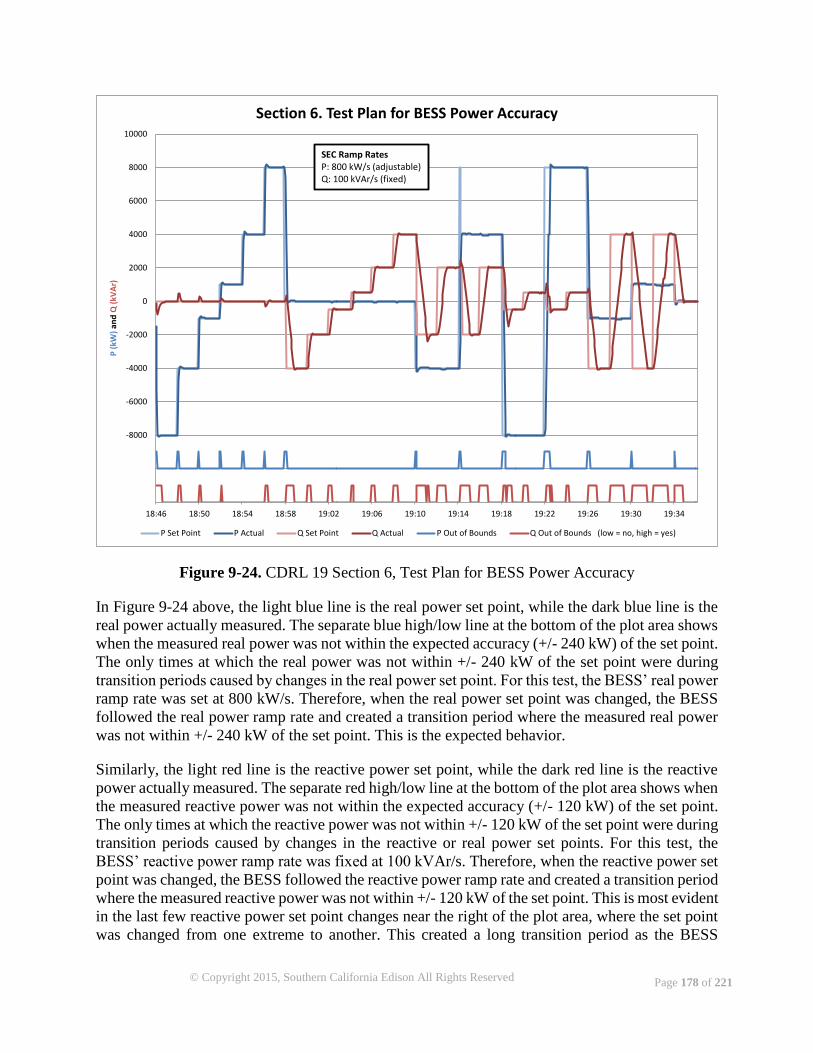
© Copyright 2015, Southern California Edison All Rights Reserved Page 178 of 221
Figure 9-24. CDRL 19 Section 6, Test Plan for BESS Power Accuracy
In Figure 9-24 above, the light blue line is the real power set point, while the dark blue line is the
real power actually measured. The separate blue high/low line at the bottom of the plot area shows
when the measured real power was not within the expected accuracy (+/- 240 kW) of the set point.
The only times at which the real power was not within +/- 240 kW of the set point were during
transition periods caused by changes in the real power set point. For this test, the BESS’ real power
ramp rate was set at 800 kW/s. Therefore, when the real power set point was changed, the BESS
followed the real power ramp rate and created a transition period where the measured real power
was not within +/- 240 kW of the set point. This is the expected behavior.
Similarly, the light red line is the reactive power set point, while the dark red line is the reactive
power actually measured. The separate red high/low line at the bottom of the plot area shows when
the measured reactive power was not within the expected accuracy (+/- 120 kW) of the set point.
The only times at which the reactive power was not within +/- 120 kW of the set point were during
transition periods caused by changes in the reactive or real power set points. For this test, the
BESS’ reactive power ramp rate was fixed at 100 kVAr/s. Therefore, when the reactive power set
point was changed, the BESS followed the reactive power ramp rate and created a transition period
where the measured reactive power was not within +/- 120 kW of the set point. This is most evident
in the last few reactive power set point changes near the right of the plot area, where the set point
was changed from one extreme to another. This created a long transition period as the BESS
-12000
-10000
-8000
-6000
-4000
-2000
0
2000
4000
6000
8000
10000
18:46 18:50 18:54 18:58 19:02 19:06 19:10 19:14 19:18 19:22 19:26 19:30 19:34
P (
kW)
and
Q (
kVA
r)Section 6. Test Plan for BESS Power Accuracy
P Set Point P Actual Q Set Point Q Actual P Out of Bounds Q Out of Bounds (low = no, high = yes)
SEC Ramp RatesP: 800 kW/s (adjustable)Q: 100 kVAr/s (fixed)
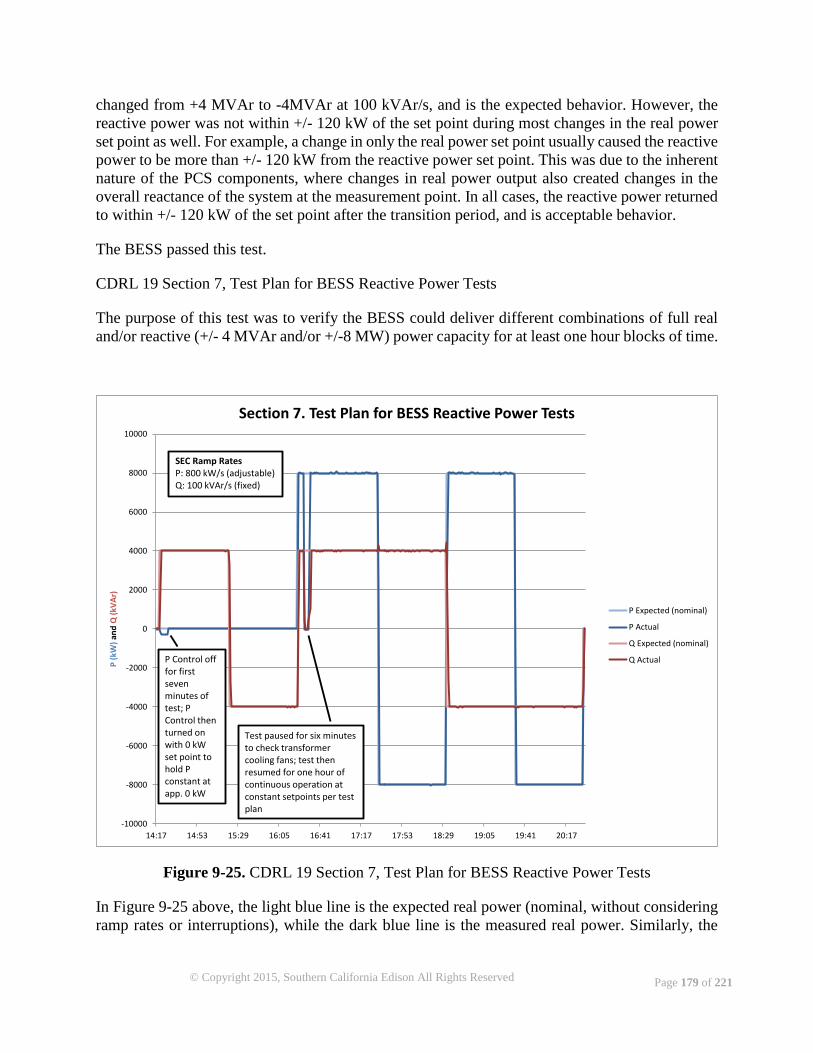
© Copyright 2015, Southern California Edison All Rights Reserved Page 179 of 221
changed from +4 MVAr to -4MVAr at 100 kVAr/s, and is the expected behavior. However, the
reactive power was not within +/- 120 kW of the set point during most changes in the real power
set point as well. For example, a change in only the real power set point usually caused the reactive
power to be more than +/- 120 kW from the reactive power set point. This was due to the inherent
nature of the PCS components, where changes in real power output also created changes in the
overall reactance of the system at the measurement point. In all cases, the reactive power returned
to within +/- 120 kW of the set point after the transition period, and is acceptable behavior.
The BESS passed this test.
CDRL 19 Section 7, Test Plan for BESS Reactive Power Tests
The purpose of this test was to verify the BESS could deliver different combinations of full real
and/or reactive (+/- 4 MVAr and/or +/-8 MW) power capacity for at least one hour blocks of time.
Figure 9-25. CDRL 19 Section 7, Test Plan for BESS Reactive Power Tests
In Figure 9-25 above, the light blue line is the expected real power (nominal, without considering
ramp rates or interruptions), while the dark blue line is the measured real power. Similarly, the
-10000
-8000
-6000
-4000
-2000
0
2000
4000
6000
8000
10000
14:17 14:53 15:29 16:05 16:41 17:17 17:53 18:29 19:05 19:41 20:17
P (
kW)
and
Q (
kVA
r)
Section 7. Test Plan for BESS Reactive Power Tests
P Expected (nominal)
P Actual
Q Expected (nominal)
Q Actual
SEC Ramp RatesP: 800 kW/s (adjustable)Q: 100 kVAr/s (fixed)
Test paused for six minutes to check transformer cooling fans; test then resumed for one hour of continuous operation at constant setpoints per test plan
P Control offfor first seven minutes of test; P Control then turned on with 0 kW set point to hold P constant at app. 0 kW
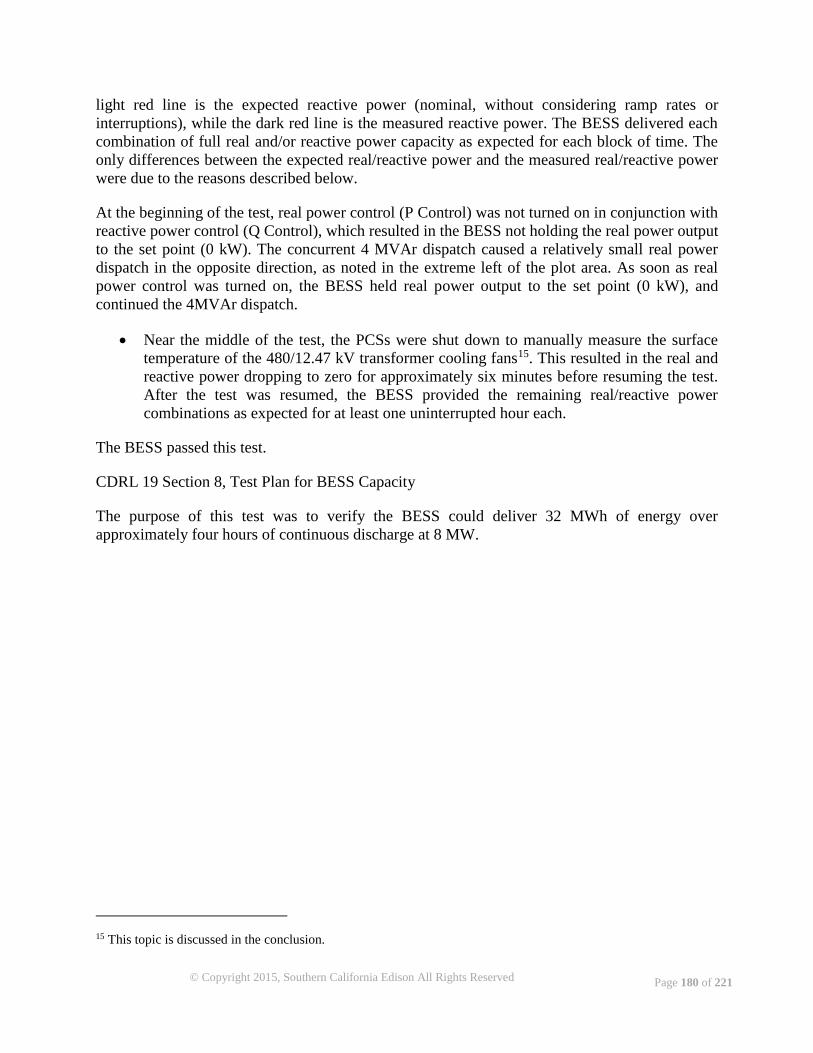
© Copyright 2015, Southern California Edison All Rights Reserved Page 180 of 221
light red line is the expected reactive power (nominal, without considering ramp rates or
interruptions), while the dark red line is the measured reactive power. The BESS delivered each
combination of full real and/or reactive power capacity as expected for each block of time. The
only differences between the expected real/reactive power and the measured real/reactive power
were due to the reasons described below.
At the beginning of the test, real power control (P Control) was not turned on in conjunction with
reactive power control (Q Control), which resulted in the BESS not holding the real power output
to the set point (0 kW). The concurrent 4 MVAr dispatch caused a relatively small real power
dispatch in the opposite direction, as noted in the extreme left of the plot area. As soon as real
power control was turned on, the BESS held real power output to the set point (0 kW), and
continued the 4MVAr dispatch.
Near the middle of the test, the PCSs were shut down to manually measure the surface
temperature of the 480/12.47 kV transformer cooling fans15. This resulted in the real and
reactive power dropping to zero for approximately six minutes before resuming the test.
After the test was resumed, the BESS provided the remaining real/reactive power
combinations as expected for at least one uninterrupted hour each.
The BESS passed this test.
CDRL 19 Section 8, Test Plan for BESS Capacity
The purpose of this test was to verify the BESS could deliver 32 MWh of energy over
approximately four hours of continuous discharge at 8 MW.
15 This topic is discussed in the conclusion.
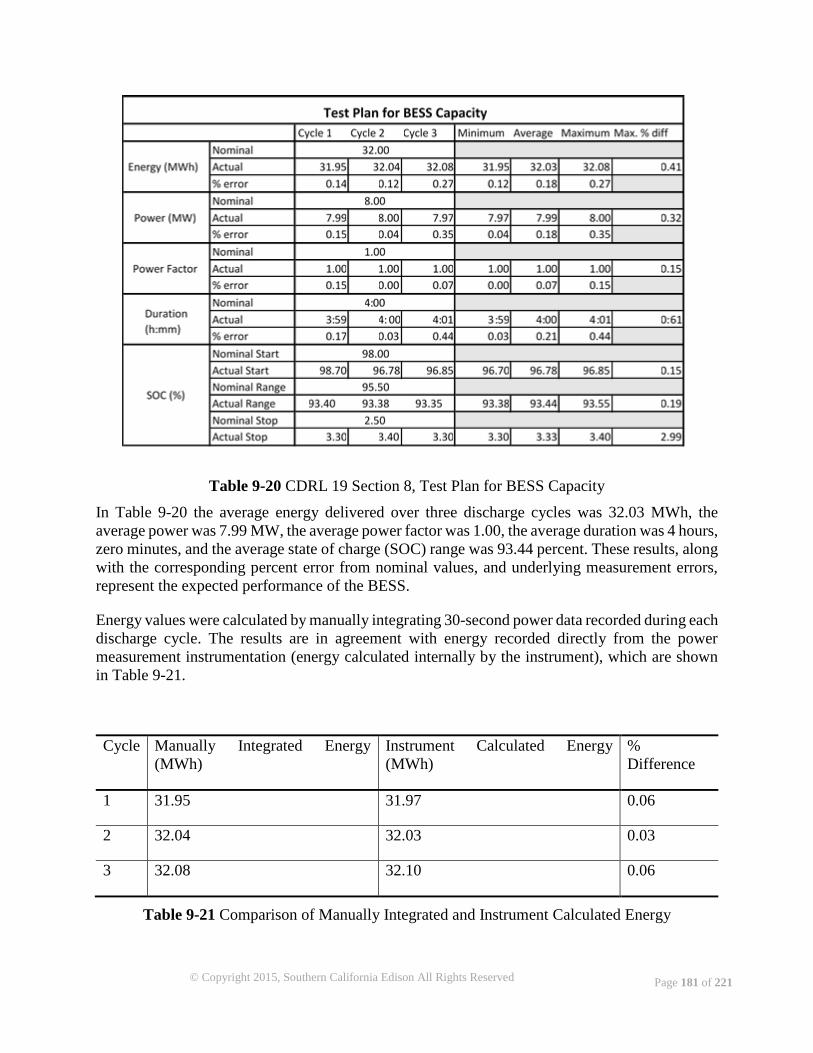
© Copyright 2015, Southern California Edison All Rights Reserved Page 181 of 221
Table 9-20 CDRL 19 Section 8, Test Plan for BESS Capacity
In Table 9-20 the average energy delivered over three discharge cycles was 32.03 MWh, the
average power was 7.99 MW, the average power factor was 1.00, the average duration was 4 hours,
zero minutes, and the average state of charge (SOC) range was 93.44 percent. These results, along
with the corresponding percent error from nominal values, and underlying measurement errors,
represent the expected performance of the BESS.
Energy values were calculated by manually integrating 30-second power data recorded during each
discharge cycle. The results are in agreement with energy recorded directly from the power
measurement instrumentation (energy calculated internally by the instrument), which are shown
in Table 9-21.
Cycle Manually Integrated Energy
(MWh)
Instrument Calculated Energy
(MWh)
%
Difference
1 31.95 31.97 0.06
2 32.04 32.03 0.03
3 32.08 32.10 0.06
Table 9-21 Comparison of Manually Integrated and Instrument Calculated Energy
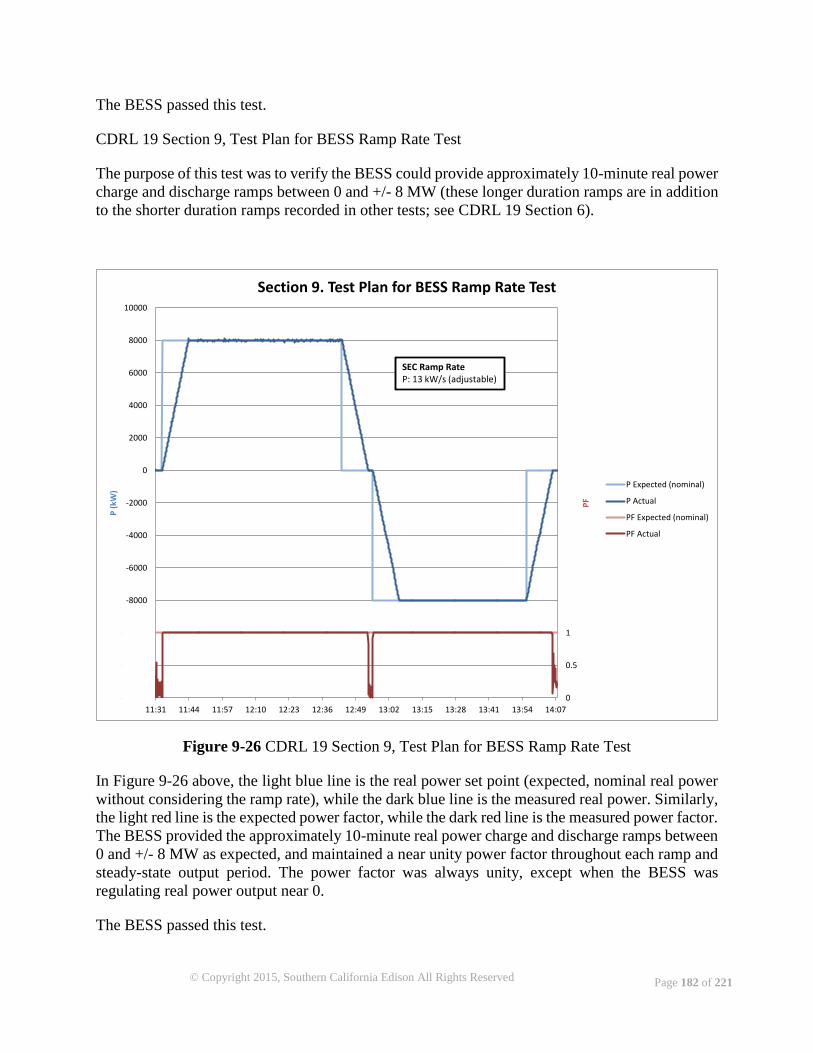
© Copyright 2015, Southern California Edison All Rights Reserved Page 182 of 221
The BESS passed this test.
CDRL 19 Section 9, Test Plan for BESS Ramp Rate Test
The purpose of this test was to verify the BESS could provide approximately 10-minute real power
charge and discharge ramps between 0 and +/- 8 MW (these longer duration ramps are in addition
to the shorter duration ramps recorded in other tests; see CDRL 19 Section 6).
Figure 9-26 CDRL 19 Section 9, Test Plan for BESS Ramp Rate Test
In Figure 9-26 above, the light blue line is the real power set point (expected, nominal real power
without considering the ramp rate), while the dark blue line is the measured real power. Similarly,
the light red line is the expected power factor, while the dark red line is the measured power factor.
The BESS provided the approximately 10-minute real power charge and discharge ramps between
0 and +/- 8 MW as expected, and maintained a near unity power factor throughout each ramp and
steady-state output period. The power factor was always unity, except when the BESS was
regulating real power output near 0.
The BESS passed this test.
0
0.5
1
1.5
2
2.5
3
3.5
4
4.5
5
5.5
6
-14000
-12000
-10000
-8000
-6000
-4000
-2000
0
2000
4000
6000
8000
10000
11:31 11:44 11:57 12:10 12:23 12:36 12:49 13:02 13:15 13:28 13:41 13:54 14:07
PF
P (
kW)
Section 9. Test Plan for BESS Ramp Rate Test
P Expected (nominal)
P Actual
PF Expected (nominal)
PF Actual
SEC Ramp RateP: 13 kW/s (adjustable)
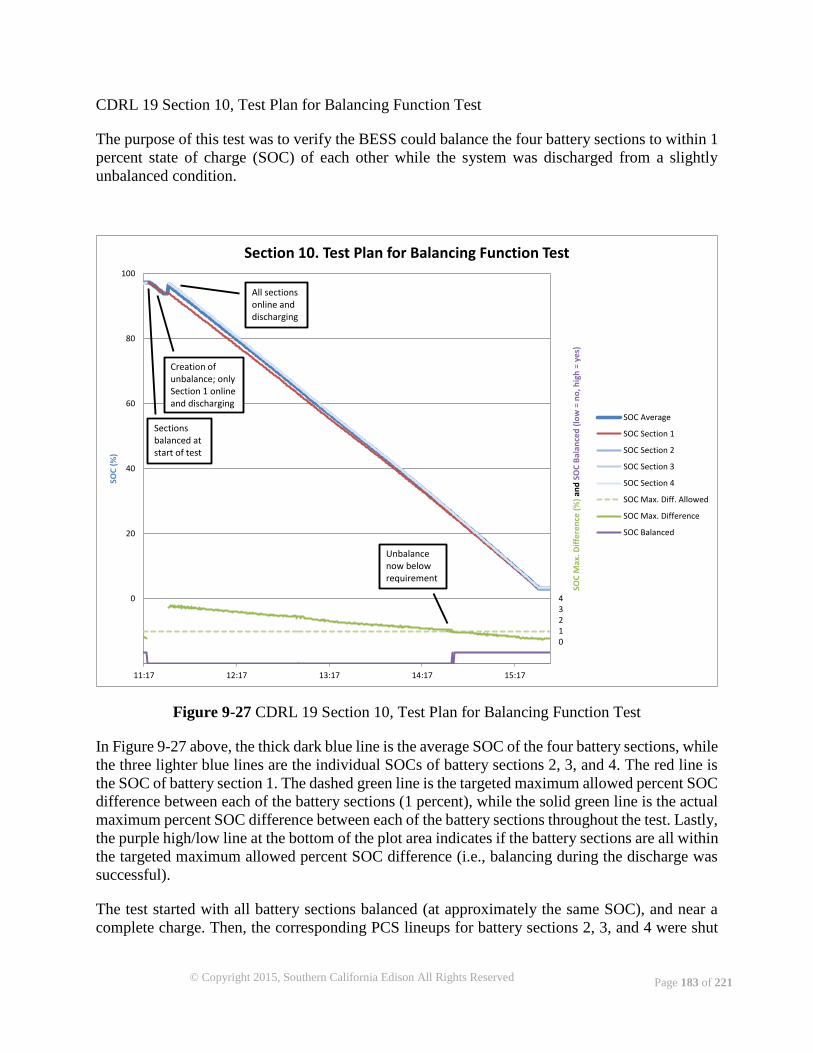
© Copyright 2015, Southern California Edison All Rights Reserved Page 183 of 221
CDRL 19 Section 10, Test Plan for Balancing Function Test
The purpose of this test was to verify the BESS could balance the four battery sections to within 1
percent state of charge (SOC) of each other while the system was discharged from a slightly
unbalanced condition.
Figure 9-27 CDRL 19 Section 10, Test Plan for Balancing Function Test
In Figure 9-27 above, the thick dark blue line is the average SOC of the four battery sections, while
the three lighter blue lines are the individual SOCs of battery sections 2, 3, and 4. The red line is
the SOC of battery section 1. The dashed green line is the targeted maximum allowed percent SOC
difference between each of the battery sections (1 percent), while the solid green line is the actual
maximum percent SOC difference between each of the battery sections throughout the test. Lastly,
the purple high/low line at the bottom of the plot area indicates if the battery sections are all within
the targeted maximum allowed percent SOC difference (i.e., balancing during the discharge was
successful).
The test started with all battery sections balanced (at approximately the same SOC), and near a
complete charge. Then, the corresponding PCS lineups for battery sections 2, 3, and 4 were shut
-2-1012345678910111213141516171819202122232425262728293031323334
-20
0
20
40
60
80
100
11:17 12:17 13:17 14:17 15:17
SOC
Max
. Dif
fere
nce
(%
) an
dSO
C B
alan
ced
(lo
w =
no
, hig
h =
ye
s)
SOC
(%
)
Section 10. Test Plan for Balancing Function Test
SOC Average
SOC Section 1
SOC Section 2
SOC Section 3
SOC Section 4
SOC Max. Diff. Allowed
SOC Max. Difference
SOC Balanced
Sectionsbalanced at start of test
Creation of unbalance; only Section 1 online and discharging
All sections online and discharging
Unbalance now below requirement
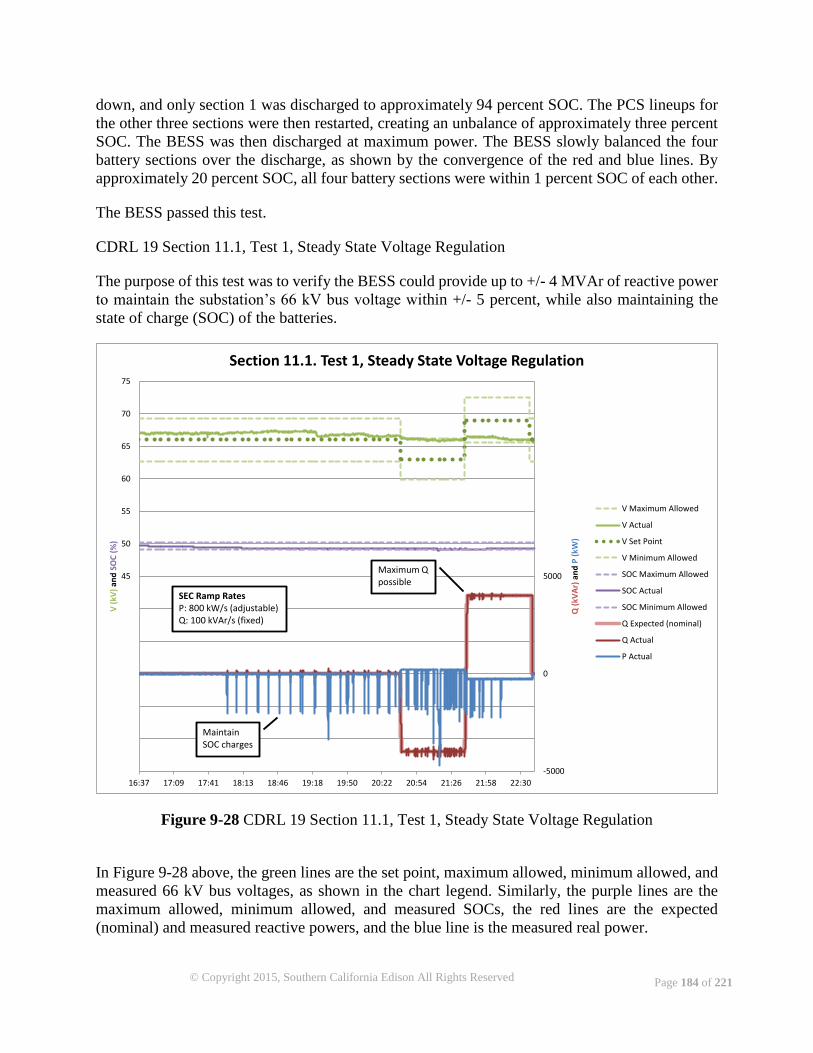
© Copyright 2015, Southern California Edison All Rights Reserved Page 184 of 221
down, and only section 1 was discharged to approximately 94 percent SOC. The PCS lineups for
the other three sections were then restarted, creating an unbalance of approximately three percent
SOC. The BESS was then discharged at maximum power. The BESS slowly balanced the four
battery sections over the discharge, as shown by the convergence of the red and blue lines. By
approximately 20 percent SOC, all four battery sections were within 1 percent SOC of each other.
The BESS passed this test.
CDRL 19 Section 11.1, Test 1, Steady State Voltage Regulation
The purpose of this test was to verify the BESS could provide up to +/- 4 MVAr of reactive power
to maintain the substation’s 66 kV bus voltage within +/- 5 percent, while also maintaining the
state of charge (SOC) of the batteries.
Figure 9-28 CDRL 19 Section 11.1, Test 1, Steady State Voltage Regulation
In Figure 9-28 above, the green lines are the set point, maximum allowed, minimum allowed, and
measured 66 kV bus voltages, as shown in the chart legend. Similarly, the purple lines are the
maximum allowed, minimum allowed, and measured SOCs, the red lines are the expected
(nominal) and measured reactive powers, and the blue line is the measured real power.
-5000
0
5000
10000
15000
15
20
25
30
35
40
45
50
55
60
65
70
75
16:37 17:09 17:41 18:13 18:46 19:18 19:50 20:22 20:54 21:26 21:58 22:30
Q (
kVA
r)an
d P
(kW
)
V (
kV)
and
SO
C (
%)
Section 11.1. Test 1, Steady State Voltage Regulation
V Maximum Allowed
V Actual
V Set Point
V Minimum Allowed
SOC Maximum Allowed
SOC Actual
SOC Minimum Allowed
Q Expected (nominal)
Q Actual
P Actual
SEC Ramp RatesP: 800 kW/s (adjustable)Q: 100 kVAr/s (fixed)
Maximum Q possible
Maintain SOC charges

© Copyright 2015, Southern California Edison All Rights Reserved Page 185 of 221
For the first four hours of the test, the voltage set point was set at 66 kV, and the measured voltage
remained well within the maximum/minimum allowed voltages. As a result, the system remained
idle, except for an occasional real power charge to maintain the battery SOC (as seen in the
measured SOC dropping to the minimum allowed SOC, and the subsequent pulses of real power).
For the fifth hour of the test, the voltage set point was intentionally lowered to 63 kV, which placed
the measured voltage above the maximum allowed voltage. This triggered a full -4 MVAr dispatch
in an attempt to lower the bus voltage. As shown in the measured voltage, this action may have
very slightly lowered the 66 kV bus voltage from where it otherwise would have trended.
Similarly, for the sixth and final hour of the test, the voltage set point was intentionally raised to
69 kV, which placed the measured voltage below the minimum allowed voltage. This triggered a
full +4 MVAr dispatch in an attempt to raise the bus voltage. As shown in the measured voltage,
this action may have very slightly raised the 66 kV bus voltage from where it otherwise would
have trended.
Due to existing conditions and characteristics of the substation’s 66 kV bus, the first four hours of
the test didn’t demonstrate the BESS’ voltage regulation function. Similarly, the behavior for the
last two hours of the test was intentionally induced, and the BESS still had negligible impact on
the bus voltage. Regardless, the BESS exhibited the expected behavior for the existing conditions
and characteristics of the bus.
The BESS passed this test.
CDRL 19 Section 11.2, Test 3, Charge during High Line Load/Discharge during Low Line Load
The purpose of this test was to verify the BESS could charge during periods of high line loading
and discharge during periods of low line loading16 per the algorithm defined in system
documentation and implemented in the control software.
16 The BESS is upstream of bottlenecks in transmission system capacity.
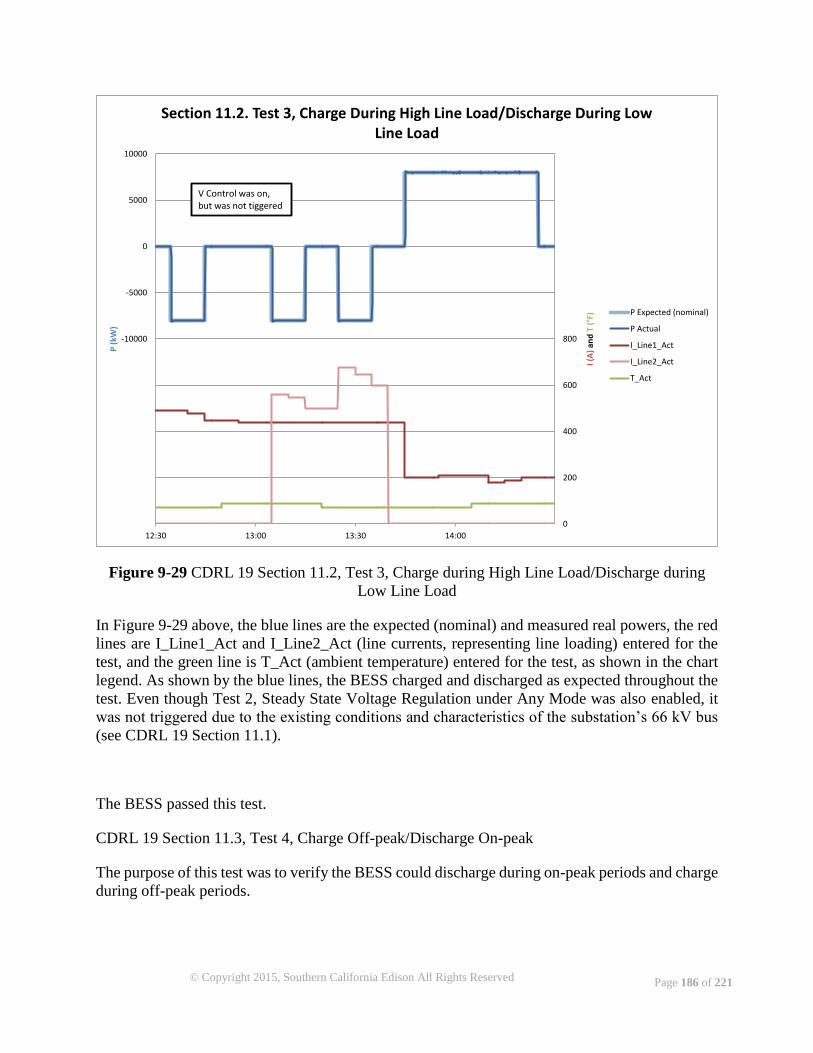
© Copyright 2015, Southern California Edison All Rights Reserved Page 186 of 221
Figure 9-29 CDRL 19 Section 11.2, Test 3, Charge during High Line Load/Discharge during
Low Line Load
In Figure 9-29 above, the blue lines are the expected (nominal) and measured real powers, the red
lines are I_Line1_Act and I_Line2_Act (line currents, representing line loading) entered for the
test, and the green line is T_Act (ambient temperature) entered for the test, as shown in the chart
legend. As shown by the blue lines, the BESS charged and discharged as expected throughout the
test. Even though Test 2, Steady State Voltage Regulation under Any Mode was also enabled, it
was not triggered due to the existing conditions and characteristics of the substation’s 66 kV bus
(see CDRL 19 Section 11.1).
The BESS passed this test.
CDRL 19 Section 11.3, Test 4, Charge Off-peak/Discharge On-peak
The purpose of this test was to verify the BESS could discharge during on-peak periods and charge
during off-peak periods.
0
200
400
600
800
1000
1200
1400
1600
-30000
-25000
-20000
-15000
-10000
-5000
0
5000
10000
12:30 13:00 13:30 14:00
I (A
)an
d T
(°F
)
P (
kW)
Section 11.2. Test 3, Charge During High Line Load/Discharge During Low Line Load
P Expected (nominal)
P Actual
I_Line1_Act
I_Line2_Act
T_Act
V Control was on,but was not tiggered
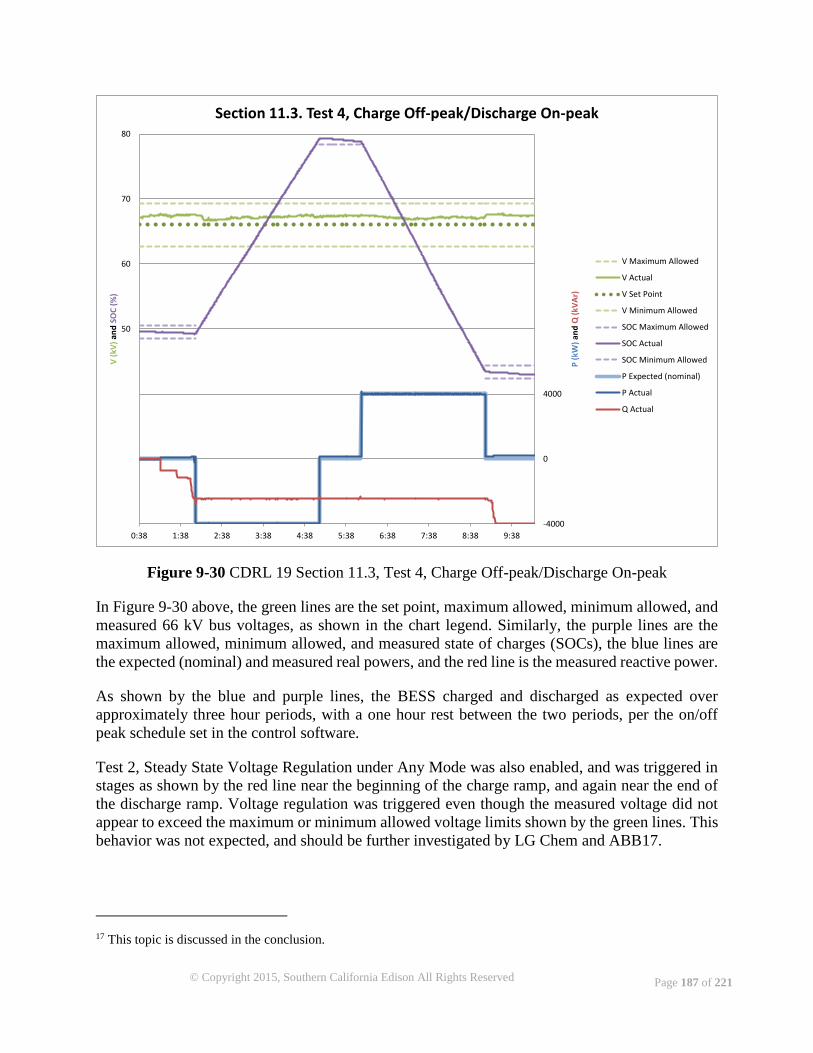
© Copyright 2015, Southern California Edison All Rights Reserved Page 187 of 221
Figure 9-30 CDRL 19 Section 11.3, Test 4, Charge Off-peak/Discharge On-peak
In Figure 9-30 above, the green lines are the set point, maximum allowed, minimum allowed, and
measured 66 kV bus voltages, as shown in the chart legend. Similarly, the purple lines are the
maximum allowed, minimum allowed, and measured state of charges (SOCs), the blue lines are
the expected (nominal) and measured real powers, and the red line is the measured reactive power.
As shown by the blue and purple lines, the BESS charged and discharged as expected over
approximately three hour periods, with a one hour rest between the two periods, per the on/off
peak schedule set in the control software.
Test 2, Steady State Voltage Regulation under Any Mode was also enabled, and was triggered in
stages as shown by the red line near the beginning of the charge ramp, and again near the end of
the discharge ramp. Voltage regulation was triggered even though the measured voltage did not
appear to exceed the maximum or minimum allowed voltage limits shown by the green lines. This
behavior was not expected, and should be further investigated by LG Chem and ABB17.
17 This topic is discussed in the conclusion.
-4000
0
4000
8000
12000
16000
20000
20
30
40
50
60
70
80
0:38 1:38 2:38 3:38 4:38 5:38 6:38 7:38 8:38 9:38
P (
kW)
and
Q (
kVA
r)
V (
kV)
and
SO
C (
%)
Section 11.3. Test 4, Charge Off-peak/Discharge On-peak
V Maximum Allowed
V Actual
V Set Point
V Minimum Allowed
SOC Maximum Allowed
SOC Actual
SOC Minimum Allowed
P Expected (nominal)
P Actual
Q Actual
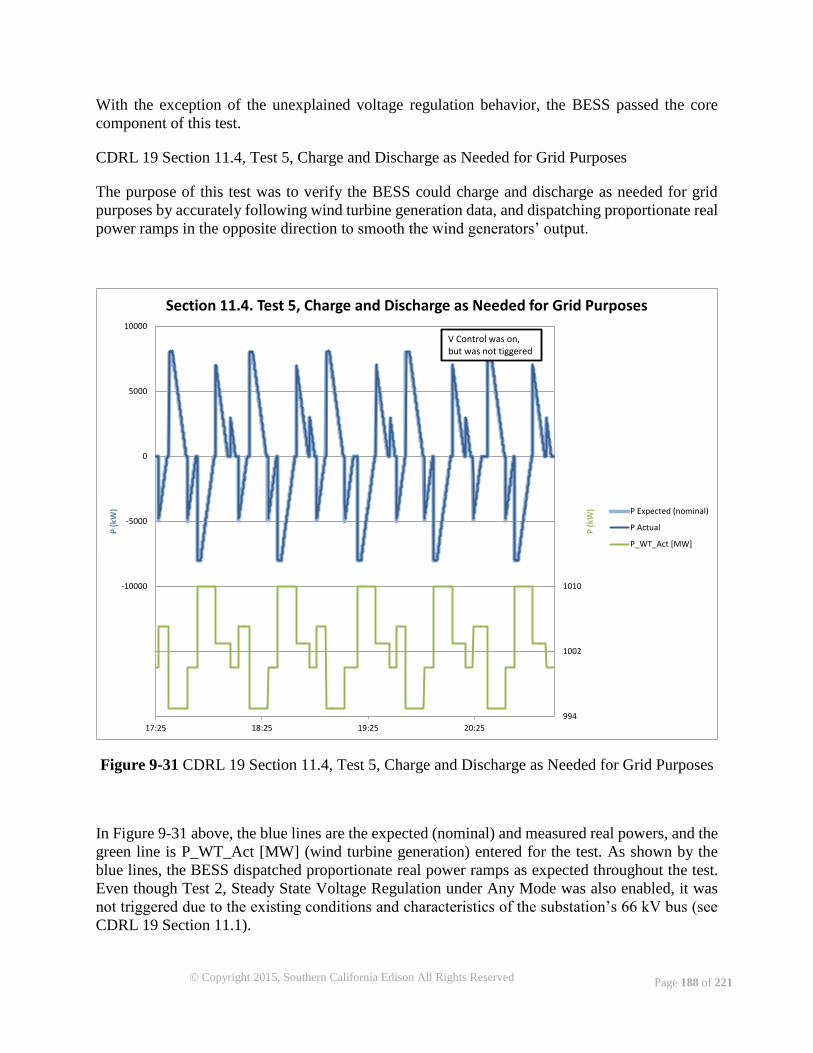
© Copyright 2015, Southern California Edison All Rights Reserved Page 188 of 221
With the exception of the unexplained voltage regulation behavior, the BESS passed the core
component of this test.
CDRL 19 Section 11.4, Test 5, Charge and Discharge as Needed for Grid Purposes
The purpose of this test was to verify the BESS could charge and discharge as needed for grid
purposes by accurately following wind turbine generation data, and dispatching proportionate real
power ramps in the opposite direction to smooth the wind generators’ output.
Figure 9-31 CDRL 19 Section 11.4, Test 5, Charge and Discharge as Needed for Grid Purposes
In Figure 9-31 above, the blue lines are the expected (nominal) and measured real powers, and the
green line is P_WT_Act [MW] (wind turbine generation) entered for the test. As shown by the
blue lines, the BESS dispatched proportionate real power ramps as expected throughout the test.
Even though Test 2, Steady State Voltage Regulation under Any Mode was also enabled, it was
not triggered due to the existing conditions and characteristics of the substation’s 66 kV bus (see
CDRL 19 Section 11.1).
994
1002
1010
1018
1026
1034
1042
-20000
-15000
-10000
-5000
0
5000
10000
17:25 18:25 19:25 20:25
P (
kW)
P (
kW)
Section 11.4. Test 5, Charge and Discharge as Needed for Grid Purposes
P Expected (nominal)
P Actual
P_WT_Act [MW]
V Control was on,but was not tiggered
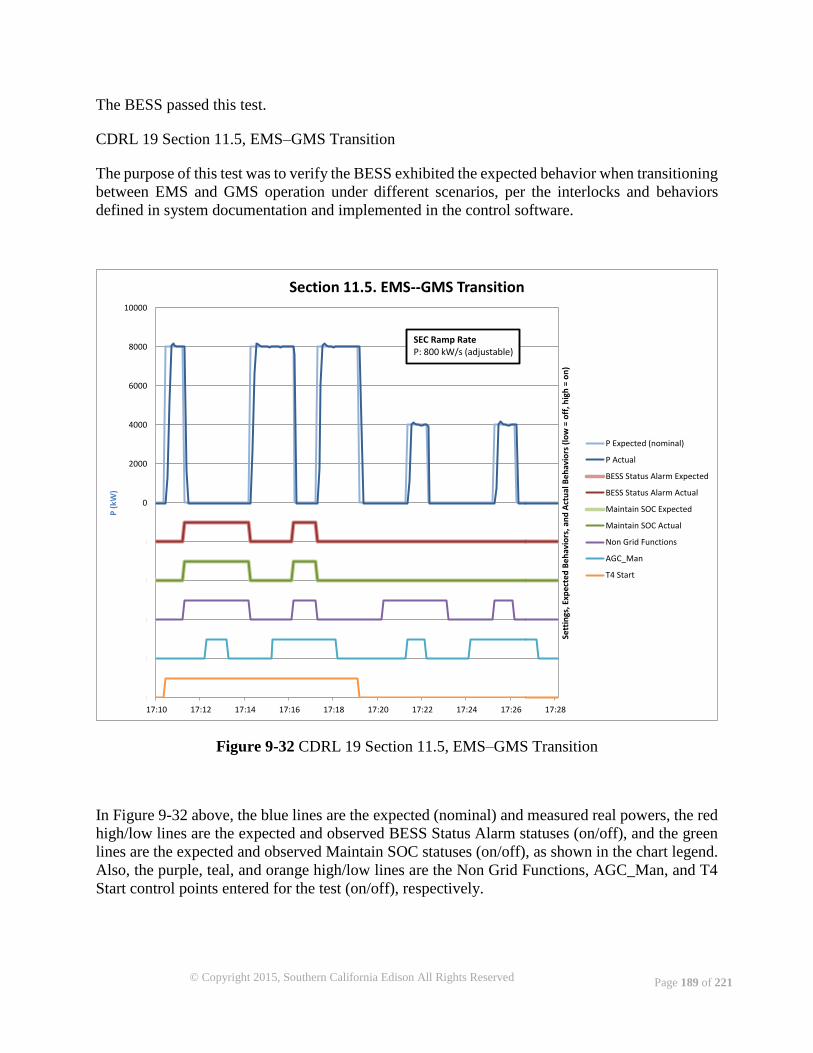
© Copyright 2015, Southern California Edison All Rights Reserved Page 189 of 221
The BESS passed this test.
CDRL 19 Section 11.5, EMS–GMS Transition
The purpose of this test was to verify the BESS exhibited the expected behavior when transitioning
between EMS and GMS operation under different scenarios, per the interlocks and behaviors
defined in system documentation and implemented in the control software.
Figure 9-32 CDRL 19 Section 11.5, EMS–GMS Transition
In Figure 9-32 above, the blue lines are the expected (nominal) and measured real powers, the red
high/low lines are the expected and observed BESS Status Alarm statuses (on/off), and the green
lines are the expected and observed Maintain SOC statuses (on/off), as shown in the chart legend.
Also, the purple, teal, and orange high/low lines are the Non Grid Functions, AGC_Man, and T4
Start control points entered for the test (on/off), respectively.
-10000
-8000
-6000
-4000
-2000
0
2000
4000
6000
8000
10000
17:10 17:12 17:14 17:16 17:18 17:20 17:22 17:24 17:26 17:28
Sett
ings
, Exp
ect
ed
Be
hav
iors
, an
d A
ctu
al B
eh
avio
rs (
low
= o
ff, h
igh
= o
n)
P (
kW)
Section 11.5. EMS--GMS Transition
P Expected (nominal)
P Actual
BESS Status Alarm Expected
BESS Status Alarm Actual
Maintain SOC Expected
Maintain SOC Actual
Non Grid Functions
AGC_Man
T4 Start
SEC Ramp RateP: 800 kW/s (adjustable)
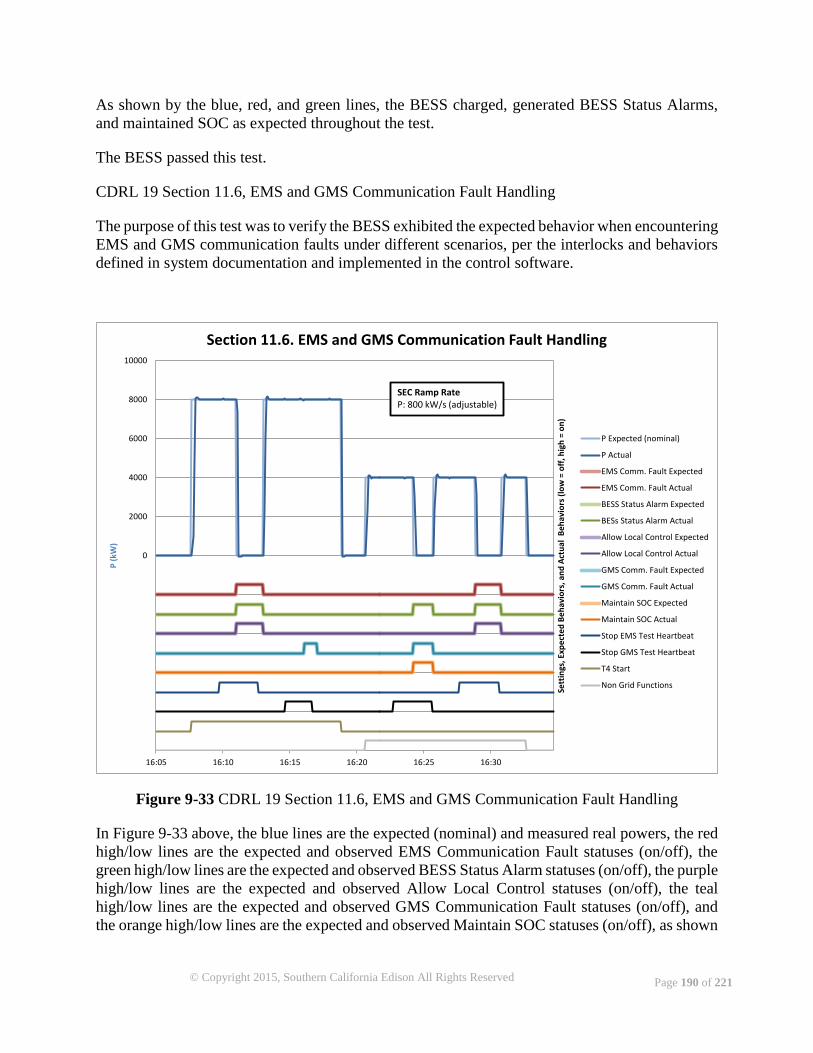
© Copyright 2015, Southern California Edison All Rights Reserved Page 190 of 221
As shown by the blue, red, and green lines, the BESS charged, generated BESS Status Alarms,
and maintained SOC as expected throughout the test.
The BESS passed this test.
CDRL 19 Section 11.6, EMS and GMS Communication Fault Handling
The purpose of this test was to verify the BESS exhibited the expected behavior when encountering
EMS and GMS communication faults under different scenarios, per the interlocks and behaviors
defined in system documentation and implemented in the control software.
Figure 9-33 CDRL 19 Section 11.6, EMS and GMS Communication Fault Handling
In Figure 9-33 above, the blue lines are the expected (nominal) and measured real powers, the red
high/low lines are the expected and observed EMS Communication Fault statuses (on/off), the
green high/low lines are the expected and observed BESS Status Alarm statuses (on/off), the purple
high/low lines are the expected and observed Allow Local Control statuses (on/off), the teal
high/low lines are the expected and observed GMS Communication Fault statuses (on/off), and
the orange high/low lines are the expected and observed Maintain SOC statuses (on/off), as shown
-10000
-8000
-6000
-4000
-2000
0
2000
4000
6000
8000
10000
16:05 16:10 16:15 16:20 16:25 16:30
Sett
ings
, Exp
ect
ed
Be
hav
iors
, an
d A
ctu
al B
eh
avio
rs (
low
= o
ff, h
igh
= o
n)
P (
kW)
Section 11.6. EMS and GMS Communication Fault Handling
P Expected (nominal)
P Actual
EMS Comm. Fault Expected
EMS Comm. Fault Actual
BESS Status Alarm Expected
BESs Status Alarm Actual
Allow Local Control Expected
Allow Local Control Actual
GMS Comm. Fault Expected
GMS Comm. Fault Actual
Maintain SOC Expected
Maintain SOC Actual
Stop EMS Test Heartbeat
Stop GMS Test Heartbeat
T4 Start
Non Grid Functions
SEC Ramp RateP: 800 kW/s (adjustable)
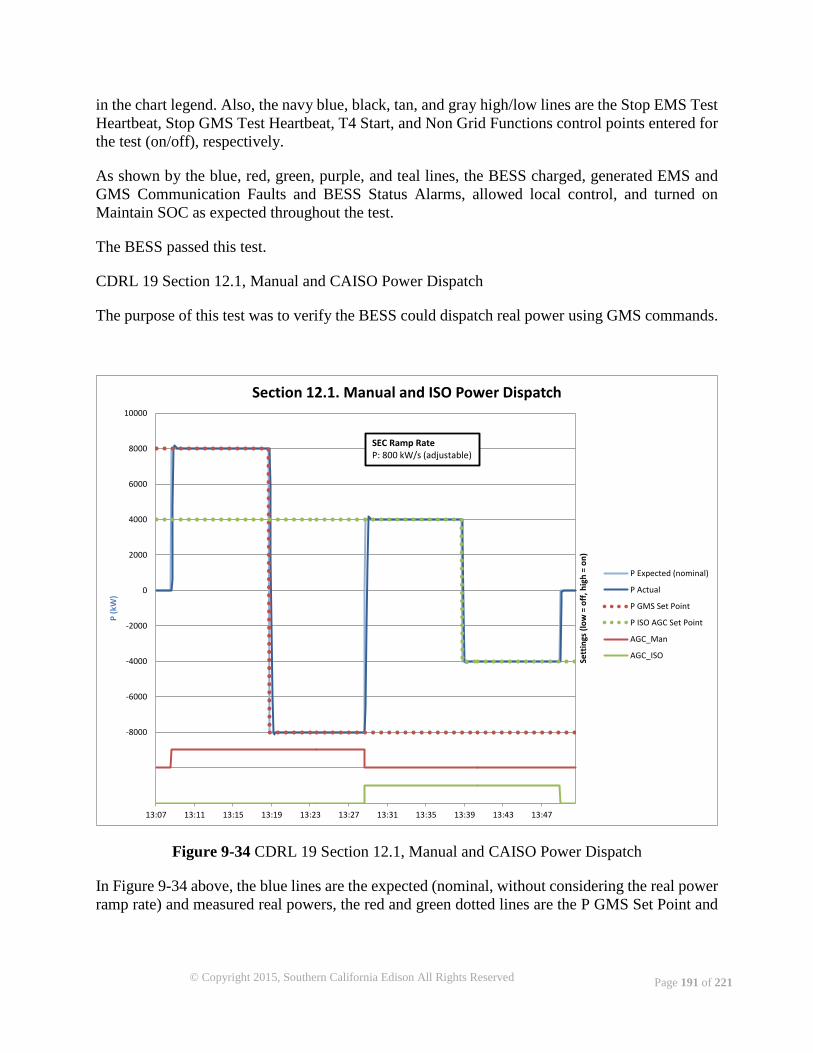
© Copyright 2015, Southern California Edison All Rights Reserved Page 191 of 221
in the chart legend. Also, the navy blue, black, tan, and gray high/low lines are the Stop EMS Test
Heartbeat, Stop GMS Test Heartbeat, T4 Start, and Non Grid Functions control points entered for
the test (on/off), respectively.
As shown by the blue, red, green, purple, and teal lines, the BESS charged, generated EMS and
GMS Communication Faults and BESS Status Alarms, allowed local control, and turned on
Maintain SOC as expected throughout the test.
The BESS passed this test.
CDRL 19 Section 12.1, Manual and CAISO Power Dispatch
The purpose of this test was to verify the BESS could dispatch real power using GMS commands.
Figure 9-34 CDRL 19 Section 12.1, Manual and CAISO Power Dispatch
In Figure 9-34 above, the blue lines are the expected (nominal, without considering the real power
ramp rate) and measured real powers, the red and green dotted lines are the P GMS Set Point and
-12000
-10000
-8000
-6000
-4000
-2000
0
2000
4000
6000
8000
10000
13:07 13:11 13:15 13:19 13:23 13:27 13:31 13:35 13:39 13:43 13:47
Sett
ings
(lo
w =
off
, hig
h =
on
)
P (
kW)
Section 12.1. Manual and ISO Power Dispatch
P Expected (nominal)
P Actual
P GMS Set Point
P ISO AGC Set Point
AGC_Man
AGC_ISO
SEC Ramp RateP: 800 kW/s (adjustable)
© Copyright 2015, Southern California Edison All Rights Reserved Page 192 of 221
P CAISO AGC Set Point entered for the test, respectively, and the red and green solid high/low
lines are the AGC_Man and AGC_CAISO control points entered for the test (on/off), respectively.
As shown by the blue lines, the BESS charged and discharged as expected throughout the test.
The BESS passed this test.
Conclusion
Throughout SAT, the BESS largely exhibited the expected behavior and passed each test. With
the successful completion of SAT, SCE hereby confirms that the Performance Tests have been
satisfactorily completed and the Performance Guarantees have been achieved, as set forth in
Exhibit O of the project contract and further established in “CDRL 19, System Acceptance Test
Plan”, and required by section (iv) of the definition of “Substantial Completion”.
However, there are a number of open items, both related to behaviors and issues observed during
SAT, as well as other items, all of which must be addressed by LG Chem and ABB prior to final
acceptance. Notable items related to behaviors and issues observed during SAT are described
below, and all items (SAT-related and otherwise) will be provided to LG Chem in separate
documentation.
Notable Items Related to Behaviors and Issues Observed During SAT
As mentioned in CDRL 19 Section 7, one of the PCS containers had a 480/12.47 kV transformer
cooling fan motor failure near the beginning of SAT, in addition to an identical failure shortly
before the start of SAT. During SAT, all 12 of these fans were replaced in both PCS containers as
a precautionary measure, and the tests were completed without any further failures. ABB reported
they are investigating the cause of the failures, and SCE is waiting on their findings.
During CDRL 19 Section 11.3, Test 4, Charge Off-peak/Discharge On-peak (see CDRL 19 Section
11.3), the voltage regulation function was triggered, even when the measured voltage didn’t appear
to exceed the maximum or minimum allowed voltage limits. This behavior was unexpected and
should be investigated by ABB. SCE would like a detailed description of the voltage regulation
algorithm, including an explanation of its operation, and its sensitivity to voltage transients and
other potential causes for it to trigger.
Per CDRL 19, SCE is waiting for an updated system communication diagram from ABB (ABB
document number 3AUP000A110-R3) showing the current equipment IP addresses provided to
ABB and verified by SCE during SAT.
The ABB local data historian was unable to recall logged data (or wasn’t logging data at all) during
SAT. ABB should fix the local data historian and confirm it automatically records all data as long
as the OPC server is running and the data historian is powered on.
The OPC server configuration applet currently resides on the ABB local computer, requiring both
the local computer and ABB local data historian be powered on in order for the ABB and SCE
data historians to receive and log data. The OPC server configuration applet should be moved and
© Copyright 2015, Southern California Edison All Rights Reserved Page 193 of 221
configured to run on the ABB local data historian, so daily operation of the system is no longer
dependent on the ABB local computer.
Appendix A
Report Approvals and Revisions: SAT Report approved and signed July 2014
Report Distribution:
SCE, LG Chem
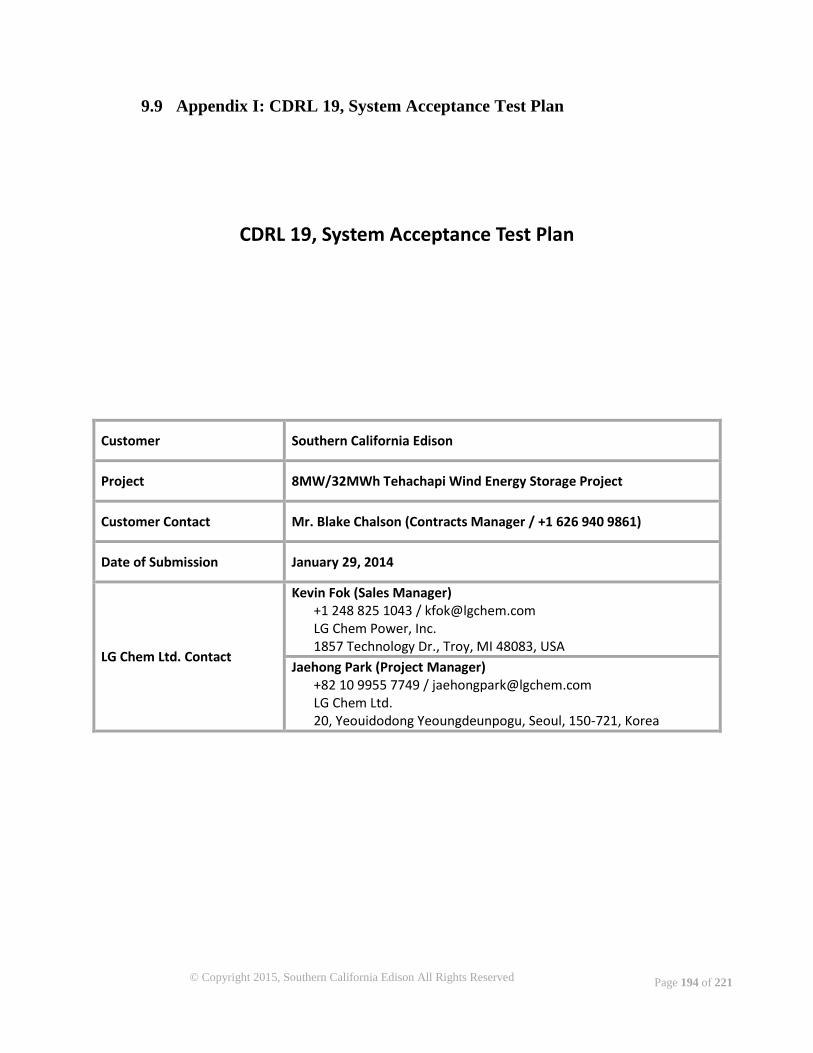
© Copyright 2015, Southern California Edison All Rights Reserved Page 194 of 221
9.9 Appendix I: CDRL 19, System Acceptance Test Plan
CDRL 19, System Acceptance Test Plan
Customer Southern California Edison
Project 8MW/32MWh Tehachapi Wind Energy Storage Project
Customer Contact Mr. Blake Chalson (Contracts Manager / +1 626 940 9861)
Date of Submission January 29, 2014
LG Chem Ltd. Contact
Kevin Fok (Sales Manager) +1 248 825 1043 / [email protected] LG Chem Power, Inc. 1857 Technology Dr., Troy, MI 48083, USA
Jaehong Park (Project Manager) +82 10 9955 7749 / [email protected] LG Chem Ltd. 20, Yeouidodong Yeoungdeunpogu, Seoul, 150-721, Korea
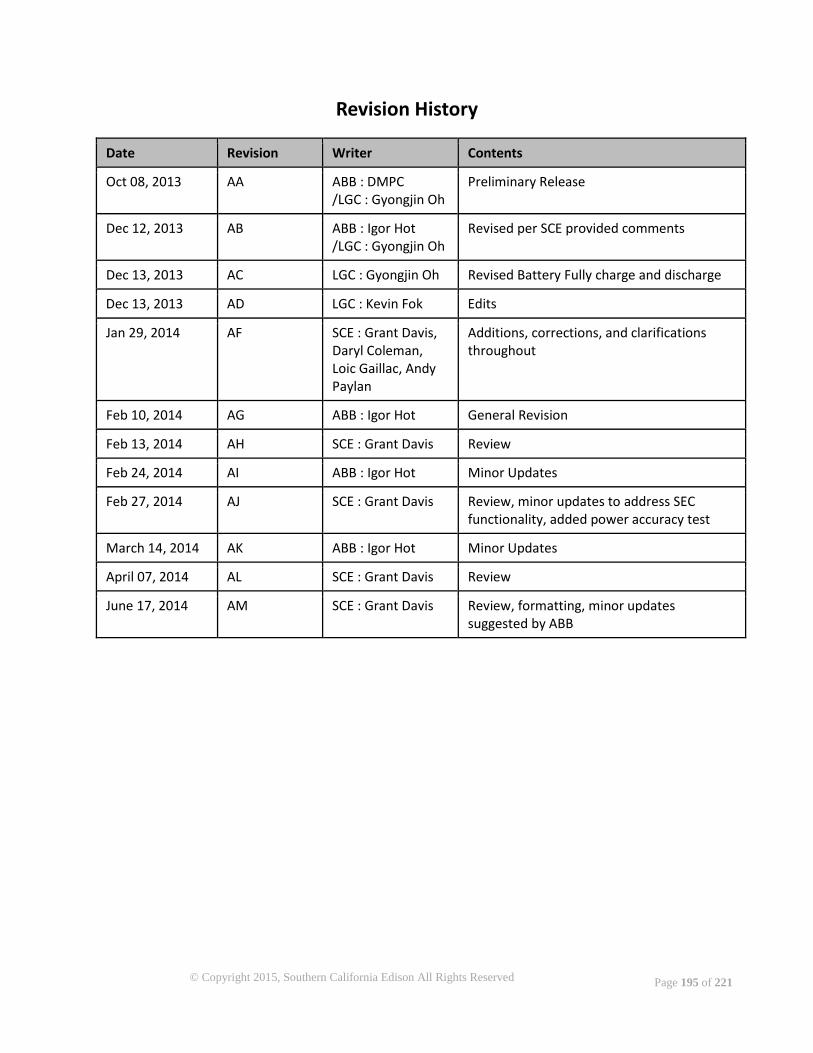
© Copyright 2015, Southern California Edison All Rights Reserved Page 195 of 221
Revision History
Date Revision Writer Contents
Oct 08, 2013 AA ABB : DMPC /LGC : Gyongjin Oh
Preliminary Release
Dec 12, 2013 AB ABB : Igor Hot /LGC : Gyongjin Oh
Revised per SCE provided comments
Dec 13, 2013 AC LGC : Gyongjin Oh Revised Battery Fully charge and discharge
Dec 13, 2013 AD LGC : Kevin Fok Edits
Jan 29, 2014 AF SCE : Grant Davis, Daryl Coleman, Loic Gaillac, Andy Paylan
Additions, corrections, and clarifications throughout
Feb 10, 2014 AG ABB : Igor Hot General Revision
Feb 13, 2014 AH SCE : Grant Davis Review
Feb 24, 2014 AI ABB : Igor Hot Minor Updates
Feb 27, 2014 AJ SCE : Grant Davis Review, minor updates to address SEC functionality, added power accuracy test
March 14, 2014 AK ABB : Igor Hot Minor Updates
April 07, 2014 AL SCE : Grant Davis Review
June 17, 2014 AM SCE : Grant Davis Review, formatting, minor updates suggested by ABB
© Copyright 2015, Southern California Edison All Rights Reserved Page 196 of 221
Table of Contents 1. SAFETY ............................................................................................................................................................... 197 2. INTRODUCTION.................................................................................................................................................. 199 3. REFERENCES ....................................................................................................................................................... 200 3.1. TECHNICAL & CONTRACTUAL DOCUMENT REFERENCES ............................................................................... 200 3.2. DESIGN DOCUMENT REFERENCES ................................................................................................................. 200 3.3. REQUIRED DATA ACQUISITION, RECORDING EQUIPMENT, AND INVERTER SYSTEM PERFORMANCE POWER ACCURACY ................................................................................................................................................................. 200 3.4. REQUIRED PROGRAMMING AND CONFIGURATION SOFTWARE ................................................................... 201 3.5. REQUIRED COMPONENT SOFTWARE AND FIRMWARE.................................................................................. 202 4. TEST PREREQUISITES .......................................................................................................................................... 203 5. IEC61850 INTERFACE AND LOCAL HISTORIAN.................................................................................................... 203 6. TEST PLAN FOR BESS POWER ACCURACY (DAY 1) .............................................................................................. 204 7. TEST PLAN FOR BESS REACTIVE POWER TESTS (DAY 2) ..................................................................................... 204 8. TEST PLAN FOR BESS CAPACITY (DAYS 3, 4, AND 5) ........................................................................................... 206 9. TEST PLAN FOR BESS RAMP RATE TEST (DAY 6) ................................................................................................. 207 10. TEST PLAN FOR BALANCING FUNCTION TEST (DAY 7) ................................................................................... 208 11. TEST PLANS FOR EMS TESTS .......................................................................................................................... 209 11.1. TEST 1, STEADY STATE VOLTAGE REGULATION (DAY 8) ............................................................................... 209 11.2. TEST 2, STEADY STATE VOLTAGE REGULATION UNDER ANY MODE, AND TEST 3, CHARGE DURING HIGH LINE LOAD/DISCHARGE DURING LOW LINE LOAD (DAY 9) ......................................................................................... 210 11.3. TEST 2, STEADY STATE VOLTAGE REGULATION UNDER ANY MODE, AND TEST 4, CHARGE OFF-PEAK/DISCHARGE ON-PEAK (DAY 10) ........................................................................................................................ 212 11.4. TEST 2, STEADY STATE VOLTAGE REGULATION UNDER ANY MODE, AND TEST 5, CHARGE AND DISCHARGE AS NEEDED FOR GRID PURPOSES (DAY 11) ................................................................................................................ 213 11.5. EMS–GMS TRANSITION (DAY 12) ............................................................................................................... 215 11.6. EMS AND GMS COMMUNICATION FAULT HANDLING (DAY 12) ................................................................. 216 12. TEST PLAN FOR GMS TESTS ............................................................................................................................ 218 12.1. MANUAL AND ISO POWER DISPATCH (DAY 12) .......................................................................................... 218 13. TEST REVIEW (DAYS 13 AND 14) .................................................................................................................... 218 APPENDIX A – TEST NOTES ........................................................................................................................................ 219

© Copyright 2015, Southern California Edison All Rights Reserved Page 197 of 221
SAFETY
This document contains important information regarding the configuration and operation of the PCS equipment for ESS applications. All operations on the PCS should be carried out by a trained technician familiar with the contents of this document.
DANGER! This symbol indicates an imminent danger resulting from mechanical forces or high voltage. A non-observance leads to life-threatening physical injury or death.
WARNING! This symbol indicates a dangerous situation. A non-observance may lead to serious or life-threatening physical injury or death.
CAUTION! This symbol indicates a dangerous situation. A non-observance may lead to physical injury or cause damage to the equipment.
NOTICE! This symbol emphasizes important information. A non-observance may cause damage to the equipment or other adverse effects.
IMPORTANT! This symbol indicates useful information. Not to be used to indicate dangerous situations.
© Copyright 2015, Southern California Edison All Rights Reserved Page 198 of 221
Work performed on any part of the equipment must be by a trained technician familiar with servicing this product.
Ensure power is isolated and locked off before attempting any work on this equipment.
Ensure the Equipment Under Test (EUT) and electrical equipment is properly grounded before attempting any work on this equipment.
Follow all applicable safety procedures enforced by the company / facility where the testing is to be performed.
Many parts in this equipment, including printed circuit boards operate at lethal voltages. DO NOT TOUCH components or connections that have voltage present. This equipment is a high energy device and requires strict precautions to be taken. Stored charge is present after the device is switched off. Normal operation of this equipment requires all protective covers to be in place and doors secured closed. Ensure proper PPE, including safety glasses, outerwear and Electrical Hazard safety footwear, are worn at all times while working on the equipment.
When the PCS100 ESS is powered down, lethal voltages (up to 1050Vdc) will remain in the energy storage element and the complete PCS100 ESS should be considered alive.
© Copyright 2015, Southern California Edison All Rights Reserved Page 199 of 221
INTRODUCTION
This document provides the System Acceptance Test Plan for Southern California Edison’s (SCE’s) Tehachapi Storage Project (TSP) 32MWh battery energy storage system (BESS) installed at Monolith Substation near Tehachapi, California. The BESS consists of 32MWh of Li-ion batteries and an 8MW/4MVAr/9MVA bidirectional power conversion system (PCS). The PCS is designed to connect to a 12.47kV, 3-Phase, 60 Hz bus, and is divided into two 4.5 MVA units. Each PCS unit is controlled by a PCS controller, and is connected to two battery sections. To allow for a central interface between the BESS and Southern California Edison, ABB implemented a site energy controller (SEC). The basic function of the SEC is to interpret the remote command functions (end user commands) and relay this information to the individual PCS units. In addition to accepting remote commands and providing status information, the SEC employs built-in logic to successfully run the system acceptance tests. The SEC aggregates the electrical parameters measured by each of the PCS power meters to act as a central interface for status reporting. The measured SEC values and/or separate data logger(s) will be used to serve as the validation mechanism for the system acceptance tests defined in this document. The accuracy of the power meters, inclusive of the current transformers (CTs), potential transformers (PTs), burden due to conductor runs from PTs and CTs to the power meters, and power meters themselves, will be provided, along with current calibration certificates. In addition, accuracy will be provided when aggregated electrical parameters are used to determine the performance of the system.
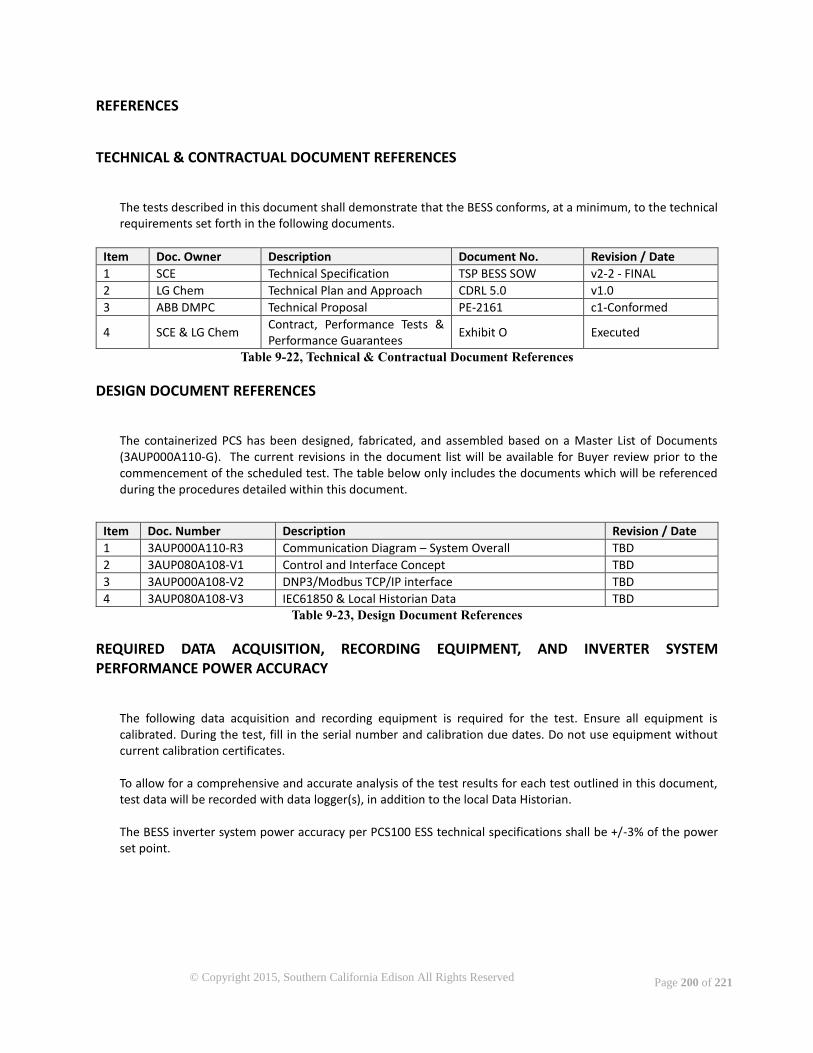
© Copyright 2015, Southern California Edison All Rights Reserved Page 200 of 221
REFERENCES
TECHNICAL & CONTRACTUAL DOCUMENT REFERENCES
The tests described in this document shall demonstrate that the BESS conforms, at a minimum, to the technical requirements set forth in the following documents.
Item Doc. Owner Description Document No. Revision / Date
1 SCE Technical Specification TSP BESS SOW v2-2 - FINAL
2 LG Chem Technical Plan and Approach CDRL 5.0 v1.0
3 ABB DMPC Technical Proposal PE-2161 c1-Conformed
4 SCE & LG Chem Contract, Performance Tests & Performance Guarantees
Exhibit O Executed
Table 9-22, Technical & Contractual Document References
DESIGN DOCUMENT REFERENCES
The containerized PCS has been designed, fabricated, and assembled based on a Master List of Documents (3AUP000A110-G). The current revisions in the document list will be available for Buyer review prior to the commencement of the scheduled test. The table below only includes the documents which will be referenced during the procedures detailed within this document.
Item Doc. Number Description Revision / Date
1 3AUP000A110-R3 Communication Diagram – System Overall TBD
2 3AUP080A108-V1 Control and Interface Concept TBD
3 3AUP000A108-V2 DNP3/Modbus TCP/IP interface TBD
4 3AUP080A108-V3 IEC61850 & Local Historian Data TBD Table 9-23, Design Document References
REQUIRED DATA ACQUISITION, RECORDING EQUIPMENT, AND INVERTER SYSTEM PERFORMANCE POWER ACCURACY
The following data acquisition and recording equipment is required for the test. Ensure all equipment is calibrated. During the test, fill in the serial number and calibration due dates. Do not use equipment without current calibration certificates. To allow for a comprehensive and accurate analysis of the test results for each test outlined in this document, test data will be recorded with data logger(s), in addition to the local Data Historian. The BESS inverter system power accuracy per PCS100 ESS technical specifications shall be +/-3% of the power set point.
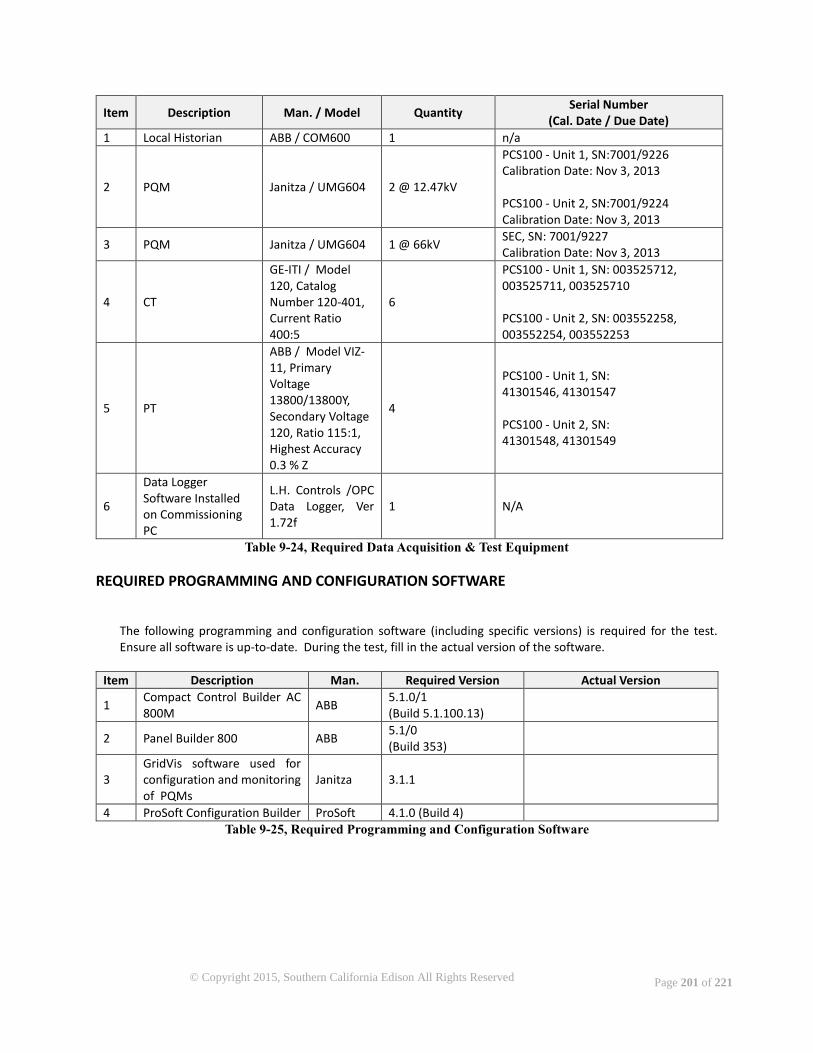
© Copyright 2015, Southern California Edison All Rights Reserved Page 201 of 221
Item Description Man. / Model Quantity Serial Number
(Cal. Date / Due Date)
1 Local Historian ABB / COM600 1 n/a
2 PQM Janitza / UMG604 2 @ 12.47kV
PCS100 - Unit 1, SN:7001/9226 Calibration Date: Nov 3, 2013 PCS100 - Unit 2, SN:7001/9224 Calibration Date: Nov 3, 2013
3 PQM Janitza / UMG604 1 @ 66kV SEC, SN: 7001/9227 Calibration Date: Nov 3, 2013
4 CT
GE-ITI / Model 120, Catalog Number 120-401, Current Ratio 400:5
6
PCS100 - Unit 1, SN: 003525712, 003525711, 003525710 PCS100 - Unit 2, SN: 003552258, 003552254, 003552253
5 PT
ABB / Model VIZ-11, Primary Voltage 13800/13800Y, Secondary Voltage 120, Ratio 115:1, Highest Accuracy 0.3 % Z
4
PCS100 - Unit 1, SN: 41301546, 41301547 PCS100 - Unit 2, SN: 41301548, 41301549
6
Data Logger Software Installed on Commissioning PC
L.H. Controls /OPC Data Logger, Ver 1.72f
1 N/A
Table 9-24, Required Data Acquisition & Test Equipment
REQUIRED PROGRAMMING AND CONFIGURATION SOFTWARE
The following programming and configuration software (including specific versions) is required for the test. Ensure all software is up-to-date. During the test, fill in the actual version of the software.
Item Description Man. Required Version Actual Version
1 Compact Control Builder AC 800M
ABB 5.1.0/1 (Build 5.1.100.13)
2 Panel Builder 800 ABB 5.1/0 (Build 353)
3 GridVis software used for configuration and monitoring of PQMs
Janitza 3.1.1
4 ProSoft Configuration Builder ProSoft 4.1.0 (Build 4)
Table 9-25, Required Programming and Configuration Software
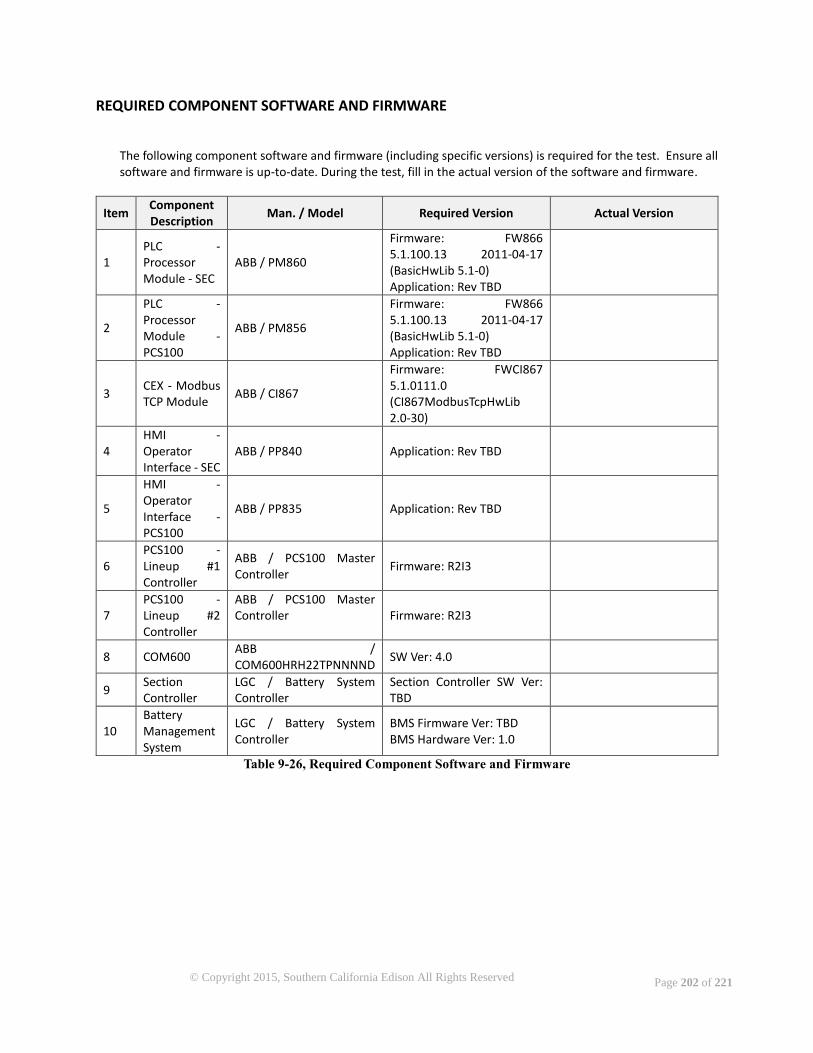
© Copyright 2015, Southern California Edison All Rights Reserved Page 202 of 221
REQUIRED COMPONENT SOFTWARE AND FIRMWARE
The following component software and firmware (including specific versions) is required for the test. Ensure all software and firmware is up-to-date. During the test, fill in the actual version of the software and firmware.
Item Component Description
Man. / Model Required Version Actual Version
1 PLC - Processor Module - SEC
ABB / PM860
Firmware: FW866 5.1.100.13 2011-04-17 (BasicHwLib 5.1-0) Application: Rev TBD
2
PLC - Processor Module - PCS100
ABB / PM856
Firmware: FW866 5.1.100.13 2011-04-17 (BasicHwLib 5.1-0) Application: Rev TBD
3 CEX - Modbus TCP Module
ABB / CI867
Firmware: FWCI867 5.1.0111.0 (CI867ModbusTcpHwLib 2.0-30)
4 HMI - Operator Interface - SEC
ABB / PP840 Application: Rev TBD
5
HMI - Operator Interface - PCS100
ABB / PP835 Application: Rev TBD
6 PCS100 - Lineup #1 Controller
ABB / PCS100 Master Controller
Firmware: R2I3
7 PCS100 - Lineup #2 Controller
ABB / PCS100 Master Controller
Firmware: R2I3
8 COM600 ABB / COM600HRH22TPNNNND
SW Ver: 4.0
9 Section Controller
LGC / Battery System Controller
Section Controller SW Ver: TBD
10 Battery Management System
LGC / Battery System Controller
BMS Firmware Ver: TBD BMS Hardware Ver: 1.0
Table 9-26, Required Component Software and Firmware

© Copyright 2015, Southern California Edison All Rights Reserved Page 203 of 221
TEST PREREQUISITES
The prerequisites for acceptance testing are:
- All commissioning tasks are completed. - The BESS is ready for coordinated control, and all SEC local control functions have been tested (Q
Control, V Control, P control, Standby Mode, SOC Control, and Maintain SOC Control). - The SEC/SCE communication interfaces (EMS DNP3/Modbus TCP/IP and GMS DNP3/Modbus TCP/IP)
are tested and fully functional.18 Set the following on the SEC Reference screen for all tests, unless specified otherwise by a specific test:
- SOC Max [%] = 100 - SOC Min [%] = 1.5 - SOC DB [%] = 0.5 - V [kV] = 66 - P Charge [kW] = -8000 - P Discharge [kW] = 8000 - P Ramp + [kW/sec] = 800 - P Ramp - [kW/sec] = 800 - Fully Charge BESS = Off - Fully Discharge BESS = Off - Maintain SOC Allowed for T1&T4 = On - V Ctrl Selected for T3, T4 or T5 = On - Critical Testing = On
IEC61850 INTERFACE AND LOCAL HISTORIAN
All logged signals should be recorded throughout the acceptance testing by the IEC61850 and Local Data Historian. Signals should be properly logged in the local historian and transferred to the SCE IEC61850 historian. Signals should be verified for accuracy and scaling per the IEC61850 & Local Historian Data document (3AUP080A108-V3).
18 If any of these interfaces are not functional at the time of testing, the corresponding SEC EMS and/or GMS Test
mode will be used for system acceptance testing.
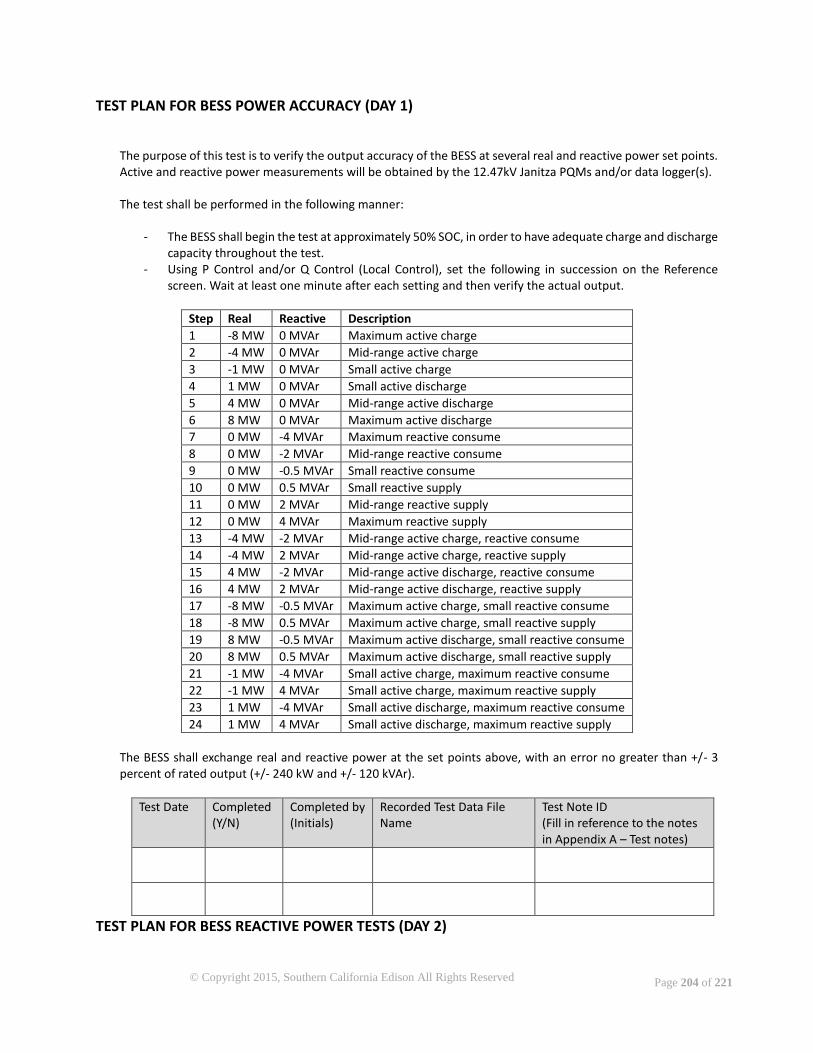
© Copyright 2015, Southern California Edison All Rights Reserved Page 204 of 221
TEST PLAN FOR BESS POWER ACCURACY (DAY 1)
The purpose of this test is to verify the output accuracy of the BESS at several real and reactive power set points. Active and reactive power measurements will be obtained by the 12.47kV Janitza PQMs and/or data logger(s). The test shall be performed in the following manner:
- The BESS shall begin the test at approximately 50% SOC, in order to have adequate charge and discharge capacity throughout the test.
- Using P Control and/or Q Control (Local Control), set the following in succession on the Reference screen. Wait at least one minute after each setting and then verify the actual output.
Step Real Reactive Description
1 -8 MW 0 MVAr Maximum active charge
2 -4 MW 0 MVAr Mid-range active charge
3 -1 MW 0 MVAr Small active charge
4 1 MW 0 MVAr Small active discharge
5 4 MW 0 MVAr Mid-range active discharge
6 8 MW 0 MVAr Maximum active discharge
7 0 MW -4 MVAr Maximum reactive consume
8 0 MW -2 MVAr Mid-range reactive consume
9 0 MW -0.5 MVAr Small reactive consume
10 0 MW 0.5 MVAr Small reactive supply
11 0 MW 2 MVAr Mid-range reactive supply
12 0 MW 4 MVAr Maximum reactive supply
13 -4 MW -2 MVAr Mid-range active charge, reactive consume
14 -4 MW 2 MVAr Mid-range active charge, reactive supply
15 4 MW -2 MVAr Mid-range active discharge, reactive consume
16 4 MW 2 MVAr Mid-range active discharge, reactive supply
17 -8 MW -0.5 MVAr Maximum active charge, small reactive consume
18 -8 MW 0.5 MVAr Maximum active charge, small reactive supply
19 8 MW -0.5 MVAr Maximum active discharge, small reactive consume
20 8 MW 0.5 MVAr Maximum active discharge, small reactive supply
21 -1 MW -4 MVAr Small active charge, maximum reactive consume
22 -1 MW 4 MVAr Small active charge, maximum reactive supply
23 1 MW -4 MVAr Small active discharge, maximum reactive consume
24 1 MW 4 MVAr Small active discharge, maximum reactive supply
The BESS shall exchange real and reactive power at the set points above, with an error no greater than +/- 3 percent of rated output (+/- 240 kW and +/- 120 kVAr).
Test Date
Completed (Y/N)
Completed by (Initials)
Recorded Test Data File Name
Test Note ID (Fill in reference to the notes in Appendix A – Test notes)
TEST PLAN FOR BESS REACTIVE POWER TESTS (DAY 2)
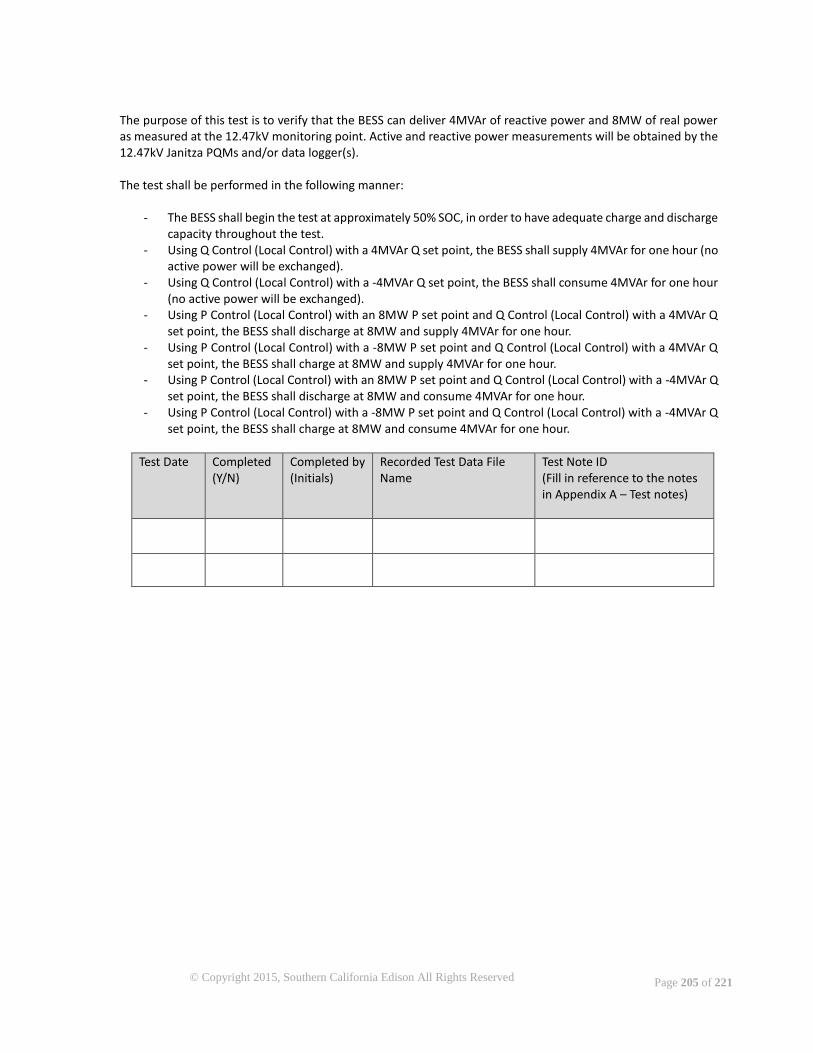
© Copyright 2015, Southern California Edison All Rights Reserved Page 205 of 221
The purpose of this test is to verify that the BESS can deliver 4MVAr of reactive power and 8MW of real power as measured at the 12.47kV monitoring point. Active and reactive power measurements will be obtained by the 12.47kV Janitza PQMs and/or data logger(s). The test shall be performed in the following manner:
- The BESS shall begin the test at approximately 50% SOC, in order to have adequate charge and discharge capacity throughout the test.
- Using Q Control (Local Control) with a 4MVAr Q set point, the BESS shall supply 4MVAr for one hour (no active power will be exchanged).
- Using Q Control (Local Control) with a -4MVAr Q set point, the BESS shall consume 4MVAr for one hour (no active power will be exchanged).
- Using P Control (Local Control) with an 8MW P set point and Q Control (Local Control) with a 4MVAr Q set point, the BESS shall discharge at 8MW and supply 4MVAr for one hour.
- Using P Control (Local Control) with a -8MW P set point and Q Control (Local Control) with a 4MVAr Q set point, the BESS shall charge at 8MW and supply 4MVAr for one hour.
- Using P Control (Local Control) with an 8MW P set point and Q Control (Local Control) with a -4MVAr Q set point, the BESS shall discharge at 8MW and consume 4MVAr for one hour.
- Using P Control (Local Control) with a -8MW P set point and Q Control (Local Control) with a -4MVAr Q set point, the BESS shall charge at 8MW and consume 4MVAr for one hour.
Test Date
Completed (Y/N)
Completed by (Initials)
Recorded Test Data File Name
Test Note ID (Fill in reference to the notes in Appendix A – Test notes)
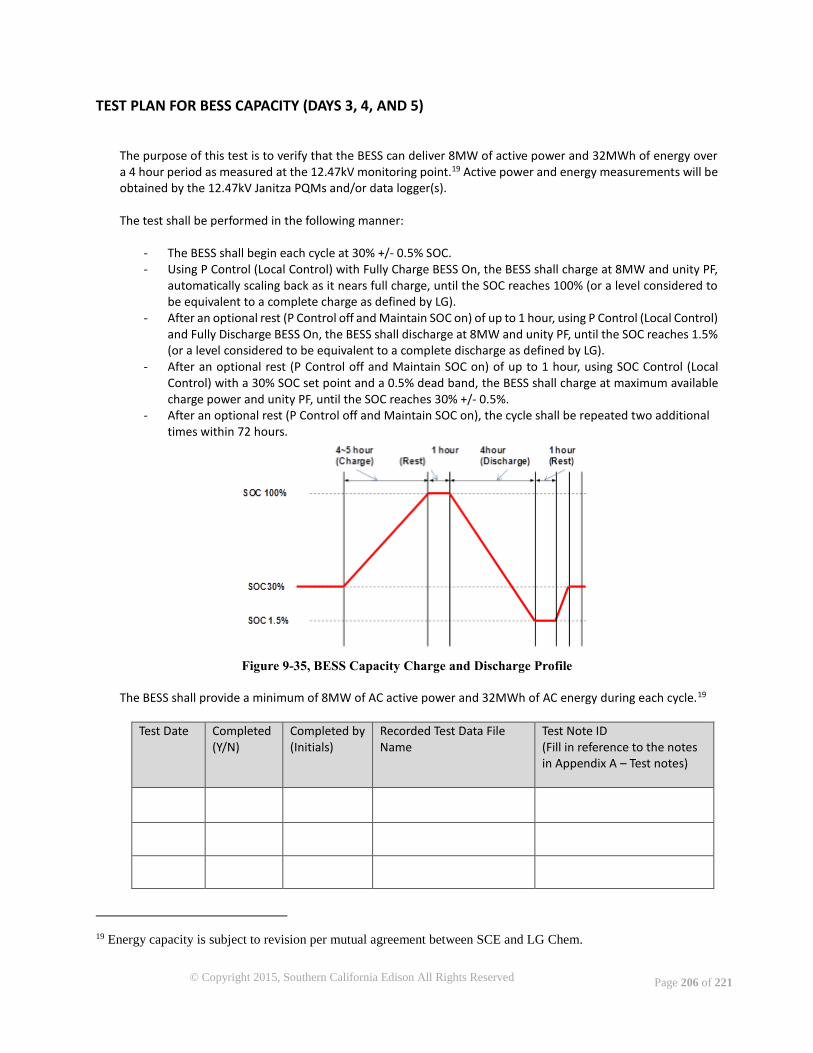
© Copyright 2015, Southern California Edison All Rights Reserved Page 206 of 221
TEST PLAN FOR BESS CAPACITY (DAYS 3, 4, AND 5)
The purpose of this test is to verify that the BESS can deliver 8MW of active power and 32MWh of energy over a 4 hour period as measured at the 12.47kV monitoring point.19 Active power and energy measurements will be obtained by the 12.47kV Janitza PQMs and/or data logger(s). The test shall be performed in the following manner:
- The BESS shall begin each cycle at 30% +/- 0.5% SOC. - Using P Control (Local Control) with Fully Charge BESS On, the BESS shall charge at 8MW and unity PF,
automatically scaling back as it nears full charge, until the SOC reaches 100% (or a level considered to be equivalent to a complete charge as defined by LG).
- After an optional rest (P Control off and Maintain SOC on) of up to 1 hour, using P Control (Local Control) and Fully Discharge BESS On, the BESS shall discharge at 8MW and unity PF, until the SOC reaches 1.5% (or a level considered to be equivalent to a complete discharge as defined by LG).
- After an optional rest (P Control off and Maintain SOC on) of up to 1 hour, using SOC Control (Local Control) with a 30% SOC set point and a 0.5% dead band, the BESS shall charge at maximum available charge power and unity PF, until the SOC reaches 30% +/- 0.5%.
- After an optional rest (P Control off and Maintain SOC on), the cycle shall be repeated two additional times within 72 hours.
Figure 9-35, BESS Capacity Charge and Discharge Profile
The BESS shall provide a minimum of 8MW of AC active power and 32MWh of AC energy during each cycle.19
Test Date
Completed (Y/N)
Completed by (Initials)
Recorded Test Data File Name
Test Note ID (Fill in reference to the notes in Appendix A – Test notes)
19 Energy capacity is subject to revision per mutual agreement between SCE and LG Chem.

© Copyright 2015, Southern California Edison All Rights Reserved Page 207 of 221
TEST PLAN FOR BESS RAMP RATE TEST (DAY 6)
The purpose of this test is to verify that the BESS can provide approximately 10-minute active power charge and discharge ramps from 0MW to 8MW. Active power measurements will be obtained by the 12.47kV Janitza PQMs and/or data logger(s). The test shall be performed in the following manner:
- The BESS shall begin the test at approximately 50% SOC, in order to have adequate charge and discharge capacity throughout the test.
- In addition to Section 4, Test Prerequisites, set the following on the Reference screen: o P Ramp + [kW/sec] = 13 o P Ramp – [kW/sec] = 13
- Using P Control (Local Control) with an 8MW P set point, the BESS shall ramp linearly from 0MW to an 8MW discharge at unity power factor over approximately 10 minutes, and then sustain an 8MW discharge for one hour.
- After the one hour discharge, using P Control (Local Control) with a 0MW P set point, the BESS shall ramp linearly from an 8MW discharge to 0MW over approximately 10 minutes.
- After an optional rest (P Control off and Maintain SOC on) of up to 1 hour, using P Control (Local Control) with a -8MW P set point, the BESS shall ramp linearly from 0MW to an 8MW charge at unity power factor over approximately 10 minutes, and then sustain an 8MW charge for one hour.
- After the one hour charge, using P Control (Local Control) with a 0MW P set point, the BESS shall ramp linearly from an 8MW charge to 0MW over approximately 10 minutes.
Test Date
Completed (Y/N)
Completed by (Initials)
Recorded Test Data File Name
Test Note ID (Fill in reference to the notes in Appendix A – Test notes)
© Copyright 2015, Southern California Edison All Rights Reserved Page 208 of 221
TEST PLAN FOR BALANCING FUNCTION TEST (DAY 7)
The purpose of this test is to verify that the BESS can balance the four battery sections to within 1% SOC of each other while the system is discharged from a slightly unbalanced condition. NOTE: The purpose of the SOC balancing function is to keep the SOC of all four battery sections within 1% SOC of each other during a discharge. The SOC balancing function is not intended to correct SOC imbalances if the four battery sections are at significantly different SOCs prior to the start of a discharge. The test shall be performed in the following manner:
- Using P Control (Local Control) with a -8MW P set point, the BESS shall charge at 8MW and unity PF, automatically scaling back as it nears full charge, until the SOC reaches 100% (or a level considered to be equivalent to a complete charge as defined by LG).
- After an optional rest (P Control off and Maintain SOC on) of up to 1 hour, shut down the PCSs for battery sections 2, 3, and 4. Only the PCS for battery section 1 shall be online.
- Using P Control (Local Control) with an 8MW P discharge set point, the BESS shall discharge at maximum power possible with battery section 1.
- Stop the discharge once battery section 1 reaches 97% SOC. Start the PCSs for battery sections 2, 3, and 4. All PCSs shall be online.
- After an optional rest of up to 30 minutes, using P Control (Local Control) with a 4MW P discharge set point, the BESS shall discharge at maximum power possible until the four battery sections are within 1% SOC of each other, and then discharge at 4MW until the SOC reaches 1.5% (or a level considered to be equivalent to a complete discharge as defined by LG).
Test Date
Completed (Y/N)
Completed by (Initials)
Recorded Test Data File Name
Test Note ID (Fill in reference to the notes in Appendix A – Test notes)

© Copyright 2015, Southern California Edison All Rights Reserved Page 209 of 221
TEST PLANS FOR EMS TESTS
TEST 1, STEADY STATE VOLTAGE REGULATION (DAY 8)
The purpose of this test is to verify that the BESS can provide up to 4MVAr of reactive power injection/absorption to maintain the Monolith 66kV bus voltage within +/- 5%, while also exchanging real power as needed to maintain the battery SOC throughout the test. Active and reactive power measurements will be obtained by the 12.47kV Janitza PQMs and/or data logger(s), and voltage measurements will be obtained by the 66kV Janitza PQM. The test shall be performed in the following manner:
- The BESS shall begin the test at approximately 50% SOC. - Using Test 1 (EMS Test) with a 66kV V set point, the BESS shall provide up to 4MVAr of reactive power
injection/absorption, and shall maintain the Monolith 66kV bus voltage within +/- 5% for at least 6 hours.
The 66kV bus voltage tolerance may be exceeded only if the BESS is operating at its maximum reactive power capacity of 4MVAr, and 4MVAr is still not sufficient to maintain the voltage within the tolerance. The BESS shall also exchange real power as needed to maintain the battery SOC within +/- 1% of the SOC at the start of the test.
Test Date
Completed (Y/N)
Completed by (Initials)
Recorded Test Data File Name
Test Note ID (Fill in reference to the notes in Appendix A – Test notes)

© Copyright 2015, Southern California Edison All Rights Reserved Page 210 of 221
TEST 2, STEADY STATE VOLTAGE REGULATION UNDER ANY MODE, AND TEST 3, CHARGE DURING HIGH LINE LOAD/DISCHARGE DURING LOW LINE LOAD (DAY 9)
The purpose of this test is to verify that the BESS can charge during periods of high line loading and discharge during periods of low line loading, while concurrently providing up to 4MVAr of reactive power injection/absorption to maintain the Monolith 66kV bus voltage within +/- 5%. The BESS should also exchange real power as needed to maintain battery SOC during periods of inactivity. Active and reactive power measurements will be obtained by the 12.47kV Janitza PQMs and/or data logger(s), and voltage measurements will be obtained by the 66kV Janitza PQM. NOTE: Test 2 is not explicitly selected on the SEC EMS Test screen like Test 1, Test 3, Test 4, or Test 5. Instead, Test 2 (which provides voltage regulation and may be operated in conjunction with one of the other tests) is enabled by turning on the V Control selection on the Reference screen. The test shall be performed in the following manner:
- The BESS shall begin the test at approximately 50% SOC. - In addition to Section 4, Test Prerequisites, set the following on the Reference screen:
o I_Calc_Lim1 = 646 o I_Calc_Lim2 = 610 o I_Calc_Lim1_Lower = 320 o I_Calc_Lim2_Lower = 300 o I_Limit_Lower_Deadband = 10 o I_Limits_Deadband = 10 o T_Lim = 80 o I_Line1_Lim1 = 486 o I_Line1_Lim2 = 450 o I_Line1_Lim1_Lower = 200 o I_Line1_Lim2_Lower = 180
- Set the following on the EMS Test screen: o I_Line1_Act [A] = 490 o I_Line2_Act [A] = 0 o T_Act [F] = 70 o I_Line1_Act_Coef = 1 o I_Line2_Act_Coef = .31
- Using Test 3 (EMS Test), the BESS shall provide up to 4MVAr of reactive power injection/absorption, and shall maintain the Monolith 66kV bus voltage within +/- 5%.
- Set the following in succession on the EMS Test screen. Wait at least five minutes after each setting, and then record the actual behavior.
Step Setting Expected Behavior
1 I_Line1_Act = 477 System charges
2 I_Line1_Act = 449 System maintains SOC
3 T_Act = 90 System maintains SOC
4 I_Line1_Act = 439 System maintains SOC
5 I_Line1_Act = 437 System maintains SOC
6 I_Line2_Act = 562 System charges
7 I_Line2_Act = 547 System charges
8 I_Line2_Act = 500 System maintains SOC
9 T_Act = 70 System maintains SOC
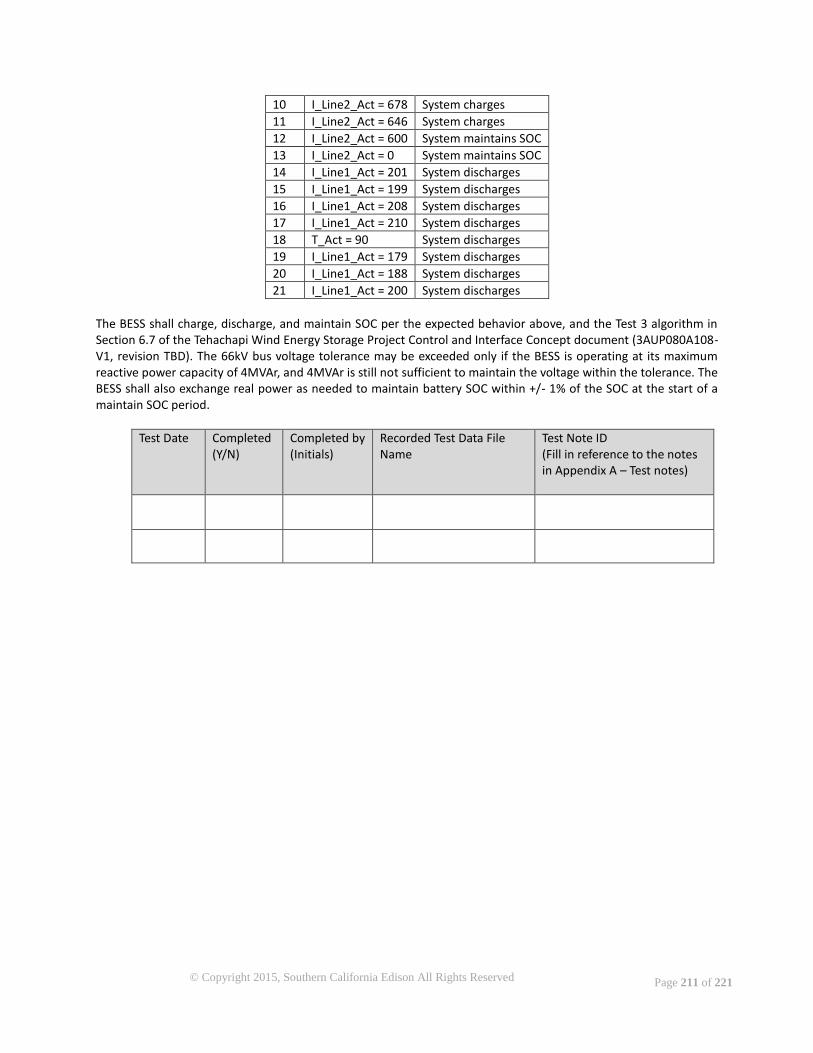
© Copyright 2015, Southern California Edison All Rights Reserved Page 211 of 221
10 I_Line2_Act = 678 System charges
11 I_Line2_Act = 646 System charges
12 I_Line2_Act = 600 System maintains SOC
13 I_Line2_Act = 0 System maintains SOC
14 I_Line1_Act = 201 System discharges
15 I_Line1_Act = 199 System discharges
16 I_Line1_Act = 208 System discharges
17 I_Line1_Act = 210 System discharges
18 T_Act = 90 System discharges
19 I_Line1_Act = 179 System discharges
20 I_Line1_Act = 188 System discharges
21 I_Line1_Act = 200 System discharges
The BESS shall charge, discharge, and maintain SOC per the expected behavior above, and the Test 3 algorithm in Section 6.7 of the Tehachapi Wind Energy Storage Project Control and Interface Concept document (3AUP080A108-V1, revision TBD). The 66kV bus voltage tolerance may be exceeded only if the BESS is operating at its maximum reactive power capacity of 4MVAr, and 4MVAr is still not sufficient to maintain the voltage within the tolerance. The BESS shall also exchange real power as needed to maintain battery SOC within +/- 1% of the SOC at the start of a maintain SOC period.
Test Date
Completed (Y/N)
Completed by (Initials)
Recorded Test Data File Name
Test Note ID (Fill in reference to the notes in Appendix A – Test notes)

© Copyright 2015, Southern California Edison All Rights Reserved Page 212 of 221
TEST 2, STEADY STATE VOLTAGE REGULATION UNDER ANY MODE, AND TEST 4, CHARGE OFF-PEAK/DISCHARGE ON-PEAK (DAY 10)
The purpose of this test is to verify that the BESS can discharge during on-peak periods and charge during off-peak periods, while concurrently providing up to 4MVAr of reactive power injection/absorption to maintain the Monolith 66kV bus voltage within +/- 5%. The BESS shall also exchange real power between on/off-peak periods as needed to maintain battery SOC. Active and reactive power measurements will be obtained by the 12.47kV Janitza PQMs and/or data logger(s), and voltage measurements will be obtained by the 66kV Janitza PQM. NOTE: Test 2 is not explicitly selected on the SEC EMS Test screen like Test 1, Test 3, Test 4, or Test 5. Instead, Test 2 (which provides voltage regulation and may be operated in conjunction with one of the other tests) is enabled by turning on the V Control selection on the Reference screen. The test shall be performed in the following manner:
- The BESS shall begin the test at approximately 50% SOC. - In addition to Section 4, Test Prerequisites, set the following on the Reference screen:
o P Charge [kW] = -4000 o P Discharge [kW] = 4000 o Off Peak Period = Mo-Fr 0900-1200 o On Peak Period = Mo-Fr 1300-1600
NOTE: The Off Peak and On Peak periods may be adjusted to accommodate actual test times, as long as the two periods are at least three continuous hours each, with a continuous one hour break between.
- Using Test 4 (EMS Test), the BESS shall provide up to 4MVAr of reactive power injection/absorption, and shall maintain the Monolith 66kV bus voltage within +/-5%.
The BESS shall charge at 4MW from 9:00 to 12:00, maintain SOC from 12:00 to 13:00, and discharge at 4MW from 13:00 to 16:00. The 66kV bus voltage tolerance may be exceeded only if the BESS is operating at its maximum reactive power capacity of 4MVAr, and 4MVAr is still not sufficient to maintain the voltage within the tolerance. The BESS shall also exchange real power between on/off-peak periods (inter-on/off-peak period) as needed to maintain battery SOC within +/- 1% of the SOC at the start of the inter-on/off-peak period.
Test Date
Completed (Y/N)
Completed by (Initials)
Recorded Test Data File Name
Test Note ID (Fill in reference to the notes in Appendix A – Test notes)
© Copyright 2015, Southern California Edison All Rights Reserved Page 213 of 221
TEST 2, STEADY STATE VOLTAGE REGULATION UNDER ANY MODE, AND TEST 5, CHARGE AND DISCHARGE AS NEEDED FOR GRID PURPOSES (DAY 11)
The purpose of this test is to verify that the BESS can charge and discharge as needed for grid purposes by accurately following wind turbine generation data. Whenever wind power quickly increases or decreases, the BESS will charge or discharge in the opposite direction to cancel out the non-compliant power ramp. This test will also verify that the BESS can concurrently provide up to 4MVAr of reactive power injection/absorption to maintain the Monolith 66kV bus voltage within +/- 5%. Active and reactive power measurements will be obtained by the 12.47kV Janitza PQMs and/or data logger(s), and voltage measurements will be obtained by the 66kV Janitza PQM. NOTE: Test 2 is not explicitly selected on the SEC EMS Test screen like Test 1, Test 3, Test 4, or Test 5. Instead, Test 2 (which provides voltage regulation and may be performed in conjunction with one of the other tests) is enabled by turning on the V Control selection on the Reference screen. The test shall be performed in the following manner:
- The BESS shall begin the test at approximately 50% SOC. - In addition to Section 4, Test Prerequisites, set the following on the Reference screen:
o P_WT_Act Allowed Ramp + [kW/sec] = 17 o P_WT_Act Allowed Ramp - [kW/sec] = 17
- Set the following on the EMS Test screen: o P_WT_Act [MW] = 1000 o P_WT_Act_Coef = 1
- Using Test 5 (EMS Test), the BESS shall provide up to 4MVAr of reactive power injection/absorption, and shall maintain the Monolith 66kV bus voltage within +/- 5%.
- Set the following in succession on the EMS Test screen and then record the actual behavior.
Step Setting Expected Behavior
1 P_WT_Act [MW] = 1005
System follows P ramp and charges at approximately 5MW, and then ramps to 0MW over approximately five minutes
2 P_WT_Act [MW] = 995
System follows P ramp and discharges at 8MW for two minutes, and then ramps to 0MW over approximately eight minutes
3 P_WT_Act [MW] = 1000
System follows P ramp and charges at approximately 5MW, and then ramps to 0MW over approximately five minutes
4 P_WT_Act [MW] = 1010
System follows P ramp and charges at 8MW for two minutes, and then ramps to 0MW over approximately eight minutes
5 P_WT_Act [MW] = 1003
System follows P ramp and discharges at approximately 7MW, and then ramps to 0MW over approximately seven minutes
6 P_WT_Act [MW] = 1000
System follows P ramp and discharges at approximately 3MW, and then ramps to 0MW over approximately three minutes
- Repeat the sequence at least five additional times.
The BESS shall charge and discharge per the expected behavior above. The 66kV bus voltage tolerance may be exceeded only if the BESS is operating at its maximum reactive power capacity of 4MVAr, and 4MVAr is still not sufficient to maintain the voltage within the tolerance.
© Copyright 2015, Southern California Edison All Rights Reserved Page 214 of 221
Test Date
Completed (Y/N)
Completed by (Initials)
Recorded Test Data File Name
Test Note ID (Fill in reference to the notes in Appendix A – Test notes)
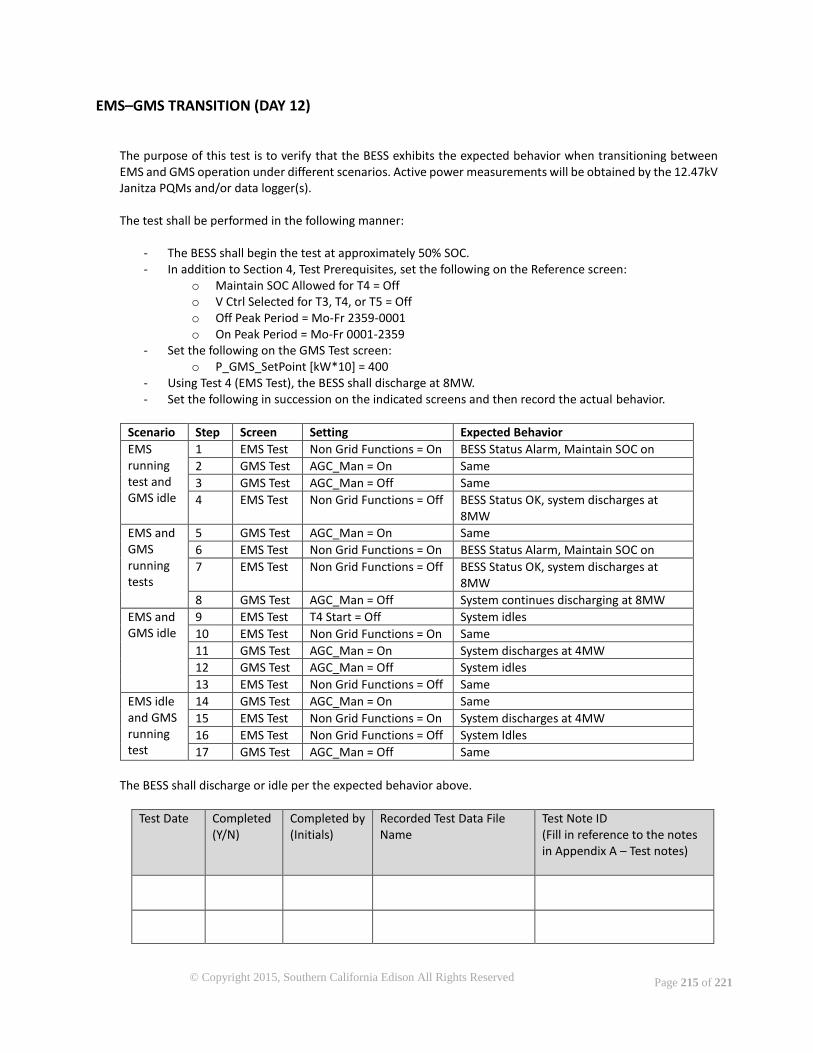
© Copyright 2015, Southern California Edison All Rights Reserved Page 215 of 221
EMS–GMS TRANSITION (DAY 12)
The purpose of this test is to verify that the BESS exhibits the expected behavior when transitioning between EMS and GMS operation under different scenarios. Active power measurements will be obtained by the 12.47kV Janitza PQMs and/or data logger(s). The test shall be performed in the following manner:
- The BESS shall begin the test at approximately 50% SOC. - In addition to Section 4, Test Prerequisites, set the following on the Reference screen:
o Maintain SOC Allowed for T4 = Off o V Ctrl Selected for T3, T4, or T5 = Off o Off Peak Period = Mo-Fr 2359-0001 o On Peak Period = Mo-Fr 0001-2359
- Set the following on the GMS Test screen: o P_GMS_SetPoint [kW*10] = 400
- Using Test 4 (EMS Test), the BESS shall discharge at 8MW. - Set the following in succession on the indicated screens and then record the actual behavior.
Scenario Step Screen Setting Expected Behavior
EMS running test and GMS idle
1 EMS Test Non Grid Functions = On BESS Status Alarm, Maintain SOC on
2 GMS Test AGC_Man = On Same
3 GMS Test AGC_Man = Off Same
4 EMS Test Non Grid Functions = Off BESS Status OK, system discharges at 8MW
EMS and GMS running tests
5 GMS Test AGC_Man = On Same
6 EMS Test Non Grid Functions = On BESS Status Alarm, Maintain SOC on
7 EMS Test Non Grid Functions = Off BESS Status OK, system discharges at 8MW
8 GMS Test AGC_Man = Off System continues discharging at 8MW
EMS and GMS idle
9 EMS Test T4 Start = Off System idles
10 EMS Test Non Grid Functions = On Same
11 GMS Test AGC_Man = On System discharges at 4MW
12 GMS Test AGC_Man = Off System idles
13 EMS Test Non Grid Functions = Off Same
EMS idle and GMS running test
14 GMS Test AGC_Man = On Same
15 EMS Test Non Grid Functions = On System discharges at 4MW
16 EMS Test Non Grid Functions = Off System Idles
17 GMS Test AGC_Man = Off Same
The BESS shall discharge or idle per the expected behavior above.
Test Date
Completed (Y/N)
Completed by (Initials)
Recorded Test Data File Name
Test Note ID (Fill in reference to the notes in Appendix A – Test notes)
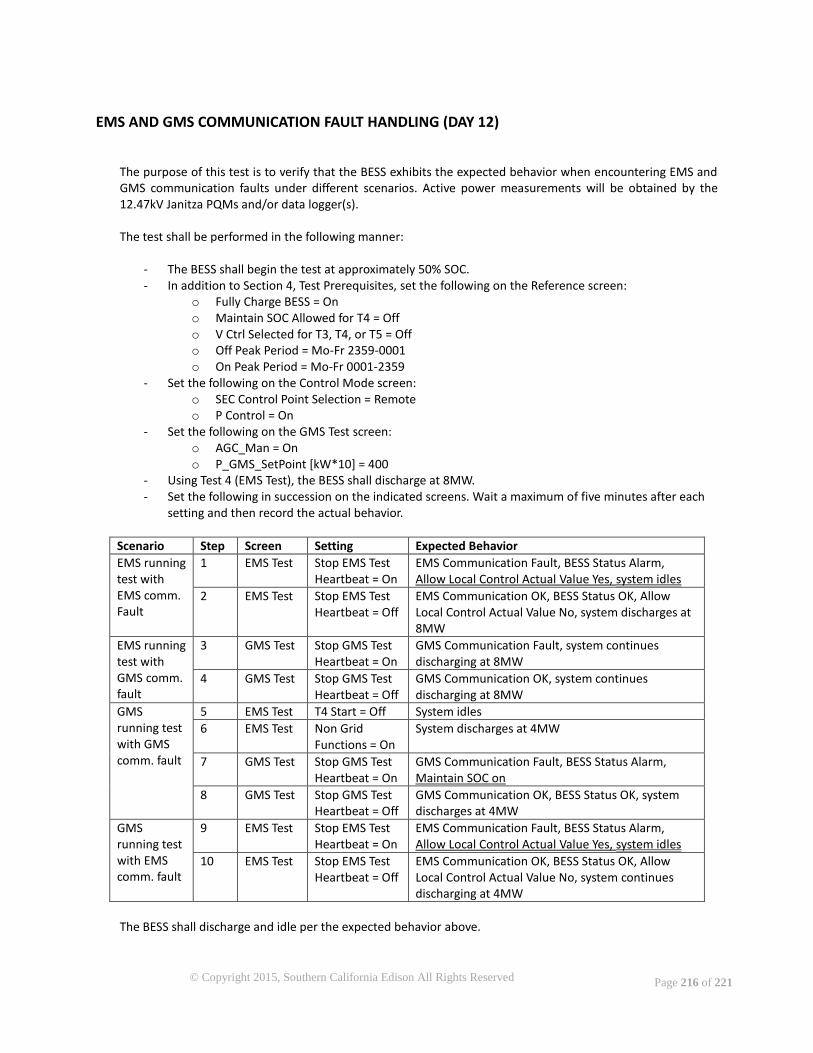
© Copyright 2015, Southern California Edison All Rights Reserved Page 216 of 221
EMS AND GMS COMMUNICATION FAULT HANDLING (DAY 12)
The purpose of this test is to verify that the BESS exhibits the expected behavior when encountering EMS and GMS communication faults under different scenarios. Active power measurements will be obtained by the 12.47kV Janitza PQMs and/or data logger(s). The test shall be performed in the following manner:
- The BESS shall begin the test at approximately 50% SOC. - In addition to Section 4, Test Prerequisites, set the following on the Reference screen:
o Fully Charge BESS = On o Maintain SOC Allowed for T4 = Off o V Ctrl Selected for T3, T4, or T5 = Off o Off Peak Period = Mo-Fr 2359-0001 o On Peak Period = Mo-Fr 0001-2359
- Set the following on the Control Mode screen: o SEC Control Point Selection = Remote o P Control = On
- Set the following on the GMS Test screen: o AGC_Man = On o P_GMS_SetPoint [kW*10] = 400
- Using Test 4 (EMS Test), the BESS shall discharge at 8MW. - Set the following in succession on the indicated screens. Wait a maximum of five minutes after each
setting and then record the actual behavior.
Scenario Step Screen Setting Expected Behavior
EMS running test with EMS comm. Fault
1 EMS Test Stop EMS Test Heartbeat = On
EMS Communication Fault, BESS Status Alarm, Allow Local Control Actual Value Yes, system idles
2 EMS Test Stop EMS Test Heartbeat = Off
EMS Communication OK, BESS Status OK, Allow Local Control Actual Value No, system discharges at 8MW
EMS running test with GMS comm. fault
3 GMS Test Stop GMS Test Heartbeat = On
GMS Communication Fault, system continues discharging at 8MW
4 GMS Test Stop GMS Test Heartbeat = Off
GMS Communication OK, system continues discharging at 8MW
GMS running test with GMS comm. fault
5 EMS Test T4 Start = Off System idles
6 EMS Test Non Grid Functions = On
System discharges at 4MW
7 GMS Test Stop GMS Test Heartbeat = On
GMS Communication Fault, BESS Status Alarm, Maintain SOC on
8 GMS Test Stop GMS Test Heartbeat = Off
GMS Communication OK, BESS Status OK, system discharges at 4MW
GMS running test with EMS comm. fault
9 EMS Test Stop EMS Test Heartbeat = On
EMS Communication Fault, BESS Status Alarm, Allow Local Control Actual Value Yes, system idles
10 EMS Test Stop EMS Test Heartbeat = Off
EMS Communication OK, BESS Status OK, Allow Local Control Actual Value No, system continues discharging at 4MW
The BESS shall discharge and idle per the expected behavior above.
© Copyright 2015, Southern California Edison All Rights Reserved Page 217 of 221
Test Date
Completed (Y/N)
Completed by (Initials)
Recorded Test Data File Name
Test Note ID (Fill in reference to the notes in Appendix A – Test notes)
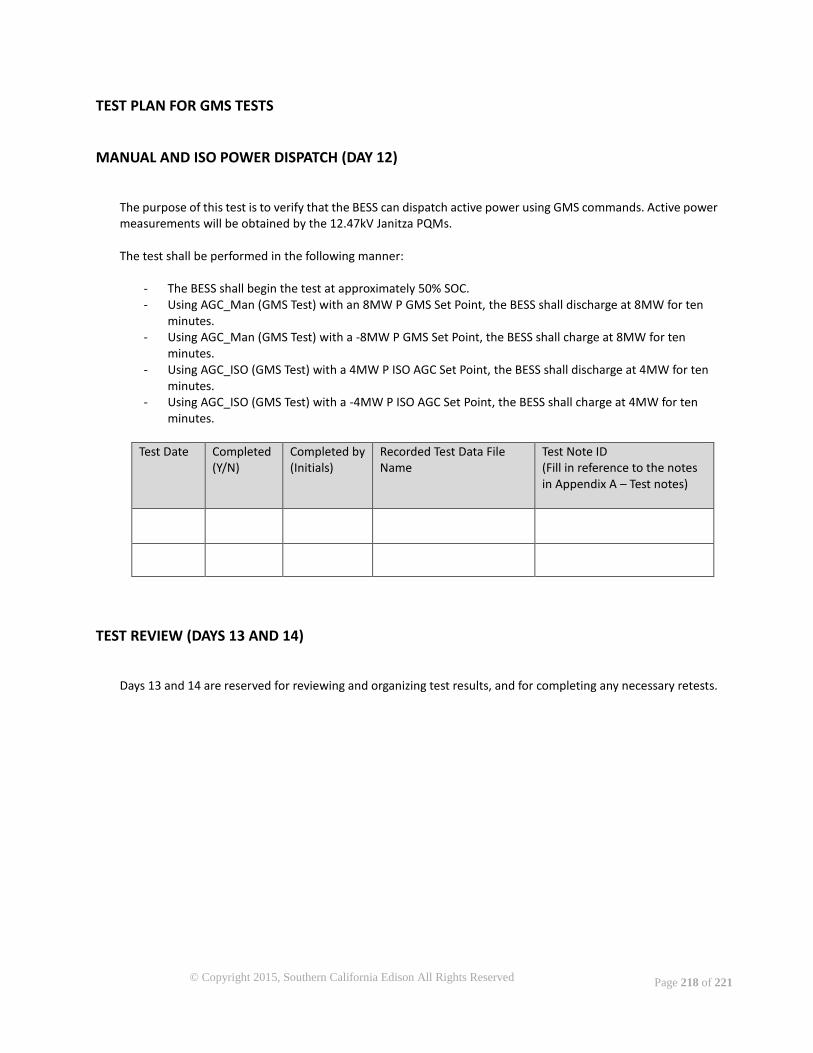
© Copyright 2015, Southern California Edison All Rights Reserved Page 218 of 221
TEST PLAN FOR GMS TESTS
MANUAL AND ISO POWER DISPATCH (DAY 12)
The purpose of this test is to verify that the BESS can dispatch active power using GMS commands. Active power measurements will be obtained by the 12.47kV Janitza PQMs. The test shall be performed in the following manner:
- The BESS shall begin the test at approximately 50% SOC. - Using AGC_Man (GMS Test) with an 8MW P GMS Set Point, the BESS shall discharge at 8MW for ten
minutes. - Using AGC_Man (GMS Test) with a -8MW P GMS Set Point, the BESS shall charge at 8MW for ten
minutes. - Using AGC_ISO (GMS Test) with a 4MW P ISO AGC Set Point, the BESS shall discharge at 4MW for ten
minutes. - Using AGC_ISO (GMS Test) with a -4MW P ISO AGC Set Point, the BESS shall charge at 4MW for ten
minutes.
Test Date
Completed (Y/N)
Completed by (Initials)
Recorded Test Data File Name
Test Note ID (Fill in reference to the notes in Appendix A – Test notes)
TEST REVIEW (DAYS 13 AND 14)
Days 13 and 14 are reserved for reviewing and organizing test results, and for completing any necessary retests.
© Copyright 2015, Southern California Edison All Rights Reserved Page 219 of 221
APPENDIX A – TEST NOTES
FILL IN NOTE ID -
NOTE:
FILL IN NOTE ID -
NOTE:
FILL IN NOTE ID -
NOTE:
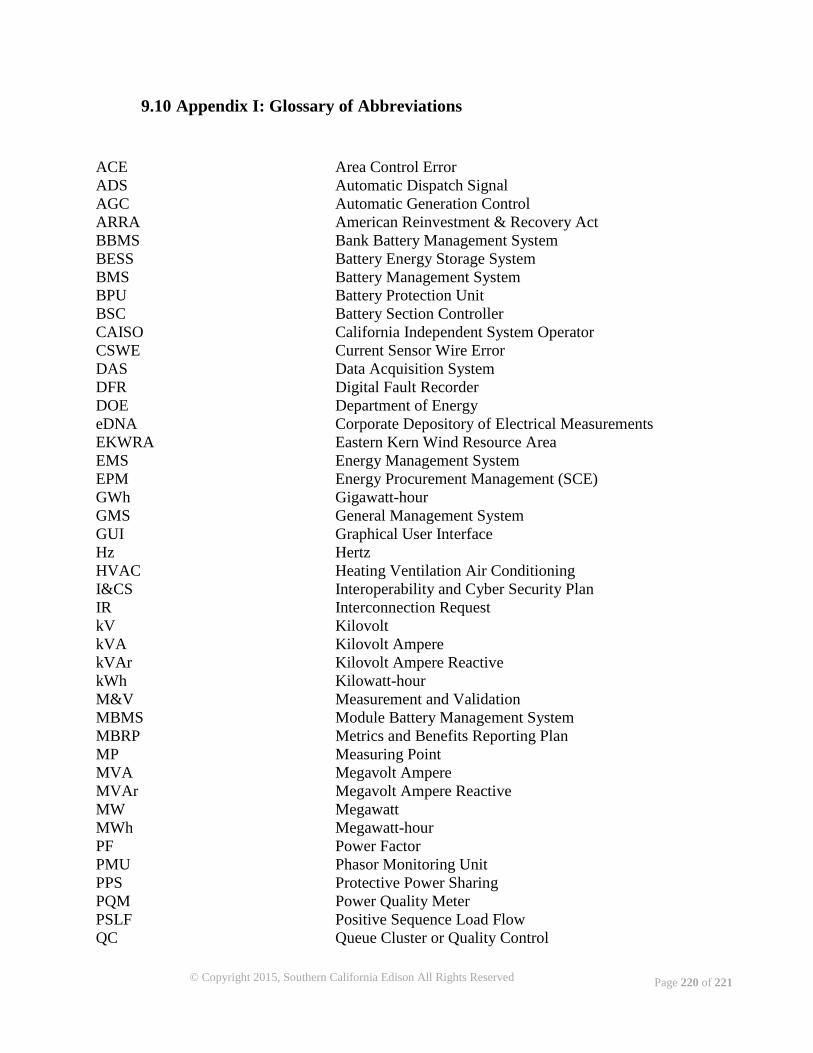
© Copyright 2015, Southern California Edison All Rights Reserved Page 220 of 221
9.10 Appendix I: Glossary of Abbreviations
ACE Area Control Error
ADS Automatic Dispatch Signal
AGC Automatic Generation Control
ARRA American Reinvestment & Recovery Act
BBMS Bank Battery Management System
BESS Battery Energy Storage System
BMS Battery Management System
BPU Battery Protection Unit
BSC Battery Section Controller
CAISO California Independent System Operator
CSWE Current Sensor Wire Error
DAS Data Acquisition System
DFR Digital Fault Recorder
DOE Department of Energy
eDNA Corporate Depository of Electrical Measurements
EKWRA Eastern Kern Wind Resource Area
EMS Energy Management System
EPM Energy Procurement Management (SCE)
GWh Gigawatt-hour
GMS General Management System
GUI Graphical User Interface
Hz Hertz
HVAC Heating Ventilation Air Conditioning
I&CS Interoperability and Cyber Security Plan
IR Interconnection Request
kV Kilovolt
kVA Kilovolt Ampere
kVAr Kilovolt Ampere Reactive
kWh Kilowatt-hour
M&V Measurement and Validation
MBMS Module Battery Management System
MBRP Metrics and Benefits Reporting Plan
MP Measuring Point
MVA Megavolt Ampere
MVAr Megavolt Ampere Reactive
MW Megawatt
MWh Megawatt-hour
PF Power Factor
PMU Phasor Monitoring Unit
PPS Protective Power Sharing
PQM Power Quality Meter
PSLF Positive Sequence Load Flow
QC Queue Cluster or Quality Control
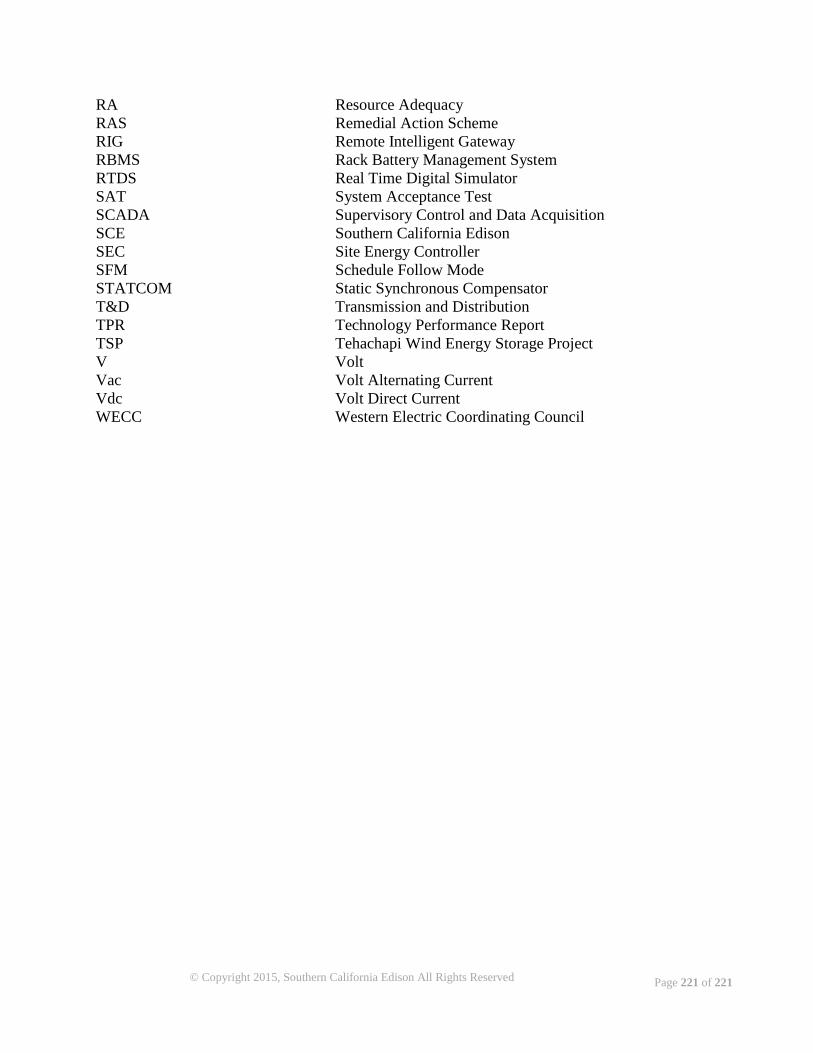
© Copyright 2015, Southern California Edison All Rights Reserved Page 221 of 221
RA Resource Adequacy
RAS Remedial Action Scheme
RIG Remote Intelligent Gateway
RBMS Rack Battery Management System
RTDS Real Time Digital Simulator
SAT System Acceptance Test
SCADA Supervisory Control and Data Acquisition
SCE Southern California Edison
SEC Site Energy Controller
SFM Schedule Follow Mode
STATCOM Static Synchronous Compensator
T&D Transmission and Distribution
TPR Technology Performance Report
TSP Tehachapi Wind Energy Storage Project
V Volt
Vac Volt Alternating Current
Vdc Volt Direct Current
WECC Western Electric Coordinating Council